An Approach to Traffic Management ina Navigational Channel by Roberto E. Soto B.S., Civil Engineering, Universidad del Zulia (1989) Submitted in Partial Fulfillment of the Requirements for the Degree of MASTER OF SCIENCE in Ocean Engineering at the Massachusetts Institute of Technology May 1995 O 1995 Roberto E. Soto All rights reserved The author hereby grants to MIT permission to reproduce and to distribute publicly paper and electronic copies of this thesis documentin whole or in part. Signature of Author............................................. .... ." ee Mvu 1,95 Certified by................................................. ......... ...... .... Dr. Ernst t. r•i.r kel Professor of Marine Systems .-. Thesis Suoervisor Accepted by ..................................... AASSACHUSETTS INSTITUTE OF TECHNOLOGY ......... Dr. A. Dou6las-arCnichael Chairman, Departmental Graduate Committee May, 1995 JUL 2 8 1995 Barker Eng LIBRARIES
Transcript
An Approach to Traffic Managementin a Navigational Channel
by
Roberto E. Soto
B.S., Civil Engineering, Universidad del Zulia (1989)
Submitted in Partial Fulfillmentof the Requirements for the Degree of
MASTER OF SCIENCEin Ocean Engineering
at the
Massachusetts Institute of Technology
May 1995
O 1995 Roberto E. SotoAll rights reserved
The author hereby grants to MIT permission to reproduce and to distribute publicly paperand electronic copies of this thesis documentin whole or in part.
Signature of Author............................................. .... ." ee
.-. Thesis SuoervisorAccepted by .....................................
AASSACHUSETTS INSTITUTEOF TECHNOLOGY
.........
Dr. A. Dou6las-arCnichaelChairman, Departmental Graduate Committee
May, 1995
JUL 2 8 1995 Barker Eng
LIBRARIES
An Approach to Traffic Management
in a Navigational Channel
by
Roberto E. Soto
Submitted in partial fulfillment of the requirements for
the Degree of MASTER OF SCIENCE
May 1995
Abstract
A systemic approach to traffic control on a navigation channel is proposed. Ageneral review of navigation channel geometry and practices is conducted.Factors that affect traffic are evaluated. A model for traffic control andmanagement is proposed. This model allows for traffic simulation (with userprovided data) and modeling (with data generated by the model). Parameters inthe model can be changed to provide the user with an overall best strategy fortraffic management. Results and applicability of the model are discussed. Asystem wide approach to traffic management is then defined using the proposedmodel and existing computing and communications technology.
Thesis Supervisor: Ernst G. Frankel, Ph.D.,D.B.A.Title: Professor of Marine Systems
An Approach to Traffic Management in a Navigational Channel
CONTENTS
1. INTRODUCTION 9
THE NAVIGATION CHANNEL
2.1 Design
2.1.1 Channel width
2.1.2 Channel depth
2.2 Safety in Navigation
2.2.1 Stopping and sep
2.2.2 Ship's domain
2.3 Summary
,aration distance
3. TRAFFIC OPERATIONS AND MANAGEMENT3.1 A Few Basic Concepts
3.2 Queuing (Operational) Mode
3.3 Velocity Distribution and Separation Distance3.4 Traffic Simulation Model
3.2 Changes in Service Rates Due to Channel Length - Maximum Distance
Separation
3.3 Changes in Service Rates Due to Speed Mode and Separation Distance
3.4 Effect of Speed Mode on Global Waiting. FCFS Routine. 2-Way, 2.5 NM
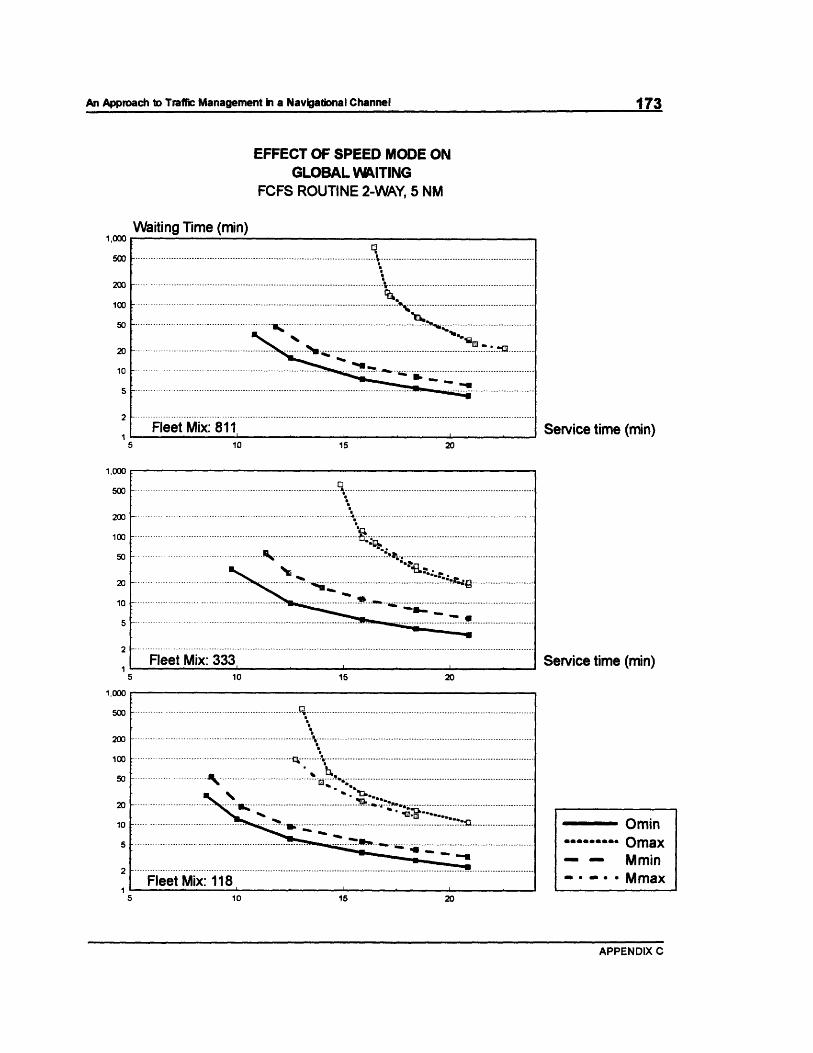
3.5 Effect of Speed Mode on Global Waiting. FCFS Routine. 2-Way, 5 NM
3.6 Effect of Speed Mode on Global Waiting. FCFS Routine. 2-Way, 10 NM
3.7 Effect of Speed Mode on Global Cost. FCFS Routine. 2-Way, 2.5 NM
3.8 Effect of Speed Mode on Global Cost. FCFS Routine. 2-Way, 5 NM3.9 Effect of Speed Mode on Global Cost. COST Routine. 2-Way, 5 NM3.10 Effect of Queueing Routine in Global Waiting. Multi-speed-Maximum
distance. 2-way, 5 NM
3.11 Effect of Queueing Routine in Global Waiting. Multi-speed-Minimum
distance. 2-way, 5 NM
3.12 Effect of Queueing Routine in Global Waiting. One-speed-Minimum distance.
2-way, 5 NM
3.13 Effect of Queueing Routine in Global Cost. Multi-speed-Maximum distance.
2-way, 5 NM
3.14 Effect of Queueing Routine in Global Cost. Multi-speed-Minimum distance.
2-way, 5 NM
3.15 Effect of Queueing Routine in Global Cost. Onei-speed-Minimum distance.
2-way, 5 NM
CONTENTS
An Approach to Traffic Management in a Navigational Channel
List of Tables
2.1 Channel Width
2.2 Causes of Collision and Grounding Casualties in the Elbe in the Years
1970-81
2.3 Emergency Stopping Distances and Time for Complete Stop - SHELL
2.4 Emergency Stopping Distances and Time for Complete Stop - DELFT
2.5 Minimum Separation Distance Assuming Instant Ship Response (in meters)
2.6 Minimum Separation Distance Assuming a 5 min Delay in Ship Response
(in meters)
3.1 Design Vessels
3.2 Service Time Comparison (in minutes). FCFS Queuing Strategy
CONTENTS
An Approach to Traffic Management in a Navigational Channel
CHAPTER No. 1
1. INTRODUCTION
Navigation channels provide the access to ports from the open sea. Their
dimensions decide the size of ships that can approach a terminal and
consequently affect the capacity of the terminal.
Most channels are not natural but dredged so they require periodic investment to
maintain the water depth required for safe passage of ships. Periodic dredging
usually is a large part of a port's operating budget, running sometimes into the
millions of dollars annually. Therefore, it makes sense to minimize dredging costs
by allowing the largest possible number of ships into the terminal with the smallest
dredging section possible. Of course, safety considerations limit the smallest
dredging section. This is usually considered by port managers and designers.
They do not, however, weight in the fact that through effective traffic management,the capacity of a channel can be markedly improved.
In chapter No. 2, channel dimensions and their effect on navigation will be
discussed. Changes in dimensions that could be carried out under a traffic control
system are defined. The idea is that a traffic management system could,conceivably, not only increase the number of ships using a channel but also allow
for greater safety. Therefore, a part of the chapter is dedicated to safety issues
in navigation and the important stopping distance.
It has been proven that a channel's capacity is primarily influenced by the queuing
model used in traffic management. In chapter No. 3, a model is proposed tosimulate and model traffic control in a channel. The model should allow a user to
INTRODUCTION
An Aproch kTraficManaemet k a Nvigtioal CannlV)
decide the most efficient way under his guidelines. Three queuing modes areincorporated in the model. Among these, most ports use a first come, first basedmodel (FCFS) in which whoever gets near the entrance first gets into the terminalfirst. Other strategies allow the costliest ship (COST) or the fastest ship (FAST)to go first. The merits of each of these strategies in traffic control are discussed.
Other factors influencing capacity are also included to find their effect on traffic.
Chapter 4 is dedicated to economic impact of alternatives. The effect of a traffic
control system with a queuing model is estimated. A best strategy under each
different circumstance is proposed.
A technological feasible traffic management system is described in chapter No. 5.The system's requirements and operation are defined by the channel dimensions
changes proposed in chapter 2, by the results obtained with traffic simulation in
chapter 3 and the most cost-effective strategy of chapter 4. Other existing traffic
systems are described, as is their influence on traffic improvements.
Finally chapter No. 6, includes conclusions and recommendations.
INTRODUCTION
An Approach to Traffic Management in a Navigational Channel 01II
v
An Approach to Traffic Management in a Navigational Channel
CHAPTER No. 2
2. THE NAVIGATION CHANNEL
Since the final objective is a traffic management system, channel design and
dimensions will be considered under the light of their effect on capacity. Here,emphasis will be placed on those factors in channel dimensions that influencecapacity.
When designing a channel, engineers consider factors such as design ship, safety,sedimentation rates, wind speed and direction, current velocity and direction,dredge availability and of course, required capacity. These factors can be roughlydivided into to categories: one concerning the safe passage of the ship and theother related to economic considerations.
2.1 DESIGN
The size of the largest ship that will traverse a channel and thecharacteristics of the area in which the channel will be built dictates itsdimensions. However, the multitude of factors affecting the engineeringdecision has made a clear definition of optimum channel dimensions elusive.So safety is the primary consideration in design. The problem is that, innavigation channels, large factors of security result in high construction andmaintenance costs.
2.1.1 Channel width
The nominal width over which the nominal depth exists defines the channel
THE NAVIGATIONAL CHANNEL
An Approach to Traffic Management in a Navigational Channel
width. ICORELS of PIANC (International Committee for the Reception ofLarge Vessels of the Permanent International Association of NavigationCongress, Ref. 17) recommends channel width to be a function of:
(a) Maximum beam of vessels to be received
(b) Difference between the vessel's true position and that estimated by the
mariner
(c) Additional deviation that might occur from the moment when de
deviation is first noted to the moment when the correction becomes
effective.
(d) Additional width needed to account for drifting due to cross currents
and cross winds.
(e) A safety margin not less than half the beam of the vessel on each
side.
ICORELS says that "the present state of knowledge of the influence of the
various parameters mentioned above on the necessary nominal width of
access channels can only be partly assessed with de desired
accuracy... Standard widths of channels in sea straits cannot be established.
They are a compromise between several factors, depending mainly in the
intensity of traffic, the possibility of a sound layout of the channel in the sea
strait, on the conditions of tide and weather, and on the dimensions of ships
that can traverse the least depth of the strait."
However, the Commission considered that the nominal width should be no
less than five times the beam of the largest vessel for a one way straight
channel. Curves have to be considered separately. In two-way channels,
THE NAVIGATIONAL CHANNEL
passing of ships in not dangerous if the distance apart is at least twice the
beam of the larger vessel accounting for limited accuracy of passing
maneuvers. These suggestions by PIANC are based on observations made
in various ports. The results were so varied that the commission could not
conclude on a definitive recommendation. This is probably due to the
various factors influencing the behavior of a ship on a channel. ICORELS
mentions drifting due to cross winds and currents as affecting the width
selection. Also, channel geometry itself plays a role in ship control.
Relative depth, lateral slopes and width all affect the way a ship behaves on
a navigation channel.
Models of ships behavior in canals (Delft Hydraulics, Ref. 6) suggest that
channel width greatly affects stopping distance, an important factor to be
considered later. The report states the stopping distance "has to be defined
as a function of the maneuvering space available to the ship on either side...the width factor." It recommends a width of 4.5 to 5 times the beam of the
ship for easy maneuvering.
Kray (Ref. 14) has several studies in which he assesses the effect of
channel slope in ship maneuverability. His findings suggest that gentler
channel slopes result in increased ship maneuverability. Other publications
(Ref. 2, 8 and 17) show that the ratio of a ship's draft to water depth also
influences the ship's maneuverability and therefore channel width.
It should be noted that experiences in Germany (Ref. 11), in which deviation
from a center line was measured, show that the lane occupied by one-way
traffic on long straight lines has an average width between 3.6 and 4.5 times
the ship's beam. The bigger coefficient refers to outbound traffic with less
THE NAVIGATIONAL CHANNEL
13An Approach to Traffic Management in a Navigational Channel
draft. These experiences correspond to a channel with a nominal width of
3.5 the ship's beam restricted by narrow banks on both sides. Other
experiences suggest controlled traffic deviates less from a center line than
non controlled traffic (Ref. 10). Unfortunately, these experiences do not
result in a recommendation for channel width under controlled traffic
conditions.
Thorensen (Ref. 21) proposes a total channel bottom for single lane
channels of 3.6 to six times the beam of the design ship, the selection
dependent on sea and wind conditions and soil type. Sea and wind
conditions define the width of the maneuvering lane. This author sets a
maneuvering factor between 1.6 and two times the beam of the ship. Bank
clearance counteracts the effect of bank suction if it is set at one to two
times the beam of the largest ship, one corresponding to a gentler side
slope.
For two way channels, Thorensen suggests a total width between 6.2 and
nine times the beam of the design ship. He bases his advice on the same
factors outlined before and includes a ship clearance lane of 30 m. or the
beam of the largest ship. Note that Thorensen's recommendations follow the
field data obtained by ICOREL.
Since the introduction of traffic management is likely to reduce the
necessary navigation portion of channel width, three different scenarios
representing different channel widths will be considered. Details about the
navigation system that should support each scenario will be discussed in
chapter No. 5.
THE NAVIGATIONAL CHANNEL
1AAn Approach to Traffic Management in a Navigational Channel 14I
I
An Approach to Traffic Management in a Navigational Channel
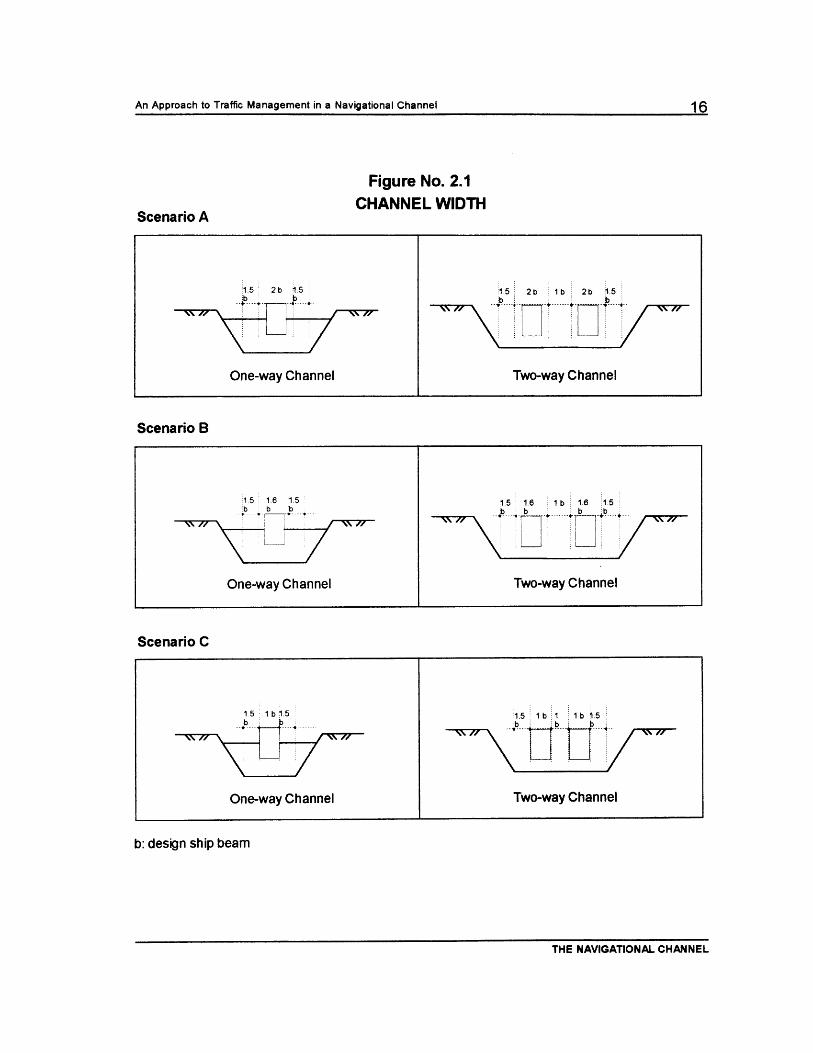
The first scenario will assume that the maneuvering factor is the largest one,two (fig. 2.1-a). This scenario will serve as a base for comparison. This
corresponds to the actual design condition of a navigation channel. The
resulting width is five times the beam for a one-way channel and eight times
the beam for a two-way channel.
The second scenario will presume the existence of improved navigation
control. Therefore, the maneuvering lane reduces to 1.6 times the beam of
the design ship without loss in safety (Fig 2.1-b). This is justified if a
navigation system provides accurate and continuous information on position
to the navigator. Now, the width will be 4.6 times the beam of the design
ship for a single lane channel and 7.2 times the beam for a double lanechannel.
TABLE No. 2.1
CHANNEL WIDTH
Scenario One - way Channel , Two way Channel
1 5.0 b 8.0 b
2 4.6 b 7.2 b
3 4.0 b 6.0 b
Note: b stands for vessel beam.
A third scenario is a 'What if" scenario. Assume for a moment a system isset up so the ship relinquishes control to an outside mechanism that canguide the ship toward the terminal. Such system would eliminate the needfor a maneuvering lane and therefore, the maneuvering lane factor would
THE NAVIGATIONAL CHANNEL
.w
An Approach to Traffic Management in a Navigational Channel
Figure No. 2.1CHANNEL WIDTH
Scenario A
15 2b 15 15 2 l 2b2b 1.5;b :b---·--- (---C- -:---
One-way Channel Two-way Channel
Scenario B
15 1.6 15 1.5 16 lb 16 15bb b b b b b 1 1, 1 .5
One-way Channel Two-way Channel
Scenario C
One-way Channel Two-way Channel
b: design ship beam
THE NAVIGATIONAL CHANNEL
1.5 lb 1 Ib 5
4 b ·7 b ~ *
An Approach to Traffic Management in a Navigational Channel
be one times the beam of the design ship (Fig. 2.1-c). In this scenario, two-
way channels will require six beams as width while one-way channel will
require four beams. Channel widths are tabulated in table No. 2.1 for theoutlined scenarios.
2.1.2 Channel depth
The depth of a navigation channel affects the safety of the operation, the
capacity of the channel and its maintenance requirements. A shallow
channel "causes an increase in the ship's required driving power and impairscontrollability in maneuvering the ship.. because of slow rudder response"
(Kray, Ref. 14). Shallow waters are defined as those in which the depth todraft ratio is less than two.
Kray also observes that ship traveling through a shallow channel may cause
movement of soft bottom material. This might result on an undesirable
redistribution from a maintenance point of view (The effects of depth inchannel capacity and maintenance will be further discussed in point 2.2.).Thorensen (Ref. 21) points out that bank suction increases when underkealclearance decreases.
Different authors advocate different approaches to depth determination. Themost general recommendation (Ref. 5) is to have a ratio of channel depthto mean draft of the largest vessel between 1.3 and 1.5. For ships moving
at speeds below six knots, a lower figure can be used (Kray, Ref. 14). Theselection between 1.3 and 1.5 will depend on factors such as:
THE NAVIGATIONAL CHANNEL
An Approach to Traffic Management in a Navigational Channel
Draft of design vessel
Tidal variations
Wave-ship motions
Load ship motions
-Wind effect on water level and on tides
Bottom suction
Water density
Increased sinkage because of passing vessels
Increased sinkage away from channel centerline
PIANC (Ref. 18) recommends a depth determined from the followingformula:
h = D+L+k+Z+I+R+C+IWL Eq. 2.1
where,
h: channel depth in relation to the level of the marine chart,D: draft of a stationary vessel in slack/still water,L: deviation from above chart datum of the hydrographic chart,Z: squat and trim,
I: amplitude of vertical ship movement,R: bottom roughness,C: keel clearance and
IWL: inaccuracy of water-level measurement and sounding.
The previous formula does not consider sedimentary processes, assuming
no siltation after initial construction. However, sedimentary process are
important in most channels and should be considered when defining
THE NAVIGATIONAL CHANNEL
navigation depth.
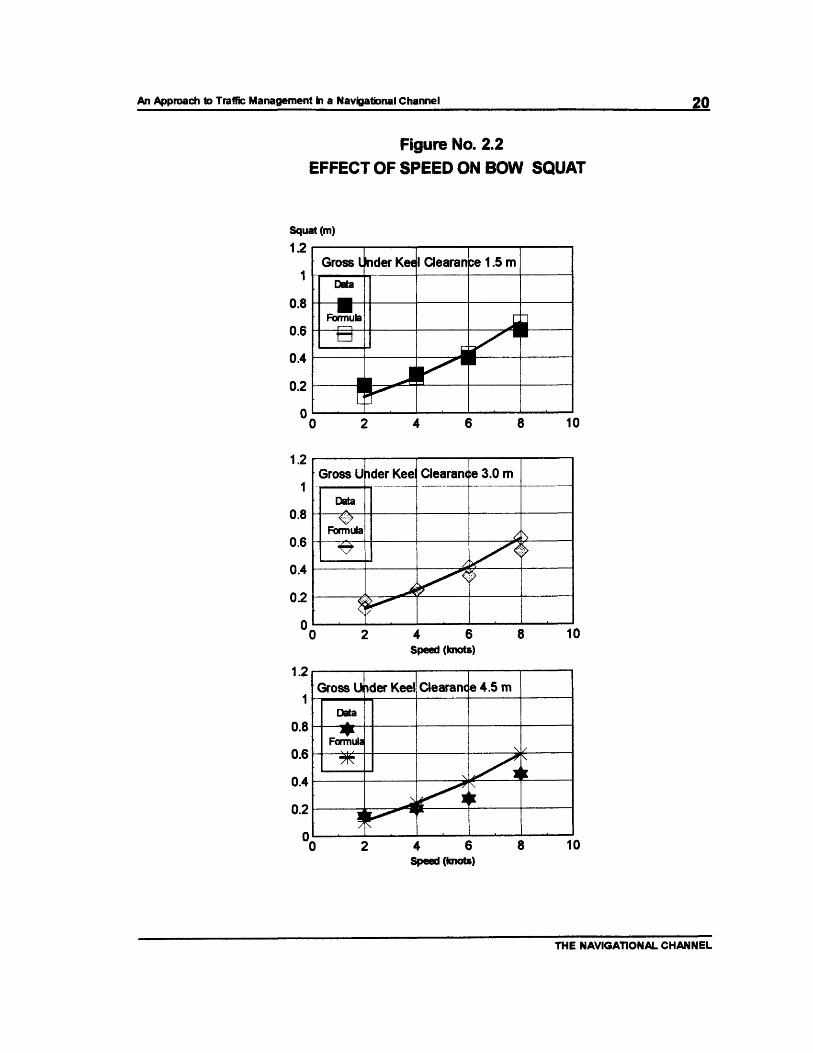
Note that squat becomes important when large vessels are involved. Figure
2.2 shows data obtained by the National Hydraulic Lab, France for a
250.000 dwt., 20 m. draft vessel with a bulbous bow model for different
under keel clearances (Ref. 8). This and other laboratory experiments
resulted in the following formula for the determination of squat:
Z= 2.4 * - Fnh Eq. 2.2
where,
A: volume de displacement [m3],
L,,: length of ship between perpendiculars [m],Fnh: Froude number = Vi/gh,
V: speed [m/s],
g: gravity [m/s 2 ] and
h: water depth [m]
As appreciated in figure 2.2, equation 2.2 agrees with the data from the
National Hydraulic Laboratory. The figure shows the little effect in bow
squat for velocities of less than six knots. Nevertheless, as velocity
increases, the squat is more pronounced for low keel clearances than for
higher ones.
Emphasis is placed in squat determination because it is the only factor in
navigation depth definition directly related to ship transit. Since channel
capacity depends on the ship's velocity and different velocities result in
THE NAVIGATIONAL CHANNEL
An Approach to Traffic Management in a Navigational Channel 19
An Approach to Traffic Management in a Navigational ChannelFigure No. 2.2
Figure No. 2.2
EFFECT OF SPEED ON BOW SQUAT
Squat (m)12
1
0.8
0.6
0.4
0.2
0
1.2
1
0.8
0.6
0.4
0.2
0I
Gross Lder Kee I Clearanpe 1.5 m
Dta
Formula
0 2 4 6 8 10
0 2 4 6 8 10Speed (knots)
%flar (,•aI, "Jaarannie 4.5 mGross UIFData
FormulaK--
2 4 6 8 10Speed (knots)
THE NAVIGATIONAL CHANNEL
1.2
1
0.8
0.6
0.4
0.2
IU~I 1\~~1 vluulull~
1
. A
An Approach to Traffic Management in a Navigational Channel
different navigation depths, the squat will be considered when evaluation
dredging requirements.
2.2 SAFETY IN NAVIGATION
Good engineers always try to maintain a good margin of security whilekeeping costs down. This sounds almost like an oxymoron for the better thesecurity margin the higher the costs usually are. Keeping this in mind, a
review of safety in navigation will be conducted. The review will have thesebasic objectives:
(a) to support the premise that a traffic management system cancontribute to a reduction in ship collisions and
(b) to show that a basic assumption in navigation can be modified tooptimize traffic flow with no loss in safety.
The first objective is easy to prove. A study made in Europe by Kemp (Ref.13) tried to assess potential benefits of shore-based marine traffic systems.The study surveyed mariners and shipmaster to find the possible effect ofdifferent levels of traffic control: no traffic control, traffic control through aVHF reporting system with no radar surveillance and traffic control throughVHF reporting system with full radar surveillance. The exercise concludedthat collision casualties could be reduced 40% by using a VHF reportingsystem and 50% by the combined use of radar and a VHF reportingsystem; without a traffic control system no changes would occur on collisionrates. The same paper concluded that a VHF reporting system alone would
THE NAVIGATIONAL CHANNEL
An Approach to Traffic Management in a Navigational Channel
not affect stranding rates, while a combined system of VHF communication
and radar surveillance would reduce strangling rates by 50%.Unfortunately, specifications for what information the radar surveillance was
to provide are not included with the results.
The same study recorded collision data in European waters from 1978 to1982. One interesting fact found is that only about 25% of all casualties
occurred in restricted waters. Also, meeting or overtaking as reasons for
collision outside ports accounted for about 70% of casualties while
crossings accounted for the rest. Although the report does not mention the
effect of traffic control in these percentages, its influence is likely to be low
due to area covered by the study and the sparseness of such systems in
operation even today.
Now its time to have a look at what causes a collision. As mentioned
before, crossing causes about 30% of all collision in European waters. It is
also very unusual to have crossing on a navigation channel. Subsequent
analysis will exclude this type of collision. Bruun (Ref. 5) reports some data
on marine casualties for Norwegian registered ships in the years 1985 and
1986. Although the data is limited, it does show "maneuvering and
navigation" as a major reason for serious casualties: about 80%. Another
interesting fact is that most grounding and collisions seemed to occur in
clear weather with good visibility and calm and moderate wind conditions.
The same author reports data from the Elbe river, access to the port of
Hamburg. This data is presented in table No. 2.2. Under the category
"Maneuvering / Navigation" all causes related to insufficient navigation
information or human errors have been included.
THE NAVIGATIONAL CHANNEL
An Approach to Traffic Management in a Navigational Channel 23
TABLE No. 2.2
CAUSES OF COLLISION AND GROUNDING CASUALTIESIN THE ELBE IN THE YEAR 1970-1981
CASUALTY CAUSE Godng_ __ _____
Ship's technical Failure 5 24.0 14 12.5
Maneuvering/ 11 52.0 78 70.0Navigation
Other 5 24.0 20 17.5
TOTAL 21 100.0 112 100.0
The historical data presented supports the argument that a traffic
management system can correct -or at least reduce- the number of
collisions since most collisions are due to "maneuvering and navigation",therefore such system could conceivably improve safety.
The second objective of this review of safety is harder to prove. It has been
claimed that a basic assumption in navigation can be modified to optimize
traffic flow with no loss in safety. Stopping distance is that basic
assumption. It is the minimum distance it takes a ship moving under its own
power to come to a complete stop under emergency conditions. In
channels and in channel capacity models it serves to define the separation
distance between ships. The problem is that presumably the immediately
preceding ship has stopped suddenly and therefore is a fixed obstacle. That
is hardly the case in reality. A ship that experiences technical failures does
not stop suddenly but maintains its motion for a longer stretch than a ship
using its power to come to a complete stop. No ship will come to a
THE NAVIGATIONAL CHANNEL
complete sudden stop unless it finds a massive obstacle on its path and a
navigation channel is not supposed to have any such obstacles. The only
instance this might happen could be if, in a two-way channel, a ship loses
control and blocks the opposing lane. Here, no amount of separation
distance will help avoid a collision because separation distance refers to
distance between vessel moving in the same direction.
Nevertheless, there is strong reason to consider stopping distance as equal
to separation distance. First, a preceding ship might not be able to stop
suddenly but it might slow considerably before the following ship notices
and reacts. Therefore, for safety reason, stopping distance seems like the
more reasonable alternative in defining separation distance. Now the key
element is information. If the following ship is alerted immediately of the
preceding ships maneuvers, it will have ample time to react and avoid a
collision. Stopping distance, as a measure of separation, results in an
excessive safety margin under this circumstance. The preceding argument
is the base for separation distance proposals described next.
2.2.1 Stopping and separation distance
The idea of stopping distance is very important in channel capacity models.
This distance defines the separation distance between ships and -as shown
in subsequent chapters- it has important effects on the number of ships that
can be served by a navigation channel. That is the reason behind the
objectives presented under navigation and safety.
PIANC (Ref. 17) suggests the stopping distance should be no less than five
times the length of the ship. It also recommends the next formula for
THE NAVIGATIONAL CHANNEL
An Approach to Traffic Management in a Navigational Channel 24
vessels traveling at speeds exceeding 2.5 m/s (about five knots):
V 25D=4 * L *() +L Eq 2.3
2.5
where,
D: stopping distance,L: ship's length and
V: ship's velocity.
The preceding equation corresponds to a stoppage maneuver with engine
half astern in deep water. Soo Lim (Ref. 20) for his channel capacity model
modified the previous formula. He used a safety margin of 1.8 to come up
with the following:
D = (.168 * Vm,075 + 1.8) * L Eq. 2.4
where,
D: stopping distance,Vm: ship's velocity and
L: ship's length.
Soo Lim offers no explanation for the usage of a safety margin of 1.8 but
argues that his formulation is more effective in evaluating major factors in
capacity such as fleet mix, channel length and vessel speed. He alsoimplies that equation 2.4 was derived for deep waters, not the case in a
THE NAVIGATIONAL CHANNEL
An Approach to Traffic Management in a Navigational Channel 25
An Approach to Tramffic Management in a Navigational Channel
dredged channel and therefore the need for an additional safety factor.
Bruun (Ref. 5) offers this equation for crash stopping distance inmaneuvering speed:
m , ku 2 1D * In ( + 0 + o tr Eq. 2.5k Tps (I - t) 2
where,
D: stopping distance,
mi: virtual mass of ship,k: coefficient of ship hull resistance,
uo: speed of ship before engine reversal,T,,: backing thrust of propeller
tp: trust deduction coefficient of propeller and
tr: time required for propeller stopping after engine reversed.
Kray (Ref. 14) lists the values tabulated in table No. 2.3 for vessels
traveling at different speeds under favorable depth of water, weather and
current conditions. Those values correspond to actual field data compiled
by Shell Corporation.
According to Shell's information, a 206,000 DWT. ship moving at a speed
between 14 and 18 knots requires about 17 ship lengths to come to a
complete stop. The same ship moving at 12 knots requires some seven
ship lengths: less than half the distance with a velocity decrease between
15 and 33%. Figure 2.3 shows this relation graphically. However, the same
THE NAVIGATIONAL CHANNEL
An Approach to Traffic Management in a Navigational Channel
ratios do not hold for other ship sizes and velocities. For instance, a 65,000
DWT. vessel seems to require about 12 ship lengths to stop while a much
larger vessel (200,000 DWT.) would need about seven ship lengths.
Another study by Delft (Ref. 6) for 160.000 DWT and 260.000 DWT vessels
resulted in the values shown in table No. 2.4. This study was conducted
using a model traveling on a canal five beams wide. The authors point out
that the stopping distance ratio for both ship sizes was very close to their
displacement ratio.
TABLE No. 2.3
EMERGENCY STOPPING DISTANCESAND TIME FOR COMPLETE STOP -SHELL
A comparison between minimum separation distance obtained assuming a
5-min delay response and stopping distance results in the following
observations:
(a) Using Soo's formulation for separation distance is similar to defining a
reaction time of 10 min. In other words, it results in a separation
distance that is about twice that obtained for a 5 min. delay in ship
response.
(b) The equation proposed by PIANC for stopping distance agrees with the
distance found assuming a 5 min. delay in response. PIANC's equation
results in a distance that is at least 15% higher than using a 5 min.
delay criterion (or equivalent to a 6 min. delay response). This is true
even for extreme cases (not included in the graphs): a 160.000 DWT.
ship traveling at 20 knots will require 3730 m to come to a complete
THE NAVIGATIONAL CHANNEL
An Approach to Traffic Management in a Navigational Channel
stop (using PIANC's equation). If it is following a small (40.000 DWT.)ship traveling at five knots, it will require 3960 m. to stop using the 5min. response strategy.
(c) No overtaking will occur during an emergency stop when a fast ship
follows a slow ship due to the difference in stopping distance (The
fastest ship will stop first).
The data presented suggests that Soo's factor of security for stopping
distance might be excessive. Of course, this is true if the pertinent
information is available to the navigator and the vessel is traveling in deep
waters. The empirical data available supports this assessment for 85.000
DWT. ships, but not for the larger 160.000 DWT. vessels. Again, the
empirical data is too scarce to help in defining stopping distance. Therefore,both formulations will be considered valid but under different circumstances.
What this circumstances are, lead to three cases when evaluating capacity:
(a) A first case in which no additional information is available to the
navigator: for this instance Soo's equation with its security factor seems
the most reasonable course due to the uncertainties inherent to
navigation (visibility, human error, etc.).
(b) A second case would assume the immediate availability of information
but a 5 min. delayed response. Here, PIANC's equation will define
separation distance because of its closeness to the 5 min. delay
response criteria.
(c) A third case that presumes immediate availability of information and
THE NAVIGATIONAL CHANNEL
immediate response. Here, because separation distances are veryshort (see Table No. 2.5), two ship lengths will be used as separation
distance.
One final observation. Shell's data includes the time required to reach a
complete stop (Table No. 2.3). At low velocities (below 12 knots), a 5-mindelay criteria would result in a reasonable separation distance since it takesdifferent ships anything between 3.5 and 10 min. to come to a completestop. This case would also support the assumption that the lead vessel
would not become a fixed obstacle in an emergency. On the other hand, atlarger velocities (over 12 knots) this does not hold true. There is quite adifference in experimental data for stopping time between a 120.000 DWT.vessel (13 min) and a 300.000 DWT. vessel (24 min). If the smaller shiptried to stop, it would become a fixed obstacle in about 13 min and thiswould violate the assumption about a ship becoming an obstacle. However,the important factor here is separation distance and even then the lead shipis not overtaken.
2.2.2 Ship's domain
The area around a vessel underway which most navigators of other vesselwould avoid entering defines the ship domain. Separation distance betweenships decides the longitudinal direction. Hydrodynamic interaction betweenships and cross-section defines the lateral dimension. These dimensionsdefine an ellipse that surrounds the ship in all directions.
Two zones will be defined within a ship domain. A first zone in which the
THE NAVIGATIONAL CHANNEL
An Approach to Traffic Management in a Navigational Channel 33
longitudinal distance is the minimum required for a complete stop assuming
information is available to the pilot. This area will be the danger zone. Any
ship coming into this area is potentially dangerous. The second zone
corresponds to the extended distance required when no information is
available. Lateral distance remains constant because hydrodynamic
interaction does not change. Note that a ship's domain will vary with fleet
mix and traveling velocity according to the formulations discussed in the
previous point. Also, since the longitudinal dimension is based on stopping
distance, it will be measured from the bow of the vessel (See figure No.
2.6).
The traffic management system requires this differentiation. If a lead ship
enters the danger zone of a ship it is already too close and the navigator
should notice this and act accordingly. While the lead ship is within the
safety zone, the navigator should monitor the lead ship performance closely
but no action should be required. The effect of ship domain on traffic control
will be discussed later.
2.3 SUMMARY
Traffic control can result on improvement in a ship's maneuverability and
therefore can serve to redefine channel's dimensions. Depending on the
level of traffic control, a channel's width could be reduced from five to four
beams of the design ship for a one way channel. For two way channels, the
width could be decreased from eight to six design vessel beams. This will
not result in unsafe operations if a vessel's navigator has continuous
information on its position. Hence, a reduction in channel width will be
conditioned by the presence of a navigatib~:control system.
THE NAVIGATIONAL CHANNEL
An Approach to Traffic Management in a Navigational Channel 34
An Approach to Traffic Management in a Navigational Channel
Figure No. 2.4
STOPPING DISTANCE COMPARASION
Distance (meters)
10
Velocity (Knots)
THE NAVIGATIONAL CHANNEL
35
Soo Lim RAANC
.. . . .. .. .. .. -• "* *"
160.000 DVVT
6,000
5,000
4,000
3,000
2,000
1,000
06.000
5,000
4,000
3,000
2,000
1,000
06,000
5,000
4,000
3,000
2,000
1,000
0
Soo Lim RANC ShelData
) dw+· M D
85.000 DWT
Soo Lim RANC
.me....
40.000 DWT
An Approach to Traffic Management in a Navigational Channel
A traffic control system can also help reduce the inter-ship separation
distance. Defining separation distance as equal to stopping distance is not
necessarily the best and safest strategy. It has been shown that it is highly
unlikely that a ship will find a fixed obstacle on a navigation channel.
Therefore, the separation distance within the channel can be defined by
reaction time. Using this criterion, separation distance can be reduced. In
order for this to work the navigator must have information of other vessels'
positions: information that can be provided by a traffic control system.
Figure No. 2.5
SHIP DOMAIN
ship
C = ship domain - danger zone
Z<Ih ship domain - safety zone
Safety Zone
Danger Zone
0
THE NAVIGATIONAL CHANNEL
Au Aproch o Taffi Maageentii Navga~nalChanel37
CHAPTER No. 3
3. TRAFFIC OPERATIONS AND MANAGEMENT
Up to this point, much paper has been dedicated to define the navigation channelin terms of design and how it affects capacity. This chapter will be directed towardactual traffic simulation and its applicability to improve a channel's capacity. Amathematical model developed by Soo Lim (Ref. 20) will help in highlightingimportant factors to be considered when planning traffic control.
Based on his results, the factors to change during simulation to find their influenceon capacity are: Queuing mode, ship velocity, fleet mix, separation distance,channel length, number of lanes, velocity distribution and arrival rate. There is an
almost infinite set of different combinations of the previous factors -at least for
practical purposes. Consequently, the goal will be to find general tendencies in his
results. These tendencies will hopefully suggest a best strategy for traffic control.
The model by Soo Lim served as the basis for the model proposed in this paper.The new model allows for simulation when actual ship arrival information is readily
available or for modeling when new trends or conditions require changes ofstrategy. It was written in VISUAL BASIC, a programming language easily
accessible and with a Windows like interface to allow for ease of use. The basicpremises of Soo Lim's model are maintained while incorporating a more flexibleand user friendly interface.
3.1 A FEW BASIC CONCEPTS
Before a traffic model can be discussed, some ideas related to capacity and
TRAFFIC OPERATIONS AND MANAGEMENT
An Approach to Traffic Management in a Navigational Channel 37
queuing theory must be reviewed.
(a) Service time
In Queuing Theory, service time refers to the length of time a customer
spends in the serving facility. Queuing theory prohibits the next
customer to use the facility during that period. Then, the service time
is the time during which an incoming ship cannot use the channel or,in other words, the minimum time of separation. Under this conditions,service time is dependent on the immediate following vessel but
independent of the immediate preceding one. The service time will be
calculated using the following formula when the maximum separation
distance (as outlined in point 2.2.1) and one speed case (all vessels
travel at same speed) are considered:
E[51 = E[L* (.168 Vi75 + 2.8) Eq. 3.1v,
where,
E[S]o: is the expected service time for a one speed case,
E[L]: is the weighted average of vessel length and
Vi: is the ship's velocity
The service time for the minimum separation distance and one speed
cases is calculated using the next equation.
TRAFFIC OPERATIONS AND MANAGEMENT
An Approach to Traffic Management in a Navigational Channel 38
E[S= E[ * (.094 * Vi7s + 2.0) Eq. 3.2v,
where,
E[S]o: is the expected service time for a one speed case,E[L]: is the weighted average of vessel length and
Vi: is the ship's velocity
For the multiple speed case (vessels travel at their own allowed speed),
the relative vessel speed decides the expected service time. Therefore,the following equation must be used in those cases:
E[S] is the expected service rate for the multiple speed case,E[S]o: is the expected service time for a one speed case,
LC: is the length of channel,D: is the separation distance calculated according to equations 2.3or 2.4 for maximum and minimum values respectively,Vi, Vj: are ship's velocities and
Pi, Pj: relative proportion of ship i and ship j in fleet mix.
(b) Waiting time
The waiting time will be defined as the time elapsed between shiparrival and channel entrance. This time will vary with the arrival rate,
TRAFFIC OPERATIONS AND MANAGEMENT
An Approach to Traffic Management in a Navigational Channel 39
queuing routine, fleet mix and other factors. It will serve as an index
of capacity.
(c) Waiting cost
A waiting ship is a money losing ship so the cost of waiting will be
calculated. This factor represents the cost associated to the total
waiting time: that spent in queue and on the ready spot. It will also
serve as an index of capacity.
(e) Arrival rate (A)
The frequency of ship arrival defines the arrival rate. It is a measure
of a channel's capacity to serve ships. The maximum inter-ship
arrival rate (X,,x) is the shortest interval in which ships can arrive to
the channel entrance without causing an infinite queue. As the length
of the channel and the separation distance growths, the maximum
interarrival rate diminishes. To find out the maximum inter-ship arrival
rate, the following expression will be used:
X- 1 Eq. 3.4ms
where,
X: arrival rate and
E[S]: the expected value of the service time.
(f) Total waiting cost
Total waiting cost is the summation of waiting costs of all vessels
TRAFFIC OPERATIONS AND MANAGEMENT
40An Approach to Traffic Management in a Navigational Channel
An Approach to Traffic Management in a Navigational Channel
during the planning period.
(g) System time
The time a ship waits to enter the channel plus the time it takes a
vessel to traverse the channel make up the system time. This value
will serve as an index for cost estimation and capacity.
3.2 QUEUING (OPERATIONAL) MODE
Three basic queuing models apply for traffic control in a navigation channel.
These models are:
(a) First come, first served (FCFS),(b) Faster vessel first (FAST) and
(c) Higher-cost vessel first (COST).
The model First come, First Served (FCFS) is the universal one. This model
is the one used when no strategy is in place. As its name implies, it allows
in whatever vessel gets to the entrance to the channel first regardless of
waiting cost, ship size or velocity.
A second model "Faster vessel first" (FAST) arranges ship entrance to the
channel according to their velocity. The basis for this strategy is the fact
that the channel serves more vessels if the fastest ship is allowed to go
first. It is an effective model from number of ships point of view. Yet, it hasthe draw back that the fastest ship is not necessarily the more expensive
TRAFFIC OPERATIONS AND MANAGEMENT
An Approach to Traffic Management in a Navigational Channel
one and usually results in higher global waiting costs.
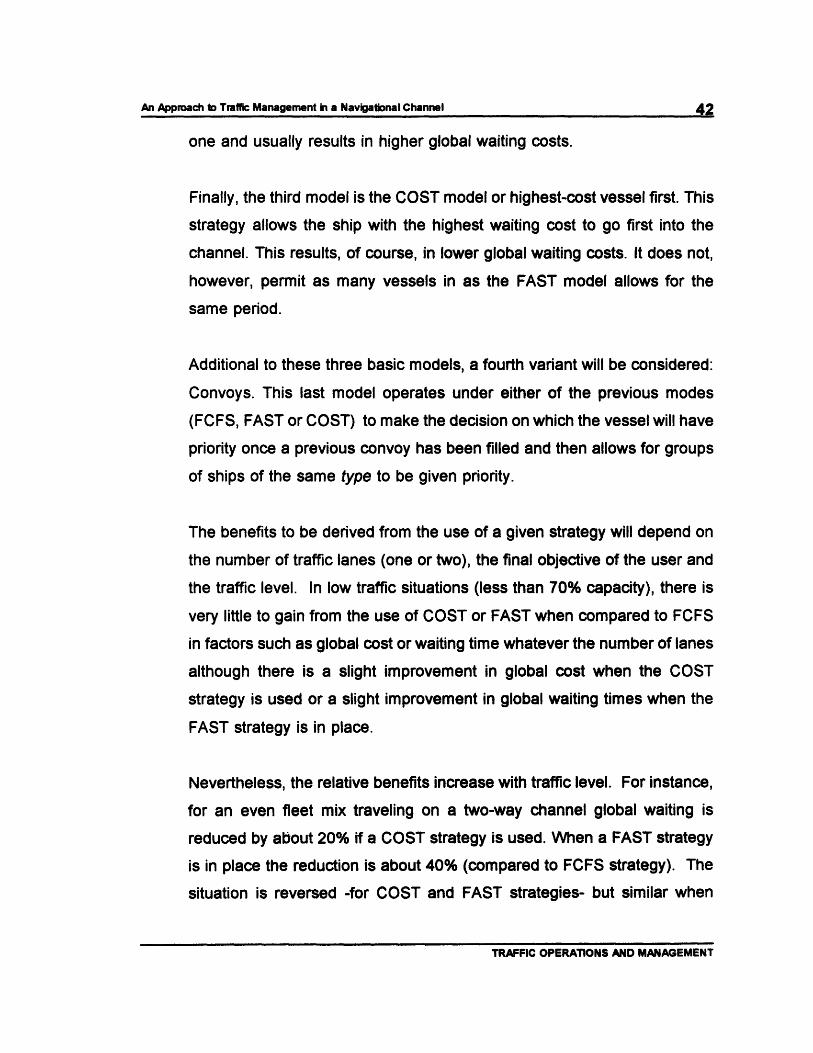
Finally, the third model is the COST model or highest-cost vessel first. This
strategy allows the ship with the highest waiting cost to go first into the
channel. This results, of course, in lower global waiting costs. It does not,however, permit as many vessels in as the FAST model allows for the
same period.
Additional to these three basic models, a fourth variant will be considered:
Convoys. This last model operates under either of the previous modes
(FCFS, FAST or COST) to make the decision on which the vessel will have
priority once a previous convoy has been filled and then allows for groups
of ships of the same type to be given priority.
The benefits to be derived from the use of a given strategy will depend on
the number of traffic lanes (one or two), the final objective of the user and
the traffic level. In low traffic situations (less than 70% capacity), there is
very little to gain from the use of COST or FAST when compared to FCFS
in factors such as global cost or waiting time whatever the number of lanes
although there is a slight improvement in global cost when the COST
strategy is used or a slight improvement in global waiting times when the
FAST strategy is in place.
Nevertheless, the relative benefits increase with traffic level. For instance,for an even fleet mix traveling on a two-way channel global waiting is
reduced by about 20% if a COST strategy is used. When a FAST strategy
is in place the reduction is about 40% (compared to FCFS strategy). The
situation is reversed -for COST and FAST strategies- but similar when
TRAFFIC OPERATIONS AND MANAGEMENT
An Approach to Traffic Management in a Navigational Channel
global costs are analyzed.
When convoys are used and traffic is high, the improvements are evenmore marked. First the service time improves, in effect increasing thecapacity of the channel (This point will be discussed in more detain in point3.6.1). Then the relative benefits of each strategy also improve by differentbut important margins. These margins vary with the length of the convoy.Depending on the channel's conditions and traffic, different convoys lengthsresult in maximum benefits. Here, improvements obtained for a certainconvoy length and queuing strategy does not necessarily imply the sameoptimum length for another queuing strategy.
3.3 VELOCITY DISTRIBUTION AND SEPARATION DISTANCE
Soo Lim found that velocity distribution within a channel has a pronouncedeffect in capacity. Velocity not only decides the time it takes a vessel to
traverse the channel, but it is also the base for the definition of separation
distance and minimum time separation as outlined in chapter 2.
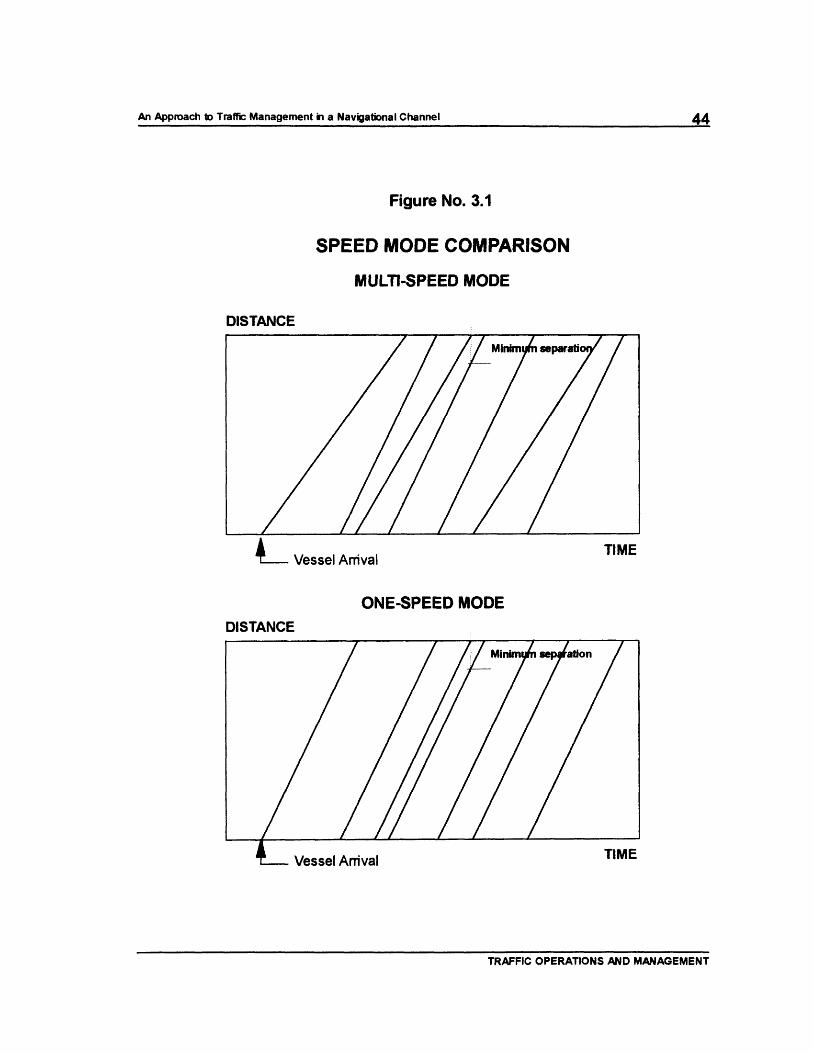
He evaluated two velocity modes: (a) one-speed and (b) multiple speeds.The one-speed mode assumes that a group of ships in a channel movesat the speed of the slowest vessel (See figure 3.1 -a). The multi-speed modeallows the fastest ship to travel at its regular speeds but always maintainingthe minimum separation distance as defined by eq. 2.4 (figure 3.1-b). Bothvelocity modes work for FCFS (first come, first served) and COST (high-cost vessel first) strategies. However, there is no sense in using a one-speed mode for a FAST (fastest vessel first) strategy or for convoys.
TRAFFIC OPERATIONS AND MANAGEMENT
An Approach to Traffic Management in a Navigational Channel
Figure No. 3.1
SPEED MODE COMPARISON
MULTI-SPEED MODE
DISTANCE
ONE-SPEED MODEDISTANCE
TRAFFIC OPERATIONS AND MANAGEMENT
The choice of velocity mode modifies the separation distance. In equation
2.4, the velocity is that of the slowest vessel when using one-speed mode.
In multi-speed mode, the velocity to use in the equation is that of thevessel.
3.4 TRAFFIC SIMULATION MODEL
The traffic simulation model used as a base for the model presented in this
paper was developed by Soo Lim (Ref. 20) using the simulation language
SLAM II (Simulation Language for Alternative Modeling). This language
combines network, discrete event, and continuous modeling capabilities. It
provides network symbols for building graphical models that are easily
translated into statements for direct computer processing. It also contains
subprograms that support both discrete event and continuous modeldevelopments.
The basic simulation model divides the channel in three operation stages:
waiting pool, ready spot and channel. Soo describes the stages the
following way: "A vessel arrives at the waiting pool ... and joins the waiting
queue. When the vessel which occupies the ready-spot enters the channel,the highest priority vessel in the waiting pool fills the ready-spot which hasonly one space. The priority of each vessel in the waiting pool is determinedby the predetermined queue discipline and updated when a vessel in theready-spot enters the channel. The vessel occupying the ready-spot in thenext vessel entering the channel regardless of its priority. The vessel in theready-spot enters the channel if the immediate preceding vessel in thechannel is located far enough from the entrance of the channel." The model
TRAFFIC OPERATIONS AND MANAGEMENT
An Approach to Traffic Management in a Navigational Channel 45
is then a translation of the fore mentioned process in mathematical terms.
Soo's model has a few drawbacks. It was written so a computer operator
with basic queuing theory knowledge could make few changes and get
results. The key here is the basic programming and queuing theory
knowledge. The interface is not user-friendly and requires some time to
master. Consequently, the new model changes this and allows for greater
flexibility in choices and results. It can be readily modified to fit any
navigation channel when a few basic statistics are known. It incorporates
a few features to make the basic model easy to use while providing useful
information not previously available. The model also allows for the
simulation of actual ship arrival data and could provide a day to day
program for greater efficiency in traffic management. In short, the
philosophy behind the model produced in this paper is to develop a tool
readily available for traffic control and management which is flexible and
provides all required information.
3.4.1 Assumptions
The current model allows for modeling and simulation of data. The
assumptions made for each different mode are:
(a) Poisson arrivals
Research by Plumlee (Ref. 20) suggests that ships arrive at public
seaports following a Poisson distribution. His study shows agreement
between predicted and actual distribution ranging from 81.5 to
TRAFFIC OPERATIONS AND MANAGEMENT
46An Approach to Traffic Management in a Navigational Channel
An Approach to Traffic Management in a Navigational Channel
98.5%. Due to this results, the capacity model assumes vesselsarrive in a Poisson manner when in modeling mode. This means
that ships arrive independently and that the inter-arrival time between
successive ships is exponentially distributed.
(b) There is enough waiting space
Enough space is available at the entrance and exit of the channel to
hold an infinite number of ships and the vessel exiting the channel
does not block traffic. No limit in the number of vessels waiting is set
in the mode; nevertheless, it will advise the user when an infinite
queue is about to be generated.
(c) There is no time delay in changing stages
When changing from waiting pool to ready-spot to channel, the
transition is instantaneous. The arriving time at the waiting pool and
the entering time to the ready-spot is the same if the ready-spot is
empty.
(d) The velocity is constant
A vessel maintains a constant velocity while traversing the channel.This does not mean all ships necessarily maintain the same velocity.
Each vessel can travel at its own speed but that speed remains the
same all along the channel.
(e) The time separation is deterministic
TRAFFIC OPERATIONS AND MANAGEMENT
(f) Fixed fleet mix
There are only three possible vessel types allowed. When modeling,it will be assumed that fleet mixes do not change during the timehorizon of the model.
(g) Vessel data is available
When simulating, all data required by the traffic controller is assumed
to be available before the vessel's arrival so the controller canprepare a schedule. The data should include size, speed andexpected time of arrival (ETA) of the incoming ship.
(h) Traffic flow is continuous
A channel can operate 24 hrs a day, 365 days a year. No accident
will impede traffic nor will bad weather during the time horizon of the
simulation.
(i) No passing zones exist
Previous assumptions are those suggested by Soo's with a few changes.
Separation distance between vessels will be considered a variable, as will
the speed mode (discussed latter on).
TRAFFIC OPERATIONS AND MANAGEMENT
An Approach to Traffic Management in a Navigational Channel 48
3.4.2. Description
The model is written in Visual Basic, a modular programming language
which allows for a Windows-like interface. It has a main program with the
basic calculation routines -that have the equations described previously-
and several sub-programs reached through "forms" that handle data input
and output (See Appendix A for programming code and Appendix B foruser's manual). A general description is given in this point, a more detaileddescription is given in Appendix B.
There are three basic areas in the model that the user can modify. A first
area contains the basic fleet and channel characteristics. The model allows
for three different vessel types. Those ships are defined by DWT, length,beam, speed and waiting costs. Those types will serve as basis for themodel. The channel length and the number of lanes must also be specifiedin this area.
On a second area, the user selects arrivals. He can generate random
arrivals with a Poisson distribution or input actual vessels arrivals. Whenthe user decides to generate arrivals, he must specify the maximum inter-
ship arrival rate, the percentage of vessels of each type in the fleet mix and
the time horizon of the incoming modeling action. This data can be savedon a file to be viewed later. The file contains arrival time and date, vessel
type and priority. When the model generates arrivals, all vessels areassigned the same priority. On the same screen, the user can change the
ship arrival data when the real time data is to be used to simulate. Theuser must specify the arrival time and date, the vessel type and whether thevessel will have priority over other vessels in the waiting pool. The program
TRAFFIC OPERATIONS AND MANAGEMENT
An Approach to Traffic Management in a Navigational Channel 49
An Approach to Traffic Management in a Navigational Channel 50
will automatically reorder the vessel data base to fit this vessel in a FCFSlist saved on a separate file.
The third area controls to the actual operation. The output devices andparameters to be considered when running the model are defined in this
area. First, the user must specify whether he wishes to simulate (with real
time data) or model (with data generated by the program). The model willuse a different file/data base concurring with this selection.
Before the user starts processing the data, he must set up the speed mode,separation distance, convoy length and queuing strategy. Different
combinations might be specified simultaneously. For instance, if a user
chooses FCFS, COST, multi-speed and one-speed mode for maximum
separation distance, the results will reflect all combinations of the mentioned
factors. Once the user has shown a set of parameters, they will be saved
and will serve as default until a new set is defined.
The results of the simulation or model will be sent to the device selected bythe user: printer, screen or file. The model gives an output for each vessel
type and for the whole operation, consisting of the following indexes:
a. Service Time
b. Waiting Cost
c. Waiting Time
d. Throughput per unit time
The model also selects a best solution. This is specified by the user on this
area. The criteria for best solution selection are:
TRAFFIC OPERATIONS AND MANAGEMENT
a. Lowest overall cost
b. Lowest waiting time
c. Largest throughput per unit time
The program can select this optimum solution for single vessels or for
different convoy lengths when the user so specifies.
It tries to incorporate all the elements described before (speed mode,operational strategy, channel and fleet characteristics, separation distance)
so a manager has real time information for channel management. The idea
was to introduce all the parameters a user might want to use to decide the
best strategy for channel operations. Those parameters can be taken in
separate or together when possible.
3.5 MODELING RESULTS
The capacity of the channel will be measured through five parameters:
service rates, total throughput per unit time, global waiting and global
waiting cost. The objective at this point is to guide the user on the choices
the model offers to improve efficiency as well as the benefits of a navigation
control system. To that end, the effect of different variables in model results
is discussed. For comparison purposes, the service rate and total
throughput per unit time are used. Note that the service rate defines thenumber of ships that can be served by the channel under a given mode. As
described before, it depends on speed, separation distance and fleet mix.Therefore, each combination of fleet mix, separation distance and speedmode results on a different service rate as shown in table No. 3.1.
TRAFFIC OPERATIONS AND MANAGEMENT
An Approach to Traffic Management in a Navigational Channel 51
An Approach to Traffic Management in a Navigational Channel
TABLE No. 3.1
DESIGN VESSELS
Soo compares arrival rates -defined as one over the expected service rate-
between different alternatives as a percentage of the maximum arrival rate
for that alternative. This comparison basis can be misleading. For instance,when the service rates are different and the comparison criterion is a
percentage of the maximum capacity, there is little difference in global
waiting; however, when the ship inter-arrival rate is used, the difference is
marked. This is because the shape (as defined by the relative values for
the same percentages of usage) is the same for both speed modes, but the
maximum capacity values differ.
There is, however, another good reason to use service rate as comparison
criteria. For all the cases evaluated, despite queuing mode, the service rate
is a direct indicator of capacity. The lower the service rate the lower waiting
time, global waiting cost and global cost are. So in this sense, the service
rate can, and will, be used as a "quick and dirty" indicator of capacity.
TRAFFIC OPERATIONS AND MANAGEMENT
Dead Weight 160000 85000 40000[ton]
Speed [m/min] 216.1 246.9 308.7
Length [m] 297 263 213
Cost [$/day] 30240 20160 14400
952-
An Approach to Traffic Management in a Navigational Channel
Figure No. 3.2
CHANGES IN SERVICE RATES DUE TOSPEED MODE AND SEPARATION DISTANCE
Service rate (min)
240 260 280 300
Mean Velocity (mnmin)
TRAFFIC OPERATIONS AND MANAGEMENT
220
-A -- . M.- -a. -s- t-... .E...ax Maxdist Min dist Min distOne speed Multi speed One speed Multi speed
a e
For comparison purposes, the model is run for 2.5, 5 and 10 NM long, two-
way navigation channel. The figures shown in Appendix C show the basic
results obtained using the model under the different modes discussed
previously. The data presented there is the basis for the following analysis.
Also, the fleet mix is varied but for only three vessels with the following
characteristics:
3.5.1 Service Rates
The model results show no significant difference between the expected
maximum service rate calculated using equations 3.1 to 3.3 -and a first
come first serve strategy- and COST and FAST strategies for the one
speed mode. When multi-speed mode is allowed, there is a slight
improvement in service time when the FAST strategy is in place. No
differences were detected when using either a COST strategy or when
allowing for convoys. In short, the use of a different queuing strategy does
not change the service rate. This is because queuing strategy basically
affects the order in which vessels enter the channel (the server). It does
not affect the separation distance or the speed mode -factors that do alter
the service rate. This fact is shown in table 3.2.
The speed strategy that results in the lowest service rate is the one speed
mode for channels longer than 4 NM for the fleet mixes evaluated;
otherwise, a multi-speed strategy is better. When the fleet mix changes,
the behavior is similar except for fleet mixes with faster speeds.
TRAFFIC OPERATIONS AND MANAGEMENT
An Approach to Traffic Management in a Navigational Channel 54
An Approach to Traffic Management in a Navigational Channel
TABLE No. 3.2
SERVICE TIME COMPARISON (in minutes)FCFS Queuing Strategy
SPEED FLEET MIX MAXIMUM MAXIMUM MINIMU IMNIMUMMODE : SEPARATION f SEPARATION SEPARATIO N SEPARATION
SEQUATION MODEL II EUAON :MODEL
One 811 16.2 16.2 10.6 9.6
333 14.6 14.6 9.6 8.7
118 12.9 12.9 8.3 7.6
Multi 811 16.2 15.5 10.9 9.9(2.5 nm)
333 14.2 13.6 9.8 9
118 11.7 11.3 7.5 7.3
Multi 811 16.9 16.2 11.6 10.7(5 NM)
333 15.7 14.9 11.2 10.4
118 12.6 12.1 8.1 8.2
Multi 811 18.5 19.3 13.2 12.2(10 NM)
333 18.5 19.3 14 13.3
118 14.2 15.1 9.3 9.9
As the channel length increases so does the multi-speed mode service
time. Also, increments in the relative proportion of type three (fastest)
vessels are followed by reductions in service time as might be expected.
Figure 3.2 shows these tendencies for different channel lengths. It is
important to point out that these tendencies correspond to the vessels
previously described. Changes in fleet mixes and velocities result in
different behavior. Of course, the difference in service times between one
and multi-speed modes is lower as the relative vessel speeds get closer.
TRAFFIC OPERATIONS AND MANAGEMENT
An Approach to Traffic Management in a Navigational Channel
Figure No. 3.3
CHANGES IN SERVICE RATES DUETO CHANNEL LENGTH
MAX. DISTANCE SEPARATION
Service rate (min)
220 240 260 280 300
Mean speed (m/min)
TRAFFIC OPERATIONS AND MANAGEMENT
...
·
18
16
14
56
i
· ·
An Approach to Traffic Management in a Navigational Channel
Separation distance is by far the factor with the largest effect on servicetime. As figure 3.3 shows, service times decrease by at least 40% ifseparation distance is kept at a minimum as opposed to maximumseparation. This is true despite speed strategy and channel length. If forexample the channel length is increased to 10 NM, the difference in servicetimes due to separation distance is about 38% while the same differencefor a 2.5 NM channel the reduction amounts to about 41%.
The data analyzed shows that:
(a) Queuing routine does not affect service rates.
(b) The best speed mode routine depends on the channel length and thefleet mix. For the examples evaluated, one speed mode is better thanmulti speed for longer channels, otherwise for shorter ones.
(c) The separation distance is a very important factor in service timedefinition. A lower separation distance always results in shorter servicetimes.
3.5.2 Global waiting and Global cost
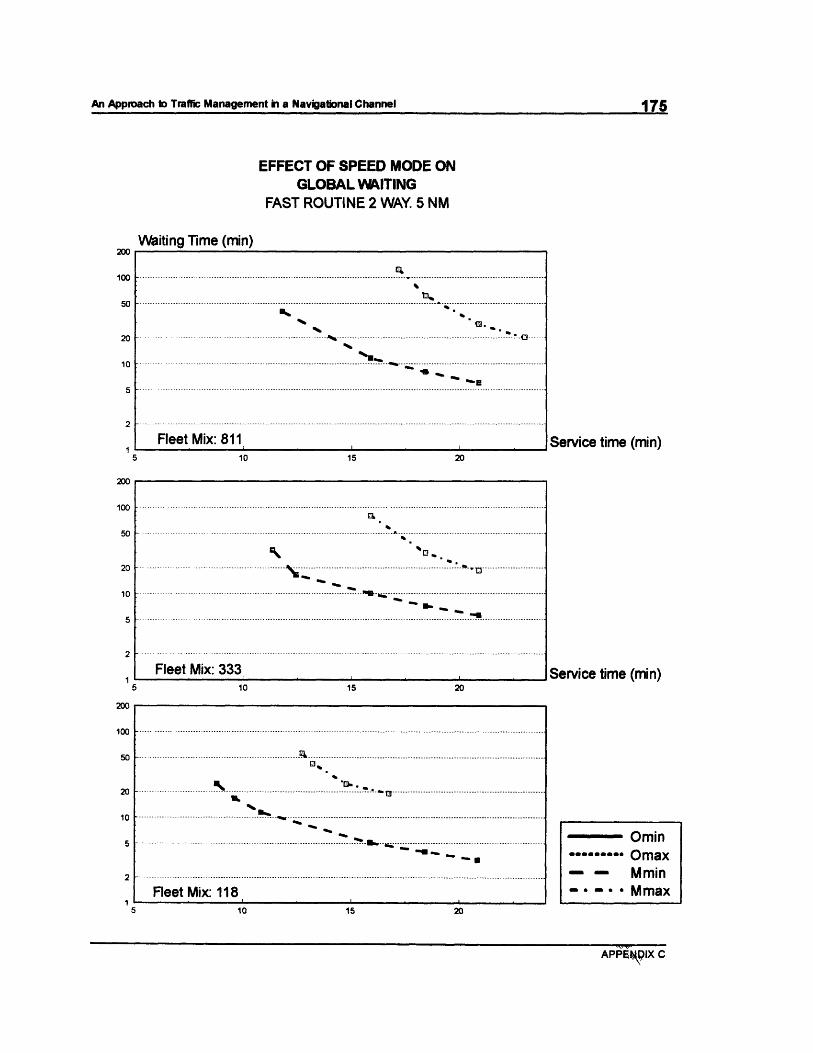
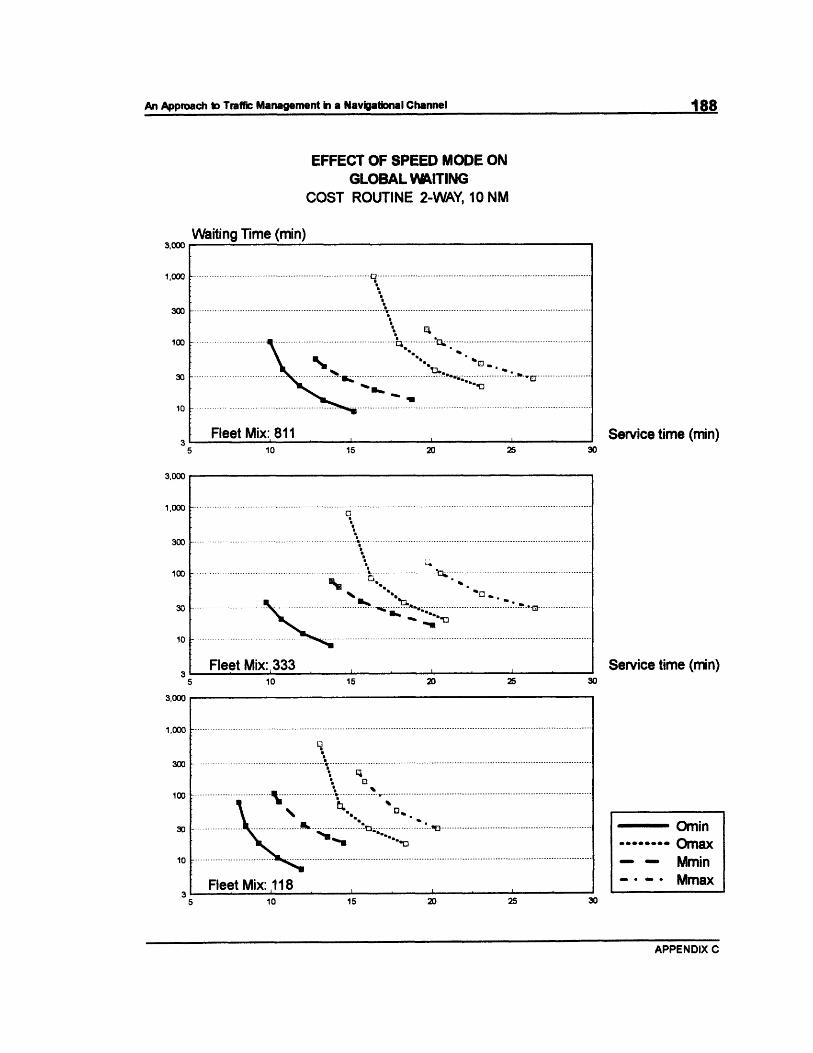
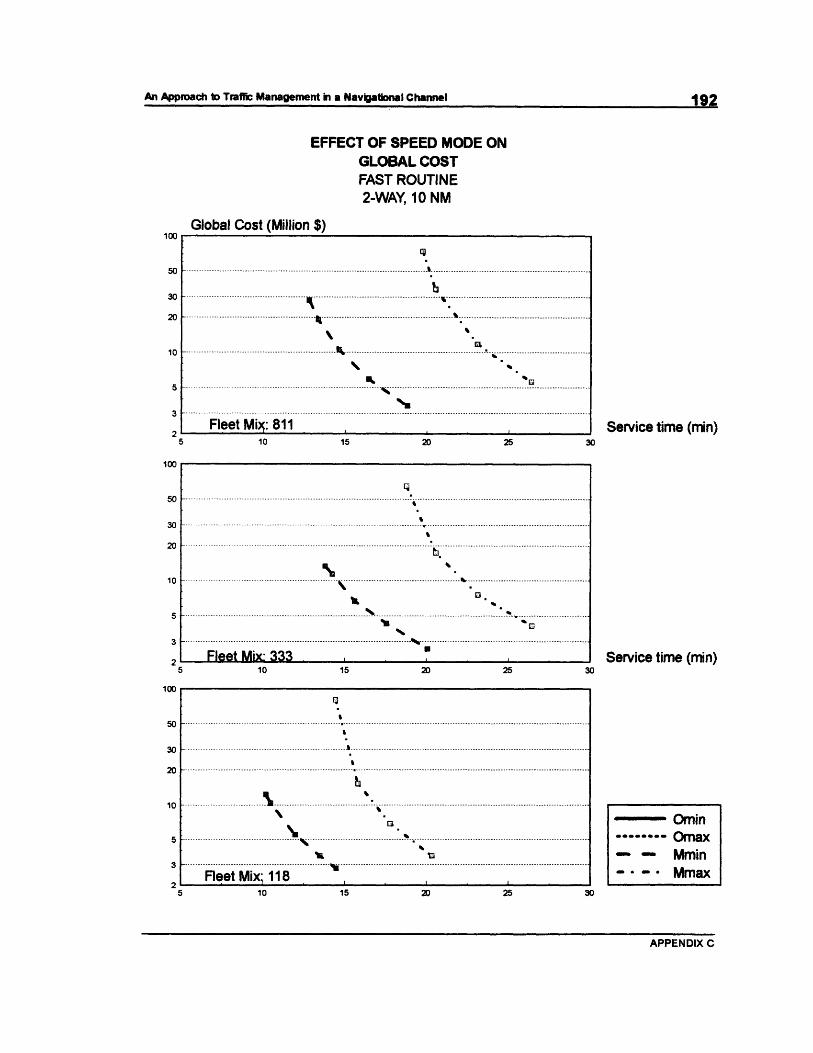
The two speed modes and two separation distances discussed before resultin four cases: Omin, Mmin, Omax y Mmax. Omin shows one-speed modewith minimum distance (minimum distance as described in chapter No. 2)while Mmin indicates multi-speed with minimum distance. Omax indicatesone-speed mode and maximum distance separation and Mmax definesmulti-speed mode with maximum distance.
Figures 3.4 to 3.9 show the results obtained using the model for globalwaiting and global cost with a FCFS strategy on different fleet mixes and
TRAFFIC OPERATIONS AND MANAGEMENT
An Approach to Traffic Management in a Navigational Channel
.......................... ..................................................... ......................................................................Fleet Mix: 118 I , I L
--
I I I I I I I I II I .
I
An Approach to Traffic Management in a Navigational Channel
......... ......... i i i ........ ........................................,' -.................................................................................... •q
An Approach to Traffic Management in a Navigational Channel
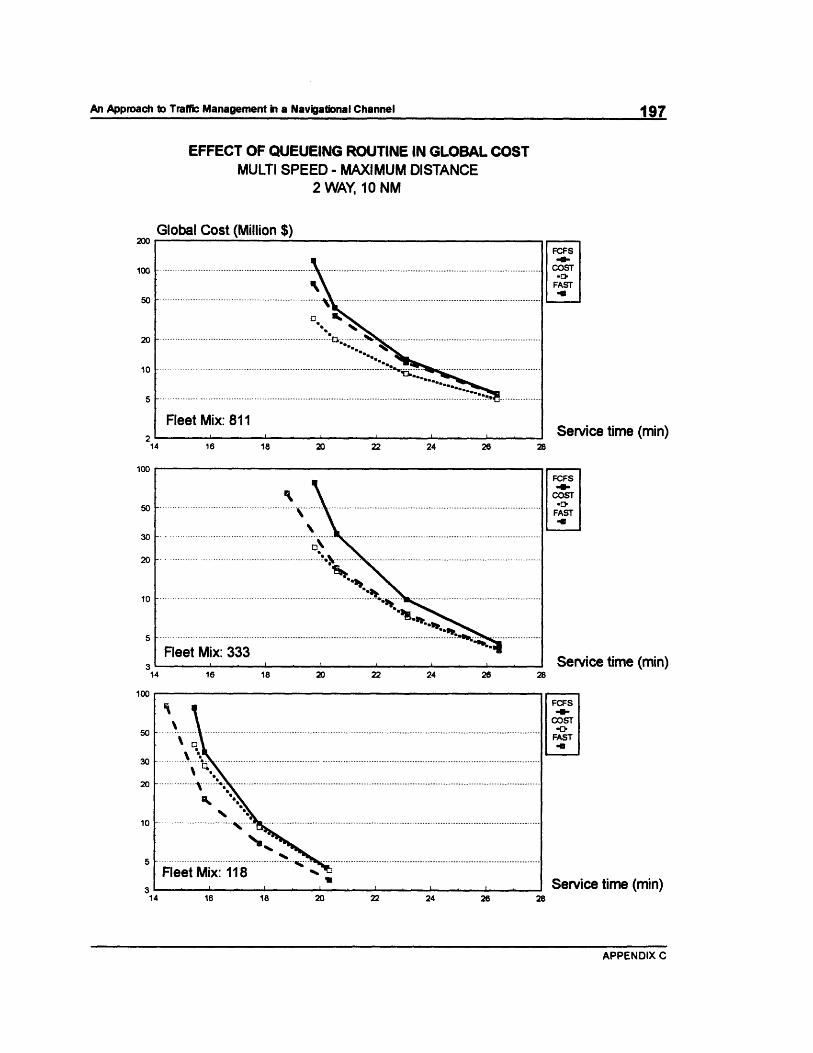
Figure No. 3.14EFFECT OF QUEUEING ROUTINE IN GLOBAL COST
MULTI SPEED - MINIMUM DISTANCE2 WAY, 5 NM
Global Cost (Million $)
10 15 20
TRAFFIC OPERATIONS AND MANAGEMENT
70
Fleet Mix: 811
Fleet Mix: 333,~ i L
10 15 20
Fleet Mix: 118
I 1 I 1 I I . ·
FCFS-W
COSTIEIFAST
Service time (min)
FCFS40I
COST
FAST
Service time (min)
FCFSCOST-.
FAST
Service time (min)
I-------------------
--- -- ------------------------------ -
---- ---------------------- --- - --- ----
--- ------ --------------------- ----- - -----
.. ... ... ----- -- -- -------------
--------- -
I-- - ---- -- ------------
----- -----------------
----------------
-- ----------
------- ----------------
---- ---------------------
.... 11 ---------------
--------------------
I --------------
.....................
------------------- - -
- ------------ -------
,, ,
An Approach to Traffic Management in a Navigational Channel
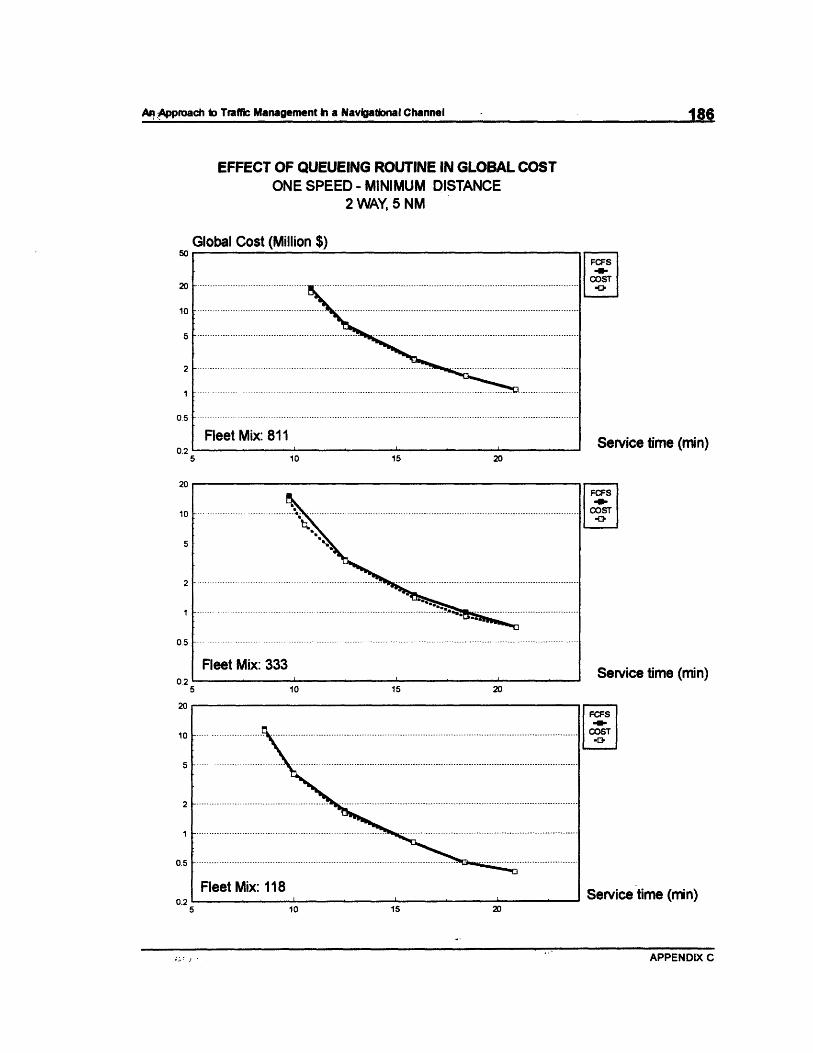
Figure No. 3.15EFFECT OF QUEUEING ROUTINE IN GLOBAL COST
ONE SPEED - MINIMUM DISTANCE2 WAY, 5 NM
Global Cost (Million $)
10 15 20
10 15 20
FCFSCOST
Service time (min)
Service time (min)
FService time (FSCOST
Service time (min)
TRAFFIC OPERATIONS AND MANAGEMENT
C
Fleet Mix: 811
50
20
10
5
2
4
0.5
0.2
20
10
5
2
1
0.5
0.25
Fleet Mix: 33310 15 20
10
5
2
1
0.5
0 2
Fleet Mix: 1185
1
Fleet.. ix: 118
An Approach to Traffic Management in a Navigational Channel
TRAFFIC OPERATIONS AND MANAGEMENT
changes in queuing routine. As congestion rates increase, the benefits of
each routine start to show up. These improvements are not as well defined
as those found changing separation distance or even speed mode. For
instance, FAST strategy succeeds in reducing global waiting time. The level
of success is, however, dependent on the fleet mix and the channel length.
For a 811 fleet mix, the improvement is almost nil. For a 333 fleet mix, a
FAST strategy it results on a 60 min reduction (or about 40%) over a FCFS
strategy. For a 118 fleet mix, the reduction is about 40 min (40%) over a
FCFS strategy. Comparing global waiting time, a COST routine performs
similarly to a FCFS routine (See Appendix C).
When convoys are allowed, the same tendencies apply. The inclusion of
convoys as a strategy serves as "fine tuning". For an arrival rate of a ship
every 17.5 min under a FCFS strategy, the Omin mode results in about 4
min of average global waiting, while the Mmin mode results in about 7 min
and the Omax and Mmax modes in about 100 min for a 811 fleet mix for
the optimum convoy length. The difference when an optimum convoy
length is not programmed is about 10%. This percentage changes with the
convoy length, but waiting times and costs start increasing after a certain
convoy length (more than five for this particular fleet mix and channel
configuration). The convoys improve on the strong points of COST and
FAST strategies, lowering waiting times in a FAST strategy and lowering
costs on a COST strategy. Note that improvements with the convoys are
not evenly distributed along all pertinent factors. For instance, while a
certain convoy length might improve on the waiting time, it does not
necessarily improve in the same proportion for the global cost; another
convoy length might result on a better global cost but not on the best
waiting time even under the same queuing strategy.
TRAFFIC OPERATIONS AND MANAGEMENT
An Approach to Traffic Management in a Navigational Channel 73
3.6 SUMMARY
An easy way to define the best alternative in separation distance and speed
mode is through service rate. This index will give an immediate idea of
what the channel capacity can be under different circumstances. The use
of this index is not limited to a fixed fleet mix so a "dynamic" service rate
can be determined as different ships arrive to use the channel.
Separation distance is the most important factor in the definition of capacity.
It greatly affects service rates and as shown, service rate defines capacity.
Reductions in the separation distance of about 35% results in similar
increases in capacity (as defined by the service rate).
The choice of velocity mode depends primarily on the channel length and
fleet mix. For short channels, multi-speed mode might be a better than a
one speed mode. For longer channels, a one speed mode is likely to be a
better one. These observations are based on relative velocity differences
between vessels composing the fleet mix. If velocities in the fleet mix have
a low variance, a multi-speed strategy will resemble a one speed mode. If
the variance is high among vessels' speeds, the difference between a
multi-speed mode and a one speed one will be larger and the effect of
channel length more acute. The choice of speed mode will, therefore,
depend on a channel's particular fleet mix and length.
It has been shown that for low arrival rates, the use of a queuing model
does not affect costs and capacity. As congestion increases, the relative
importance of a queuing mode also increases. Once the congestion is
TRAFFIC OPERATIONS AND MANAGEMENT
74An Approach to Traffic Management in a Navigational Channel
nearing capacity, the choice of queuing model depends on the objective in
mind. If maintaining low cost -while disregarding users priority arrival- is the
objective, the best strategy is to use a COST routine. When the prime
objective is to allow the highest number of vessels through the channel
again disregarding priority of arrival, then the FAST strategy is the optimum
one. FCFS strategy does not have any advantages over the other two
strategies for high arrival rates. It's only advantage is that it does maintain
an arrival priority that might please some channel users. These conclusions
are effective when referring to same velocity modes and separations
distance.
Convoys improve capacity on any given queuing model. The optimum
convoy length varies with the conditions under analysis and the objective
in mind. The improvements -although they might be marginal while on low
usage levels- become more important as arrivals get near capacity but are
not as important as those obtained changing other model factors.
TRAFFIC OPERATIONS AND MANAGEMENT
An Approach to Trafmc Management in a Navigational Channel 75
An Approach to Traffic Management ri a Navigational Channel 76
TRAFFIC OPERATIONS AND MANAGEMENT
76An Approach to Traffic Management in a Navigational Channel
An Approach to Traffic Management in a Navigational Channel
CHAPTER No. 4
4. ECONOMIC CONSIDERATIONS
Now that the potential benefits have been described in the previous chapter, the
economic benefits will be defined. The analysis will be limited to two cases: A
5-NM long, 2-way channel and a 10 NM long 2-way channel. Each has been
modeled for the speeds and queues described in the previous chapter under an
evenly distributed fleet mix. This point will add dollar value to the time savings and
the individual vessel costs. At this level, no convoys will be planned.
4.1 CASE: 5-NM LONG, 2-WAY CHANNEL
For the evaluation of the 5 NM long channel, the FCFS queuing strategy
with maximum separation and multiple speed allowed will be the basis for
comparison. The intership arrival rate will be one vessel every 20 min (or
85% of capacity). Under this scheme, about 52600 vessels will be served
during one year. The global waiting cost associated to this level of service
is about 12 million $/year. If the speed strategy is changed from multiple
speed to one speed, the level of utilization drops to 81 % of capacity but the
number of vessels served remains constant. In this event, the global
waiting cost is 11.9 million $/year. If the same level of capacity is to be
maintained, vessels can be received every 19 min (for a total of 55200vessels/year) with a global waiting cost of about 13.2 million $/year.
Changing the base case now to minimum distance but keeping the samearrival rate, the global waiting cost is 2.5 million $/year. Under this
ECONOMIC CONSIDERATIONS
An Approach to Traffic Management in a Navigational Channel
separation distance, the channel would be operating at 55% capacity whenvessels arrive every 20 min. To increase the capacity to 85%, a vesselshould arrive every 12.8 min (82000 vessels/year). If a vessel is receivedat this rate, the global waiting cost is 14.6 million $/year.
Finally, changing not only the minimum distance but also the speed modeto one speed, the global waiting cost is 2.2 million $/year. The level ofcapacity when vessels arrive every 20 min is 53%. The channel can servea ship every 12.5 min (84000 vessels/year) and operate at 85% capacity.
Working at 85% capacity, the global waiting cost would be 9.1 million
$/year.
Note that changing solutions always either reduce cost or increase the
throughput in the channel in most cases substantially. When arrival levels
are maintained, then costs are reduced. Otherwise, when arrivals increase
to accommodate the increase capacity, cost increase but the number of
vessels served also increases. Cost are reduced by 80% or about 10
million $/year when the distance is minimized and the one speed strategy
is in place.
4.2 CASE: 10-NM LONG, 2-WAY CHANNEL
The base case for this channel is the same as the one described on point
4.2. Here, the base service time is 22.7 min (85% capacity for the multi-
speed maximum distance case). The channel can serve 46300 vessels in
one year and the waiting cost is 21.9 million $/year. When the speed
strategy in the channel is changed to one speed, the capacity utilization
ECONOMIC CONSIDERATIONS
An Approach to Traffic Management in a Navigational Channel
level drops to 64%. and the waiting cost is 9.1 million $/year. When the
capacity utilization is 85%, this combination results in a waiting cost of 73
million $/year while serving 61200 vessels.
If the multi speed mode and the arrival rate is maintained while changing
the separation distance to the minimum, the global waiting cost is about 3
million $/year. The utilization level is then 74%. Increasing the arrival rate
to 85% of the capacity will result in a global waiting cost of 14.6 * 106
$/year. The cost is distributed among 73500 vessels that are served.
For the last combination, one-speed and minimum distance with vessel
arriving every 22.7 min, the predicted global waiting cost is about 2 million
$/year. This arrival rate corresponds to 45% utilization under these
conditions. At 85% capacity, the global cost is 36.5 million $/year but
102700 vessels can use the facility.
As in the case of a 5-NM long channel, there is always improvement. The
improvement is either additional capacity or lower waiting costs. In the
most extreme case, the channel manager can either save 20 million $/year
or allow twice as many ships as before the change in strategy is set.
4.3 SUMMARY
Even though the analysis is limited to two cases, the savings in global
waiting cost seem to justify investments in a distance reduction system.
The savings vary with the strategy selected, channel length and fleet mix.Even though this last factor was not considered in the previous analysis, the
ECONOMIC CONSIDERATIONS
. v
An Approach to Traffic Management in a Navigational Channel
service rates described in point 3 indicate such behavior. Again, the
financial benefits are the savings in waiting costs or the increased channel
usage fees due to the increased traffic.
The dramatic savings described kick in when a channel is nearing capacity.
When the level of utilization is lower -say about 70%- the said services
might not materialize or become much lower. A case by case analysis
must be pursued in order to determine potential savings. Using the model
described in the previous chapter this can be determined under a myriad
of conditions.
ECONOMIC CONSIDERATIONS
An Approach to Traffic Management in a Navigational Channel
CHAPTER No. 5
5. TRAFFIC MANAGEMENT SYSTEM
All elements discussed in previous chapters make up a navigation system: an
access channel, a fleet and a traffic management program. These elements can
be taken in conjunction to establish a system for traffic management. In chapter
2, the safety factors in the definition of separation distance and the ship domain
were discussed. At that point the feasibility of reducing separation distance was
established since information is available to the user. In chapter 3, the system for
traffic management and the factors to consider when developing a strategy was
established. The proposed model can then be used to define a best approach.
The economic benefits of distance reduction were established in chapter 4. In
short, it all points to the potential benefits and feasibility of reducing separation
distance. This chapter describes a system wide approach to the problem. The
objective will be to propose a system than can be used with minimum start up
costs and with readily available equipment and know how.
5.1 REQUIREMENTS
Let's check the requirements for the system to work. Under the case to beconsidered base, a channel is operated with distances as determined byequations 3.2 (maximum distance), a multi-speed mode and a FCFSqueuing strategy. To improve on this, the first factor to be considered will
be separation distance. As established before, this is feasible if hefollowing condition is met: information is available. From the previousanalysis, the only way distance can be reduced is by providing continuous
TRAFFIC MANAGEMENT SYSTEM
An Aproch t TrfficMangemnt i a avigtioal CannlA9
position information to the user.
The proposal is to install a GPS (Global Position System) like set up. Such
system installed on a vessel will send a continuous radio signal to a "fixed"
land station that will have a dual purpose:
a) improve the accuracy of the "mobil" GPS on the vessel and
b) inform a control center of the vessels position continuously.
The "fixed" land station will monitor all incoming vessels and will send a
signal back with the position of all incoming vessels. The system installed
on the vessel is connected to a inboard computer that will monitor the
vessel position in the channel and will also receive data via modem or radio
signal with the position of other vessels in the vicinity.
The accuracy of a GPS system will depend mainly on the number of
satellites the device keeps track of. Devices in the market that receive up
to 6 satellite signals have accuracy of 1 to 5 m. This level seems more
than enough for our ship positioning purposes. Since the signal is sent
continuously (a standard systems can send four signals every second), not
only is the position known but also the speed of the vessel at any given
time. The requirements for the distance reduction are then met.
A computer can be set up so it can pick up signals coming from many
vessels. Systems similar to this are already in the market and can monitor
as many as 100 vessels. Since the signal priority and effect on the overall
system will depend on the distance to the terminal or channel, different
signal acceptance rates can be defined according to this factor. In other
TRAFFIC MANAGEMENT SYSTEM
An Approach to Traffic Management in a Navigational Channel 82
An Approach to Traffic Management in a Navigational Channel
words, the computer might accept signals every minute from incommingvessels not in the waiting area and every second for vessels using thechannel for instance. A fast PC might be able to handle this data withspecial modifications.
The previously described set up takes care of the information system. Thenext step is to use the model to come up with the best overall strategy asdefined by channel usage policy and costs. This is done with the modelingprogram described on chapter 3. The program is flexible enough and
provides information to make an informed decision on the best overall
strategy. Even though, the model does not accept vessel information
currently, it can be easily modified to keep track of incoming vessels and
provide the channel manager with probable arrival times as it places the
vessel in queue (and on its own data base).
5.2 SUMMARY
A system to handle vessel traffic in a navigation channel can be installed
with existing off-the-shelve technology and a relatively minor investment.
Since all GPS systems signals are not necessarily compatible, a portable
computer with modem/FAX (and a cellular phone) connected to a "mobil"
GPS might be carried by the pilot to the vessel. This might be a temporary
solution for GPS manufacturers are working on universal standards for
signal transition and reception.
The "fixed" land system will include a GPS that will serve as reference point
to all other positioning systems hooked up to a computer that will monitor
TRAFFIC MANAGEMENT SYSTEM
the vessels' positions, estimated arrivals and probable waiting times (using
the model proposed on this paper). This could be handled by one or
several personal computers that can work on a local area network if one is
not sufficient to handle all incoming information.
TRAFFIC MANAGEMENT SYSTEM
An Approach to Traffic Management in a Navigational Channel 84
CHAPTER No. 6
6. CONCLUSIONS AND RECOMMENDATIONS
A traffic management system is feasible and easily implemented using existing
technology. All constituent parts can be put together with a small compared to thepossible savings. The savings in time and costs are relative to the level of usageof the navigation channel. Nevertheless, even when in low usage levels some
savings can be made. Once an optimum solution set is chosen for a waterway,
the usage level at which a management system can be set up with some profit can
be easily calculated.
In general, the model proposed can, by itself, generate savings in time and
money. The amount of the savings will depend on the basic objectives of the port
manager: cost reduction or waiting time reduction. The capacity of the system can
also be increased by the use of the model. The use of convoys can be
selectively chosen depending on the mix of vessels in waiting queue, and will also
enhance the system objectives. Also, once a model for operation has been
established, day to day operations can be managed with the model.
The model results show the financial and operative advantage of reducing
separation distance. The definition of this factor needs to be reviewed under the
light of the existing positioning, communication and computing technologies.
CONCLUSIONS AND RECOMENDATIONS
An Approach to Traffic Management in a Navigational Channel 85
An Approach to Traffic Management ri a Navigational Channel As
BIBUOGRAPHY
An Approach to Traffic Management in a Navigational Channel 86
An Aproch o TfficMangemnt i aNaviatinalChanel87
BIBLUOGRAPHY
1. Abdelgalil, E.M., "Shipping Casualties and Ship's Domain". International
Symphosium on Marine Traffic. Liverpool 1978 (p. 95).
2. Agerschou, Hans et al. "Planning and Design of Ports and Marine
Terminals". Wiley Interscience. 1983.
3. Andersen, Terje. "Use of Risk Analysis in Port Siting, Planning and
Design". Veritas Offshore Technology and Services. Oslo, Norway.
4. Bottoms, Eric. "Practical Tonnage Capacity of Canalyzed Waterways".
Journal of the Waterways, Harbors Division. Vol 92. (WW1) Feb. 1966.
An Approach to Traff~ Management ii a Navigational Channel 92
ScaleMode = SMEnd Sub
Sub Emboss (DoWhat As Control, Style As String, FrameSize As Integer)DrawWidth = 1' Embossed=1; Etched=0 (inner or outer respectively)If Left$(LCase$(Style), 1) = "o" Then
cg = 15c2 = 8
Elsecg=8c2 = 15
End If' Set the frame distances relative to controlDoWhat.BackColor = QBColor(7)X = DoWhat.Left - 46 - FrameSizeY = DoWhat.Top - 46 - FrameSizeX1 = DoWhat.Left + DoWhat.Width + 26 + FrameSizeY1 = DoWhat.Top + DoWhat.Height + 26 + FrameSize' Draw first frameLine (X, Y)-(X1, Y1), QBColor(cg), B' Draw second frame down and to the rightLine (X + 14, Y + 14)-(X1 + 20, Y1 + 20), QBColor(c2), B' Add dost to make two of the corners look smooth' only for embossed styleIf cg = 15 Then
Sub GenArrival_Click 0'Allows only cancel keyGenArrival.Enabled = FalseEditPD.Enabled = FalseHelpP.Enabled = FalsefrmGenShpData.Enabled = False' Creates data base
APPENDIX A
An Approach to Traffic Management in a Navigational Channel 99
An Approach to Traff~ Management ii a Navigational Channel 100GenerateArrival' Reactives all keysfrmGenShpData.Enabled = TrueEditPD.Enabled = TrueHelpP.Enabled = TruefrmGenShpData.Enabled = True
End Sub
Sub ShiplPerc_Change 0' Sets value of ship1Ship1 = Val(ShiplPerc.Text)' Changes value of third vessels' depending on first and secondShip3Perc.Text = 100 - (Ship1 + Ship2)
End Sub
Sub Ship2Perc_Change 0' Sets value of ship2Ship2 = Val(Ship2Perc.Text)' Changes value of third vessels'depending on first and secondShip3Perc.Text = 100 - (Ship1 + Ship2)
End Sub
Sub Ship3Perc_Change 0' Sets value of ship3Ship3 = Val(Ship3Perc.Text)' Changes value of third vessels'depending on first and secondShiplPerc.Text = 100 - (Ship3 + Ship2)
End Sub
Sub ShipArrival_Change 0' Sets arrival rateArrivalRate = Val(ShipArrival.Text)
End Sub
Sub Textl_Change 0' Sets length of simulationSimDays = Val(Textl.Text)
End Sub
APPENDIX A
100An Approach 1o Traftic Management in a Navigational Channel
An~~~~~~~~~~~~~~~ AprahtIrfi aaeet iaNvgtoa hne 0
MDIPRINC.FRM
Sub cmdSalida_Click 0End
End Sub
Sub BasicData_Click 0BasicDataRoutine
End Sub
Sub ExitProg_Click 0'Ends programmsg = "This will end your Channel Operations Optimization session."Answer = MsgBox(msg, 65, "Quit")If Answer = 1 Then
EndEnd If
End Sub
Sub GenDB_Click 0' Calls routine to generate dataGenShpArrival
End Sub
Sub MDIForm_Load 0OpenBasicDataOpenShipDbLoad frmOperationsfrmOperations.Show
On Error GoTo ErrorTrap'Initializes necesary files' Checks if User ship Data Base exitsXFile = Dir$C'C:\simmod\Ship235.Txt')If UCase(XFile) <> UCase("Ship234.Txt") Then' File does no exist'Generates newFileCopy "c:\simmod\blank.txt", "c:\simmod\Ship234.Txt"
End IfGoTo JumpErrorTrap:
ErrorTrapJump:End Sub
Sub mnuBasicData_Click 0BasicDataRoutine
APPENDIX A
An Approach to Traffic Management in a Navigational Channel 101
An Approach to Traffic Management ii a Navigational Channel 102
End Sub
Sub RunSimulation_Click 0' Run simulationProcess
End Sub
Sub SetupProcessClick 0' Runs routine for setting up simulationSetUpSimulation
End Sub
Sub UserDB_Click 0' Calls user data routineUseShpArrival
End Sub
APPENDIX A
An Approach to Traffic Management in a Navigational Channel 102
An Approach to Traffic Management m a Navigational Channel 103MONITOR.FRM
Sub Command3Dl1Click 0EndEnd Sub
Sub Command3D2_Click 0gauMonitor.Value = gauMonitor.Value + 2
End Sub
Sub gauMonitorChange 0If gauMonitor.Value >= 100 Then
Unload frmMonitorEnd If
End Sub
APPENDIX A
An Approach to Traffic Management in a Navigational Channel 103
AJi Approach k~ Traffic Management m a Navigational Channel 104OPERATIO.FRM
Sub cmdBasicData Click 0Load frmShowBasicDatafrmShowBasicData.Show'BasicDataRoutine
End Sub
Sub cmdExit_Click 0msg = "This will end your Channel Operations Optimization session."Answer = MsgBox(msg, 65, "Quit")If Answer = 1 Then
EndEnd If
End Sub
Sub cmdRun_Click 0' Run simulation'frmMonitor.ShowLoad frmRunProcessfrmRunProcess.Show'Process
End Sub
Sub cmdSetup_Click 0' Runs routine for setting up simulationSetUpSimulation
End Sub
Sub Form_Load 0frmOperations.Top = 100frmOperations.Left = 100
End Sub
APPENDIX A
104An Approach to Trafi Management in a Navigational Channel
ElseaniPrinter.SpecialOp = 1SendtoPrinter = TruecmdPrinter.Caption = "- On -"
End IfEnd Sub
Sub Form_Load 0If SendtoScreen = True Then
aniMonitor.SpecialOp = 1Else
aniMonitor.Frame = 1End IfIf SendtoPrinter = True Then
aniPrinter.SpecialOp = 1Else
aniPrinter.Frame = 1End IfIf SendtoFile = True Then
aniFile.SpecialOp = 1Else
aniFile.Frame = 1End If
End Sub
APPENDIX A
An Approach to Traffic Management in a Navigational Channel 106
An Aproch o TrffiMaageent i aNavgatinalChanel107
PRINCIPM.FRM
Sub BasicData_Click 0BasicDataRoutine
End Sub
Sub ExitProg_Click 0'Ends programEnd
End Sub
Sub Form_Load 0' Initializes necesary files' Checks if User ship Data Base exitsXFile = Dir$("C:\simmod\Ship235.Txt")If UCase(XFile) <> UCase("Ship234.Txt") Then
' File does no exist' Generates newFileCopy "c:\simmod\blank.txt", "c:\simmod\Ship234.Txt"
End IfEnd Sub
Sub GenDB_Click 0' Calls routine to generate dataGenShpArrival
End Sub
Sub RunSimulation_Click 0' Run simulationProcess
End Sub
Sub SetupProcessClick 0' Runs routine for setting up simulationSetUpSimulation
End Sub
Sub UserDB_Click 0'Calls user data routineUseShpArrival
End Sub
APPENDIX A
107An Approach to Traffic Management in a Navigational Channel
An Approach to Traffic Management ii a Navigational Channel 108
PROCESSD.FRM
Dim Control As Integer
Sub DisableCell 0' Does not allow user to' change data on screenOption3Dl.Enabled = FalseOption3D2.Enabled = Falsecheck3dl.Enabled = FalseCheck3D2.Enabled = FalseChecK3D3.Enabled = FalseQueuel.Enabled = FalseQueue2.Enabled = FalseQueue3.Enabled = FalseSpeedl.Enabled = FalseSpeed0.Enabled = FalseSeparl.Enabled = FalseSepar2.Enabled = FalseStartDate.Enabled = FalseNDays.Enabled = FalseIf Simulation = True Then
Sub cmdSaveSetup_Click 0Control = 0Convoy = Val(Combol.Text)If Convoy = 0 Then Convoy = 1IniDate = StartDate.TextSimDays = Val(NDays.Text)' Opens file and saves data on screenSaveBasicData
End Sub
Sub cmdSCriteria_Click 0Load frmSelectCriteriafrmSelectCriteria.Show
End Sub
Sub Form_Load 0frmProcessData.Height = 6180frmProcessData.Top = 100frmProcessData.Left = 2250frmProcessData.Width = 5640Control = 0' Opens basic data fileOpenBasicData' Defines values that will show on screenIniData' Defines status of cells
APPENDIX A
An Approach to Traffic Management in a Navigational Channel 110
'Shows MessageMessagel.Visible = TrueMessagel.Caption = "Best combination included when several options indicated"'Assigns values to form variblesIf SendToScreen Then
check3dl .Value = IElse
check3dl.Value = 0End IfIf SendtoPrinter Then
Check3D2.Value = 1Else
Check3D2.Value = 0End IfIf SendtoFile Then
ChecK3D3.Value = 1Else
ChecK3D3.Value = 0End IfIf Simulation = True Then
Option3D1.Value = FalseOption3D2.Value = True' If Simulation, Initial date relevantLabel8.Visible = TrueStartDate.Visible = True
ElseOption3D1.Value = TrueOption3D2.Value = False' If Modeling, Initial date irrelevantLabel8.Visible = FalseStartDate.Visible = False
End IfEnd Sub
Sub NDays_Change 0'Assigns value in box to'variable Time HorizonTimeHorizon = Val(NDays.Text)
End Sub
Sub Option3DI_Click (Value As Integer)'Changes Icon and updatesIf Option3DD1.Value = False Then
Plconl.Visible = TruePlcon2.Visible = FalsePlcon3.Visible = FalsePlcon4.Visible = True' If Simulation, Initial date relevantLabel8.Visible = True
APPENDIX A
An Approach io Traffic Management in a Navigational Channel 111
An Appmach to Traffic Management m a Navigational Channel 112
StartDate.Visible = TrueElse
Plconl.Visible = TruePlcon2.Visible = TruePlcon3.Visible = TruePlcon4.Visible = False' If Modeling, Initial date irrelevantLabel8.Visible = FalseStartDate.Visible = False
End IfSimulation = Option3D2.Value
End Sub
Sub Option3D2_Click (Value As Integer)'Changes Icon and updatesIf Option3lD1.Value = False Then
Plconl.Visible = TruePlcon2.Visible = FalsePlcon3.Visible = FalsePlcon4.Visible = True' If Simulation, Initial date relevantLabel8.Visible = TrueStartDate.Visible = True
ElsePlconl.Visible = FalsePlcon2.Visible = TruePlcon3.Visible = TruePlcon4.Visible = False' If Modeling, Initial date irrelevantLabel8.Visible = FalseStartDate.Visible = False
End IfSimulation = Option3D2.Value
End Sub
Sub Queuel_Click (Value As Integer)' Checks if another queue mode has been specified' if so allows changeIf Queuel.Value = True Then
QueueFCFS = TrueElse
QueueFCFS = FalseEnd If
End Sub
Sub Queue2_Click (Value As Integer)' Checks if another queue mode has been specified' if so allows change' Changes values of COST toggle
APPENDIX A
An Approach to Traffic Management in a Navigational Channel 112
An Aproch o Trffi Maageent i aNavgatinalChanel113
If Queue2.Value = True ThenQueueCOST = True
ElseQueueCOST = False
End IfEnd Sub
Sub Queue3_Click (Value As Integer)' Checks if another queue mode has been specified'if so allows change' Changes values of FAST toggleIf Queue3.Value = True Then
QueueFAST = TrueElse
QueueFAST = FalseEnd If
End Sub
Sub Separl_Click (Value As Integer)'Accepts only min or max separationIf Separl.Value = True Then
MinSepar = TrueElse
MinSepar = FalseEnd If
End Sub
Sub Separ2_Click (Value As Integer)'Accepts only min or max separationIf Separ2.Value = True Then
MinSepar = FalseElse
MinSepar = TrueEnd If
End Sub
Sub Speed0_Click (Value As Integer)' Checks if another speed has been specified' if so allows changeIf Speed0.Value = True Then
SpeedOne = TrueIf SpeedMufti = False Then
Combol.Text = "No"Combol.Enabled = False
ElseCombol.Enabled = True
End IfElse
SpeedOne = False
APPENDIX A
An Approach to Traffic Management in a Navigational Channel 113
An Approachto Traflic Management ri a Navigational Channel 114
Combol.Enabled = TrueEnd If
End Sub
Sub Speedl_Click (Value As Integer)' Checks if another speed has been specified' if so allows changeIf Speedl.Value = True Then
SpeedMulti = TrueCombol.Enabled = True
ElseSpeedMulti = FalseIf SpeedOne = True Then
Combol.Text = "No"Combol.Enabled = False
ElseCombol.Enabled = True
End IfEnd If
End Sub
APPENDIX A
114An Approach to Traffic Management in a Navigational Channel
REPORT.FRM
Function CenterValue (Text$, Ys, LongSpace)x = Len(Text$)If Ys > x Then
x = YsEnd IfEspacio = Int((LongSpace - x) / 2)CenterValue = Space$(Espacio) + Text$ + Space$(LongSpace - x - Espacio)
End Function
Sub Form_Load 0Textl.FontBold = FalseTextl.Text = Templ
End Sub
APPENDIX A
An Approach to Traffic Management in a Navigational Channel 115
An Approach to Traffic Management ii a Navigational Channel 116
RUNPROCE.FRM
Sub Command3D1_Click 0EndEnd Sub
Sub Command3D2_Click 0Process
End Sub
Sub Labet6 _Click 0
End Sub
Sub cmdCancel_Click 0Unload frmRunProcess
End Sub
Sub cmdRun_Click 0Divisor = 0If QueueFCFS = True Then
Divisor = Divisor + 1End IfIf QueueCOST = True Then
Divisor = Divisor + 1End IfIf QueueFAST = True Then
Divisor = Divisor + 1End IfIf SpeedOne = True And SpeedMulti Then
Sub ClearBoxes 0' Erases text from boxesShipType.Text = " "ArrivalM.Text = " "
ArrivalD.Text = " "ArrivalY.Text =""
APPENDIX A
An Approach b Traft Management in a Navigational Channel 123
An Approach to Traffic Management ii a Navigational Channel 124
ArrivalH.Text = ""
ArrivalMi.Text = " "Priority.Value = 0
End Sub
Sub DisableCells 0'Changes StatusShipType.Enabled = Not ShipType.EnabledArrivalM.Enabled = Not ArdvalM.EnabledArrivalD.Enabled = Not ArrivalD.EnabledArdvalY.Enabled = Not ArrivalY.EnabledArrivalH.Enabled = Not ArdvalH.EnabledArrivalMi.Enabled = Not ArrivalMi.EnabledPriority.Enabled = Not Priority.Enabled
End Sub
Sub NextRec_Click 0' Adds One to Control and changes record' on screenControl = Control + IIf Control > TotalShip Then
Control = 1End IfChangeRecord (Control)
End Sub
Sub PreviousRec Click 0'Substracts One from Control and changes record' on screenControl = Control - IIf Control <= 0 Then
Control = TotalShipEnd IfChangeRecord (Control)
End Sub
Sub AddShip_Click 0'Show messageMessagel.Visible = TrueMessagel.Caption = "Changes will be effective after Exiting"' Toggles off unnecesary keysIf EditShip.Enabled = True Then
An Approach b Traffic Management in a Navigational Channel 124
ClearBoxes'Allows for changes in input boxesDisableCells
Else' Saves new vesselOpen "c:\vb\tesis\ship235.txt" For Append As #1Varl = Val(ShipType.Text)Call ChangeDateBack(Val(ArrivalD.Text), Val(ArdvalM.Text), Val(ArrivalY.Text)
Val(ArrivalH.Text), Val(ArrivalMi.Text), FinalDate)Var2 = FinalDateVar3 = Priority.ValuePrint #1, Varl, Var2, Var3Close #1'Adds new vessel to count and arrayTotalShip = TotalShip + 1Ship(TotalShip).AOrder =TotalShipShip(TotalShip).SType = VarlShip(TotalShip).Arrival = Var2Ship(TotalShip).Priority = Var3'Clears boxes and waits for new oneShipArrival.Text = TotalShip + 1ClearBoxes
End IfEnd Sub
Sub CancelShip_Click 0If Printer.Enabled = True Then
' Cancel Key for Ship Menu'Marks record for deletion in DBFor i = I To TotalShip
If MarkForDeletion(i) = True ThenShip(i).Arrival = 0
End IfNext i' Orders data base as FCFS,' erases marked records and savesOrderFCFS'Goes back to main menuUnload frmUserShpData
ElseIf EditShip.Caption = "Save" Then
'Editing menu' Goes back to Ship Menu' Changes captionEditShip.Caption = "Edit"'Enable Add and Delete keysAddShip.Enabled = TruePrinter.Enabled = TrueDelShip.Enabled = True
APPENDIX A
An Approach b Trafti Managlement in a Naviglational Channel521
An Approach to Traffic Management ui a Navigational Channel 126
' Disables cells for editingIf ArrivalD.Enabled = True Then
DisableCellsEnd If
End IfIf EditShip.Enabled = False Then
'On some other menuIf AddShip.Enabled = True Then
'Add ship menu' Goes back to Ship Menu' Shows first record in DBChangeRecord (1)' Enables (or disables) necesary keysDisableCellsEditShip.Enabled = TruePrinter.Enabled = TrueDelShip.Enabled = True
Sub DelShip_Click 0If EditShip.Enabled = True Then
'On main menu, disable' unnecesary keysAddShip.Enabled = FalseEditShip.Enabled = FalsePrinter.Enabled = False' Disable Cells for editionIf ArrivalD.Enabled = True Then
DisableCellsEnd If
ElseIf ShipArrival.BackColor <> Color2 Then
' Out of main menu,' mark current ship for deletion'if not already markedShipArrival.BackColor = Color2ShipType.BackColor = Color2ArrivalM.BackColor = Color2ArrivalD.BackColor = Color2ArrivalY.BackColor = Color2
APPENDIX A
An Approach to Traffic Management in a Navigational Channel 126
Sub EditShip_Click 0'Show message'Show messageMessagel .Visible = TrueMessagel .Caption = "Changes will be effective after Exiting"If EditShip.Caption = "Edit" Then
128An Approach to Traffic Management in a Navigational Channel
AmI9
Sub ShipDWT_GotFocus 0' Extend highlight over entire text' entry when user selects input boxShipDWT.SelStart = 0ShipDWT.SelLength = Len(ShipDWT.Text)
End Sub
Sub ShipDWT_LostFocus 0'Read new Ship DWTDim NewShipDWTNewShipDWT = Val(ShipDWT.Text)ShipDWT.Text = NewShipDWTCr$ = Chr$(13) + Chr$(10)Textol$ = "A ship's dead weight can not be less than zero."Texto2$ = "DWT rarely exceeds 500,000 tons." + Cr$Texto2$ = Texto2$ + " Is the entry correct?"Texto3$ = "About Ship Tonnage"OkDWT = ValidateEntry(NewShipDWT, 0, 500000, Textol$,If OkDWT = True Then
ShipDWT = NewShipDWTEnd If
End Sub
Texto2$, Texto3$)
Sub ShipLength_GotFocus 0'Extend highlight over entire text'entry when user selects input boxShipLength.SelStart = 0ShipLength.SelLength = Len(ShipLength.Text)
End Sub
Sub ShipLengthLostFocus 0'Read new Ship LengthDim NewShipLengthNewShipLength = Val(ShipLength.Text)ShipLength.Text = NewShipLengthCr$ = Chr$(13) + Chr$(10)Textol$ = "A ship's length can not be less than zero."Texto2$ = "A ship's length rarely exceeds 250 m." + Cr$Texto2$ = Texto2$ + " Is the entry correct?"Texto3$ = "About Ship Dimensions"OkLength = ValidateEntry(NewShipLength, 0, 250, Textol$, Texto2$, Texto3$)If OkLength = True Then
ShipLength = NewShipLengthEnd If
End Sub
Sub ShipSpeed_GotFocus 0' Extend highlight over entire text' entry when user selects input box
APPENDIX A
An Approach to Tmaffi Management in a Navigational Channel 129I
Sub ShipSpeed_LostFocus 0'Read new Ship SpeedDim NewShipSpeedNewShipSpeed = Val(ShipSpeed.Text)ShipSpeed.Text = NewShipSpeedCr$ = Chr$(13) + Chr$(10)Textol$ = "A ship's speed can not be less than zero."Texto2$ = "A ship's speed rarely exceeds 15 knots." + Cr$Texto2$ = Texto2$ + " Is the entry correct?"Texto3$ = "About Ship Speed"OkSpeed = ValidateEntry(NewShipSpeed, 0, 15, Textol$, Texto2$, Texto3$)If OkSpeed = True Then
ShipSpeed = NewShipSpeedEnd If
End Sub
Sub ShipType_Change 0' Checks number input and acts accordinglyIf Val(ShipType.Text) = 1 Or Val(ShipType.Text) = 2 Or Val(ShipType.Text) = 3 Then
Sub ShipWCost_LostFocus 0'Read new Ship WCostDim NewShipWCostNewShipWCost = Val(ShipWCost.Text)ShipWCost.Text = NewShipWCostCr$ = Chr$(13) + Chr$(10)Textol$ = "A ship's waiting cost can not be less than zero."Texto2$ = "Waiting cost rarely exceeds $100/hour." + Cr$Texto2$ = Texto2$ + " Is the entry correct?"Texto3$ = "About Waiting Cost"OkWCost = ValidateEntry(NewShipWCost, 0, 100, Textol$, Texto2$, Texto3$)If OkWCost = True Then
ShipWCost = NewShipWCostEnd If
End Sub
Sub spiArrivalSpinDown 0Control = Control - 1If Control <= 0 Then
Control = TotalShipEnd IfChangeRecord (Control)
APPENDIX A
An Approach to Traffi Management in a Navigational Channel 131
An Approach to Traffic Management 11 a Navgational Channel 132
End Sub
Sub spiArrival_SpinUp 0' Adds One to Control and changes record' on screenControl = Control + 1If Control > TotalShip Then
Control = 1End IfChangeRecord (Control)
End Sub
APPENDIX A
An Approach to Traffic Management in a Navigational Channel 132
An Aproch o Taffc Maageentii Naigatona Chnne 13
MODBAS.BAS
Type ShipDataBaseSType As IntegerAOrder As IntegerArrival As DoublePriority As Integer
End Type
Type ShipTypeSpeed As SingleDWT As SingleLength As SingleWCost As Single
End Type
Type ShipServiceStime As DoubleDist As SingleSpeed As Single
End Type
Const NShip = 10000
' Basic Statistical DataGlobal ShipTypes
'Global SimulationGlobal Ship(NShip) As ShipDataBaseGlobal ShipT(NShip) As ShipDataBaseGlobal SType(5) As ShipTypeGlobal NType(3) As IntegerGlobal Service As DoubleGlobal Pool As DoubleGlobal WaitCost As DoubleGlobal Servicelnd(3) As DoubleGlobal Poollnd(3) As DoubleGlobal WaitingC(3) As DoubleGlobal ServiceTime(NShip) As DoubleGlobal PoolTime(NShip) As Double
Global TotalDWT As DoubleGlobal DWTInd(3) As Double
Global MarkForDeletion(1000) As DoubleGlobal Bt(2, 3) As ShipServiceGlobal ChannelTimeOne(3), ChanneTimeMulti(3)Global ExpectedServiceMulti, ExpectedServiceOne
APPENDIX A
An Approach to Traffi Management in a Navigational Channel 133
An Approach to Traffic Management ki a Navigational Channel 134
Sub ChangeShipTemp 0' Substitutes array for processing with current array
APPENDIX A
An Approach to Trafti Management in a Navigational Channel 134
An Aproch t TrfficMangemnt ma Nvigaionl Chnne 1I
For i = 1 To TotalShipShipT(i).SType = Ship(i).STypeShipT(i).Arrival = Ship(i).ArrivalShipT(i).Priority = Ship(i).PriorityShipT(i).AOrder = Ship(i).AOrder
Next iEnd Sub
Function DateConversion (Dateinput)' Changes date in regular format to days' base date: january 1, 1992ReDim MonthDays(12)MonthDays(1) = 31MonthDays(2) = 28MonthDays(3) = 31MonthDays(4) = 30MonthDays(5) = 31MonthDays(6) = 30MonthDays(7) = 31MonthDays(8) = 31MonthDays(9) = 30MonthDays(10) = 31MonthDays(11) = 30MonthDays(12) = 31MonthDate = Val(Left$(Datelnput, 2))DayDate = Val(Mid$(Datelnput, 3, 2))YearDate = Val(Right$(Datelnput, 2))Days = 0Extra = 0If YearDate > 92 Then
Sub GenerateArrival 0' SimDay in days'ArrivalRate in minutesRandomize 1' Changes date format'BaseDate = DateConversion(IniDate)' Checks if previous file exists' Checks if Generated ship data base exitsXfile = Dir$("'C:\simmod\ShipGen.txt')If UCase(X) <> UCase("ShipGen.txt") Then
' File does no exist' Generates newFileCopy "c:\simmod\blank.txt", "c:\simmod\ShipGen.txt"
End If' Opens file to include dataOpen "c:\simmod\ShipGen.TXT" For Output As #1' Determines number of ships to generateTotalShip = Int(SimDays * 24 / ArrivalRate)' Determines steps in progress barProgresStep = 3000 / TotalShipNStep = Int(TotalShip / 50)' Runs generation routinei=0L = Exp(-ArrivalRate)M=0XAcum = 0Do
X=0p=1ok = True' Finds arrival with Poisson DistributionDo
u = Rnd
APPENDIX A
An Appr~oach W Tfraffi Management in a Navigational Channel 137
p= p*uIf p > L Then
X=X+1Else
Exit DoEnd If
Loop While okXAcum = XAcum + X' Finds Ship with Uniform DistributionY = RndIf Y < Ship1 / 100 Then
Tship = 1Elself Y < (Ship1 + Ship2) / 100 Then
Tship = 2Else
Tship = 3End If' Prints data into filePrint #1, Tship, XAcum, 0M=M+1
Loop While M < TotalShipClose #1
End Sub
Sub GenShpArrival 0' Loads form for automatic generation' of arrivalsLoad frmGenShpDatafrmGenShpData.Show
End Sub
Sub LineIntersect (X1, Y1, M1, X2, Y2, M2, Xres, Yres)' Finds intersection point of two lines' X represents time, Y represents distance' M represents speedB1 = Y1 - M1 * X1B2 = Y2 - M2 * X2Xres = (B2 - B1) / (M1 - M2)Yres = (M1 * Xres + 81)
End Sub 'LineIntersect
Sub MultiSpeed (k, PoolM, SpeedMode)' Checks is minimun separation is conserved' otherwise assigns minimum separation time to' arrival time - Finds Pool timeCall SeparationMulti(ShipT(k).SType, ShipT(k - 1).SType, Bt(1, 0).Speed, Mintime,
MinDist)If SType(ShipT(k).SType).Speed > Bt(1, 0).Speed Then
' Next ship faster than current
APPENDIX A
An Approach to Traffic Management in a Navigational Channel 138
If Mintime + Bt(1, 0).Stime < ShipT(k).Arrival Then'Ship arrives after minimum time - no waitBt(2, 0).Stime = ShipT(k).ArdvalPoolM = 0
Else'Ship arrives before minimum time - waitBt(2, 0).Stime = Mintime + Bt(1, 0).StimePoolM = Bt(2, 0).Stime - ShipT(k).Arrival
End IfElse
' Next ship slower than currentTtemp = SType(ShipT(k).SType).Speed / (Bt(1, 1).Dist - MinDist)If Bt(1, 1).Stime - Ttemp < ShipT(k).Arrival Then
'Minimum distance ok to enter - no waitBt(2, 0).Stime = ShipT(k).ArdvalPoolM = 0
Else' Minimum distance not ok - waitBt(2, 0).Stime = Bt(1, 1).Stime - TtempPoolM = Bt(2, 0).Stime - ShipT(k).Arrival
End IfEnd If
End Sub' ProcessMulti
Sub OneSpeed (k, PoolO)'Checks is minimun separation is conserved'otherwise assigns minimum separation time to' arrival timeCall SeparationOne(ShipT(k).SType, ShipT(k - 1).SType, Bt(1, 0).Speed, Mintime, M
inDist)' remIf Mintime + Bt(1, 0).Stime < ShipT(k).Arrival Then
' Mininum distance ok to enter - no waitTtemp = ShipT(k).ArrivalPoolO = 0
Else' Minimum distance not ok - waitTtemp = Mintime + Bt(1, 0).StimePoolO = Bt(1, 0).Stime + Mintime - ShipT(k).Arrival
End IfEnd Sub
Sub OpenBasicData 0On Error GoTo ErrorTrap' Opens data base with channel data + reads it'True=-1; False=0Handler = 1Open "c:\simmod\Basic.dat" For Input As #1Input #1, Simulation, SendtoScreen, SendToPrinter, SendtoFile
APPENDIX A
An Approach to Traffi Management in a Navigational Channel 139
An Approach to Traffic Management ii a Navigational Channel 140
Next i' Inputs simulation data' used only if user specifiesInput #1, Varl, Var2, Var3Input #1, Var4Ship1 = Val(Varl)Ship2 = Val(Var2)Ship3 = Val(Var3)ArrivalRate = Val(Var4)Input #1, Varl, Var2ConvoyOpt = VarlSelectChoice = Var2Close #1' Sets begining of simulation to current dateIniDate = Date
GoTo Jump2
APPENDIX A
An Approach tc) Traffic Management in a Navigational Channel 140
ErrorTrap:Trampa = ErrIf Trampa = 62 Then
msg = "The current Basic Data file is corrupted or missing."msg = msg & " Press Ok to correct this problem or Cancel for no corrections.
Answer = MsgBox(msg, 49, "File Error")If Answer = 1 Then
' Sets begining of simulation to current dateIniDate = Date
End If
Jump2:End Sub
Sub OpenShipDb 0' Opens file containing ship data base' and determines number of ships'The file to use depends on user's specsIf Simulation = True Then
Open "C:\simmod\Ship235.txt" For Input As #1Else
Open "C:\simmod\ShipGen.TXT" For Input As #1End Ifi= 1NType(1) = 0NType(2) = 0NType(3) = 0Do While Not EOF(1)
Input #1, Ship(i).STypeInput #1, Ship(i).ArrivalInput #1, Ship(i).PriorityShip(i).AOrder = iSelect Case Ship(i).STypeCase Is = 1
NType(1) = NType(1) + 1Case Is = 2
NType(2) = NType(2) + 1Case Is = 3
NType(3) = NType(3) + 1End Selecti=i+
LoopTotalShip = i - 1Close #1
APPENDIX A
An Approach to Traffic Management in a Navigational Channel 142
Call ChangeShipTempEnd Sub
Sub OrderFCFS 0' Orders db based on arriving dateDim Tempo As ShipDataBaseReDim MatrixP(TotalShip + 1, 5) As VariantFor i = 1 To TotalShip
Sub PrincipalMenu 0'Returns user to main menuLoad PrincipMenuPrincipMenu.Show
End Sub
Sub Process 0' Call all dataOpenBasicDataOpenShipDb'Changes Mouse pointer to hourglassPrincipMenu.MousePointer = 11' Determines service time for one and' multi speed modesExpectedServiceOne = ExpectedService(0)ExpectedServiceMulti = ExpectedService(1)' If printer control is on prints headlineIf SendToPrinter Then
Printer.FontBold = TruePrinter.FontSize = 9.75Printer.Print "TRAFFIC CONTROL MODEL"Printer.PrintIf Simulation Then
An Approach to Traffic Management in a Navigational Channel 147
An Approach to Traffic Management ii a Navigational Channel 148
End IfFor Im = Ik + 1 To Im2
If Bt(1, 0).Stime + Maxtime < ShipT(lm).Arrival ThenImFinal = Im - 1Im = Im2
End IfIf Ship(Im).SType = ControlType Then
ok = TrueElse
ok = FalseEnd If
Next ImIf ok = True Then
Exit DoElse
ControlType = ControlType - 1If ControlType <= 0 Then Exit Do
End IfLoop While ok = FalseServiceTime(Ik) = Mintime' Organizes vessels in pool according to user's criteria' but only if vessel in ready spot has no priorityOkChanges = 0If ShipT(lk).Priority <> 1 Then
' Finds if any ship in pool has priorityFor Im = Ik + 1 To ImFinal
End IfNext Im' If no ship in pool has priority, organizes' acording to convoy length.' If convoy lenght maximum or no vessels' available then selects by queue criteriaIf OkChanges <> 1 Then
ChangeinConvoy = 0If ConvoyBase < ConvoyLength Then
' Finds if any ship in pool can complete convoyFor Im = Ik + 1 To ImFinal
An Approach Wn Traffic Management in a Navigational Channel 148
If ConvoyBase = ConvoyLength And ChangelnConvoy <> 1 Then' No vessels to add to convoy has been found or' convoy is already full.* Next vessel assigned according to queueing criteriaSelect Case QueueCase Is = 2 'FAST
If SType(ShipT(lk).SType).Speed <> MaxSpeed ThenFor Im = Ik + 1 To ImFinal
Select Case SType(ShipT(lk).SType).SpeedCase Is = MaxSpeed
Call ChangeOrder(Im, Ik)Im = ImFinal
Case Is < SType(ShipT(Im).SType).SpeedCall ChangeOrder(Im, Ik)
End SelectNext Im
End IfCase Is = 3 'COST
If SType(ShipT(Ik).SType).WCost <> MaxCost ThenFor Im = Ik + I To ImFinal
Select Case SType(ShipT(Ik).SType).WCostCase Is = MaxCost
Call ChangeOrder(Im, Ik)Im = ImFinal
Case Is < SType(ShipT(Im).SType).WCostCall ChangeOrder(Im, Ik)
End SelectNext Im
End IfEnd SelectConvoyBase = 1
End If New convoyEnd if'No other ships has priority
End If' Ship in ready spot has no priority'Finds pool timeSelect Case SpeedModeCase Is = 1
If Bt(1, 0).Stime + Maxtime < ShipT(Im).Arrival ThenImFinal = Im - 1Im = Im2
End IfIf Ship(Im).SType = ControlType Then
ok = TrueElse
ok = FalseEnd If
Next ImIf ok = True Then
Exit DoElse
ControlType = ControlType - 1If ControlType <= 0 Then Exit Do
End IfLoop While ok = False
End SelectServiceTime(lk) = Mintime' Organizes vessels in pool according to user's criteria' but only if vessel in ready spot has no priorityOkChanges = 0If ShipT(lk).Priority <> 1 Then
' Finds if any ship in pool has priorityFor Im = Ik + 1 To ImFinal
Sub SeparationMulti (M, N, ControlSpeed, SeparationTime, SeparationDistance)
APPENDIX A
' Calculates separation distance and time'Separation Time as defined in thesis' m=Current ship type, n=preceding ship type'Control speed is set by previous shipIf MinSepar Then
Sub SeparationOne (M, N, ControlSpeed, SeparationTime, SeparationDistance)' Calculates separation distance and time' Separation Time as defined in thesis' m=Current ship, n=preceding ship'Control speed is set by previous shipIf MinSepar Then
Sub SetUpSimulation 0Load frmProcessDatafrmProcessData.Show
End Sub
Sub ShowResults (Queue, SpeedMode, ConvoyLength)' Calculates final statsCall FinalResult' Print headings and basic infoSelect Case QueueCase Is = 1 'FCFS
PrintQueue = "FCFS"Case Is = 2 'FAST
PrintQueue = "FAST"Case Is = 3 'COST
PrintQueue = "COST"End Select
APPENDIX A
An Approach to Traffic Management in a Navigational Channel 155
156An Approach to0 Traffic Management in a Navigational Channel
Select Case SpeedModeCase Is = 0
PrintSpeed = "One-SpeedCase Is = 1
PrintSpeed = "Multi-Speed "End Select' Select unitsIf Service > 10 Then' Prints results in hoursTFactor = 1RUnit = " [hour]
Else' Prints results in minutesTFactor = 60RUnit = " [min]
Sub Prueba 0Printer.Print "Prueba de Impresora"Printer.EndDocEnd Sub
APPENDIX A
An Approach lb Traffic Management in a Navigatibnal Channel 160
APPENDIX B
USER'S MANUAL
In the following pages, a brief description of the operations optimization model ismade. The figures are taken directly from the program. Since the program iswritten with a Windows interface, it can only be run from that operating system.On the other hand, this allows all command functions as are available under thatsystem.
.... .. ...
Eile View Edit flasic Data Erocess
Figure 1
The first figure (Figure No.1) shows the opening screen. The user can access theoptions through the menu on top or through the buttons on the screen. Thecorner options allow to close the application, change to another while running orto minimize the screen size as in any Windows application.
The FILE command on the top menu allows access to filing and printing functions
Elle ycew Edit Basic Data Erocessi:•!•!.!•!!!!!•r!•!•!!••!•!• ........... ......!•!••!. .......!..........!!.!!! ..............!!!!!•!•.;......!!!!................ !!!!!!!!!!.. !!!!.......!!!!!.......................................•!!!!!!!!!!•!!!!!
Figure 2
and to exit the program. The VIEW command shows the basic channel and shipcharacteristics as defined by the default (See figure No. 2). Once the user haschanged information, the program will maintain that as default.
The EDIT command will access routines to change the channel or vessel set upincluded as basic data (and shown in the VIEW command). The BASIC DATAcommand allows access to ship arrival data bases, either user generated orgenerated by the model. On the first case, (user generated data) the user willhave entered a subroutine that allows changes in that data base (Figure 4). Onthe second case, the user will enter a routine that allows for the generation ofarrival with a Poisson distribution (Figure 3).
Finally, PROCESS enters the basic processing routine. In this module, the userspecifies the combination of factors he wishes to modellsimulate and runs it.
An Appr~oach ID Trafti Management in a Navigational Channel 162
An Approach to Traffic Management ki a Navigational Channel 163
Figure 3
As mentioned before, the user can either use the main menu or access routinethrough the buttons located to the left of the screen. The first button (from top tobottom) is the BASIC DATA button. Selecting this option, brings up the "BasicData" menu (Figure 4). In this menu, the user sees the channel basic data andthe different vessels characteristics. He can then proceed to edit them by pressingthe EDIT button. This action will bring up a screen as the one shown in figure 5.
a........i** "ii.~~i':iii~i~E~ii 9~iiii P~i~i~~:.:.. 00:~.............. · ·.r. i·.~··· 5·;··;i~i~i~ii~~~~i t e e iil
.... ...
Figure 4
The EDIT button in the "Basic Data" menu (Figure 4) allows access to the channeland basic vessel types characteristics. The user can either print the data (PRINTkey), save changes (SAVE key) or go back to the main menu (by pressingCANCEL). As for all menus, this screen can be enabledldisabled or minimized bypressing the corner controls. The channel length, the number of lanes, and thecycle time (the number of hours the traffic is inbound or outbound) aredefined/modified in this screen. The vessel basic characteristics are also defined.The user must specify three vessel types and their tonnage, speed in the channel,length and waiting cost. The input data will serve as default as soon as the userpresses the SAVE button.
Another key control in the main menu, the SETUP key, will change the parametersfor the simulation. Pressing this buttom button bring up a screen as the oneshown in figure 5.
This screen is the "Process Set-Up" menu. The user defines the parameters forthe simulationn or modeling. The user models when he has an arrival data basegenerated by the program (in the screen shown on figure 4). Otherwise, the usercan simulate with a ship arrival data base (as shown in figure 3).
The specifications for speed mode, separation distance, queue priority and use ofconvoys are all set up in this screen. The user just places the cursor on top of the
APPENDIX B
An Approadi to Traffc Management in a Navigational Channel 164
I
I
ctl165
file Yiew Edit Basic Data Erocess
Figure
5
option and changes the toggle on/off for most options
The "Time Horizon" option allows the user to definethe time period starting on the current date for whichthe simulation/model is run.The OUTPUT button changes the way the results areprinted. They final tables can be either sent to thescreen, to a printer or to a file. The way the optionsare presented is shown in figure 6.
The user can also request a criteria for the model tochoose a "best" solution or combination of factors. Bypressing the SELECT CRITERIA button the user hasaccess to the screen shown in figure 7.
Figume 6Once the user has indicated the variables he wishes
to model, he can save them pressing the SAVE SET-UP key. The model will not
" M ......;·--;;. ··.......................................·.·.ijiiS ·::·:;~·:·.. ....... ...... .·:: ·............':'N::'i:" :::............:::I~ ::i:::i:;::......... ... .... .......::·:: · i ii~ii~i I· ···ii
Figure 7
recognize any changes unless the user presses the previous
The user is now ready to run a simulation/model. In order to do this, he mustpress the RUN PROCESS key on the main menu (Figure 1). This action will callup a screen similar to the one shown in Figure 8. The "Run Process" screenshows in short the options that will be considered when running. The lower partof the screen contains a bar to control the time it will take the model to come upwith results. This will obviously be a function of the simulation time or number ofvessels. Once the bar reaches 100%, the program will display the results in thescreen (Figure 9) if the user has requested that option when on "Process Set-Up"menu. Otherwise, the program will send the output to the device requested.
Finally, in the main menu, the EXIT key will end the program.
APPENDIX B
An Approach to Traft Managemnent in a Navigational Channel 166
An Appmach ~ Traffic Management m a Navigational Channel 167
i; ! R M - a 11
file Yiew LdIt flasic Data &ocess:·:·:;·:; ;:I:·;·:·:·:: · :: :·1: ;.................. I ........ 'i''i~i
............................................................. .............. ........................... ft ......................................................
F leet M ix: 3 33................................................................ ........ ................ ........ .......................
F le e t M i : 8 11......................................... ................... ... ............ ............................................................................................................. .............. ........................... ........ .................. ...........