27
BTS GROUP HOLDINGS PCL FY 2018/19 EARNINGS PRESENTATION SET OPPORTUNITY DAY 6 JUN 2019

BTS GROUP HOLDINGS PCL
FY 2018/19 EARNINGS PRESENTATION
SET OPPORTUNITY DAY 6 JUN 2019

prepared by Investor Relations departmentBTS Group Holdings PCL
Disclaimer
Investment involves risk. Prospective should understand the characteristics of Securities and study information about BTS Group Holdings Public Company Limited (the “Company”)before making a decision to invest in Securities. This presentation is for information purposes only and is intended only for the initial direct attendee of the presentation. It may not bereproduced or redistributed to any other person. It shall not and does not constitute either an offer to purchase or buy or a solicitation to purchase or buy or an offer to sell or exchangeor a solicitation to sell or exchange any securities of BTS Group Holdings PCL (the "Company") or any of its subsidiaries in the United States of America or in any other jurisdiction or aninducement to enter into investment activity. No part of this presentation, nor the fact of its existence, should form the basis of, or be relied on in connection with, any contract orcommitment or investment decision whatsoever. No representation, warranty or undertaking, express or implied, is made as to, and no reliance should be placed on, the fairness,accuracy, completeness or correctness of the information or the opinions contained herein.
This presentation is not to be relied upon in any manner as legal, tax or any other advice and shall not be used in substitution for the exercise of independent judgment and each personmade aware of the information set-forth hereof shall be responsible for conducting its own investigation and analysis of the information contained herein. Except where otherwiseindicated, the information provided in this presentation is based on matters as they exist as of the date stated or, if no date is stated, as of the date of preparation and not as of anyfuture date, and the information and opinions contained herein are subject to change without notice. None of the Company nor any of its subsidiaries accepts any obligation to updateor otherwise revise any such information to reflect information that subsequently becomes available or circumstances existing or changes occurring after the date hereof. None of theCompany or any of its subsidiaries or any of their respective directors, officers, employees or agents shall have any liability whatsoever (in negligence or otherwise) for any losshowsoever arising from any use of this presentation or its contents or otherwise arising in connection with the presentation and any and all such liability is expressly disclaimed.
The information contained herein must be kept strictly confidential and may not be reproduced or redistributed in any format without the express written approval of the Company.Some statements made in this presentation are forward-looking statements, which are subject to various risks and uncertainties. These include statements with respect to theCompany’s corporate plans, strategies and beliefs and other statement that are not historical facts. These statement can be identified by the use of forward-looking terminology such as“may”, “will”, “expect” , “intend”, “estimate”, “continue”, “plan” or other similar words. The statements are based on the assumptions and beliefs of the Company’s management inlight of the information currently available to the Company. These assumptions involve risks and uncertainties which may cause the actual results, performance or achievements to bematerially different from any future results, performance or achievements expressed or implied by such forward-looking statements. Nothing in this Presentation is, or should be reliedon as promise or representation of the Company as to the future.
BTS Group Earnings Presentation2

prepared by Investor Relations departmentBTS Group Holdings PCL
Agenda
BTS Group Earnings Presentation3
FY 2018/19 FINANCIAL PERFORMANCESECTION 1
BUSINESS UPDATESSECTION 2
APPENDICESSECTION 3
prepared by Investor Relations departmentBTS Group Holdings PCL
FY 2018/19 Highlights
4BTS Group Earnings PresentationSection 1: FY 2018/19 Financial Performance
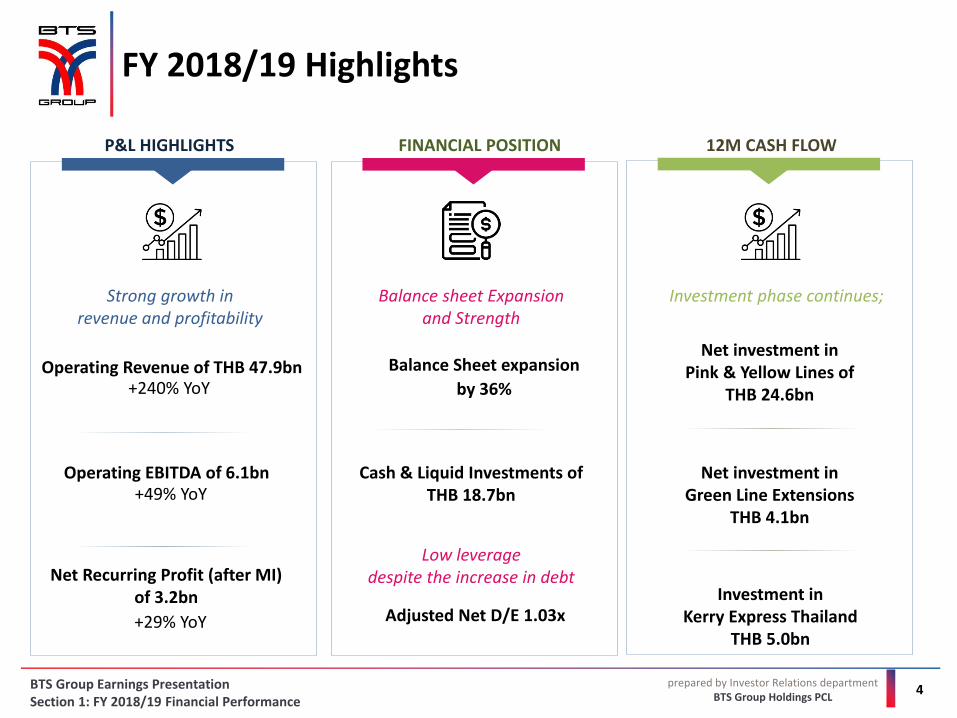
Strong growth in revenue and profitability
Operating Revenue of THB 47.9bn
+29% YoY
Net Recurring Profit (after MI) of 3.2bn
FINANCIAL POSITION
Balance sheet Expansion and Strength
Cash & Liquid Investments ofTHB 18.7bn
Adjusted Net D/E 1.03x
Low leverage despite the increase in debt
Investment phase continues;
Net investment in Pink & Yellow Lines of
THB 24.6bn
Net investment in Green Line Extensions
THB 4.1bn
Investment in Kerry Express Thailand
THB 5.0bn
P&L HIGHLIGHTS 12M CASH FLOW
+240% YoY
+49% YoYOperating EBITDA of 6.1bn
Balance Sheet expansion
by 36%
prepared by Investor Relations departmentBTS Group Holdings PCL
FY 18/19 Key Milestones
5BTS Group Earnings PresentationSection 1: FY 2018/19 Financial Performance
2018
BTS
GR
OU
PM
ASS
TR
AN
SIT
PR
OP
ERTY
JUN – JUL
MED
IA
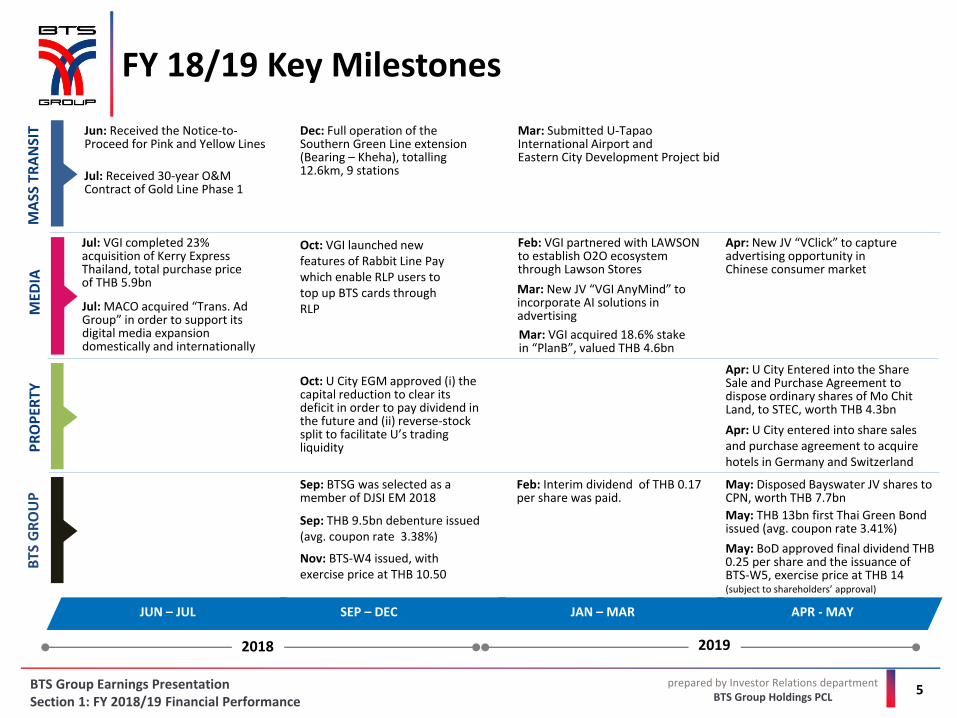
Jun: Received the Notice-to-Proceed for Pink and Yellow Lines
Jul: Received 30-year O&M Contract of Gold Line Phase 1
Jul: MACO acquired “Trans. Ad Group” in order to support its digital media expansion domestically and internationally
SEP – DEC
Oct: U City EGM approved (i) the capital reduction to clear its deficit in order to pay dividend in the future and (ii) reverse-stock split to facilitate U’s trading liquidity
JAN – MAR
Feb: Interim dividend of THB 0.17 per share was paid.
Feb: VGI partnered with LAWSON to establish O2O ecosystem through Lawson Stores
Mar: Submitted U-TapaoInternational Airport and Eastern City Development Project bid
Sep: BTSG was selected as a member of DJSI EM 2018
Mar: VGI acquired 18.6% stake in “PlanB”, valued THB 4.6bn
APR - MAY
Apr: U City Entered into the Share Sale and Purchase Agreement to dispose ordinary shares of Mo Chit Land, to STEC, worth THB 4.3bn
May: BoD approved final dividend THB 0.25 per share and the issuance of BTS-W5, exercise price at THB 14 (subject to shareholders’ approval)
May: Disposed Bayswater JV shares to CPN, worth THB 7.7bn
Dec: Full operation of the Southern Green Line extension (Bearing – Kheha), totalling12.6km, 9 stations
Mar: New JV “VGI AnyMind” to incorporate AI solutions in advertising
Apr: New JV “VClick” to capture advertising opportunity in Chinese consumer market
May: THB 13bn first Thai Green Bond issued (avg. coupon rate 3.41%)
Jul: VGI completed 23% acquisition of Kerry Express Thailand, total purchase price of THB 5.9bn
2019
Oct: VGI launched new features of Rabbit Line Pay which enable RLP users to top up BTS cards through RLP
Nov: BTS-W4 issued, with exercise price at THB 10.50
Sep: THB 9.5bn debenture issued (avg. coupon rate 3.38%)
Apr: U City entered into share sales and purchase agreement to acquire hotels in Germany and Switzerland

prepared by Investor Relations departmentBTS Group Holdings PCL
OPERATING REVENUE COMPARISON (YoY)
INCOME STATEMENT (THB mn) FY 2018/19 FY 2017/18 % YoY
Operating Revenue1 47,923 14,102 240%
Gross operating profit 7,869 5,778 36%
Operating EBITDA2 6,106 4,089 49%
Recurring net profit – after MI 3,248 2,508 29%
Accounting EBITDA 6,876 7,571 (9)%
Net income (loss)3 2,873 4,416 (35)%
Gross operating profit margin (%) 16.4% 41.0%
Accounting EBITDA margin (%) 13.9% 42.3%
Recurring net profit margin – after MI(%) 6.6% 16.0%
Operating EBITDA margin (%) 12.7% 29.0%
P&L SNAPSHOT
FY 2018/19 OPERATING REVENUE BREAKDOWN
1 operating revenue of 4 BUs & share of net profit from BTSGIF 2 excluding non-mass transit interest income 3 to equity holders of the parent
6
FY 2018/19 Overview
86%
Mass Transit 11%
Media
1%
Property
2%
Services
BTS Group Earnings PresentationSection 1: FY 2018/19 Financial Performance
14,102
47,923
32,216 1,221 (279) 663
FY17/18 Mass Transit Media Property Services FY18/19
(44)% 148%31%354%
(THB mn)

prepared by Investor Relations departmentBTS Group Holdings PCL
Share in BTSGIF
2%
O&M
Construction revenue for Pink and Yellow Lines
74%
Mass Transit relatedInterest income
3%
HISTORICAL OPERATING REVENUE (THB mn) KEY FACTORS▪ The YoY revenue growth of 32.2bn or 354% was mainly from
• Construction revenue for the Pink and Yellow lines of THB 30.7bn• Interest income related to Mass Transit rose by 114% or THB 576mn
to THB 1,078mn• O&M revenue increased by 29% or THB 515mn to THB 2,277mn,
chiefly as a result of the full opening of Southern Green Line ext. in Dec 18 and the contractually agreed increase in the operating fee of the existing ext.
▪ Cost rose by THB 30.6bn to THB 36.9bn largely from the recognition of construction cost for the Pink and Yellow Lines
▪ Operating EBITDA margin was 10.9% (31.5% in FY 2017/18)
OPERATING PERFORMANCE
MASS TRANSIT (THB mn)
FY2018/19
FY2017/18
%YoY
Revenue 41,328 9,112 354%
Costs of revenue 36,868 6,274 488%
Gross profit 4,460 2,837 57%
Operating EBITDA 4,498 2,872 57%
Gross margin (%) 10.8% 31.1%
Operating EBITDA margin (%)
10.9% 31.5%
OPERATING REVENUE BREAKDOWN
FY 2018/19
7
Mass Transit
Services revenue from provision of E&M works & train procurement for Green Line ext.
15%
5%
BTS Group Earnings PresentationSection 1: FY 2018/19 Financial Performance
468 452 452 565 807 252 228 244 239 187 234 193 242 289 354
1,205 926
1,524 2,183
1,451
11,777
13,616
5,325
14
16
228
15
4Q 17/18 1Q 18/19 2Q 18/19 3Q 18/19 4Q 18/19
Others
Construction revenue for Pink and YellowLinesServices revenue from provision of E&Mworks & train procurement for Green Line ext.Mass Transit related interest income
Share of net profit in BTSGIF
O&M
* Comprised of (i) Services revenue from provision of E&M works for Gold Line and (ii) Farebox from BRT
Others*
1%
*

prepared by Investor Relations departmentBTS Group Holdings PCL
HISTORICAL OPERATING REVENUE (THB mn) KEY FACTORS
▪ All-time high revenue of THB 5,123mn, an increase of 31% YoY driven by organic growth in the OOH media segment and higher revenue from Digital Services segment• OOH Media revenue* rose by 8% YoY to THB 3,841mn largely from
encouraging growth in all business units• Digital Services Business rose sharply by 273% YoY to THB
1,282mn mainly due to the eight-month consolidation of Trans.AdGroup, higher revenue from Rabbit Group and the increase in average number of policies sold
▪ Costs increased by 56% YoY to THB 1,234mn primarily due to the eight-month consolidation of Trans.Ad Group
▪Operating EBITDA margin declined YoY to 45.5% (50.6% in FY 2017/18)
46%
BTS – Related Media
21%
Outdoor Media
MEDIA (THB mn)
FY2018/19
FY2017/18
%YoY
Operating revenue 5,123 3,902 31%
Costs of revenue 1,919 1,234 56%
Gross profit 3,204 2,668 20%
Operating EBITDA 2,332 1,976 18%
Gross margin (%) 65.5% 68.4%
Operating EBITDA margin (%) 45.5% 50.6%
FY 2018/19
OPERATING PERFORMANCE OPERATING REVENUE BREAKDOWN
8
Media
8%
Office Buildings
and Others
25%
Digital
*OOH Media includes Transit, Outdoor and Office Building and Other Media
BTS Group Earnings PresentationSection 1: FY 2018/19 Financial Performance
1,020 990 909 965 1,047
87 87296
495335
4Q 17/18 1Q 18/19 2Q 18/19 3Q 18/19 4Q 18/19
Digital Services Media OOH

prepared by Investor Relations departmentBTS Group Holdings PCL
Residential
4%
HISTORICAL OPERATING REVENUE (THB mn) KEY FACTORS▪Operating revenue was THB 360mn, mainly from commercial property
which decreased by 46% YoY, primarily attributable to the deconsolidation of the majority of BTS property business as a result of the EBT of UE to U City in 4Q 17/18
▪ Share of net loss from investment in U City, our associate, of THB 80mn (THB 505mn loss in FY 2017/18) as U City recognised lower loss on impairment of assets, improved operating performance of hotel business in Europe and the transfer progress of Sansiri-JVs
▪Operating costs dropped in tandem with the decline in operating revenue, reducing by 37% YoY or THB 153mn to THB 261mn.
OPERATING PERFORMANCE
PROPERTY (THB mn)
FY2018/19
FY2017/18
%YoY
Operating Revenue 360 639 (44)%
Costs of revenue 261 413 (37)%
Gross profit 99 226 (56)%
Operating EBITDA (22) (4) 460%
Gross margin (%) 27.6% 35.3%
Operating EBITDA margin (%)
(6.1)% (0.6)%
OPERATING REVENUE BREAKDOWN
FY 2018/19
NOTE: Property operating performances exclude share of profit/(loss) from investment in BTS-SIRI JVs, U City and Bayswater.
9
Property
96%
Commercial & Others
BTS Group Earnings PresentationSection 1: FY 2018/19 Financial Performance
16080 87 85
107
4Q 17/18 1Q 18/19 2Q 18/19 3Q 18/19 4Q 18/19
Operating revenue

prepared by Investor Relations departmentBTS Group Holdings PCL
46,364 52,150
36,971 50,370
22,923
41,794
31 Mar 18 31 Mar 19
Total shareholders' equity Total non-current liabilities Total current liabilities
144,315106,258
84,591
123,186
21,667
21,129
31 Mar 18 31 Mar 19
Total non-current assets Total current assets
144,315106,258
Cash
31 Mar 18: THB 9.5bn
31 Mar 19: THB 4.0bn
Current Investments
31 Mar 18: THB 5.7bn
31 Mar 19: THB 7.7bn
Long-Term Investments
31 Mar 18: THB 15.9bn
31 Mar 19: THB 14.6bn
80%
20%
15%
85%
29%
36%
35%
44%
21%
35%
FY 2018/19: 1.39xFY 2017/18: 1.02x
Gross Debt to Equity
FY 2018/19: 1.03xFY 2017/18: 0.37x
Adjusted NetDebt* to Equity
FY 2018/19: 7.43xFY 2017/18: 3.02x
Adjusted Net Debt* to Recurring EBITDA
FY 2018/19: 3.70xFY 2017/18: 3.31x
Interest Coverage
FY 2018/19: 0.51xFY 2017/18: 0.95x
Current Ratio
ASSETS BREAKDOWN LIABILITIES AND EQUITY BREAKDOWN
KEY RATIOS
10
Financial Position
*Adjusted Net Debt = Interest Bearing Debt – Cash and Cash Equivalent and Liquid Investment
(THB mn) (THB mn)
BTS Group Earnings PresentationSection 1: FY 2018/19 Financial Performance
Gross Debt
31 Mar 18: THB 47.2bn
31 Mar 19: THB 72.5bn
Adjusted Net Debt*
31 Mar 18: THB 17.1bn
31 Mar 19: THB 53.8bn
*****
Issued Ordinary Shares
31 Mar 18: 11,940.4mn
31 Mar 19: 11,845.4mn
prepared by Investor Relations departmentBTS Group Holdings PCL
Agenda
11BTS Group Earnings Presentation
FY 2018/19 FINANCIAL PERFORMANCESECTION 1
BUSINESS UPDATESSECTION 2
APPENDICESSECTION 3
prepared by Investor Relations departmentBTS Group Holdings PCL
Mass Transit UpdateFY 2018/19 Core Network Ridership
12
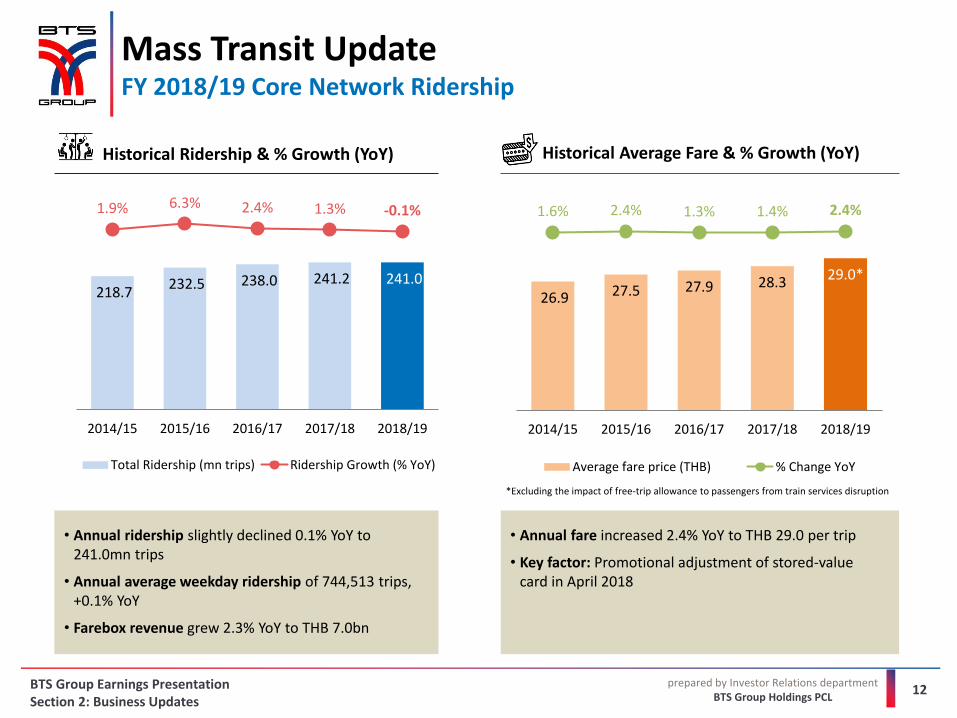
Historical Ridership & % Growth (YoY) Historical Average Fare & % Growth (YoY)
BTS Group Earnings PresentationSection 2: Business Updates
*Excluding the impact of free-trip allowance to passengers from train services disruption
218.7 232.5 238.0 241.2 241.0
1.9% 6.3% 2.4% 1.3% -0.1%
-150.0%
-140.0%
-130.0%
-120.0%
-110.0%
-100.0%
-90.0%
-80.0%
-70.0%
-60.0%
-50.0%
-40.0%
-30.0%
-20.0%
-10.0%
0.0%
10.0%
20.0%
30.0%
-
50.0
100.0
150.0
200.0
250.0
300.0
350.0
2014/15 2015/16 2016/17 2017/18 2018/19
Total Ridership (mn trips) Ridership Growth (% YoY)
26.9 27.5 27.9 28.3 29.0*
1.6% 2.4% 1.3% 1.4% 2.4%
-150.0%
-140.0%
-130.0%
-120.0%
-110.0%
-100.0%
-90.0%
-80.0%
-70.0%
-60.0%
-50.0%
-40.0%
-30.0%
-20.0%
-10.0%
0.0%
10.0%
20.0%
30.0%
15.0
17.0
19.0
21.0
23.0
25.0
27.0
29.0
31.0
33.0
35.0
2014/15 2015/16 2016/17 2017/18 2018/19
Average fare price (THB) % Change YoY
• Annual ridership slightly declined 0.1% YoY to 241.0mn trips
• Annual average weekday ridership of 744,513 trips, +0.1% YoY
• Farebox revenue grew 2.3% YoY to THB 7.0bn
• Annual fare increased 2.4% YoY to THB 29.0 per trip
• Key factor: Promotional adjustment of stored-value card in April 2018

prepared by Investor Relations departmentBTS Group Holdings PCL
Mass Transit UpdateProgress of BTS Secured Lines
13
Included in Masterplan17 Oct 18
Included in Masterplan17 Oct 18
NTP issued
29 Jun 18
NTP issued
29 Jun 18
*Sources: Information was from MRTA and the Company’s report as of 30 April 2019, except for E&M for Northern Green Line ext. and Gold Line which were as of 30 May 2019
NORTHERN GREEN LINE EXT.(Mochit - Khukot)18.2km/ 16 stations
PINK LINE(Khae Rai – Min Buri)34.5km/ 30 stations
YELLOW LINE(Ladprao - Samrong)30.4km/ 23 stations
FY 17/18 FY 18/19 FY 19/20 FY 20/21
Targeted 1st station: (Aug 2019)
Targeted full Operation
(2020)
Contract Signed
FY 21/22
Targeted operation(Oct 2021)
Targeted operation(Oct 2021)
Contract Signed
Construction Period
Construction Period
Construction Period100%
PINK LINE (EXTENSION)(Sirat – Muengthong Thani)3.0km/ 2 stations
YELLOW LINE (EXTENSION)(Ratchada - Ratchayothin)2.6km/ 2 stations
GOLD LINE PHASE 1(Krung Thon Buri – KlongSan)1.7km/ 3 stations
Targetedoperation
(by Sep 2020)
O&M contract Signed (31 Jul 18)
Construction Period
34% 20%
19% 33%
34% 20%
Civil E&M
Progress (%)*
BTS Group Earnings PresentationSection 2: Business Updates
27%
prepared by Investor Relations departmentBTS Group Holdings PCL
Media UpdateVGI’s Partnership
14BTS Group Earnings PresentationSection 2: Business Updates
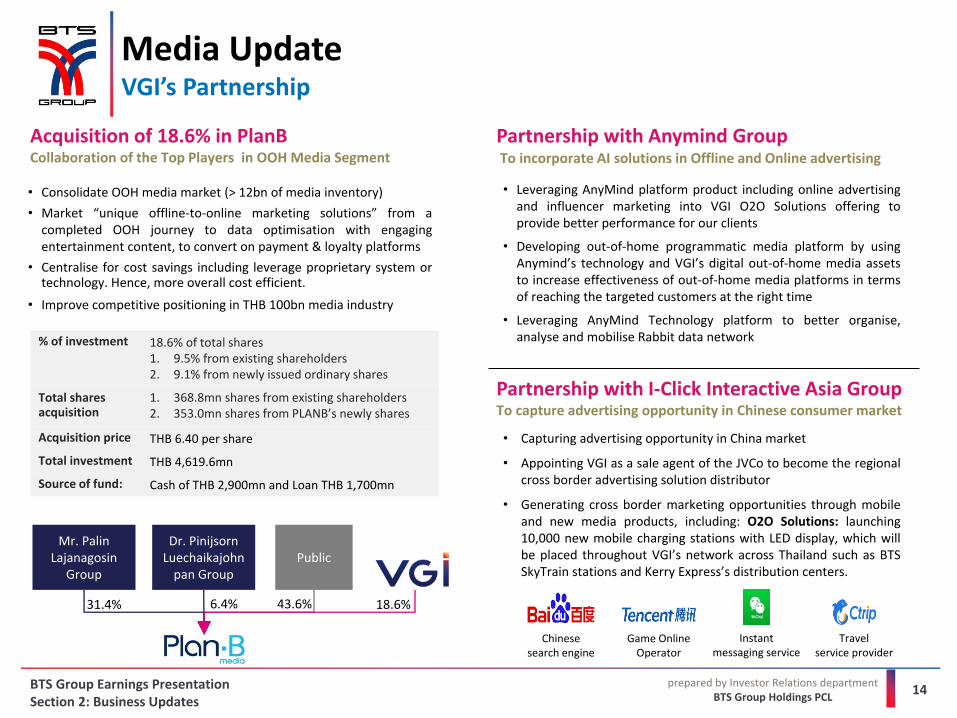
Acquisition of 18.6% in PlanBCollaboration of the Top Players in OOH Media Segment
% of investment 18.6% of total shares 1. 9.5% from existing shareholders 2. 9.1% from newly issued ordinary shares
Total shares acquisition
1. 368.8mn shares from existing shareholders2. 353.0mn shares from PLANB’s newly shares
Acquisition price THB 6.40 per share
Total investment THB 4,619.6mn
Source of fund: Cash of THB 2,900mn and Loan THB 1,700mn
Mr. Palin Lajanagosin
Group
Dr. PinijsornLuechaikajohn
pan GroupPublic
43.6%6.4%31.4% 18.6%
• Consolidate OOH media market (> 12bn of media inventory)
• Market “unique offline-to-online marketing solutions” from a completed OOH journey to data optimisation with engaging entertainment content, to convert on payment & loyalty platforms
• Centralise for cost savings including leverage proprietary system or technology. Hence, more overall cost efficient.
• Improve competitive positioning in THB 100bn media industry
Partnership with Anymind GroupTo incorporate AI solutions in Offline and Online advertising
• Leveraging AnyMind platform product including online advertising and influencer marketing into VGI O2O Solutions offering to provide better performance for our clients
• Developing out-of-home programmatic media platform by using Anymind’s technology and VGI’s digital out-of-home media assets to increase effectiveness of out-of-home media platforms in terms of reaching the targeted customers at the right time
• Leveraging AnyMind Technology platform to better organise, analyse and mobilise Rabbit data network
Partnership with I-Click Interactive Asia GroupTo capture advertising opportunity in Chinese consumer market
• Capturing advertising opportunity in China market
• Appointing VGI as a sale agent of the JVCo to become the regional cross border advertising solution distributor
• Generating cross border marketing opportunities through mobile and new media products, including: O2O Solutions: launching 10,000 new mobile charging stations with LED display, which will be placed throughout VGI’s network across Thailand such as BTS SkyTrain stations and Kerry Express’s distribution centers.
Chinese search engine
Game OnlineOperator
Travel service provider
Instant messaging service
prepared by Investor Relations departmentBTS Group Holdings PCL
Media UpdateVGI’s Broaden User-Base from Rabbit and Kerry Network Expansion
15BTS Group Earnings PresentationSection 2: Business Updates
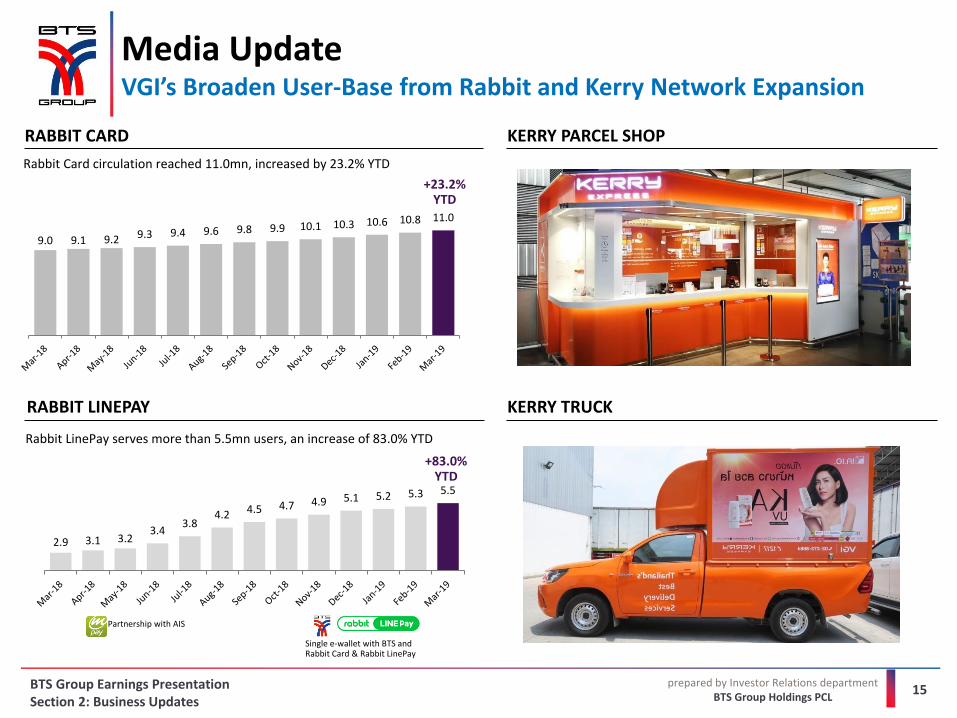
RABBIT LINEPAY
Rabbit LinePay serves more than 5.5mn users, an increase of 83.0% YTD
Partnership with AIS
2.9 3.1 3.23.4
3.84.2 4.5 4.7 4.9 5.1 5.2 5.3 5.5
Single e-wallet with BTS and Rabbit Card & Rabbit LinePay
+83.0% YTD
RABBIT CARD
Rabbit Card circulation reached 11.0mn, increased by 23.2% YTD
9.0 9.1 9.2 9.3 9.4 9.6 9.8 9.9 10.1 10.3 10.6 10.8 11.0
+23.2% YTD
KERRY PARCEL SHOP
KERRY TRUCK

prepared by Investor Relations departmentBTS Group Holdings PCL
Property UpdateDisposal of the Investment in Bayswater JV to CPN, Worth THB 7.7bn
16
Transaction Disposal of the investment in Bayswater Co., Ltd.
RationaleTo generate profit and to use proceeds for other businesses, projects or working capital of the Company
Seller The Company
Buyer Central Pattana Public Company Limited (CPN)
Value ofDisposed Investment
THB 7,699mn
Amount of Shares to be Disposed
50,000 ordinary shares (50% of total shares) at par value of THB 100 per share
Asset Details Land 48 – 3 – 12.8 Rai (78,051.2sqm)
Ownership: Freehold
BTS Proximity 200m from Phahon Yothin 24 Station (N10 of Northern Green Line extension)
BTS Group Earnings PresentationSection 2: Business Updates
prepared by Investor Relations departmentBTS Group Holdings PCL
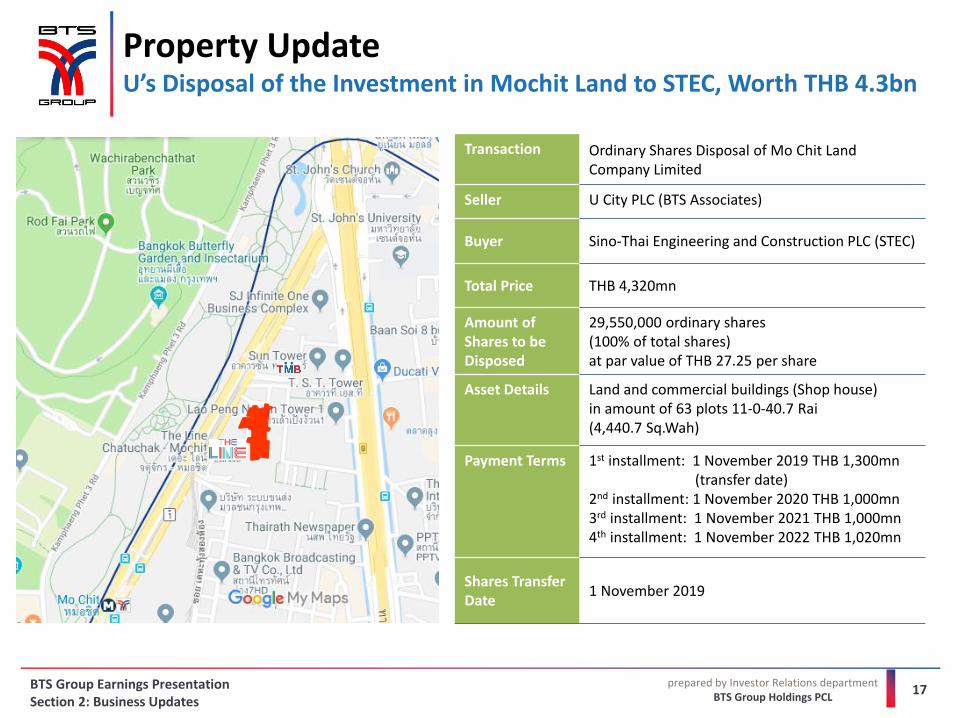
Property UpdateU’s Disposal of the Investment in Mochit Land to STEC, Worth THB 4.3bn
Transaction Ordinary Shares Disposal of Mo Chit Land Company Limited
Seller U City PLC (BTS Associates)
Buyer Sino-Thai Engineering and Construction PLC (STEC)
Total Price THB 4,320mn
Amount of Shares to be Disposed
29,550,000 ordinary shares (100% of total shares) at par value of THB 27.25 per share
Asset Details Land and commercial buildings (Shop house) in amount of 63 plots 11-0-40.7 Rai (4,440.7 Sq.Wah)
Payment Terms 1st installment: 1 November 2019 THB 1,300mn (transfer date)
2nd installment: 1 November 2020 THB 1,000mn3rd installment: 1 November 2021 THB 1,000mn4th installment: 1 November 2022 THB 1,020mn
Shares Transfer Date
1 November 2019
17BTS Group Earnings PresentationSection 2: Business Updates

prepared by Investor Relations departmentBTS Group Holdings PCL
BTS Group UpdateFirst Thai Green Bond Offering to Institutional & HNW Investors
18BTS Group Earnings PresentationSection 2: Business Updates
THB 13BN GREEN BOND
Rationale:
Issuance Date:
For debt repayment of Eligible Green Projects (Pink & Yellow Line)
24 May 2019
Average Coupon Rate:
3.41%
Complied with
By ICMA✓ ✓
Climate Bonds Standard version 2.1
✓
Verified by
Provide Second Party Opinion (SPO) to verify BTSG Greenbond Framework Aligned with GBP
Certified by Climate Bonds Initiative (CBI)
Certified byTHB 13.0bnIssue Size:
THB 41.7bnBidding Demand:
A/ Stable rated by TRISCredit Rating:

prepared by Investor Relations departmentBTS Group Holdings PCL
BTS Group UpdateBTS-W4 and BTS-W5 Term Sheets
BTS Group Earnings PresentationSection 2: Business Updates
Ticker BTS-W4
Term 1 year from the issuance date
Issuance date 30 November 2018
Expiry date 29 November 2019
Warrants price nil
No. of warrants 1,315,710,907 units
AllocationTo existing shareholders at the ratio of 9 existing BTS shares : 1 bts-W4
Exercise ratio1 1 BTS-W4 to 1.1 new common share of BTS
Exercise price THB 10.50 per share
Expected maximum proceeds
THB 13.8bn
Exercise period Quarterly
Progress48.8mn units exercised, generating proceeds of THB 0.5bn, equivalent to 3.7% of maximum proceeds
BTS-W4 TERMS AND CONDITIONS
19
Ticker BTS-W5
Term 1 year from the issuance date
Warrants price nil
No. of warrants Up to 1,319.61mn units
AllocationTo existing shareholders at the ratio of 10 existing BTS shares : 1 BTS-W5
Exercise ratio 1 BTS-W5 to 1 new common share of BTS
Exercise price THB 14 per share
Expected maximum proceeds
THB 18.5bn
Exercise period Quarterly
1Subject to shareholders’ approval, issuance of new warrants (BTS-W5) up to 1,319.6mn units, calculated based on the assumption that BTS-W4 Warrants (including the case of rights adjustment of BTS-W4 Warrants) and BTS-WC Warrants which are entitled to exercise are fully exercised. The number of shares with the right to receive BTS-W5 Warrants will be equivalent to 13,195.7mn shares.
BTS-W5 TERMS AND CONDITIONS

prepared by Investor Relations departmentBTS Group Holdings PCL
THB 1.5 - 1.9bnMass-transit related interest income
THB 27 - 33bn THB 0.7bn THB 0.2bn(Excludes: Real estate
development cost)
THB 23 - 27bnPink and Yellow LinesConstruction revenue
THB 4 - 6bnRevenue from E&M provision and train procurement for Green Line extensions
4 - 5%Core Network ridership growth
THB 3.4bn Train O&M revenue
THB 6.0 - 6.2bnVGI Revenue
40 - 45% VGI EBITDA margin
20 - 25% VGI NPAT margin
FY 2019/20 BTS Group Targets and CAPEX
≥ 20% U City EBITDA margin
THB 350mnBTS Group
Property Revenue
THB 7.2 - 7.5bnU City Revenue
BTS GROUP TARGETS
CAPEX: THB 28-34BN
MASS TRANSIT PROPERTYMEDIA
BTS Group Earnings PresentationSection 2: Business Updates
20

prepared by Investor Relations departmentBTS Group Holdings PCL
Agenda
BTS Group Earnings Presentation 21
FY 2018/19 FINANCIAL PERFORMANCESECTION 1
BUSINESS UPDATESSECTION 2
APPENDICESSECTION 3

prepared by Investor Relations departmentBTS Group Holdings PCL
Mass Transit UpdateProgress of New Trains Delivery
22
✓ 14 trains arrived ✓ Another 8 trains will be completely
delivered by 2019
✓ First batch arrived in 1H 2019✓ The remaining will be completely
delivered by 2020
BTS Group Earnings PresentationAppendices

prepared by Investor Relations departmentBTS Group Holdings PCL
Mass Transit UpdateProgress of BTS Targeted Lines
Sources: MRTA, the Company
FY 17/18 FY 18/19 FY 19/20 FY 20/21 FY 21/22
WESTERN GREEN LINE EXT.(Bang Wa – Taling Chan)7.0km/ 6 stations
TargetedFull operation
TargetedFull operation
Expected open bid/ award
Expected open bid/ award
LRT(Bangna - Suvarnabhumi)18.3km/ 14 stations
GREY LINE PHASE 1(Watcharaphon - Thonglo)16.3km/ 15 stations
ORANGE LINE(Min Buri – Taling Chan)39.6km/ 29 stations
Expected open bid/ award
Expected open bid/ award Targeted
Full operation
TargetedFull operation
FY 22/23
Construction Period
Construction Period
Construction Period
Construction Period
(Civil works of Eastern Orange)
BTS Group Earnings PresentationAppendices
23
prepared by Investor Relations departmentBTS Group Holdings PCL
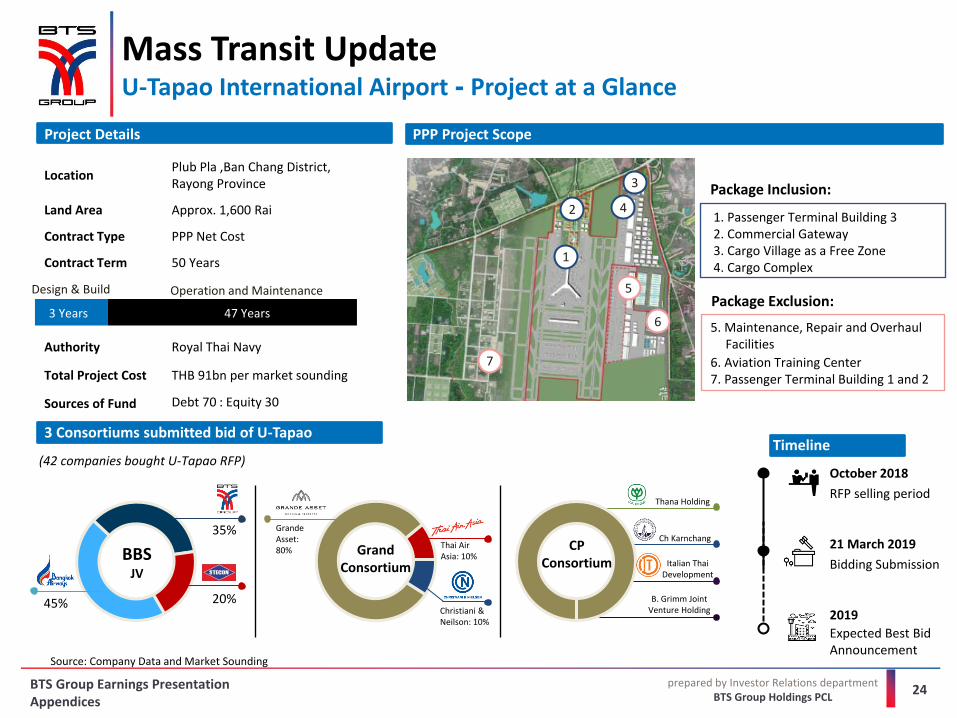
Mass Transit UpdateU-Tapao International Airport - Project at a Glance
24BTS Group Earnings PresentationAppendices
3 Consortiums submitted bid of U-Tapao
LocationPlub Pla ,Ban Chang District, Rayong Province
Land Area Approx. 1,600 Rai
Contract Type PPP Net Cost
Contract Term 50 Years
Authority Royal Thai Navy
Total Project Cost THB 91bn per market sounding
Sources of Fund Debt 70 : Equity 30
Project Details
45%
35%
20%
3 Years 47 Years
Design & Build Operation and Maintenance
BBS JV
2
3
4
1
5
6
7
PPP Project Scope
1. Passenger Terminal Building 32. Commercial Gateway3. Cargo Village as a Free Zone4. Cargo Complex
5. Maintenance, Repair and Overhaul Facilities
6. Aviation Training Center7. Passenger Terminal Building 1 and 2
Timeline
Source: Company Data and Market Sounding
21 March 2019
Bidding Submission
2019
Expected Best Bid Announcement
October 2018
RFP selling period
Package Inclusion:
Package Exclusion:
Grande Asset: 80%
Thai Air Asia: 10%
Christiani & Neilson: 10%
Grand Consortium
Thana Holding
Ch Karnchang
Italian Thai Development
B. Grimm Joint Venture Holding
(42 companies bought U-Tapao RFP)
CPConsortium

prepared by Investor Relations departmentBTS Group Holdings PCL
Western Orange
Eastern Orange
Eastern Orange
Western OrangeEXPECTED TIMELINE
Mass Transit UpdateOrange Line – Project at a Glance
25
2023Targeted Commercial Operation Date
MAY 2017Civil work construction of Eastern Orange began
2019Expect request for proposal (RFP) for Civil work construction of Western Orange & E&M, available for sale
Underground Stations
Elevated Stations
ORANGE LINE (39.6KM, 29 STATIONS)
CAPEX Civil ~THB 90bn*E&M ~THB 30bn
Route
Length
No. of Station
Taling Chan –
Thailand Cultural Center
17km
12 (underground)
Route
Length
No. of Station
Thailand Cultural Center - Min Buri
22.6km
17 (10 aboveground and 7 underground)
* Western Orange civil works CAPEX
BTS Group Earnings PresentationAppendices

prepared by Investor Relations departmentBTS Group Holdings PCL
26
Property Update14 Projects SIRI-JV Condomimium Launched with Upcoming 3 Projects
PARTNERSHIP ROADMAP
2015
2016
50:50 JV to develop a targeted THB 100bn worth of condominiums along current and future mass transit lines through the JV with Sansiri PCL with an expected NPAT margin 12%
2018
The LINE Jatujak – Mo Chit Project value: THB 5,815mn No. of units: 841The LINE Sukhumvit 71Project value: THB 1,967mn No. of units: 291The LINE RatchathewiProject value: THB 2,851mn No. of units: 231
The LINE Asoke-RatchadaProject value: THB 3,022mn No. of units: 473The BASE Garden Rama 9Project value: THB 2,336mn No. of units: 640The LINE Phahon-PradipatProject value: THB 5,890mn No. of units: 981
2017
The BASE Phetkasem 29Project value: THB 2,012mn No. of units: 640The MONUMENT Thong LoProject value: THB 6,258mn No. of units: 127The LINE SathornProject value: THB 3,910mn No. of units: 327
The LINE Sukhumvit 101Project value: THB 4,653mn No. of units: 778KHUN BY YOO Project value: THB 4,069mn No. of units: 148
The LINE WongsawangProject value: THB 4,776mn No. of units: 1,288
The LINE WongsawangThe LINE Sukhumvit
101
The LINE
Jatujak-Mo Chit
Fully transferred
The BASE SaphanmaiProject value: THB 2,921mn No. of units: 820
The LINE Phahonyothin ParkProject value: THB 4,961mn No. of units: 880
2019The LINE
Sathorn
The BASE Ratchada-ThapraProject value: THB 3,050mn No. of units: 1,037VIA Sukhumvit 34Project value: THB 1,345mn No. of units: 82Yak Phang MuangProject value: THB 1,842mn No. of units: 315
Ready to move in
New projectTo be transferred
BTS Group Earnings PresentationAppendices
prepared by Investor Relations departmentBTS Group Holdings PCL
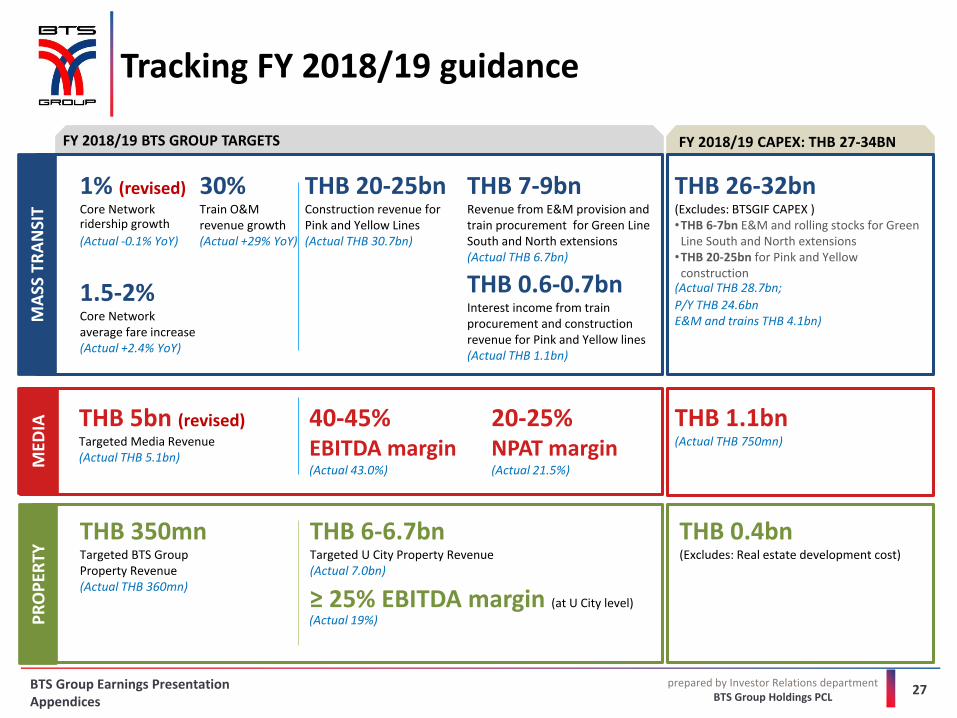
Tracking FY 2018/19 guidanceM
EDIA
FY 2018/19 BTS GROUP TARGETS
THB 5bn (revised)Targeted Media Revenue(Actual THB 5.1bn)
1% (revised)Core Networkridership growth
(Actual -0.1% YoY)
1.5-2%Core Networkaverage fare increase(Actual +2.4% YoY)
30%Train O&M revenue growth (Actual +29% YoY)
THB 7-9bnRevenue from E&M provision and train procurement for Green Line South and North extensions(Actual THB 6.7bn)
THB 350mnTargeted BTS Group Property Revenue(Actual THB 360mn)
(Actual 19%)
THB 20-25bnConstruction revenue for Pink and Yellow Lines(Actual THB 30.7bn)
THB 6-6.7bnTargeted U City Property Revenue(Actual 7.0bn)
≥ 25% EBITDA margin (at U City level)
40-45% EBITDA margin(Actual 43.0%)
20-25% NPAT margin(Actual 21.5%)
THB 0.6-0.7bnInterest income from train procurement and construction revenue for Pink and Yellow lines(Actual THB 1.1bn)
MA
SS T
RA
NSI
T
FY 2018/19 CAPEX: THB 27-34BN
THB 26-32bn(Excludes: BTSGIF CAPEX )•THB 6-7bn E&M and rolling stocks for Green Line South and North extensions•THB 20-25bn for Pink and Yellow construction
(Actual THB 28.7bn;
P/Y THB 24.6bnE&M and trains THB 4.1bn)
THB 1.1bn(Actual THB 750mn)
THB 0.4bn(Excludes: Real estate development cost)
PR
OP
ERTY
BTS Group Earnings PresentationAppendices
27


