+ All Categories
Home > Documents > Budapest University of Technology and Economics Engineering

Budapest University of Technology and Economics Engineering

Date post: 18-Mar-2022
Category:
Upload: others
View: 3 times
Download: 0 times
Share this document with a friend
39
1 Budapest University of Technology and Economics Faculty of Civil Engineering Building vulnerability assessment of historic building in Budapest to define the stages of seismic fragility Student: Nino Tabatadze MSc student Supervisors: Dr. Vigh László Gergely, Associate Professor, Department of Structural Engineering Dr. Török Ákos, Professor, Department of Engineering Geology and Geotechnics Budapest, October 2019
Transcript

1  


Budapest University of Technology and Economics Faculty of Civil Engineering 


Building vulnerability assessment of historic building in Budapest to define 

the stages of seismic fragility 


Student:           Nino Tabatadze 

                           MSc student 


Supervisors:    Dr. Vigh László Gergely,   

                           Associate Professor, Department of Structural Engineering 


                           Dr. Török Ákos,  

                           Professor, Department of Engineering Geology and Geotechnics 


Budapest, October 2019 

2  


Table of contents  

Abstract ........................................................................................................................................................... 3 

1. Introduction ................................................................................................................................................. 4 

1.1  The aim of the study..................................................................................................................................... 4 

1.2  Postulates of the methodology to solve the problem .............................................................................. 4 

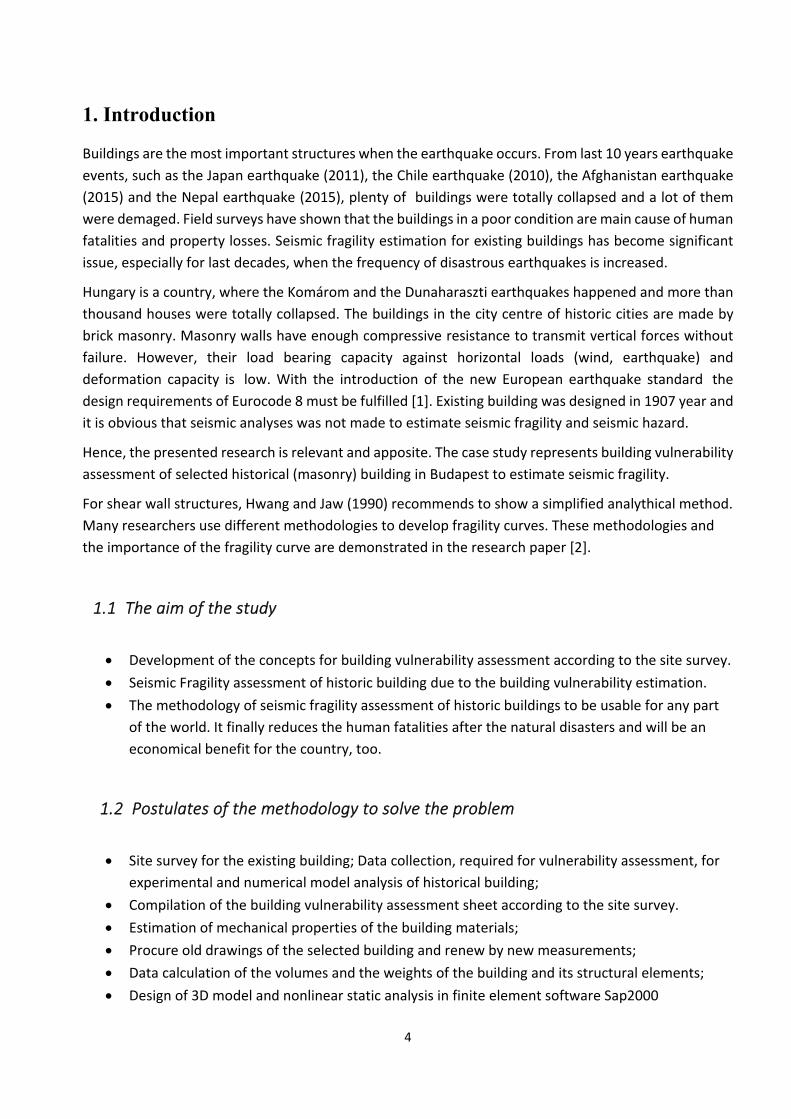
1.3  Historic value and importance of the structure ........................................................................................ 5 

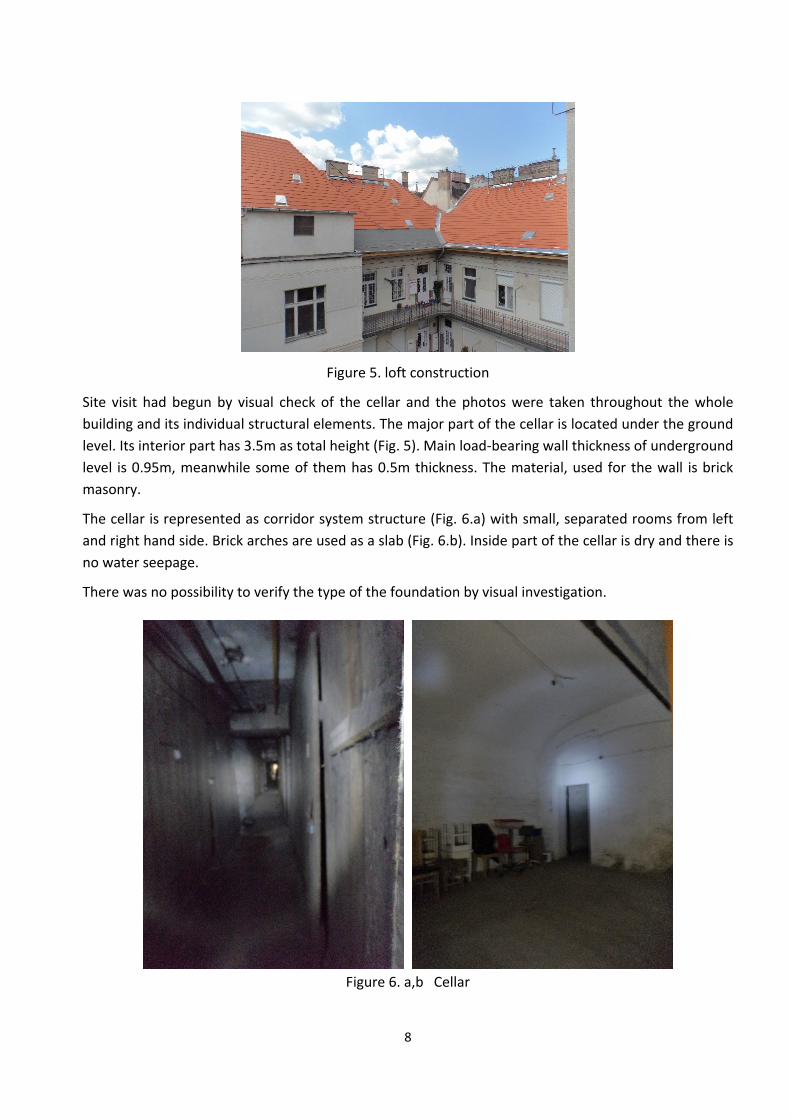
2. Site Survey ................................................................................................................................................... 7 

2.1  Steps required to fulfil during the site survey for building vulnerability .............................................. 7 

assessment ............................................................................................................................................................ 7 

2.2  Completed work during the site survey ..................................................................................................... 7 

3.   Compilation of the building vulnerability assessment sheet ..................................................................... 11 

4. Estimation of mechanical parameters for masonry walls ............................................................................ 19 

5. Modification of the old drawings with new measurements ........................................................................ 20 

6. Calculated data of the volumes and the weights of the building and its structural elements ...................... 21 

7. Design of 3D model and nonlinear static analysis in finite element software Sap2000 ................................ 23 

8. Modeling the Methodology for seismic fragility assessment of the existing building .................................. 30 

8.1    Methods of seismic fragility assessment ............................................................................................... 30 

8.2   Determination of capacity (Force ‐ displacement) curve ...................................................................... 31 

8.3   Definition of IDA (Incremental Dynamic Analysis) curve ...................................................................... 32 

8.4   Representation of seismic fragility and seismic hazard curves ........................................................... 34 

Conclusions ................................................................................................................................................... 37 

Acknowledgements ....................................................................................................................................... 37 

References ..................................................................................................................................................... 38 


3  


Abstract

The  city  centre  of  historic  cities  are  densely  populated  and  the  inhabitants mostly  live  in  historic 

buildings. Most of these buildings are made of brick or stone and their structure were designed following 

the  traditional  techniques without  taking  into account  the  seismic hazards. Accordingly,  seismic  risk 

assessment  of  such masonry  structures  is  an  important  issue  nowadays.  This  study  focuses  on  the 

conception of methodology, which implies all the steps for fragility assessment of historic building. City 

center of Budapest was selected as a typical study area and investigation has been done for one of the 

historic building.  

The  research  focuses  on  the  building  vulnerability  assessment  of  one  selected  building.  The  study 

included  in  the  first  step  the  identification  of  the  building  archetype,  construction  technology  and 

condition of the structure and structural elements. To obtain all these parameters, on site survey was 

made for the existing building, which also included the measurements of the building geometry and the 

structural components. 

After gathering the information and the new measurements of the building, modifications were made 

for the old construction plans, which were obtained from archives. The volumes and the weights of the 

structural elements of the building were calculated.  

The extracted data was used to create a numerical model of the building. Linear and non‐linear analysis 

were made for the entire structure to find the capacity curve. According the capacity and fragility curve 

the seismic hazard was estimated. 

Presented methodology is useful tool for the assessment of seismic hazard of historic buildings, not 

only in Budapest but at other parts of the world, too. 


4  

1. Introduction

Buildings are the most important structures when the earthquake occurs. From last 10 years earthquake 

events, such as the Japan earthquake (2011), the Chile earthquake (2010), the Afghanistan earthquake 

(2015) and the Nepal earthquake (2015), plenty of  buildings were totally collapsed and a lot of them 

were demaged. Field surveys have shown that the buildings in a poor condition are main cause of human 

fatalities and property losses. Seismic fragility estimation for existing buildings has become significant 

issue, especially for last decades, when the frequency of disastrous earthquakes is increased.  

Hungary is a country, where the Komárom and the Dunaharaszti earthquakes happened and more than 

thousand houses were totally collapsed. The buildings in the city centre of historic cities are made by 

brick masonry. Masonry walls have enough compressive resistance to transmit vertical forces without 

failure.  However,  their  load  bearing  capacity  against  horizontal  loads  (wind,  earthquake)  and 

deformation  capacity  is   low. With  the  introduction of  the new European earthquake  standard   the 

design requirements of Eurocode 8 must be fulfilled [1]. Existing building was designed in 1907 year and 

it is obvious that seismic analyses was not made to estimate seismic fragility and seismic hazard. 

Hence, the presented research is relevant and apposite. The case study represents building vulnerability 

assessment of selected historical (masonry) building in Budapest to estimate seismic fragility. 

For shear wall structures, Hwang and Jaw (1990) recommends to show a simplified analythical method. 

Many researchers use different methodologies to develop fragility curves. These methodologies and 

the importance of the fragility curve are demonstrated in the research paper [2]. 


   1.1  The aim of the study  

Development of the concepts for building vulnerability assessment according to the site survey. 

Seismic Fragility assessment of historic building due to the building vulnerability estimation. 

The methodology of seismic fragility assessment of historic buildings to be usable for any part 

of the world. It finally reduces the human fatalities after the natural disasters and will be an 

economical benefit for the country, too.   


    1.2  Postulates of the methodology to solve the problem  

Site survey for the existing building; Data collection, required for vulnerability assessment, for 

experimental and numerical model analysis of historical building; 

Compilation of the building vulnerability assessment sheet according to the site survey. 

Estimation of mechanical properties of the building materials; 

Procure old drawings of the selected building and renew by new measurements; 

Data calculation of the volumes and the weights of the building and its structural elements; 

Design of 3D model and nonlinear static analysis in finite element software Sap2000   

5  

Modeling the methodology of seismic fragility assessment of the existing building; 

Determination of capacity (Force ‐ displacement) curve; 

Definition of IDA (Incremental Dynamic Analysis) curve; 

Representation of seismic fragility and seismic hazard curves. 


1.3  Historic value and importance of the structure  

Research work was done for brick masonry historic building, located in the heart of the Budapest, on 

Bartok Bela street 10/12 (Fig. 1,2,3). The front facade of the existing building overlooks the Bartok Bela 

street, the back facade – Budafoki street, right side facade from Bartok Bela street is located on Csiki 

street and from left side facade has a border with adjacent building. 

The place was perfectly selected. Almost all the Hungarian traditional Buildings , located in the city 

center are dated in XX century and  represents the face of the city. Therefore to protect the historic 

buildings against the unpredictable earthquake events, has a vital role for the Country. 


Figure 1. Existing building photo from google map  

6  


Figure 2. Existing building location from google map 


Figure 3. Selected structure top view with adjacent buildings 

7  

2. Site Survey

2.1  Steps required to fulfil during the site survey for building vulnerability      

        assessment  Visual investigation of the building vulnerability; 

Photos have to be taken for both throughout the building and its individual elements; For any 

special details and damaged structural elements; 

Sketches of the building with it’s geometrical measurements, which includes: the height of the 

storeys, openings; Dimensions of the courtyard, cellar, walls, staircase, balconies, roof; 

Thickness of the slab, beam and any of significant structural elements; 

Identification of building archetype; 

Define the age, importance and usage of the structure; 

Estimation of construction configuration and construction technology; 

Define the condition of the structure and structural elements; 


2.2  Completed work during the site survey  

Existing structure  is residential building,  located  in  the city center.  It was built  in 1907. Shape of  the 

structure  is  rectangular  and  has  vertical  irregularity.  5‐6  storey  building  (with  additional  cellar)  is 

surrounded by courtyard and inner round balconies for each floor (Fig. 4. a,b).  Northern and eastern 

part of the building has 5 storeys, with additional cellar and loft construction (Fig. 5), while the South 

and western part has 6 storeys with cellar and on the top with flat roof. 


Figure 4. a,b   Exterior photos of the selected building 

8  


Figure 5. loft construction 

Site visit had begun by visual  check of  the  cellar and  the photos were  taken  throughout  the whole 

building and its individual structural elements. The major part of the cellar is located under the ground 

level. Its interior part has 3.5m as total height (Fig. 5). Main load‐bearing wall thickness of underground 

level  is 0.95m, meanwhile some of them has 0.5m thickness. The material, used  for the wall  is brick 

masonry.  

The cellar is represented as corridor system structure (Fig. 6.a) with small, separated rooms from  left 

and right hand side. Brick arches are used as a slab (Fig. 6.b). Inside part of the cellar is dry and there is 

no water seepage.  

There was no possibility to verify the type of the foundation by visual investigation.  

    Figure 6. a,b   Cellar 

9  


The structure has two brick masonry cores with main staircase with elevator (Fig. 7.a,b) and secondary 

staircase, made by  stone. Last  floor  staircase  is not  in a good condition and  requires more detailed 

investigation. There is an elevator in the corner of south eastern part. 


Figure 7.a,b   Internal Staircase 


Ground level is highest level of the building with height of 5.15m, but the floor construction is installed 

on 1.38 m above from the ground with narrow balconies around the building, surfaced by stone 

material. The entrances, located on the balcony are connected to the ground by separate, external 

stone staircases. Some of the upper level balconies have material loss from the bottom part (Fig. 8a,b).  

Main load bearing brick masonry wall has 0.85m thickness and on the same level 0.5m and 0.4m load 

bearing and 0.3m secondary walls are represented. Walls around the courtyard have a lot of openings, 

which is the considerable part for seismic analysis. 

The height of the first floor is 4.14m and the above level height ‐ 4.16m. Typical level height is 4m. Only 

the last storey height is around 3.5m. Wall thicknesses varies from 0.65m to 0.3m. 


Figure 8.a,b  Material loss, illustrated on the bottom part of the balconies 

During the survey, Schmidt hammer was used to check the type of the material of structural elements 

and in case of concrete segments to define the quality of material. 

10  

The crackes discovered in the walls and in the other part of the structural elements are not significantly 

valuable.  

Steel beams with 20cm in height are represented on the edges of the floor and balcony slabs.  

The building has seven individual balconies from the front facade from Bartok Bela street, but it could 

not be available to check.  

Due  to  the  Komárom  earthquake  (1763)  it  is  obvious  that  the  roof  part  of  the  buildings  are  very 

important and sensitive part during the earthquake event. Houses with displaced roofs and overturned 

gables are illustrated in the literature [3]. 

The existing building has two type of the roof construction. From southern side it is an open gable and 

from western side a shed roof is presented. Major part of the loft construction consists of timber beams, 

columns and rafters  (Fig. 9.a,b,c). Maximum height of  the roof  is around 6.5‐6.7m  from  the bottom. 

Some of the walls are continuing until the top of the roof. There are several chimney constructions, too. 


Figure 9.a,b,c Loft constructions 

Visual investigation of the loft constructions shows that the materials (Fig. 9.a,b,c) are relatively new, in 

good condition.  

Quality and the condition of the whole building might be rated as moderate. 


11  


3. Compilation of the building vulnerability assessment sheet

After the searching of Hungarian building vulnerability assessment form, It was revealed that the form 

does not exist in Hungary. Based on the above mentioned problem for new Hungarian building 

vulnerability assessment sheet formation,  Indian [4] and American [5] forms were selected as a 

sample. All the items were discussed and modified according to the specifics of Hungarian buildings 

and its individual characteristics. 

To become the process obvious, American (Fig. 10) and Indian forms (Fig. 11 and Fig. 12) are illustrated on this research paper. 


12  


Figure 10. Rapid Visual Screening of Buildings for Potential Seismic Hazards Level [5] 

13  


Figure 11. Indian building vulnerability assessment form [4] 

14  


Figure 12. Indian building vulnerability assessment form (continuation) [4] 

15  

After the deep discussion and comparison, related to the Building vulnerability assessment form for 

Hungary, new form was created (Fig.13, Fig.14). 


Figure 13.  Building vulnerability assessment form for Hungary 

16  


Figure 14.  Building vulnerability assessment form for Hungary 

17  

Since the required parameters was defined from site survey of the existing structure, the building 

vulnerability assessment form was filled (Fig. 15, Fig.16). 


Figure 15. Filled building vulnerability assessment form 

18  


Figure 16. Filled building vulnerability assessment form 

19  

4. Estimation of mechanical parameters for masonry walls

Mechanical parameters for masonry walls, like Young’s modulus (Modulus of elasticity), Poisson ratio, 

shear modulus and compressive strength have one of  the  important role.  It  is essential to know  the 

characteristic of brick masonry walls in order to evaluate the responses of masonry walls for any kind of 

loading.  Individual  bricks  do  possess  better  compressive  capacity  as  compared  to masonry  walls. 

Masonry walls are bound together with either mud mortar, lime mortar or by cement sand mortars of 

various mixes  as  per  strength  requirements.  The  essential  strength  properties  in  engineering  are 

basically the compressive strength and the modulus of elasticity. The American Society for Testing and 

Materials (ASTM) standard is the most popular for testing bricks and brick masonry for these properties 

so far [6]. 

For the presented research paper, separate material characteristic values are illustrated from Hungarian 

codes and literature (Table 1), but the mechanical parameters for masonry walls was found from studies 

developed  in Department of Structural Engineering, University of Naples Federico  II, Naples,  Italy  [7] 

(Table 2). 

 Parameters / Material 

brick  wood  steel  reinforced concrete (40‐50ys old) 

stone   

Weight per unit volume  1600‐1750  600‐700 

7000‐8000  2300‐2400  2650  

Modulus of elasticity (MPa) 

800‐2300  4000  200000  15000‐30000 

35000‐40000 


Poisson ratio  0.263  does not have 

0,25‐0,30  0,15  0,28 

Coefficient for thermal expansion 

9*10‐6  4*10‐6  11.9 *10‐6  1.3*10‐5  8*10‐6 


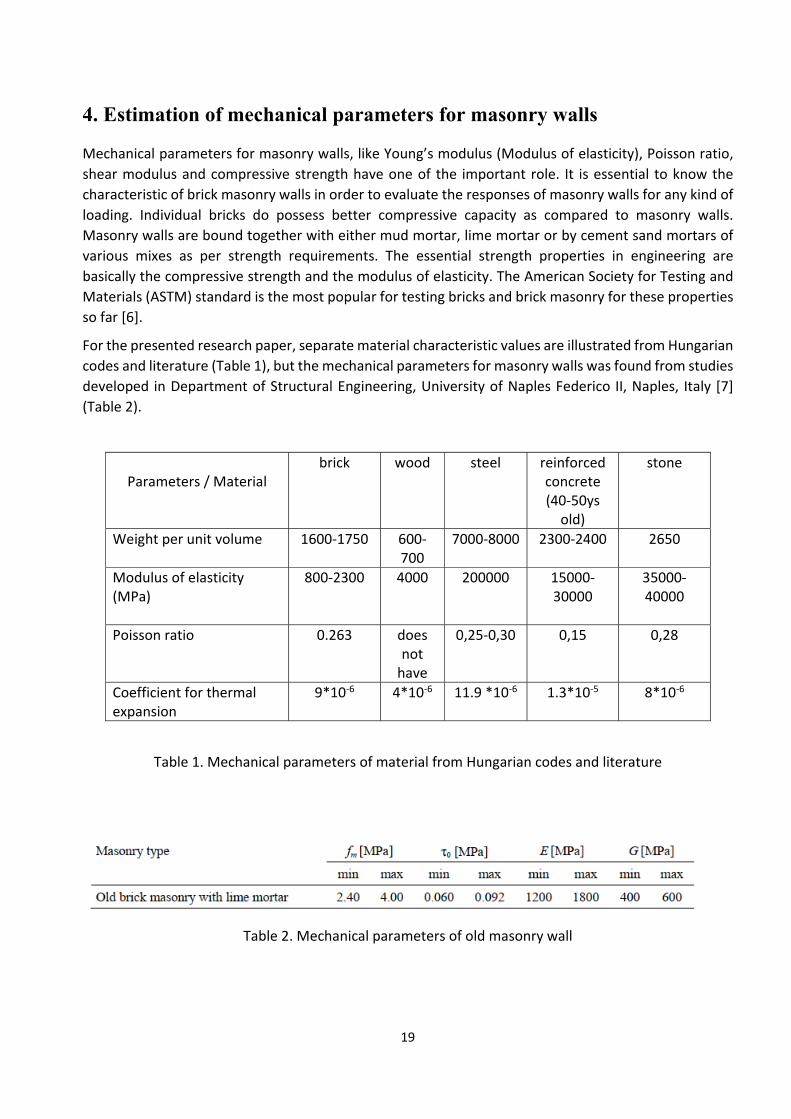
Table 1. Mechanical parameters of material from Hungarian codes and literature 


Table 2. Mechanical parameters of old masonry wall 

20  

5. Modification of the old drawings with new measurements It is a necessary step to calculate the data of the volumes and the weights of the building and to detect 

the structural elements of the building. 

The old drawings (Fig. 17.a,b) of existing building were procured from Hungarian online archive [8] and 

were modified by new measurements gathered from the site survey. Several new drawings are 

illustrated in the research paper (Fig. 18,19,20.a,b). 


Figure 17. a) Samples of the typical plan and b) vertical plan (old drawings) 


Figure 18. Sample of the walls and openings plan of typical floor (new drawing) 

21  

6. Calculated data of the volumes and the weights of the building and its structural elements

After getting the new drawings, the volumes and the weights of each structural elements and finally 

for the whole building were calculated. 


Table 3. Volumes and weights of structural components of Cellar and ground floor. 


Table 4. Volumes and weights of structural components of 1st and 2nd  floor. 

22  


Table 5. Volumes and weights of structural components of 3rd‐4th‐5th  floor. 


Building vulnerability assessment form, new drawings of the existing building, represented data of 

volumes and weights values of building and building elements, can be used either for experimental or 

analytical (force‐displacement) methods of seismic fragility assessment.  


23  

7. Design of 3D model and nonlinear static analysis in finite element software Sap2000  

3D model of the existing building was designed in Sap2000. First step was to define material properties 

(Fig. 19, Fig.20 ) 


Figure 19. Material property data 


24  


Figure 20. Nonlinear material data 

Shell elements were selected for wall sections (Fig. 21, Fig. 22). 


Figure 21. List of the wall sections 

25  


Figure 22. Shell section data for the wall with thickness 65 cm 


Steel beams were used on balcony edges, and for loft construction timber frame elements were 

defined (Fig. 23).  


Figure 23. Frame properties 

26  


Slab was calculated as a rigid diaphragm.  

Shell elements for slab and walls were divided into 0.2 – 0.3m size finite elements. Starting points of  

the wall finite elements were restrained as it is illustrated on Fig. 24. 


Figure 24. Joint restraints 

When the design of the building geometry was completed (Fig. 25), Dead, live and horizontal loads 

were assigned [9].  


Figure 25. 3D model of the building 

27  


Nonlinear static load case was defined for nonlinear static analysis, which combines dead and live 

loads. Then the horizontal load case was modified for nonlinear static analysis. 


Figure 26. Horizontal load case modified for nonlinear static analysis 

To calculate the numerical model of the whole building by nonlinear static pushover analysis requires 

too much time for masonry building with a large volume. Alternative decision was made to calculate 

single floor separately and increase the vertical and horizontal loads for each floor (Fig. 27, 28, 29.a,b, 

Table 6). 

 Floor number 


Dead load KN/m2 

Live load KN/m2 

Assumed  Horizontal load 

KN/m2 

Cellar  104  

12  11.6 

Ground floor  

85  10  9.5 

First floor  

64  8  7.2 

Second floor  

49  6  5.5 

Third floor  

35  4  3.9 

Fourth floor  

23  2  2.5 

Fifth floor  

10  ‐  1 


Table 6. Load distribution for each floor of the building 

28  


Figure 27. Deformed shape of the single floor walls  


Figure 28. Deformed shape of the single floor walls and slab  


Figure 29.a,b    3D model for last floor and loft construction 

29  


Maximum displacements and base shear forces were represented per floor after the nonlinear static 

calculation (Table 7). 


 Floor name 


Max displacement 

Base shear force KN 

Cellar  

0.002659  11500.589 

Ground floor  

0.003842  9439.162 

First floor  

0.005094  7160.744 

Second floor  

0.003966  5533.302 

Third floor  

0.004569  4014.356 

Fourth floor  

0.003301  2712.403 

Fifth floor  

0.002051  402.59 


Table 7. Maximum displacements and base shear forces for each floor of the building 


It is recommended to find maximum displacements and base shear force for whole building by 

simplified method to estimate the capacity curve. 


30  

8. Modeling the Methodology for seismic fragility assessment of the existing building

Methods of seismic fragility assessment; 

Determination of capacity (Force ‐ displacement) curve; 

Definition of IDA (Incremental Dynamic Analysis) curve;  

Representation of seismic fragility and seismic hazard curves. 


      8.1    Methods of seismic fragility assessment  

Fragility is the probability of exceeding a certain damage state, conditional on the ground motion 

intensity [10]. 

There are two main components in the probabilistic seismic risk assessment: 1. information about 

ground motion hazard on the site and 2. Fragility knowledge with respect to the intensity of the 

ground motion. 

Several methods are established for seismic fragility evaluation in different literature. 

The general equation to develop fragility is [2]:    

                                      (1) 

where, 

LS is the limit state or damage state (DS), 

IM is the intensity measure (ground motion), and 

Y is the realized condition of ground motion IM. 

Relative Frequency (RF) Method ‐  where the capacity is assumed to be deterministic, attaining 

probability is approximated by the relative frequency. 

Lognormal Distribution (LD) Method – Is the most popular method, when capacity is assumed to be 

deterministic and realizations as some probability distribution function (Fig. 30) 

                                                                             (2) 

Where Fij is the cumulative probability distribution function [8]. 

31  


Figure 30. Fragility curve based on the lognormal distribution [11] 


Maximum Likelihood (BD) Method ‐ Capacity is assumed to be deterministic and each realization is 

represented as the result of a multi‐outcome Bernoulli‐type experiment, which resolves a dichotomy 

for a number of events. A lognormal distribution function is assumed to illustrate the fragility curves.  

First‐order Second‐moment (FS) Method ‐ demand and capacity are random variables and it is 

assumed that they are are independent and lognormal. 

Fuzzy Random (FR) Method ‐ damage quantification is naturally fuzzy, its probability is the expectation 

of the membership function μE relevant to this event [10]. 

For seismic fragility calculation of  unreinforced masonry buildings, given formula is required to be 

used by Frankie et al. (2012) [2]: 

   (3)   where,        


     8.2   Determination of capacity (Force ‐ displacement) curve  

To predict the force‐displacement (F‐δ) relationship for masonry walls, it is accepted to provide either 

by the analysis of experimental results of masonry wall or numerical analysis of structure.  

In case of numerical analysis, Nonlinear static pushover analysis is required to use. The capacity curve 

expressed by pushover analyses has to be converted into a bilinear curve. Limit‐ displacement values 

can be identified (Fig. 31).  

For the existing building to use simplified method is more rational, because of the large volume and 

weight of the building, it is obvious that numerical model calculation takes a lot of time. 


32  


Figure 31. Capacity curve (a) and capacity spectrum (b) obtained from the deterministic APA [12] 


To use the illustrated model (Fig. 32) depends on both the description of the damage states on the F‐ 

δ curve, the placement of the ultimate point (δult, Fult) and the importance of the residual strength of   

the wall [?]. 


Figure 32. Idealizations of the 

F‐δ backbone curve for masonry walls. 

    8.3   Definition of IDA (Incremental Dynamic Analysis) curve  

IDA (Incremental Dynamic Analysis) STUDY is a dynamic analysis study of a given structural model 

parameterized by the scale factor of the given ground motion time history. 

An IDA CURVE is a plot of a state variable (DM) recorded in an IDA study versus one or more IMs that 

characterize the applied scaled accelerogram. 

An  IDA  CURVE  SET  is  a  collection  of  IDA  curves  of  the  same  structural  model  under  different 

accelerograms that are all parameterized on the same IMs and DM [13]. 

The IDA given the structural model and a statistical population of records is no longer deterministic; it 

is a random line, or a random function DM = f(IM) (for a single, monotonic IM). Then, just as we are 

able to summarize a suite of records by having, for example, mean, median, and 16%, 84% response 

spectra, so we can define mean, median and 16%, 84% IDA curves (e.g., Figure 33. a,b) to (marginally) 

33  

summarize an IDA curve set. Alternatively a parametric model of the median DM given the IM can be 

fit to all the lines simultaneously [13].  


Figure 33. SPO2IDA‐predicted IDA fractiles for the equivalent SDoF system (a) Sa(T1)(g) vs 

Roof displacement, (b) Sa(T1)(g) vs Maximum Interstorey Drift Ratio [14] 


The IDA always rises much higher than the SPO in IM terms [13]. 


34  

 8.4   Representation of seismic fragility and seismic hazard curves  

The  IDA curve estimation give us a direct way to create seismic fragility curve (Fig. 34, 35, 36). 


Figure 34. Illustration of fragility curves [11] 


Figure 35. Family of fragility curves at 95%, 50% and 5% confidence levels [11] 


35  


Figure 36. Fragility curve, conditional probability of failure [15] 


Steps for hazard curve are given in Fig. 37. 


Figure 37. Seismic hazard analysis steps [11] 


36  

Hazard curve is given as a probability density as a function of special acceleration (Fig. 38). It reflects 

the time‐dependence and frequency of occurrence of the action, that depends on the location. It is an 

action‐specific feature [15]. 


Figure 38. Hazard curve, PDF and CDF for two sites 

(Kosovo (green) and Italy (red; PGA = 0.2 g) [15] 


Finally, we can estimate fragility and hazard curves relationship (Fig. 39) 


Figure 39. Fragility and hazard curves [15]  


37  


Conclusions


The  present  study  focused  on  the  seismic  fragility  evaluation  based  on  the  building  vulnerability 

assessment.  

Research paper represents the site survey for Hungarian historic building, gathering the all necessary 

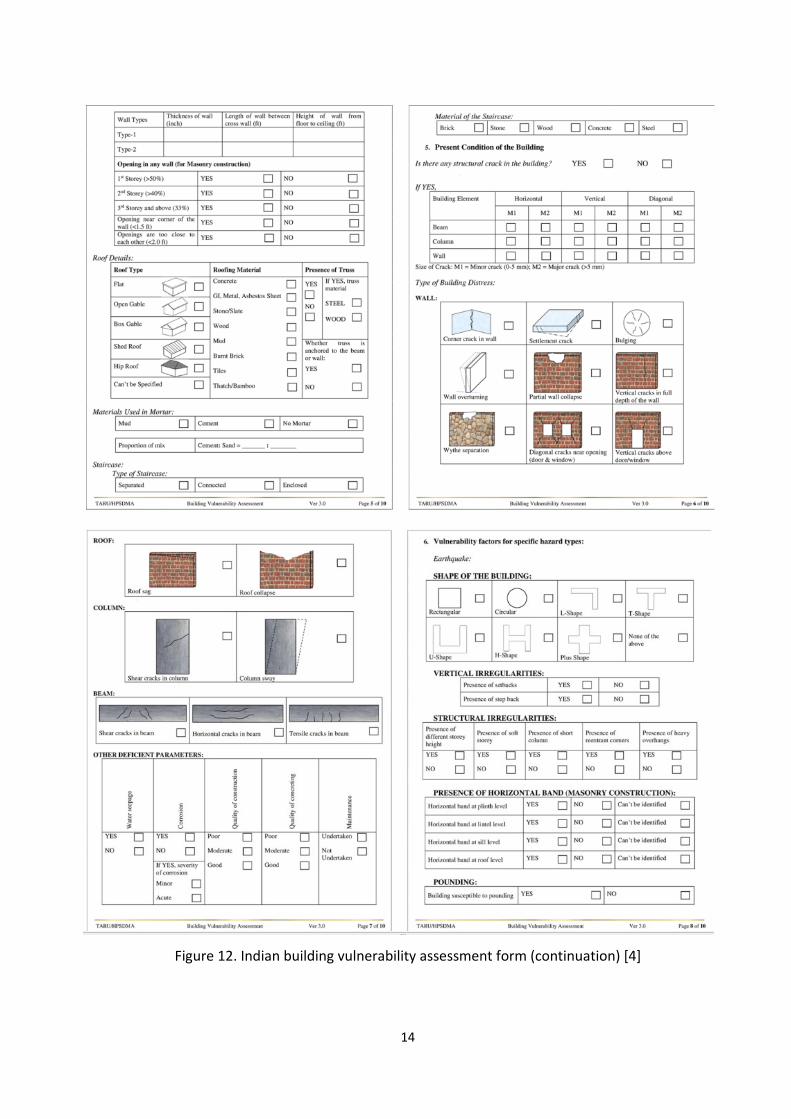
information of the building for seismic analysis. Indian and American building vulnerability assessment 

forms are illustrated, which was used to create a new form for Hungary.  

Estimation of mechanical parameters of existed material was done according to the relevant literature, 

collected as from national documents also from foreign laboratory test papers. 

All the above mentioned data was used to create the 3D model in finite element software and calculate 

by Nonlinear static analysis. 

Detailed methodological tools are presented, to estimate the capacity (force ‐displacement) curve and  

determine the IDA curve, which gives the possibility for seismic fragility and seismic hazard assessment. 

The demonstrated methodology will be effective as for pre‐earthquake, also for post earthquake seismic 

hazard assessment of the buildings, which will be a significant benefit for the country. 


Acknowledgements

I would like to express my gratitude to my supervisors: Dr. Vigh Lászlo Gergely and Dr. Török Ákos for 

their support and useful suggestions around this research work. To be always ready to help me and 

encourage. The experience gained by this study work, improved and enriched my knowledge 

throughout the Seismic Engineering field. 

A special consideration to my friends from Georgia and from Syria, Mr. Otar Qvrivishvili and Mr. Shadi 

Fattoum.  

This paper is also related to OKF project. 

38  

References

[1] Fódi A, (2011) Experimental and numerical investigation of reinforced and plain masonry walls, 

Theses of the PhD Dissertation, Budapest University of Technology and Economics, Budapest, p 3 (19) 

[2] Nadzli F M, (2018) Seismic fragility assessment for buildings due to earthquake excitation. 

SpringerBrief in Computational Mechanics, Springer, Berlin, pp 3‐12 (121) 

[3] Morais E C, (2018) Estimation of the Intensities of Historical Seismic Events in Moderately Seismic 

Regions, Based on the Damage Analysis of Hungarian Historical Buildings, PhD Dissertation, Budapest 

University of Technology and Economics, Budapest, p 19 (107) 

[?] Morais E C, Vigh L G, Krähling J,  (2017) Seismic damage analysis of a Hungarian historical peasant 

house archetype, ENOC 2017, Budapest, Hungary ,  p 5 (7)   

[4] Sreerama A K, Rajaram C, Mishra S, Ramancharla P K,  Karnath A; Rapid visual screening of different 

housing typologies in Himachal, 

Pradesh, India, Report No: IIIT/TR/2017/‐1, Centre for Earthquake Engineering International Institute 

of Information Technology, Hyderabad ‐ 500 032, pp 7‐9 (26) 

[5] Applied technology council, (2015) THIRD EDITION Rapid Visual Screening of Buildings for Potential 

Seismic Hazards: A Handbook, Redwood City, California 94065, pp 252‐255 (388) 

[6] Phaiju S, Pradhan P M, (2018)  Experimental Work for Mechanical Properties of Brick and Masonry 

Panel, JScE Vol. 5, p 2 (8) 

[7] Parisi F. & Augenti N, Experimental data analysis for mechanical modelling 

of existing brick masonry structures, Department of Structural Engineering, University of Naples 

Federico II, Naples, Italy , 15WCEE LISBOA 2012, p 8 (11)   

[8] Stein Manó bérháza [HU BFL ‐ XV.17.d.329 ‐ 5504, 1‐9. f.] 

[9] P. Bisch, E. Carvalho, H. Degee, P. Fajfar, M. Fardis,P. Franchin, M. Kreslin, A. Pecker,P. Pinto, A. 

Plumier, H. Somja, G. Tsionis, Editors: B. Acun, A. Athanasopoulou, A. PintoE. Carvalho, M. Fardis, 

(2011) Lisbon, Eurocode 8: Seismic Design of BuildingsWorked examples, European Commission Joint 

Research Centre, JRC 68411, EUR 25204 EN , p 265 (522) 

[10] di Roio M, (2008) ON THE COMPUTATION OF SEISMIC FRAGILITY CURVES, DISAT Dept., University 

of L’Aquila, Italy, The 14th World Conference on Earthquake Engineering October 12‐17, 2008, Beijing, 

China, pp 1‐3 (8) 

[11] Jack R. Benjamin and associates, INC.  and RPK Structural mechanics consulting, (1994) 

Methodology for Developing Seismic Fragilities, TR‐103959 Research project, California, pp 2‐5, 2‐9,    

2‐25, 2‐32 

[12] Vargas Y F Pujades L G Barbat A H ∙ Hurtado J E,  (2013) Capacity, fragility and damage in 

reinforced concrete buildings: a probabilistic approach, Bull Earthquake Eng (2013) 11:2007–2032DOI 

10.1007/s10518‐013‐9468‐x, p 9 (29)   

39  

[13] Vamvatsikos D. and Cornell C. A, (2002) Incremental Dynamic Analysis, Department of Civil and 

Environmental Engineering, Stanford University, CA 94305‐4020, U.S.A., DOI: 10.1002/eqe.141, pp 4‐

5,12,19 (24)  

 [14] Mulchandani H. K. S.M.ASCE1 and Muthukumar G, Ph.D, (2018) Resilience Based Earthquake 

Design of    Buildings: Current Practice, Problems, and Opportunities in Indian Scenario,  DOI: 

10.1061/9780784482032, Dept. of Civil Engineering, Birla Institute of Technology and Science, Pilani, 

P 8 (10)   

[15] Vigh L G, Lecture note – Methods of Engineering Analysis, Department of Structural engineering, 

Budapest University of Technology and Economics, Budapest, Hungary, pp 12‐19 


Recommended