December 18, 2017 Lori Villanueva, Interim Superintendent Coalinga-Huron Joint Unified School District 657 Sunset Street Coalinga, CA 93210-2927 Dear Superintendent Villanueva, e purpose of this management letter is to provide the findings and recommendations identified by the Fiscal Crisis and Management Assistance Team (FCMAT) following on-site technical assistance provided to the district. e study agreement states that FCMAT will perform the following: 1. Review the district’s 2016-17 general fund budget and develop a multiyear financial projection (MYFP) for the current and two subsequent fiscal years to determine the district’s financial status. Make recommendations for expenditures reductions and/or revenue enhancements to help the district eliminate its budget deficit and maintain financial solvency. Provide a snapshot in time of the current financial status using the district’s 2016-17 second interim report as a baseline. Develop the MYFP as a trend based on certain criteria and assumptions instead of a prediction of exact numbers, focusing on the district’s general fund and including the review and fiscal impact of other funds on the general fund. 2. Provide technical assistance to include: • On-site support and training to the business services department. • On-site work with business services on budget development, monitoring, board presentations of budget information, review of internal controls, processes and procedures for the business office, including recommendations for improvements, if any. FCMAT provided technical assistance from May through September 2017 to the district’s Business Services Department in the areas of budget development and monitoring, board presentations of budget information, review of internal controls, and business office processes and procedures. e assistance included recommendations for improvements.
Transcript
December 18, 2017
Lori Villanueva, Interim SuperintendentCoalinga-Huron Joint Unified School District657 Sunset StreetCoalinga, CA 93210-2927
Dear Superintendent Villanueva,
The purpose of this management letter is to provide the findings and recommendations identified by the Fiscal Crisis and Management Assistance Team (FCMAT) following on-site technical assistance provided to the district.
The study agreement states that FCMAT will perform the following:
1. Review the district’s 2016-17 general fund budget and develop a multiyear financial projection (MYFP) for the current and two subsequent fiscal years to determine the district’s financial status. Make recommendations for expenditures reductions and/or revenue enhancements to help the district eliminate its budget deficit and maintain financial solvency. Provide a snapshot in time of the current financial status using the district’s 2016-17 second interim report as a baseline. Develop the MYFP as a trend based on certain criteria and assumptions instead of a prediction of exact numbers, focusing on the district’s general fund and including the review and fiscal impact of other funds on the general fund.
2. Provide technical assistance to include:
• On-site support and training to the business services department.
• On-site work with business services on budget development, monitoring, board presentations of budget information, review of internal controls, processes and procedures for the business office, including recommendations for improvements, if any.
FCMAT provided technical assistance from May through September 2017 to the district’s Business Services Department in the areas of budget development and monitoring, board presentations of budget information, review of internal controls, and business office processes and procedures. The assistance included recommendations for improvements.
2
Budget and Multiyear Financial ProjectionMultiyear financial projections (MYFPs) help local educational agencies make more informed decisions and forecast the effects of current decisions. Projections are a part of annual budget development and should be evaluated and updated during each interim financial reporting period and before any signif-icant budget adjustments, such as salary increases. When developing and implementing an MYFP, a district’s main objectives are to achieve and sustain a balanced budget, improve academic achievement and maintain local governance.
To evaluate the MYFP, attention is focused on whether the district is deficit spending and whether it is able to meet its reserve requirement in each fiscal year and demonstrate a positive unappropriated fund balance. When the unappropriated fund balance is negative, the deficit balance is the amount by which the budget must be reduced under Assembly Bill (AB) 1200 guidelines. The MYFP should be viewed as a trend based on certain criteria and assumptions rather than as a prediction of exact numbers.
One of the most critical elements of budgeting for expenditures is accurately projecting employee salary and benefit costs. These costs are the largest part of any school district’s budget; in Coalinga-Huron Joint Unified, they are approximately 80% of the unrestricted general fund budget. FCMAT’s review of employee salary projections indicated that district staff do not have an adequate system to estimate the costs of salaries and benefits, and therefore these costs have not been properly allocated in the district’s budget.
Under new leadership, the district has worked with Fresno County Office of Education’s (COE’s) Information Systems and Technology Department to begin implementing the position control module in the COE’s Everest financial software. A reliable position control system is essential for budgeting and monitoring expenditures and for identifying the salary and benefit costs of employees. FCMAT reviewed and evaluated salary and benefit cost estimates projected in the district’s newly implemented position control database for the 2017-18 fiscal year and compared these to payroll reports to determine whether the budgeted amounts are accurate. FCMAT found that many budget accounts were underestimated and did not match the spreadsheet created to account for staff salaries and benefits.
FCMAT’s MYFP indicates that the district is maintaining its required 3% reserve for economic uncer-tainties. However, FCMAT’s MYFP indicates the district has a structural deficit in each reporting period except fiscal year 2019-20. Beginning in fiscal year 2020-21 and continuing for the next 15 years, the district will need to budget for an annual certificate of participation (COP) principal payment of approx-imately $325,000. Without an increase in revenue to offset this payment, the district’s structural deficit will continue.
Following is a summary of FCMAT’s projections for the district’s unrestricted resources.
Multiyear Financial Projection Summary General Fund Unrestricted Resources Only
DescriptionBase Year
2017-18Year 1
2018-19Year 2
2019-20
Total Revenues $44,764,152.60 $45,912,166.60 $47,610,621.60
Total Expenditures $40,477,636.67 $41,455,387.20 $42,006,181.40
Total Other Financing Sources/Uses ($4,728,673.94) ($5,116,329.37) ($5,417,190.66)
Net Increase (Decrease) in Fund Balance ($442,158.01) ($659,549.97) $187,249.54
Subsequent EventsInitially, FCMAT planned to provide a snapshot in time of the district’s financial status using the district’s 2016-17 second interim report as a baseline. However, because of numerous discrepancies between the Human Resources Department data, payroll information, and the budget, the superintendent instructed staff to verify every employee’s position, salary and funding source for fiscal year 2017-18.
The district also chose to use the Fresno COE’s position control module in its financial system. Because of timing issues and errors in vital information for 2016-17, the district determined that using the fiscal year 2017-18 adopted budget as a base year would be more beneficial in assessing its financial position.
Assembly Bill (AB) 1200 OversightIf at any time during the fiscal year a district is unable to meet its financial obligations for the current or two subsequent fiscal years, or has a qualified or negative budget certification, the local county super-intendent of schools is required to notify the district’s governing board and the state superintendent of public instruction (SPI). The county office is required to follow Education Code Section 42127.6 when assisting a school district in this situation, and take all actions necessary to ensure that the district meets its financial obligations. Assistance may include assigning a fiscal expert or fiscal advisor to the district, conducting a study of the district’s financial and budget conditions, and requiring the district to submit a proposal for addressing its fiscal condition. In the case of a district that does not meet its state-prescribed reserve levels, the intent of an MYFP is to help the COE and the district form a plan to regain fiscal solvency and restore the reserve.
The MYFP developed by FCMAT indicates that although the district is able to maintain its reserve requirement in 2017-18 and the two subsequent fiscal years, it continues to have a structural deficit. The district has not been effective in controlling costs or eliminating programs or funds that have not been self-supporting, or in making reductions in departments in which staffing and programs exceed current standards.
The district administration and governing board will need to identify and implement expenditure reductions now; doing so will have a compounding beneficial effect over the multiyear projection period. Taking this action will reduce the need for even larger reductions in future years and maintain the district’s required reserve for economic uncertainties.
Multiyear Financial Projection MethodLocal educational agencies use many different software products to prepare MYFPs. For the district’s MYFP, FCMAT used its web-based Budget Explorer MYFP software, which was designed for California school districts and is available free of charge.
4
Budget Explorer allows school districts to create and update financial projections by communicating with the state’s Standardized Account Code Structure (SACS) software or importing data directly from a district’s financial system. Its comprehensive modeling capabilities allow MYFPs to be produced effi-ciently, accurately and more rapidly than with spreadsheets. Budget Explorer can be used to make more informed budget decisions and include educational goals and objectives in several financial scenarios. The MYFP provided in this document is also available to the district online.
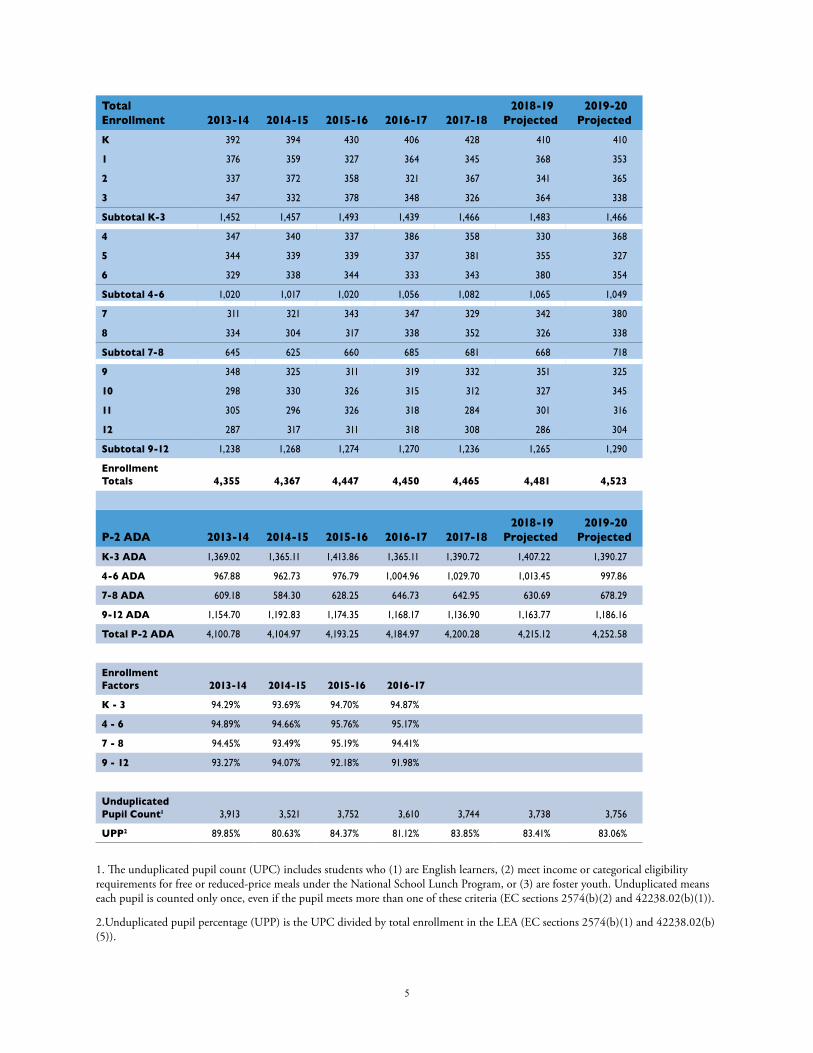
Enrollment and Attendance ProjectionsAccurate tracking and analysis of enrollment and average daily attendance (ADA) are essential compo-nents of budget planning. Because the majority of the district’s funding is based on the total number of student attendance days, monitoring and projecting student enrollment and attendance is crucial. When enrollment and related ADA decline, a district must consider the budgetary effects of the decline on teacher-to-student ratios and plan accordingly. To ensure fiscal solvency, a district must also exercise extreme caution regarding negotiations, staffing and deficit spending. Accurate tracking and analysis of enrollment and ADA can help a district better project future revenues and control staffing expenditures to help maintain fiscal solvency.
To project enrollment, FCMAT used the cohort survival method, which groups students by grade level upon entry and tracks them through each year they stay in school. This method evaluates the longitu-dinal information on the number of students who pass from one grade to the next in the subsequent year. It closely accounts for student retention, dropouts and transfers to and from the district, grade by grade. Although other projection methods are available, the cohort survival method is usually the best choice for school districts because of its sensitivity to incremental changes in several key variables. To project kindergarten enrollment, FCMAT used an average of the past five fiscal years’ enrollment to estimate the incoming enrollments for fiscal years 2018-19 and 2019-20.
The projections for the district’s total unduplicated pupil count were estimated for each fiscal year by taking the sum of the unduplicated pupil percentage for the prior three years and dividing it by three. That percentage was then applied to the total enrollment to get the unduplicated pupil count for the current and two subsequent fiscal years.
FCMAT reviewed the district’s enrollment and ADA trends for 2013-14 through 2016-17, and its 2017 enrollment data. The review compared October California Basic Educational Data System (CBEDS) and California Longitudinal Pupil Achievement Data System (CALPADS) student enrollment counts to the second period principal apportionment (P-2) ADA to determine the average ADA-to-enrollment ratios. However, the district will need to carefully monitor and project enrollment and ADA at each reporting period to ensure the most recent data is included in its budget assumptions.
The results of these attendance calculations were used in FCMAT’s Local Control Funding Formula (LCFF) calculation and MYFP for 2017-18, 2018-19 and 2019-20 and are presented in the table below.
5
Total Enrollment 2013-14 2014-15 2015-16 2016-17 2017-18
1. The unduplicated pupil count (UPC) includes students who (1) are English learners, (2) meet income or categorical eligibility requirements for free or reduced-price meals under the National School Lunch Program, or (3) are foster youth. Unduplicated means each pupil is counted only once, even if the pupil meets more than one of these criteria (EC sections 2574(b)(2) and 42238.02(b)(1)).
2.Unduplicated pupil percentage (UPP) is the UPC divided by total enrollment in the LEA (EC sections 2574(b)(1) and 42238.02(b)(5)).
6
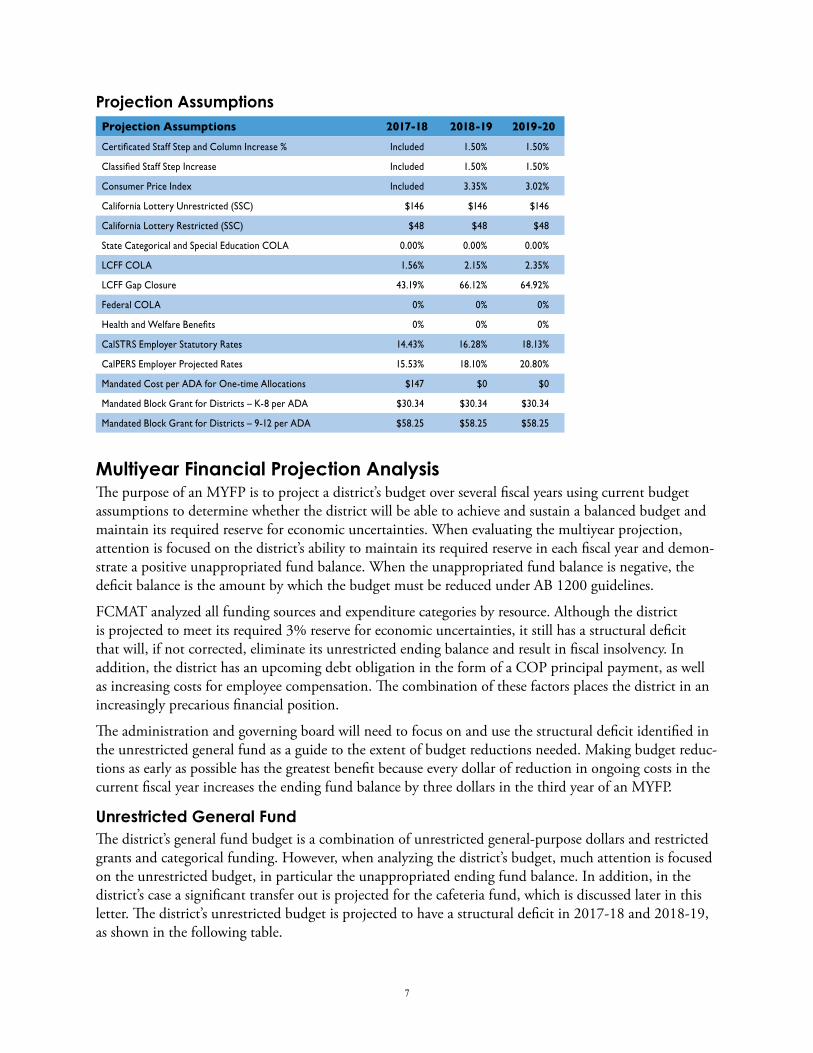
Multiyear Financial Projection AssumptionsThe MYFP prepared by FCMAT uses the district’s 2017-18 adopted budget financial report and corre-sponding SACS data file as the baseline.
FCMAT used budget assumptions based on the 2017-18 State Budget Act, the governor’s 2017-18 budget proposal, School Services of California’s (SSC’s) Financial Projection Dartboard, and the California Department of Finance’s estimates for LCFF funding factors.
To verify the base year (2017-18) for the multiyear projection, FCMAT did the following:
• Reviewed internal and third party support documentation to verify the district’s current year revenue.
• Reviewed the district’s actual year-to-date and prior two years’ revenue and expenditure detail to identify potential adjustments in each resource and major object code of the general fund.
• Compared certificated, classified and management employee salary and benefit information to position control records, payroll database information and the September 2017 payroll report.
In addition, FCMAT used a number of district documents to develop a baseline and future assumptions for the MYFP, including the following:
• Letters from the COE regarding the district’s 2016-17 and 2017-18 adopted budget reports and 2016-17 interim financial reports
• District chart of accounts
• 2016-17 first interim report
• 2016-17 second interim report
• 2017-18 adoption budget report
• 2016-17 unaudited actuals report
• Balance sheet summary reports
• Position control records
• September 2017 payroll reports
• Collective bargaining agreements for all employee groups
• Collective bargaining disclosures
• Long-term debt schedules
• District LCFF calculator spreadsheets
• Enrollment information, including CBEDS and CALPADS data for the current and four prior fiscal years
• Attendance reports for 2013-14 through 2016-17
• Annual independent audit reports for 2014-15 and 2015-16
7
Projection Assumptions Projection Assumptions 2017-18 2018-19 2019-20Certificated Staff Step and Column Increase % Included 1.50% 1.50%
Classified Staff Step Increase Included 1.50% 1.50%
Consumer Price Index Included 3.35% 3.02%
California Lottery Unrestricted (SSC) $146 $146 $146
California Lottery Restricted (SSC) $48 $48 $48
State Categorical and Special Education COLA 0.00% 0.00% 0.00%
Mandated Cost per ADA for One-time Allocations $147 $0 $0
Mandated Block Grant for Districts – K-8 per ADA $30.34 $30.34 $30.34
Mandated Block Grant for Districts – 9-12 per ADA $58.25 $58.25 $58.25
Multiyear Financial Projection AnalysisThe purpose of an MYFP is to project a district’s budget over several fiscal years using current budget assumptions to determine whether the district will be able to achieve and sustain a balanced budget and maintain its required reserve for economic uncertainties. When evaluating the multiyear projection, attention is focused on the district’s ability to maintain its required reserve in each fiscal year and demon-strate a positive unappropriated fund balance. When the unappropriated fund balance is negative, the deficit balance is the amount by which the budget must be reduced under AB 1200 guidelines.
FCMAT analyzed all funding sources and expenditure categories by resource. Although the district is projected to meet its required 3% reserve for economic uncertainties, it still has a structural deficit that will, if not corrected, eliminate its unrestricted ending balance and result in fiscal insolvency. In addition, the district has an upcoming debt obligation in the form of a COP principal payment, as well as increasing costs for employee compensation. The combination of these factors places the district in an increasingly precarious financial position.
The administration and governing board will need to focus on and use the structural deficit identified in the unrestricted general fund as a guide to the extent of budget reductions needed. Making budget reduc-tions as early as possible has the greatest benefit because every dollar of reduction in ongoing costs in the current fiscal year increases the ending fund balance by three dollars in the third year of an MYFP.
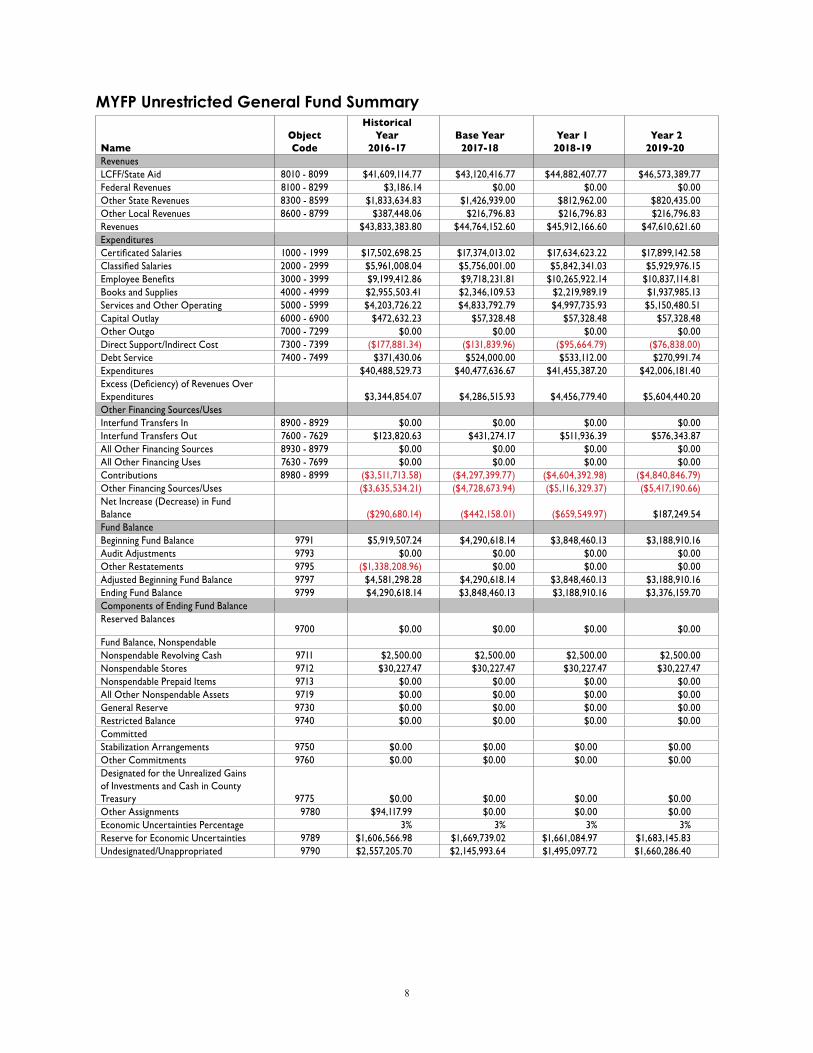
Unrestricted General FundThe district’s general fund budget is a combination of unrestricted general-purpose dollars and restricted grants and categorical funding. However, when analyzing the district’s budget, much attention is focused on the unrestricted budget, in particular the unappropriated ending fund balance. In addition, in the district’s case a significant transfer out is projected for the cafeteria fund, which is discussed later in this letter. The district’s unrestricted budget is projected to have a structural deficit in 2017-18 and 2018-19, as shown in the following table.
8
MYFP Unrestricted General Fund Summary
NameObject Code
Historical Year
2016-17Base Year
2017-18Year 1
2018-19 Year 2 2019-20
Revenues LCFF/State Aid 8010 - 8099 $41,609,114.77 $43,120,416.77 $44,882,407.77 $46,573,389.77 Federal Revenues 8100 - 8299 $3,186.14 $0.00 $0.00 $0.00 Other State Revenues 8300 - 8599 $1,833,634.83 $1,426,939.00 $812,962.00 $820,435.00 Other Local Revenues 8600 - 8799 $387,448.06 $216,796.83 $216,796.83 $216,796.83 Revenues $43,833,383.80 $44,764,152.60 $45,912,166.60 $47,610,621.60 Expenditures Certificated Salaries 1000 - 1999 $17,502,698.25 $17,374,013.02 $17,634,623.22 $17,899,142.58 Classified Salaries 2000 - 2999 $5,961,008.04 $5,756,001.00 $5,842,341.03 $5,929,976.15 Employee Benefits 3000 - 3999 $9,199,412.86 $9,718,231.81 $10,265,922.14 $10,837,114.81 Books and Supplies 4000 - 4999 $2,955,503.41 $2,346,109.53 $2,219,989.19 $1,937,985.13 Services and Other Operating 5000 - 5999 $4,203,726.22 $4,833,792.79 $4,997,735.93 $5,150,480.51 Capital Outlay 6000 - 6900 $472,632.23 $57,328.48 $57,328.48 $57,328.48 Other Outgo 7000 - 7299 $0.00 $0.00 $0.00 $0.00 Direct Support/Indirect Cost 7300 - 7399 ($177,881.34) ($131,839.96) ($95,664.79) ($76,838.00)Debt Service 7400 - 7499 $371,430.06 $524,000.00 $533,112.00 $270,991.74 Expenditures $40,488,529.73 $40,477,636.67 $41,455,387.20 $42,006,181.40 Excess (Deficiency) of Revenues Over Expenditures $3,344,854.07 $4,286,515.93 $4,456,779.40 $5,604,440.20 Other Financing Sources/Uses Interfund Transfers In 8900 - 8929 $0.00 $0.00 $0.00 $0.00 Interfund Transfers Out 7600 - 7629 $123,820.63 $431,274.17 $511,936.39 $576,343.87 All Other Financing Sources 8930 - 8979 $0.00 $0.00 $0.00 $0.00 All Other Financing Uses 7630 - 7699 $0.00 $0.00 $0.00 $0.00 Contributions 8980 - 8999 ($3,511,713.58) ($4,297,399.77) ($4,604,392.98) ($4,840,846.79)Other Financing Sources/Uses ($3,635,534.21) ($4,728,673.94) ($5,116,329.37) ($5,417,190.66)Net Increase (Decrease) in Fund Balance ($290,680.14) ($442,158.01) ($659,549.97) $187,249.54 Fund Balance Beginning Fund Balance 9791 $5,919,507.24 $4,290,618.14 $3,848,460.13 $3,188,910.16 Audit Adjustments 9793 $0.00 $0.00 $0.00 $0.00 Other Restatements 9795 ($1,338,208.96) $0.00 $0.00 $0.00 Adjusted Beginning Fund Balance 9797 $4,581,298.28 $4,290,618.14 $3,848,460.13 $3,188,910.16 Ending Fund Balance 9799 $4,290,618.14 $3,848,460.13 $3,188,910.16 $3,376,159.70 Components of Ending Fund Balance Reserved Balances
9700 $0.00 $0.00 $0.00 $0.00 Fund Balance, Nonspendable Nonspendable Revolving Cash 9711 $2,500.00 $2,500.00 $2,500.00 $2,500.00 Nonspendable Stores 9712 $30,227.47 $30,227.47 $30,227.47 $30,227.47 Nonspendable Prepaid Items 9713 $0.00 $0.00 $0.00 $0.00 All Other Nonspendable Assets 9719 $0.00 $0.00 $0.00 $0.00 General Reserve 9730 $0.00 $0.00 $0.00 $0.00 Restricted Balance 9740 $0.00 $0.00 $0.00 $0.00 Committed Stabilization Arrangements 9750 $0.00 $0.00 $0.00 $0.00 Other Commitments 9760 $0.00 $0.00 $0.00 $0.00 Designated for the Unrealized Gains of Investments and Cash in County Treasury 9775 $0.00 $0.00 $0.00 $0.00 Other Assignments 9780 $94,117.99 $0.00 $0.00 $0.00 Economic Uncertainties Percentage 3% 3% 3% 3%Reserve for Economic Uncertainties 9789 $1,606,566.98 $1,669,739.02 $1,661,084.97 $1,683,145.83 Undesignated/Unappropriated 9790 $2,557,205.70 $2,145,993.64 $1,495,097.72 $1,660,286.40
9
Restricted General FundThe district has approximately 25 federal and state programs that use restricted funding. Not including the routine restricted maintenance account (RRMA), six programs require a contribution from the district’s unrestricted general fund in the budget and/or projection years. The table below shows the programs that are projected to require a contribution.
Contributions
NameResource
CodeBase Year
2017-18Year 1
2018-19Year 2
2019-20Unrestricted Resources
Unrestricted General Fund 00000 ($4,297,399.77) ($4,604,392.98) ($4,840,846.79)
Total Unrestricted ($4,297,399.77) ($4,604,392.98) ($4,840,846.79)
Restricted Resources
NCLB: Title I, Part C, Migrant Ed (Regular and Summer Program) 30600 $1,000.15 $2,523.94
Spec Ed: IDEA Basic Local Assistance Entitlement, Part B, Sec 611 33100 $330,157.64 $422,809.23 $469,879.44
NCLB: Title III, Limited English Proficient (LEP) Student Program 42030 $66,720.85 $102,453.17 $111,306.11
Career Technical Education Incentive Grant Program 63870 $0.00 $0.00 $7,595.20
Special Education 65000 $2,340,281.80 $2,448,415.56 $2,557,352.47
Other Restricted Resources 90100 $0.00 $0.00 $710.86
Total Restricted $4,297,399.77 $4,604,392.98 $4,840,846.79
Balance $0.00 $0.00 $0.00
The district will need to continue to review all contributions from its unrestricted general fund and ensure that restricted programs are self-sustaining. The only exceptions should be the routine restricted maintenance account and special education. Special education typically receives insufficient state and federal funding, and restricted maintenance receives no specific state and federal funding.
Providing funding for services to special education students is an ongoing challenge for school districts statewide. Districts are faced with increasing differences between federal and state government funding and the mandated costs for these essential student services. Neither state nor federal funding is designed to support a standalone program; they supplement the general education program. Therefore, the combined state and federal financial resources are insufficient to cover even the most efficient special education programs. Local districts must transfer funding from their unrestricted general funds, dollars generated by all students, to pay for the portion of special education costs that exceeds program revenues.
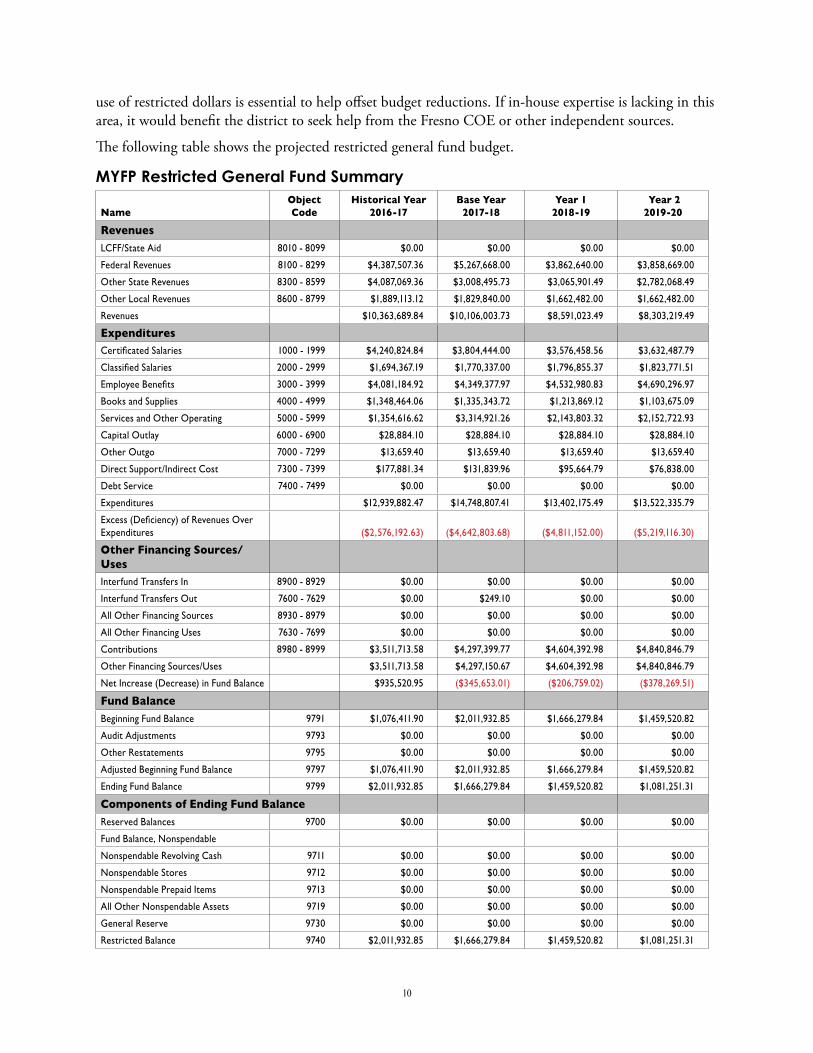
Although the district has a structural deficit in its unrestricted general fund, the district carried over a little more than $2 million in its restricted general fund last year. Categorical funds are intended to provide resources for additional support services to students, so this large carryover amount indicates that the district may not have maximized the use of these dollars. Careful analysis and planning regarding the
10
use of restricted dollars is essential to help offset budget reductions. If in-house expertise is lacking in this area, it would benefit the district to seek help from the Fresno COE or other independent sources.
The following table shows the projected restricted general fund budget.
MYFP Restricted General Fund Summary
NameObject Code
Historical Year 2016-17
Base Year 2017-18
Year 1 2018-19
Year 2 2019-20
Revenues LCFF/State Aid 8010 - 8099 $0.00 $0.00 $0.00 $0.00
Federal Revenues 8100 - 8299 $4,387,507.36 $5,267,668.00 $3,862,640.00 $3,858,669.00
Other State Revenues 8300 - 8599 $4,087,069.36 $3,008,495.73 $3,065,901.49 $2,782,068.49
Other Local Revenues 8600 - 8799 $1,889,113.12 $1,829,840.00 $1,662,482.00 $1,662,482.00
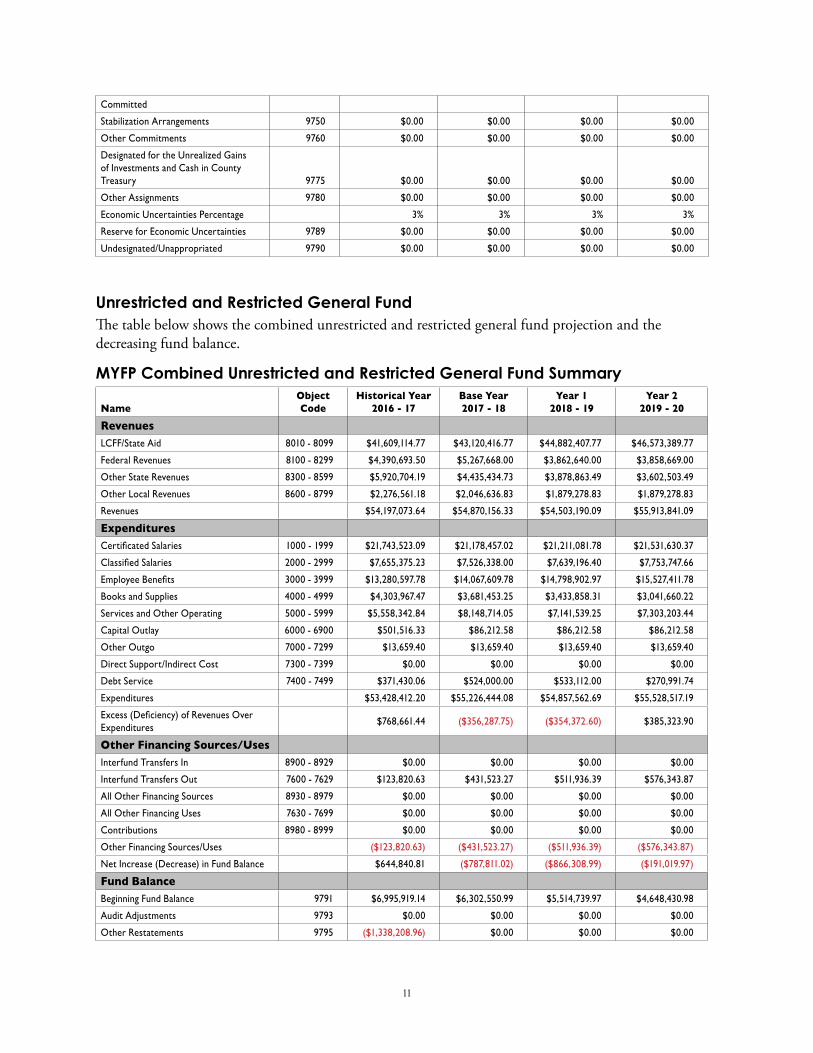
Unrestricted and Restricted General FundThe table below shows the combined unrestricted and restricted general fund projection and the decreasing fund balance.
MYFP Combined Unrestricted and Restricted General Fund Summary
NameObject Code
Historical Year 2016 - 17
Base Year 2017 - 18
Year 1 2018 - 19
Year 2 2019 - 20
Revenues LCFF/State Aid 8010 - 8099 $41,609,114.77 $43,120,416.77 $44,882,407.77 $46,573,389.77
Federal Revenues 8100 - 8299 $4,390,693.50 $5,267,668.00 $3,862,640.00 $3,858,669.00
Other State Revenues 8300 - 8599 $5,920,704.19 $4,435,434.73 $3,878,863.49 $3,602,503.49
Other Local Revenues 8600 - 8799 $2,276,561.18 $2,046,636.83 $1,879,278.83 $1,879,278.83
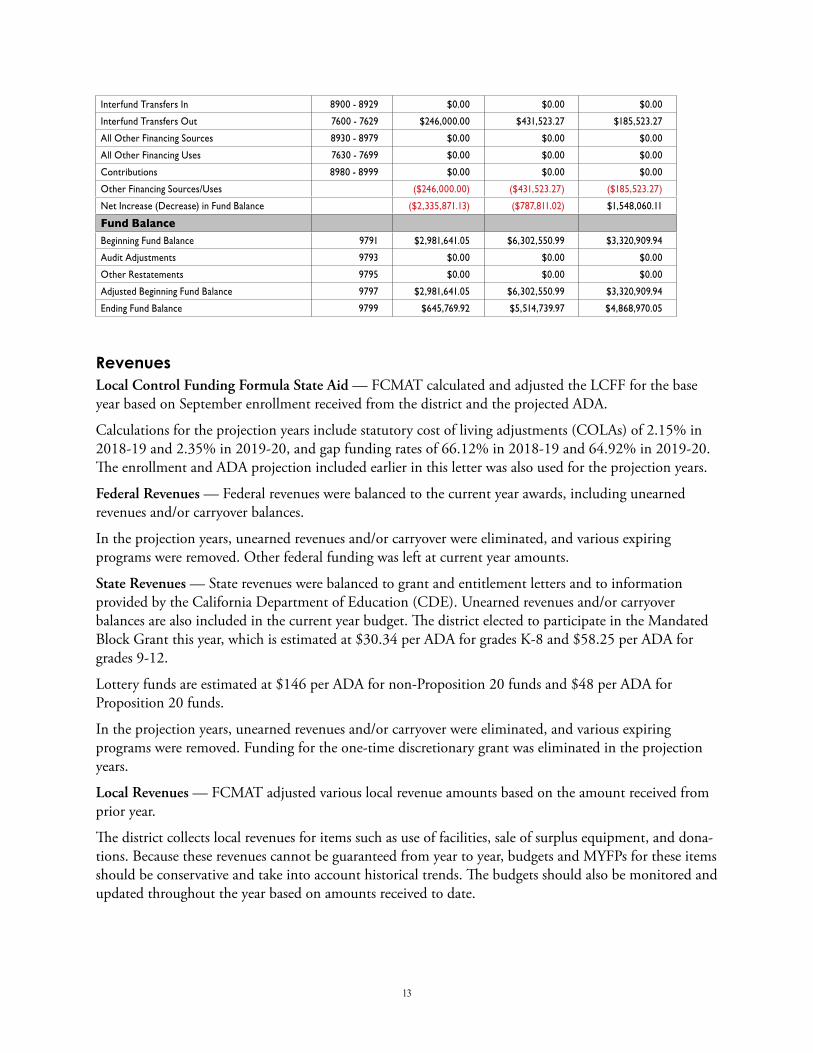
Adjustment AnalysisThe following table and narrative show the differences between the district’s 2017-18 adopted budget and FCMAT’s analysis. The narrative also includes details regarding the assumptions used in the projection years.
Name Object Code
District Adopted
2017-18 Budget
FCMAT Analysis 2017-18 Differences
Revenues LCFF/State Aid 8010 - 8099 $42,735,868.00 $43,120,416.77 $384,548.77
Federal Revenues 8100 - 8299 $4,254,144.00 $5,267,668.00 $1,013,524.00
Other State Revenues 8300 - 8599 $1,423,128.00 $4,435,434.73 $3,012,306.73
Other Local Revenues 8600 - 8799 $1,822,536.00 $2,046,636.83 $224,100.83
Interfund Transfers In 8900 - 8929 $0.00 $0.00 $0.00
Interfund Transfers Out 7600 - 7629 $246,000.00 $431,523.27 $185,523.27
All Other Financing Sources 8930 - 8979 $0.00 $0.00 $0.00
All Other Financing Uses 7630 - 7699 $0.00 $0.00 $0.00
Contributions 8980 - 8999 $0.00 $0.00 $0.00
Other Financing Sources/Uses ($246,000.00) ($431,523.27) ($185,523.27)
Net Increase (Decrease) in Fund Balance ($2,335,871.13) ($787,811.02) $1,548,060.11
Fund Balance Beginning Fund Balance 9791 $2,981,641.05 $6,302,550.99 $3,320,909.94
Audit Adjustments 9793 $0.00 $0.00 $0.00
Other Restatements 9795 $0.00 $0.00 $0.00
Adjusted Beginning Fund Balance 9797 $2,981,641.05 $6,302,550.99 $3,320,909.94
Ending Fund Balance 9799 $645,769.92 $5,514,739.97 $4,868,970.05
RevenuesLocal Control Funding Formula State Aid — FCMAT calculated and adjusted the LCFF for the base year based on September enrollment received from the district and the projected ADA.
Calculations for the projection years include statutory cost of living adjustments (COLAs) of 2.15% in 2018-19 and 2.35% in 2019-20, and gap funding rates of 66.12% in 2018-19 and 64.92% in 2019-20. The enrollment and ADA projection included earlier in this letter was also used for the projection years.
Federal Revenues — Federal revenues were balanced to the current year awards, including unearned revenues and/or carryover balances.
In the projection years, unearned revenues and/or carryover were eliminated, and various expiring programs were removed. Other federal funding was left at current year amounts.
State Revenues — State revenues were balanced to grant and entitlement letters and to information provided by the California Department of Education (CDE). Unearned revenues and/or carryover balances are also included in the current year budget. The district elected to participate in the Mandated Block Grant this year, which is estimated at $30.34 per ADA for grades K-8 and $58.25 per ADA for grades 9-12.
Lottery funds are estimated at $146 per ADA for non-Proposition 20 funds and $48 per ADA for Proposition 20 funds.
In the projection years, unearned revenues and/or carryover were eliminated, and various expiring programs were removed. Funding for the one-time discretionary grant was eliminated in the projection years.
Local Revenues — FCMAT adjusted various local revenue amounts based on the amount received from prior year.
The district collects local revenues for items such as use of facilities, sale of surplus equipment, and dona-tions. Because these revenues cannot be guaranteed from year to year, budgets and MYFPs for these items should be conservative and take into account historical trends. The budgets should also be monitored and updated throughout the year based on amounts received to date.
14
ExpendituresCertificated Salaries — Salary accounts were estimated based on the new position control data and then compared with the payroll system. The accounts were also reconciled with the September payroll report.
The FCMAT MYFP includes ongoing step and/or column costs of 1.5% each year.
Classified Salaries — Salary accounts were estimated based on the new position control data and then compared with the payroll system. The accounts were also reconciled with the September payroll report.
The FCMAT MYFP includes ongoing step costs of 1.5% each year.
Employee Benefits — Benefit accounts were estimated based on various percentages that drive the required statutory benefits.
The FCMAT MYFP includes a cap of $14,500 for health and welfare benefits beginning in 2017-18 based on the district’s negotiated agreements with its employee groups.
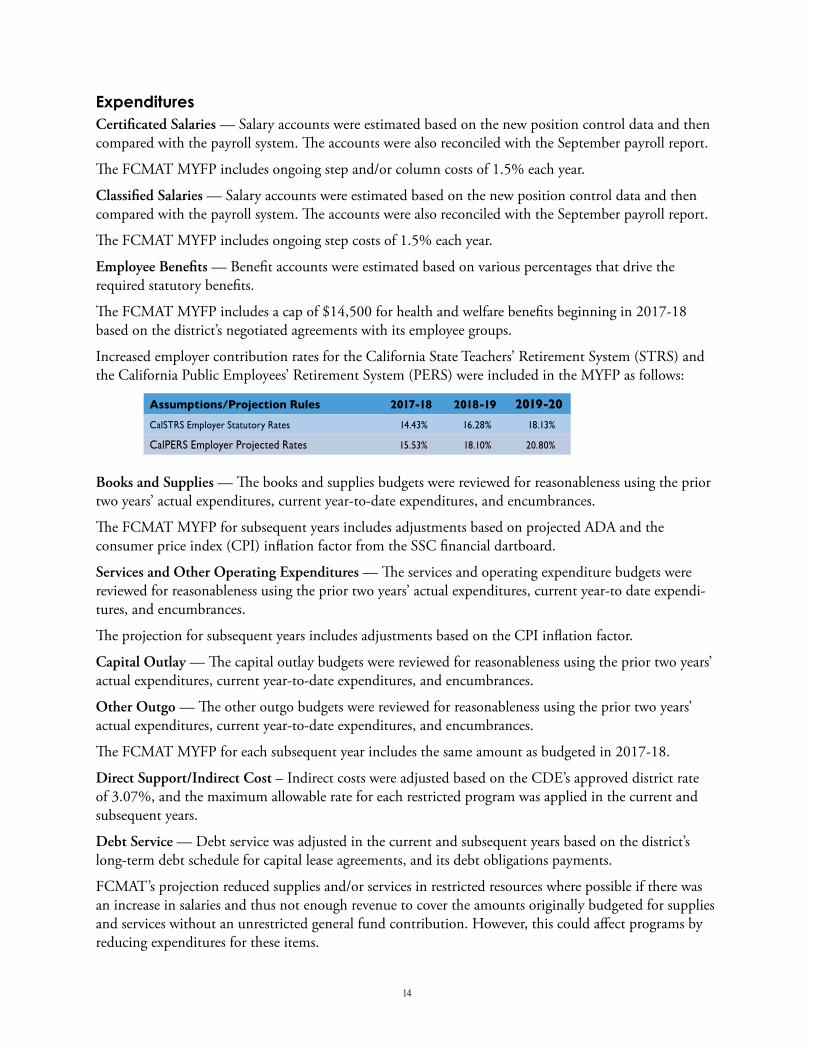
Increased employer contribution rates for the California State Teachers’ Retirement System (STRS) and the California Public Employees’ Retirement System (PERS) were included in the MYFP as follows:
Books and Supplies — The books and supplies budgets were reviewed for reasonableness using the prior two years’ actual expenditures, current year-to-date expenditures, and encumbrances.
The FCMAT MYFP for subsequent years includes adjustments based on projected ADA and the consumer price index (CPI) inflation factor from the SSC financial dartboard.
Services and Other Operating Expenditures — The services and operating expenditure budgets were reviewed for reasonableness using the prior two years’ actual expenditures, current year-to date expendi-tures, and encumbrances.
The projection for subsequent years includes adjustments based on the CPI inflation factor.
Capital Outlay — The capital outlay budgets were reviewed for reasonableness using the prior two years’ actual expenditures, current year-to-date expenditures, and encumbrances.
Other Outgo — The other outgo budgets were reviewed for reasonableness using the prior two years’ actual expenditures, current year-to-date expenditures, and encumbrances.
The FCMAT MYFP for each subsequent year includes the same amount as budgeted in 2017-18.
Direct Support/Indirect Cost – Indirect costs were adjusted based on the CDE’s approved district rate of 3.07%, and the maximum allowable rate for each restricted program was applied in the current and subsequent years.
Debt Service — Debt service was adjusted in the current and subsequent years based on the district’s long-term debt schedule for capital lease agreements, and its debt obligations payments.
FCMAT’s projection reduced supplies and/or services in restricted resources where possible if there was an increase in salaries and thus not enough revenue to cover the amounts originally budgeted for supplies and services without an unrestricted general fund contribution. However, this could affect programs by reducing expenditures for these items.
15
Budget MonitoringIt is best practice to monitor budges regularly during the fiscal year to ensure appropriations are not over-spent and revenues received or expenditures made are not materially different than budgeted. The district makes many budget revisions during the fiscal year, but does so reactively as information develops, typically because of increases in either income or expenditures, budgeting of unearned revenues or carry-over balances, or increases in expenditures such that they exceed budgeted amounts. Revisions to major expenditure classifications are subject to board approval according to Education Code Section 42600.
FCMAT’s review of the district’s 2016-17 budget indicates that it has not been properly monitored, reviewed or updated in a timely manner. For example, categorical programs did not reflect accurate revenues, nor did they include the correct amounts for prior years’ carryover balances or unearned revenues. Expenditure accounts were not updated to accurately capture approved expenditures, so actual expenditures exceeded budget amounts, which in turn caused large variances in the 2016-17 unaudited actuals. The district will need to monitor and update its budget regularly to decrease the variance between budgeted and actual expenses at year-end closing. This will increase its credibility with local employee associations, the community, and the governing board.
The business office does not include a monthly budget-to-actual summary report for review by the governing board. Doing so would help the board and the community understand that the budget constantly changes and the reasons for variances, as well as counter the perception that budget changes occur only at interim reporting time. Budget adjustments and communication about how they affect the district must be frequent, ongoing and public. It is common for people to remember the last thing they heard, so it is imperative that news about budget adjustments and how they affect fund balance, either negatively or positively, be repeated on a continuing basis.
The Standardized Account Code Structure (SACS) specifies a uniform, comprehensive list of accounts that all school districts statewide must use for their financial data collection and reporting. District staff lack a clear understanding of the uniform financial reporting format. SACS has optional codes that can be used to create more detailed reports, and the district has chosen to use some of these to align with various expenditure plans. However, expenditures are not processed using these optional codes, so staff must constantly make journal entries to accurately record expenditures. A more effective approach would be to communicate the account code changes to staff and confirm that expenditures are properly coded before processing payments.
General LedgerThe district’s financial activity for numerous programs has not been accurately reported. A review of the district’s general ledger revealed negative beginning balances in various resources because of improper closing of the 2015-16 unaudited actuals. In addition, federal programs were not properly adjusted to show unearned revenue. Further review of the balance sheet accounts revealed that they were not being reconciled at least annually, causing many of them to have debit beginning balances when in fact they should have had credit balances. Because of this, the district had a restatement in the amount of $1,338,209 in fiscal year 2016-17. The majority of the restatement was to the health and welfare liability account to bring it into compliance with language in the contract with the Coalinga-Huron Joint Unified Teachers Association; another significant portion was to the workers’ compensation liability account because vendor payments for expenditures had been improperly paid from this account, resulting in understated expenditures in fiscal year 2015-16.
16
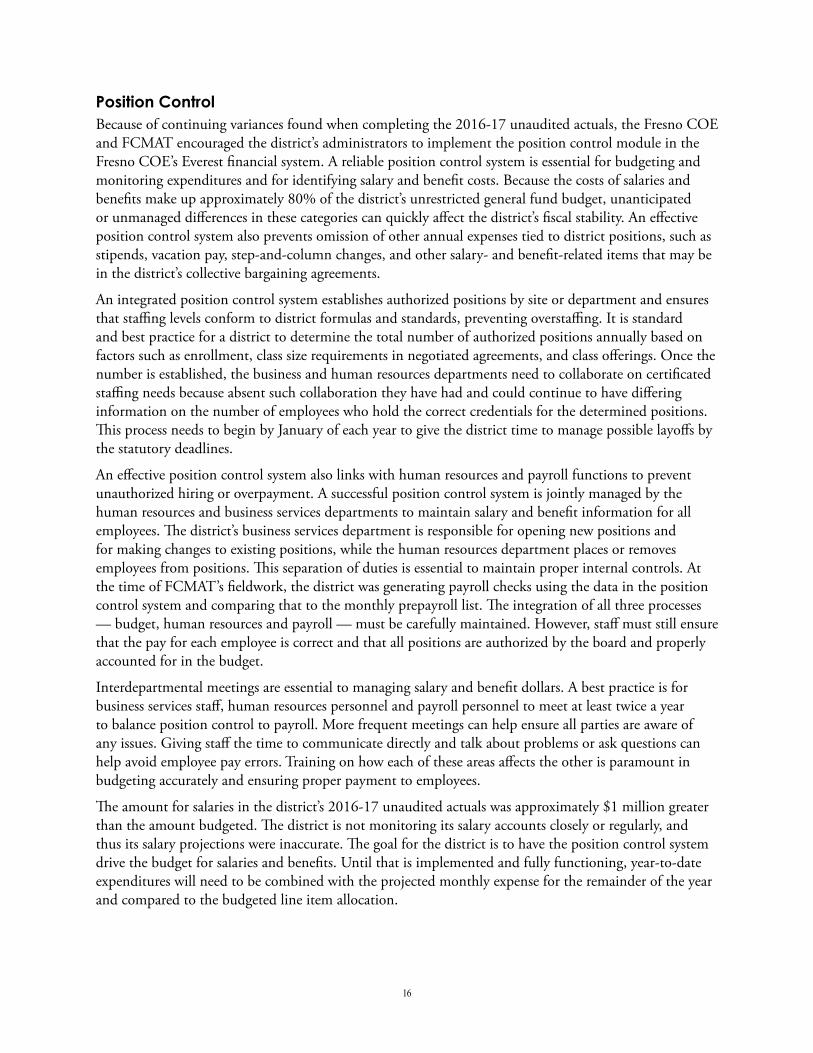
Position ControlBecause of continuing variances found when completing the 2016-17 unaudited actuals, the Fresno COE and FCMAT encouraged the district’s administrators to implement the position control module in the Fresno COE’s Everest financial system. A reliable position control system is essential for budgeting and monitoring expenditures and for identifying salary and benefit costs. Because the costs of salaries and benefits make up approximately 80% of the district’s unrestricted general fund budget, unanticipated or unmanaged differences in these categories can quickly affect the district’s fiscal stability. An effective position control system also prevents omission of other annual expenses tied to district positions, such as stipends, vacation pay, step-and-column changes, and other salary- and benefit-related items that may be in the district’s collective bargaining agreements.
An integrated position control system establishes authorized positions by site or department and ensures that staffing levels conform to district formulas and standards, preventing overstaffing. It is standard and best practice for a district to determine the total number of authorized positions annually based on factors such as enrollment, class size requirements in negotiated agreements, and class offerings. Once the number is established, the business and human resources departments need to collaborate on certificated staffing needs because absent such collaboration they have had and could continue to have differing information on the number of employees who hold the correct credentials for the determined positions. This process needs to begin by January of each year to give the district time to manage possible layoffs by the statutory deadlines.
An effective position control system also links with human resources and payroll functions to prevent unauthorized hiring or overpayment. A successful position control system is jointly managed by the human resources and business services departments to maintain salary and benefit information for all employees. The district’s business services department is responsible for opening new positions and for making changes to existing positions, while the human resources department places or removes employees from positions. This separation of duties is essential to maintain proper internal controls. At the time of FCMAT’s fieldwork, the district was generating payroll checks using the data in the position control system and comparing that to the monthly prepayroll list. The integration of all three processes — budget, human resources and payroll — must be carefully maintained. However, staff must still ensure that the pay for each employee is correct and that all positions are authorized by the board and properly accounted for in the budget.
Interdepartmental meetings are essential to managing salary and benefit dollars. A best practice is for business services staff, human resources personnel and payroll personnel to meet at least twice a year to balance position control to payroll. More frequent meetings can help ensure all parties are aware of any issues. Giving staff the time to communicate directly and talk about problems or ask questions can help avoid employee pay errors. Training on how each of these areas affects the other is paramount in budgeting accurately and ensuring proper payment to employees.
The amount for salaries in the district’s 2016-17 unaudited actuals was approximately $1 million greater than the amount budgeted. The district is not monitoring its salary accounts closely or regularly, and thus its salary projections were inaccurate. The goal for the district is to have the position control system drive the budget for salaries and benefits. Until that is implemented and fully functioning, year-to-date expenditures will need to be combined with the projected monthly expense for the remainder of the year and compared to the budgeted line item allocation.
17
Career Technical Education The district received $343,901 in career technical education (CTE) incentive grant funding for the 2015-16 fiscal year, which was carried forward to the 2016-17 fiscal year. In fiscal year 2017-18 the district is using the 2016-17 grant amount of $285,574. This is a three-year grant program; however, funding for 2017-18 has not yet been awarded, so FCMAT used the 2016-17 amount for fiscal year 2018-19 in its MYFP. The purpose of this program is to encourage development of new CTE programs and maintain and enhance current CTE programs during implementation of the LCFF pursuant to California Education Code Section 42238.02.
The district did not initially direct the 2015-16 CTE funding to ongoing salary and benefit costs of the CTE program; rather, these funds were budgeted for supplies and services, including consulting services for various programs. Because of the district’s financial situation, administrators chose to allocate unspent dollars during 2016-17 year-end close to cover salaries and benefits for staff who taught the various CTE programs, while still ensuring that the district exceeded the requirement that it match the grant funding amount (see the following paragraph for exact matching requirements). For fiscal year 2017-18, FCMAT’s budget analysis left allocations for this resource budgeted to a specified certificated staff member and left the prior year amounts in object codes 4XXX-7XXX in the 2017-18 budget. After this, a small amount remained unallocated and fell to the fund balance. Because there is one more year of anticipated funding, fiscal year 2018-19 is budgeted identical to the current fiscal year in FCMAT’s MYFP.
The CTE program requires matching funds in the following ratios, respectively, in each fiscal year of the projection: 1-to-1, 1.5-to-1 and 2-to-1. If the district is awarded $343,901 each year, it would have to spend matching funds totaling at least $343,901, $515,852 and $687,802 on the program, respectively, each year. The district budgeted $1,075,265 in 2016-17 for the CTE program; this significantly exceeds program funding and required matching amounts. This problem is compounded by the fact that the funding sources do not continue after the third year. The district must carefully monitor the program expenditures to ensure it accounts for all expenditures and complies with funding requirements, and at the same time carefully avoid overspending that will increase dependency on the unrestricted general fund. In addition, the district will need to identify a new funding source for the program or reduce and/or eliminate programs once the grant funding expires.
Other FundsIn addition to analyzing the general fund, FCMAT completed a review of the district’s 2016-17 unaudited actuals and its 2017-18 adopted budget report for other funds. FCMAT’s review found the following:
• The cafeteria fund shows that expenses exceeded revenues in 2016-17 and are projected to do so again in 2017-18; this has necessitated ongoing contributions from the unrestricted general fund. To reverse this trend and restore and maintain financial solvency, the district will need to seek ways to reduce expenses and/or increase revenue.
• The district is using its special reserve fund for other than capital outlay projects to make up for the deficit in the general fund; however, this is a one-time source of revenue, and continued transfers out would ultimately deplete this resource.
• The district is also using its special reserve fund for postemployment benefits to compensate for the deficit in the general fund because the amount needed at the time of the adopted budget, even with the special reserve fund mentioned above, was not sufficient to meet the required 3%
18
reserve for economic uncertainty. The board approved a resolution for current year only to allow staff to transfer these dollars into the special reserve fund for other than capital outlay so the district would have sufficient funds to meet the reserve requirement.
Revenue Increases and Expenditure Reductions Many districts freeze spending during difficult financial situations. The key to implementing a spending freeze is to do so immediately and without exception for unrestricted general fund expenditures, excluding health and safety issues. Spending of restricted program funding may need to continue because many resources include deadlines by which all funds must be expended or returned to grantor.
In addition, implementing purchase order (PO) cut-off dates can help reduce spending and make it easier to estimate the ending fund balances and reserves. The PO cut-off dates should include all expenditures from all funding sources and should be early enough in the year (normally in March and April) that a thorough review of each resource can be made to ensure that all restricted resource expenditure deadlines are met. It would benefit the district to consider implementing spending freezes and/or PO cut-off dates each year.
As detailed above, the district needs to carefully monitor its CTE program expenditures to avoid over-spending that increases dependency on the unrestricted general fund, and it needs to either identify a new funding source for the program or reduce or eliminate programs once funding expires.
FCMAT’s review of reports from the district’s financial system revealed that the district is not charging the maximum allowable indirect cost rate to all programs, including programs that require a contribution from the unrestricted general fund, such as special education and the cafeteria fund. The district needs to calculate and charge the full indirect cost rate to all allowable restricted programs to show the true cost of each program and maximize unrestricted resources.
Because staffing costs account for the majority of the district’s budgeted expenditures, it is impossible to make significant budget or expenditure reductions without affecting staffing. As indicated during FCMAT’s fieldwork, the district will need to analyze staffing levels for all departments and compare them to industry standards.
RecommendationsThe district should:
1. Adopt a budget and MYFPs that eliminate the structural deficit to prevent future fiscal insolvency.
2. Ensure that MYFPs are kept up to date and that the projections are accurate and based on the most current budget assumptions.
3. Monitor and project student enrollment and ADA at each reporting period to ensure that the most recent data is included in the budget assumptions.
4. Compare unduplicated pupil counts and enrollment numbers reported by the CDE at each reporting period to ensure they agree with the district’s CALPADS totals.
5. Update revenue budgets throughout the year to ensure they match information provided by CDE and award letters.
19
6. Recognize unearned revenue in the current year budget upon completion of the prior year unaudited actuals, and ensure that unearned revenue is not included in the subsequent two years of the MYFP.
7. Be conservative when budgeting amounts for local revenue, and update the budget throughout the year as needed to account for year-to-date receipts.
8. Review contributions to restricted programs and ensure that these programs are self-sustaining, except for restricted maintenance and special education.
9. Review contributions to other funds and ensure that the other funds are self-sus-taining.
10. Relay all current budget information to its governing board, bargaining units, and community.
11. Review all budgets monthly to help prevent variances between budgeted and actual expenses at year-end closing.
12. Prepare a monthly budget-to-actual summary report for all funds and present it at a regular board meeting.
13. Continually report at board meetings the need for and causes of budget adjustments and how they affect the ending fund balance.
14. Continually review and monitor certificated staff assignments and class sizes, and classified staffing and assignments, to ensure staffing levels are appropriate and cost effective.
15. Schedule and hold interdepartmental meetings twice a year to reconcile position control information with site and department staff lists and to payroll.
16. Train business office, human resources, payroll and school site staff on how their work affects other functions in both their own and one another’s departments.
17. Ensure that all staff members have the opportunity for professional development relevant to their respective positions and duties.
18. Make a plan to use restricted dollars in the year they are received. If in-house staff are unsure how to spend the dollars, seek help from the Fresno COE or other indepen-dent sources.
19. Confirm that expenditures are properly coded before processing payments.
20. Review the general ledger accounts at least annually.
21. Ensure that position control functions are properly assigned.
22. Monitor the CTE grant regularly and make adjustments as needed.
23. Ensure that all programs are charged the maximum allowable indirect cost rate.
20
FCMAT appreciates the opportunity to serve the Coalinga-Huron Joint Unified School District and extends thanks to its staff for their cooperation and assistance during this review.