103
2016-2018 OPERATING BUDGET As Approved at December 3, 2015

2016-2018
OPERATING BUDGET
As Approved at December 3, 2015

The Government Finance Officers Association of the United States and Canada (GFOA) presented a Distinguished Budget Presentation Award to the City of Edmonton, Alberta for its annual budget for the fiscal year beginning January 1, 2015.
In order to receive this award, a governmental unit must publish a budget document that meets program criteria as a policy document, as a financial plan, as an operations guide, and as a communications device.
This award is valid for a period of one year only. We believe our current budget continues to conform to program requirements, and we are submitting it to GFOA to determine its eligibility for another award.
On behalf of City Council, I am pleased to present the City of Edmonton’s 2016-18 Operating Budget. While the priority of this budget was a restraint on spending, City Council remained mindful of our need to maintain the programs, services and infrastructure Edmontonians expect and deserve. We understand the financial stress many Edmonton households and businesses are facing and tried to find a fair balance. It was at times a difficult journey but, in the end, I believe we did achieve this balance. By supporting a motion to fund the neighbourhood renewal program through grants and savings, Council showed it was willing to be creative about where we could find large-scale savings and deliver the tax relief Edmontonians were looking for. Through this single motion, Council was able to shave 1.5 per cent from the proposed tax increase for the next two years. In many ways, this budget was part of a broader discussion about what programs and services are the responsibility of the City of Edmonton and what should be uploaded back to other orders of government. In too many instances, municipalities like Edmonton are taking on more than we should when it comes to areas of provincial and federal responsibility, like
affordable housing. To be sure, City Council remains strongly committed to supporting affordable housing projects in Edmonton. Without initiatives like the Housing First Program, we wouldn’t have been able to house over 5,000 homeless people since 2009. However, ensuring that a high concentration of the most vulnerable Albertans have proper shelter should not and cannot be the sole responsibility of Edmonton property taxpayers. Council also demonstrated restraint by staying within the $10 million available through efficiency and innovation efforts within the administration. It may have been easier, and perhaps more popular with many citizens, to fund more programs and initiatives, but we all recognized this was not the right time to do so. By staying within our means, we didn’t have to raise taxes further and yet we were able to still fund things like gender-based violence prevention, improved maintenance of our sports fields and the early stages of our energy transition strategy. Within the 3.4 per cent tax increase we ended up with the fundamental building blocks of a well-considered budget: 2.6 per cent to keep pace with the demands of a busy city (primarily in labour and operating commitments), and 0.8 per cent to begin paying for the long-awaited Valley Line LRT to the southeast. We also began the important process of looking more deeply at our cost drivers through a review of staff overtime and a wholesale review of city services – all in the name of finding long-term efficiency, effectiveness and alignment with our core priorities as a Council. Our efforts to find efficiencies and the push for greater transparency and efficacy in our operations doesn’t end with this budget, but remains core to the ongoing work of this Council. As we work through these multi-year budget cycles, we can continue to establish long-term spending priorities to help build a more sustainable city.
Don Iveson
Mayor
Message from the Mayor
- i -

Table of Contents
- ii -
Foreword 1
Building a Great City
Edmonton in Focus 3
Economic Outlook 4
Budget Building Blocks
Bringing our Vision to Life 11
Multi-year Planning & Budgeting 13
Budget engagement: Summer 2015 15
Corporate Workforce Plan 17
Positive Change 19
Positive Change Stories 21
Positive Change Recommendations 23
Budget in Brief
Corporate Summary 35
Approved Property Tax Increase 36
2016 - 2018 Operating Budget 37
Typical Homeowner 39
Where the Money Comes From 40
Where the Money is Spent 41
Monthly Average Household Spending 42
Budget Principles 43
Impacts of a Growing City
2015 - 2018 Capital Budget 44
Operating Impacts of Capital and Contributed Assets 47
Operating Impacts of Capital 54
Operating Impacts of Contributed Assets 76
Summary of Service Packages - Funded 79
Budget by the Numbers
Financial Tables 91
User Fees, Fines and Permits 99
Departments 125
Boards and Commissions 517
Supplementary Information 603
Page
Key Dates
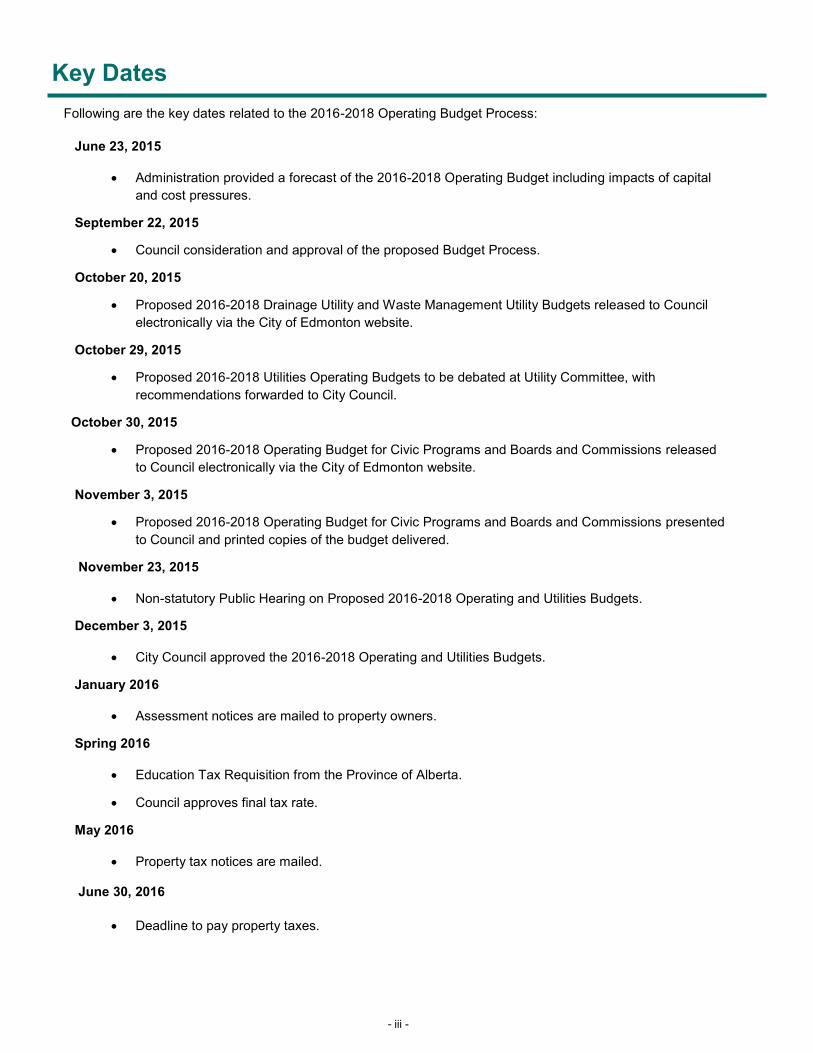
Following are the key dates related to the 2016-2018 Operating Budget Process:
June 23, 2015
Administration provided a forecast of the 2016-2018 Operating Budget including impacts of capital
and cost pressures.
September 22, 2015
Council consideration and approval of the proposed Budget Process.
October 20, 2015
Proposed 2016-2018 Drainage Utility and Waste Management Utility Budgets released to Council
electronically via the City of Edmonton website.
October 29, 2015
Proposed 2016-2018 Utilities Operating Budgets to be debated at Utility Committee, with
recommendations forwarded to City Council.
October 30, 2015
Proposed 2016-2018 Operating Budget for Civic Programs and Boards and Commissions released
to Council electronically via the City of Edmonton website.
November 3, 2015
Proposed 2016-2018 Operating Budget for Civic Programs and Boards and Commissions presented
to Council and printed copies of the budget delivered.
November 23, 2015
Non-statutory Public Hearing on Proposed 2016-2018 Operating and Utilities Budgets.
December 3, 2015
City Council approved the 2016-2018 Operating and Utilities Budgets.
January 2016
Assessment notices are mailed to property owners.
Spring 2016
Education Tax Requisition from the Province of Alberta.
Council approves final tax rate.
May 2016
Property tax notices are mailed.
June 30, 2016
Deadline to pay property taxes.
- iii -
Foreword
The 2016-2018 Approved Operating Budget has been prepared by Administration with City Council’s Vision top
of mind. The six 10-year goals in The Way Ahead and alignment to the Corporate Outcomes
approved by City Council were significant considerations in drafting this budget.
The 2016-2018 Approved Operating Budget document is presented in one volume. The budget document
contains introductory and summary level information followed by Department, Branch and program level
budget detail. The 2016-2018 Approved Utilities Budget is presented in a separate volume.
Unless otherwise stated, all amounts are shown in thousands of dollars
Building a Great City
Building a Great City section provides an overview of the alignment of Council’s vision, strategy and the 2016-
2018 budget. It also provides an economic update for the City of Edmonton.
Budget Building Blocks
Describes the Corporate Planning Framework, the multi-year budgeting process and the linkage to Strategic
Planning. This section also includes the Corporate Workforce Plan and Positive Change recommendations for
City Council’s consideration.
Budget in Brief
The Budget in Brief section provides a quick look at the 2016-2018 Approved Operating Budget. It shows the
impacts for a typical homeowner, where the money comes from, where the money is spent and the monthly
average household spending.
Impacts of a Growing City
Provides information related to the Operating Impacts of Capital and of Contributed Capital as well as a
summary of all of the Service Packages.
Budget by the Numbers
Included in this section are the budget summaries, FTE tables and approved changes to user fees, fines and
permits.
Department and Branch Overviews
This section contains detailed information of each City Department and its Branches. The Department
Overview introduces the department and includes a table identifying all the branches and programs contained
within the department. Highlights of the approved 2016-2018 budgets and a departmental view of the budget
are also provided. The Branch Overviews provide information on major services and programs and the
approved 2016-2018 Operating Budget for the branch. Changes to the budget and information on results, cost
drivers and services offered by program, along with details of funded service packages are also presented if
applicable.
Breaking down each Branch into additional levels of detail is intended to provide clearer information about
revenues and expenditures in the base budget, as well as any changes for 2016-2018.
- 1 -

Foreword
Supplementary Information
This section includes additional information about the City of Edmonton and the approved 2016-2018
Operating Budget. The sections include:
Governance Structure
Basis of Budgeting
Reserve Funds
Council Motions
List of Council Approved Plans
Neighbourhood Renewal Program Listing
Outstanding Debt Summary
Summary List of Performance Measures
Major Financial Policies
Terms and Definitions
Access to Approved 2016-2018 Budget Documents
The approved 2016-2018 Budget document is available on the City’s Website: http://www.edmonton.ca/
budget2016
- 2 -

Building a Great City Works
Edmonton in Focus
Edmonton has continued to grow throughout 2015, despite the current economic uncertainty that Alberta faces.
Edmonton's drive over the past decade to build a strong, diversified, and sustainable economy has already proven its
value. The momentum of the City's growth, sound fiscal management, and timely investment in capital infrastructure
has provided Edmonton's overall economy with a strong buffer.
In order to continue improving how we plan for Edmonton's future, the City has now moved its operating budget to a
multi-year, rather than year-by-year basis. This gives the City several advantages from a planning perspective. It
allows Council and Administration to respond to broader economic changes in a responsible way, taking a longer view
of Edmonton's needs, while building stable program and service delivery. It provides more flexibility in how the City
finances operations, as funding priorities can be reallocated across different years of the budget. This multi-year
approach allows us to align strategy, business plans and operating and capital budgets to ensure the dollars are spent
to achieve City Council’s vision.
Strong Fiscal Management
In September 2015, the independent financial rating service Standard and Poor reaffirmed the City of Edmonton's AA+
credit rating for the fourth consecutive year. The report noted that Edmonton continues to manage its finances well by
employing an experienced financial management team, holding a strong liquidity position, and keeping its debt burden
well within both provincial limits and the more stringent City policy.
But Edmonton is not simply resting on its past successes.
City Building
2015 saw several of Edmonton's signature projects spring to life in the core of the city. The Metro Line opened to
service, adding the Northern Alberta Institute of Technology (NAIT), Royal Alexandra Hospital, MacEwan University,
and other north Edmonton landmarks to the City's LRT network. The Ice District, Edmonton's new downtown
entertainment district, is rapidly taking shape, with the new Rogers Place arena slated to open next year. In August of
this year, construction began on Blatchford, a new sustainable community in the heart of Edmonton. The City also
continued to develop as an arts and cultural centre, hosting a mixture of events ranging from the cutting-edge Red Bull
Crashed Ice tournament—held on a man-made skating track built just for the event in Louise McKinney Park—, to the
ITU World Triathlon, to City favourites such as the Heritage Festival, the Fringe International Theatre Festival, and the
Edmonton Folk Music Festival.
Significant challenges still lie ahead for Edmonton as it prepares to renew its strategic vision, The Way Ahead, and
pushes forward on a new city-wide transit review strategy that will see the City rethink how it delivers transit service to
its 870,000 some residents. But collaboration between Edmonton and its regional partners will ensure that the Metro
Edmonton economic engine which Edmonton powers continues to thrive.
- 3 -
Building a Great CityWorks
Economic Outlook
The impact of lower global oil prices was evident in the Edmonton economy in 2015.
Economic growth for 2015 in our region is now expected to slow down to 0.7% from the rate of 3.1% recorded for
2014. However, it is also expected that Edmonton’s growth will outperform Alberta’s growth as a result of Edmonton’s
relatively more diversified economy.
The driving force for this expected moderate growth comes from expanding employment and incomes, although at
slower rates than seen in recent years. This expansion, combined with ongoing population growth, provided solid
support to the housing, retail and personal service sectors of the Edmonton economy.
Global and North American Developments
Global economic growth continued to move forward at a slightly weaker pace in the third quarter of 2015. While
conditions in the US improved in the quarter, growth in the Euro zone and emerging markets has continued to
disappoint. With very weak conditions in Italy, France and Spain, the Euro Zone’s economic prospects still pose the
most significant downside risk to global economic recovery. As well China, Brazil, South Africa, Russia and several
other emerging market economies may not meet growth numbers that are currently anticipated.
The International Monetary Fund expects the global economy to grow at 3.3% in 2015 – a slightly slower rate than
forecasted in the first quarter 2015 World Economic Outlook update report. Global growth will rise in 2016 to 3.8% as
the advanced countries accelerate and emerging economies see more robust growth.
Although inclement winter weather in the US resulted in very weak economic growth early in 2015, the US economy
rebounded later in the year resulting in an annual growth rate of approximately 2.5% for 2015. This growth rate is
currently expected to accelerate to the 3% range in 2016. Higher levels of activity in US consumer spending,
manufacturing and construction contribute to continuing growth in the US. These positive developments more than
compensated for weakness in the energy sector and business investment.
Economic growth in the emerging economies showed signs of stabilizing in the third quarter of 2015, after a relatively
weak showing in 2014. While a slight moderation in economic output in countries such as China is likely over the
remainder of 2015, growth across all emerging markets is expected to hold at around 4.2% which is down slightly from
the 4.3% rate foreseen in the first quarter of 2015. Looking forward to 2016 growth in emerging economies should
improve to 4.7% which is still well below historical norms.
Unlike in the US, growth in Canada did not accelerate quickly in the third quarter of 2015. Rather, Real Gross
Domestic Product remained sluggish as the impact of sharply lower oil prices continue to be felt. With oil prices only
partially recovering and no significant boost to exports from a lower Canadian dollar so far, the Canadian economy will
see very modest growth in the third quarter. For 2015 as a whole economic growth will come in at an annualized rate
of about 1% which is well below the 1.9% the Bank was forecasting earlier in the year. With better conditions in the US
and improved exports as a result of a lower Canadian dollar 2016 should be a better year for Canada with growth in
the 2.3% range.
- 4 -

Building a Great City Works
Inflation in Edmonton
Inflation as measured by the Consumer Price Index (CPI) moved up from the very low levels recorded in the first and
second quarters during the third quarter of 2015. Year over year inflation was 1.6% in September 2015 as the impact of
last year’s fall in gasoline prices began to fade. Housing costs, particularly rents, are continuing to rise albeit at a
slower pace than in in previous quarters. This will lead to higher inflation for the remainder of 2015. Edmonton’s rental
vacancy rate is in the 2.4% range which remains well below the long term average of 3.5%. This is causing rents to rise
faster than overall inflation in Edmonton. While the vacancy rate will rise over 2015 the tight conditions in the rental
segment of the housing market will continue to put upward pressure on shelter costs and drive inflation up in the
months ahead.
Edmonton’s CPI Inflation
Source: Statistics Canada
-2.00%
-1.00%
0.00%
1.00%
2.00%
3.00%
4.00%
- 5 -
Building a Great CityWorks
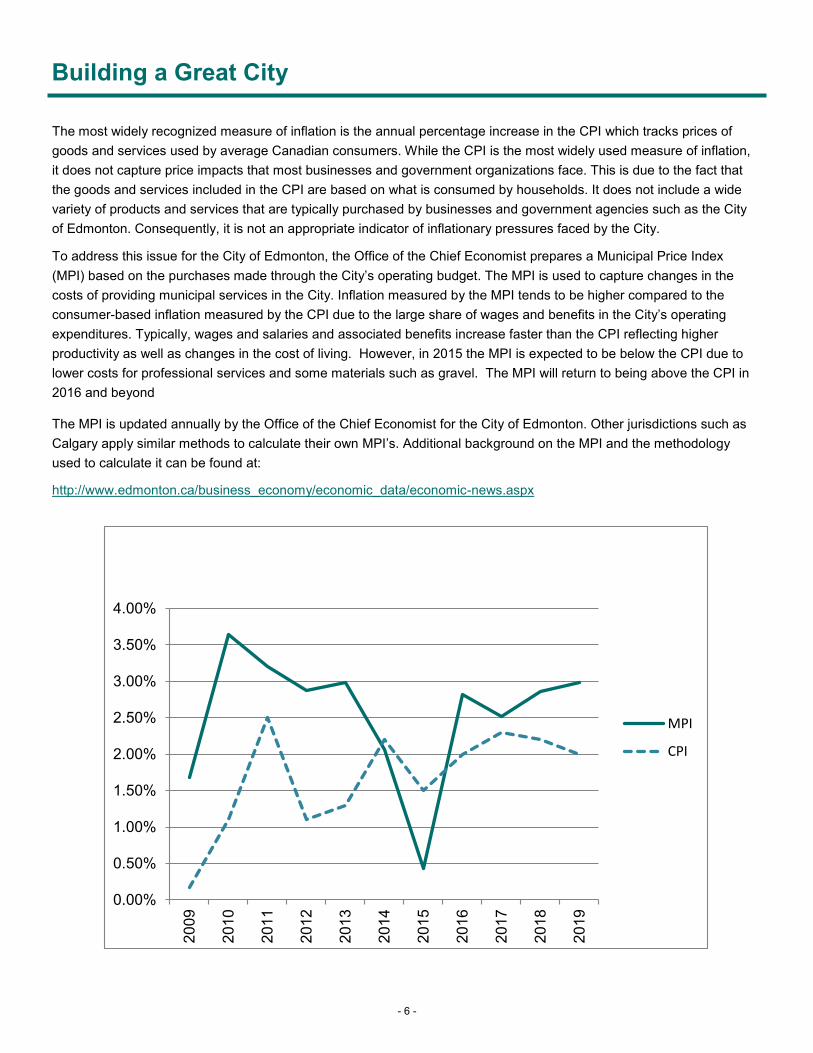
The most widely recognized measure of inflation is the annual percentage increase in the CPI which tracks prices of
goods and services used by average Canadian consumers. While the CPI is the most widely used measure of inflation,
it does not capture price impacts that most businesses and government organizations face. This is due to the fact that
the goods and services included in the CPI are based on what is consumed by households. It does not include a wide
variety of products and services that are typically purchased by businesses and government agencies such as the City
of Edmonton. Consequently, it is not an appropriate indicator of inflationary pressures faced by the City.
To address this issue for the City of Edmonton, the Office of the Chief Economist prepares a Municipal Price Index
(MPI) based on the purchases made through the City’s operating budget. The MPI is used to capture changes in the
costs of providing municipal services in the City. Inflation measured by the MPI tends to be higher compared to the
consumer-based inflation measured by the CPI due to the large share of wages and benefits in the City’s operating
expenditures. Typically, wages and salaries and associated benefits increase faster than the CPI reflecting higher
productivity as well as changes in the cost of living. However, in 2015 the MPI is expected to be below the CPI due to
lower costs for professional services and some materials such as gravel. The MPI will return to being above the CPI in
2016 and beyond
The MPI is updated annually by the Office of the Chief Economist for the City of Edmonton. Other jurisdictions such as
Calgary apply similar methods to calculate their own MPI’s. Additional background on the MPI and the methodology
used to calculate it can be found at:
http://www.edmonton.ca/business_economy/economic_data/economic-news.aspx
0.00%
0.50%
1.00%
1.50%
2.00%
2.50%
3.00%
3.50%
4.00%
20
09
20
10
20
11
20
12
20
13
20
14
20
15
20
16
20
17
20
18
20
19
MPI
CPI
- 6 -
Building a Great City Works
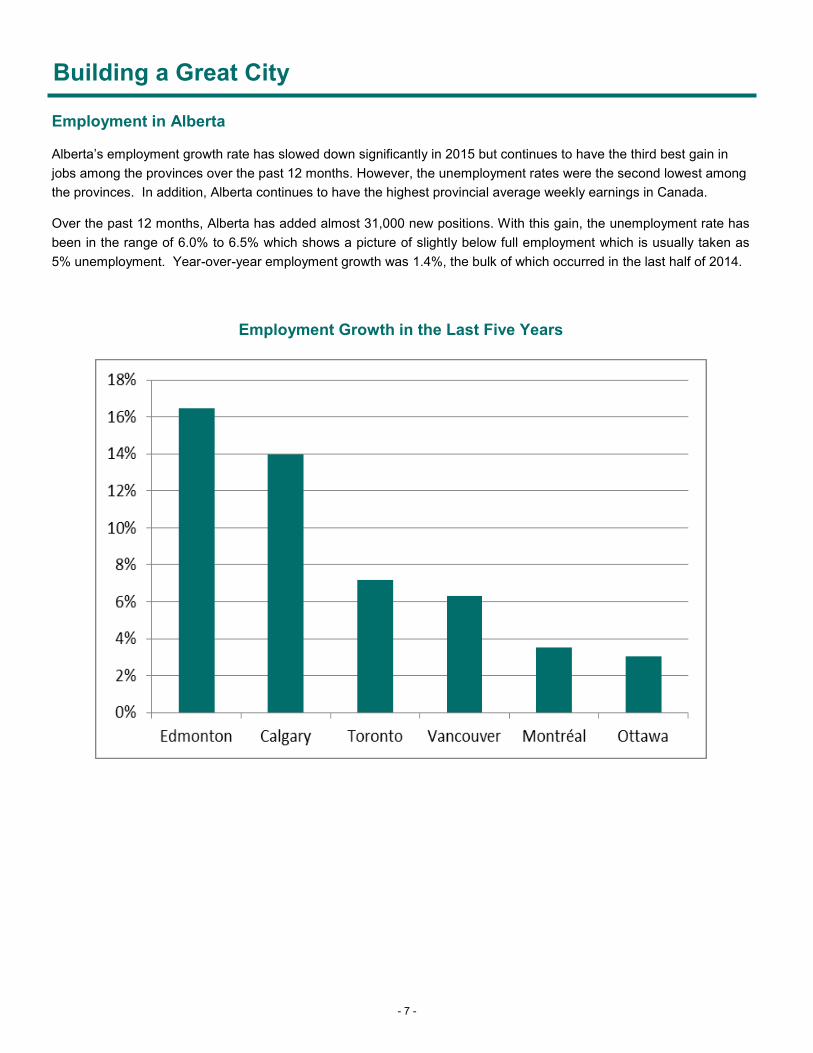
Employment in Alberta
Alberta’s employment growth rate has slowed down significantly in 2015 but continues to have the third best gain in
jobs among the provinces over the past 12 months. However, the unemployment rates were the second lowest among
the provinces. In addition, Alberta continues to have the highest provincial average weekly earnings in Canada.
Over the past 12 months, Alberta has added almost 31,000 new positions. With this gain, the unemployment rate has
been in the range of 6.0% to 6.5% which shows a picture of slightly below full employment which is usually taken as
5% unemployment. Year-over-year employment growth was 1.4%, the bulk of which occurred in the last half of 2014.
Employment Growth in the Last Five Years
- 7 -

Building a Great CityWorks
Employment in Edmonton
Employment in the Edmonton region for the third quarter of 2015 was up year over year with particularly good
increases in full-time jobs. Strong job gains in construction, financial services, health care and education more than
made up for weakness in the retail, energy and manufacturing sectors. As a result, Edmonton’s unemployment rate
stood at 5.9% in September 2015. Employment growth in Edmonton will slow over the remainder of 2015 and the
unemployment rate will rise to 6.5% range in the coming months as the available labour force increases more rapidly
than the number of new jobs.
Employment in the Edmonton region made very respectable gains over the course of the year as 20,000 net new jobs
have been added over the last 12 months. These have been largely full-time jobs. However there has been a
tendency toward part-employment in the most recent job numbers. The region saw job gains in construction,
professional services, public administration and healthcare. Job losses have occurred in oil & gas, manufacturing, and
logistics. As a result, Edmonton’s unemployment rate stood at 5.9% in the third quarter of 2015 – well below the
current Canadian value of approximately 7.1%.
Employment Trends in the Edmonton CMA
Source: Statistics Canada
0
1
2
3
4
5
6
7
8
550
575
600
625
650
675
700
725
750
775
800
Pe
rce
nt
Em
plo
ym
en
t (0
00
)
Employment (Left Axis) Unemplyment (Right Axis)
- 8 -

Building a Great City Works
Building Permits
After a very strong gain in the second quarter, the value of building permits in Edmonton eased in the third quarter of
2015. The quarterly value for both non-residential and residential permits slipped lower in the quarter. The one year
moving average, which smooths out sharp changes in quarterly results for building permit values, was also down
slightly in the third quarter. However values of permits remained at historically good levels. The value of building
permits will weaken from current levels, particularly for multi-family residential buildings, as the rental vacancy rate
continues to rise over the remainder of 2015. With applications for new developments slowing, it is anticipated that
building permit values will fall in the months to come.
City of Edmonton—Value of Building Permits
Source: City of Edmonton, Current Planning Branch
$-
$200
$400
$600
$800
$1,000
$1,200
$1,400
$1,600
Value of Building Permits One Year Moving Average
- 9 -
Building a Great CityWorks
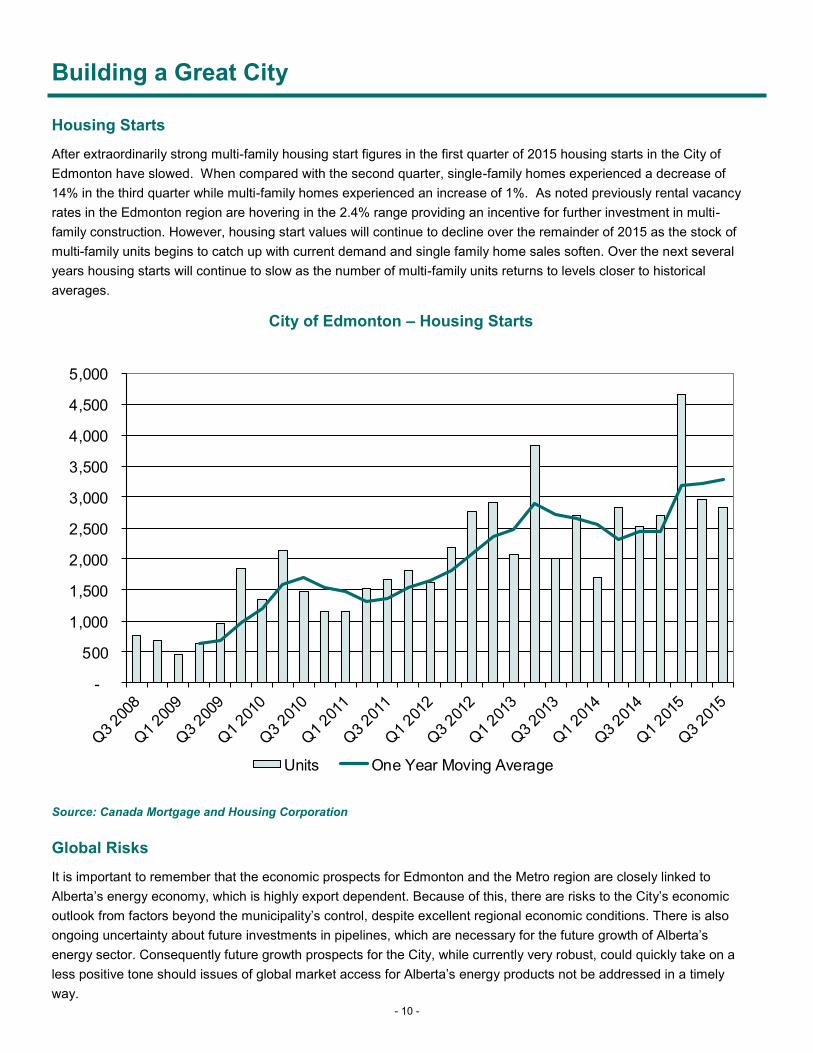
Housing Starts
After extraordinarily strong multi-family housing start figures in the first quarter of 2015 housing starts in the City of
Edmonton have slowed. When compared with the second quarter, single-family homes experienced a decrease of
14% in the third quarter while multi-family homes experienced an increase of 1%. As noted previously rental vacancy
rates in the Edmonton region are hovering in the 2.4% range providing an incentive for further investment in multi-
family construction. However, housing start values will continue to decline over the remainder of 2015 as the stock of
multi-family units begins to catch up with current demand and single family home sales soften. Over the next several
years housing starts will continue to slow as the number of multi-family units returns to levels closer to historical
averages.
City of Edmonton – Housing Starts
Source: Canada Mortgage and Housing Corporation
Global Risks
It is important to remember that the economic prospects for Edmonton and the Metro region are closely linked to
Alberta’s energy economy, which is highly export dependent. Because of this, there are risks to the City’s economic
outlook from factors beyond the municipality’s control, despite excellent regional economic conditions. There is also
ongoing uncertainty about future investments in pipelines, which are necessary for the future growth of Alberta’s
energy sector. Consequently future growth prospects for the City, while currently very robust, could quickly take on a
less positive tone should issues of global market access for Alberta’s energy products not be addressed in a timely
way.
-
500
1,000
1,500
2,000
2,500
3,000
3,500
4,000
4,500
5,000
Units One Year Moving Average
- 10 -

Budget Building Blocks
Bringing Our Vision to Life
Edmonton’s City Council has developed a City Vision - a creative description of our City’s future that paints a picture
of how we imagine our city will look in 2040. The journey toward that 2040 vision is supported by deliberate and
purposeful planning to build a great city and create the community in which Edmontonians strive to work, live and
play. The City of Edmonton’s strategic plan, The Way Ahead describes the city vision and identifies six 10-year
strategic goals that direct long-term planning. The six 10-year goals are:
Transform Edmonton’s Urban Form
Enhance Use of Public Transit and Active Modes of Transportation
Improve Edmonton’s Livability
Preserve and Sustain Edmonton’s Environment
Ensure Edmonton’s Financial Sustainability
Diversify Edmonton’s Economy
A set of corporate outcomes, performance measures with targets, and conditions of success help define and
measure the journey to achieving the 10-year strategic goals.
Directional Plans
Directional plans, called The Ways Plans, identify the strategies to achieve the 10-year strategic goals. Directional
plans are:
The Way We Grow: Municipal Development Plan
The Way We Move: Transportation Master Plan
The Way We Live: Edmonton’s People Plan
The Way We Green: Edmonton’s Environmental Strategic Plan
The Way We Finance: (under development)
The Way We Prosper: The City of Edmonton’s Economic
Development Plan
- 11 -
Budget Building Blocks
Edmonton is a city for people - for all of us - where we live, how we get around, how we engage with one another in
society, and also how we grow. It’s a city of builders, a city of innovators, and a city that leads. Our community is
filled with residents, businesses, entrepreneurs, investors who are bound together by a common vision and driven
by individual efforts to make something great. Edmonton is a place where people actively build things and creatively
make new things - and new connections - happen. Each year we welcome thousands of new citizens into our city
and into our neighbourhoods, and we also welcome and encourage new visitors from around the world. Edmonton is
a fast growing city – among the fastest growing in the country. Located in Treaty 6 territory, Edmonton is a young
city with a rich and layered history. Our community provides the canvas where we can share our stories, build our
futures together, and walk in the footsteps of those who came before us as we forge new paths ahead.
To build a Great City that is caring, sustainable and resilient, Edmonton will continue to deliver superior livability for
its residents through well-designed, green and connected places and spaces. Our city-building efforts are intended
to support improved social equity, broader economic opportunity and enhanced collective prosperity.
As we work towards our longer-term 2040 City vision, we are currently wrapping up the remaining three years of the
first ten years of our strategic plan, The Way Ahead. Our environment is continuously changing and new ideas,
issues and opportunities emerge. Edmonton has a clear focus on what needs to be achieved over the coming
decades, and as a result we developed the 2016-2018 Way Ahead Implementation plan to prioritize initiatives that
need to be delivered over the next three years to make the biggest impact now as we move into the next phase of
our strategic plan (2019-2028).
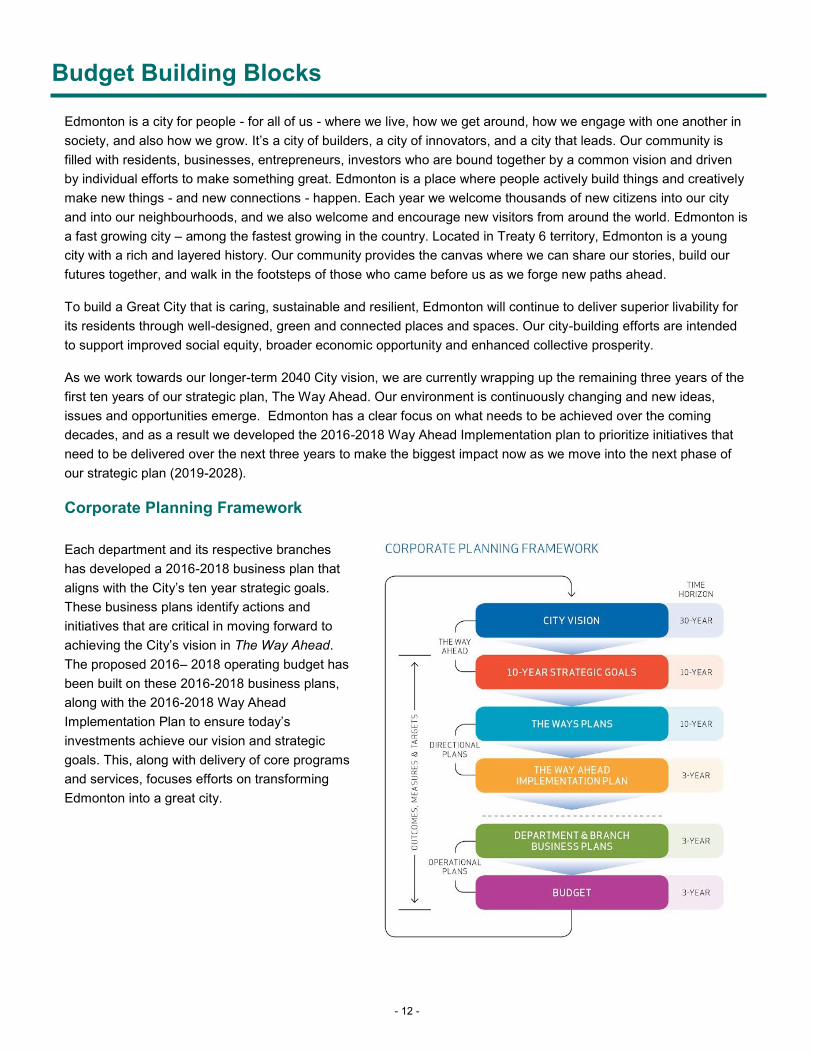
Corporate Planning Framework
Each department and its respective branches
has developed a 2016-2018 business plan that
aligns with the City’s ten year strategic goals.
These business plans identify actions and
initiatives that are critical in moving forward to
achieving the City’s vision in The Way Ahead.
The proposed 2016– 2018 operating budget has
been built on these 2016-2018 business plans,
along with the 2016-2018 Way Ahead
Implementation Plan to ensure today’s
investments achieve our vision and strategic
goals. This, along with delivery of core programs
and services, focuses efforts on transforming
Edmonton into a great city.
- 12 -
Budget Building Blocks
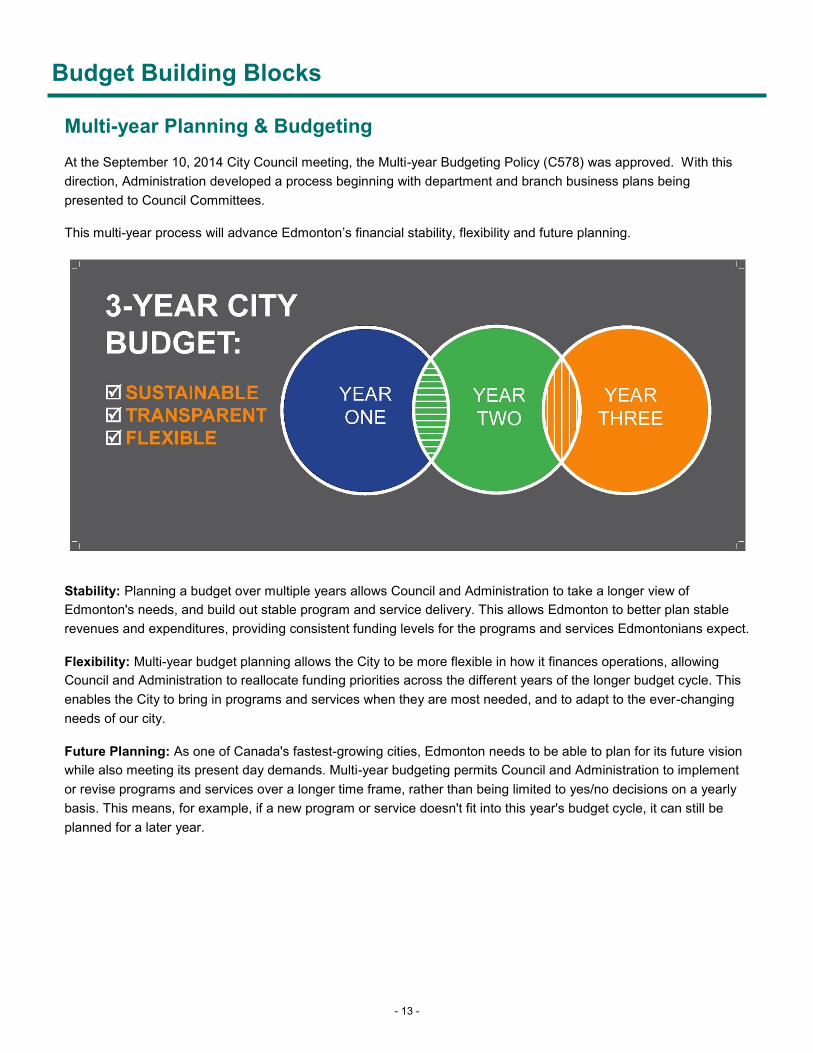
Multi-year Planning & Budgeting
At the September 10, 2014 City Council meeting, the Multi-year Budgeting Policy (C578) was approved. With this
direction, Administration developed a process beginning with department and branch business plans being
presented to Council Committees.
This multi-year process will advance Edmonton’s financial stability, flexibility and future planning.
Stability: Planning a budget over multiple years allows Council and Administration to take a longer view of
Edmonton's needs, and build out stable program and service delivery. This allows Edmonton to better plan stable
revenues and expenditures, providing consistent funding levels for the programs and services Edmontonians expect.
Flexibility: Multi-year budget planning allows the City to be more flexible in how it finances operations, allowing
Council and Administration to reallocate funding priorities across the different years of the longer budget cycle. This
enables the City to bring in programs and services when they are most needed, and to adapt to the ever-changing
needs of our city.
Future Planning: As one of Canada's fastest-growing cities, Edmonton needs to be able to plan for its future vision
while also meeting its present day demands. Multi-year budgeting permits Council and Administration to implement
or revise programs and services over a longer time frame, rather than being limited to yes/no decisions on a yearly
basis. This means, for example, if a new program or service doesn't fit into this year's budget cycle, it can still be
planned for a later year.
- 13 -
Budget Building Blocks
While, research shows that more than three quarters of the 26 outcome measures set in The Way Ahead are
projected to be near, meet or exceed targets by 2018, the City still needs to make considerable efforts to fully deliver
on its promises.
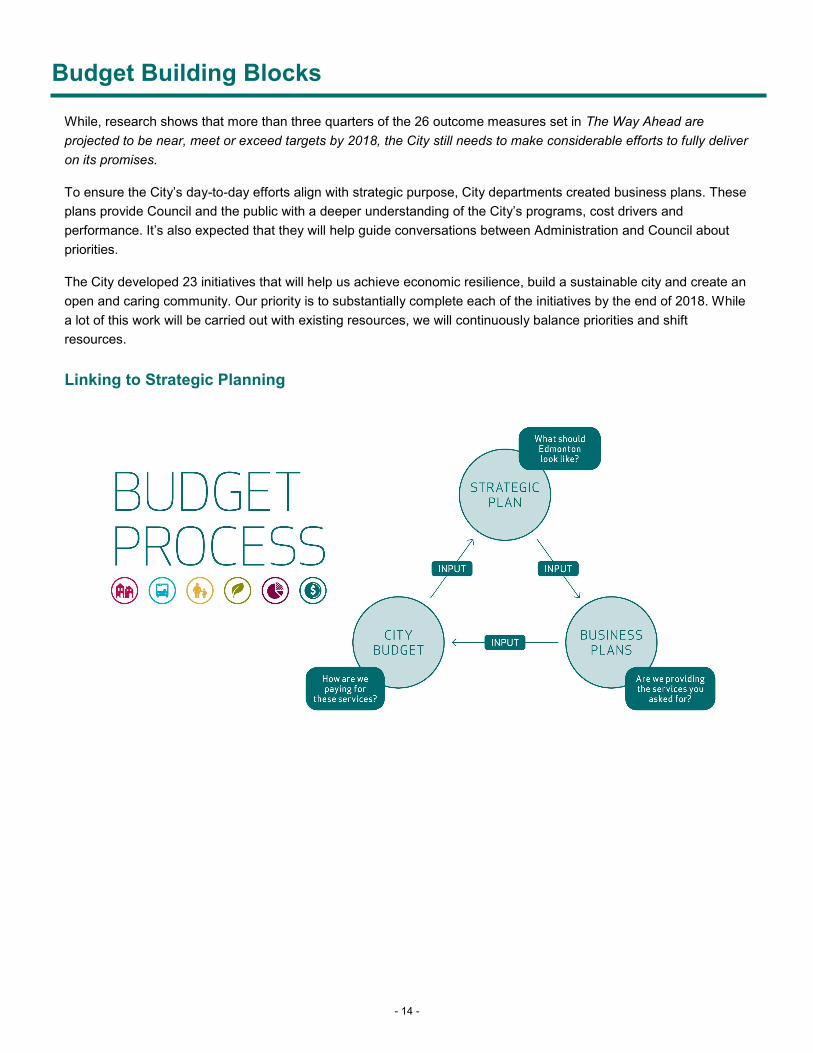
To ensure the City’s day-to-day efforts align with strategic purpose, City departments created business plans. These
plans provide Council and the public with a deeper understanding of the City’s programs, cost drivers and
performance. It’s also expected that they will help guide conversations between Administration and Council about
priorities.
The City developed 23 initiatives that will help us achieve economic resilience, build a sustainable city and create an
open and caring community. Our priority is to substantially complete each of the initiatives by the end of 2018. While
a lot of this work will be carried out with existing resources, we will continuously balance priorities and shift
resources.
Linking to Strategic Planning
- 14 -
Budget Building Blocks
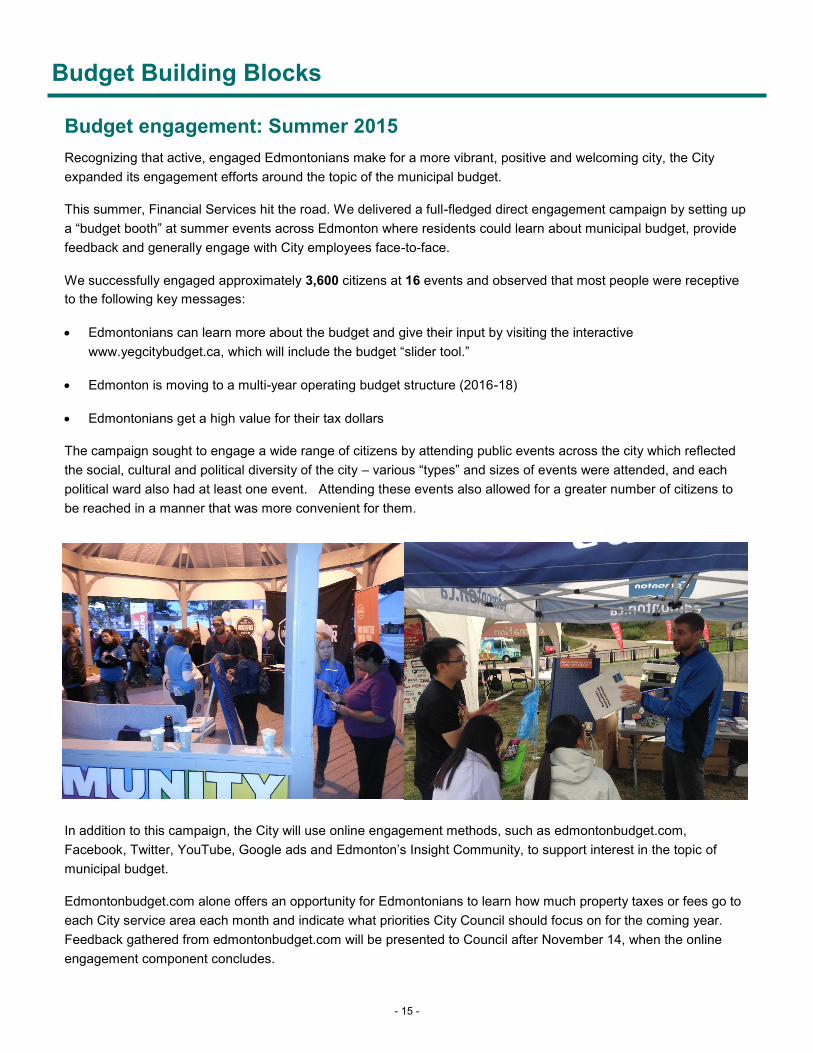
Budget engagement: Summer 2015
Recognizing that active, engaged Edmontonians make for a more vibrant, positive and welcoming city, the City
expanded its engagement efforts around the topic of the municipal budget.
This summer, Financial Services hit the road. We delivered a full-fledged direct engagement campaign by setting up
a “budget booth” at summer events across Edmonton where residents could learn about municipal budget, provide
feedback and generally engage with City employees face-to-face.
We successfully engaged approximately 3,600 citizens at 16 events and observed that most people were receptive
to the following key messages:
Edmontonians can learn more about the budget and give their input by visiting the interactive
www.yegcitybudget.ca, which will include the budget “slider tool.”
Edmonton is moving to a multi-year operating budget structure (2016-18)
Edmontonians get a high value for their tax dollars
The campaign sought to engage a wide range of citizens by attending public events across the city which reflected
the social, cultural and political diversity of the city – various “types” and sizes of events were attended, and each
political ward also had at least one event. Attending these events also allowed for a greater number of citizens to
be reached in a manner that was more convenient for them.
In addition to this campaign, the City will use online engagement methods, such as edmontonbudget.com,
Facebook, Twitter, YouTube, Google ads and Edmonton’s Insight Community, to support interest in the topic of
municipal budget.
Edmontonbudget.com alone offers an opportunity for Edmontonians to learn how much property taxes or fees go to
each City service area each month and indicate what priorities City Council should focus on for the coming year.
Feedback gathered from edmontonbudget.com will be presented to Council after November 14, when the online
engagement component concludes.
- 15 -

Budget Building Blocks
Accountability for Results
Performance measures exist at multiple levels throughout the organization. The City uses a suite of performance
measures to assess how it is performing – at the corporate, department and program levels. Types of measures
include effectiveness and efficiency (including productivity, timeliness, and quality) measures. Performance
measurement:
Improves transparency and accountability
Supports decision-making and resource allocations
Monitors progress in achieving intended results (effectiveness)
Monitors efficiency
Monitors programs and services
Reporting to citizens about things that matter to them is an important component of accountability. The City recently
reported its 2014 progress towards the outcomes, measures and targets in The Way Ahead. Departments and
branches will be reporting progress on their business plan performance measures beginning in 2017. The City also
implemented the Citizen Dashboard to report on the performance of services and activities that are important to
citizens and that promote the outcomes associated with The Way Ahead. Please visit the Citizen Dashboard at
http://www.edmonton.ca/city_government/citizen-dashboard-city-by-the-numbers.aspx.
Please refer to the Supplementary Information section for a complete list of the Performance Measures.
- 16 -

Budget Building Blocks
Corporate Workforce Plan
Building Capacity and Advancing Organizational Culture
The City of Edmonton provides a wide range of services that Edmontonians use every day. The majority of civic
services are citizen focused and labour intensive, which explains why approximately 60% of the operating budget
relates to personnel. The City’s workforce of more than 13,000 staff in peak season includes diverse positions such
as Firefighters, Transit Operators and Lifeguards.
People – our staff are the key resource to bring City Council’s vision to life . The 2015-2020 Corporate Workforce
Plan is the framework to build Human Resource Capacity to deliver on the Ways. The plan was developed based on
extensive external research and analysis of labour projections, leading external organizations, and internal
consultations with key stakeholders.
The culture of the organization reflects how we as an organization choose to work together and how we interact with
Council, citizens and other stakeholders. It is our behaviours, attitude and approach. Intentionally shaping our
desired organizational culture is the foundation of the Corporate Workforce Plan. It influences our work in the three
strategic focus areas of:
Talent: Attracting and retaining a diverse,
engaged, innovative and skilled workforce to
build a great City.
Learning: Leverage learning as a competitive
advantage to build a strong and sustainable
workforce for today and tomorrow.
Performance: Optimize individual and
organizational performance.
The three Strategic Focus Areas and performance
measures provide a business discipline to the overall
framework. The identification of goals and initiatives for
each of the Strategic Focus Areas provides structure to
advance meaningful progress towards the achieving the
desired outcomes.
- 17 -
Budget Building Blocks
Making Progress
The most recent Employee Engagement and Diversity Survey, administered in September 2014, demonstrated
significant positive growth in culture throughout the organization. Participation rates continue to increase and
achieved a 50% increase over participation rates for the 2010 survey. Every one of the 34 questions in the four
indices of the survey increased over 2012 survey results demonstrating positive change and consistent leadership
across the organization. The next survey will take place at the end of 2016 and will provide an indication of the
success of the action plans implemented in 2015 and 2016.
Sample of progress:
Engagement is enhanced through employee events such as the Great City Event, where more than 1000
supervisors gathered together in 2015 to network and learn about innovation and service excellence, and the
Great City evening, where over 4500 staff and family members gathered to celebrate and be recognized for their
contributions to building a great city.
Engagement is also advanced through our grassroots programs such as the Culture Ambassador Program,
with over 600 members across the organization and Branch action plans
Launch of the School of Business: The new enterprise learning approach is focused on building capacity
throughout the organization at all levels. In 2015 the School of Business implemented four significant streams of
learning. They include a comprehensive Aspiring Supervisors Program, new Management 101 Program,
expansion of the Supervisor 101 Program, and training focused on the individual. The strategy of modernizing
our approach to learning will continue with the implementation of an enterprise learning system and expansion of
online learning.
Diversity and inclusion within the workplace has progressed with successful employment initiatives such as the
Abilities@work program in partnership with six community partners and civic unions. Significant progress has
been made in the Aboriginal Awareness and Education Initiative with 1500 City staff trained by the end of 2015
and a plan to achieve 100% of City staff by the end of 2018.
An integrated Civic Accommodation Transformation team representing culture, communications, technology,
space design, customer services and alternative work strategies was formed in early 2015. This team is working
to transform shared spaces and new ways of working with new technologies to reduce real estate costs and
environmental footprints, provide flexible workspace options to support collaboration, innovation and increased
productivity and to better serve the needs of citizens and increase performance.
Continuing Our Progress
In 2016-18 a focus on building organizational and individual capacity and advancing the desired corporate culture
remain a priority. The 2015 – 2020 Corporate Workforce Plan is ambitious, bold and fitting for a top diversity
employer in Canada and a top employer in Alberta. Our success will be dependent on modernizing and innovating
our business processes and building people capacity through a strong, sustainable organizational culture.
- 18 -

Budget Building Blocks
Positive Change
What is Positive Change?
Positive Change has been ongoing at the City of Edmonton. Since 2010, the City has successfully reduced the net
operating budget by $178 million. For the 2016-2018 period, the target is a 2% reduction in the operating budget tax
levy.
Council’s 2% Initiative provided a goal: to build a more visible and well-defined culture of innovation and
improvement at the City of Edmonton. In response, we have developed a corporate innovation program,
encouraging the existing drive for innovation in the organization and creating new structures to support innovation
practices at all levels. This is driven through facilitated training and by supporting a distributed network of innovation
champions in each department.
This 2% comes in two forms:
Recoverable:
‘Recoverable’ savings are costs that can be directly reduced from City services or programs, meaning Council can
use the money recovered to fund other programs and services, or to lower the total property tax increase.
An example would be reducing the percentage of salt in the sand used on Edmonton’s winter roads. The cost
savings from this change are recovered as a direct budget savings.
Reallocated:
‘Reallocated’ savings are costs that can be reassigned to be better used within a City department, in order to
improve how that area does its business.
An example would be City staff taking over work duties related to the City’s biosolids program, which would
previously have been done by contractors. The cost savings from this change allow the City to more flexibly manage
the program.
Achieving Positive Change
Positive change is achieved though 3 different approaches:
Program Review:
Program Review means reviewing the programs that the City of Edmonton offers to citizens, making sure they align
with citizen needs and the City’s strategic plan, and optimizing how we deliver them.
If a program is important to Edmonton and Edmontonians, it should have measurable outcomes and we should be
considering how best to meet those outcomes. If a program isn’t important to the City or its citizens, then we need to
re-examine why we’re doing it at all.
Improvement & Innovation
Council’s 2% Initiative has served as a catalyst to build a more visible and well-defined culture of innovation and
improvement at the City of Edmonton. We have developed the Corporate Innovation Program, encouraging the
existing drive for innovation in the organization as well as formalizing our innovation practices and requirements
through facilitated training and supporting a distributed network of innovation champions in each department.
- 19 -

Budget Building Blocks
Innovation at the City is both big and small. These ideas, no matter the scale, require that we work together. Each of
our employees has a role in identifying and implementing improvements and their efforts are helping us to drive
positive change for our residents and accomplish Council’s long-term strategic goals.
Improvement & Innovation means encouraging and following through on the ideas of our workforce so as to improve
the services we deliver to residents. Staff are committed to serving citizens and have bold ideas and innovative ways
to serve them better, like switching to a paperless system for our Assessment Review Board to make the process
simpler and more efficient, optimizing our bus routes resulting in significant capital savings, and using sophisticated
social marketing around waste diversion to help achieve our sustainability goals.
Budget Best Practices:
Budget Best Practices means creating a consistent framework across the City in how we develop our budgets, and
then engage citizens. It means creating business plans for each of the City’s branches, and then performing what we
say we will in those plans and measuring and being accountable for those results.
This means, as a citizen, if in the business plan or budget your City says it’s spending money on snow clearing, its
spending that amount of money on snow clearing--not on something else. And if we spend more or less than that
amount of money… we explain why.
- 20 -

Budget Building Blocks
Positive Change Stories
City Tribunals Make Paper Go Poof!
Property owners have the right to file a complaint on their property
assessment, and lots of people and businesses do. As a result, the
assessment review board and their public appointees conduct more
than 900 complaint hearings between April and December each year.
With each complaint generating an average of 600 or more sheets of
paper, the amount of paper those hearings generated is truly
staggering, 540,000 sheets a year. Stacked, they’d reach the top of a
16-storey building!
To deal with this volume of paper, the Assessment and Taxation
Branch, IT and Facility and Landscape Infrastructure met early in late
2014 to discuss how to efficiently convert the appeals process to a digital-only one.
The system allows parties to a complaint to submit their arguments and supporting material online or if paper copies
are provided, they are scanned into the system. The system accepts many formats such as PDF, Word, Excel,
PowerPoint, etc.
Each side is given full access to the other’s submissions. The sides can submit rebuttals, and counter-rebuttals if
they wish.
At the actual hearing, assessment review board members and representatives of both sides each use one of 30
computer thinkpads to display pages they are referring to in their arguments or questions. Assessment review board
members can make notes on their screens with fingertips or styluses. The hearing clerk displays which page is
being discussed on a large monitor in the room.
The response has been overwhelmingly positive from both individual homeowners and agents representing very
large corporations.
New ETS scheduling software module saves $27 million in capital costs
ETS is about to integrate a $335,000 module into its highly complex
bus scheduling computer application, and that module will instantly
do away with the need for 49 buses worth about $27 million.
These buses will not be sold but be used to improve peak service to
suburban growth areas, and to alleviate critical overload situations on
specific routes.
- 21 -
Budget Building Blocks
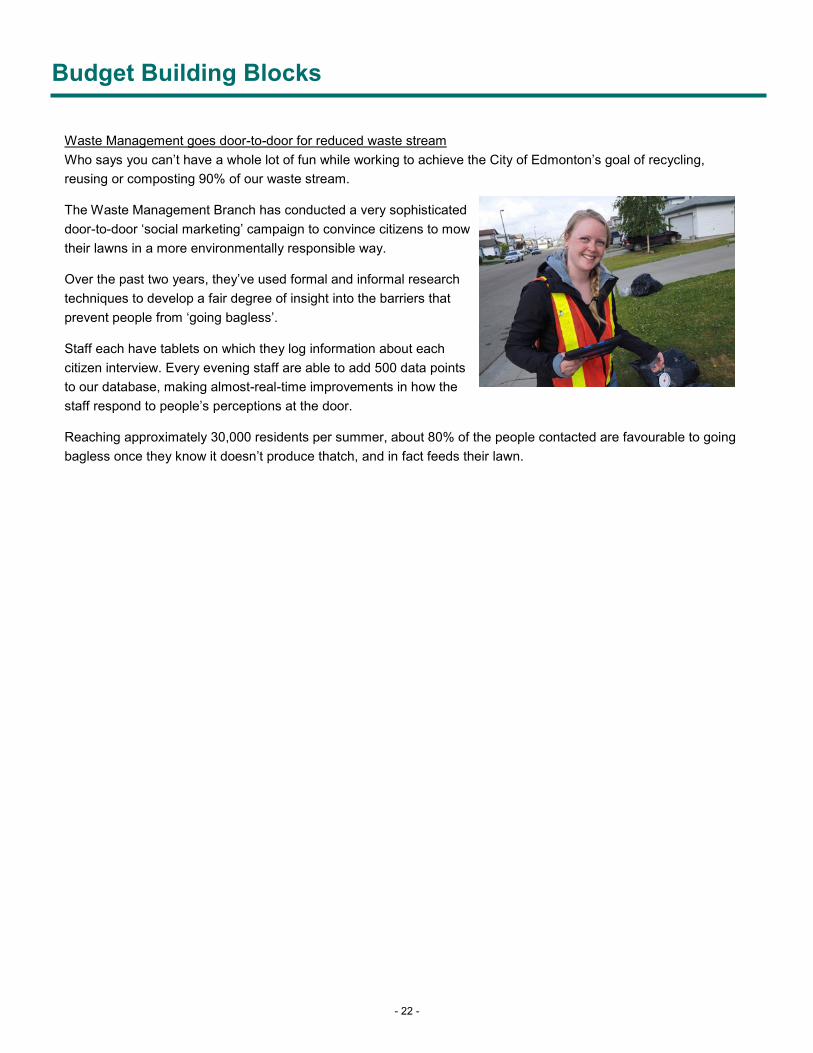
Waste Management goes door-to-door for reduced waste stream
Who says you can’t have a whole lot of fun while working to achieve the City of Edmonton’s goal of recycling,
reusing or composting 90% of our waste stream.
The Waste Management Branch has conducted a very sophisticated
door-to-door ‘social marketing’ campaign to convince citizens to mow
their lawns in a more environmentally responsible way.
Over the past two years, they’ve used formal and informal research
techniques to develop a fair degree of insight into the barriers that
prevent people from ‘going bagless’.
Staff each have tablets on which they log information about each
citizen interview. Every evening staff are able to add 500 data points
to our database, making almost-real-time improvements in how the
staff respond to people’s perceptions at the door.
Reaching approximately 30,000 residents per summer, about 80% of the people contacted are favourable to going
bagless once they know it doesn’t produce thatch, and in fact feeds their lawn.
- 22 -
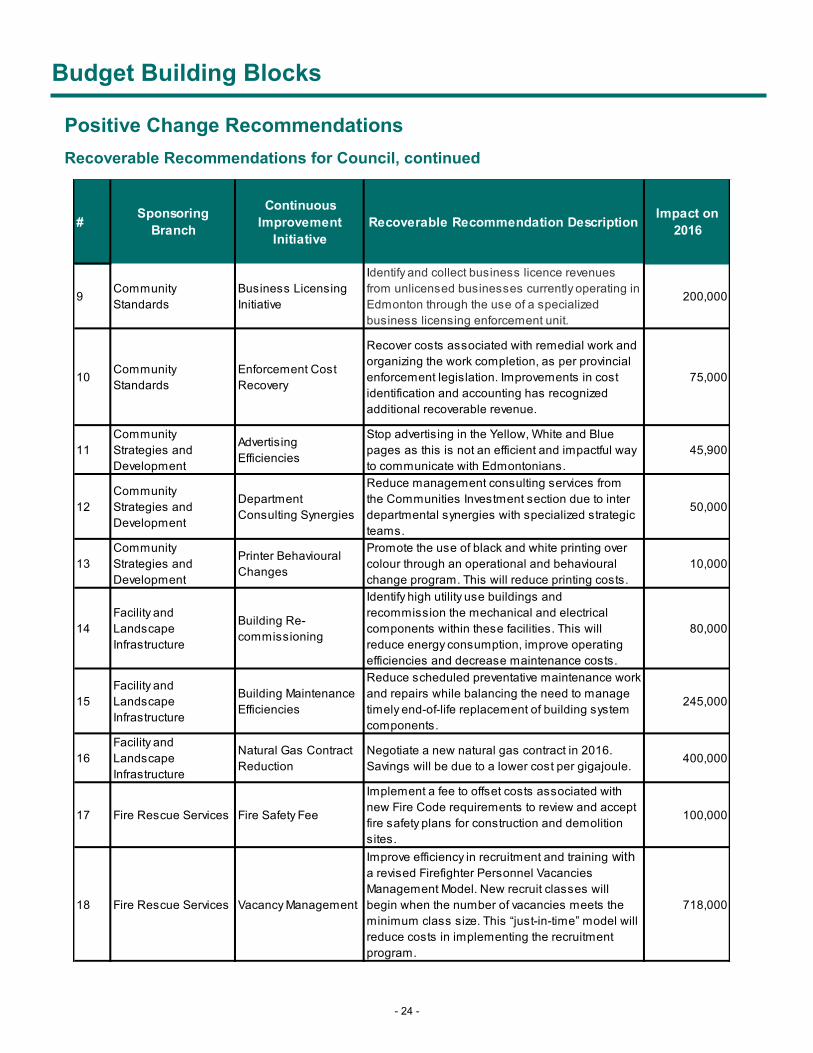
Budget Building Blocks
Positive Change Recommendations
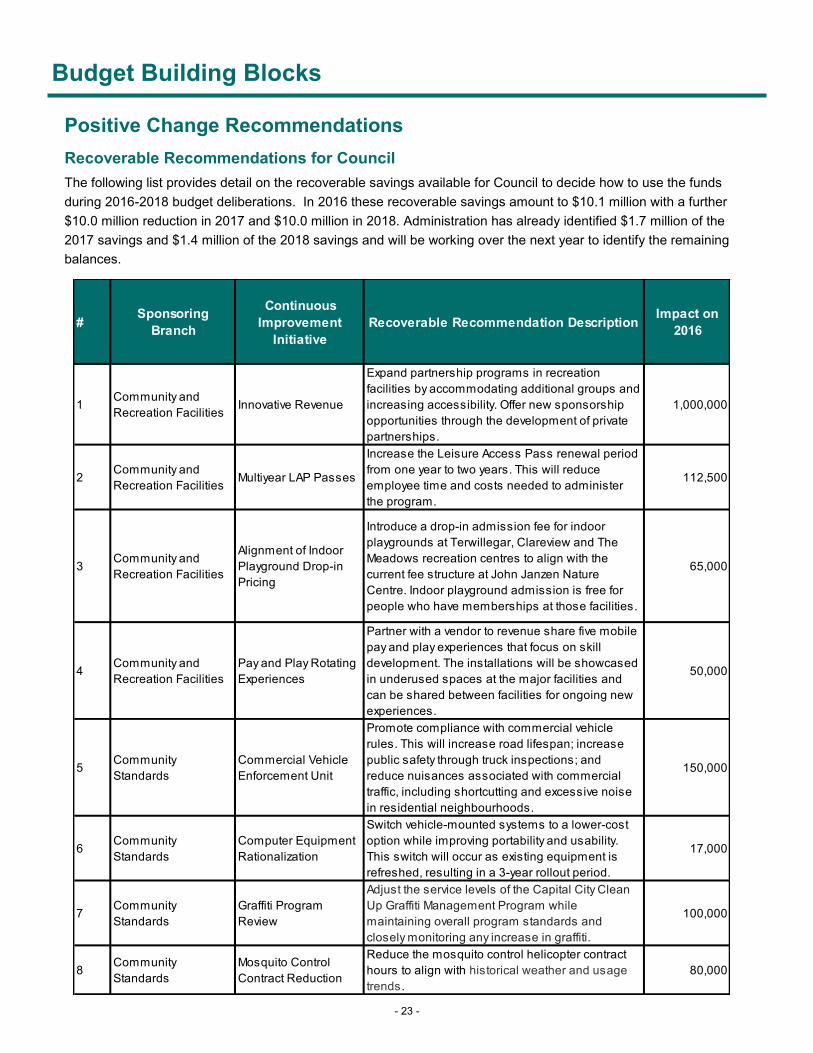
Recoverable Recommendations for Council
The following list provides detail on the recoverable savings available for Council to decide how to use the funds
during 2016-2018 budget deliberations. In 2016 these recoverable savings amount to $10.1 million with a further
$10.0 million reduction in 2017 and $10.0 million in 2018. Administration has already identified $1.7 million of the
2017 savings and $1.4 million of the 2018 savings and will be working over the next year to identify the remaining
balances.
#Sponsoring
Branch
Continuous
Improvement
Initiative
Recoverable Recommendation DescriptionImpact on
2016
1Community and
Recreation FacilitiesInnovative Revenue
Expand partnership programs in recreation
facilities by accommodating additional groups and
increasing accessibility. Offer new sponsorship
opportunities through the development of private
partnerships.
1,000,000
2Community and
Recreation FacilitiesMultiyear LAP Passes
Increase the Leisure Access Pass renewal period
from one year to two years. This will reduce
employee time and costs needed to administer
the program.
112,500
3Community and
Recreation Facilities
Alignment of Indoor
Playground Drop-in
Pricing
Introduce a drop-in admission fee for indoor
playgrounds at Terwillegar, Clareview and The
Meadows recreation centres to align with the
current fee structure at John Janzen Nature
Centre. Indoor playground admission is free for
people who have memberships at those facilities.
65,000
4Community and
Recreation Facilities
Pay and Play Rotating
Experiences
Partner with a vendor to revenue share five mobile
pay and play experiences that focus on skill
development. The installations will be showcased
in underused spaces at the major facilities and
can be shared between facilities for ongoing new
experiences.
50,000
5Community
Standards
Commercial Vehicle
Enforcement Unit
Promote compliance with commercial vehicle
rules. This will increase road lifespan; increase
public safety through truck inspections; and
reduce nuisances associated with commercial
traffic, including shortcutting and excessive noise
in residential neighbourhoods.
150,000
6Community
Standards
Computer Equipment
Rationalization
Switch vehicle-mounted systems to a lower-cost
option while improving portability and usability.
This switch will occur as existing equipment is
refreshed, resulting in a 3-year rollout period.
17,000
7Community
Standards
Graffiti Program
Review
Adjust the service levels of the Capital City Clean
Up Graffiti Management Program while
maintaining overall program standards and
closely monitoring any increase in graffiti.
100,000
8Community
Standards
Mosquito Control
Contract Reduction
Reduce the mosquito control helicopter contract
hours to align with historical weather and usage
trends.
80,000
- 23 -
Budget Building Blocks
Positive Change Recommendations
Recoverable Recommendations for Council, continued
#Sponsoring
Branch
Continuous
Improvement
Initiative
Recoverable Recommendation DescriptionImpact on
2016
9Community
Standards
Business Licensing
Initiative
Identify and collect business licence revenues
from unlicensed businesses currently operating in
Edmonton through the use of a specialized
business licensing enforcement unit.
200,000
10Community
Standards
Enforcement Cost
Recovery
Recover costs associated with remedial work and
organizing the work completion, as per provincial
enforcement legislation. Improvements in cost
identification and accounting has recognized
additional recoverable revenue.
75,000
11
Community
Strategies and
Development
Advertising
Efficiencies
Stop advertising in the Yellow, White and Blue
pages as this is not an efficient and impactful way
to communicate with Edmontonians.
45,900
12
Community
Strategies and
Development
Department
Consulting Synergies
Reduce management consulting services from
the Communities Investment section due to inter
departmental synergies with specialized strategic
teams.
50,000
13
Community
Strategies and
Development
Printer Behavioural
Changes
Promote the use of black and white printing over
colour through an operational and behavioural
change program. This will reduce printing costs.
10,000
14
Facility and
Landscape
Infrastructure
Building Re-
commissioning
Identify high utility use buildings and
recommission the mechanical and electrical
components within these facilities. This will
reduce energy consumption, improve operating
efficiencies and decrease maintenance costs.
80,000
15
Facility and
Landscape
Infrastructure
Building Maintenance
Efficiencies
Reduce scheduled preventative maintenance work
and repairs while balancing the need to manage
timely end-of-life replacement of building system
components.
245,000
16
Facility and
Landscape
Infrastructure
Natural Gas Contract
Reduction
Negotiate a new natural gas contract in 2016.
Savings will be due to a lower cost per gigajoule.400,000
17 Fire Rescue Services Fire Safety Fee
Implement a fee to offset costs associated with
new Fire Code requirements to review and accept
fire safety plans for construction and demolition
sites.
100,000
18 Fire Rescue Services Vacancy Management
Improve efficiency in recruitment and training with
a revised Firefighter Personnel Vacancies
Management Model. New recruit classes will
begin when the number of vacancies meets the
minimum class size. This “just-in-time” model will
reduce costs in implementing the recruitment
program.
718,000
- 24 -

Budget Building Blocks
Positive Change Recommendations
Recoverable Recommendations for Council, continued
#Sponsoring
Branch
Continuous
Improvement
Initiative
Recoverable Recommendation DescriptionImpact on
2016
19 NeighbourhoodsParks Servicing and
Maintenance
Implement alternative approaches to day-to-day
caretaking/servicing duties, improve internal
coordination between functional teams and other
departments (e.g., spring cleaning coordination
with Transportation), and review and adjust
resource and service work plans at various sites
to reflect operational effectiveness.
110,000
20 NeighbourhoodsEfficiencies in Printed
Materials
Advancements in digital/mobile technology have
allowed the elimination of some printed materials
and the adoption of more environmentally friendly
practices..
40,000
21 NeighbourhoodsMaintenance
Operating Adjustment
Realize program operating efficiencies and lower
costs by forming more effective partnerships.80,000
22 Human Resources Online T4sProvide online T4s, which will save costs on
paper, envelopes, printing and employee time.10,000
23 Fleet Services
Bus Mid-life
Refurbishment
Strategy
Implement the Bus Mid-life Refurbishment
Strategy, which extends the life of buses from 12 to
20 years through engine and body replacements.
540,000
24 Fleet Services
Systematic Review of
Muni Fleet to Optimize
Lifecycle Management
and Investments
Enhance lifecycle management of the snow
removal and street sweeper fleets to ensure
minimized total cost of ownership (capital and
operating) through a combination of new
materials, enhanced analysis and innovative
processes to optimize lifecycles on specific
equipment.
210,400
25
Corporate
Procurement and
Supply Services
Cost Savings from
Office
Products/Stationery
Products
The City issued an RFP for our Corporate Office
Products requirements in 2015. The successful
proponent (Staples Canada) included pricing that
provided very aggressive discounting compared
with previous agreement, resulting in the
opportunity to reduce Departmental stationery
budgets without impact.
200,000
26Information
Technology
Wireless Data
Contract
Implement a new cellular products and services
contract.118,000
27Information
Technology
Enterprise License
Rationalization
Reduce the number of Oracle licenses, and
purchase a corporate Tableau license.67,000
28 Financial Services
Investment
Management
Recoveries
Increase the assets being managed internally.
This, along with an overall increase in the total
funds under management, is expected to increase
the amount of revenues generated within the
investment program. This savings is incremental
to savings identified in 2015
360,000
- 25 -

Budget Building Blocks
Positive Change Recommendations
Recoverable Recommendations for Council, continued
#Sponsoring
Branch
Continuous
Improvement
Initiative
Recoverable Recommendation DescriptionImpact on
2016
29 Financial Services Finance
Transformation
Realign Financial Services resources to enable an
increased level of business analytics support to
City departments and the Corporation, while
improving the branch’s accounting oversight and
transactional consistency and efficiency. This will
result in lower employee turnover rates; lower
absenteeism; business process improvement;
lower overtime costs; higher productivity; and a
more efficient, collaborative work model.
25,000
30 City Manager Meeting Efficiency
Use Google Hangouts and electronic meeting
materials for more meetings. This will reduce
costs for meeting hosting, parking and office
supplies.
10,000
31 Communications ConsultingReduce the number of consultants used to
complete projects.68,000
32Urban Planning and
Environment Branch
In-House Graphic
Design
Maintain the in-house creative services unit which
allows the City to pursue more projects at a lower
cost than outsourcing.
20,000
33Intergovernmental
and External AffairsEvents
Reduce spending on event attraction - bids,
hosting and activation.22,000
34
Real Estate, Housing
and Economic
Sustainability
Labour Budget
Reconciliation
Apply a Labour Discount Rate Adjustment to the
budget to account for the lag between positions
becoming vacant and recruiting to fill the positions.
152,000
35
Real Estate, Housing
and Economic
Sustainability
Sales Commission
Reconciliation
Reduce the budget set aside for property sales
commissions to align with actual spending trends
in past years.
152,000
36Urban Planning and
Environment Branch
Project Management
Refinement
Implement a project management framework to
improve cost projections and planning of
expenditure timing on external resources, leading
to a reduction in consulting costs.
60,000
37Urban Planning and
Environment Branch
Labour Budget
Adjustment
Apply a UPE Labour Discount Rate Adjustment to
the budget to account for the lag between
positions becoming vacant to when they are filled.
200,000
38 Edmonton Transit MinBus
Implement MinBus software to optimize the
scheduling of buses, which will require 49 fewer
buses to maintain current service levels. This will
save on capital costs in future years as well as
labour and maintenance costs needed to service
fewer buses.
335,000
39 Edmonton TransitTraining Budget
Efficiencies
The training budget was analyzed and efficiencies
were found by using a different method to estimate
the cost of providing the same amount of training
for operators
736,000
- 26 -

Budget Building Blocks
Positive Change Recommendations
Recoverable Recommendations for Council, continued
#Sponsoring
Branch
Continuous
Improvement
Initiative
Recoverable Recommendation DescriptionImpact on
2016
40 Edmonton TransitTransit Administrative
Efficiencies
Reduce Transit Administrative costs for materials,
stationery, equipment and other services.175,000
41Transportation
Operations
LED Streetlight
Conversion
Replace a portion of neighbourhood high
pressure sodium and metal halide luminaires
with more environmentally friendly and cost-
effective LED luminaires.
300,000
42Transportation
Operations
Pavement Design and
Quality Assurance
Testing
Provide pavement design and quality assurance
testing related services to regional partners (eg.
City of St. Albert and Sturgeon County).
250,000
43Transportation
Operations
Traffic Controller
System conversion
(Operating Impacts)
Convert to a new traffic controller system that
changes connectivity from the central controller
(copper based) to the traffic signals in the field
(wireless). This will reduce annual
telecommunication fees.
100,000
44Transportation
OperationsDirect Materials
Eliminate sand chips for snow pack (but keep for
rain/ice conditions). About two-thirds of sanding
conditions do not require sand chips.
440,000
45Transportation
OperationsDirect Materials Reduce yard storage sand salt mix from 4% to 3%. 20,000
46Transportation
OperationsContract
Send the sand/salt mixing contract to tender or buy
a mixer from sand recycling for 60% of the value.
Partial funding could come from the aggregate
recycling reserve.
200,000
47Transportation
OperationsContract
Reduced contracted services by discontinuing
Centre of Excellence sub contracts and instead
carry out direct tendering of two of five contracts.
50,000
48Transportation
OperationsContract
Reduction to the overhead costs associated with
the revised EPCOR Transportation Electrical
Services Agreement.
1,000,000
49Transportation
Operations
Community Sandbox
Program Cessation
Discontinue the Community Sandbox program,
which only reaches half of Edmonton
neighbourhoods. This allows Roadway
Maintenance employees to focus on road and
sidewalk sanding and plowing during snow
events.
300,000
50Transportation
Operations
Adopt Provincial
Overdimensional
Permit System
Adopt the Provincial Overdimensional Permit
System, which is estimated to capture an
additional 25% of oversized or overweight truck
loads using city roadways. The associated permit
fees will be used to decrease tax levy needs.
250,000
Recoverable Recommendations for Council 10,098,800
- 27 -
Budget Building Blocks
Positive Change Recommendations
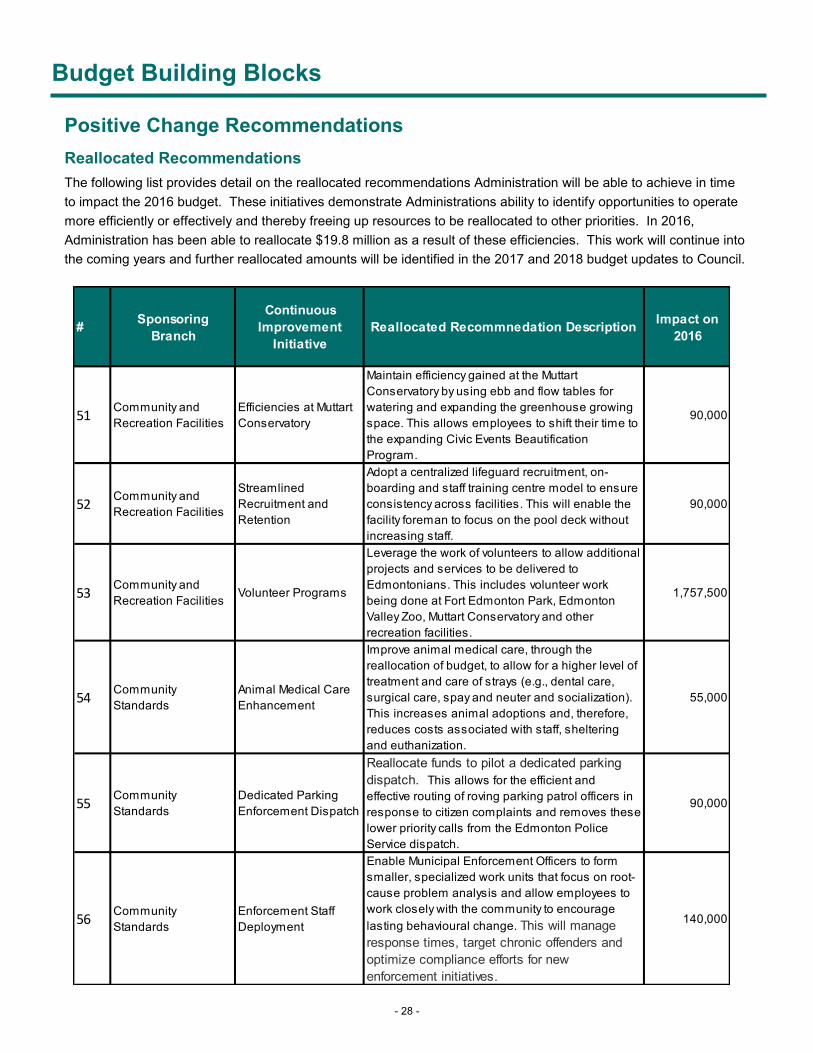
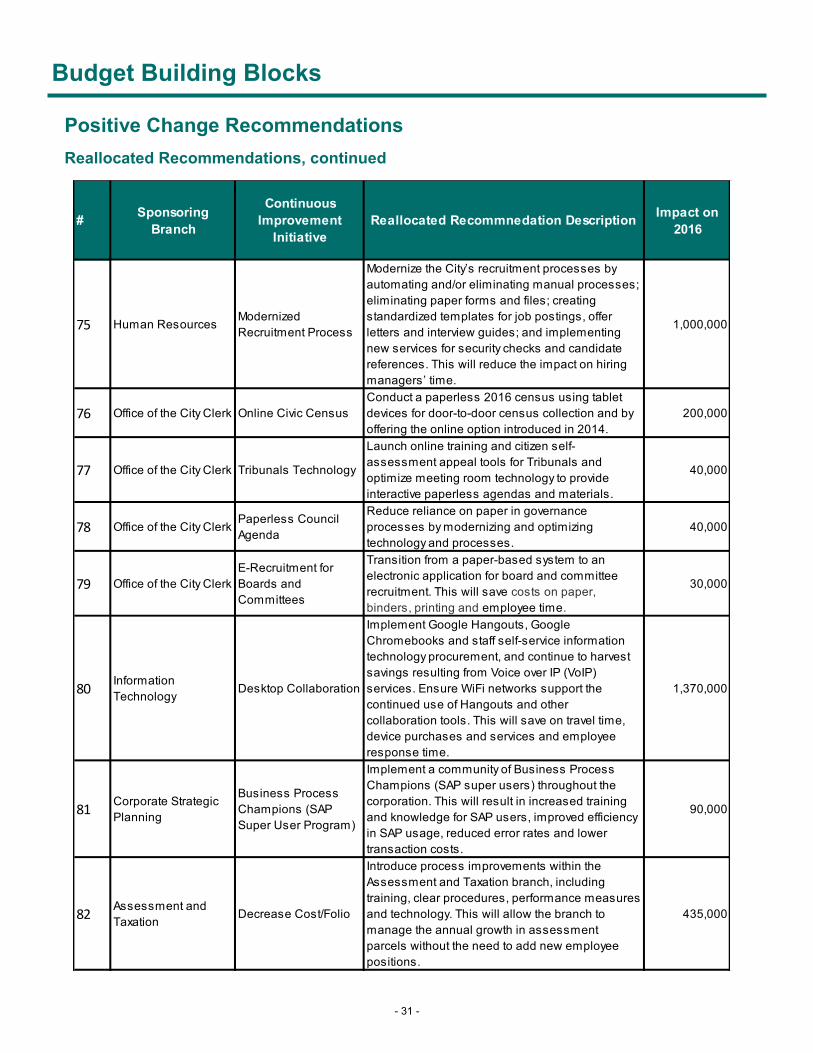
Reallocated Recommendations
The following list provides detail on the reallocated recommendations Administration will be able to achieve in time
to impact the 2016 budget. These initiatives demonstrate Administrations ability to identify opportunities to operate
more efficiently or effectively and thereby freeing up resources to be reallocated to other priorities. In 2016,
Administration has been able to reallocate $19.8 million as a result of these efficiencies. This work will continue into
the coming years and further reallocated amounts will be identified in the 2017 and 2018 budget updates to Council.
#Sponsoring
Branch
Continuous
Improvement
Initiative
Reallocated Recommnedation DescriptionImpact on
2016
51Community and
Recreation Facilities
Efficiencies at Muttart
Conservatory
Maintain efficiency gained at the Muttart
Conservatory by using ebb and flow tables for
watering and expanding the greenhouse growing
space. This allows employees to shift their time to
the expanding Civic Events Beautification
Program.
90,000
52Community and
Recreation Facilities
Streamlined
Recruitment and
Retention
Adopt a centralized lifeguard recruitment, on-
boarding and staff training centre model to ensure
consistency across facilities. This will enable the
facility foreman to focus on the pool deck without
increasing staff.
90,000
53Community and
Recreation FacilitiesVolunteer Programs
Leverage the work of volunteers to allow additional
projects and services to be delivered to
Edmontonians. This includes volunteer work
being done at Fort Edmonton Park, Edmonton
Valley Zoo, Muttart Conservatory and other
recreation facilities.
1,757,500
54Community
Standards
Animal Medical Care
Enhancement
Improve animal medical care, through the
reallocation of budget, to allow for a higher level of
treatment and care of strays (e.g., dental care,
surgical care, spay and neuter and socialization).
This increases animal adoptions and, therefore,
reduces costs associated with staff, sheltering
and euthanization.
55,000
55Community
Standards
Dedicated Parking
Enforcement Dispatch
Reallocate funds to pilot a dedicated parking
dispatch. This allows for the efficient and
effective routing of roving parking patrol officers in
response to citizen complaints and removes these
lower priority calls from the Edmonton Police
Service dispatch.
90,000
56Community
Standards
Enforcement Staff
Deployment
Enable Municipal Enforcement Officers to form
smaller, specialized work units that focus on root-
cause problem analysis and allow employees to
work closely with the community to encourage
lasting behavioural change. This will manage
response times, target chronic offenders and
optimize compliance efforts for new
enforcement initiatives.
140,000
- 28 -

Budget Building Blocks
Positive Change Recommendations
Reallocated Recommendations, continued
#Sponsoring
Branch
Continuous
Improvement
Initiative
Reallocated Recommnedation DescriptionImpact on
2016
57Community
Standards
Retail Commercial
Property- Nuisance
Reduction Initiative
Reallocate funds to reduce the number of
chronically dilapidated retail commercial
properties causing problems for nearby
business and residential communities. Focused
compliance and enforcement efforts will help
reduce cleanup costs for the City.
100,000
58Community
StandardsVolunteer Programs
Leverage the work of volunteers to allow additional
projects and services to be delivered to
Edmontonians. This includes volunteer work that
supports various Capital City Clean Up programs
including Adopt-a-Block, 15-to-Clean, River Valley
Cleanup and Graffiti Removal.
304,000
59Community
Strategies and
Development
Centralized
Departmental Work
Intake
Centralize the work intake process for web
services and contract work to make task allocation
and coordination more efficient.
25,000
60Community
Strategies and
Development
Truth and
Reconciliation
Committee
Reallocation
Use unspent operational dollars saved from the
responsible administration of the Wicihitowin
Society to support the Truth and Reconciliation
Commission’s Calls to Action.
250,000
61Community
Strategies and
Development
Poverty Reallocation
Reallocate employee time and program dollars to
the EndPoverty Edmonton initiative. Work from this
initiative will positively impact many related
initiatives in Edmonton.
200,000
62Community
Strategies and
Development
Millwoods Seniors
Centre Reallocation
Reallocate funds to support the new Millwoods
Seniors & Multicultural Centre, which offers a
greater variety of services to a larger, more diverse
group of people than the previous centre did.
150,000
63Community
Strategies and
Development
Multicultural Relations
Director Reallocation
Separate Multicultural Relations from the
Aboriginal and Multicultural Relations section and
hire a Director of Multicultural Relations using
funds from a vacant position. This is a more
efficient way to address increasing needs from
multicultural groups.
150,000
64Community
Strategies and
Development
Volunteer Programs
Leverage the work of volunteers to allow additional
projects and services to be delivered to
Edmontonians. This includes volunteer work
being done with Communities of Interest, Salute to
Excellence, NextGen and Youth Council.
477,000
65Facility and
Landscape
Infrastructure
Energy Management
Work with the City’s new electricity service provider
to implement the contract’s value-added services
that support City energy conservation programs.
500,000
- 29 -

Budget Building Blocks
Positive Change Recommendations
Reallocated Recommendations, continued
#Sponsoring
Branch
Continuous
Improvement
Initiative
Reallocated Recommnedation DescriptionImpact on
2016
66 Fire Rescue ServicesPractical Training
Facility Conversion
Convert the Fire Rescue practical training tower
from a wood burning facility to liquid petroleum.
This increases opportunities for firefighters to train
in live fire scenarios, reduces air and water
contamination, improves the health and safety of
firefighters while training, and reduces setup and
cleanup time.
19,000
67 Fire Rescue ServicesRepurposing of Air
Monitoring Unit
Replace the Air Monitoring Unit truck with HazMat
Area Ray Detectors, which are more accurate and
safer, and repurpose the Air Monitoring Unit into a
technical rescue backup unit. This saves costs on
training and calibration maintenance.
60,000
68 Fire Rescue Services Trial of Sprinter Unit
Use a smaller sized Sprinter Unit, rather than the
larger Air Salvage Unit, for daily delivery of fire
station supplies. This reduces fuel and
preventative maintenance costs.
47,000
69 Fire Rescue ServicesEquipment Inventory
Control
Introduce an electronic reporting and tracking
system to report lost and/or damaged equipment.
Moving from a paper-based system saves time
and money.
10,000
70 Fire Rescue ServicesUniform and Clothing
Inventory Control
Distribute uniforms and clothing on a monthly
basis rather than annual to increase efficiencies in
inventory control. Have employees pick up their
own orders instead of arranging for delivery to
stations.
5,000
71 NeighbourhoodsNaturalization and Turf
Inventory Reduction
Reduce the impacts of continued urban growth on
the turf program by increasing naturalization, tree
planting opportunities and community gardens,
where appropriate.
200,000
72 Neighbourhoods
Alternative and
Integrated City-wide
Horticulture
Approaches
Use more efficient practices for greening,
horticulture and beautification. These practices
may include replacing annual flowers with
perennials, expanding the use of flower pots,
increasing the use of indigenous flower plants,
and strategic placement of flowers.
150,000
73 Neighbourhoods
Play Space
Inspections and Minor
Servicing
Change play space inspection cycles from 11-day
cycles to 14-day cycles. This will reduce the total
number of cycles without affecting play space
maintenance standards, which will be above or in
line with Canadian standards.
35,000
74 Neighbourhoods Volunteer Programs
Leverage the work of volunteers to allow additional
projects and services to be delivered to
Edmontonians. This includes volunteer work
being done with Leaders in Training, Root for
Trees and Front Yards in Bloom.
769,500
- 30 -
Budget Building Blocks
Positive Change Recommendations
Reallocated Recommendations, continued
#Sponsoring
Branch
Continuous
Improvement
Initiative
Reallocated Recommnedation DescriptionImpact on
2016
75 Human ResourcesModernized
Recruitment Process
Modernize the City’s recruitment processes by
automating and/or eliminating manual processes;
eliminating paper forms and files; creating
standardized templates for job postings, offer
letters and interview guides; and implementing
new services for security checks and candidate
references. This will reduce the impact on hiring
managers’ time.
1,000,000
76 Office of the City Clerk Online Civic Census
Conduct a paperless 2016 census using tablet
devices for door-to-door census collection and by
offering the online option introduced in 2014.
200,000
77 Office of the City Clerk Tribunals Technology
Launch online training and citizen self-
assessment appeal tools for Tribunals and
optimize meeting room technology to provide
interactive paperless agendas and materials.
40,000
78 Office of the City ClerkPaperless Council
Agenda
Reduce reliance on paper in governance
processes by modernizing and optimizing
technology and processes.
40,000
79 Office of the City Clerk
E-Recruitment for
Boards and
Committees
Transition from a paper-based system to an
electronic application for board and committee
recruitment. This will save costs on paper,
binders, printing and employee time.
30,000
80Information
TechnologyDesktop Collaboration
Implement Google Hangouts, Google
Chromebooks and staff self-service information
technology procurement, and continue to harvest
savings resulting from Voice over IP (VoIP)
services. Ensure WiFi networks support the
continued use of Hangouts and other
collaboration tools. This will save on travel time,
device purchases and services and employee
response time.
1,370,000
81Corporate Strategic
Planning
Business Process
Champions (SAP
Super User Program)
Implement a community of Business Process
Champions (SAP super users) throughout the
corporation. This will result in increased training
and knowledge for SAP users, improved efficiency
in SAP usage, reduced error rates and lower
transaction costs.
90,000
82Assessment and
Taxation Decrease Cost/Folio
Introduce process improvements within the
Assessment and Taxation branch, including
training, clear procedures, performance measures
and technology. This will allow the branch to
manage the annual growth in assessment
parcels without the need to add new employee
positions.
435,000
- 31 -

Budget Building Blocks
Positive Change Recommendations
Reallocated Recommendations, continued
#Sponsoring
Branch
Continuous
Improvement
Initiative
Reallocated Recommnedation DescriptionImpact on
2016
83 Financial Services Finance
Transformation
Realign Financial Services resources to enable an
increased level of business analytics support to
City departments and the Corporation, while
improving the branch’s accounting oversight and
transactional consistency and efficiency. This will
result in lower employee turnover rates; lower
absenteeism; business process improvement;
lower overtime costs; higher productivity; and a
more efficient, collaborative work model.
10,000
84Utilities - Drainage
ServicesSAP Mobility Solution
Implement electronic work orders in conjunction
with SAP timesheet reporting and management.
This reduces driving time and decreases data
entry, allowing administrative employees to focus
on other areas.
650,000
85Utilities - Drainage
Services
In-house Tunnel
Boring Machine(TBM)
Refurbishment
Refurbish specialized tunnel boring machines at
the City’s new Edmiston facility rather than
returning it to the manufacturer. This saves both
time and money.
570,000
86Utilities - Drainage
Services
Managing Engineering
Drawings Review
Implement a review system that will allow
Drainage Services to switch from paper-based
engineering drawing reviews to a digital process.
This initiative will improve workflow processes,
decrease duplication of work, and enhance
document management.
320,000
87Utilities - Waste
Management
Services
Vehicle Life Cycle
Management
Assume end of life-cycle asset management
responsibilities to maximize input costs. Waste
Management Utility will assess vehicles
throughout their life cycle for refurbishment,
seeking to extend asset life and lower total capital
costs.
225,000
88Utilities - Waste
Management
Services
In-House Equipment
Mechanics
Train Waste Management Utility mechanics to
service specialized equipment used in the wood
chipping and composting process. In-house
resources can service equipment more quickly,
reduce costs and improve productivity.
200,000
89Utilities - Waste
Management
Services
Nutrigold In-house
Management
Transition the Nutri-Gold program from contracting
to in-house management.60,000
90 Current PlanningThird Party Verification
of Compliance (VOC)
Implement a program that will allow builders and
contractors to provide verification that footing and
foundation and plumbing stack work complies
with safety code requirements. Each accepted
compliance report reduces the need for City
employees to conduct on-site inspections while
having no tax levy impact.
70,000
- 32 -

Budget Building Blocks
Positive Change Recommendations
Reallocated Recommendations, continued
#Sponsoring
Branch
Continuous
Improvement
Initiative
Reallocated Recommnedation DescriptionImpact on
2016
91 Current PlanningTwo Year's Taxi
Driver's Licence
Increase the taxi and limousine drivers’ licensing
term from one year to two years. This will reduce
employee time and costs needed to administer
the program while having no tax levy impact.
43,000
92Real Estate, Housing
and Economic
Sustainability
Discontinue Creation
of Annual Business
Plan Production
Stop production of an annual business plan
because 3-year plans are now required. This will
save costs on printing, writing, design,
photography and employee time.
13,000
93Urban Planning and
Environment Branch
Shared Park
Development Program
- Circulation & Project
Tracking
Automate the review and tracking process for the
Shared Park Development Program. This will
reduce employee time and costs needed to
administer the program.
26,000
94Urban Planning and
Environment Branch
External Grant
Management (Alberta
Eco-Trust)
Transfer Community Sustainability Engagement
grant management to the Alberta Eco-Trust. This
will reduce employee time and costs needed to
administer the program.
7,000
95 Edmonton Transit MinBus
Implement MinBus software to optimize the
scheduling of buses, which will require 49 fewer
buses to maintain current service levels. This will
save on capital costs in future years as well as
labour and maintenance costs needed to service
fewer buses.
307,000
96 Edmonton TransitSmart Bus (Operating
Impacts)
Implement Smart Bus technology, which will
reduce fuel and bus maintenance costs. The
improved rider experience should also increase
fare revenue.
400,000
97 Edmonton Transit2015/ 2016 Bus
Service Reallocation
Savings from annual review of adjusting bus
service from low perfroming routes to higher
perfroming routes.
750,000
98Transportation
Operations
Parking Control
Technology
Implement pay-by-plate technology which uses
automated enforcement. It offers a variety of
payment options and information on real time off-
street parking availability, on-street stall utilization
trends and directional parking guidance.
Revenues will offset capital costs associated with
the parking technology upgrade and contribute
towards the arena funding model.
833,000
99Transportation
Operations
Uncollected Fine
Revenue (OTS)
Hire a collection agency to collect out-of-province
automated enforcement ticket fines which have not
been paid. Revenues collected will be assigned to
the Traffic Safety and Automated Enforcement
Reserve.
1,500,000
- 33 -

Budget Building Blocks
Positive Change Recommendations
Reallocated Recommendations, continued
#Sponsoring
Branch
Continuous
Improvement
Initiative
Reallocated Recommnedation DescriptionImpact on
2016
100Edmonton Police
ServiceVarious
Streamline processes (e.g., dispatching tow
trucks) that will free up dispatchers and officers to
address other calls for service. Reinvest funds
from revenue adjustments and lower priority
programs into high priority positions and
programs throughout the service.
4,000,000
101Edmonton Public
LibraryBuilding Maintenance
Insource small on-demand building maintenance
and repairs, which will create funding for two
maintenance positions and save on future
maintenance costs.
128,000
102Edmonton Public
Library
Lease Fit-up and
Wayfinding
Reduce EPL signage and wayfinding expenditures
as well as eliminate one-time fit-up expenditures
for an eplGO store front location.
504,000
103Edmonton Public
LibraryExpenditure Review
Reduce utilities, insurance, telephone, fleet
and financial systems costs as a result of a review
of planned future expenditures.
172,000
104Edmonton Public
LibraryLease Cost Savings Save on leasing costs for new Mill Woods Library. 74,000
105Edmonton Public
LibraryLibrary Staffing
Reallocate a library services position to EPL's City
of Learners initiative.70,000
106Edmonton Public
LibraryLibrary Guide
Eliminate the paper library guide and promote the
online e-version.23,000
Recommendations Reallocated 19,834,000
Recoverable Recommendations for Council 10,098,800
Total Recommendations 29,932,800
- 34 -
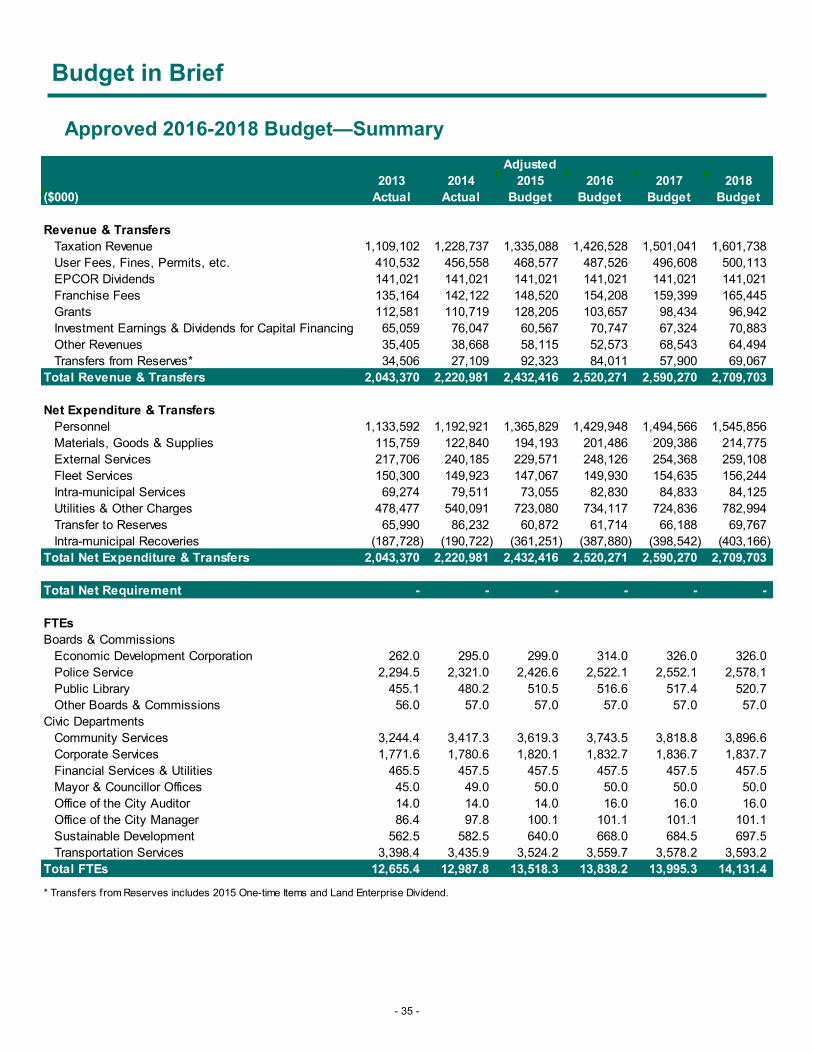
Budget in Brief
Approved 2016-2018 Budget—Summary
Adjusted
2013 2014 2015 2016 2017 2018
($000) Actual Actual Budget Budget Budget Budget
Revenue & Transfers
Taxation Revenue 1,109,102 1,228,737 1,335,088 1,426,528 1,501,041 1,601,738
User Fees, Fines, Permits, etc. 410,532 456,558 468,577 487,526 496,608 500,113
EPCOR Dividends 141,021 141,021 141,021 141,021 141,021 141,021
Franchise Fees 135,164 142,122 148,520 154,208 159,399 165,445
Grants 112,581 110,719 128,205 103,657 98,434 96,942
Investment Earnings & Dividends for Capital Financing 65,059 76,047 60,567 70,747 67,324 70,883
Other Revenues 35,405 38,668 58,115 52,573 68,543 64,494
Transfers from Reserves* 34,506 27,109 92,323 84,011 57,900 69,067
Total Revenue & Transfers 2,043,370 2,220,981 2,432,416 2,520,271 2,590,270 2,709,703
Net Expenditure & Transfers
Personnel 1,133,592 1,192,921 1,365,829 1,429,948 1,494,566 1,545,856
Materials, Goods & Supplies 115,759 122,840 194,193 201,486 209,386 214,775
External Services 217,706 240,185 229,571 248,126 254,368 259,108
Fleet Services 150,300 149,923 147,067 149,930 154,635 156,244
Intra-municipal Services 69,274 79,511 73,055 82,830 84,833 84,125
Utilities & Other Charges 478,477 540,091 723,080 734,117 724,836 782,994
Transfer to Reserves 65,990 86,232 60,872 61,714 66,188 69,767
Intra-municipal Recoveries (187,728) (190,722) (361,251) (387,880) (398,542) (403,166)
Total Net Expenditure & Transfers 2,043,370 2,220,981 2,432,416 2,520,271 2,590,270 2,709,703
Total Net Requirement - - - - - -
FTEs
Boards & Commissions
Economic Development Corporation 262.0 295.0 299.0 314.0 326.0 326.0
Police Service 2,294.5 2,321.0 2,426.6 2,522.1 2,552.1 2,578.1
Public Library 455.1 480.2 510.5 516.6 517.4 520.7
Other Boards & Commissions 56.0 57.0 57.0 57.0 57.0 57.0
Civic Departments
Community Services 3,244.4 3,417.3 3,619.3 3,743.5 3,818.8 3,896.6
Corporate Services 1,771.6 1,780.6 1,820.1 1,832.7 1,836.7 1,837.7
Financial Services & Utilities 465.5 457.5 457.5 457.5 457.5 457.5
Mayor & Councillor Offices 45.0 49.0 50.0 50.0 50.0 50.0
Office of the City Auditor 14.0 14.0 14.0 16.0 16.0 16.0
Office of the City Manager 86.4 97.8 100.1 101.1 101.1 101.1
Sustainable Development 562.5 582.5 640.0 668.0 684.5 697.5
Transportation Services 3,398.4 3,435.9 3,524.2 3,559.7 3,578.2 3,593.2
Total FTEs 12,655.4 12,987.8 13,518.3 13,838.2 13,995.3 14,131.4
* Transfers from Reserves includes 2015 One-time Items and Land Enterprise Dividend.
- 35 -
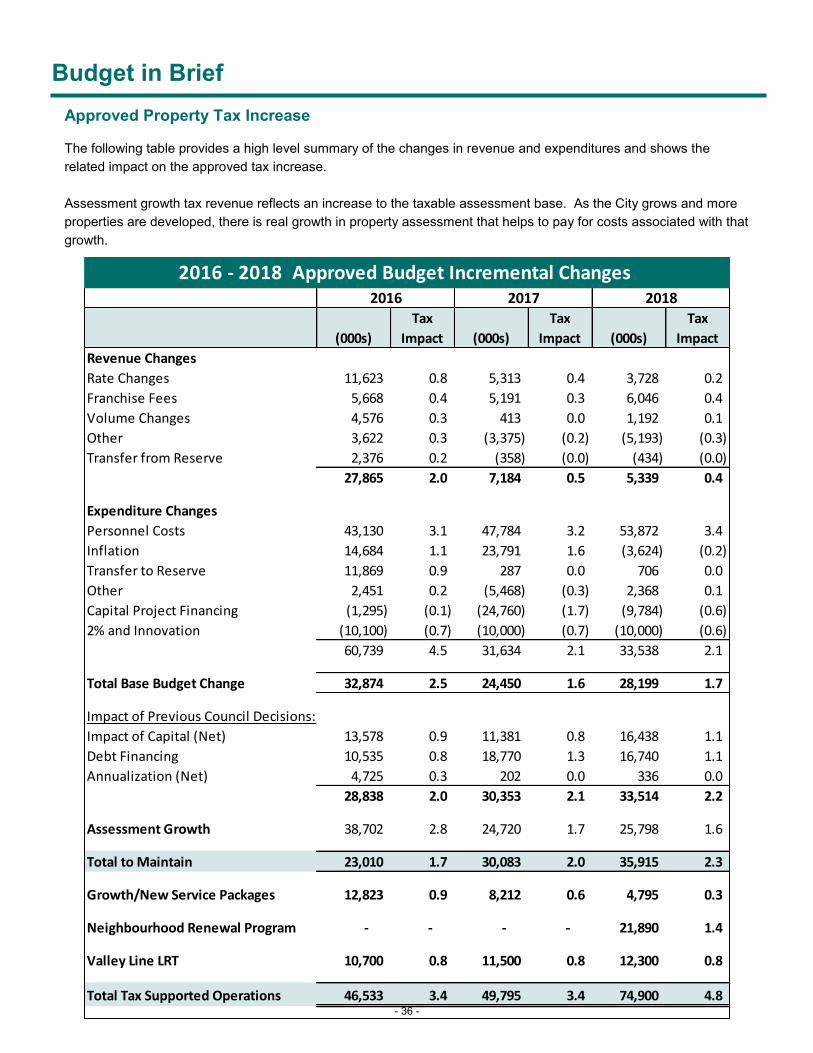
Budget in Brief
Approved Property Tax Increase
The following table provides a high level summary of the changes in revenue and expenditures and shows the
related impact on the approved tax increase.
Assessment growth tax revenue reflects an increase to the taxable assessment base. As the City grows and more
properties are developed, there is real growth in property assessment that helps to pay for costs associated with that
growth.
(000s)
Tax
Impact (000s)
Tax
Impact (000s)
Tax
Impact
Revenue Changes
Rate Changes 11,623 0.8 5,313 0.4 3,728 0.2
Franchise Fees 5,668 0.4 5,191 0.3 6,046 0.4
Volume Changes 4,576 0.3 413 0.0 1,192 0.1
Other 3,622 0.3 (3,375) (0.2) (5,193) (0.3)
Transfer from Reserve 2,376 0.2 (358) (0.0) (434) (0.0)
27,865 2.0 7,184 0.5 5,339 0.4
Expenditure Changes
Personnel Costs 43,130 3.1 47,784 3.2 53,872 3.4
Inflation 14,684 1.1 23,791 1.6 (3,624) (0.2)
Transfer to Reserve 11,869 0.9 287 0.0 706 0.0
Other 2,451 0.2 (5,468) (0.3) 2,368 0.1
Capital Project Financing (1,295) (0.1) (24,760) (1.7) (9,784) (0.6)
2% and Innovation (10,100) (0.7) (10,000) (0.7) (10,000) (0.6)
60,739 4.5 31,634 2.1 33,538 2.1
Total Base Budget Change 32,874 2.5 24,450 1.6 28,199 1.7
Impact of Previous Council Decisions:
Impact of Capital (Net) 13,578 0.9 11,381 0.8 16,438 1.1
Debt Financing 10,535 0.8 18,770 1.3 16,740 1.1
Annualization (Net) 4,725 0.3 202 0.0 336 0.0
28,838 2.0 30,353 2.1 33,514 2.2
Assessment Growth 38,702 2.8 24,720 1.7 25,798 1.6
Total to Maintain 23,010 1.7 30,083 2.0 35,915 2.3
Growth/New Service Packages 12,823 0.9 8,212 0.6 4,795 0.3
Neighbourhood Renewal Program - - - - 21,890 1.4
Valley Line LRT 10,700 0.8 11,500 0.8 12,300 0.8
Total Tax Supported Operations 46,533 3.4 49,795 3.4 74,900 4.8
2016 - 2018 Approved Budget Incremental Changes 2016 2017 2018
- 36 -

Budget in Brief
2016 – 2018 Operating Budget
Budgeting for Results
The City aims to strike a balance of affordable taxes for property owners and reasonable user fees, while achieving
program results and maintaining priority services for the general public. Edmontonians provide valuable input on
operational priorities using a variety of channels, including comments through the city’s online reporting tools, calls
to 311, public consultation on specific programs, direct contact with the Mayor and Councillors throughout the year,
and through the budget public hearing.
Budget Development
On June 23, Administration updated City Council on the forecast for the 2016-2018 Budget. The projected cost
increases related to impacts of previous Council decisions including new infrastructure that will come into operation
between 2016-2018 were identified. Other projected increases to maintain service levels were identified for
personnel, fleet, and non-personnel inflation. Revenue increases were identified for increased assessment and both
volume and rate increases for user fees. The proposed tax levy increase at that time was estimated to be
approximately 6% for each of the three years. Administration also provided Council with an update to the Budget
Principles and an amendment was approved that any future year annualization costs be recognized in the third year
and any funds approved and not required until the following year, will be available to fund one-time initiatives.
Since then, Administration has continued to refine the forecast into a full multi-year budget. In the development of
this budget, all department submissions were reviewed for appropriate justification of change. Inflationary increases
were limited to those services with supported increased supplier costs. Administration also evaluated opportunities
for additional revenue and productivity enhancements, and where appropriate adjustments related to these have
been included in the 2016-2018 proposed budget. As a result of these efforts, the proposed budget increase is
approximately 1% lower in each of the three years than the spring forecast.
Budget Highlights
The 2016-2018 budget is shaped by a period of slowing growth in Alberta but also a need to operationalize
investments from previous periods of growth.
The 2016-2018 Budget includes inflationary rate increases for transit fares and admission to recreation facilities for
all three years; however, overall revenue is budgeted to flatten for volume and rates over 2017-2018. Due to strong
housing starts in the first half of 2015, real assessment growth revenues for 2016 are expected to remain positive.
As the expected slowing of the economy and the resulting reduction in new construction begin to take effect in 2017-
2018, the real assessment growth will also moderate, resulting in less new revenue available in the 2017-2018
budgets. These assessment growth estimates will need to be monitored as the years unfold, with any impacts to the
budget identified. Depending on the magnitude, there may be a need for future budget adjustments.
Personnel costs account for approximately 57% of the operating expenditures of the City. Personnel cost increases
included in the 2016-2018 budget are: for new personnel related to growth associated with operating new facilities
and infrastructure; to cover existing and potential contract settlements; to advance staff hired at less than the job
rate toward that rate; and for benefit cost increases. In addition to personnel costs, the approved budget covers
operating costs such as: fuel to power vehicles and equipment; road materials to fix potholes; and electricity and
natural gas to light and heat buildings. Total base budget expenditure changes net of base budget revenue
changes are expected to be well within the range of the consumer price index and the municipal price index.
- 37 -
Budget in Brief
2016 – 2018 Operating Budget Even in the environment of a slowing economy the City has to deal with the financial impacts of rapid expansion
over the last several years. This is reflected in the increases to the budgets in all three years for the impact of
capital. Through the 2015-2018 Capital budget the construction of fire halls and other City facilities was approved.
In order to bring these facilities into service they need to be resourced through the operating budget. Some of the
projects approved through the capital budget require debt financing which is reflected in the 2016-2018 operating
budget and which is consistent with the City’s debt management fiscal policy.
As part of the Operating Budget approval, City Council made the decision to suspend increases to the dedicated tax
levy for the Neighbourhood Renewal Program for 2016 and 2017. A multi-year dedicated tax increase of 0.8% was
approved for the Valley Line LRT to support the construction and future operation of the new Valley Line.
Administration has included a small number of service packages to reflect previous commitments. Departments
have also reprioritized within their base budgets to fund initiatives that will continue to move forward with achieving
Council’s vision. Examples of this include:
Advancing the recommendations of the ELEVATE report,
Completing the Facility Renewal Strategy,
Continuing to partner with groups to advance the existing Aboriginal initiative, and
Funding the Downtown Edmonton Pedway Network Wayfinding Concept Plan.
The approved budget includes a 3.4% tax increase for 2017 & 2018 and 4.8% in 2019. The impact of these
increases on a typical Edmonton homeowner with an assessed home value of $408,000 is an additional $77 per
year in 2016, $79 in 2017 and $116 in 2018. Administration believes the approved 2016-2018 Budget provides a
balance between managing expense increases required to continue to fund growth in the City and advancing
Council’s priorities for Edmontonians while keeping taxes affordable and user fees reasonable.
- 38 -

Budget in Brief
Typical Homeowner
Impact of the approved 2016-2018 municipal tax increases and utility rate increases on a
Typical Homeowner ($408,000 Assessed Value for each year)
2015 2016 Annual 2017 Annual 2018 Annual
Budget Budget Impact Budget Impact Budget Impact
Municipal Services 2,081$ 2,140$ 59$ 2,201$ 61$ 2,276$ 75$
Neighbourhood Renewal 181 181 - 181 - 203 22
Valley Line LRT - 18 18 36 18 55 19
Total Property Tax Bill1 2,262 2,339 77 2,418 79 2,534 116
Stormwater Drainage 2 117 123 6 129 6 135 6
Sanitary Drainage (Collection & Transmission) 3 268 274 6 280 6 286 6
Waste Management 4 488 516 28 542 26 572 30
Total Utility Bill 873 913 40 951 38 993 42
Total Municipal Services 3,135$ 3,252$ 117$ 3,369$ 117$ 3,527$ 158$
1 The Municipal Services increase is based on a approved tax increase of 2.6% in 2016, 2017 and 2018. The Neighbourhood Renew al increase is based on a dedicated tax increase of 1.4% in 2018. The Valley Line LRT is based on a dedicated tax increase of 0.8% in each year from 2016 to 2018. Total Property Tax Bill is based on a home assessed at $408,000. 2 For 2016 to 2018, the Approved Stormw ater Drainage Utility Fee is based on an average residential lot size of 552 m2.3 For 2016 to 2018, the Approved Sanitary Drainage (Collection & Transmission) Utility Fee is based upon an annual w ater consumption of 184.8 m3.4 For 2016 to 2018, the Approved Waste Management Utility Fee is based on a single family residential charge of $43.00 per month in 2016, $45.16 per month in 2017, and $47.72 per month in 2018.
2015 2016 Annual 2017 Annual 2018 Annual
Budget Budget Impact Budget Impact Budget Impact
Municipal Services 510$ 525$ 15$ 540$ 15$ 558$ 18$
Neighbourhood Renewal 44 44 - 44 - 50 6
Valley Line LRT - 4 4 9 5 13 4
Per $100k of assessment value, residential 554$ 573$ 19$ 593$ 20$ 621$ 28$
Impact of the approved 2016-2018 municipal tax increase
per $100,000 of assessment value, residential
- 39 -

Budget in Brief
Where the Money Comes From
Taxes collected from residential and commercial properties make up 52.4% of the total revenue needed for the
operating budget, which includes the amount for Valley Line LRT. In addition, there is 4.2% collected from
properties for Neighbourhood Renewal. Through Council approval of the budget, the amount required from
property taxes is determined. Each homeowner pays a share of the total tax required based on the value of his
or her home, relative to all other homes; as does each business. At 13.9% of the total revenue, user fees form
the next significant portion of revenue collected by the City. This revenue is generated primarily from permits,
transit fares and fees collected for the use of recreation facilities. The percentages shown in the chart below
reflect the 2016 approved budget and similar percentages would result from the 2017 and 2018 approved
budgets.
- 40 -

Budget in Brief
Where the Money is Spent
The total tax-supported expenditures for the major categories are shown in the chart below. The portion of the
City’s budget that is spent on providing police, transit, community services & attractions is 43%. The
percentages shown in the chart below reflect the expenditure amounts from the approved 2016 budget.
- 41 -

Budget in Brief
Monthly Average Household Spending
According to Statistics Canada’s most recent Survey of Household Spending (2013), the average Edmonton
household paid approximately $19,600 in taxes to all orders of government (income tax, education tax, sales tax
and property tax). Of this amount, 90.2% accrued to the Federal and Provincial Governments (60.9% and
29.3%, respectively) while the City’s total tax share equated to 9.8%.
Income taxes for Provincial and Federal Governments automatically increase with a rise in income; while
property taxes paid to the City do not automatically increase with a rise in assessment. In addition, both the
Provincial and Federal Governments levy a variety of consumption taxes that generate significant revenue.
Edmonton households receive exceptional value for their municipal property taxes. This payment delivers
services and amenities such as police, transit, parks, sports fields, community recreation centres, libraries, fire
protection, roads, and much more.
Monthly household expenses include all of the basic expenses to live and enjoy life in the City of Edmonton. For
an average Edmonton household in 2013, monthly spending was approximately $7,200, and included items
such as shelter, food, transportation, insurance, health care, and entertainment. Municipal tax accounted for only
2.2% of a typical household’s monthly expense.
- 42 -

Budget in Brief
Budget Principles In developing the approved 2016-2018 budget, Administration did adhere to the following budget principles:
a) The Operating Budget presented to Council in November will be based on the strategy set by Council in June and will outline any impacts on services needed in order to meet that strategic direction.
b) On-going revenue may fund on-going or one-time expenditures whereas one-time revenue may only fund
onetime expenditures.
c) Capital budgets submitted for approval will include details of the future financial requirements based on the full life cycle costs including operations.
d) All mid-year operating and capital budget, requests including requests for personnel, require a source of funding and should be considered in light of other corporate priorities.
e) All service packages, including those of Boards and Commissions, must include the budget requirement of
revenue and expenditures for only the amount required for each year except in year 3, where the full year requirement identified, and any funds approved and not required until the following year, will be available to fund one-time initiatives.
f) Budgets will include program outcomes, results, service levels and business drivers to support Council
decision making, which will move the City towards results based budget.
- 43 -

Impacts of a Growing City
2015-2018 Capital Budget
Municipal infrastructure is the backbone of our everyday life. It is how we get from home to the workplace, where
we go for recreation, how we dispose of waste, how we care for our books and heritage treasures, how we
position police and fire rescue around the city to protect us day and night. Public infrastructure is essential to all
residents and businesses in the city of Edmonton and critical to the competitiveness of our economy, the quality
of life citizens enjoy, and the delivery of public services.
Infrastructure is expensive to build or buy, renew or replace; therefore, getting the most value out of every dollar
spent on infrastructure is vital. The City invests in new infrastructure to meet the needs of a growing population
and economy, and repairs existing infrastructure to maintain the standards Edmontonians expect.
The ability to build and maintain infrastructure assets ensures Edmonton can provide services and remain an
attractive and cost-effective place to live and do business. As the City implements the 2015-2018 capital budget,
it does so on the heels of record levels of spending witnessed over the previous two capital cycles. This has
placed Edmonton on a solid foundation in terms of addressing key growth and renewal priorities.
Between 2004 and 2014, the City has invested $9.3 billion in infrastructure. This unprecedented level of
spending touches every corner of the city – from bridge construction to public transit, neighbourhood
revitalization to libraries, fire and police protection to parks and recreation and waste management – and
benefits all Edmontonians.
The foundation of the 2015-2018 Capital Budget was the 2015-2024 Capital Investment Agenda (CIA). The CIA
provides a high level overview of the City’s capital investment requirements over the next ten years and supports
the strategic direction of Council in the Way Ahead.
The 2015-2018 Capital Budget was approved in December 11, 2014 with $4.49 billion in capital spending in the
next four years, of which $1.60 billion had been approved through previous Council decisions. The approved
budget includes a further $1.76 billion that will be spent to continue work beyond 2018.
Original Approved Capital Budget—December 11, 2014
($000) 2015-2018 Total
2019 & Beyond
Recommended
Funding Overall Total
Renewal $1,882,857 $498,393 $2,381,250
Growth $2,605,626 $1,263,529 $3,869,155
TOTAL $4,488,483 $1,761,922 $6,250,405
- 44 -

Impacts of a Growing City
The 2015-2018 Capital Budget strikes a balance between investments in a growing city and the requirement to
keep existing City assets in good repair. 58% of the capital budget is in support of new projects such as light rail
transit, libraries, fire stations, as well as further investment to support a vibrant downtown. The remaining 42%
provides for the refurbishment of roads, neighbourhoods, parks, city buildings, and transit vehicles. Through the
investments outlined in the 2015-2018 Capital Budget, Edmontonians will benefit from both new and well
maintained infrastructure to enhance their quality of life.
The City is investing in great neighbourhoods – the building blocks of a great city. Transportation’s
Neighbourhood Renewal Program (NRP) outlines an effective, long term strategic approach to address
Edmonton’s neighbourhood infrastructure needs through the renewal and rebuilding of roads, sidewalks and
streetlights in existing neighbourhoods. The program balances the rebuild need in some neighbourhoods with
a preventative maintenance approach in others.
To advance growth projects in the City, the 2015-2018 budget includes $981.1 million in tax-supported debt
projects. These projects include the Valley Line ($458.3 million in 2015-2018 and an additional $299.7 million
beyond 2018), the Westwood Transit Garage ($186.5 million), Blatchford Redevelopment ($67.9 million), the
North West Campus ($62.5 million) (includes Detainee Management Centre and an Investigation and
Management Centre), the Great Neighbourhoods Program ($60.0 million), a co-located Dispatch and
Emergency Operations Centre at the North West Campus ($54.4 million for 2015-2018 and an additional $8.4
million in 2019), Milner Library Renewal and Upgrades ($51.5 million), Walterdale Bridge ($19.5 million),
Whitemud Drive Widening 66 to 34 Street ($14.6 million) and Coronation Community Recreation Centre ($5.9
million in 2015-2018 and an additional $85.4 million beyond 2018).
$478.9 million of self-supported tax-guaranteed debt growth projects were approved in the 2015-2018 Capital
budget. The projects financed by self-supported tax-guaranteed debt include The Quarters District Phase I and
Phase II projects ($47.1 million) and Transit Oriented Development Stadium Station ($5.0 million) and Downtown
Area, the Arena ($365.1 million) as well as the Capital City Downtown Plan projects ($61.7 million for 2015-
2018 and an additional $16.5 million for 2019 & beyond), which include Green and Walkable Downtown, Jasper
Avenue New Vision, the Warehouse Campus Neighbourhood Park, and 105 Street and 102 Avenue.
- 45 -
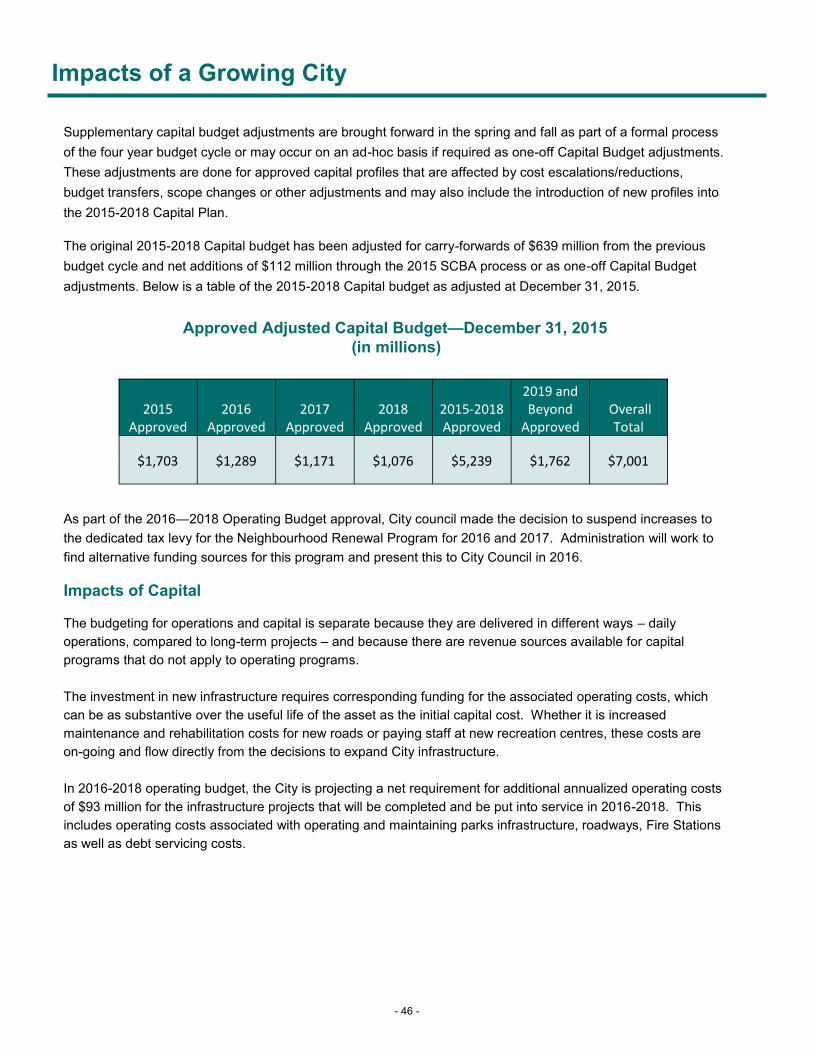
Impacts of a Growing City
Supplementary capital budget adjustments are brought forward in the spring and fall as part of a formal process
of the four year budget cycle or may occur on an ad-hoc basis if required as one-off Capital Budget adjustments.
These adjustments are done for approved capital profiles that are affected by cost escalations/reductions,
budget transfers, scope changes or other adjustments and may also include the introduction of new profiles into
the 2015-2018 Capital Plan.
The original 2015-2018 Capital budget has been adjusted for carry-forwards of $639 million from the previous
budget cycle and net additions of $112 million through the 2015 SCBA process or as one-off Capital Budget
adjustments. Below is a table of the 2015-2018 Capital budget as adjusted at December 31, 2015.
Approved Adjusted Capital Budget—December 31, 2015
(in millions)
As part of the 2016—2018 Operating Budget approval, City council made the decision to suspend increases to
the dedicated tax levy for the Neighbourhood Renewal Program for 2016 and 2017. Administration will work to
find alternative funding sources for this program and present this to City Council in 2016.
Impacts of Capital
The budgeting for operations and capital is separate because they are delivered in different ways – daily
operations, compared to long-term projects – and because there are revenue sources available for capital
programs that do not apply to operating programs.
The investment in new infrastructure requires corresponding funding for the associated operating costs, which
can be as substantive over the useful life of the asset as the initial capital cost. Whether it is increased
maintenance and rehabilitation costs for new roads or paying staff at new recreation centres, these costs are
on-going and flow directly from the decisions to expand City infrastructure.
In 2016-2018 operating budget, the City is projecting a net requirement for additional annualized operating costs
of $93 million for the infrastructure projects that will be completed and be put into service in 2016-2018. This
includes operating costs associated with operating and maintaining parks infrastructure, roadways, Fire Stations
as well as debt servicing costs.
2015 Approved
2016 Approved
2017 Approved
2018 Approved
2015-2018 Approved
2019 and Beyond
Approved Overall
Total
$1,703 $1,289 $1,171 $1,076 $5,239 $1,762 $7,001
- 46 -

Impacts of a Growing City
Operating Impacts of Capital and Contributed Assets
The 2016-2018 Approved Operating Budget includes funding of $13.6 million in 2016, $11.4 million in 2017 and
$16.4 million in 2018 in order to deal with the operating impacts from capital projects and contributed assets.
The table below provides a summary of all service packages related to operating impacts of capital and contributed
assets. Based on previous decisions made by Council, new and renovated facilities and services will begin
operations in 2016-2018. Staff will be required to operate and maintain the infrastructure as well as to provide
programs to the public. The City will also be taking on responsibility for new infrastructure as a result of assets
contributed by developers and growth of the City. The details of the operating impacts of capital and contributed
assets service packages are included in the branch sections and can be located using the page references provided
in this table.
# Operating Impacts of Capital ($000)
2016
Net
Req
2017
Net
Req
2018
Net
Req
Page
#
Edmonton Police Service
1
Annualization - - -
New Budget 2,488 1,597 1,378
Total 2,488 1,597 1,378
Total FTEs 15.0 10.0 4.0
2
Annualization - - -
New Budget - 687 1,521
Total - 687 1,521
Total FTEs - 5.0 5.0
Community & Recreation Facilities
3
Annualization - - -
New Budget 726 1,890 (68)
Total 726 1,890 (68)
Total FTEs 6.4 15.5 11.6
Operating Impacts of Capital
Northwest Division
This package calls for a steady buildup of employees who will
operate NW Division now, and transition to the new station in
2018. 13 employees (mostly sworn) will be required in 2016
to augment employees currently assigned to NW; ten more
will be required in 2017, and the final 4 will be required in
2018. Also included are two additional police dispatchers to
work in the Police Communication Branch (commonly known
as 9-1-1) to manage the dispatch (radio) channel for the new
Division. Each division has a dispatcher assigned on a 24 x 7
basis. The early opening of NW Division resulted in these
positions being required sooner than first planned.
Digital Asset Management Project
The Digital Asset Management Project (DAMS) will
significantly increase EPS capacity for storing digital records
of all kind, including police records, body worn video,
surveillance video, and photographs. Over the next three
years, five employees will be required to transition materials
and records to DAMS and keep it operational on a 24
hour/day basis. Other positions focus on various aspects of
security for the EPS. Two security management civilians will
oversee the safety and security of EPS employees, facilities
and information. To keep up with the growth in EPS facilities,
and to maintain several rapidly ageing buildings, two building
and facility project officers are required.
This package identifies the on-going funding required to
operate and maintain the 2016 to 2018 Council approved
capital profiles. This funding allows for the operation and
maintenance of significant river valley and River Valley
Alliance capital projects, impacts for Community Strategies,
Community Standards, and the new Borden Outdoor Pool.
138
540
539
- 47 -

Impacts of a Growing City
Operating Impacts of Capital and Contributed Assets
# Operating Impacts of Capital ($000)
2016
Net
Req
2017
Net
Req
2018
Net
Req
Page
#
4
Annualization - 202 - 139
New Budget 343 518 13
Total 343 720 13
Total FTEs 0.6 1.9
Facility and Landscape Infrastructure
5
Annualization - 328 272 173
New Budget 3,953 567 1,979
Total 3,953 895 2,251
Total FTEs 16.3 14.1 21.6
Fire Rescue Services
6
Annualization - 1,959 - 186
New Budget 1,452 443 59
Total 1,452 2,402 59
Total FTEs 10.3 16.7
7
Annualization - - 111 187
New Budget - 723 34
Total - 723 145
Total FTEs 4.3 0.7
8
Annualization - - 415 188
New Budget - 321 3,418
Total - 321 3,832
Total FTEs - 2.3 26.1
Downtown Arena - Community Services
Operating Impacts of Capital
Pilot Sound Fire Station
Rossdale Fire Station
Windermere Fire Station
A new fire station in the Windermere community was
approved by City Council. This service package identifies the
ongoing funding required to operate and maintain the
Windermere fire station, which will improve Fire Rescue
Services response in the southwest of the city. The service
package also identifies operating cost impacts due to
increased demand on existing services driven by internal
growth.
A new fire station in the Pilot Sound community was
approved by City Council. This service package identifies the
ongoing funding required to operate and maintain the Pilot
Sound fire station, which will improve Fire Rescue Services
response to communities in the northeast of the city.
City Council approved renovation and reactivation of the
Rossdale fire station. This service package identifies the
ongoing funding required to operate and maintain the re-
activated Rossdale fire station, which will improve river rescue
response and improve downtown rescue response.
This service package allows for operation, maintenance,
programming and social supports needed from Community
Services for this capital development.
This service package provides for funding for maintenance
and custodial services at new City of Edmonton facilities that
will open in 2016-2018 including those for Waste
Management Services, Edmonton Transit and the
Community Services Department. Facility and Landscape
Infrastructure also provides maintenance and custodial
services to the Edmonton Police Service and the Edmonton
Public Library.
- 48 -

Impacts of a Growing City
Operating Impacts of Capital and Contributed Assets
# Operating Impacts of Capital ($000)
2016
Net
Req
2017
Net
Req
2018
Net
Req
Page
#
Neighbourhoods
9
Annualization - - - 198
New Budget 496 1,355 938
Total 496 1,355 938
Total FTEs 5.1 9.9 9.5
Corporate Procurement and Supply Services
10
Annualization - - - 226
New Budget - - -
Total - - -
Total FTEs 3.0
Fleet Services
11
Annualization - - - 247
New Budget - - -
Total - - -
Total FTEs 2.0 - -
12
Annualization - - - 246
New Budget - - -
Total - - -
Total FTEs 2.0 2.0
Human Resources
13
Annualization - - - 260
New Budget - 259 -
Total - 259 -
Total FTEs - 1.0 -
The Succession Planning and Talent Management modules
are part of HR's modernization and will support the advanced
ability to understand, manage and report on talent at a
corporate level.
This request is for the operating impacts of the capital which
will include licensing fees, administrative support and
maintenance / sustainment activities.
Corporate Succession & Talent Mgmt
This service package identifies the on-going funding required
to operate and maintain the 2016 to 2018, Council approved,
capital profiles with significant parks projects that require
ongoing maintenance of these new assets. Funding will allow
for the maintenance of parks assets, including mowing and
trimming in parks and roadways, inventories, horticulture,
sportsfields, play spaces.
To support growth in the number of technology-related
projects and capital construction projects as outlined in the
2015-18 Capital Budget plan, additional resources are
required to maintain existing service levels.
Gross cost $300K charged to Capital Plan
Maintain and provide reporting from a number of information
and reporting systems to allow for City Departments and
clients to access timely data for the management of their
fleets including fleet usage, efficiency and budget
management.
Community Services is expected to add $10.1 M to their fleet
in 2015 SCBA. Volumes of maintenance hours are
increasing to service additional units for Community Services
and higher usage for vehicles and equipment. Growth and
demand for the fleet remains high, requiring additional
resources to complete maintenance forecasted.
Operating Impacts of Capital
Growth Positions for Capital Procurement
Logistics and Information Analysis
Increased Maintenance Requirements
- 49 -
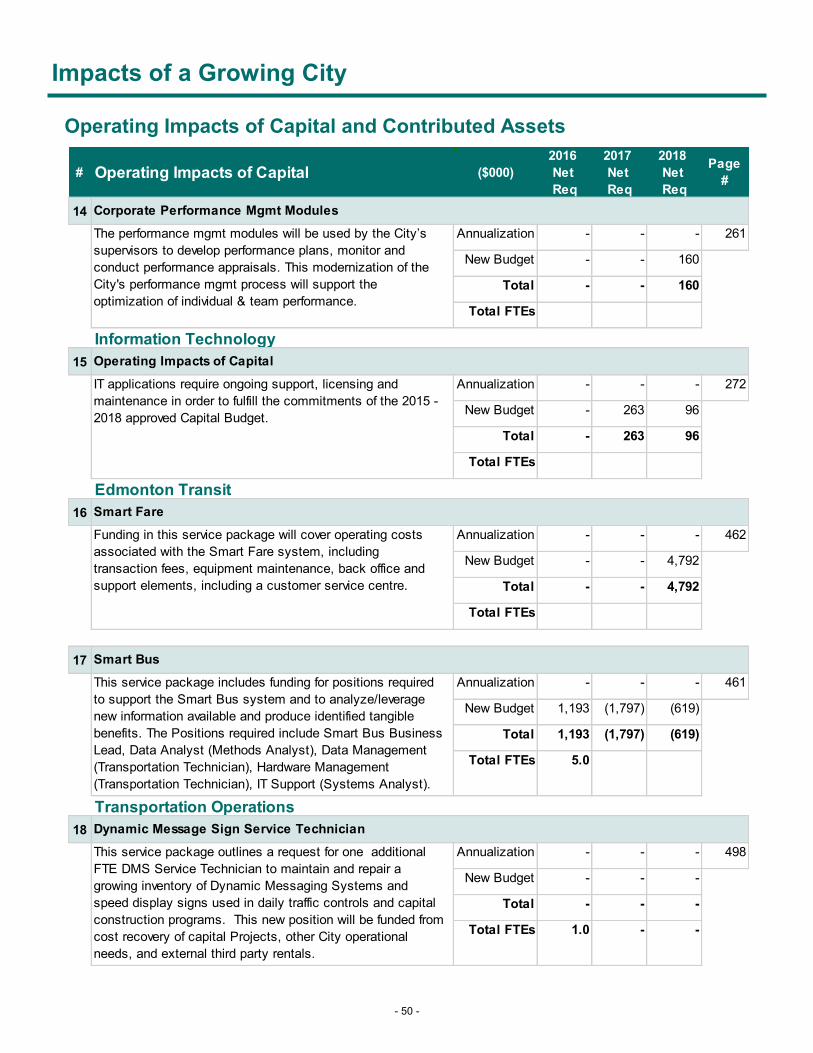
Impacts of a Growing City
Operating Impacts of Capital and Contributed Assets
# Operating Impacts of Capital ($000)
2016
Net
Req
2017
Net
Req
2018
Net
Req
Page
#
14
Annualization - - - 261
New Budget - - 160
Total - - 160
Total FTEs
Information Technology
15
Annualization - - - 272
New Budget - 263 96
Total - 263 96
Total FTEs
Edmonton Transit
16
Annualization - - - 462
New Budget - - 4,792
Total - - 4,792
Total FTEs
17
Annualization - - - 461
New Budget 1,193 (1,797) (619)
Total 1,193 (1,797) (619)
Total FTEs 5.0
Transportation Operations
18
Annualization - - - 498
New Budget - - -
Total - - -
Total FTEs 1.0 - -
This service package outlines a request for one additional
FTE DMS Service Technician to maintain and repair a
growing inventory of Dynamic Messaging Systems and
speed display signs used in daily traffic controls and capital
construction programs. This new position will be funded from
cost recovery of capital Projects, other City operational
needs, and external third party rentals.
IT applications require ongoing support, licensing and
maintenance in order to fulfill the commitments of the 2015 -
2018 approved Capital Budget.
Funding in this service package will cover operating costs
associated with the Smart Fare system, including
transaction fees, equipment maintenance, back office and
support elements, including a customer service centre.
The performance mgmt modules will be used by the City’s
supervisors to develop performance plans, monitor and
conduct performance appraisals. This modernization of the
City's performance mgmt process will support the
optimization of individual & team performance.
This request is for the operating impacts of the capital which
Corporate Performance Mgmt Modules
This service package includes funding for positions required
to support the Smart Bus system and to analyze/leverage
new information available and produce identified tangible
benefits. The Positions required include Smart Bus Business
Lead, Data Analyst (Methods Analyst), Data Management
(Transportation Technician), Hardware Management
(Transportation Technician), IT Support (Systems Analyst).
Operating Impacts of Capital
Smart Fare
Smart Bus
Dynamic Message Sign Service Technician
- 50 -
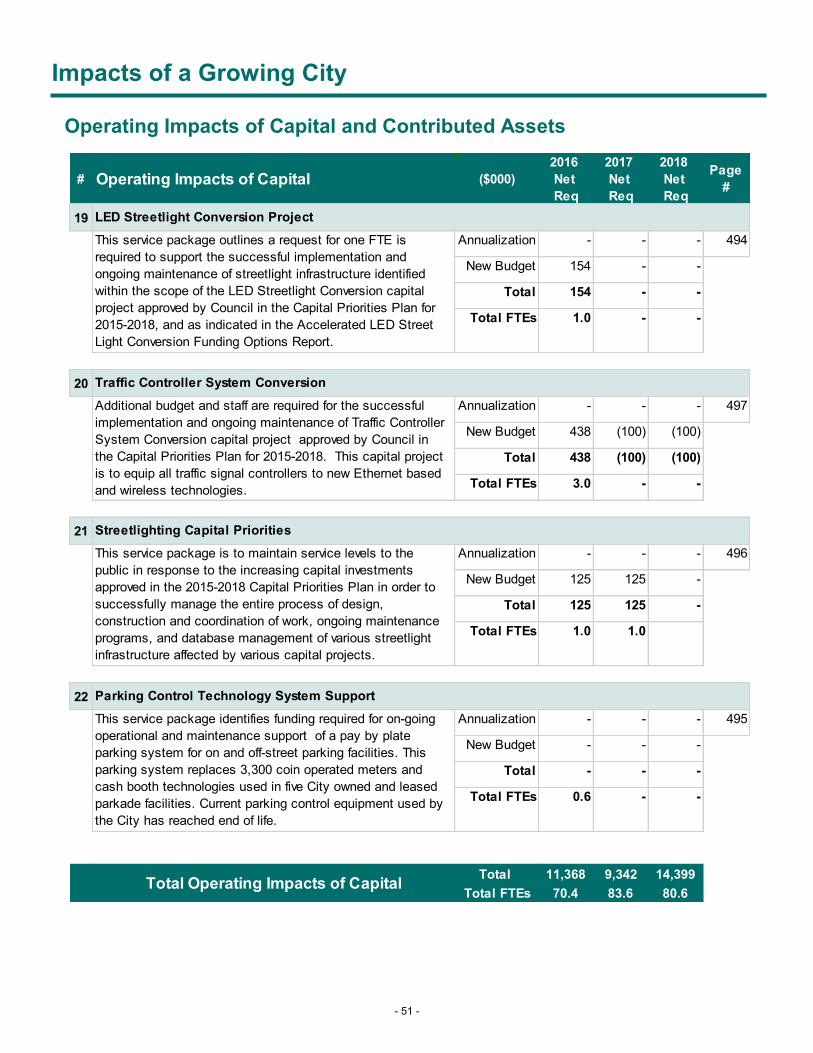
Impacts of a Growing City
Operating Impacts of Capital and Contributed Assets
# Operating Impacts of Capital ($000)
2016
Net
Req
2017
Net
Req
2018
Net
Req
Page
#
19
Annualization - - - 494
New Budget 154 - -
Total 154 - -
Total FTEs 1.0 - -
20
Annualization - - - 497
New Budget 438 (100) (100)
Total 438 (100) (100)
Total FTEs 3.0 - -
21
Annualization - - - 496
New Budget 125 125 -
Total 125 125 -
Total FTEs 1.0 1.0
22
Annualization - - - 495
New Budget - - -
Total - - -
Total FTEs 0.6 - -
Total 11,368 9,342 14,399Total FTEs 70.4 83.6 80.6
This service package is to maintain service levels to the
public in response to the increasing capital investments
approved in the 2015-2018 Capital Priorities Plan in order to
successfully manage the entire process of design,
construction and coordination of work, ongoing maintenance
programs, and database management of various streetlight
infrastructure affected by various capital projects.
This service package identifies funding required for on-going
operational and maintenance support of a pay by plate
parking system for on and off-street parking facilities. This
parking system replaces 3,300 coin operated meters and
cash booth technologies used in five City owned and leased
parkade facilities. Current parking control equipment used by
the City has reached end of life.
Total Operating Impacts of Capital
Parking Control Technology System Support
This service package outlines a request for one FTE is
required to support the successful implementation and
ongoing maintenance of streetlight infrastructure identified
within the scope of the LED Streetlight Conversion capital
project approved by Council in the Capital Priorities Plan for
2015-2018, and as indicated in the Accelerated LED Street
Light Conversion Funding Options Report.
Streetlighting Capital Priorities
Additional budget and staff are required for the successful
implementation and ongoing maintenance of Traffic Controller
System Conversion capital project approved by Council in
the Capital Priorities Plan for 2015-2018. This capital project
is to equip all traffic signal controllers to new Ethernet based
and wireless technologies.
Traffic Controller System Conversion
LED Streetlight Conversion Project
- 51 -
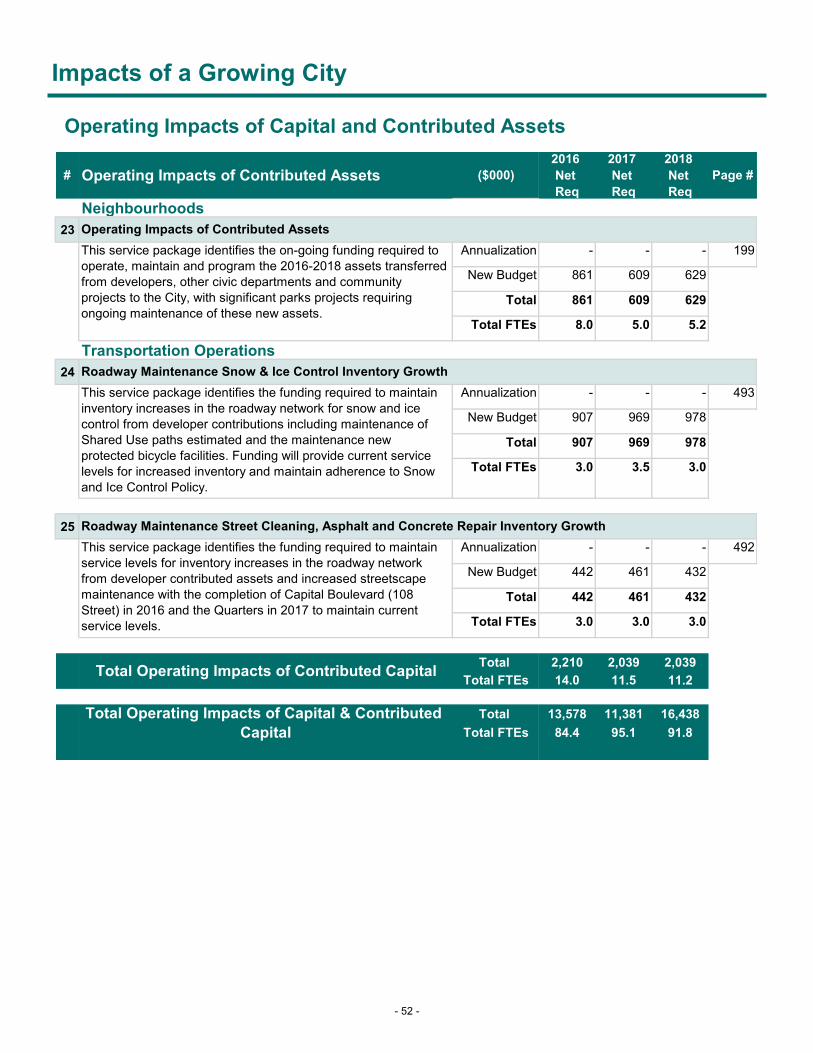
Impacts of a Growing City
Operating Impacts of Capital and Contributed Assets
# Operating Impacts of Contributed Assets ($000)
2016
Net
Req
2017
Net
Req
2018
Net
Req
Page #
Neighbourhoods
23
Annualization - - - 199
New Budget 861 609 629
Total 861 609 629
Total FTEs 8.0 5.0 5.2
Transportation Operations
24
Annualization - - - 493
New Budget 907 969 978
Total 907 969 978
Total FTEs 3.0 3.5 3.0
25
Annualization - - - 492
New Budget 442 461 432
Total 442 461 432
Total FTEs 3.0 3.0 3.0
Total 2,210 2,039 2,039
Total FTEs 14.0 11.5 11.2
Total 13,578 11,381 16,438Total FTEs 84.4 95.1 91.8
This service package identifies the funding required to maintain
inventory increases in the roadway network for snow and ice
control from developer contributions including maintenance of
Shared Use paths estimated and the maintenance new
protected bicycle facilities. Funding will provide current service
levels for increased inventory and maintain adherence to Snow
and Ice Control Policy.
Operating Impacts of Contributed Assets
This service package identifies the on-going funding required to
operate, maintain and program the 2016-2018 assets transferred
from developers, other civic departments and community
projects to the City, with significant parks projects requiring
ongoing maintenance of these new assets.
Total Operating Impacts of Contributed Capital
Total Operating Impacts of Capital & Contributed
Capital
This service package identifies the funding required to maintain
service levels for inventory increases in the roadway network
from developer contributed assets and increased streetscape
maintenance with the completion of Capital Boulevard (108
Street) in 2016 and the Quarters in 2017 to maintain current
service levels.
Roadway Maintenance Snow & Ice Control Inventory Growth
Roadway Maintenance Street Cleaning, Asphalt and Concrete Repair Inventory Growth
- 52 -
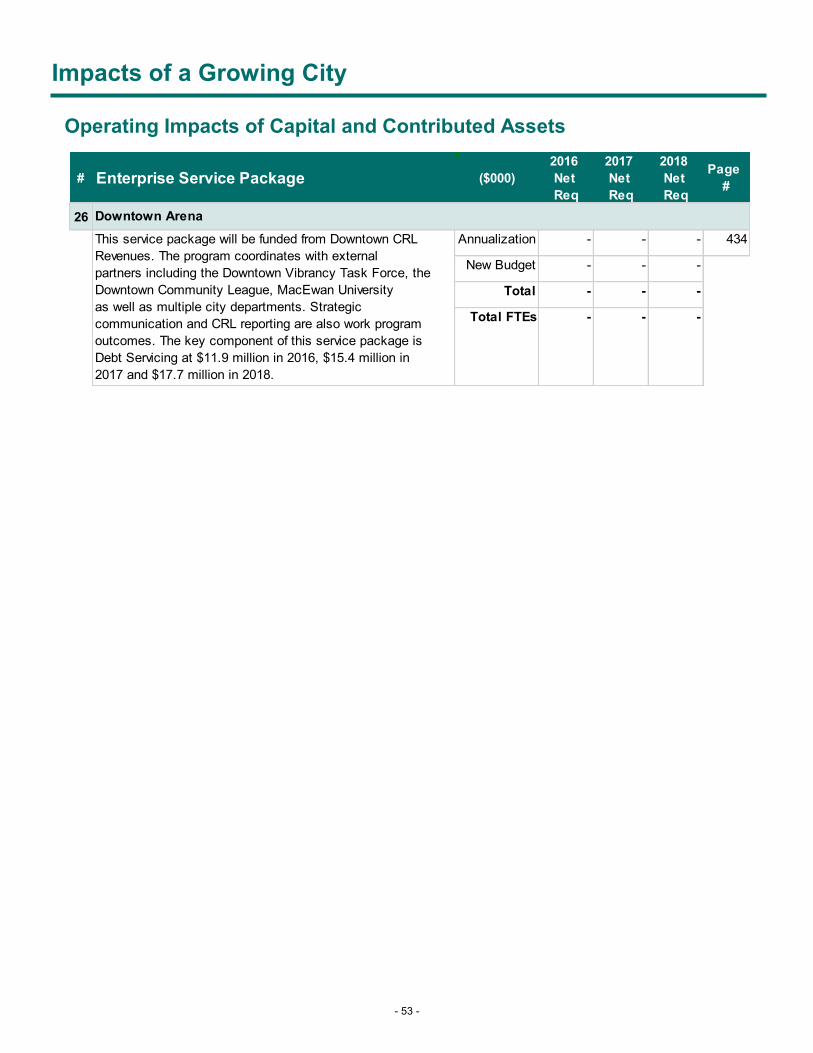
Impacts of a Growing City
Operating Impacts of Capital and Contributed Assets
# Enterprise Service Package ($000)
2016
Net
Req
2017
Net
Req
2018
Net
Req
Page
#
26
Annualization - - - 434
New Budget - - -
Total - - -
Total FTEs - - -
Downtown Arena
This service package will be funded from Downtown CRL
Revenues. The program coordinates with external
partners including the Downtown Vibrancy Task Force, the
Downtown Community League, MacEwan University
as well as multiple city departments. Strategic
communication and CRL reporting are also work program
outcomes. The key component of this service package is
Debt Servicing at $11.9 million in 2016, $15.4 million in
2017 and $17.7 million in 2018.
- 53 -
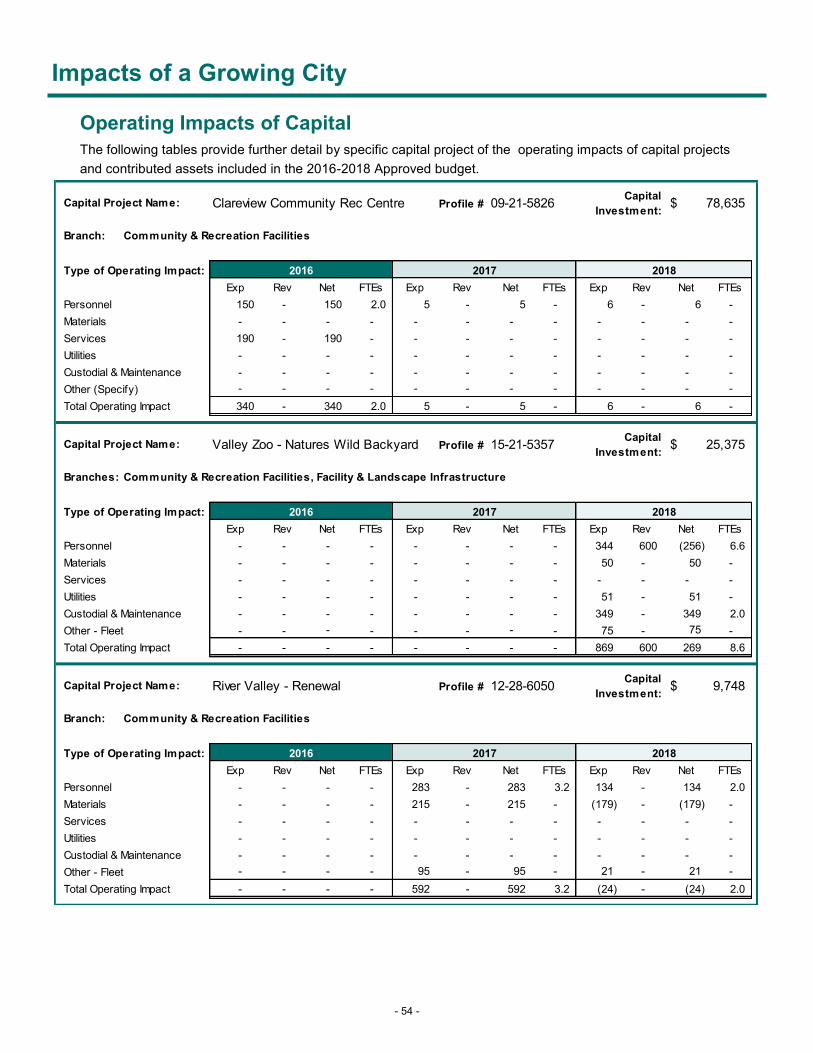
Impacts of a Growing City
Operating Impacts of Capital
The following tables provide further detail by specific capital project of the operating impacts of capital projects
and contributed assets included in the 2016-2018 Approved budget.
Profile #
Branch: Community & Recreation Facilities
2016 2017 2018
Exp Rev Net FTEs Exp Rev Net FTEs Exp Rev Net FTEs
150 - 150 2.0 5 - 5 - 6 - 6 -
Materials - - - - - - - - - - - -
Services 190 - 190 - - - - - - - - -
Utilities - - - - - - - - - - - -
Custodial & Maintenance - - - - - - - - - - - -
- - - - - - - - - - - -
340 - 340 2.0 5 - 5 - 6 - 6 -
Profile #
Branches: Community & Recreation Facilities, Facility & Landscape Infrastructure
2016 2017 2018
Exp Rev Net FTEs Exp Rev Net FTEs Exp Rev Net FTEs
- - - - - - - - 344 600 (256) 6.6
Materials - - - - - - - - 50 - 50 -
Services - - - - - - - - - - - -
Utilities - - - - - - - - 51 - 51 -
Custodial & Maintenance - - - - - - - - 349 - 349 2.0
- - - - - - - - 75 - 75 -
- - - - - - - - 869 600 269 8.6
Profile #
Branch: Community & Recreation Facilities
2016 2017 2018
Exp Rev Net FTEs Exp Rev Net FTEs Exp Rev Net FTEs
- - - - 283 - 283 3.2 134 - 134 2.0
Materials - - - - 215 - 215 - (179) - (179) -
Services - - - - - - - - - - - -
Utilities - - - - - - - - - - - -
Custodial & Maintenance - - - - - - - - - - - -
- - - - 95 - 95 - 21 - 21 -
- - - - 592 - 592 3.2 (24) - (24) 2.0
Capital Project Name: Clareview Community Rec Centre 09-21-5826Capital
Investment:78,635$
Type of Operating Impact:
Personnel
Other (Specify)
Total Operating Impact
Capital Project Name: Valley Zoo - Natures Wild Backyard 15-21-5357Capital
Investment:25,375$
Type of Operating Impact:
Personnel
Other - Fleet
Total Operating Impact
Capital Project Name: River Valley - Renewal 12-28-6050Capital
Investment:9,748$
Type of Operating Impact:
Personnel
Other - Fleet
Total Operating Impact
- 54 -
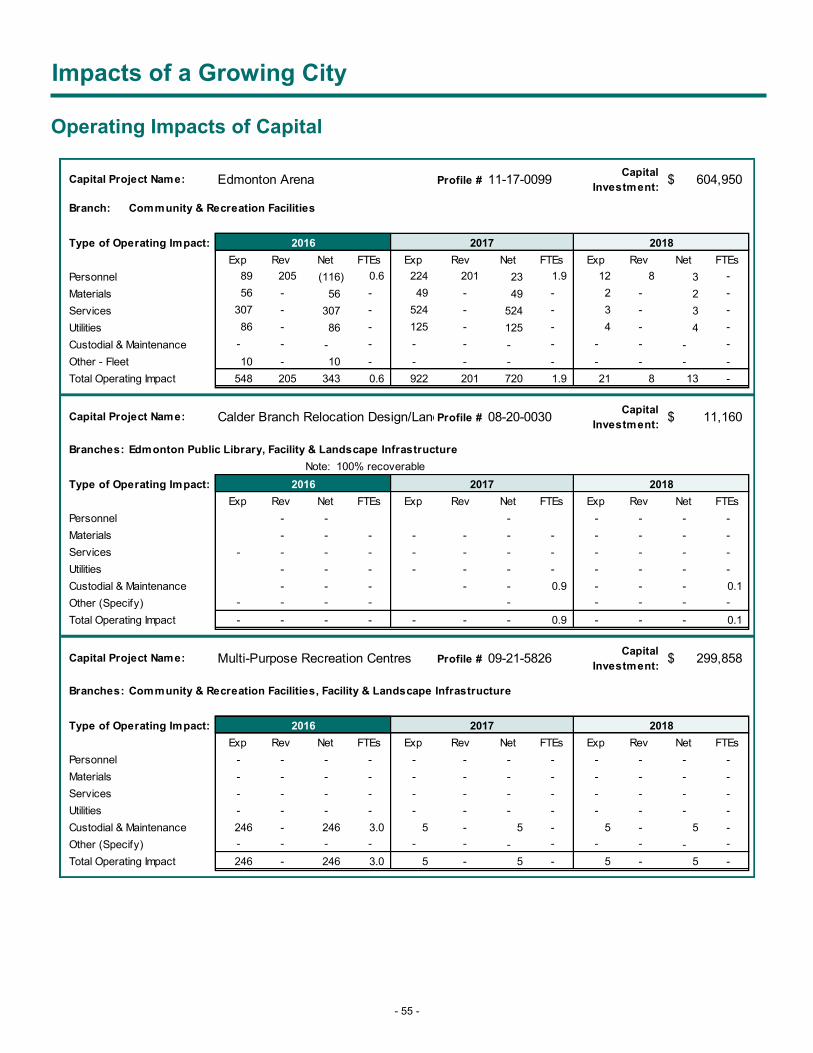
Impacts of a Growing City
Profile #
Branch: Community & Recreation Facilities
2016 2017 2018
Exp Rev Net FTEs Exp Rev Net FTEs Exp Rev Net FTEs
89 205 (116) 0.6 224 201 23 1.9 12 8 3 -
Materials 56 - 56 - 49 - 49 - 2 - 2 -
Services 307 - 307 - 524 - 524 - 3 - 3 -
Utilities 86 - 86 - 125 - 125 - 4 - 4 -
Custodial & Maintenance - - - - - - - - - - - -
10 - 10 - - - - - - - - -
548 205 343 0.6 922 201 720 1.9 21 8 13 -
Profile #
Branches: Edmonton Public Library, Facility & Landscape Infrastructure
Note: 100% recoverable
2016 2017 2018
Exp Rev Net FTEs Exp Rev Net FTEs Exp Rev Net FTEs
- - - - - - -
Materials - - - - - - - - - - -
Services - - - - - - - - - - - -
Utilities - - - - - - - - - - -
Custodial & Maintenance - - - - - 0.9 - - - 0.1
- - - - - - - - -
- - - - - - - 0.9 - - - 0.1
Profile #
Branches: Community & Recreation Facilities, Facility & Landscape Infrastructure
2016 2017 2018
Exp Rev Net FTEs Exp Rev Net FTEs Exp Rev Net FTEs
- - - - - - - - - - - -
Materials - - - - - - - - - - - -
Services - - - - - - - - - - - -
Utilities - - - - - - - - - - - -
Custodial & Maintenance 246 - 246 3.0 5 - 5 - 5 - 5 -
- - - - - - - - - - - -
246 - 246 3.0 5 - 5 - 5 - 5 -
Type of Operating Impact:
Personnel
Other - Fleet
Total Operating Impact
Capital Project Name: Edmonton Arena 11-17-0099Capital
Investment:604,950$
Capital Project Name: Calder Branch Relocation Design/Land 08-20-0030Capital
Investment:11,160$
Type of Operating Impact:
Personnel
Other (Specify)
Total Operating Impact
Capital Project Name: Multi-Purpose Recreation Centres 09-21-5826Capital
Investment:299,858$
Type of Operating Impact:
Personnel
Other (Specify)
Total Operating Impact
Operating Impacts of Capital
- 55 -

Impacts of a Growing City
Profile #
Branches: Edmonton Public Library, Facility & Landscape Infrastructure
Note: 100% recoverable
2016 2017 2018
Exp Rev Net FTEs Exp Rev Net FTEs Exp Rev Net FTEs
- - - - - - - - - - - -
Materials - - - - - - - - - - - -
Services - - - - - - - - - - - -
Utilities - - - - - - - - - - - -
Custodial & Maintenance - - - - - - - 0.5 - - - 0.5
- - - - - - - - - - - -
- - - - - - - 0.5 - - - 0.5
Profile #
Branches: Urban Planning & Environment , Facility & Landscape Infrastructure
2016 2017 2018
Exp Rev Net FTEs Exp Rev Net FTEs Exp Rev Net FTEs
- - - - - - - - - - - -
Materials - - - - - - - - - - - -
Services - - - - - - - - - - - -
Utilities - - - - - - - - - - - -
Custodial & Maintenance 153 - 153 1.0 (54) - (54) - 4 - 4 -
- - - - - - - - - - - -
153 - 153 1.0 (54) - (54) - 4 - 4 -
Profile #
Branches: Community & Recreation Facilities, Facility & Landscape Infrastructure
2016 2017 2018
Exp Rev Net FTEs Exp Rev Net FTEs Exp Rev Net FTEs
- - - - - - - - - - - -
Materials - - - - - - - - - - - -
Services - - - - - - - - - - - -
Utilities - - - - - - - - - - - -
Custodial & Maintenance - - - - 34 - 34 - - - - -
- - - - - - - - - - - -
- - - - 34 - 34 - - - - -
Capital Project Name: Capilano Branch Relocation 11-20-0038Capital
Investment:11,807$
Type of Operating Impact:
Personnel
Other (Specify)
Total Operating Impact
Capital Project Name: RVA Connective Infrastructure 12-17-6100Capital
Investment:114,264$
Type of Operating Impact:
Personnel
Other (Specify)
Total Operating Impact
Capital Project Name:Whitemud Equine Centre
Redevelopment12-21-5742
Capital
Investment:6,501$
Type of Operating Impact:
Personnel
Other (Specify)
Total Operating Impact
Operating Impacts of Capital
- 56 -

Impacts of a Growing City
Profile #
Branches: Edmonton Transit, Facility & Landscape Infrastructure
2016 2017 2018
Exp Rev Net FTEs Exp Rev Net FTEs Exp Rev Net FTEs
- - - - - - - - - - - -
Materials - - - - - - - - - - - -
Services - - - - - - - - - - - -
Utilities - - - - - - - - - - - -
Custodial & Maintenance - - - - - - - - 1,542 - 1,542 4.0
- - - - - - - - - - - -
- - - - - - - - 1,542 - 1,542 4.0
Profile #
Branches: Real Estate,Housing & Economic Sustainability, Facility & Landscape Infrastructure
2016 2017 2018
Exp Rev Net FTEs Exp Rev Net FTEs Exp Rev Net FTEs
- - - - - - - - - - - -
Materials - - - - - - - - - - - -
Services - - - - - - - - - - - -
Utilities - - - - - - - - - - - -
Custodial & Maintenance - - - - 81 - 81 0.5 2 - 2 -
- - - - - - - - - - - -
- - - - 81 - 81 0.5 2 - 2 -
Profile #
Branch: Facility and Landscape Infrastructure
2016 2017 2018
Exp Rev Net FTEs Exp Rev Net FTEs Exp Rev Net FTEs
- - - - - - - - - - - -
Materials - - - - - - - - - - - -
Services - - - - - - - - - - - -
Utilities - - - - - - - - - - - -
Custodial & Maintenance 450 - 450 - - - - - - - - -
- - - - - - - - - - - -
450 - 450 - - - - - - - - -
Other (Specify)
Total Operating Impact
Capital
Investment:2,800$
Type of Operating Impact:
Personnel
Total Operating Impact
Capital Project Name:Project Management & Information
System 14-75-0102
22,400$
Type of Operating Impact:
Personnel
Other (Specify)
Capital Project Name: Galleria Project-Pedway Connection 14-17-5037Capital
Investment:
Type of Operating Impact:
Personnel
Other (Specify)
Total Operating Impact
Capital Project Name:Westwood Transit Garage
Replacement12-66-1413
Capital
Investment:201,517$
Operating Impacts of Capital
- 57 -
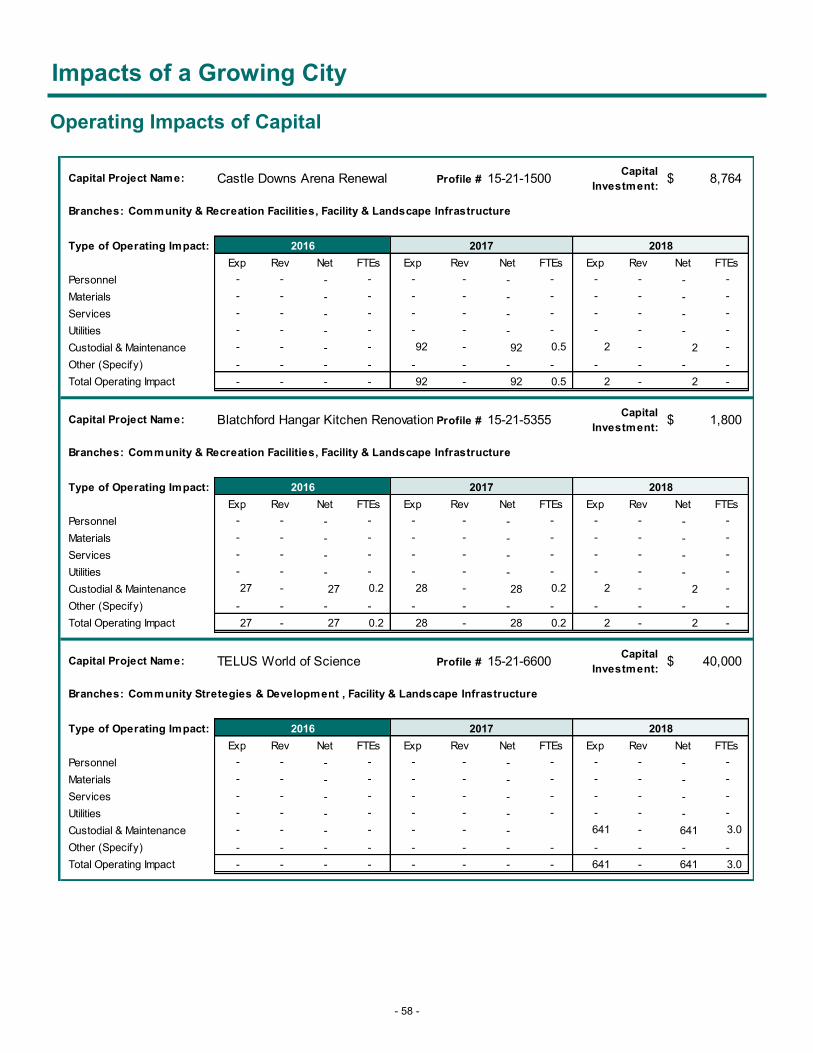
Impacts of a Growing City
Profile #
Branches: Community & Recreation Facilities, Facility & Landscape Infrastructure
2016 2017 2018
Exp Rev Net FTEs Exp Rev Net FTEs Exp Rev Net FTEs
- - - - - - - - - - - -
Materials - - - - - - - - - - - -
Services - - - - - - - - - - - -
Utilities - - - - - - - - - - - -
Custodial & Maintenance - - - - 92 - 92 0.5 2 - 2 -
- - - - - - - - - - - -
- - - - 92 - 92 0.5 2 - 2 -
Profile #
Branches: Community & Recreation Facilities, Facility & Landscape Infrastructure
2016 2017 2018
Exp Rev Net FTEs Exp Rev Net FTEs Exp Rev Net FTEs
- - - - - - - - - - - -
Materials - - - - - - - - - - - -
Services - - - - - - - - - - - -
Utilities - - - - - - - - - - - -
Custodial & Maintenance 27 - 27 0.2 28 - 28 0.2 2 - 2 -
- - - - - - - - - - - -
27 - 27 0.2 28 - 28 0.2 2 - 2 -
Profile #
Branches: Community Stretegies & Development , Facility & Landscape Infrastructure
2016 2017 2018
Exp Rev Net FTEs Exp Rev Net FTEs Exp Rev Net FTEs
- - - - - - - - - - - -
Materials - - - - - - - - - - - -
Services - - - - - - - - - - - -
Utilities - - - - - - - - - - - -
Custodial & Maintenance - - - - - - - 641 - 641 3.0
- - - - - - - - - - - -
- - - - - - - - 641 - 641 3.0
Capital Project Name: Castle Downs Arena Renewal 15-21-1500Capital
Investment:8,764$
Type of Operating Impact:
Personnel
Other (Specify)
Total Operating Impact
Capital Project Name: Blatchford Hangar Kitchen Renovation 15-21-5355Capital
Investment:1,800$
Type of Operating Impact:
Personnel
Other (Specify)
Total Operating Impact
Capital Project Name: TELUS World of Science 15-21-6600Capital
Investment:40,000$
Type of Operating Impact:
Personnel
Other (Specify)
Total Operating Impact
Operating Impacts of Capital
- 58 -

Impacts of a Growing City
Profile #
Branches: Neighbourhoods , Facility & Landscape Infrastructure
2016 2017 2018
Exp Rev Net FTEs Exp Rev Net FTEs Exp Rev Net FTEs
- - - - - - - - - - - -
Materials - - - - - - - - - - - -
Services - - - - - - - - - - - -
Utilities - - - - - - - - - - - -
Custodial & Maintenance - - - - 373 - 373 2.0 (130) - (130) -
- - - - - - - - - - - -
- - - - - - - - - - - -
- - - - 373 - 373 2.0 (130) - (130) -
Profile #
Branches: Fleet Services, Facility & Landscape Infrastructure
2016 2017 2018
Exp Rev Net FTEs Exp Rev Net FTEs Exp Rev Net FTEs
- - - - - - - - - - - -
Materials - - - - - - - - - - - -
Services - - - - - - - - - - - -
Utilities - - - - - - - - - - - -
Custodial & Maintenance 10 - 10 - - - - - - - - -
- - - - - - - - - - - -
10 - 10 - - - - - - - - -
Profile #
Branches: Community Strategies & Development , Facility & Landscape Infrastructure
2016 2017 2018
Exp Rev Net FTEs Exp Rev Net FTEs Exp Rev Net FTEs
- - - - - - - - - - - -
Materials - - - - - - - - - - - -
Services - - - - - - - - - - - -
Utilities - - - - - - - - - - - -
Custodial & Maintenance 110 - 110 0.5 (56) - (56) - 2 - 2 -
- - - - - - - - - - - -
110 - 110 0.5 (56) - (56) - 2 - 2 -
Personnel
Other (Specify)
Total Operating Impact
Safety & Security - Composite CM-21-5771Capital
Investment:6,000$
Type of Operating Impact:
Personnel
Other (Specify)
Total Operating Impact
Capital Project Name:
Upgraded Fuel Site-Kennedale 16-25-4003Capital
Investment:4,330$
Type of Operating Impact:
Capital Project Name:
Personnel
Other (Specify)
Total Operating Impact
15-28-4200Capital
Investment:24,698$
Type of Operating Impact:
Capital Project Name:Ambleside SW District
Office,Maintenance Yard & Fuel Site
Operating Impacts of Capital
- 59 -
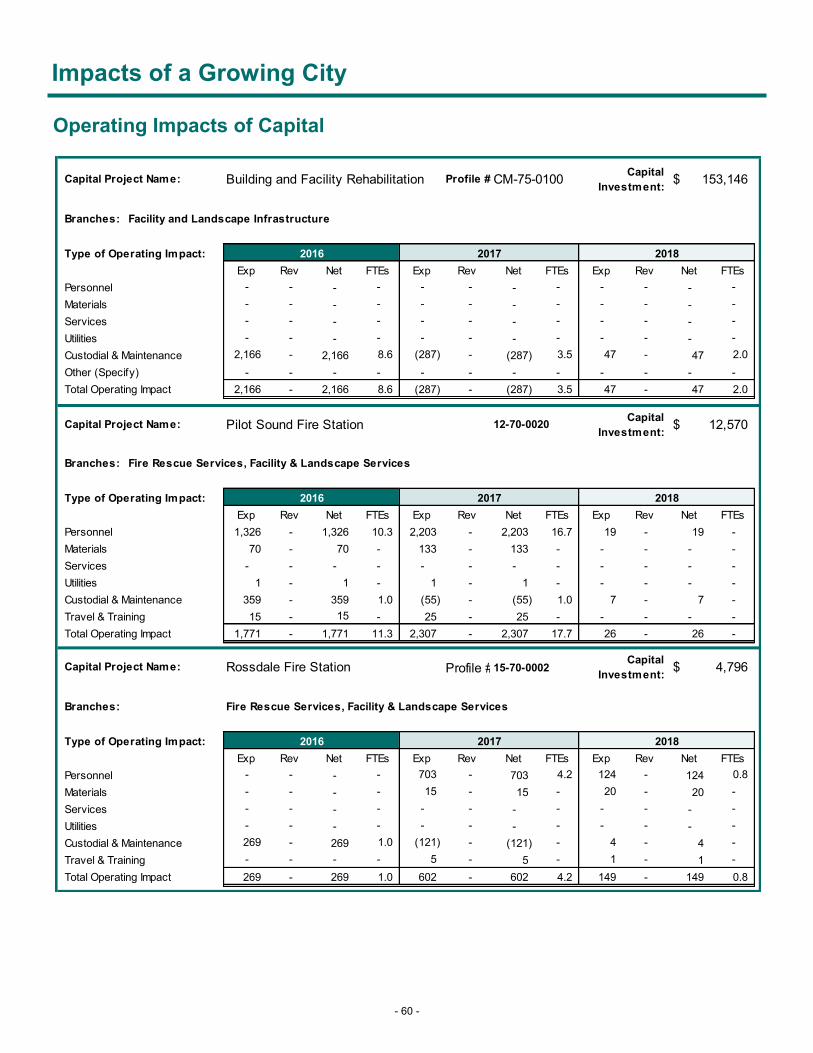
Impacts of a Growing City
Profile #
Branches: Facility and Landscape Infrastructure
2016 2017 2018
Exp Rev Net FTEs Exp Rev Net FTEs Exp Rev Net FTEs
- - - - - - - - - - - -
Materials - - - - - - - - - - - -
Services - - - - - - - - - - - -
Utilities - - - - - - - - - - - -
Custodial & Maintenance 2,166 - 2,166 8.6 (287) - (287) 3.5 47 - 47 2.0
- - - - - - - - - - - -
2,166 - 2,166 8.6 (287) - (287) 3.5 47 - 47 2.0
12-70-0020
Branches: Fire Rescue Services, Facility & Landscape Services
2016 2017 2018
Exp Rev Net FTEs Exp Rev Net FTEs Exp Rev Net FTEs
1,326 - 1,326 10.3 2,203 - 2,203 16.7 19 - 19 -
Materials 70 - 70 - 133 - 133 - - - - -
Services - - - - - - - - - - - -
Utilities 1 - 1 - 1 - 1 - - - - -
Custodial & Maintenance 359 - 359 1.0 (55) - (55) 1.0 7 - 7 -
15 - 15 - 25 - 25 - - - - -
1,771 - 1,771 11.3 2,307 - 2,307 17.7 26 - 26 -
Profile #15-70-0002
Branches: Fire Rescue Services, Facility & Landscape Services
2016 2017 2018
Exp Rev Net FTEs Exp Rev Net FTEs Exp Rev Net FTEs
- - - - 703 - 703 4.2 124 - 124 0.8
Materials - - - - 15 - 15 - 20 - 20 -
Services - - - - - - - - - - - -
Utilities - - - - - - - - - - - -
Custodial & Maintenance 269 - 269 1.0 (121) - (121) - 4 - 4 -
- - - - 5 - 5 - 1 - 1 -
269 - 269 1.0 602 - 602 4.2 149 - 149 0.8
Capital Project Name:Capital
Investment:12,570$
Type of Operating Impact:
Pilot Sound Fire Station
Personnel
Travel & Training
Total Operating Impact
Capital Project Name:Capital
Investment:4,796$
Type of Operating Impact:
Personnel
Rossdale Fire Station
Travel & Training
Total Operating Impact
Capital Project Name: Building and Facility Rehabilitation CM-75-0100Capital
Investment:153,146$
Type of Operating Impact:
Personnel
Other (Specify)
Total Operating Impact
Operating Impacts of Capital
- 60 -

Impacts of a Growing City
Profile # 15-70-0004
Branches: Fire Rescue Services, Facility & Landscape Services
2016 2017 2018
Exp Rev Net FTEs Exp Rev Net FTEs Exp Rev Net FTEs
- - - - 304 - 304 2.3 3,617 - 3,617 26.0
Materials - - - - 12 - 12 - 181 - 181 -
Services - - - - - - - - - - - -
Utilities - - - - 1 - 1 - - - - -
Custodial & Maintenance - - - - 199 - 199 1.0 30 - 30 1.0
- - - - 4 - 4 - 34 - 34 -
- - - - 520 - 520 3.3 3,862 - 3,862 27.0
Profile # 15-70-0005
Branch: Fire Rescue Services
2016 2017 2018
Exp Rev Net FTEs Exp Rev Net FTEs Exp Rev Net FTEs
- - - - - - - - - - - -
Materials 40 - 40 - 40 - 40 - 40 - 40 -
Services - - - - - - - - - - - -
Utilities - - - - - - - - - - - -
Custodial & Maintenance - - - - - - - - - - - -
- - - - - - - - - - - -
40 - 40 - 40 - 40 - 40 - 40 -
Profile #
Branches: Neighbourhoods, Community & Recreation Facilities
2016 2017 2018
Exp Rev Net FTEs Exp Rev Net FTEs Exp Rev Net FTEs
30 - 30 0.5 223 - 223 3.5 42 - 42 0.5
Materials & Equipment - - - - 10 - 10 - - - - -
Services - - - - - - - - - - - -
Utilities - - - - - - - - - - - -
Custodial & Maintenance - - - - - - - - - - - -
15 - 15 - 175 - 175 - (166) - (166) -
45 - 45 0.5 408 - 408 3.5 (124) - (124) 0.5 Total Operating Impact
Capital
Investment:16,617$
Type of Operating Impact:
Personnel
Capital Project Name:Capital
Investment:14,690$
Type of Operating Impact:
Windermere Fire Station
Personnel
Travel & Training
Total Operating Impact
Capital Project Name:Capital
Investment:2,250$
Type of Operating Impact:
Personnel
Traffic Light Pre-emption
Other (Specify)
Total Operating Impact
Capital Project Name: River Valley Trail & Park Renewal CM-28-8530
Fleet
Operating Impacts of Capital
- 61 -
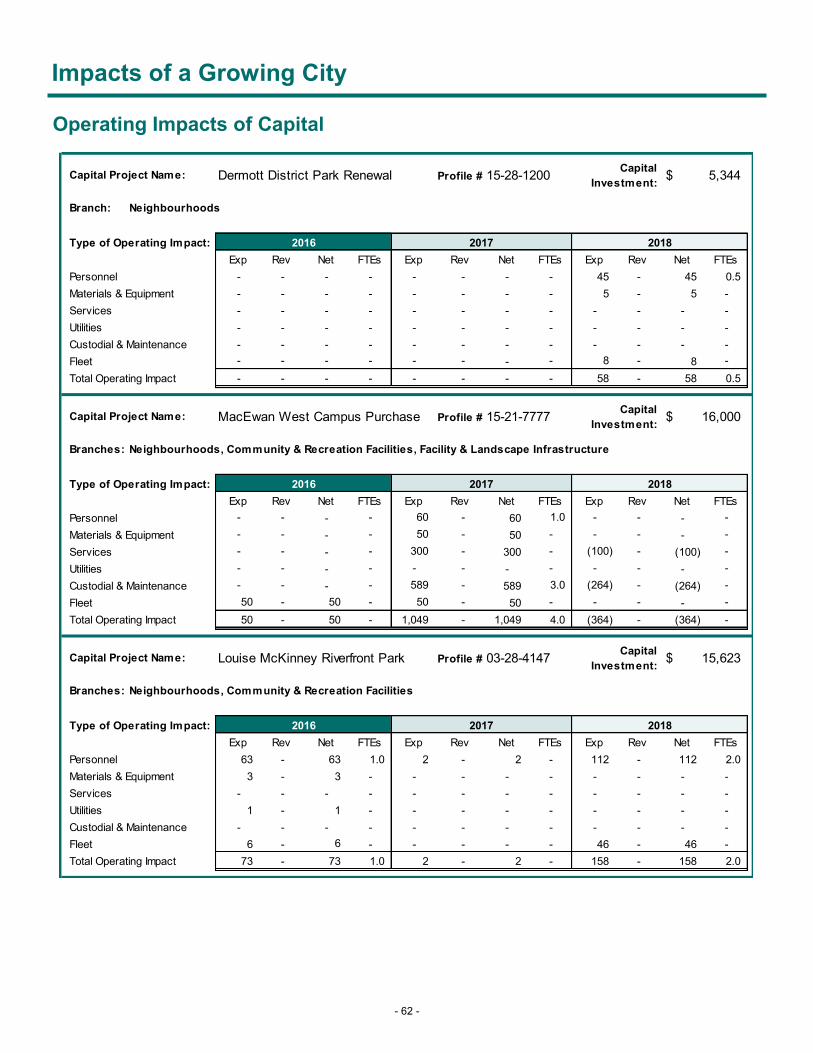
Impacts of a Growing City
Profile #
Branch: Neighbourhoods
2016 2017 2018
Exp Rev Net FTEs Exp Rev Net FTEs Exp Rev Net FTEs
- - - - - - - - 45 - 45 0.5
Materials & Equipment - - - - - - - - 5 - 5 -
Services - - - - - - - - - - - -
Utilities - - - - - - - - - - - -
Custodial & Maintenance - - - - - - - - - - - -
- - - - - - - - 8 - 8 -
- - - - - - - - 58 - 58 0.5
Profile #
Branches: Neighbourhoods, Community & Recreation Facilities, Facility & Landscape Infrastructure
2016 2017 2018
Exp Rev Net FTEs Exp Rev Net FTEs Exp Rev Net FTEs
- - - - 60 - 60 1.0 - - - -
Materials & Equipment - - - - 50 - 50 - - - - -
Services - - - - 300 - 300 - (100) - (100) -
Utilities - - - - - - - - - - - -
Custodial & Maintenance - - - - 589 - 589 3.0 (264) - (264) -
50 - 50 - 50 - 50 - - - - -
50 - 50 - 1,049 - 1,049 4.0 (364) - (364) -
Profile #
Branches: Neighbourhoods, Community & Recreation Facilities
2016 2017 2018
Exp Rev Net FTEs Exp Rev Net FTEs Exp Rev Net FTEs
63 - 63 1.0 2 - 2 - 112 - 112 2.0
Materials & Equipment 3 - 3 - - - - - - - - -
Services - - - - - - - - - - - -
Utilities 1 - 1 - - - - - - - - -
Custodial & Maintenance - - - - - - - - - - - -
6 - 6 - - - - - 46 - 46 -
73 - 73 1.0 2 - 2 - 158 - 158 2.0
Capital Project Name: Dermott District Park Renewal 15-28-1200Capital
Investment:5,344$
Type of Operating Impact:
Personnel
Fleet
Total Operating Impact
Capital Project Name: MacEwan West Campus Purchase 15-21-7777Capital
Investment:16,000$
Type of Operating Impact:
Personnel
Fleet
Total Operating Impact
Capital Project Name: Louise McKinney Riverfront Park 03-28-4147Capital
Investment:15,623$
Type of Operating Impact:
Personnel
Fleet
Total Operating Impact
Operating Impacts of Capital
- 62 -
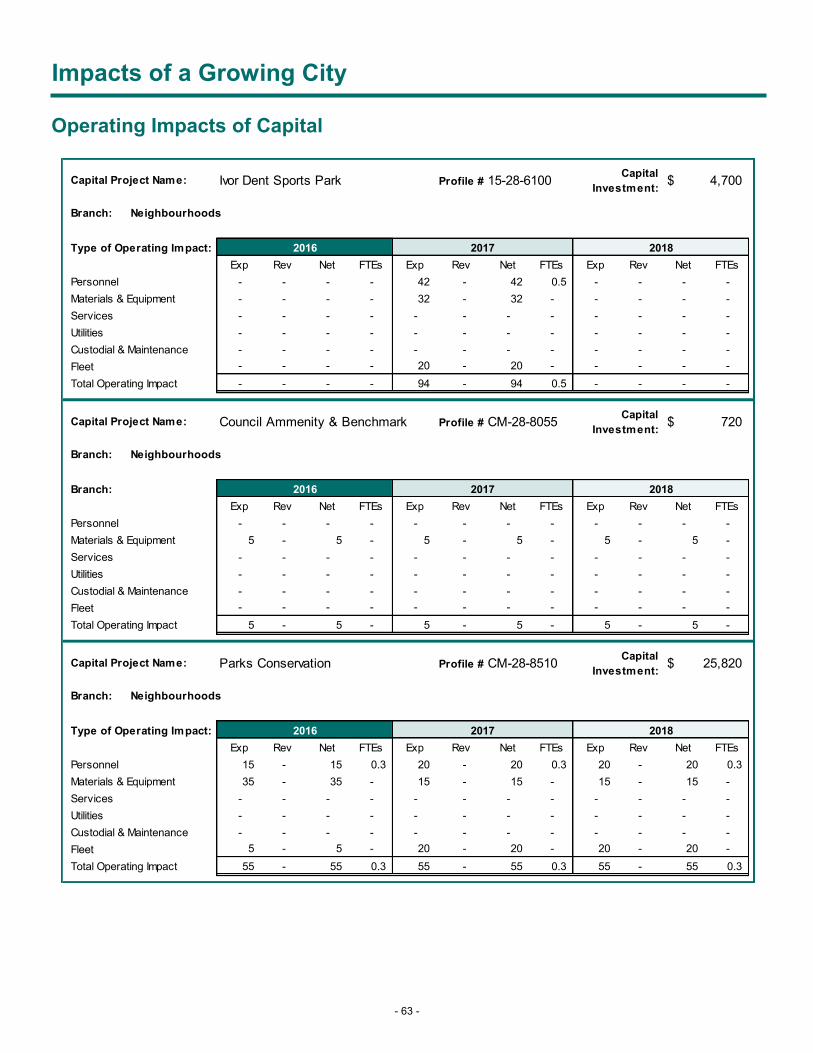
Impacts of a Growing City
Profile #
Branch: Neighbourhoods
2016 2017 2018
Exp Rev Net FTEs Exp Rev Net FTEs Exp Rev Net FTEs
- - - - 42 - 42 0.5 - - - -
Materials & Equipment - - - - 32 - 32 - - - - -
Services - - - - - - - - - - - -
Utilities - - - - - - - - - - - -
Custodial & Maintenance - - - - - - - - - - - -
- - - - 20 - 20 - - - - -
- - - - 94 - 94 0.5 - - - -
Profile #
Branch: Neighbourhoods
2016 2017 2018
Exp Rev Net FTEs Exp Rev Net FTEs Exp Rev Net FTEs
- - - - - - - - - - - -
Materials & Equipment 5 - 5 - 5 - 5 - 5 - 5 -
Services - - - - - - - - - - - -
Utilities - - - - - - - - - - - -
Custodial & Maintenance - - - - - - - - - - - -
- - - - - - - - - - - -
5 - 5 - 5 - 5 - 5 - 5 -
Profile #
Branch: Neighbourhoods
2016 2017 2018
Exp Rev Net FTEs Exp Rev Net FTEs Exp Rev Net FTEs
15 - 15 0.3 20 - 20 0.3 20 - 20 0.3
Materials & Equipment 35 - 35 - 15 - 15 - 15 - 15 -
Services - - - - - - - - - - - -
Utilities - - - - - - - - - - - -
Custodial & Maintenance - - - - - - - - - - - -
5 - 5 - 20 - 20 - 20 - 20 -
55 - 55 0.3 55 - 55 0.3 55 - 55 0.3
Capital Project Name: Ivor Dent Sports Park 15-28-6100Capital
Investment:4,700$
Type of Operating Impact:
Personnel
Fleet
Total Operating Impact
Capital Project Name: Council Ammenity & Benchmark CM-28-8055Capital
Investment:720$
Branch:
Personnel
Fleet
Total Operating Impact
Capital Project Name: Parks Conservation CM-28-8510Capital
Investment:25,820$
Type of Operating Impact:
Personnel
Fleet
Total Operating Impact
Operating Impacts of Capital
- 63 -

Impacts of a Growing City
Profile #
Branch: Neighbourhoods
2016 2017 2018
Exp Rev Net FTEs Exp Rev Net FTEs Exp Rev Net FTEs
5 - 5 0.1 5 - 5 0.1 - - - -
Materials & Equipment - - - - - - - - - - - -
Services - - - - - - - - - - - -
Utilities - - - - - - - - - - - -
Custodial & Maintenance - - - - - - - - - - - -
10 - 10 - 10 - 10 - - - - -
15 - 15 0.1 15 - 15 0.1 - - - -
Profile #
Branch: Neighbourhoods
2016 2017 2018
Exp Rev Net FTEs Exp Rev Net FTEs Exp Rev Net FTEs
- - - - 200 - 200 2.5 - - - -
Materials & Equipment - - - - 100 - 100 - - - - -
Services - - - - - - - - - - - -
Utilities - - - - - - - - - - - -
Custodial & Maintenance - - - - - - - - - - - -
- - - - - - - - - - - -
- - - - 300 - 300 2.5 - - - -
Profile #
Branches: Neighbourhoods, Facility & Landscape Infrastructure
2016 2017 2018
Exp Rev Net FTEs Exp Rev Net FTEs Exp Rev Net FTEs
29 - 29 0.6 32 - 32 0.5 33 - 33 0.5
Materials & Equipment 36 - 36 - 40 - 40 - 39 - 39 -
Services - - - - - - - - - - - -
Utilities - - - - - - - - - - - -
Custodial & Maintenance 53 - 53 0.5 62 - 62 0.5 4 - 4 -
4 - 4 - - - - - - - - -
122 - 122 1.1 134 - 134 1.0 76 - 76 0.5
Capital Project Name: Hawrelak Park 100th Anniversery 15-28-4152Capital
Investment:3,100$
Type of Operating Impact:
Personnel
Fleet
Total Operating Impact
Capital Project Name: SW District Main Office & Yard 15-28-4200Capital
Investment:24,698$
Type of Operating Impact:
Personnel
Fleet
Total Operating Impact
Capital Project Name:Neighourhood Park Development -
RenewalCM-28-7055
Capital
Investment:19,000$
Type of Operating Impact:
Personnel
Fleet
Total Operating Impact
Operating Impacts of Capital
- 64 -

Impacts of a Growing City
Profile #
Branches: Neighbourhoods, Facility & Landscape Infrastructure
2016 2017 2018
Exp Rev Net FTEs Exp Rev Net FTEs Exp Rev Net FTEs
46 - 46 1.0 46 - 46 1.0 62 - 62 1.0
Materials & Equipment 4 - 4 - 4 - 4 - 4 - 4 -
Services - - - - - - - - - - - -
Utilities - - - - - - - - - - - -
Custodial & Maintenance 110 - 110 0.5 5 - 5 0.5 4 - 4 -
40 - 40 - 40 - 40 - 24 - 24 -
200 - 200 1.5 95 - 95 1.5 94 - 94 1.0
Profile #
Branch: Neighbourhoods
2016 2017 2018
Exp Rev Net FTEs Exp Rev Net FTEs Exp Rev Net FTEs
10 - 10 0.2 10 - 10 0.2 10 - 10 0.2
Materials & Equipment - - - - - - - - - - - -
Services - - - - - - - - - - - -
Utilities - - - - - - - - - - - -
Custodial & Maintenance - - - - - - - - - - - -
3 - 3 - 3 - 3 - 3 - 3 -
13 - 13 0.2 13 - 13 0.2 13 - 13 0.2
Profile #
Branch: Neighbourhoods
2016 2017 2018
Exp Rev Net FTEs Exp Rev Net FTEs Exp Rev Net FTEs
- - - - - - - - - - - -
Materials & Equipment 6 - 6 - 6 - 6 - 8 - 8 -
Services - - - - - - - - - - - -
Utilities - - - - - - - - - - - -
Custodial & Maintenance - - - - - - - - - - - -
- - - - - - - - - - - -
6 - 6 - 6 - 6 - 8 - 8 -
Capital Project Name:Neighourhood Park Development -
NewCM-28-7050
Capital
Investment:11,617$
Type of Operating Impact:
Personnel
Fleet
Total Operating Impact
Capital Project Name: Playspace Conservation CM-28-8520Capital
Investment:2,500$
Type of Operating Impact:
Personnel
Fleet
Total Operating Impact
Capital Project Name: Sportsfield Renewal CM-28-8515Capital
Investment:1,200$
Type of Operating Impact:
Personnel
Fleet
Total Operating Impact
Operating Impacts of Capital
- 65 -

Impacts of a Growing City
Profile #
Branches: Neighbourhoods, Community & Recreation Facilities
2016 2017 2018
Exp Rev Net FTEs Exp Rev Net FTEs Exp Rev Net FTEs
202 - 202 3.4 31 129 (98) 0.5 7 3 4 -
Materials & Equipment 11 - 11 - 21 - 21 - - - - -
Services 22 - 22 - - - - - - - - -
Utilities 15 - 15 - - - - - - - - -
Custodial & Maintenance - - - - - - - - - - - -
14 - 14 - 20 - 20 - - - - -
264 - 264 3.4 72 129 (57) 0.5 7 3 4 -
Profile #
Branch: Neighbourhoods
2016 2017 2018
Exp Rev Net FTEs Exp Rev Net FTEs Exp Rev Net FTEs
45 - 45 0.5 45 - 45 0.5 45 - 45 0.5
Materials & Equipment - - - - - - - - - - - -
Services - - - - - - - - - - - -
Utilities - - - - - - - - - - - -
Custodial & Maintenance - - - - - - - - - - - -
5 - 5 - 5 - 5 - 5 - 5 -
50 - 50 0.5 50 - 50 0.5 50 - 50 0.5
Profile #
Branches: Neighbourhoods, Community & Recreation Facilities
2016 2017 2018
Exp Rev Net FTEs Exp Rev Net FTEs Exp Rev Net FTEs
- - - - 165 - 165 2.7 116 - 116 2.0
Materials & Equipment - - - - 14 - 14 - - - - -
Services - - - - - - - - - - - -
Utilities - - - - 1 - 1 - - - - -
Custodial & Maintenance - - - - - - - - - - - -
- - - - 27 - 27 - 53 - 53 -
- - - - 207 - 207 2.7 169 - 169 2.0
Capital Project Name: Paul Kane Park 15-28-1100Capital
Investment:3,288$
Type of Operating Impact:
Personnel
Fleet
Total Operating Impact
Capital Project Name: Tree Planting & Naturalization CM-28-2001Capital
Investment:2,685$
Type of Operating Impact:
Personnel
Fleet
Total Operating Impact
Capital Project Name: Queen Elizabeth Park Phase 2 15-28-1700Capital
Investment:5,248$
Type of Operating Impact:
Personnel
Fleet
Total Operating Impact
Operating Impacts of Capital
- 66 -

Impacts of a Growing City
Profile #
Branches: Neighbourhoods, Community & Recreation Facilities
2016 2017 2018
Exp Rev Net FTEs Exp Rev Net FTEs Exp Rev Net FTEs
- - - - 349 - 349 5.9 11 - 11 -
Materials & Equipment - - - - 125 - 125 - 5 - 5 -
Services - - - - - - - - - - - -
Utilities - - - - 59 - 59 - - - - -
Custodial & Maintenance - - - - - - - - - - - -
- - - - 96 - 96 - - - - -
- - - - 629 - 629 5.9 16 - 16 -
Profile #
Branch: Neighbourhoods
2016 2017 2018
Exp Rev Net FTEs Exp Rev Net FTEs Exp Rev Net FTEs
122 - 122 2.0 - - - - - - - -
Materials & Equipment 5 - 5 - 2 - 2 - 3 - 3 -
Services - - - - - - - - - - - -
Utilities - - - - - - - - - - - -
Custodial & Maintenance - - - - - - - - - - - -
20 - 20 - - - - - - - - -
147 - 147 2.0 2 - 2 - 3 - 3 -
Profile #
Branches: Neighbourhoods, Community & Recreation Facilities
2016 2017 2018
Exp Rev Net FTEs Exp Rev Net FTEs Exp Rev Net FTEs
- - - - 15 - 15 0.2 185 - 185 3.0
Materials & Equipment - - - - 5 - 5 - 6 - 6 -
Services - - - - - - - - - - - -
Utilities - - - - - - - - - - - -
Custodial & Maintenance - - - - - - - - 61 - 61 -
- - - - 11 - 11 - 11 - 11 -
- - - - 31 - 31 0.2 262 - 262 3.0
Capital Project Name: Bordan Park Natural Swimming Pond 12-21-8683Capital
Investment:14,497$
Type of Operating Impact:
Personnel
Fleet
Total Operating Impact
Capital Project Name: Great Neighbourhoods Initiative CM-21-5800Capital
Investment:72,718$
Type of Operating Impact:
Personnel
Fleet
Total Operating Impact
Capital Project Name: Kihcly Askiy Sacred Earth 15-21-3400Capital
Investment:2,000$
Type of Operating Impact:
Personnel
Fleet
Total Operating Impact
Operating Impacts of Capital
- 67 -
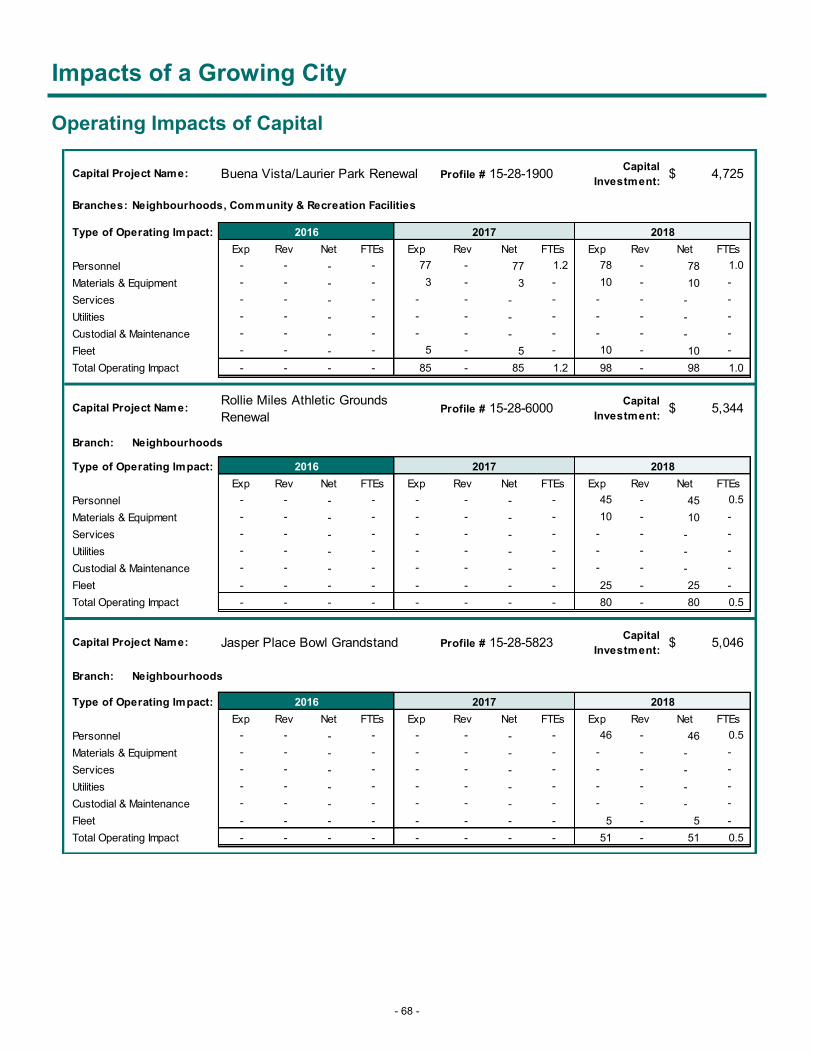
Impacts of a Growing City
Profile #
Branches: Neighbourhoods, Community & Recreation Facilities
2016 2017 2018
Exp Rev Net FTEs Exp Rev Net FTEs Exp Rev Net FTEs
- - - - 77 - 77 1.2 78 - 78 1.0
Materials & Equipment - - - - 3 - 3 - 10 - 10 -
Services - - - - - - - - - - - -
Utilities - - - - - - - - - - - -
Custodial & Maintenance - - - - - - - - - - - -
- - - - 5 - 5 - 10 - 10 -
- - - - 85 - 85 1.2 98 - 98 1.0
Profile #
Branch: Neighbourhoods
2016 2017 2018
Exp Rev Net FTEs Exp Rev Net FTEs Exp Rev Net FTEs
- - - - - - - - 45 - 45 0.5
Materials & Equipment - - - - - - - - 10 - 10 -
Services - - - - - - - - - - - -
Utilities - - - - - - - - - - - -
Custodial & Maintenance - - - - - - - - - - - -
- - - - - - - - 25 - 25 -
- - - - - - - - 80 - 80 0.5
Profile #
Branch: Neighbourhoods
2016 2017 2018
Exp Rev Net FTEs Exp Rev Net FTEs Exp Rev Net FTEs
- - - - - - - - 46 - 46 0.5
Materials & Equipment - - - - - - - - - - - -
Services - - - - - - - - - - - -
Utilities - - - - - - - - - - - -
Custodial & Maintenance - - - - - - - - - - - -
- - - - - - - - 5 - 5 -
- - - - - - - - 51 - 51 0.5
Type of Operating Impact:
Personnel
Fleet
Total Operating Impact
Capital Project Name: Jasper Place Bowl Grandstand 15-28-5823Capital
Investment:5,046$
Type of Operating Impact:
Personnel
Fleet
Total Operating Impact
Capital Project Name:Rollie Miles Athletic Grounds
Renewal15-28-6000
Capital
Investment:5,344$
Type of Operating Impact:
Personnel
Fleet
Total Operating Impact
Capital Project Name: Buena Vista/Laurier Park Renewal 15-28-1900Capital
Investment:4,725$
Operating Impacts of Capital
- 68 -
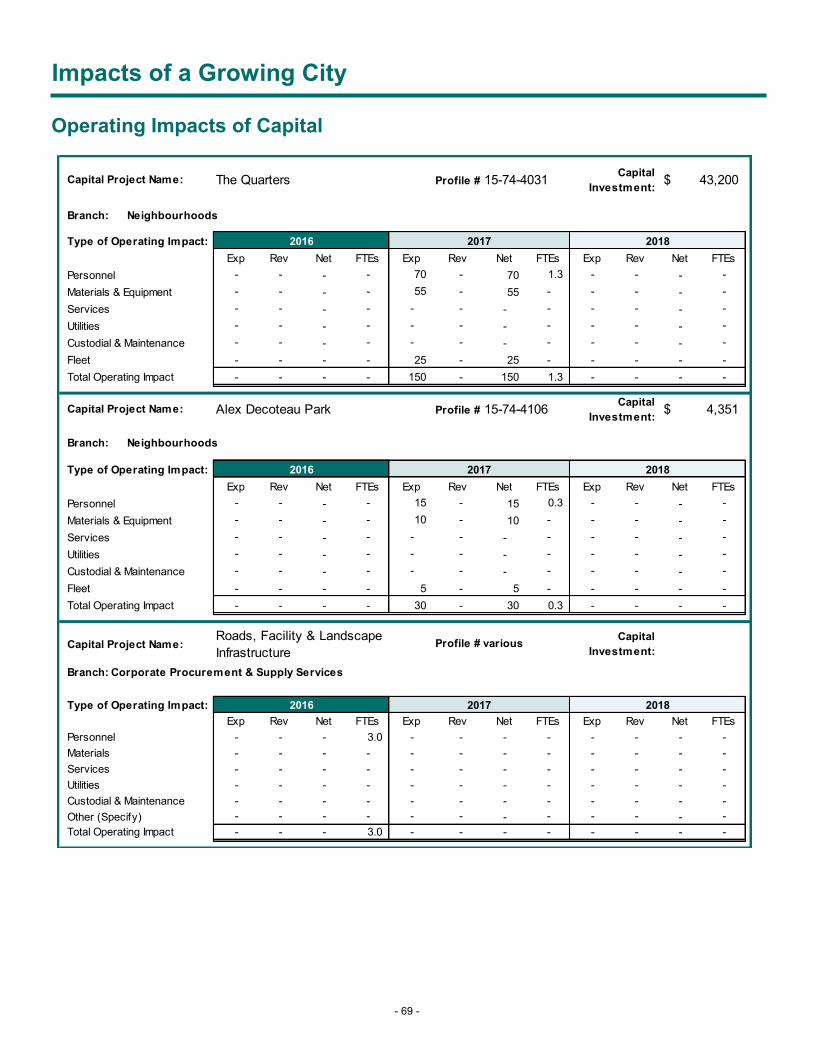
Impacts of a Growing City
Profile #
Branch: Neighbourhoods
2016 2017 2018
Exp Rev Net FTEs Exp Rev Net FTEs Exp Rev Net FTEs
- - - - 70 - 70 1.3 - - - -
Materials & Equipment - - - - 55 - 55 - - - - -
Services - - - - - - - - - - - -
Utilities - - - - - - - - - - - -
Custodial & Maintenance - - - - - - - - - - - -
- - - - 25 - 25 - - - - -
- - - - 150 - 150 1.3 - - - -
Profile #
Branch: Neighbourhoods
2016 2017 2018
Exp Rev Net FTEs Exp Rev Net FTEs Exp Rev Net FTEs
- - - - 15 - 15 0.3 - - - -
Materials & Equipment - - - - 10 - 10 - - - - -
Services - - - - - - - - - - - -
Utilities - - - - - - - - - - - -
Custodial & Maintenance - - - - - - - - - - - -
- - - - 5 - 5 - - - - -
- - - - 30 - 30 0.3 - - - -
Capital Project Name:
Branch: Corporate Procurement & Supply Services
2016 2017 2018
Exp Rev Net FTEs Exp Rev Net FTEs Exp Rev Net FTEs
- - - 3.0 - - - - - - - -
Materials - - - - - - - - - - - -
Services - - - - - - - - - - - -
Utilities - - - - - - - - - - - -
Custodial & Maintenance - - - - - - - - - - - -
- - - - - - - - - - - -
- - - 3.0 - - - - - - - -
Roads, Facility & Landscape
Infrastructure
Type of Operating Impact:
Personnel
Fleet
Total Operating Impact
Capital Project Name: Alex Decoteau Park 15-74-4106Capital
Investment:4,351$
Type of Operating Impact:
Personnel
Fleet
Total Operating Impact
Capital Project Name: The Quarters 15-74-4031Capital
Investment:43,200$
Profile # various
Other (Specify)
Total Operating Impact
Capital
Investment:
Type of Operating Impact:
Personnel
Operating Impacts of Capital
- 69 -

Impacts of a Growing City
Capital Project Name: Profile #
Branch: Fleet Services
2016 2017 2018
Exp Rev Net FTEs Exp Rev Net FTEs Exp Rev Net FTEs
- - - - - - - 2.0 - - - 2.0
Materials - - - - - - - - - - - -
Services - - - - - - - - - - - -
Utilities - - - - - - - - - - - -
Custodial & Maintenance - - - - - - - - - - - -
- - - - - - - - - - - -
- - - - - - - 2.0 - - - 2.0
Capital Project Name: Profile # CM-18-1509
Branch: Fleet Services
2016 2017 2018
Exp Rev Net FTEs Exp Rev Net FTEs Exp Rev Net FTEs
- - - 2.0 - - - - - - - -
Materials - - - - - - - - - - - -
Services - - - - - - - - - - - -
Utilities - - - - - - - - - - - -
Custodial & Maintenance - - - - - - - - - - - -
- - - - - - - - - - - -
- - - 2.0 - - - - - - - -
Profile #
Branch: Human Resources
2016 2017 2018
Exp Rev Net FTEs Exp Rev Net FTEs Exp Rev Net FTEs
- - - - 104 - 104 1.0 - - - -
Materials - - - - 151 - 151 - - - - -
Services - - - - 2 - 2 - 160 - 160 -
Utilities - - - - - - - - - - - -
Custodial & Maintenance - - - - - - - - - - - -
- - - - 2 - 2 - - - - -
- - - - 259 - 259 1.0 160 - 160 -
VariousCapital
Investment:18,704$
Type of Operating Impact:
Comm. Svc - 2015 Fall SCBA
Personnel
Other (Specify)
Total Operating Impact
Capital
Investment:IT Business Applications Growth 246$
Type of Operating Impact:
Personnel
Other (Specify)
Total Operating Impact
Capital Project Name: Enterprise Applications Growth CM 18-1508Capital
Investment:
Total Operating Impact
944$
Type of Operating Impact:
Personnel
Other (Specify)
Operating Impacts of Capital
- 70 -

Impacts of a Growing City
Profile #
Branch: Information Technology
2016 2017 2018
Exp Rev Net FTEs Exp Rev Net FTEs Exp Rev Net FTEs
- - - - - - - - - - - -
Materials - - - - 155 - 155 - - - - -
Services - - - - - - - - - - - -
Utilities - - - - - - - - - - - -
Custodial & Maintenance - - - - - - - - - - - -
- - - - - - - - - - - -
- - - - 155 - 155 - - - - -
Profile #
Branch: Information Technology
2016 2017 2018
Exp Rev Net FTEs Exp Rev Net FTEs Exp Rev Net FTEs
- - - - - - - - - - - -
Materials - - - - 76 - 76 - 9 - 9 -
Services - - - - - - - - - - - -
Utilities - - - - - - - - - - - -
Custodial & Maintenance - - - - - - - - - - - -
- - - - - - - - - - - -
- - - - 76 - 76 - 9 - 9 -
Profile #
Branch: Information Technology
2016 2017 2018
Exp Rev Net FTEs Exp Rev Net FTEs Exp Rev Net FTEs
- - - - - - - - - - - -
Materials - - - - 32 - 32 - - - - -
Services - - - - - - - - - - - -
Utilities - - - - - - - - - - - -
Custodial & Maintenance - - - - - - - - - - - -
- - - - - - - - - - - -
- - - - 32 - 32 - - - - - Total Operating Impact
15,448$
Type of Operating Impact:
Personnel
Other (Specify)
Total Operating Impact
Capital Project Name: Business Unit Application Renewal CM-18-1506Capital
Investment:
Type of Operating Impact:
Personnel
Other (Specify)
Capital Project Name: Enterprise Applications Growth CM-18-1508Capital
Investment:13,933$
Type of Operating Impact:
Personnel
Other (Specify)
Total Operating Impact
Capital Project Name: IT Enterprise Application Renewal CM-18-1504Capital
Investment:14,922$
Operating Impacts of Capital
- 71 -
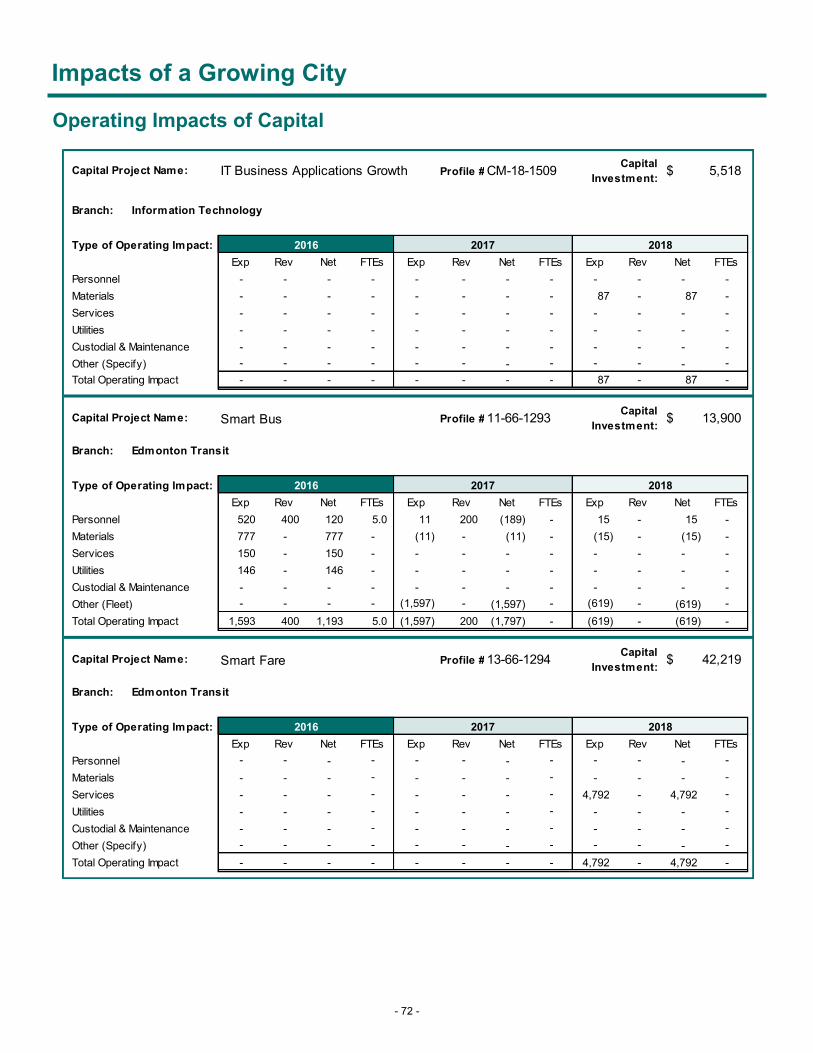
Impacts of a Growing City
Profile #
Branch: Information Technology
2016 2017 2018
Exp Rev Net FTEs Exp Rev Net FTEs Exp Rev Net FTEs
- - - - - - - - - - - -
Materials - - - - - - - - 87 - 87 -
Services - - - - - - - - - - - -
Utilities - - - - - - - - - - - -
Custodial & Maintenance - - - - - - - - - - - -
- - - - - - - - - - - -
- - - - - - - - 87 - 87 -
Smart Bus Profile #
Branch: Edmonton Transit
2016 2017 2018
Exp Rev Net FTEs Exp Rev Net FTEs Exp Rev Net FTEs
520 400 120 5.0 11 200 (189) - 15 - 15 -
Materials 777 - 777 - (11) - (11) - (15) - (15) -
Services 150 - 150 - - - - - - - - -
Utilities 146 - 146 - - - - - - - - -
Custodial & Maintenance - - - - - - - - - - - -
- - - - (1,597) - (1,597) - (619) - (619) -
1,593 400 1,193 5.0 (1,597) 200 (1,797) - (619) - (619) -
Smart Fare Profile #
Branch: Edmonton Transit
2016 2017 2018
Exp Rev Net FTEs Exp Rev Net FTEs Exp Rev Net FTEs
- - - - - - - - - - - -
Materials - - - - - - - - - - - -
Services - - - - - - - - 4,792 - 4,792 -
Utilities - - - - - - - - - - - -
Custodial & Maintenance - - - - - - - - - - - -
- - - - - - - - - - - -
- - - - - - - - 4,792 - 4,792 -
Capital Project Name: 11-66-1293Capital
Investment:13,900$
Type of Operating Impact:
Personnel
Other (Fleet)
Total Operating Impact
Capital Project Name: 13-66-1294Capital
Investment:42,219$
Type of Operating Impact:
Personnel
Other (Specify)
Total Operating Impact
Capital Project Name: IT Business Applications Growth CM-18-1509Capital
Investment:5,518$
Type of Operating Impact:
Personnel
Other (Specify)
Total Operating Impact
Operating Impacts of Capital
- 72 -
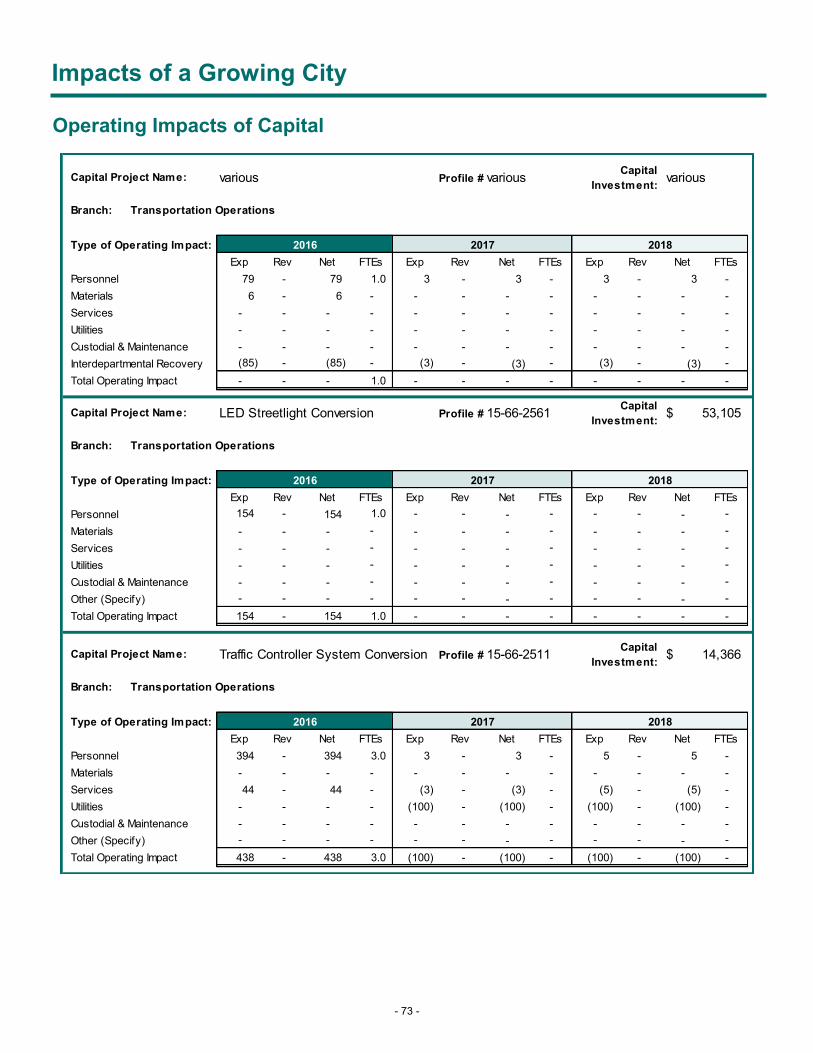
Impacts of a Growing City
Profile #
Branch: Transportation Operations
2016 2017 2018
Exp Rev Net FTEs Exp Rev Net FTEs Exp Rev Net FTEs
79 - 79 1.0 3 - 3 - 3 - 3 -
Materials 6 - 6 - - - - - - - - -
Services - - - - - - - - - - - -
Utilities - - - - - - - - - - - -
Custodial & Maintenance - - - - - - - - - - - -
(85) - (85) - (3) - (3) - (3) - (3) -
- - - 1.0 - - - - - - - -
Profile #
Branch: Transportation Operations
2016 2017 2018
Exp Rev Net FTEs Exp Rev Net FTEs Exp Rev Net FTEs
154 - 154 1.0 - - - - - - - -
Materials - - - - - - - - - - - -
Services - - - - - - - - - - - -
Utilities - - - - - - - - - - - -
Custodial & Maintenance - - - - - - - - - - - -
- - - - - - - - - - - -
154 - 154 1.0 - - - - - - - -
Profile #
Branch: Transportation Operations
2016 2017 2018
Exp Rev Net FTEs Exp Rev Net FTEs Exp Rev Net FTEs
394 - 394 3.0 3 - 3 - 5 - 5 -
Materials - - - - - - - - - - - -
Services 44 - 44 - (3) - (3) - (5) - (5) -
Utilities - - - - (100) - (100) - (100) - (100) -
Custodial & Maintenance - - - - - - - - - - - -
- - - - - - - - - - - -
438 - 438 3.0 (100) - (100) - (100) - (100) -
Other (Specify)
Total Operating Impact
Capital
Investment:14,366$
Type of Operating Impact:
Personnel
Total Operating Impact
Capital Project Name: Traffic Controller System Conversion 15-66-2511
53,105$
Type of Operating Impact:
Personnel
Other (Specify)
Total Operating Impact
Capital Project Name: LED Streetlight Conversion 15-66-2561Capital
Investment:
Type of Operating Impact:
Personnel
Interdepartmental Recovery
Capital Project Name: various variousCapital
Investment:various
Operating Impacts of Capital
- 73 -

Impacts of a Growing City
Operating Impacts of Capital
Profile #
Branch: Transportation Operations
2016 2017 2018
Exp Rev Net FTEs Exp Rev Net FTEs Exp Rev Net FTEs
104 - 104 1.0 111 - 111 1.0 8 - 8 -
Materials 21 - 21 - 14 - 14 - (8) - (8) -
Services - - - - - - - - - - - -
Utilities - - - - - - - - - - - -
Custodial & Maintenance - - - - - - - - - - - -
- - - - - - - - - - - -
125 - 125 1.0 125 - 125 1.0 - - - -
Profile #
Branch: Transportation Operations
2016 2017 2018
Exp Rev Net FTEs Exp Rev Net FTEs Exp Rev Net FTEs
77 - 77 0.6 2 - 2 - 3 - 3 -
Materials - - - - - - - - - - - -
Services 471 - 471 - 198 - 198 - (3) - (3) -
Utilities - - - - - - - - - - - -
Custodial & Maintenance - - - - - - - - - - - -
- 548 (548) - - 200 (200) - - - - -
548 548 - 0.6 200 200 - - - - - -
Profile #
Branches: Edmonton Police Service, Facility & Landscape Services
2016 2017 2018
Exp Rev Net FTEs Exp Rev Net FTEs Exp Rev Net FTEs
1,932 - 1,932 15.0 1,458 - 1,458 10.0 750 - 750 4.0
Materials 99 - 99 - 16 - 16 - (11) - (11) -
Services - - - - - - - - 693 - 693 -
Utilities 15 - 15 - (5) - (5) - (6) - (6) -
Custodial & Maintenance - - - - - - - - - - - 9.0
442 - 442 - 128 - 128 - (48) - (48) -
2,488 - 2,488 15.0 1,597 - 1,597 10.0 1,378 - 1,378 13.0
Capital Project Name: various variousCapital
Investment:various
Type of Operating Impact:
Personnel
Other (Specify)
Total Operating Impact
Capital Project Name: Parking Control Technology 14-66-2570Capital
Investment:12,000$
Branch:
Personnel
Parking Revenue
Total Operating Impact
Capital Project Name: Northwest Division 12-60-1376Capital
Investment:106,860$
Type of Operating Impact:
Personnel
Other (Trsfs and Training)
Total Operating Impact
- 74 -
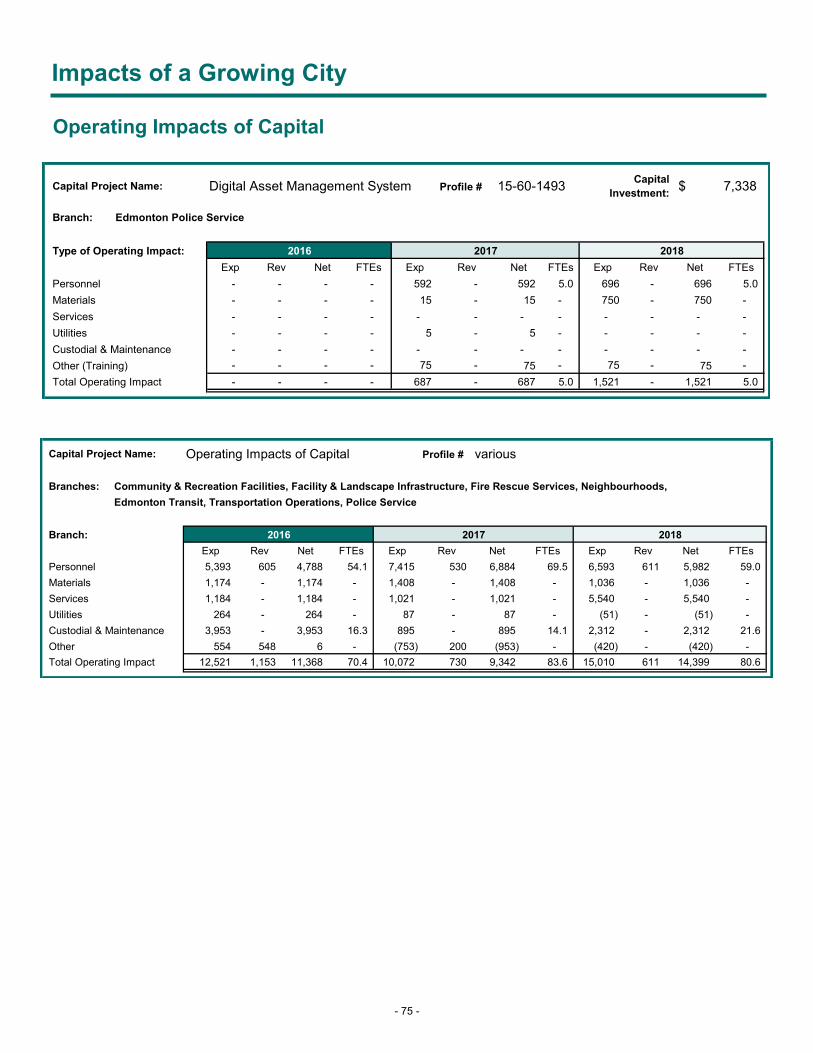
Impacts of a Growing City
Operating Impacts of Capital
Profile #
Branch: Edmonton Police Service
2016 2017 2018
Exp Rev Net FTEs Exp Rev Net FTEs Exp Rev Net FTEs
- - - - 592 - 592 5.0 696 - 696 5.0
Materials - - - - 15 - 15 - 750 - 750 -
Services - - - - - - - - - - - -
Utilities - - - - 5 - 5 - - - - -
Custodial & Maintenance - - - - - - - - - - - -
- - - - 75 - 75 - 75 - 75 -
- - - - 687 - 687 5.0 1,521 - 1,521 5.0 Total Operating Impact
Type of Operating Impact:
Personnel
Other (Training)
Capital Project Name: Digital Asset Management System 15-60-1493Capital
Investment:7,338$
Profile #
Branches: Community & Recreation Facilities, Facility & Landscape Infrastructure, Fire Rescue Services, Neighbourhoods,
Edmonton Transit, Transportation Operations, Police Service
2016 2017 2018
Exp Rev Net FTEs Exp Rev Net FTEs Exp Rev Net FTEs
5,393 605 4,788 54.1 7,415 530 6,884 69.5 6,593 611 5,982 59.0
Materials 1,174 - 1,174 - 1,408 - 1,408 - 1,036 - 1,036 -
Services 1,184 - 1,184 - 1,021 - 1,021 - 5,540 - 5,540 -
Utilities 264 - 264 - 87 - 87 - (51) - (51) -
Custodial & Maintenance 3,953 - 3,953 16.3 895 - 895 14.1 2,312 - 2,312 21.6
554 548 6 - (753) 200 (953) - (420) - (420) -
12,521 1,153 11,368 70.4 10,072 730 9,342 83.6 15,010 611 14,399 80.6
Branch:
Personnel
Other
Total Operating Impact
Capital Project Name: Operating Impacts of Capital various
- 75 -

Impacts of a Growing City
Operating Impacts of Contributed Assets
For the 2016-2018 Operating Budget, the City of Edmonton will experience an increase in the budget relating to assets
that have been turned over to the City to maintain from development that has occurred throughout the City. As the
increase per community is small, the increased need for contributed assets has been broken into four areas: Northwest,
Northeast, Southeast and Southwest.
Branches:
2016 2017 2018
Exp Rev Net FTEs Exp Rev Net FTEs Exp Rev Net FTEs
409 - 409 2.0 433 - 433 2.0 426 - 426 2.0
14 - 14 - 15 - 15 - 16 - 16 -
79 - 79 - 84 - 84 - 83 - 83 -
Horticulture 151 - 151 0.3 106 - 106 0.9 110 - 110 1.0
3 - 3 - 2 - 2 - 2 - 2 -
6 - 6 - 4 - 4 - 4 - 4 -
24 - 24 1.5 17 - 17 0.1 18 - 18 0.2
3 - 3 - 2 - 2 - 2 - 2 -
688 - 688 3.8 663 - 663 3.0 661 - 661 3.2
Branches:
2016 2017 2018
Exp Rev Net FTEs Exp Rev Net FTEs Exp Rev Net FTEs
168 - 168 - 177 - 177 0.5 175 - 175 -
22 - 22 - 23 - 23 - 23 - 23 -
22 - 22 - 23 - 23 - 23 - 23 -
Horticulture 67 - 67 0.8 47 - 47 0.5 49 - 49 0.5
3 - 3 - 2 - 2 - 2 - 2 -
11 - 11 - 8 - 8 - 8 - 8 -
2 - 2 - 1 - 1 - 2 - 2 -
295 - 295 0.8 281 - 281 1.0 281 - 281 0.5
Park Access & Circulation
Total Operating Impact
Furniture & Fixtures
Protection Elements
Transportation Operations, Neighbourhoods
Type of Operating Impact:
Maintenance & Utilities for:
Arterial, Local & Collector Roads
Alleys
Sidew alks
Total Operating Impact
Northeast Boundaries: North of the North Saskatchewan River
Communities Include:
Albany, Britnell, Crystallina Nera, Cy Becker, Ebbers Industrial, Eaux Claires, Fraser,
Homesteader, Klarvatten, Marquis, McConachie, Schonsee, Oxford, Hollick-Kenyon,
Kirkness.
Arterials: 195 Avenue - 50 Street to 66 Street, 34 Street, 153 Ave to 158 Avenue, 66 Street,
195 Ave to 178 Avenue, Meridian Street, 153 Ave to 167 Avenue
Playgrounds
Furniture & Fixtures
Protection Elements
Park Access & Circulation
North of Whitemud Drive, 87 Ave and the North Saskatchewan River
Communities Include:
Arena District, Blachford, Cameron Heights, Carlton, Edgemont, Granville, Griesbach, The
Hamptons, Hawks Ridge, MIstatim Industrial, Rampart Industrial, Rapperswill Industrial,
Rosenthal, Secord, Starling/Big Lake, Stewart Greens, Stony Industrial 4, Trumpeter,
Webber Greens, Winterburn Industrial. Yellowhead Industrial.
Arterials: 170 Street, 135 Ave - 140 Ave, 215 Street - Hawks Ridge Blvd South to 112 Ave,
215 Street - Glastonbury Blvd to 62 Ave, 231 Street - Secord Gate to Stony Plain Road
Transportation Operations, Neighbourhoods
Type of Operating Impact:
Maintenance & Utilities for:
Northwest Boundaries
Arterial, Local & Collector Roads
Alleys
Sidew alks
- 76 -

Impacts of a Growing City
Branches:
2016 2017 2018
Exp Rev Net FTEs Exp Rev Net FTEs Exp Rev Net FTEs
220 - 220 2.0 233 - 233 2.0 229 - 229 2.0
12 - 12 - 12 - 12 - 12 - 12 -
41 - 41 - 43 - 43 - 43 - 43 -
Horticulture 100 - 100 1.0 70 - 70 0.7 73 - 73 0.7
4 - 4 - 3 - 3 - 3 - 3 -
16 - 16 0.1 11 - 11 - 12 - 12 -
3 - 3 - 2 - 2 - 2 - 2 -
396 - 396 3.1 375 - 375 2.7 374 - 374 2.7
Branches:
2016 2017 2018
Exp Rev Net FTEs Exp Rev Net FTEs Exp Rev Net FTEs
251 - 251 2.0 267 - 267 2.0 262 - 262 2.0
13 - 13 - 15 - 15 - 14 - 14 -
98 - 98 - 105 - 105 - 104 - 104 -
Horticulture 380 - 380 3.8 269 - 269 2.5 278 - 278 2.5
10 - 10 - - - - - - - - -
14 - 14 - 10 - 10 - 10 - 10 -
61 - 61 0.5 43 - 43 0.3 44 - 44 0.3
4 - 4 - 12 - 12 - 11 - 11 -
831 - 831 6.3 721 - 721 4.8 723 - 723 4.8
Park Access & Circulation
Total Operating Impact
Playgrounds
Furniture & Fixtures
Protection Elements
Transportation Operations, Neighbourhoods
Type of Operating Impact:
Maintenance & Utilities for:
Arterial, Local & Collector Roads
Alleys
Sidew alks
Park Access & Circulation
Total Operating Impact
Southwest Boundaries: South of Whitemud Drive, 87 Ave and the North Saskatchewan River
Communities Include:
Allard, Ambleside, Callaghan, Cavanagh, Cashman, Chappelle, Desrochers, Glenridding
Heights, Graydon Hills, Hays Ridge, Heritage Valley Towne Centre, Magrath Heights,
Keswick, Paisley, Windermere, Blackmud Creek, Rutherford, Hodgson, Terwillegar Towne.,
Terwillegar South, Mactaggart.
Arterials: 30 Avenue SW, Blackmud Creek to 103A Street, 41 Avenue - Blackmud Creek to
Chappelle, Ellerslie Road, 141 to 127 Street, James Mowatt Trail-Allard Blvd to 41 Ave SW
Furniture & Fixtures
Protection Elements
Transportation Operations, Neighbourhoods
Type of Operating Impact:
Maintenance & Utilities for:
Arterial, Local & Collector Roads
Alleys
Sidew alks
Southeast Boundaries: South of the North Saskatchewan River
Communities Include:
Aurum/Cloverbar Industrial, Charlesworth, Ellerslie Industrial, Laurel, Maple, Maple Ridge
Industrial, The Orchards at Ellerslie, Pylypow Industrial, South Edmonton Common,
Southeast Industrial, Summerside, Tamarack, Walker, Meadows, Roper Industrial.
Arterials: , 23 Avenue - 17 Street to Tamarack Collector, 25 Avenue - Orchards Gate to Watt
Drive , 50 Street - Ellerslie Road to 25 Avenue SW, 66 Street, 25 Ave SW to Winspear
Common, Ellerslie Road - 50 Street to Pioneer Meadow Entrance
Operating Impacts of Contributed Assets
- 77 -

Impacts of a Growing City
Operating Impacts of Contributed Assets
Branches:
2016 2017 2018
Exp Rev Net FTEs Exp Rev Net FTEs Exp Rev Net FTEs
1,048 - 1,048 6.0 1,110 - 1,110 6.5 1,092 - 1,092 6.0
61 - 61 - 65 - 65 - 65 - 65 -
240 - 240 - 255 - 255 - 253 - 253 -
- - - - - - - - - - - -
Horticulture 698 - 698 5.9 492 - 492 4.6 509 - 509 4.7
13 - 13 - 2 - 2 - 2 - 2 -
26 - 26 - 19 - 19 - 19 - 19 -
112 - 112 2.1 79 - 79 0.4 81 - 81 0.5
- - - - - - - - - - - -
- - - - - - - - - - - -
12 - 12 - 17 - 17 - 17 - 17 -
2,210 - 2,210 14.0 2,039 - 2,039 11.5 2,039 - 2,039 11.2
2016 2017 2018
Exp Rev Net FTEs Exp Rev Net FTEs Exp Rev Net FTEs
12,521 1,153 11,368 70.4 10,072 730 9,342 83.6 15,010 611 14,399 80.6
2,210 - 2,210 14.0 2,039 - 2,039 11.5 2,039 - 2,039 11.2
14,731 1,153 13,578 84.4 12,111 730 11,381 95.1 17,049 611 16,438 91.8 Total Operating Impact
Summary of Operating Impacts of Capital and Contributed Assets
Contributed Assets
Operating Impacts of:
Capital
Furniture & Fixtures
Protection Elements
Sports Fields
Spray Parks
Park Access & Circulation
Total Operating Impact
Maintenance & Utilities for:
Arterial, Local & Collector Roads
Alleys
Sidewalks
Streetlights & Signals
Playgrounds
Transportation Operations, Neighbourhoods
Type of Operating Impact:
- 78 -

Impacts of a Growing City
Summary of Service Packages—Funded
The 2016-2018 Approved Operating Budget includes funding of $12.8 million in 2016, $8.2 million in 2017 and
$4.8 million in 2018 for service packages.
The table below provides a summary of all funded service packages. In addition to the service packages which
assist in achieving Council's Vision there are some that are required in order to meet commitments that have
already been made. The details of the funded service packages are included in the branch sections and can be
located using the page references provided in the table.
# Service Packages ($000)
2016
Net
Req
2017
Net
Req
2018
Net
Req
Page
#
Arts Council1
Annualization - - -
New Budget 120 120 120
Total 120 120 120
FTEs - - -
Edmonton Public Library
2
Annualization - - -
New Budget 200 - -
Total 200 - -
FTEs 1.0 - -
3
Annualization - - -
New Budget - - 301
Total - - 301
FTEs - - -
EAC Operations
The Edmonton Arts Council has experienced growth in
personnel to fully deliver service to the City of Edmonton. Our
last increase to our operations from City Council was in 2011
($300,000). The EAC now has 22 employees, double the
number from 2010. In addition, the EAC is due for a
technology review and upgrade.
Welcome Baby Program
The Welcome Baby program puts early literacy programs into
the hands of newborns and their parents through public health
clinics as part of the two month immunization. This program
was intended to be funded from donations and sponsorships
until 2018, at which time EPL would request additional City
funding to provide sustained on-going funding for this initiative.
City of Learners
The Edmonton Public Library Board’s 2014-18 Strategic
Goals focuses on learning as one of its four strategic
directions. Other cities in Canada, like Vancouver, Fredericton
and Grande Prairie, also have learning community initiatives
which have contributed to enhanced livability, a key plank of
Edmonton City Council’s vision. The budget request includes
funding for a position to coordinate this initiative, support
costs (stationery, training), engagement and programming
costs.
563
553
556
- 79 -

Impacts of a Growing City
Summary of Service Packages—Funded
# Service Packages ($000)
2016
Net
Req
2017
Net
Req
2018
Net
Req
Page
#
4
Annualization - - -
New Budget - 450 (60)
Total - 450 (60)
FTEs - - 3.3
5
Annualization - - -
New Budget - 232
Total - 232 -
FTEs - 0.8 -
Fort Edmonton Park
6
Annualization - - -
New Budget 100 100 -
Total 100 100 -
FTEs - - -
Heritage Council
7
Annualization - - -
New Budget 33 33 34
Total 33 33 34
FTEs - - -
Reach Edmonton
8
Annualization - - -
New Budget 1,000 - -
Total 1,000 - -
Total FTEs - - -
Enhancement of Aboriginal Programming
Alternative Service Delivery Model - eplGO Service Point (Storefront Model - South)
Implementation of eplGO store front library locations (small
footprint rental spaces - max 3,000 sq. ft.) in growing areas of
the City provides an interim solution in meeting the demands
of customers in neighbourhoods without easy access to a
physical library. The funding request includes one-time fit-up
costs for a leased facility, staffing (3.3 FTEs) and operating
costs implemented in 2017.
Alternative Service Delivery Model - epl2go Literacy Van
In 2016, EPL will expand its fleet of literacy vans to bring
library programs and services and the latest technology
resources to Edmontonians. This request includes one-time fit-
up and operating costs for a fourth literacy van. EPL will fund
2016 costs (i.e. one-time and initial operating) through
donations, and in 2017, EPL is requesting City funding for
sustained on-going operating costs.
Increase to Core Funding
Increase to Edmonton Heritage Council’s core operating grant
due to staffing growth and expertise, office costs and
increased levels of service to the community since being
founded in 2009.
24/7 Integrated Crisis Response
This initiative involves collaboration, program development and
support for ongoing relationship between the Fort Edmonton
Management Company and its First Nations and Métis
partners who will be included in programming and capital
development processes at Fort Edmonton Park when it
impacts the historical and cultural narratives of First Nations
and Métis peoples of this territory.
Potentially 75% more calls can be responded to, by having an
increased presence on the street in vulnerable
neighbourhoods and less reliance on EPS and EMS
resources to deal with non emergency calls. Citizens will feel
safer given the increase in downtown visits with the new
entertainment district. Vulnerable Edmontonians will receive
the help they need in a more timely fashion.
555
554
579
589
596
- 80 -
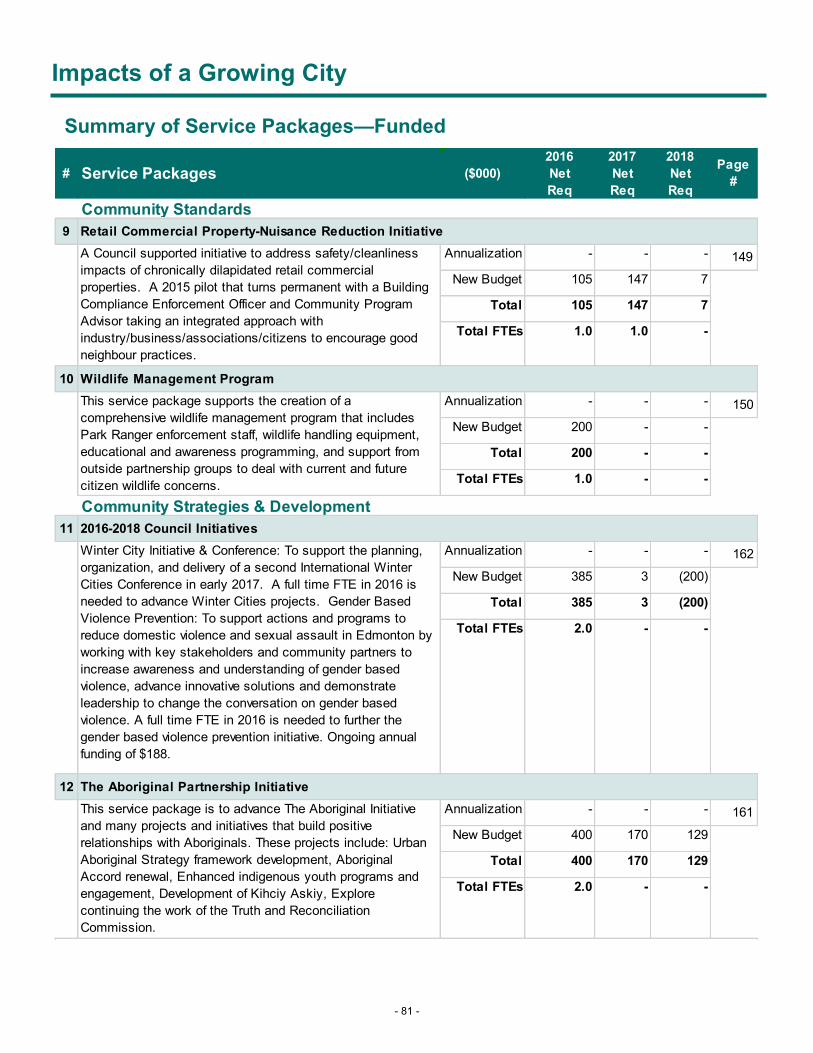
Impacts of a Growing City
Summary of Service Packages—Funded
# Service Packages ($000)
2016
Net
Req
2017
Net
Req
2018
Net
Req
Page
#
Community Standards
9
Annualization - - -
New Budget 105 147 7
Total 105 147 7
Total FTEs 1.0 1.0 -
10
Annualization - - -
New Budget 200 - -
Total 200 - -
Total FTEs 1.0 - -
Community Strategies & Development
11
Annualization - - -
New Budget 385 3 (200)
Total 385 3 (200)
Total FTEs 2.0 - -
12
Annualization - - -
New Budget 400 170 129
Total 400 170 129
Total FTEs 2.0 - -
This service package supports the creation of a
comprehensive wildlife management program that includes
Park Ranger enforcement staff, wildlife handling equipment,
educational and awareness programming, and support from
outside partnership groups to deal with current and future
citizen wildlife concerns.
2016-2018 Council Initiatives
Winter City Initiative & Conference: To support the planning,
organization, and delivery of a second International Winter
Cities Conference in early 2017. A full time FTE in 2016 is
needed to advance Winter Cities projects. Gender Based
Violence Prevention: To support actions and programs to
reduce domestic violence and sexual assault in Edmonton by
working with key stakeholders and community partners to
increase awareness and understanding of gender based
violence, advance innovative solutions and demonstrate
leadership to change the conversation on gender based
violence. A full time FTE in 2016 is needed to further the
gender based violence prevention initiative. Ongoing annual
funding of $188.
The Aboriginal Partnership Initiative
This service package is to advance The Aboriginal Initiative
and many projects and initiatives that build positive
relationships with Aboriginals. These projects include: Urban
Aboriginal Strategy framework development, Aboriginal
Accord renewal, Enhanced indigenous youth programs and
engagement, Development of Kihciy Askiy, Explore
continuing the work of the Truth and Reconciliation
Commission.
Retail Commercial Property-Nuisance Reduction Initiative
A Council supported initiative to address safety/cleanliness
impacts of chronically dilapidated retail commercial
properties. A 2015 pilot that turns permanent with a Building
Compliance Enforcement Officer and Community Program
Advisor taking an integrated approach with
industry/business/associations/citizens to encourage good
neighbour practices.
Wildlife Management Program
149
150
162
161
- 81 -
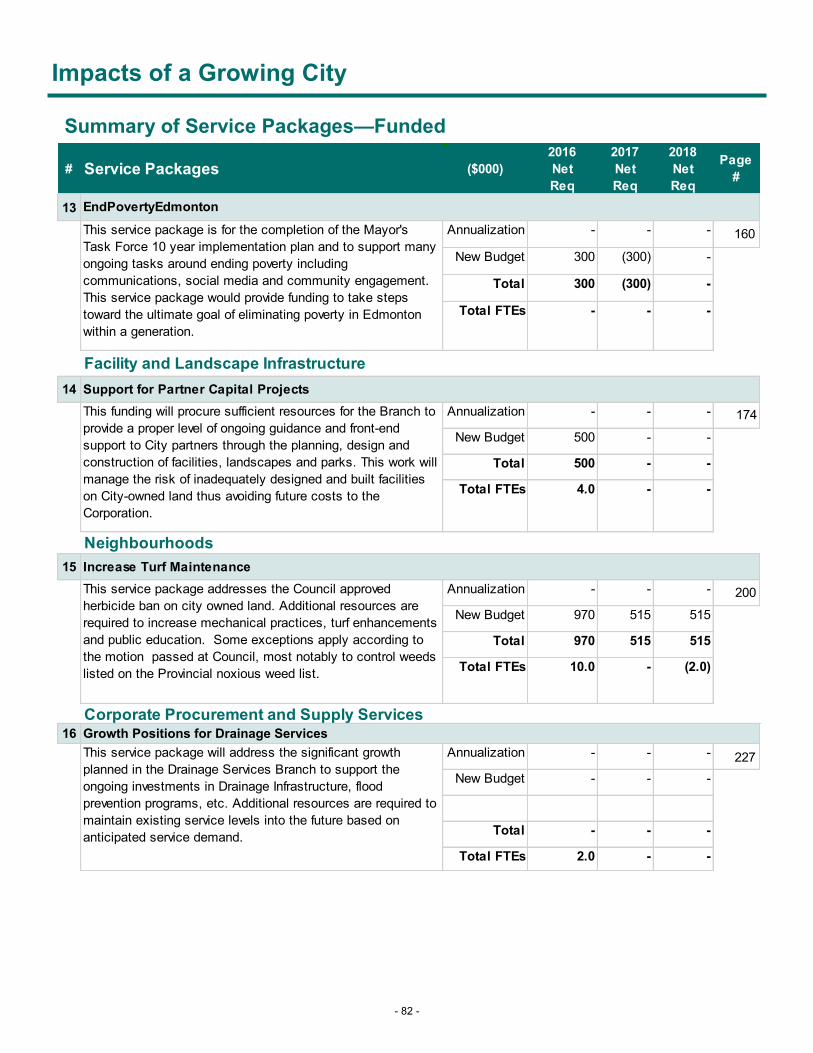
Impacts of a Growing City
Summary of Service Packages—Funded
# Service Packages ($000)
2016
Net
Req
2017
Net
Req
2018
Net
Req
Page
#
13
Annualization - - -
New Budget 300 (300) -
Total 300 (300) -
Total FTEs - - -
Facility and Landscape Infrastructure
14
Annualization - - -
New Budget 500 - -
Total 500 - -
Total FTEs 4.0 - -
Neighbourhoods
15
Annualization - - -
New Budget 970 515 515
Total 970 515 515
Total FTEs 10.0 - (2.0)
Corporate Procurement and Supply Services16
Annualization - - -
New Budget - - -
Total - - -
Total FTEs 2.0 - -
This service package addresses the Council approved
herbicide ban on city owned land. Additional resources are
required to increase mechanical practices, turf enhancements
and public education. Some exceptions apply according to
the motion passed at Council, most notably to control weeds
listed on the Provincial noxious weed list.
EndPovertyEdmonton
This service package is for the completion of the Mayor's
Task Force 10 year implementation plan and to support many
ongoing tasks around ending poverty including
communications, social media and community engagement.
This service package would provide funding to take steps
toward the ultimate goal of eliminating poverty in Edmonton
within a generation.
Increase Turf Maintenance
Growth Positions for Drainage ServicesThis service package will address the significant growth
planned in the Drainage Services Branch to support the
ongoing investments in Drainage Infrastructure, flood
prevention programs, etc. Additional resources are required to
maintain existing service levels into the future based on
anticipated service demand.
Support for Partner Capital Projects
This funding will procure sufficient resources for the Branch to
provide a proper level of ongoing guidance and front-end
support to City partners through the planning, design and
construction of facilities, landscapes and parks. This work will
manage the risk of inadequately designed and built facilities
on City-owned land thus avoiding future costs to the
Corporation.
160
174
200
227
- 82 -
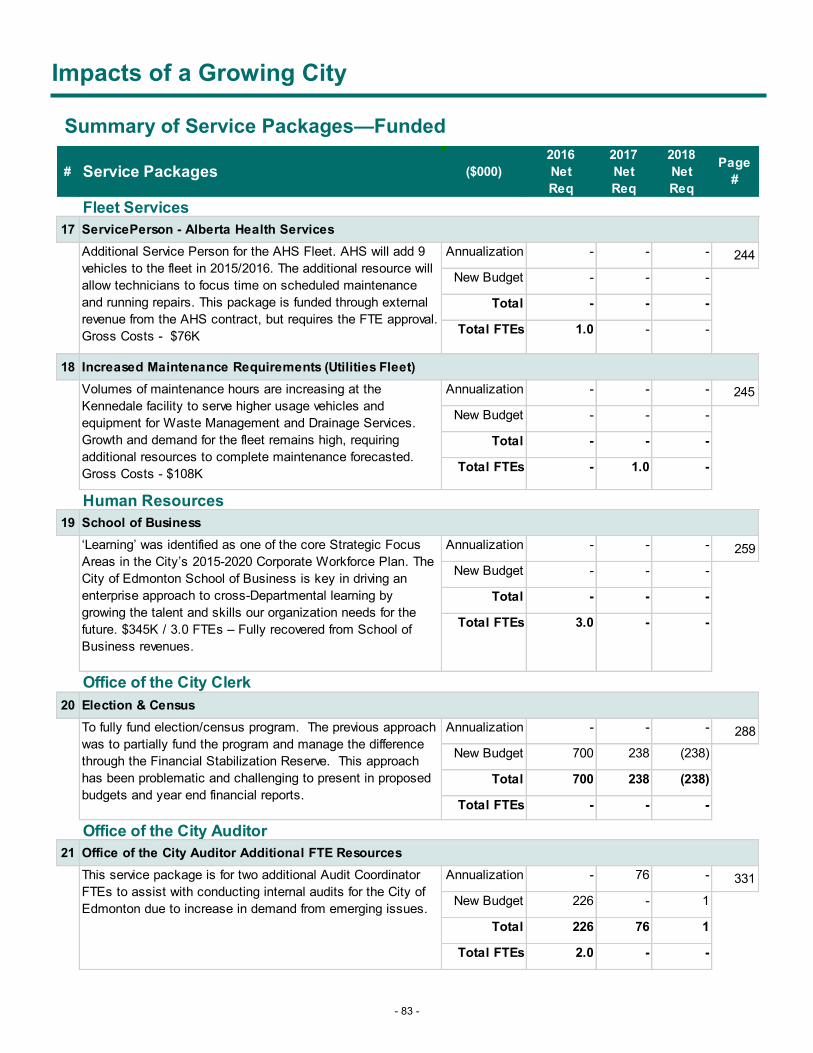
Impacts of a Growing City
Summary of Service Packages—Funded
# Service Packages ($000)
2016
Net
Req
2017
Net
Req
2018
Net
Req
Page
#
Fleet Services
17
Annualization - - -
New Budget - - -
Total - - -
Total FTEs 1.0 - -
18
Annualization - - -
New Budget - - -
Total - - -
Total FTEs - 1.0 -
Human Resources
19
Annualization - - -
New Budget - - -
Total - - -
Total FTEs 3.0 - -
Office of the City Clerk
20
Annualization - - -
New Budget 700 238 (238)
Total 700 238 (238)
Total FTEs - - -
Office of the City Auditor
21
Annualization - 76 -
New Budget 226 - 1
Total 226 76 1
Total FTEs 2.0 - -
Additional Service Person for the AHS Fleet. AHS will add 9
vehicles to the fleet in 2015/2016. The additional resource will
allow technicians to focus time on scheduled maintenance
and running repairs. This package is funded through external
revenue from the AHS contract, but requires the FTE approval.
Gross Costs - $76K
Increased Maintenance Requirements (Utilities Fleet)
ServicePerson - Alberta Health Services
School of Business
‘Learning’ was identified as one of the core Strategic Focus
Areas in the City’s 2015-2020 Corporate Workforce Plan. The
City of Edmonton School of Business is key in driving an
enterprise approach to cross-Departmental learning by
growing the talent and skills our organization needs for the
future. $345K / 3.0 FTEs – Fully recovered from School of
Business revenues.
Election & Census
To fully fund election/census program. The previous approach
was to partially fund the program and manage the difference
through the Financial Stabilization Reserve. This approach
has been problematic and challenging to present in proposed
budgets and year end financial reports.
Office of the City Auditor Additional FTE Resources
This service package is for two additional Audit Coordinator
FTEs to assist with conducting internal audits for the City of
Edmonton due to increase in demand from emerging issues.
Volumes of maintenance hours are increasing at the
Kennedale facility to serve higher usage vehicles and
equipment for Waste Management and Drainage Services.
Growth and demand for the fleet remains high, requiring
additional resources to complete maintenance forecasted.
Gross Costs - $108K
244
245
259
288
331
- 83 -

Impacts of a Growing City
Summary of Service Packages—Funded
# Service Packages ($000)
2016
Net
Req
2017
Net
Req
2018
Net
Req
Page
#
Corporate Communications
22
Annualization - - -
New Budget 1,000 1,000 -
Total 1,000 1,000 -
Total FTEs - - -
Intergovernmental & External Affairs
23
Annualization - - -
New Budget 1,200 - -
Total 1,200 - -
Total FTEs - - -
24
Annualization - - -
New Budget - 500 -
Total - 500 -
Total FTEs - - -
25
Annualization - - -
New Budget - - 550
Total - - 550
Total FTEs - - -
Current Planning
26
Annualization - - -
New Budget - - -
Total - - -
Total FTEs 6.0 13.5 16.0
Anticipated Event 2018
Red Bull Crashed Ice was held in Edmonton for the first time
in March 2015. The event was successful on two fronts -
economic impact ($20.6 million) and reputational/profile for the
city (200 million media impressions, 1600 media stories and
delayed broadcast to over 100 million viewers).
The Current Planning Branch recommends a total of 44
positions (12.0 in 2016, 15.0 in 2017, 17.0 in 2018 before
annualization). The positions will provide the Branch flexibility
to support safety codes, customer service, planning,
development and development coordination to accommodate
increased service demands and to support other areas of The
City that provide technical support.
This service package is a placeholder for discussions
regarding the City's involvement in the International Festival of
Extreme Sports (FISE). The World Series of FISE is an
action sport event involving BMX, Roller sport, Mountain
Biking, Skateboarding and Wakeboarding.
Funding for this service package will come from appropriated
funds within the Financial Stabilization Reserve.
Anticipated EventThis is a joint initiative among Alberta Basketball, Canada
Basketball, Edmonton Tourism, the University of Alberta and
the City of Edmonton. It is unique for a leading City and
University to partner with the national and provincial sport
organization responsible to deliver basketball programs
nationally, provincially and locally.
Sponsorship agreement re Rogers Place
As part of the Master Agreement for the downtown arena
(Rogers Place), the City agreed to a 10-year sponsorship
agreement with the Katz Group. This agreement will provide
the City with access to a number of avenues through both the
new arena and the Edmonton Oilers to promote Edmonton
and City of Edmonton programs, services and initiatives.
Anticipated Events 2016-2018
Customer Services & Operations- Increased Service Volumes
351
360
359
361
378
- 84 -

Impacts of a Growing City
Summary of Service Packages—Funded
# Service Packages ($000)
2016
Net
Req
2017
Net
Req
2018
Net
Req
Page
#
27
Annualization - - -
New Budget - - -
Total - - -
Total FTEs 5.0 - -
Real Estate, Housing and Economic Sustainability
28
Annualization - - -
New Budget 234 99 (10)
Total 234 99 (10)
Total FTEs 2.0 2.0 -
29
Annualization - - -
New Budget 100 - -
Total 100 - -
Total FTEs - - -
30
Annualization - - -
New Budget 1,046 17 23
Total 1,046 17 23
Total FTEs 7.0 - -
31
Annualization - - -
New Budget 250 250 250
Total 250 250 250
Total FTEs - - -
Mature Community Development Team
Building and Land Management
FTEs are required for improved property management services
and to implement new technology for enhanced suburban site
integration. Outcomes are new revenue opportunities, cost
efficiencies and property management best practices.
Implications of not funding include a higher risk profile, such as
legal and audit risk, and the inability to meet existing project and
service requirements.
Ec Sustainability - Northern & Industrial Programs
Funding is required for industrial investment attraction, business
retention and expansion supported by a marketing initiative.
Funds will also be used to meet commitments for the Northern
Circumpolar Secretariat. Increased resources will enhance
business marketing, develop an eco-industrial business program,
and improve partnerships with northern communities and
industrial businesses.
Edm Research Park - City Admin
Provide professional leasing, property management, and facilities
maintenance support for the Edmonton Research Park, under the
new business model recommended for adoption. The FTEs and
resources required will ensure that the vision for the Edmonton
Research Park is achieved.
Ec Sustainability - Main Street and BRZ Image and Reputation Initiative
New funding will ensure that Edmonton’s destination commercial-
oriented streets (Whyte Avenue and 124 St) are effectively
maintained to a standard that upholds the reputation of
Edmonton. Additional funding will extend support to BRZs not
supported by the Main Street Image and Reputation Initiative or
the Great Neighbourhoods Initiative, to ensure equitable support
across all of the City's BRZs.
Current Planning recommends five (5) positions to address
regulatory, communication, and relationship issues specific to
mature neighbourhood developments. The team will liaise with
existing areas to recommend policy or process changes
(including fee changes, incentives or penalties) and improve
education, development standards and communication between
stakeholders.
379
395
396
394
- 85 -
398
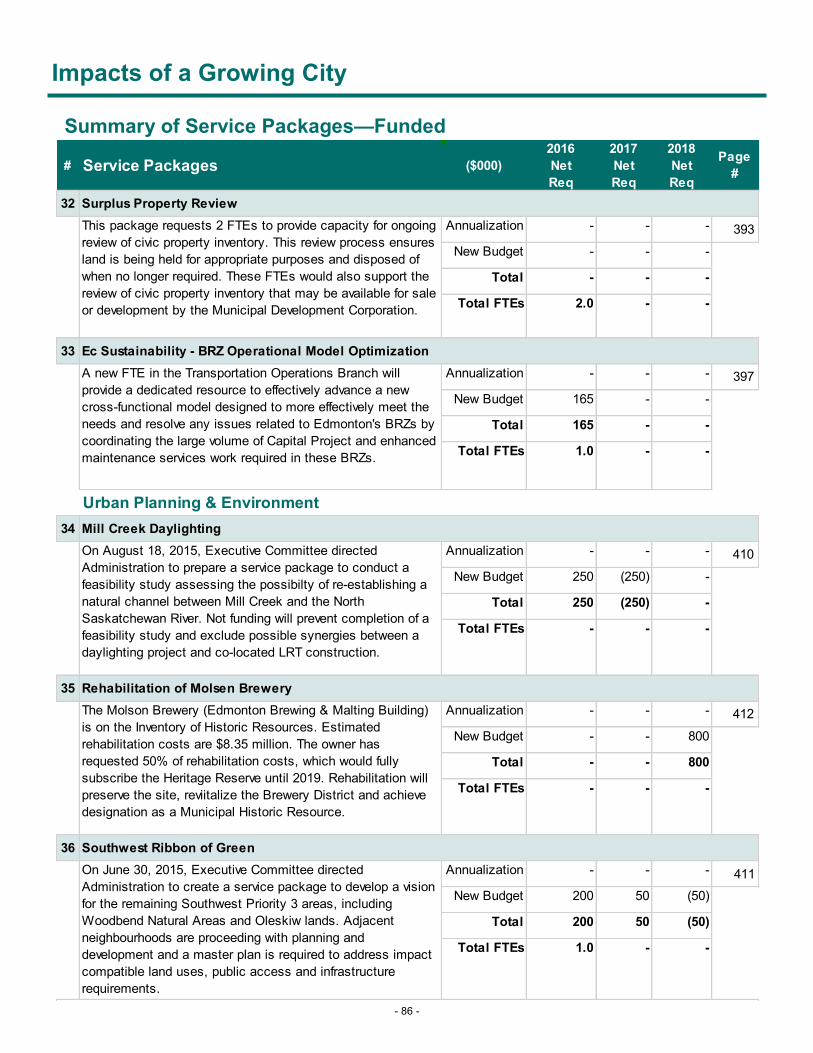
Impacts of a Growing City
Summary of Service Packages—Funded
# Service Packages ($000)
2016
Net
Req
2017
Net
Req
2018
Net
Req
Page
#
32
Annualization - - -
New Budget - - -
Total - - -
Total FTEs 2.0 - -
33
Annualization - - -
New Budget 165 - -
Total 165 - -
Total FTEs 1.0 - -
Urban Planning & Environment
34
Annualization - - -
New Budget 250 (250) -
Total 250 (250) -
Total FTEs - - -
35
Annualization - - -
New Budget - - 800
Total - - 800
Total FTEs - - -
36
Annualization - - -
New Budget 200 50 (50)
Total 200 50 (50)
Total FTEs 1.0 - -
A new FTE in the Transportation Operations Branch will
provide a dedicated resource to effectively advance a new
cross-functional model designed to more effectively meet the
needs and resolve any issues related to Edmonton's BRZs by
coordinating the large volume of Capital Project and enhanced
maintenance services work required in these BRZs.
Mill Creek Daylighting
On August 18, 2015, Executive Committee directed
Administration to prepare a service package to conduct a
feasibility study assessing the possibilty of re-establishing a
natural channel between Mill Creek and the North
Saskatchewan River. Not funding will prevent completion of a
feasibility study and exclude possible synergies between a
daylighting project and co-located LRT construction.
Rehabilitation of Molsen Brewery
The Molson Brewery (Edmonton Brewing & Malting Building)
is on the Inventory of Historic Resources. Estimated
rehabilitation costs are $8.35 million. The owner has
requested 50% of rehabilitation costs, which would fully
subscribe the Heritage Reserve until 2019. Rehabilitation will
preserve the site, reviitalize the Brewery District and achieve
designation as a Municipal Historic Resource.
Southwest Ribbon of Green
On June 30, 2015, Executive Committee directed
Administration to create a service package to develop a vision
for the remaining Southwest Priority 3 areas, including
Woodbend Natural Areas and Oleskiw lands. Adjacent
neighbourhoods are proceeding with planning and
development and a master plan is required to address impact
compatible land uses, public access and infrastructure
requirements.
Ec Sustainability - BRZ Operational Model Optimization
Surplus Property Review
This package requests 2 FTEs to provide capacity for ongoing
review of civic property inventory. This review process ensures
land is being held for appropriate purposes and disposed of
when no longer required. These FTEs would also support the
review of civic property inventory that may be available for sale
or development by the Municipal Development Corporation.
393
410
412
411
- 86 -
397

Impacts of a Growing City
Summary of Service Packages—Funded
# Service Packages ($000)
2016
Net
Req
2017
Net
Req
2018
Net
Req
Page
#
37
Annualization - - -
New Budget 1,304 750 (97)
Total 1,304 750 (97)
Total FTEs 3.0 - -
38
Annualization - - -
New Budget 200 100 (125)
Total 200 100 (125)
Total FTEs - - -
39
Annualization - - -
New Budget - 186 7
Total - 186 7
Total FTEs - 2.0 -
40
Annualization - - -
New Budget 1,000 1,000 750
Total 1,000 1,000 750
Total FTEs 4.0 2.0 4.0
Edmonton Transit
41
Annualization - - -
New Budget 103 236 5
Total 103 236 5
Total FTEs 1.0 2.0 -
Implementing Edmonton's Community Energy Transition Strategy
Endorsed by Council on April 29, 2015, this strategy will
transform Edmonton into an energy sustainable city. By 2035,
the strategy will deliver $2.5 billion in private savings through
investments in clean energy, energy conservation and
efficiency. Not funding this service package will impact
corporate targets and discontinue this initiative, part of The
Way Ahead Implementation Plan.
River Crossing
LRT - LRT Maintenance Foremen & Escalator Tech
A request for 1 Elevator/Escalator Technologist and 2
Maintenance and Service Foremen. The Elevator Tech will
monitor contractors in the field and push for improvements in
contractor reporting, resulting in higher service uptimes for
elevators and escalators. The Foremen will be responsible for
quality and quantity of work being performed on LRV vehicles,
improving reliability of the ETS system.
On June 30, 2015, Executive Committee directed
Administration to create a service package to develop a
business case for River Crossing, which explores options for
creating a landmark destincation precinct in the river valley.
River Crossing includes integration of initiatives such as West
Rossdale Urban Design Plan, Walterdale Bridge, Touch the
Water promenade, and Rossdale Generating Station.
Stewarding Great Neighbourhoods
This package enables the 4 citizen-facing departments to
centralize neighbourhood-scale intelligence for mature
neighbourhoods, improving coordination and enabling cost
savings and numerous efficiencies.
Corporate Environmental Targets
This service package includes 6 initiatves from 4 branches
including: Climate Adaption Strategy, Energy Conservation
and Efficiency Initiatives in City Facilities, Enviso Expansion,
LRT- ETS Environmental Programs and Plans, Purchase of
Green Power for City Operations.
409
413
414
408
460
- 87 -

Impacts of a Growing City
Summary of Service Packages—Funded
# Service Packages ($000)
2016
Net
Req
2017
Net
Req
2018
Net
Req
Page
#
42
Annualization - - -
New Budget - 174 61
Total - 174 61
Total FTEs - - -
43
Annualization - - -
New Budget 230 2,000 2,000
Total 230 2,000 2,000
Total FTEs 1.0 6.5 6.0
Transportation Operations
44
Annualization - - -
New Budget 302 316 22
Total 302 316 22
Total FTEs 3.0 2.0 -
45 Geotechnical Engineering Reviews and Design
Annualization - - -
New Budget - - -
Total - - -
Total FTEs - 1.0 -
46 Road Safety Engineer
Annualization - - -
New Budget - - -
Total - - -
Total FTEs 1.0 - -
This service package outlines a request for a senior
geotechnical position. This position will reduce the time
required to provide geotechnical reviews to the Sustainable
Development Department for various development
applications, as well as the geotechnical reviews and
consulting required for in-house projects for Transportation
Services.
Low Income Transit Pass
This package supports the administration of a low income
transit pass program, including funding for:
-software application upgrades
-facility upgrades (point of sales)
-staff for application processing (5 positions)
-staff for counter sales (8 positions)
-staff for online sales (1 position)
Roadway Maintenance Inspectors
This service package outlines funding and FTE requirements
to address customer service gaps and provide increased
oversight of contracted equipment. The current number of five
inspectors has not increased since 1980 and can not keep
pace with increased customer inquiries and hired equipment
usage arising from inventory growth over the past 30 years.
This service package includes one permanent position (1
FTE) of a Road Safety Engineer. The creation of this position
will streamline the road safety assessment process by
incorporating a position that will specifically deal with making
safety recommendations that need to be considered to reduce
collisions. No impact on tax levy as is it funded by Traffic
Safety and Automated Enforcement Reserve.
DATS - Change to DATS Accommodation Rate
This package will provide budget for additional DATS trips to
be provided by third party contractors. This is required to
maintain current service levels with increased service demand.
464
463
499
491
502
- 88 -
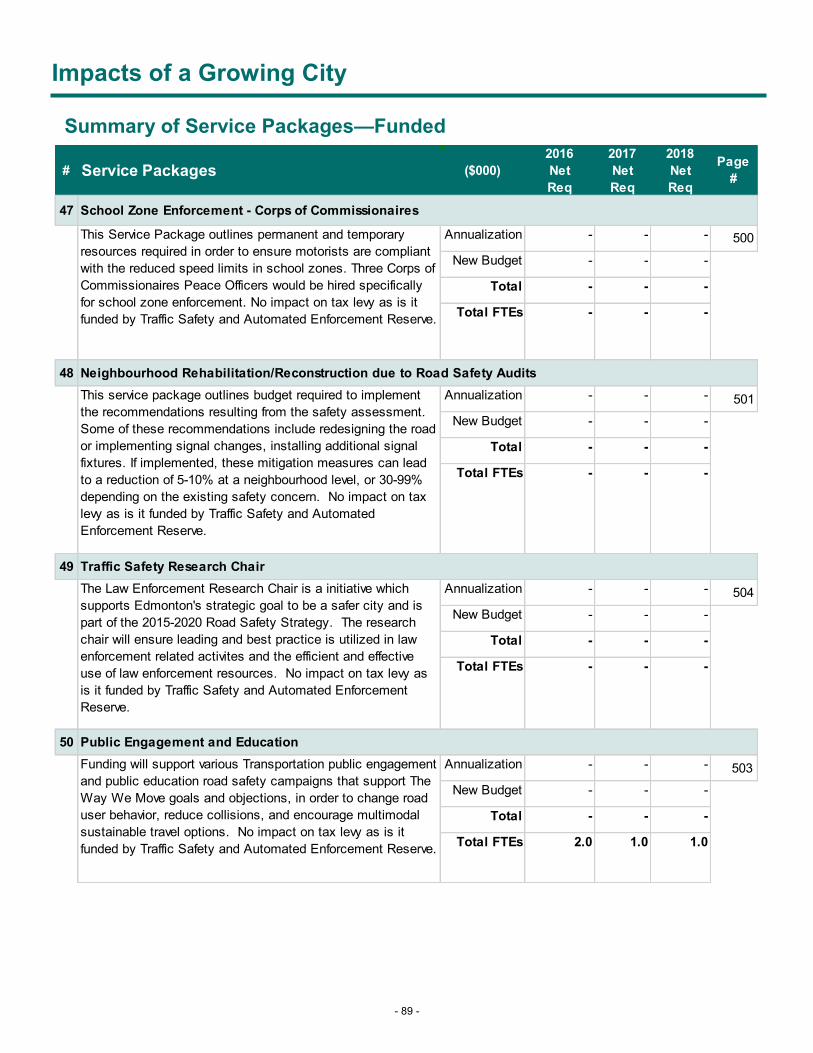
Impacts of a Growing City
Summary of Service Packages—Funded
# Service Packages ($000)
2016
Net
Req
2017
Net
Req
2018
Net
Req
Page
#
47 School Zone Enforcement - Corps of Commissionaires
Annualization - - -
New Budget - - -
Total - - -
Total FTEs - - -
48 Neighbourhood Rehabilitation/Reconstruction due to Road Safety Audits
Annualization - - -
New Budget - - -
Total - - -
Total FTEs - - -
49 Traffic Safety Research Chair
Annualization - - -
New Budget - - -
Total - - -
Total FTEs - - -
50 Public Engagement and Education
Annualization - - -
New Budget - - -
Total - - -
Total FTEs 2.0 1.0 1.0
This Service Package outlines permanent and temporary
resources required in order to ensure motorists are compliant
with the reduced speed limits in school zones. Three Corps of
Commissionaires Peace Officers would be hired specifically
for school zone enforcement. No impact on tax levy as is it
funded by Traffic Safety and Automated Enforcement Reserve.
This service package outlines budget required to implement
the recommendations resulting from the safety assessment.
Some of these recommendations include redesigning the road
or implementing signal changes, installing additional signal
fixtures. If implemented, these mitigation measures can lead
to a reduction of 5-10% at a neighbourhood level, or 30-99%
depending on the existing safety concern. No impact on tax
levy as is it funded by Traffic Safety and Automated
Enforcement Reserve.
The Law Enforcement Research Chair is a initiative which
supports Edmonton's strategic goal to be a safer city and is
part of the 2015-2020 Road Safety Strategy. The research
chair will ensure leading and best practice is utilized in law
enforcement related activites and the efficient and effective
use of law enforcement resources. No impact on tax levy as
is it funded by Traffic Safety and Automated Enforcement
Reserve.
Funding will support various Transportation public engagement
and public education road safety campaigns that support The
Way We Move goals and objections, in order to change road
user behavior, reduce collisions, and encourage multimodal
sustainable travel options. No impact on tax levy as is it
funded by Traffic Safety and Automated Enforcement Reserve.
500
501
504
503
- 89 -

Impacts of a Growing City
Summary of Service Packages—Funded
# Service Packages ($000)
2016
Net
Req
2017
Net
Req
2018
Net
Req
Page
#
Transportation Planning
51 Community Traffic Management
Annualization - - -
New Budget - - -
Total - - -
Total FTEs 5.0 - -
52 Enhanced Concept Planning
Annualization - - -
New Budget - - -
Total - - -
Total FTEs 7.0 - -
Total 12,823 8,212 4,795
Total FTEs 80.0 34.8 28.3
New scope of work for Transportation Planning to complete
concept planning for arterial renewal and neighborhood
renewal programs, to implement Complete Streets approach,
and significant public engagement in advance of the current
processes. No impact on tax levy as it is funded by capital.
Community traffic management addresses neighbourhood
shortcutting, excessive traffic volumes and speeds. The
process to develop a community traffic management plan is
community-driven and collaborative, and focuses on extensive
public engagement in all aspects of plan development, trial
implementation and ultimately the implementation of
permanent measures. Outcomes support The Way We Move.
No impact on tax levy as is it funded by Traffic Safety and
Automated Enforcement Reserve.
Total Funded Ongoing & One-Time Service Packages
515
516
- 90 -
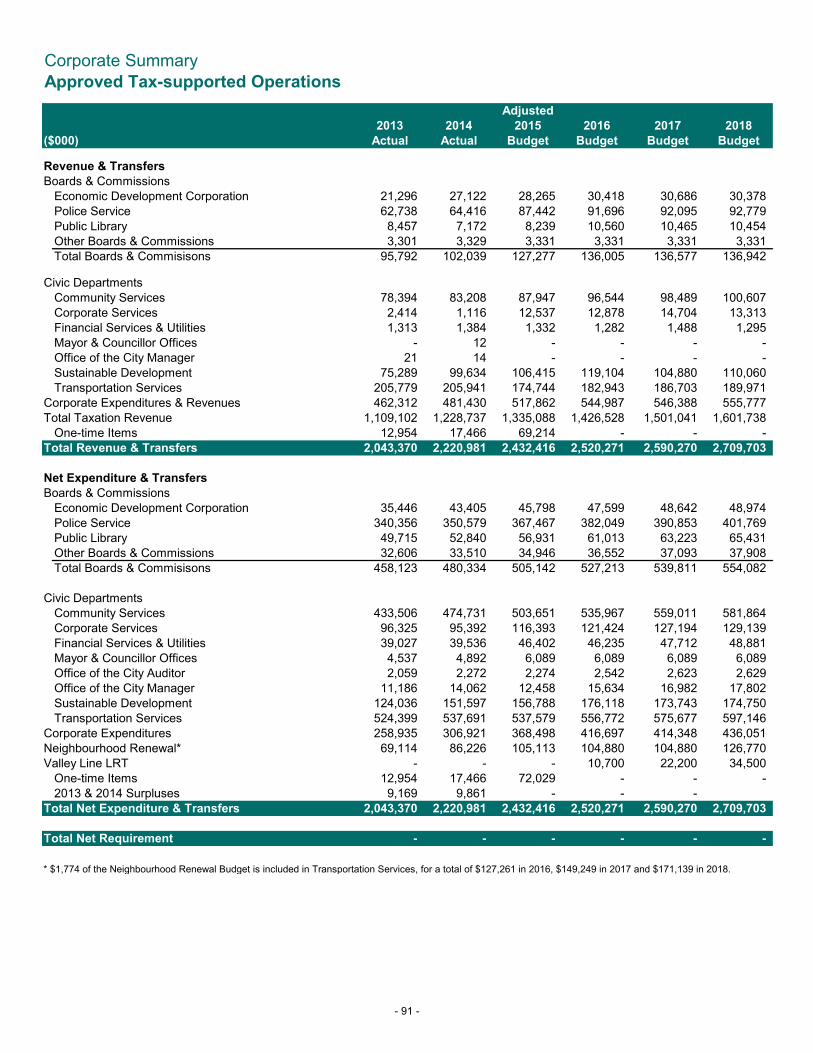
Corporate Summary
Approved Tax-supported Operations
Adjusted
2013 2014 2015 2016 2017 2018
($000) Actual Actual Budget Budget Budget Budget
Revenue & Transfers
Boards & Commissions
Economic Development Corporation 21,296 27,122 28,265 30,418 30,686 30,378
Police Service 62,738 64,416 87,442 91,696 92,095 92,779
Public Library 8,457 7,172 8,239 10,560 10,465 10,454
Other Boards & Commissions 3,301 3,329 3,331 3,331 3,331 3,331
Total Boards & Commisisons 95,792 102,039 127,277 136,005 136,577 136,942
Civic Departments
Community Services 78,394 83,208 87,947 96,544 98,489 100,607
Corporate Services 2,414 1,116 12,537 12,878 14,704 13,313
Financial Services & Utilities 1,313 1,384 1,332 1,282 1,488 1,295
Mayor & Councillor Offices - 12 - - - -
Office of the City Manager 21 14 - - - -
Sustainable Development 75,289 99,634 106,415 119,104 104,880 110,060
Transportation Services 205,779 205,941 174,744 182,943 186,703 189,971
Corporate Expenditures & Revenues 462,312 481,430 517,862 544,987 546,388 555,777
Total Taxation Revenue 1,109,102 1,228,737 1,335,088 1,426,528 1,501,041 1,601,738
One-time Items 12,954 17,466 69,214 - - -
Total Revenue & Transfers 2,043,370 2,220,981 2,432,416 2,520,271 2,590,270 2,709,703
Net Expenditure & Transfers
Boards & Commissions
Economic Development Corporation 35,446 43,405 45,798 47,599 48,642 48,974
Police Service 340,356 350,579 367,467 382,049 390,853 401,769
Public Library 49,715 52,840 56,931 61,013 63,223 65,431
Other Boards & Commissions 32,606 33,510 34,946 36,552 37,093 37,908
Total Boards & Commisisons 458,123 480,334 505,142 527,213 539,811 554,082
Civic Departments
Community Services 433,506 474,731 503,651 535,967 559,011 581,864
Corporate Services 96,325 95,392 116,393 121,424 127,194 129,139
Financial Services & Utilities 39,027 39,536 46,402 46,235 47,712 48,881
Mayor & Councillor Offices 4,537 4,892 6,089 6,089 6,089 6,089
Office of the City Auditor 2,059 2,272 2,274 2,542 2,623 2,629
Office of the City Manager 11,186 14,062 12,458 15,634 16,982 17,802
Sustainable Development 124,036 151,597 156,788 176,118 173,743 174,750
Transportation Services 524,399 537,691 537,579 556,772 575,677 597,146
Corporate Expenditures 258,935 306,921 368,498 416,697 414,348 436,051
Neighbourhood Renewal* 69,114 86,226 105,113 104,880 104,880 126,770
Valley Line LRT - - - 10,700 22,200 34,500
One-time Items 12,954 17,466 72,029 - - -
2013 & 2014 Surpluses 9,169 9,861 - - -
Total Net Expenditure & Transfers 2,043,370 2,220,981 2,432,416 2,520,271 2,590,270 2,709,703
Total Net Requirement - - - - - -
* $1,774 of the Neighbourhood Renewal Budget is included in Transportation Services, for a total of $127,261 in 2016, $149,249 in 2017 and $171,139 in 2018.
- 91 -

Tax-supported Operations
Approved Net Operating Requirement
Adjusted
2013 2014 2015 2016 2017 2018
($000) Actual Actual Budget Budget Budget Budget
Boards & Commissions
Economic Development Corporation 14,150 16,283 17,533 17,181 17,956 18,596
Police Service 277,618 286,163 280,025 290,353 298,758 308,990
Public Library 41,258 45,668 48,692 50,453 52,758 54,977
Other Boards & Commissions 29,305 30,181 31,615 33,221 33,762 34,577
Total Boards & Commissions 362,331 378,295 377,865 391,208 403,234 417,140
Civic Departments
Community Services
Community & Recreation Facilities 37,951 43,384 45,566 46,185 51,608 54,902
Community Standards 19,128 20,393 21,024 22,243 22,812 23,459
Community Strategies & Development 24,700 25,635 24,339 25,314 25,657 26,073
Facility & Landscape Infrastructure 52,978 60,550 65,801 72,442 75,988 80,814
Fire Rescue Services 169,056 186,122 196,349 205,359 212,286 219,228
Neighbourhoods 51,299 55,439 62,625 67,880 72,171 76,781
Corporate Services
Corporate Procurement & Supply Services 8,879 9,756 11,627 12,044 12,442 12,913
Customer Information Services 13,690 14,184 14,323 14,851 15,284 15,770
Fleet Services - - - - - -
Human Resources 10,252 11,886 15,074 15,886 16,441 16,631
Information Technology 41,655 39,051 42,042 43,934 45,836 47,774
Law 8,915 9,548 10,580 10,931 11,167 11,458
Office of the City Clerk 10,520 9,851 10,210 10,900 11,320 11,280
Financial Services & Utilities
Assessment & Taxation 19,666 20,000 22,016 21,787 22,466 23,106
Corporate Strategic Planning 3,633 4,072 4,637 5,252 5,613 5,557
Financial Services 5,315 5,096 8,257 7,253 7,185 7,662
Financial Strategies & Budget 9,100 8,984 10,160 10,661 10,960 11,261
Mayor & Councillor Offices 4,537 4,880 6,089 6,089 6,089 6,089
Office of the City Auditor 2,059 2,272 2,274 2,542 2,623 2,629
Office of the City Manager
City Manager 1,060 1,080 1,177 1,622 1,240 1,265
Corporate Communications 7,761 8,203 8,403 9,902 11,117 11,344
Intergovernmental & External Affairs 2,344 4,765 2,878 4,110 4,625 5,193
Sustainable Development
Community Revitalization Levy - The Quarters 142 142 142 142 142 142
Current Planning (37) (199) - - - -
Real Estate, Housing & Economic Sustainability 33,130 34,300 31,790 35,451 44,538 39,773
Urban Planning & Environment 15,512 17,720 18,441 21,421 24,183 24,775
Transportation Services
Edmonton Transit 174,042 182,322 208,626 214,255 222,893 235,548
LRT Design & Construction 666 710 739 720 731 742
Roads Design & Construction 1,397 1,335 1,463 1,572 1,624 1,679
Transportation Operations 128,786 133,748 137,603 143,226 149,436 154,712
Transportation Planning 13,729 13,635 14,404 14,056 14,290 14,494
Total Civic Departments 871,865 928,864 998,659 1,048,030 1,102,767 1,143,054
Corporate Expenditures & Revenues
Automated Enforcement - - - - - -
Capital Project Financing 94,524 130,695 151,755 160,995 155,005 161,961
Corporate Expenditures 34,309 29,219 30,451 37,955 42,728 52,035
Corporate Revenues (338,342) (336,369) (333,825) (341,040) (344,273) (349,872)
Taxation Expenditures 6,132 1,946 2,255 13,800 14,500 16,150
Total Corporate Expenditures & Revenues (203,377) (174,509) (149,364) (128,290) (132,040) (119,726)
Neighbourhood Renewal
Total Neighbourhood Renewal 70,655 87,767 106,654 106,654 106,654 128,544
Less: Microsurfacing - Transportation Operations 1,541 1,541 1,541 1,774 1,774 1,774
Transfer to Capital - Corporate Programs 69,114 86,226 105,113 104,880 104,880 126,770
Valley Line LRT - - - 10,700 22,200 34,500
Total Taxation Revenue (1,109,102) (1,228,737) (1,335,088) (1,426,528) (1,501,041) (1,601,738)
One-time Items - - 2,815 - - -
2013 & 2014 Surpluses 9,169 9,861 - - - -
Total Net Operating Requirement - - - - - -
Net Operating Requirement amounts are the difference betw een amounts on Expenditure & Revenue Tables that follow .- 92 -
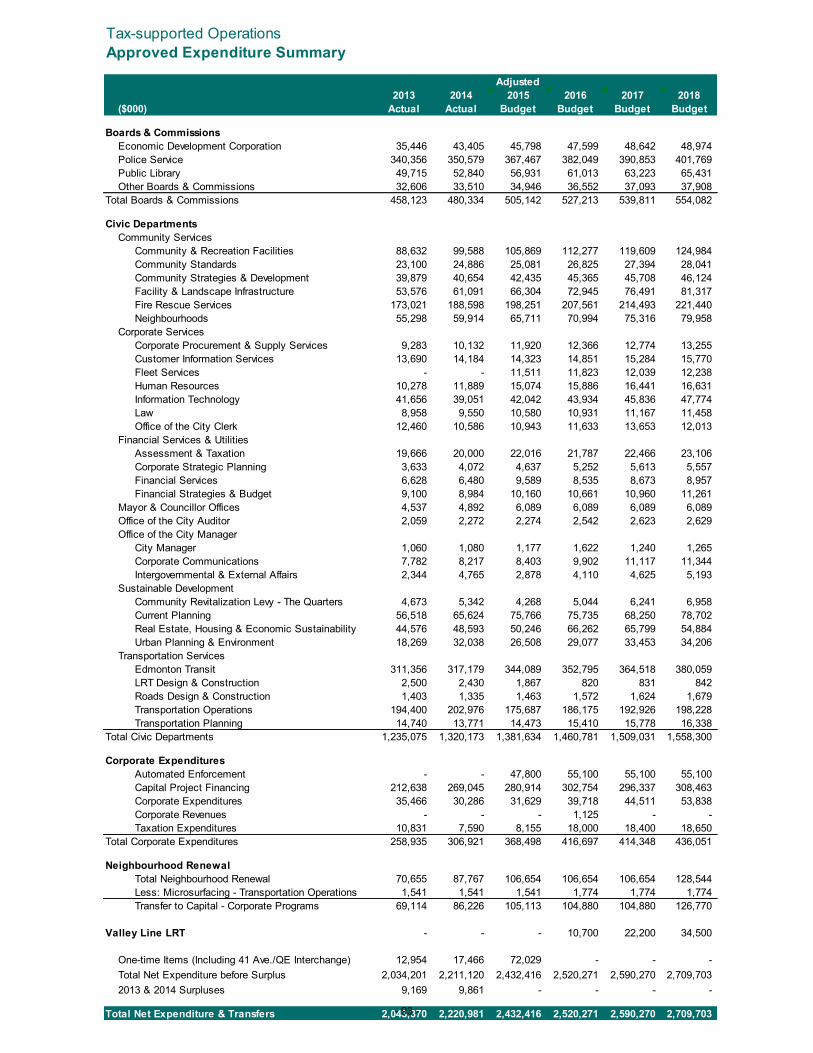
Tax-supported Operations
Approved Expenditure Summary
Adjusted
2013 2014 2015 2016 2017 2018
($000) Actual Actual Budget Budget Budget Budget
Boards & Commissions
Economic Development Corporation 35,446 43,405 45,798 47,599 48,642 48,974
Police Service 340,356 350,579 367,467 382,049 390,853 401,769
Public Library 49,715 52,840 56,931 61,013 63,223 65,431
Other Boards & Commissions 32,606 33,510 34,946 36,552 37,093 37,908
Total Boards & Commissions 458,123 480,334 505,142 527,213 539,811 554,082
Civic Departments
Community Services
Community & Recreation Facilities 88,632 99,588 105,869 112,277 119,609 124,984
Community Standards 23,100 24,886 25,081 26,825 27,394 28,041
Community Strategies & Development 39,879 40,654 42,435 45,365 45,708 46,124
Facility & Landscape Infrastructure 53,576 61,091 66,304 72,945 76,491 81,317
Fire Rescue Services 173,021 188,598 198,251 207,561 214,493 221,440
Neighbourhoods 55,298 59,914 65,711 70,994 75,316 79,958
Corporate Services
Corporate Procurement & Supply Services 9,283 10,132 11,920 12,366 12,774 13,255
Customer Information Services 13,690 14,184 14,323 14,851 15,284 15,770
Fleet Services - - 11,511 11,823 12,039 12,238
Human Resources 10,278 11,889 15,074 15,886 16,441 16,631
Information Technology 41,656 39,051 42,042 43,934 45,836 47,774
Law 8,958 9,550 10,580 10,931 11,167 11,458
Office of the City Clerk 12,460 10,586 10,943 11,633 13,653 12,013
Financial Services & Utilities
Assessment & Taxation 19,666 20,000 22,016 21,787 22,466 23,106
Corporate Strategic Planning 3,633 4,072 4,637 5,252 5,613 5,557
Financial Services 6,628 6,480 9,589 8,535 8,673 8,957
Financial Strategies & Budget 9,100 8,984 10,160 10,661 10,960 11,261
Mayor & Councillor Offices 4,537 4,892 6,089 6,089 6,089 6,089
Office of the City Auditor 2,059 2,272 2,274 2,542 2,623 2,629
Office of the City Manager
City Manager 1,060 1,080 1,177 1,622 1,240 1,265
Corporate Communications 7,782 8,217 8,403 9,902 11,117 11,344
Intergovernmental & External Affairs 2,344 4,765 2,878 4,110 4,625 5,193
Sustainable Development
Community Revitalization Levy - The Quarters 4,673 5,342 4,268 5,044 6,241 6,958
Current Planning 56,518 65,624 75,766 75,735 68,250 78,702
Real Estate, Housing & Economic Sustainability 44,576 48,593 50,246 66,262 65,799 54,884
Urban Planning & Environment 18,269 32,038 26,508 29,077 33,453 34,206
Transportation Services
Edmonton Transit 311,356 317,179 344,089 352,795 364,518 380,059
LRT Design & Construction 2,500 2,430 1,867 820 831 842
Roads Design & Construction 1,403 1,335 1,463 1,572 1,624 1,679
Transportation Operations 194,400 202,976 175,687 186,175 192,926 198,228
Transportation Planning 14,740 13,771 14,473 15,410 15,778 16,338
Total Civic Departments 1,235,075 1,320,173 1,381,634 1,460,781 1,509,031 1,558,300
Corporate Expenditures
Automated Enforcement - - 47,800 55,100 55,100 55,100
Capital Project Financing 212,638 269,045 280,914 302,754 296,337 308,463
Corporate Expenditures 35,466 30,286 31,629 39,718 44,511 53,838
Corporate Revenues - - - 1,125 - -
Taxation Expenditures 10,831 7,590 8,155 18,000 18,400 18,650
Total Corporate Expenditures 258,935 306,921 368,498 416,697 414,348 436,051
Neighbourhood Renewal
Total Neighbourhood Renewal 70,655 87,767 106,654 106,654 106,654 128,544
Less: Microsurfacing - Transportation Operations 1,541 1,541 1,541 1,774 1,774 1,774
Transfer to Capital - Corporate Programs 69,114 86,226 105,113 104,880 104,880 126,770
Valley Line LRT - - - 10,700 22,200 34,500
One-time Items (Including 41 Ave./QE Interchange) 12,954 17,466 72,029 - - -
Total Net Expenditure before Surplus 2,034,201 2,211,120 2,432,416 2,520,271 2,590,270 2,709,703
2013 & 2014 Surpluses 9,169 9,861 - - - -
Total Net Expenditure & Transfers 2,043,370 2,220,981 2,432,416 2,520,271 2,590,270 2,709,703 - 93 -
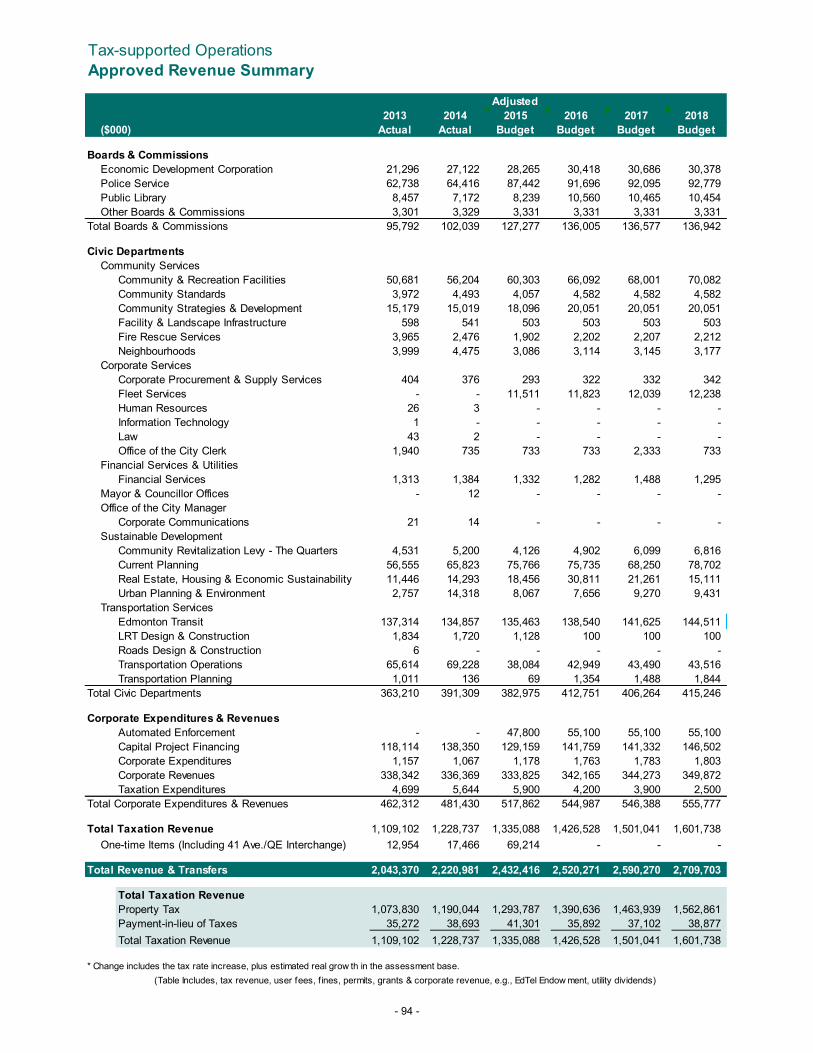
Tax-supported Operations
Approved Revenue Summary
Adjusted
2013 2014 2015 2016 2017 2018
($000) Actual Actual Budget Budget Budget Budget
Boards & Commissions
Economic Development Corporation 21,296 27,122 28,265 30,418 30,686 30,378
Police Service 62,738 64,416 87,442 91,696 92,095 92,779
Public Library 8,457 7,172 8,239 10,560 10,465 10,454
Other Boards & Commissions 3,301 3,329 3,331 3,331 3,331 3,331
Total Boards & Commissions 95,792 102,039 127,277 136,005 136,577 136,942
Civic Departments
Community Services
Community & Recreation Facilities 50,681 56,204 60,303 66,092 68,001 70,082
Community Standards 3,972 4,493 4,057 4,582 4,582 4,582
Community Strategies & Development 15,179 15,019 18,096 20,051 20,051 20,051
Facility & Landscape Infrastructure 598 541 503 503 503 503
Fire Rescue Services 3,965 2,476 1,902 2,202 2,207 2,212
Neighbourhoods 3,999 4,475 3,086 3,114 3,145 3,177
Corporate Services
Corporate Procurement & Supply Services 404 376 293 322 332 342
Fleet Services - - 11,511 11,823 12,039 12,238
Human Resources 26 3 - - - -
Information Technology 1 - - - - -
Law 43 2 - - - -
Office of the City Clerk 1,940 735 733 733 2,333 733
Financial Services & Utilities
Financial Services 1,313 1,384 1,332 1,282 1,488 1,295
Mayor & Councillor Offices - 12 - - - -
Office of the City Manager
Corporate Communications 21 14 - - - -
Sustainable Development
Community Revitalization Levy - The Quarters 4,531 5,200 4,126 4,902 6,099 6,816
Current Planning 56,555 65,823 75,766 75,735 68,250 78,702
Real Estate, Housing & Economic Sustainability 11,446 14,293 18,456 30,811 21,261 15,111
Urban Planning & Environment 2,757 14,318 8,067 7,656 9,270 9,431
Transportation Services
Edmonton Transit 137,314 134,857 135,463 138,540 141,625 144,511
LRT Design & Construction 1,834 1,720 1,128 100 100 100
Roads Design & Construction 6 - - - - -
Transportation Operations 65,614 69,228 38,084 42,949 43,490 43,516
Transportation Planning 1,011 136 69 1,354 1,488 1,844
Total Civic Departments 363,210 391,309 382,975 412,751 406,264 415,246
Corporate Expenditures & Revenues
Automated Enforcement - - 47,800 55,100 55,100 55,100
Capital Project Financing 118,114 138,350 129,159 141,759 141,332 146,502
Corporate Expenditures 1,157 1,067 1,178 1,763 1,783 1,803
Corporate Revenues 338,342 336,369 333,825 342,165 344,273 349,872
Taxation Expenditures 4,699 5,644 5,900 4,200 3,900 2,500
Total Corporate Expenditures & Revenues 462,312 481,430 517,862 544,987 546,388 555,777
Total Taxation Revenue 1,109,102 1,228,737 1,335,088 1,426,528 1,501,041 1,601,738
One-time Items (Including 41 Ave./QE Interchange) 12,954 17,466 69,214 - - -
Total Revenue & Transfers 2,043,370 2,220,981 2,432,416 2,520,271 2,590,270 2,709,703
Total Taxation Revenue
Property Tax 1,073,830 1,190,044 1,293,787 1,390,636 1,463,939 1,562,861
Payment-in-lieu of Taxes 35,272 38,693 41,301 35,892 37,102 38,877
Total Taxation Revenue 1,109,102 1,228,737 1,335,088 1,426,528 1,501,041 1,601,738
* Change includes the tax rate increase, plus estimated real grow th in the assessment base.
(Table Includes, tax revenue, user fees, f ines, permits, grants & corporate revenue, e.g., EdTel Endow ment, utility dividends)
- 94 -
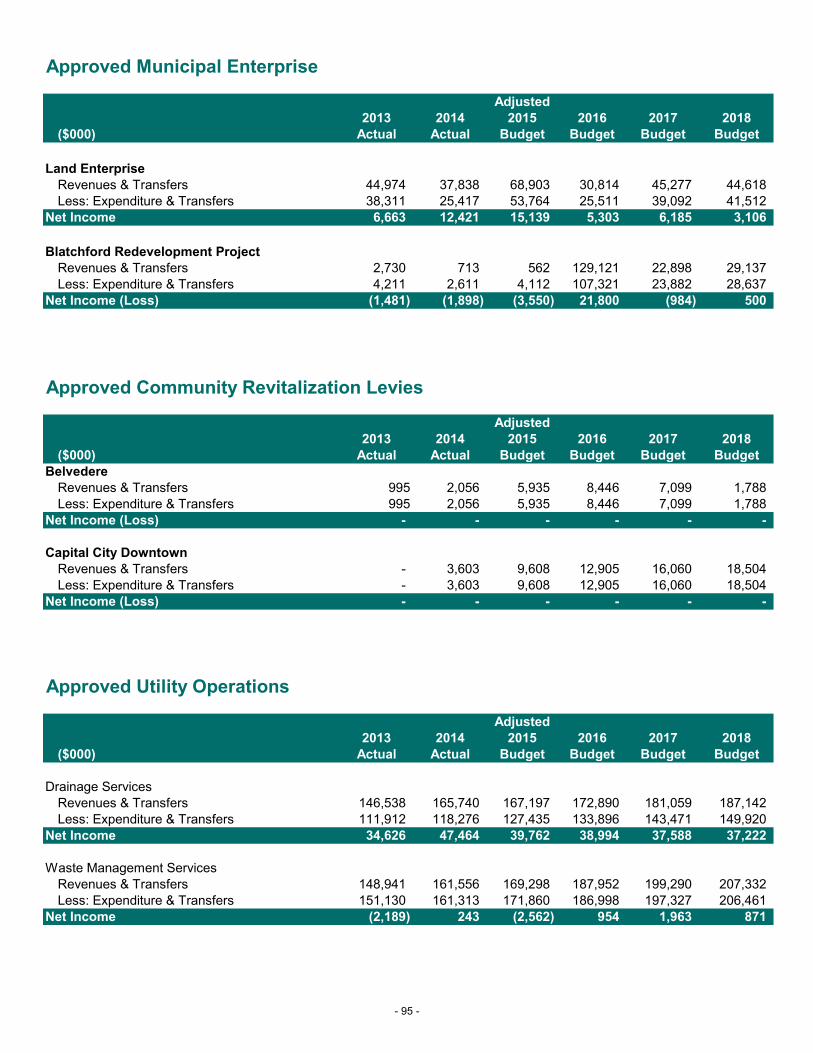
Approved Municipal Enterprise
Adjusted
2013 2014 2015 2016 2017 2018
($000) Actual Actual Budget Budget Budget Budget
Land Enterprise
Revenues & Transfers 44,974 37,838 68,903 30,814 45,277 44,618
Less: Expenditure & Transfers 38,311 25,417 53,764 25,511 39,092 41,512
Net Income 6,663 12,421 15,139 5,303 6,185 3,106
Blatchford Redevelopment Project
Revenues & Transfers 2,730 713 562 129,121 22,898 29,137
Less: Expenditure & Transfers 4,211 2,611 4,112 107,321 23,882 28,637
Net Income (Loss) (1,481) (1,898) (3,550) 21,800 (984) 500
Approved Community Revitalization Levies
Adjusted
2013 2014 2015 2016 2017 2018
($000) Actual Actual Budget Budget Budget Budget
Belvedere
Revenues & Transfers 995 2,056 5,935 8,446 7,099 1,788
Less: Expenditure & Transfers 995 2,056 5,935 8,446 7,099 1,788
Net Income (Loss) - - - - - -
Capital City Downtown
Revenues & Transfers - 3,603 9,608 12,905 16,060 18,504
Less: Expenditure & Transfers - 3,603 9,608 12,905 16,060 18,504
Net Income (Loss) - - - - - -
Approved Utility Operations
Adjusted
2013 2014 2015 2016 2017 2018
($000) Actual Actual Budget Budget Budget Budget
Drainage Services
Revenues & Transfers 146,538 165,740 167,197 172,890 181,059 187,142
Less: Expenditure & Transfers 111,912 118,276 127,435 133,896 143,471 149,920
Net Income 34,626 47,464 39,762 38,994 37,588 37,222
Waste Management Services
Revenues & Transfers 148,941 161,556 169,298 187,952 199,290 207,332
Less: Expenditure & Transfers 151,130 161,313 171,860 186,998 197,327 206,461
Net Income (2,189) 243 (2,562) 954 1,963 871
- 95 -

Full-time Equivalents
Adjusted
2013 2014 2015 2016 2017 2018
Actual Actual Budget Budget Budget Budget
Boards & Commissions
Economic Development Corporation 262.0 295.0 299.0 314.0 326.0 326.0
Police Service 2,294.5 2,321.0 2,426.6 2,522.1 2,552.1 2,578.1
Public Library 455.1 480.2 510.5 516.6 517.4 520.7
Other Boards & Commissions 56.0 57.0 57.0 57.0 57.0 57.0
Total Boards & Commissions 3,067.6 3,153.2 3,293.1 3,409.7 3,452.5 3,481.8
Civic Departments
Community Services
Community & Recreation Facilities 685.0 800.7 910.8 948.2 969.3 983.9
Community Standards 141.8 149.6 156.3 166.3 167.3 167.3
Community Strategies & Development 100.2 103.7 100.9 104.9 104.9 104.9
Facility & Landscape Infrastructure 546.8 559.3 592.8 615.1 630.2 653.8
Fire Rescue Services 1,180.0 1,186.5 1,213.3 1,240.3 1,263.5 1,290.4
Neighbourhoods 590.6 617.5 645.2 668.7 683.6 696.3
Corporate Services
Corporate Procurement & Supply Services 149.0 149.0 154.0 159.0 159.0 159.0
Customer Information Services 192.1 192.1 192.1 192.1 192.1 192.1
Fleet Services 734.0 742.0 754.0 757.0 760.0 762.0
Human Resources 161.5 161.5 162.5 165.5 166.5 166.5
Information Technology 358.9 378.9 391.4 393.0 393.0 393.0
Law 87.0 87.0 98.0 98.0 98.0 97.0
Office of the City Clerk 89.1 70.1 68.1 68.1 68.1 68.1
Financial Services & Utilities
Assessment & Taxation 189.2 189.2 189.2 189.2 189.2 189.2
Corporate Strategic Planning 30.0 31.0 31.0 31.0 31.0 31.0
Financial Services 161.8 153.8 153.8 153.8 153.8 153.8
Financial Strategies & Budget 84.5 83.5 83.5 83.5 83.5 83.5
Mayor and Councillor Offices 45.0 49.0 50.0 50.0 50.0 50.0
Office of the City Auditor 14.0 14.0 14.0 16.0 16.0 16.0
Office of the City Manager
City Manager 5.0 5.0 6.0 6.0 6.0 6.0
Corporate Communications 73.4 84.8 85.1 86.1 86.1 86.1
Intergovernmental & External Affairs 8.0 8.0 9.0 9.0 9.0 9.0
Sustainable Development
Community Revitalization Levy - The Quarters 5.0 5.0 4.0 4.0 4.0 4.0
Current Planning 317.5 342.5 381.0 392.0 405.5 421.5
Real Estate, Housing & Economic Sustainability 125.0 117.0 128.0 139.0 140.0 140.0
Urban Planning & Environment 115.0 118.0 127.0 133.0 135.0 132.0
Transportation Services
Edmonton Transit 2,289.5 2,323.0 2,395.3 2,401.3 2,409.8 2,416.8
LRT Design & Construction 16.0 16.0 17.0 17.0 17.0 17.0
Roads Design & Construction 109.0 109.0 109.0 109.0 109.0 109.0
Transportation Operations 869.3 869.3 879.3 894.8 903.8 910.8
Transportation Planning 114.6 118.6 123.6 137.6 138.6 139.6
Total Civic Departments 9,587.8 9,834.6 10,225.2 10,428.5 10,542.8 10,649.6
Total Tax-supported Operations 12,655.4 12,987.8 13,518.3 13,838.2 13,995.3 14,131.4
Municipal Enterprises & Community Revitalization Levy
Blatchford Redevelopment Project 8.0 8.0 8.0 8.0 8.0 8.0
Land Enterprise 15.0 15.0 7.0 7.0 7.0 7.0
Capital City Downtown Community Revitalization Levy - - 3.0 3.0 3.0 3.0
Total Municipal Enterprise 23.0 23.0 18.0 18.0 18.0 18.0
Utility Operations
Drainage Services 684.9 690.9 725.9 760.9 769.9 777.9
Waste Management Services 465.8 476.7 525.9 548.6 563.3 566.5
Total Utility Operations 1,150.7 1,167.6 1,251.8 1,309.5 1,333.2 1,344.4
Total Full-time Equivalents 13,829.1 14,178.4 14,788.1 15,165.7 15,346.5 15,493.8
- 96 -
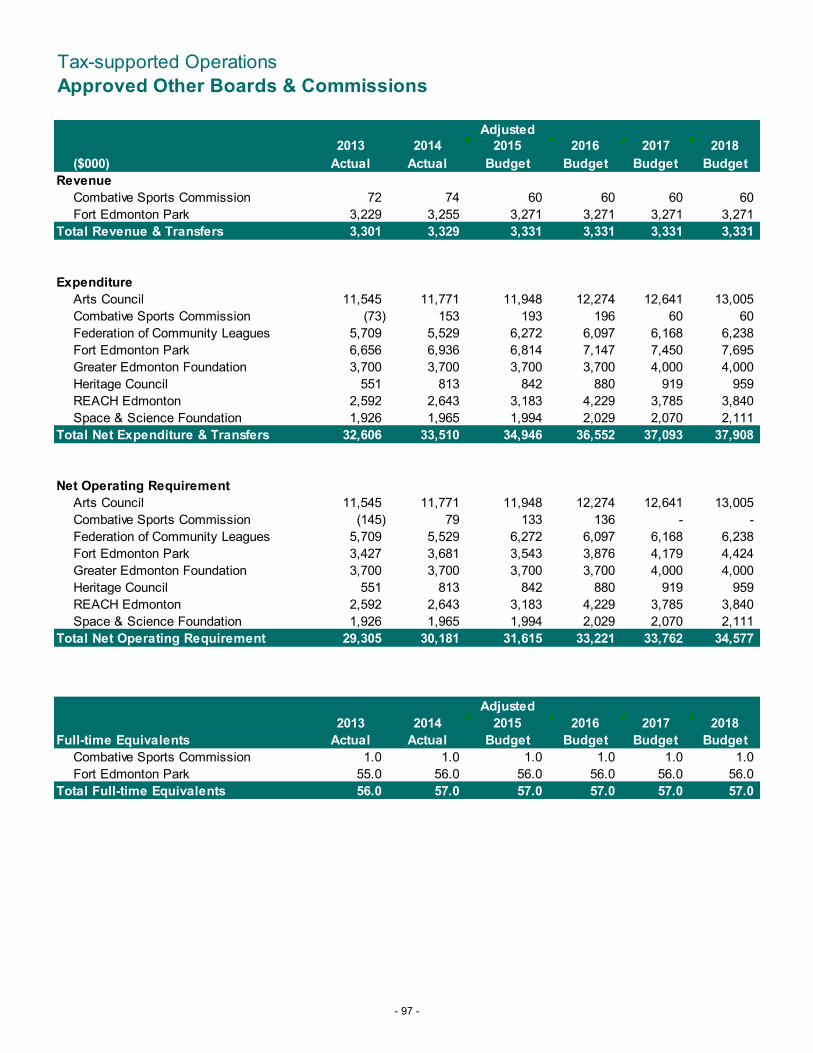
Tax-supported Operations
Approved Other Boards & Commissions
Adjusted
2013 2014 2015 2016 2017 2018
($000) Actual Actual Budget Budget Budget Budget
Revenue
Combative Sports Commission 72 74 60 60 60 60
Fort Edmonton Park 3,229 3,255 3,271 3,271 3,271 3,271
Total Revenue & Transfers 3,301 3,329 3,331 3,331 3,331 3,331
Expenditure
Arts Council 11,545 11,771 11,948 12,274 12,641 13,005
Combative Sports Commission (73) 153 193 196 60 60
Federation of Community Leagues 5,709 5,529 6,272 6,097 6,168 6,238
Fort Edmonton Park 6,656 6,936 6,814 7,147 7,450 7,695
Greater Edmonton Foundation 3,700 3,700 3,700 3,700 4,000 4,000
Heritage Council 551 813 842 880 919 959
REACH Edmonton 2,592 2,643 3,183 4,229 3,785 3,840
Space & Science Foundation 1,926 1,965 1,994 2,029 2,070 2,111
Total Net Expenditure & Transfers 32,606 33,510 34,946 36,552 37,093 37,908
Net Operating Requirement
Arts Council 11,545 11,771 11,948 12,274 12,641 13,005
Combative Sports Commission (145) 79 133 136 - -
Federation of Community Leagues 5,709 5,529 6,272 6,097 6,168 6,238
Fort Edmonton Park 3,427 3,681 3,543 3,876 4,179 4,424
Greater Edmonton Foundation 3,700 3,700 3,700 3,700 4,000 4,000
Heritage Council 551 813 842 880 919 959
REACH Edmonton 2,592 2,643 3,183 4,229 3,785 3,840
Space & Science Foundation 1,926 1,965 1,994 2,029 2,070 2,111
Total Net Operating Requirement 29,305 30,181 31,615 33,221 33,762 34,577
Adjusted
2013 2014 2015 2016 2017 2018
Full-time Equivalents Actual Actual Budget Budget Budget Budget
Combative Sports Commission 1.0 1.0 1.0 1.0 1.0 1.0
Fort Edmonton Park 55.0 56.0 56.0 56.0 56.0 56.0
Total Full-time Equivalents 56.0 57.0 57.0 57.0 57.0 57.0
- 97 -

Amortization and Contributed Assets
Adjusted Adjusted
2013 2014 2015 2016 2017 2018 2015 2016 2017 2018
($000) Actual Actual Budget Budget Budget Budget Budget Budget Budget Budget
Boards & Commissions
Police Service 11,430 13,281 13,552 16,060 16,885 20,528 - - - -
Public Library 9,337 9,369 9,884 9,901 10,101 10,264 - - - -
Civic Departments
Community Services
Community & Recreation Facilities 3,160 3,847 4,241 6,674 6,824 6,948 - - - -
Facility & Landscape Infrastructure 38,924 56,492 40,344 55,213 56,954 59,337 - - - -
Fire Rescue Services 903 1,000 1,005 1,404 1,674 2,093 - - - -
Neighbourhoods - Other 13,904 16,020 17,912 19,242 15,593 20,258 5,500 5,500 5,500 5,500
Neighbourhoods - Land - 22,000 22,000 22,000
Corporate Services
Corporate Procurement & Supply
Services - - 4 4 4 4 - - - -
Fleet Services 18,593 19,061 17,973 17,536 18,326 18,233 - - - -
Human Resources 34 34 34 34 34 34 - - - -
Information Technology 19,434 18,301 16,375 17,325 17,850 18,386 - - - -
Law 62 62 62 62 62 62 - - - -
Office of the City Clerk 132 153 135 170 170 170 - - - -
Financial Services & Utilities
Assessment & Taxation 85 21 85 85 85 85 - - - -
Financial Services 189 189 189 189 189 189 - - - -
Mayor and Councillor Offices 6 6 6 6 6 6 - - - -
Office of the City Auditor 8 8 8 8 8 8 - - - -
Office of the City Manager
City Manager 10 10 10 10 10 10 - - - -
Sustainable Development
Current Planning 220 529 370 1,039 1,239 1,439 - - - -
Real Estate, Housing & Economic
Sustainability 669 669 669 669 669 669 - - - -
Urban Planning and Environment 124 124 124 904 2,356 3,119 - - - -
Transportation Services
Edmonton Transit 38,491 39,881 61,257 61,257 61,257 61,257 - - - -
Transportation Operations 160,303 169,488 164,164 172,278 182,738 193,837 72,000 72,500 73,000 73,500
Total 316,018 348,545 348,403 380,070 393,034 416,936 77,500 100,000 100,500 101,000
Notes:
The non-cash budget for amortization and contributed assets is summarized in the table above.
The amortization and contributed assets budget is a non-cash budget This budget is necessary to comply with legislative requirements and does
not impact tax levy requirements.
Contributed assets are donated assets from external third parties. The larger contributed assets are in Drainage, Roadways and Parks.
These assets typically result from construction of new sites where developers have completed the base infrastructure, such as sewage trunk and
roadways, and the assets are then turned over to the City. As for Parks, the developer is obligated to dedicate 10% of certain sites as parkland.
The City recognizes the contributed asset as a tangible capital asset and also recognizes a contributed asset revenue amount.
The asset and revenue amounts are reported in the City's consolidated annual financial statements, in the Statement of Financial Position and
Statement of Operations, respectively.
Contributed AssetsAmortization
- 98 -


