57
| Date post: | 13-Apr-2017 |
| Category: |
Documents |
| Upload: | magued-m-fawzy-cfc |
| View: | 171 times |
| Download: | 0 times |


Table of Content
Index / Links
Report Brief.
Performa P/L
Sales Analysis.
Prime Cost.
MPP & Wages.
Operating Exp.
Profitability Analysis
Cash Flow
Capital Expenditure.
Main Assumptions Used
Budgeting & Reporting Team 2

Report Brief
Budgeting & Reporting Team 3

Report Brief
Budgeting & Reporting Team 4
Sales volume expected to increase by 15% than year 2009 outlook,
revenues expected to increase 27% due to implementing new price
scheme which contribute additional revenues equal 37.6 M LE.
Material cost expected to increase by 24% than year 2009 OL, 9% due to
expected price increase and 15% related to volume increase.
Material margin equal to 61% of total sales vs. 63% average previous
years, although unit cost still greater than year outlook by 8%, specially
primary and secondary backing materials.

Budgeting & Reporting Team 5
Company operating expenses expected to increase by 6% representing 34%
of total sales vs. 44% for 2009 OL.
Total projected wages 2010 according to HR scenario equal to L.E. 117
millions vs. current position equal L.E.107 millions, increase by 10%.
Total new hire through 2010 equal 348 headcount (HDCT) cost equal to
L.E. 10 millions.
Net income after tax expected to increase by 110% than 2009 OL
representing also 9% of total revenues vs. 6% for 2009 OL.
Kindly refer to the main assumption used to build up budget figures.
Report Brief

Budgeting & Reporting Team 6
Main Items K L.E. 2007 2008 2009 OL Budget 2010Bench Mark
(120 MLE)
Total SQM 43,989 46,233 48,490 55,680
Total Export Revenue 674,091 714,910 727,751 917,522 1,050,000
Total Local Revenue 155,113 173,898 151,873 213,207 212,127
Scrap Sales 5,063 15,339 15,880 8,000 8,000
TOTAL Sales
Industrial Cost 761,876 830,132 849,326 991,309 1,125,773
Gross Profit 72,392 74,015 46,178 147,419 144,355
Gross Margin
Total Materials 553,828 550,960 561,833 698,470 803,422
Total Industrial Exp. 99,763 146,744 159,116 173,635 193,264
Total Selling Expenses 108,285 132,428 128,376 119,204 129,087
Total G & A Exp. 11,567 16,529 16,410 24,605 18,872
Financing cost 19,617 26,534 37,979 40,039 43,675
TOTAL COST
Net operating Income
% Net operating Income
Others 49,021 62,027 64,796 41,884 62,250
Net Income Before Tax 89,579 92,435 56,568 124,659 144,058
Net Income After Tax
Performa P/L

Budget 2010 Scenarios
Budgeting & Reporting Team 7
Row Labels Net Income Inflation Rate Refund
Current Scenario 103,841 15% 5%
Scenario 1 105,148 12% 5%
Scenario 2 106,019 10% 5%
Scenario 3 106,890 8% 5%
Scenario 4 111,484 15% 6%
Scenario 5 112,791 12% 6%
Scenario 6 113,662 10% 6%
Scenario 7 114,533 8% 6%
Scenario 8 119,127 15% 7%
Scenario 9 120,434 12% 7%
Scenario 10 121,305 10% 7%
Scenario 11 122,176 8% 7%
Scenario 12 126,770 15% 8%
Scenario 13 128,077 12% 8%
Scenario 14 128,948 10% 8%
Scenario 15 129,819 8% 8%

Currency fluctuation Impact
Budgeting & Reporting Team 8
Scenario Summary Current X1 X2 X3
Changing Cells:
L.E. / € 8.14 8.00 7.90 7.80
Euro Sales € 54,132 € 54,132 € 54,132 € 54,132
Revenues 440,634 433,056 427,643 422,229
Result Cells:
Net Income 103,841 97,213 92,479 87,743
Sales Analysis
Budgeting & Reporting Team 9

Sales Volume K Regions 2006 2007 2008 2009 OL * B 2010B 10/
OL 09
Export
Americas 12,075 13,981 13,878 12,021 -16%
Europe 13,374 13,645 13,340 16,533 21,124 25%
Fareast 3,413 2,748 2,673 2,112 1,494 -8%
Arab & Africa 5,005 6,023 6,031 6,374 2,894 -48%
Export Stocks 5,674
Total Export Vol. 21,792 34,491 36,024 38,898 43,187 13%
Local
Retail 4,640 4,597 5,245 4,675 2,490 -47%
Wholesale 3,989 4,721 4,764 4,823 3,119 -35%
Projects 179 180 200 95 150 58%
Local stocks 4,400
Total Local Vol. 8,808 9,498 10,209 9,592 10,159 24%
Total SQM 30,600 43,989 46,233 48,490 53,347 15%
Volume Comparison
10Budgeting & Reporting Team*2009 Year outlook based on sales seasonality

Sales Comparison 2006-2010
Sales Forecast 2010K L.E.
Regions 2006 2007 2008 2009 OL * Budget 2010B 10/
OL 09
Export
Americas 238,571 224,528 255,764 259,221 235,924 -2%
Europe 309,801 321,632 320,624 348,911 499,006 32%
Fareast 53,792 46,669 43,944 33,465 45,106 76%
Arab & Africa 69,932 81,262 94,578 86,153 62,573 37%
Export Stocks 74,913
Total Export Revenue 672,096 674,091 714,910 727,751 925,709 21%
Local
Egypt-Retail 68,787 70,142 88,195 72,097 67,991 -6%
Egypt-Wholesale 61,904 76,319 77,281 75,925 45,689 -40%
Projects 6,546 8,652 8,422 3,851 9,600 149%
Local stocks 89,926
Total Local 137,237 155,113 173,898 151,873 213,207 40%
Scrap Sales 6,772 5,063 15,339 15,880 8,000 8,000 -50%
Total Revenues 816,105 834,267 904,147 895,504 1,138,728 1,271,547 27%
11Budgeting & Reporting Team * 2009 Year outlook based on sales seasonality

Production & Stock Sales
Budgeting & Reporting Team 12
Region QualitiesTotal Revenues
K. L.E.Total SQM P/SQM
Americas
Production 235,924 11,627 20.29
Stock 17,035 1,400 12.17
Europe
Production 499,006 20,682 24.13
Stock 12,181 1,180 10.32
Fareast
Production 45,106 1,936 23.3
Stock 3,627 343 10.57
Arab & Africa
Production 62,573 3,293 19.00
Stock 42,070 3,360 12.52
Local
Production 123,280 5,759 21.41
Stock 89,926 6,100 14.74
Grand Total 1,130,728 55,680 20.31

13Budgeting & Reporting Team
Avg. price per SQM
L.E. / SQM
Americas 19.88 18.59 18.29 18.99 20.29
Eroupe 23.16 23.57 24.04 21.47 24.13
Fareast 15.76 16.98 16.44 14.76 23.30
Arab & Africa 13.97 13.49 15.68 13.59 19.00
Export Stocks 0.00 0.00 0.00 0.00 11.92
Avg. Export 19.89 19.54 19.85 18.71 20.94
Retail 14.82 15.26 16.82 15.42 27.31
Wholesale 15.52 16.17 16.22 15.74 14.65
Projects 36.57 48.07 42.11 40.68 64.00
Local stocks 0.00 0.00 0.00 0.00 14.75
Avg. Local 15.58 16.33 17.03 15.83 17.98
Avg. Total 19.00 18.85 19.22 18.14 20.31

14Budgeting & Reporting Team
Exp/Loc. Region Total SQM New Revenues Old
Revenues
Price
Contribution
Export
Americas 13,027 252,959 245,321 7,638
Europe 21,862 511,187 487,383 23,803
Fareast 2,279 48,734 48,231 502
Arab & Africa 6,653 104,643 94,470 10,173
Local
Outlets 8,412 152,050 154,404 (2,355)
Wholesale 2,955 41,541 44,470 (2,929)
Projects 150 9,600 9,098 501
Private Sector 178 5,868 5,691 177
Public Sector 164 4,148 4,102 46
Grand Total 55,680 1,130,728 1,093,171 37,557
New price contribution

Region Net Sales K L.E. Total SQM 2010 Avg. P/SQM L.E.
Americas 235,924 11,627 20
Europe 499,006 20,682 24
Fareast 45,106 1,936 23
Arab & Africa 62,573 3,293 19
Export Stock 74,913 6,283 12
Local 213,206 11,859 18
Grand Total 1,130,728 55,680 20
15Budgeting & Reporting Team

16Budgeting & Reporting Team
Export Revenues

Export Vol. Comparison
17Budgeting & Reporting Team

Local Sales Comparison
18Budgeting & Reporting Team

Local Vol. Comparison
19Budgeting & Reporting Team
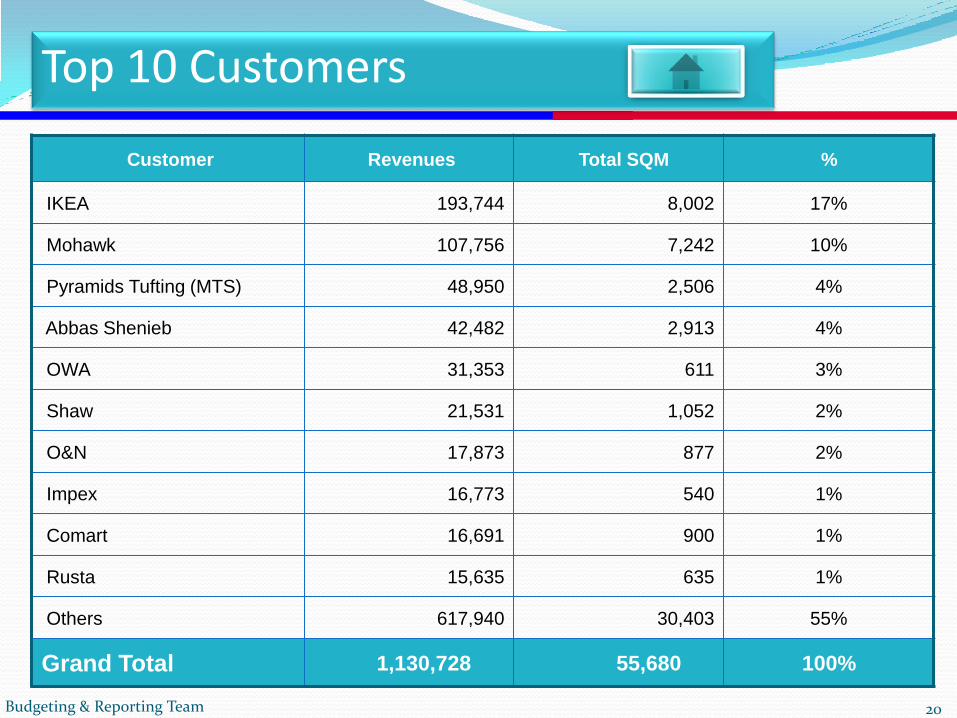
Top 10 Customers
Budgeting & Reporting Team 20
Customer Revenues Total SQM %
IKEA 193,744 8,002 17%
Mohawk 107,756 7,242 10%
Pyramids Tufting (MTS) 48,950 2,506 4%
Abbas Shenieb 42,482 2,913 4%
OWA 31,353 611 3%
Shaw 21,531 1,052 2%
O&N 17,873 877 2%
Impex 16,773 540 1%
Comart 16,691 900 1%
Rusta 15,635 635 1%
Others 617,940 30,403 55%
Grand Total 1,130,728 55,680 100%

Budgeting & Reporting Team 21
Printed/
Tufted
Total
Revenues
Total
SQM %
Printed 677,126 30,349 60%
Tufted 381,541 19,414 34%
Any 72,061 5,918 6%
Grand
Total 1,130,728 55,680 100%
Printed/Tufted

Local Sales
28Budgeting & Reporting Team
Customer
Total
Revenues
K. L.E.
Total
SQM P / SQM
Outlets
Production 62,123 2,312 26.87
Stock 89,926 6,100 14.74
Wholesale (Production) 41,541 2,955 14.06
Projects (Production) 9,600 150 64.00
Private Sector (Production)
5,868 178 32.97
Public Sector (Production)
4,148 164 25.29
Grand Total 213,206 11,859 17.98

Prime Cost (material)
Budgeting & Reporting Team 29

Material Costs
Budgeting & Reporting Team 30
Details ∆ % Vol. Var. Price Var. Total Var.
SQM (Production)
TOTAL Sales
Yarns
Latex & foam
Primary backing
Dyes and
Chemicals
Secondary
backing
Total Materials
Cost / SQM

Material Cost per SQM
Budgeting & Reporting Team 31
Details
SQM
Yarns
Latex & foam
Primary backing
Dyes and Chemicals
Secondary backing
Total Materials

Material Costs
Budgeting & Reporting Team 32

Projected Wages MPP
Budgeting & Reporting Team 33

MPP 2010
Budgeting & Reporting Team 34
816,104102,163
RevenuesProfit
834,26774,638
904,14680,489
895,504 49,351
1,138,72833,831

MPP 2010
Budgeting & Reporting Team 35
MPP 2010 ∆
Operation
Commercial
Supporting
Grand Total

Budgeting & Reporting Team 36
Total Wages by function
Function Actual New Hire Projected
K L.E. HDCT K L.E. HDCT K L.E. HDCT
OPERATION 82,149 5,760 5,146 291 87,295 6,051
Supporting & Controling 13,220 290 3,883 65 17,102 355
Commercial 11,261 314 1,267 28 12,527 342
Grand Total 106,628 6,364 10,295 384 116,924 6,748

Overview – Total Company
Budgeting & Reporting Team 37
Total wages by function KL.E. New HDCT by function

Summary of Wages
38
In t
erm
s o
f K
L.E
.
Function ITEM Direct K L.E. Indirect K L.E. Grand Total K L.E.
OPERATION
Actual 52,330 29,819 82,149
New Hire 1,861 3,285 5,146
Projected 54,190 33,104 87,295
Supporting & Controlling
Actual 13,220 13,220
New Hire 3,883 3,883
Projected 17,102 17,102
Commercial
Actual 11,260 11,260
New Hire 1,267 1,267
Projected 12,527 12,527
Grand Total
Actual 52,330 54,299 106,628
New Hire 1,861 8,435 10,295
Projected 54,190 62,733 116,924
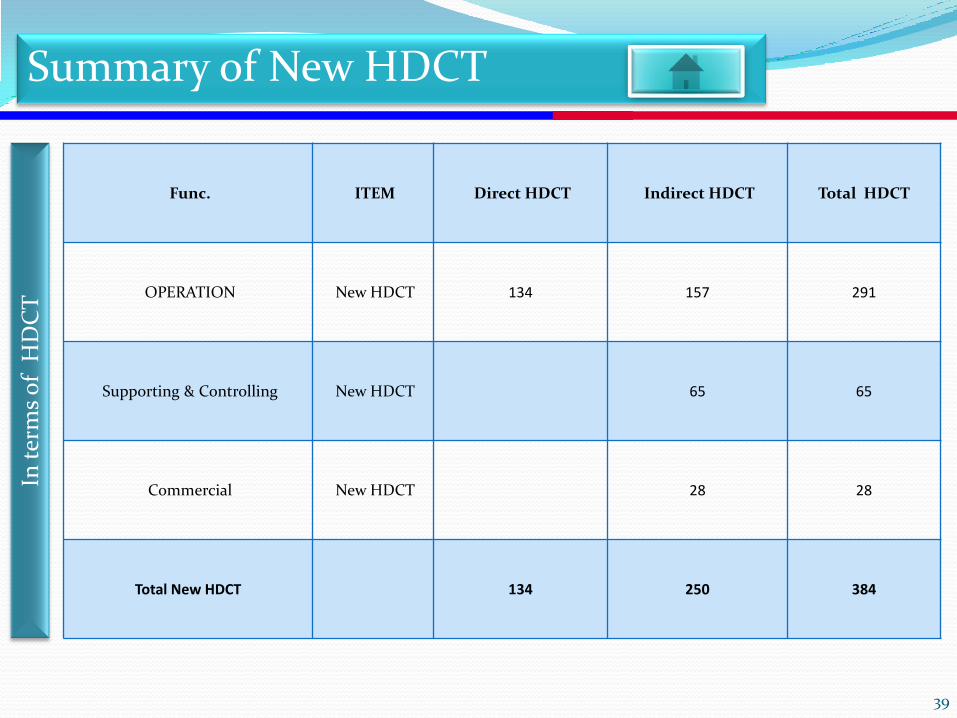
Summary of New HDCT
39
Func. ITEM Direct HDCT Indirect HDCT Total HDCT
OPERATION New HDCT 134 157 291
Supporting & Controlling New HDCT 65 65
Commercial New HDCT 28 28
Total New HDCT 134 250 384
In t
erm
s o
f H
DC
T
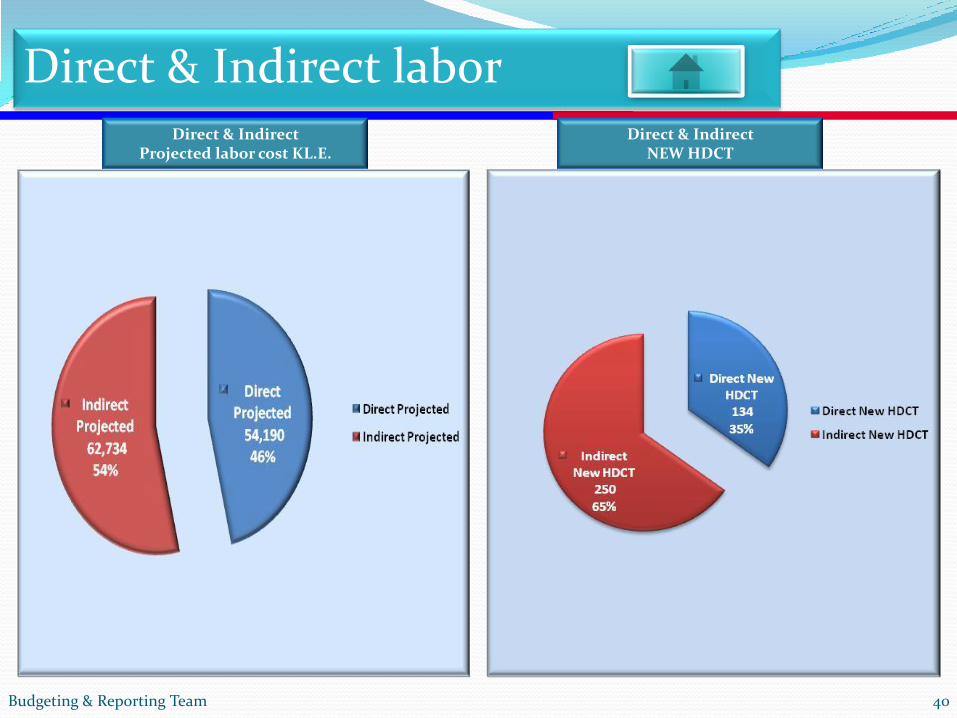
Direct & Indirect labor
Budgeting & Reporting Team 40
Direct & Indirect Projected labor cost KL.E.
Direct & Indirect NEW HDCT

New Indirect Labor by section
Budgeting & Reporting Team 41
Indirect labor New Hire by section

Operational Sections - Wages
Budgeting & Reporting Team 42
Operation sections-New Hire Cost

Operation Direct & Indirect labor
Budgeting & Reporting Team 43
Direct & Indirect operationlabor cost KL.E
operationNEW HDCT

Supporting & Controlling
Budgeting & Reporting Team 44
Sec. Actual New Hire New HDCT Projected
Top Management 1,452 - - 1,452
Human Resources 4,207 2,089 43 6,296
MDC 354 46 4 400
Finance 3,625 1,112 7 4,738
Information Technology 1,764 168 1 1,932
Compliance 599 338 7 937
Projects 968 - - 968
HSE 249 129 3 378
13,220 3,883 65 17,102

Supp. & cont. sections – Wages
Budgeting & Reporting Team 45
Supporting Func. New Hire

Commercial Sections
Budgeting & Reporting Team 46
Commercial Func. New Hire

OPEX 2010
Budgeting & Reporting Team 47

OPEX Comparison
Budgeting & Reporting Team
OPEX 2006 2007 2008 2009 OL 2010 ∆ %
Total SQM 30,600 43,989 46,233 48,490 55,680 15%
Industrial Exp. 93,733 99,763 146,744 159,116 173,635 9%
Selling Exp. 110,861 108,285 132,428 128,376 119,204 -7%
G & A 11,511 11,567 16,529 16,410 24,605 50%
Financing cost 13,004 19,617 26,534 37,979 40,039 5%
Total Opex 259,709 283,221 368,468 390,371 357,483 6%
48

OPEX Comparison
Budgeting & Reporting Team 49

Profitability Analysis
Budgeting & Reporting Team 50

Budgeting & Reporting Team 51
Profitability Analysis
2006 2007 2008 2009 OL 2010
Revenues 816,105 834,267 904,147 895,504 1,138,728
Gross Profit 62,575 72,392 74,015 46,178 147,419
NOP 38,060 41,207 30,952 (8,211) 82,775
EBT 133,238 89,579 92,435 56,568 124,659
N.I 115,507 73,988 79,935 49,351 103,841
Margin Analysis
Gross Profit 8% 9% 8% 5% 8%
NOP 5% 5% 3% -1% 2%
EBT 16% 11% 10% 6% 6%
Net Income 14% 9% 9% 6% 5%

Budgeting & Reporting Team 52
Profitability Analysis

Budgeting & Reporting Team 53
Margin Analysis
54Budgeting & Reporting Team
Cash Inflow

Generated Sales by currency
Budgeting & Reporting Team 55
K L.E. Q.1 Q.2 Q.3 Q.4 Total
Euro 85,659 107,896 115,082 129,384 438,022
EGP 50,429 49,839 56,329 56,609 213,206
USD 98,871 127,311 134,373 118,945 479,500
Grand Total 234,959 285,047 305,784 304,938 1,130,728

Projected Cash Inflow
Budgeting & Reporting Team 56
Cash Inflow K Q.1/2010 Q.2/2010 Q.3/2010 Q.4/2010 Q.1/2011 Q.2/2011Total Cash
In by currency
Euro 5,924 12,434 13,204 15,178 5,744 1,358 53,841
USD 7,252 18,129 26,296 22,239 13,133 772 87,821
EGP 50,429 49,839 56,329 56,609 - - 213,206
Equivalent EGP 138,214 249,976 307,327 301,511 118,436 15,265 1,130,728
Currency exchange rate:
• 1.49 $ / €• 5.46 L.E./ $• 8.14 L.E./ €

Capital Expenditure
Budgeting & Reporting Team 57

Capex 2010
Budgeting & Reporting Team 58
Assets Addition
Building
Equipments
Total Operation & Engineering
Pcs & Lab Top for operation 455
Pcs & Lab Top for Commercial
Pcs & Lab Top for Supporting
Replacement Pcs & Lab Top
ERP sys., server and infra structure
Total IT Assets Additions
Total Asset Addition

Budgeting & Reporting Team 59
اإلدارة انطانبت 1ياك انتكهفت انتقذيريت 2ياك انتكهفت انتقذيريت َيىياك انتكهفت انتقذيريت يجًع انًخازٌانتكهفت
انتقذيريت
اإلجًاني
انكهي
جتاإلَ
ارة
داإ
إحالل وتجذيذ صاج
عُابر انتجهيس
وانطباعت ويجاري
انًطر
250
إستكًال عُبر انتجهيس
انجذيذ وخطىط
انحريق
1,500,000عًم تىسعاث بُيىياك
و10,000بًساحت 12,000,000
عًم رصيف شحٍ
وخط تفصيم وتعذيم
يساراث حركت انشحٍ
1,200إَشاء غرف تىزيع
كهرباء انخط انجذيذ200,000
إستكًال عُبر خط
3انتجهيس انجذيذ رقى1,000,000
إجًانً 1,450 1,700 13,000 16,150
اديذ
إل اهت
سسه
4إحالل وتجذيذ عذد
يصعذ1,000
عًم تأييٍ إطفاء
يخسٌ 2تهقائي نعذد 850
تشغيم يحطت
انكهرباء
نىحاث -يحىالث)
(كابالث-تىزيع
1,000
إعادة تخطيط يُطقت
انشحٍ ويُطقت
انشىَت وعًم
C-TPATيتطهباث
1,500
IKEAاطفاء تهقائً 850
إجًانً 3,350 850 1,000 4,200
يتشر
نب ارد
ىانً
ا
إستكًال دور أسفم
صاالث )انًعرض
كافتيريا -انتذريب
انعايهيٍ وباقي يكاتب
(انًىارد انبشريت
500
إستكًال انذور اإلداري
Phase2600
إجًانً 1,100 1,100
إجًاني األعًال 2,550,000 5,050,000 13,850,000 1,000,000 22,450
Capex 2010 Engineering

Budgeting & Reporting Team 60
3 New or Used FRS- C/L -with PCL to produce difficult quality for Ikea Like Hoven & Nassby to prevent
Transation Problems5,000,000
13 Air conditions for Control Panels Cabinets of machines on new Mac and Mac2 234,000
Upgrade current machines (machine 22 ) 216,000
Printing Unit ( one color )with steamer and dryer for testing whit tuft 300,000
Horizental streach Machine for Packing of Tufting Rolls 720,000
Cars on Creels for creeling cones 210,000
6 Sewing machines for sewing primary backing 180,000
13 Unrolling Units for adjustment primary backing rolls on machines 3,150,000
9 Acuomelators ( Dancers ) for all Tuftco machines ( Multi pile height ) 135,000
38 Electric Motors with Gear box for all Tuft Rolling machines 105,000
Upgrade Printing Machines 6,733,612
Used backing Machine 5,000,000
Upgrade Backing machines 3,467,000
Confection Upgrade 1,018,000
Maintenance Equipment 200,000
Water treatment equipment 1,430,000
Engineering Equipment 1,000,000
Supply Chain Equipment 740,000
Technical equipment 3,840,000
Total Production 33,678,612
Equipment 2010

Budgeting & Reporting Team 61
K L.E. Total 2010
Total for operation 455
Total for Commercial 75
ERP Sys. 2,697
ERP Servers (4) 437
Infra Structure 12,170
Total for Support 16,209
Total Requirements 16,739
IT requirements 2010

Main Assumptions used
Currency exchange rate : 1.49 $/€ & 5.46 L.E./$
Inflation Rate : 15%
Effective Tax rate: 16.7%
Refund rate : 5% of export sales
Water, Lighting and power cost expected to increase by 26% related to increased prices in addition to volume related costs.
All other expenses are non volume related, cost calculated based on above inflation rate from base line year OL.
Other gain or losses include 45.9 millions refund.
5 millions FOREX losses,
1 million investment gain
Budgeting & Reporting Team 62

63


