18
Budgeting and Tracking Your District’s Volatile Energy Costs 1
| Date post: | 24-Dec-2015 |
| Category: |
Documents |
| Upload: | antony-hart |
| View: | 216 times |
| Download: | 0 times |
Budgeting and Tracking Your District’s Volatile
Energy Costs
1

Breakout Session Topics• Energy Costs 101
• Natural Gas Cost Components
• Budgeting and Tracking Natural Gas Costs
• Electric Power Cost Components
• Apples to Apples
• Budgeting and Tracking Electric Power Costs
• IEC Program Contacts
2

Energy Costs 101
3

Energy Costs 101
4
Cost = Price
Cost ≠ Price
Cost = (P*Q)T → BUDGET

Natural Gas Cost Components
5

Gas 101 - Natural Gas Delivery System
Production Transportation Distribution Consumption
Interstate Pipeline = Basis
Gas Producers = NYMEX
School Facilities
Utility = LDC Distribution Costs
City
Gate
State line
Natural gasexploration& productioncompanies
Interstate gas pipelinesmoving gas to utilities
Local gasutilitiesdelivering gasto end-users
Burning gasfor heat andprocessapplications
Source: NYMEX6
+ Supplier Margin

Tracking and Budgeting Natural
Gas Costs
7
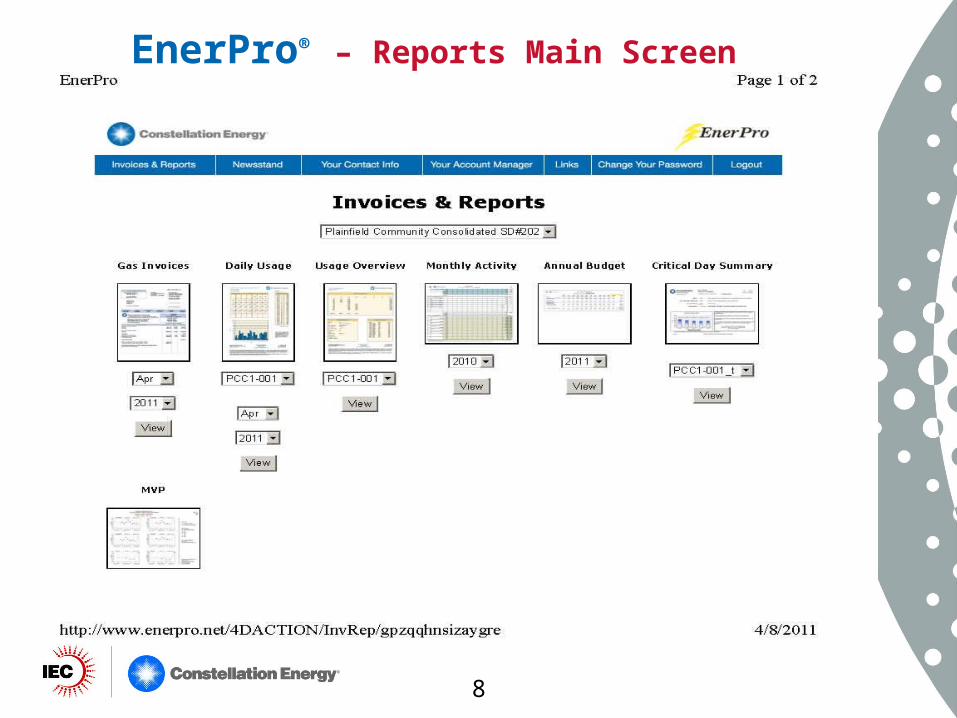
EnerPro® – Reports Main Screen
8

IEC Managed Program – Budget Forecast
9
NICOR Last Updated: 2/20/2011
Jul-11 Aug-11 Sep-11 Oct-11 Nov-11 Dec-11 Jan-12 Feb-12 Mar-12 Apr-12 May-12 Jun-12 TotalLP LP LP LP LP LP LP LP LP LP LP LP
Net Usage 2,434 2,792 4,821 15,243 25,214 39,194 43,866 35,323 28,022 13,375 6,912 3,630 220,824Estimated Estimated Estimated Estimated Estimated Estimated Estimated Estimated Estimated Estimated Estimated Estimated
Gross Delivered Therms: 2,492 2,858 4,935 15,605 25,812 40,125 44,908 36,162 28,687 13,693 7,076 3,716 226,068Net Delivered Therms (less utility loss factor) 2,437 2,796 4,827 15,264 25,250 39,250 43,929 35,374 28,062 13,394 6,922 3,635 221,140
Deliveries:IEC SPOT POOL GAS for usage 2,492 2,858 4,935 15,605 20,770 32,286 36,135 29,097 23,083 13,693 7,076 3,716 191,745Estimated NYMEX price per therm $0.4037 $0.4095 $0.4125 $0.4135 $0.4180 $0.4376 $0.4616 $0.4748 $0.4738 $0.4538 $0.4568 $0.4603 $0.4488
1,006$ 1,170$ $2,036 $6,452 $8,682 $14,128 $16,680 $13,815 $10,937 $6,214 $3,232 $1,710-$ -$ -$ -$ -$ -$ -$ -$
IEC Option A Gas Hedged as of today 0 0 0 0 5,043 7,839 8,773 7,065 5,604 0 0 0 34,324WACOG NYMEX price per therm $0.0000 $0.0000 $0.0000 $0.0000 $0.5868 $0.5868 $0.5868 $0.5868 $0.5868 $0.0000 $0.0000 $0.0000 $0.5868
Estimated Basis Volume 2,434 2,792 4,821 15,243 25,214 39,194 43,866 35,323 28,022 13,375 6,912 3,630 220,824Estimated Basis Volume Price per therm 0.0223$ 0.0223$ 0.0223$ 0.0223$ 0.0327$ 0.0327$ 0.0327$ 0.0327$ 0.0327$ 0.0197$ 0.0197$ 0.0197$ $0.0308
Commodity & Utility Consumption Charge
Commodity Charge * $1,062 $1,234 $2,146 $6,800 $11,839 $19,189 $22,554 $18,639 $14,758 $6,483 $3,372 $1,784 $109,860 Wgt Avg Cost / Therm $0.4361 $0.4421 $0.4451 $0.4462 $0.4695 $0.4896 $0.5142 $0.5277 $0.5267 $0.4847 $0.4878 $0.4914 $0.4975
EST Utility Distribution Charges 158$ 173$ 257$ 621$ 969$ 1,457$ 1,620$ 1,322$ 1,067$ 556$ 331$ 208$ $8,740$0.0651 $0.0620 $0.0532 $0.0408 $0.0384 $0.0372 $0.0369 $0.0374 $0.0381 $0.0416 $0.0478 $0.0572 $0.0396
IEC Per Account Member Fee $20 $20 $20 $20 $20 $20 $20 $20 $20 $20 $20 $20 $2401
Est. "Shared Savings" Storage Discount $0 $0 $0 $0 ($260) ($404) ($452) ($364) ($289) $0 $0 $0 ($1,767)
$1,255 $1,444 $2,451 $7,533 $12,720 $20,498 $24,006 $19,830 $15,725 $7,140 $3,764 $2,033 $118,398
$0.5154 $0.5172 $0.5085 $0.4942 $0.5045 $0.5230 $0.5473 $0.5614 $0.5612 $0.5338 $0.5445 $0.5601 $0.5362
* IEC Consumption Charge includes NICOR utility loss factor.
Spot Market Price 0.4037$ 0.4095$ 0.4125$ 0.4135$ 0.4180$ 0.4376$ 0.4616$ 0.4748$ 0.4738$ 0.4538$ 0.4568$ 0.4603$ Forecast Forecast Forecast Forecast Forecast Forecast Forecast Forecast Forecast Forecast Forecast Forecast
Disclaimer: The preceding information is based upon market price estimates, estimated usage, and therefore, cannot be construed as a formal offer or as a guaranteed delivered price.
OPTION A "IEC MANAGED PROGRAM" with Storage Release Shared Savings ProgramBUDGET FORECAST for July 2011 through June 2012
TOTAL NATURAL GAS COSTS
Bradley Bourbonnais Community High School District #307
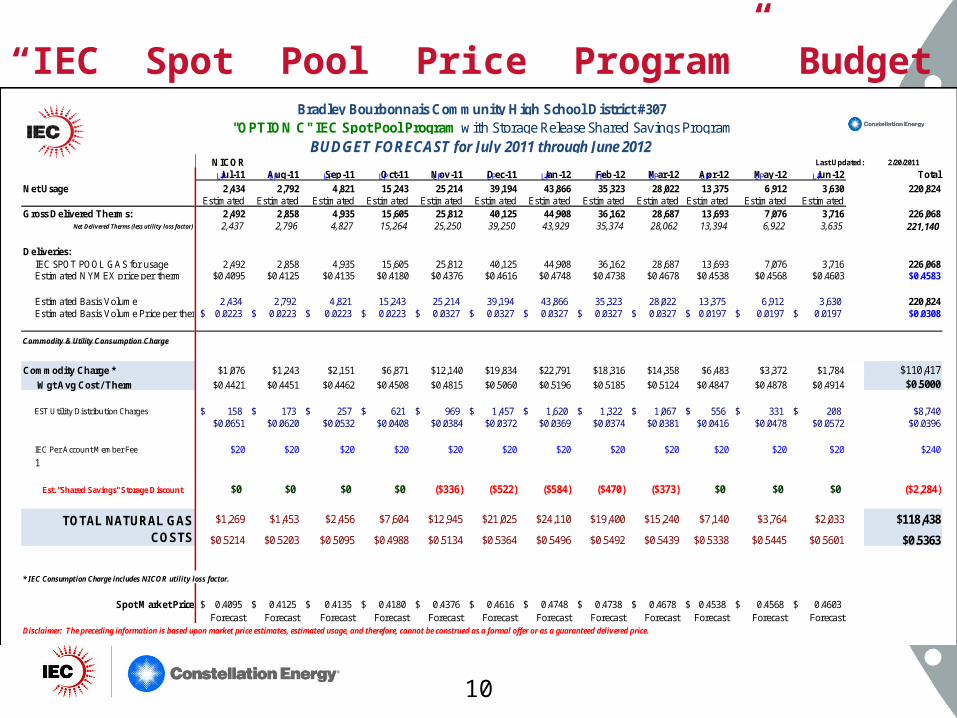
“IEC Spot Pool Price Program” Budget Forecast
10
NICOR Last Updated: 2/20/2011
Jul-11 Aug-11 Sep-11 Oct-11 Nov-11 Dec-11 Jan-12 Feb-12 Mar-12 Apr-12 May-12 Jun-12 TotalLP LP LP LP LP LP LP LP LP LP LP LP
Net Usage 2,434 2,792 4,821 15,243 25,214 39,194 43,866 35,323 28,022 13,375 6,912 3,630 220,824Estimated Estimated Estimated Estimated Estimated Estimated Estimated Estimated Estimated Estimated Estimated Estimated
Gross Delivered Therms: 2,492 2,858 4,935 15,605 25,812 40,125 44,908 36,162 28,687 13,693 7,076 3,716 226,068Net Delivered Therms (less utility loss factor) 2,437 2,796 4,827 15,264 25,250 39,250 43,929 35,374 28,062 13,394 6,922 3,635 221,140
Deliveries:IEC SPOT POOL GAS for usage 2,492 2,858 4,935 15,605 25,812 40,125 44,908 36,162 28,687 13,693 7,076 3,716 226,068Estimated NYMEX price per therm $0.4095 $0.4125 $0.4135 $0.4180 $0.4376 $0.4616 $0.4748 $0.4738 $0.4678 $0.4538 $0.4568 $0.4603 $0.4583
Estimated Basis Volume 2,434 2,792 4,821 15,243 25,214 39,194 43,866 35,323 28,022 13,375 6,912 3,630 220,824Estimated Basis Volume Price per therm 0.0223$ 0.0223$ 0.0223$ 0.0223$ 0.0327$ 0.0327$ 0.0327$ 0.0327$ 0.0327$ 0.0197$ 0.0197$ 0.0197$ $0.0308
Commodity & Utility Consumption Charge
Commodity Charge * $1,076 $1,243 $2,151 $6,871 $12,140 $19,834 $22,791 $18,316 $14,358 $6,483 $3,372 $1,784 $110,417 Wgt Avg Cost / Therm $0.4421 $0.4451 $0.4462 $0.4508 $0.4815 $0.5060 $0.5196 $0.5185 $0.5124 $0.4847 $0.4878 $0.4914 $0.5000
EST Utility Distribution Charges 158$ 173$ 257$ 621$ 969$ 1,457$ 1,620$ 1,322$ 1,067$ 556$ 331$ 208$ $8,740$0.0651 $0.0620 $0.0532 $0.0408 $0.0384 $0.0372 $0.0369 $0.0374 $0.0381 $0.0416 $0.0478 $0.0572 $0.0396
IEC Per Account Member Fee $20 $20 $20 $20 $20 $20 $20 $20 $20 $20 $20 $20 $2401
Est. "Shared Savings" Storage Discount $0 $0 $0 $0 ($336) ($522) ($584) ($470) ($373) $0 $0 $0 ($2,284)
$1,269 $1,453 $2,456 $7,604 $12,945 $21,025 $24,110 $19,400 $15,240 $7,140 $3,764 $2,033 $118,438
$0.5214 $0.5203 $0.5095 $0.4988 $0.5134 $0.5364 $0.5496 $0.5492 $0.5439 $0.5338 $0.5445 $0.5601 $0.5363
* IEC Consumption Charge includes NICOR utility loss factor.
Spot Market Price 0.4095$ 0.4125$ 0.4135$ 0.4180$ 0.4376$ 0.4616$ 0.4748$ 0.4738$ 0.4678$ 0.4538$ 0.4568$ 0.4603$ Forecast Forecast Forecast Forecast Forecast Forecast Forecast Forecast Forecast Forecast Forecast Forecast
Disclaimer: The preceding information is based upon market price estimates, estimated usage, and therefore, cannot be construed as a formal offer or as a guaranteed delivered price.
"OPTION C" IEC Spot Pool Program with Storage Release Shared Savings ProgramBUDGET FORECAST for July 2011 through June 2012
TOTAL NATURAL GAS COSTS
Bradley Bourbonnais Community High School District #307

Electric Power
11

Pricing Components
• Energy Price• Capacity• Ancillaries and RTO costs• Transmission Costs and Losses• Distribution Losses• Renewable Portfolio Standards• Administrative Fees• Delivery Service Charges

Know What You’re Buying and How to Tell an Apple from a Lemon
Other Supplier IEC
Energy 4.789¢/kwh 3.974¢/kwh
Capacity Pass Thru 0.896¢/kwh
Distribution Losses Pass Thru 0.242¢/kwh
Transmission & Ancillaries 0.596¢/kwh 0.596¢/kwh
RPS Pass Thru included
Other RTO Charges Pass Thru 0.225¢/kwh
How Much will you pay? 5.385 + ??? 5.933¢/kwh
No matter who you purchase from, demand they show you transparency in the pricing. If they won’t –
Show them the door.

Sample Budget Projection
14

IEC Natural Gas Program Day-to Day Contacts
Before you become a Member:Glen Grimm – New Business Development
Office: 630-264-6600Cell: 630-205-6454E-mail: [email protected]: 630-264-6611
After you become a Member:Liz Peronto – Account ManagerOffice: 888-579-6600E-mail: [email protected] Fax: 262-506-6611
15

IEC Electric Program Contacts
Membership Questions (Prospective and Current)
Tonya Powell – Electric Program Administrator
Office: 314-613-9120
E-mail: [email protected]
Fax: 888-354-9837
Billing Questions:
Glenda Ehrlich & Meghan Scally
AEM Customer Care Team
Office: 888-451-3911 opt 3
E-mail: [email protected]
Fax: 888-354-9837

Pricing Components Descriptions
• Energy – The Wholesale Energy cost secured by the IEC through block purchases
• Capacity – Charges dictated by MISO or PJM to ensure reliability
• Ancillaries and RTO costs – includes imbalance fees, Market administration fees, etc…
• Transmission – rate charged to transport energy from generator to service point
• Distribution Losses – cost of the percentage of energy that is “Lost” while traveling from Point A to B.

Pricing Components Descriptions (cont’d)
• Renewable Portfolio Standards – Cost to suppliers to ensure required percentage of energy derives from approved Renewable resources
• Administrative Fees – Because the IEC is a non-profit organization, Administrative fees are charged to cover the cost of administering the Program (marketing, communications, Program Administration, etc…)
• Delivery Service Charges – fees charged by the local utility to use their poles, wires, metering services, etc.


![[Add your district’s information here]](https://static.documents.pub/doc/80x56/568162ba550346895dd342ae/add-your-districts-information-here.jpg)


