Building a Better Li-Garnet Solid Electrolyte/Metallic Li Interface with Antimony
Romain Dubey, Jordi Sastre, Claudia Cancellieri, Faruk Okur, Alexander Forster, Lea Pompizii, Agnieszka Priebe, Yaroslav E. Romanyuk, Lars P. H. Jeurgens, Maksym V. Kovalenko,* and Kostiantyn V. Kravchyk*
DOI: 10.1002/aenm.202102086
1. Introduction
The quest for safe, non-flammable, and temperature-tolerant energy storage sys-tems with high energy and power densi-ties has caused a surge of research on batteries that consist solely of solid-state components.[1,2] In particular, solid-state batteries (SSBs) employing cubic Li7La3Zr2O12 (LLZO) garnet-type solid elec-trolytes are appealing as energy storage technology,[3] owing to a superior set of properties, such as a high Li-ion con-ductivity of up to 1 mS cm−1 (RT), a low electronic conductivity of ≈10−8 S cm−1 (RT), a high thermal and mechanical sta-bility and a wide electrochemical opera-tion window of 0–6 V versus Li+/Li.[4,5] LLZO-based SSBs, nevertheless, still face a number of obstacles before they can be practically deployed.[6] One of the fore-
most issues is the poor LLZO wettability by lithium metal,[7] mainly caused by the presence of the Li-ion-insulating layer at the LLZO surface, composed of LiOH, and Li2CO3,[8,9] although some differences as to its thickness and constituents have been reported.[10–12] The presence of this surface layer has decisive implications on the electrochemical performance of LLZO-SSBs. At best, this leads to an increase in the Li/LLZO interfacial resistance[10,11] and, consequently, to high voltage polarization upon Li plating/stripping.[13] At worst, it results in the formation of Li dendrites induced by the inhomogeneous distribution of the applied current density (current focusing).[4]
Towards solving the issue of poor LLZO wettability by lithium metal, various approaches of LLZO surface treatment were extensively explored. For instance, conventional heat treatments of LLZO at 600–900 °C[14] and surface treatments by HCl,[15] LiBF4 in ACN[16] have been shown to be effective in removing thin Li-ion insulating surface layers. Additionally, employment of Al2O3,[7] Au,[17] SnO2,[18] graphite,[19] Mg,[20] Ge[21] as interlayers between LLZO and Li reduces the Li/LLZO inter-facial resistance (a recent overview is provided by Kim et al.[2]). This effect was chiefly attributed to the reaction between these interlayer materials and Li, forming Li-ion conducting compounds.
We have chosen to examine Sb as an interfacial layer, inspired by the prior art with Ge,[21] Si,[22] and Sn.[23] A common motif here is that these elements form alloys with Li. We
The deployment of Li-garnet Li7La3Zr2O12 (LLZO) solid-state electrolytes in solid-state batteries is severely hampered by their poor wettability with metallic Li. In this work, Sb is presented as a compelling interfacial layer allowing superior wetting of Li onto a LLZO surface, resulting in a remark-ably low Li/LLZO interfacial resistance of 4.1(1) Ω cm2. An atomistic insight into Sb-coated LLZO interface using soft and hard X-ray photoelectron spectro scopy and focused ion beam time-of-flight secondary ion mass spec-trometry shows the formation of a Li-Sb alloy as an interlayer. It is deter-mined that the Li/Sb-coated LLZO/Li symmetrical cells exhibit a high critical current density of up to 0.64 mA cm−2 and low overpotentials of 40–50 mV at a current density of 0.2 mA cm−2 without applying external pressure. The electrochemical performance of Sb coated-LLZO pellets is also assessed with an intercalation-type V2O5 cathode. Li/Sb-coated-LLZO/V2O5 full cells deliver stable capacities of around 0.45 mAh cm−2, with a peak current den-sity of 0.3 mA cm−2.
R. Dubey, F. Okur, A. Forster, L. Pompizii, M. V. Kovalenko, K. V. KravchykLaboratory of Inorganic ChemistryDepartment of Chemistry and Applied BiosciencesETH ZürichZürich CH-8093, SwitzerlandE-mail: [email protected]; [email protected]. Dubey, J. Sastre, F. Okur, A. Forster, L. Pompizii, Y. E. Romanyuk, M. V. Kovalenko, K. V. KravchykLaboratory for Thin Films and PhotovoltaicsEmpa-Swiss Federal Laboratories for Materials Science & TechnologyDübendorf CH-8600, SwitzerlandC. Cancellieri, L. P. H. JeurgensLaboratory for Joining Technologies & CorrosionEmpa-Swiss Federal Laboratories for Materials Science & TechnologyDübendorf CH-8600, SwitzerlandA. PriebeLaboratory for Mechanics of Materials and NanostructuresEmpa-Swiss Federal Laboratories for Materials Science and TechnologyFeuerwerkerstrasse 39, Thun CH-3602, Switzerland
The ORCID identification number(s) for the author(s) of this article can be found under https://doi.org/10.1002/aenm.202102086.
demonstrate that a thin film of Sb on the LLZO surface serves as a wetting layer for Li deposition, yielding low interfacial resistance of 4.1(1) Ω cm2, and a high critical current density of Li plating/stripping of ≈0.64 mA cm−2. The Li/Sb-coated LLZO interface has been studied by soft and hard X-ray photoelectron spectroscopy (XPS/HAXPES), and focused ion beam time-of-flight secondary ion mass spectroscopy (FIB-TOF-SIMS).
2. Results and Discussion
2.1. The Preparation of a Sb-Coated LLZO Solid-State Electrolyte
LLZO solid-state electrolyte with a nominal composition of Li6.25Al0.25La3Zr2O12 was prepared in the form of highly dense (95–98% of the theoretical density of 5.17 g cm−3) sintered pel-lets with a thickness of ≈1 mm and a diameter of ≈10 mm (see Methods section for details). Then the pellets were polished with SiC paper (grain size 320, then 1000) under air, followed by a heat-treatment at 600 °C for 1 h in an Ar-filled glovebox. The powder X-ray diffraction measurements (Figure 1a) confirmed the formation of a phase-pure cubic LLZO structure (Figure 1b, the space group, Ia3d, a = 12.9652(4) Å, V = 2179.404 Å3, ICSD 430 571).
Sb thin films were coated via magnetron sputtering onto heat-treated LLZO pellets under an argon atmosphere using an Sb target. Scanning electron microscopy (SEM) measurements
with energy dispersive x-ray analysis of an Sb-coated LLZO pellet revealed that Sb was uniformly distributed throughout the LLZO circular planar surface (Figure 1c). The resulting sur-face of the LLZO pellets has a shiny, grayish color (Figure 1d). Interestingly, the color turns to shiny orange within seconds after being in contact with molten Li (Figure 1e), indicating the formation of another compound. As foreseen, Sb-coated LLZO pellets demonstrated improved wettability with molten Li, resulting in a low Li/LLZO contact angle (Figure 1f). By contrast, uncoated LLZO pellets exhibited a lithiophobic behavior, refusing any close contact with molten Li, as shown in Figure 1g.
Aiming to determine the optimal thickness of the Sb inter-facial layer, double-side Sb-coated LLZO pellets with different Sb thicknesses ranging from 5 to 100 nm were analyzed by impedance spectroscopy. The thickness error was ≈9.5% (see Figure S1 in the Supporting Information). Before the measure-ments, a ≈50 µm thick Li foil (6 mm diameter) was isostatically pressed onto the Sb surface and then heat-treated at 220 °C on a hot plate under inert conditions. Figure 2 compares the electro-chemical impedance spectra obtained with different thicknesses of the Sb interfacial layer. The first and second semi- circles are attributed to the total resistance of LLZO pellet and the Li/LLZO interfacial resistance, according to previous reports on LLZO solid-state electrolytes.[10] The total ionic conductivity of the LLZO pellets was between 0.45 and 0.5 mS cm−1. A com-parison of the impedance spectra shows that reducing the Sb
Figure 1. a) Powder X-ray diffraction pattern (XRD) of a LLZO pellet after sintering. b) The cubic structure of LLZO along with the representation of possible Li-ion migration pathways as proposed by Junji et al.[24] and Chen et al.[25] c) SEM-EDX images of Sb-coated LLZO pellet. d–g) Optical images of d) as prepared Sb-coated LLZO pellet, e) Sb-coated LLZO pellet after short contact with molten Li, f) Sb-coated LLZO pellet wetted by molten Li, and g) uncoated LLZO pellets with molten Li.
thickness from 100 to 10 nm leads to a decrease in the interfacial resistance from 660(20) to 4.1(1) Ω cm2. Interestingly, a further reduction of the thickness up to 5 nm results in an increase of the interfacial resistance to 59(3) Ω cm2. Of note, the best sym-metrical cell made of heat-treated LLZO without Sb interfacial layer has an interfacial resistance of 28.2(1.4) Ω cm2 (Figure S2, Supporting Information), which is comparable to the majority of reported values of Li/heat-treated LLZO interface.[13]
2.2. Surface Characterization
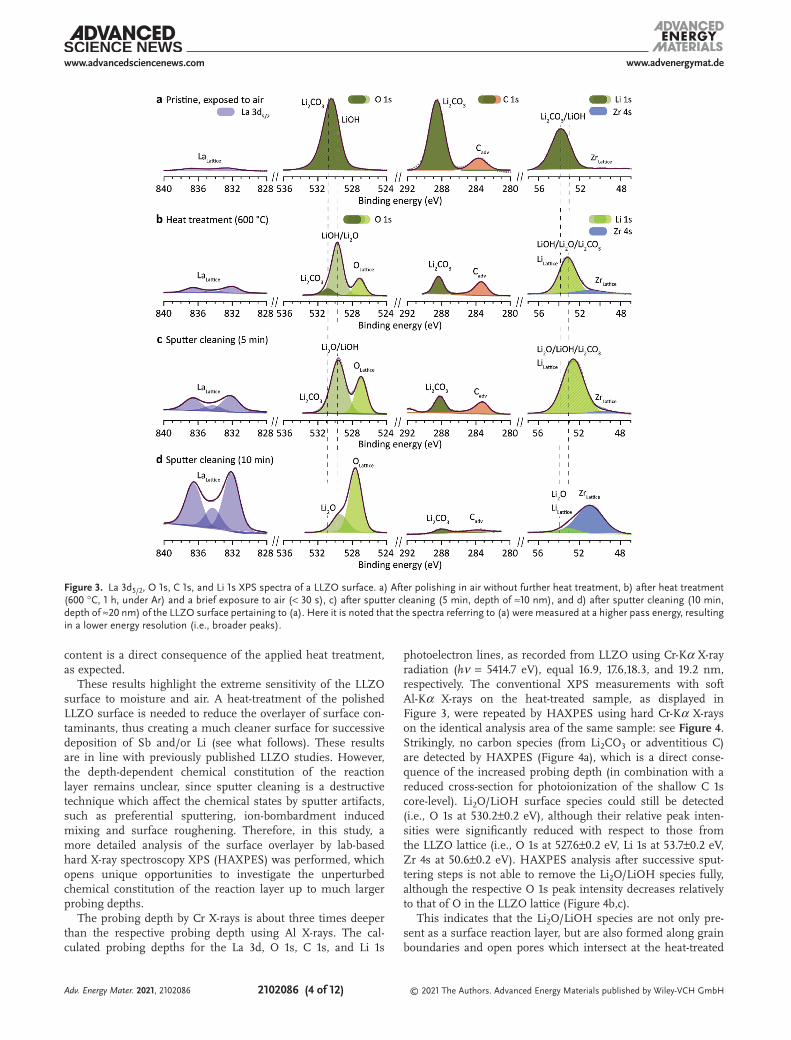
Next, we systematically investigated the surface chemistry of LLZO pellets after each successive preparation step by X-ray photoelectron spectroscopy (XPS). The LLZO pellets were exam-ined before and after heat-treatment (600 °C for 1 h under inert conditions). Additionally, a heat-treated LLZO pellet was meas-ured after two Ar sputter-cleaning cycles at 1 kV (sputter area of 2 × 2 mm2), which corresponds to approximate sputter depths of ≈10 and ≈20 nm, respectively (as estimated from the cali-brated sputter-rate of 2.3 nm min−1 for a reference Ta2O5 film). In Figure 3a, the measured La 3d5/2, O 1s, C 1s, and Li 1s spectra of the non-heat-treated, pristine sample after polishing are depicted. The probing depths for the La 3d, O1s, C 1s, and Li 1s photoelectron lines, as recorded from LLZO using Al-Kα X-ray radiation (hν = 1486.7 eV), equal 3.6, 4.8, 5.5, and 6.6 nm, respec-tively (see Supporting Information for formalism about probing depths). The XPS analysis indicates the presence of a thick over-layer, which is mainly constituted of Li2CO3 (with traces of Na).
The resolved O 1s, C 1s and Li 1s main peaks at binding energy (BE) values of 530.1 ± 0.4 eV, 288.4 ± 0.4 eV and 53.6 ± 0.4 eV are assigned to Li2CO3,[14] whereas the smaller C 1s peak at 283.4 ± 0.4 eV is attributed to adventitious carbon (see Supporting Information for comments about charge neu-tralization/referencing). The substrate signals from La (and Zr) are only very weak, which suggests that the polishing step under shielding gas with short air exposure, introduces a heter-ogeneous Li2CO3 overlayer with an average thickness of several nanometers. The Li2CO3 overlayer has formed due to the reac-tion of Li from LLZO with moist air[9,10] and/or carbon residues during the polishing step.
In Figure 3b, the measured La 3d5/2, O 1s, C 1s, and Li 1s spectra of the heat-treated sample are shown. The heat-treatment, as well as the transport of the heat-treated sample for XPS analysis, were performed under a shielding atmos-phere. As such, the air-exposure of the heat-treated (during transfer of the sample into the UHV chamber of the XPS instrument) could be minimized to < 30 s. Nonetheless, the substrate signals from La and Zr in the LLZO lattice are still relatively small, which indicates the presence of an overlayer on the heat-treated LLZO substrate. However, the O 1s and C 1s spectral contributions from Li2CO3 are much lower as compared to the polished, non-heat-treated sample. The O 1s spectral contribution from Li2CO3 (at 530.1 ± 0.4 eV) is rela-tively small; two additional O 1s spectral contributions were resolved, as attributed to Li2O/ LiOH at 529.7 ± 0.4 eV and oxygen in the LLZO lattice (OLattice) at 527.0 ± 0.4 eV.[26] The C 1s spectrum also evidences a much lower Li2CO3 surface content as compared to the non-heat-treated sample (com-pare C 1s spectra in Figure 3a,b). Unfortunately, the chemical shifts of the Li 1s photoelectron lines between the individual OLattice, Li2O, Li2O2, and LiOH chemical species are relatively small (as compared to their respective intrinsic peak widths) and their spectral contributions overlap with the Zr 4s peak from LLZO (see last column in Figure 3). Moreover, differen-tial charging of the insulating LLZO surface will be slightly dif-ferent depending on the composition of the overlayer. Hence, the individual Li 1s spectral contributions from Li2CO3, Li2O and/or LiOH cannot be resolved unambiguously. Therefore, only a single Li 1s spectral contribution for Li2CO3, Li2O, LiOH and/or Li in the LLZO lattice (plus a Zr 4s peak from Zr in the LLZO lattice) is fitted in this study. Nonetheless, the XPS anal-ysis clearly evidences that the overlayer on heat-treated LLZO is much thinner as compared to the non-heat-treated sample and constituted of a mixture of Li2CO3, Li2O and LiOH (with traces of Na and F). As follows from the Figure 3c,d, short sputter-cleaning successively removes the Li2CO3/Li2O/LiOH over-layer, resulting in increased signal intensities from La, O, and Li in the LLZO lattice, practically free from surface contami-nants. The respective Li 1s peak shifts from predominantly Li2CO3 at 53.6±0.4 eV to prevailing Li in the LLZO lattice at 53.2 eV±0.4 eV. The drastic reduction of the Li2CO3 surface
Figure 2. a) Impedance spectra of Li/LLZO/Li symmetrical cells comprising Sb-coated LLZO pellets with different Sb thicknesses. An impedance spec-trum of heat-treated LLZO without Sb interfacial layer is included for comparison. b) Zoom-in version of the impedance spectrum of the Li/LLZO/Li symmetrical cell comprising 10 nm Sb-coated LLZO pellet. The Li/LLZO interfacial resistance values derived from the impedance spectra are shown in Table S1 in the Supporting Information.
content is a direct consequence of the applied heat treatment, as expected.
These results highlight the extreme sensitivity of the LLZO surface to moisture and air. A heat-treatment of the polished LLZO surface is needed to reduce the overlayer of surface con-taminants, thus creating a much cleaner surface for successive deposition of Sb and/or Li (see what follows). These results are in line with previously published LLZO studies. However, the depth-dependent chemical constitution of the reaction layer remains unclear, since sputter cleaning is a destructive technique which affect the chemical states by sputter artifacts, such as preferential sputtering, ion-bombardment induced mixing and surface roughening. Therefore, in this study, a more detailed analysis of the surface overlayer by lab-based hard X-ray spectroscopy XPS (HAXPES) was performed, which opens unique opportunities to investigate the unperturbed chemical constitution of the reaction layer up to much larger probing depths.
The probing depth by Cr X-rays is about three times deeper than the respective probing depth using Al X-rays. The cal-culated probing depths for the La 3d, O 1s, C 1s, and Li 1s
photoelectron lines, as recorded from LLZO using Cr-Kα X-ray radiation (hν = 5414.7 eV), equal 16.9, 17.6,18.3, and 19.2 nm, respectively. The conventional XPS measurements with soft Al-Kα X-rays on the heat-treated sample, as displayed in Figure 3, were repeated by HAXPES using hard Cr-Kα X-rays on the identical analysis area of the same sample: see Figure 4. Strikingly, no carbon species (from Li2CO3 or adventitious C) are detected by HAXPES (Figure 4a), which is a direct conse-quence of the increased probing depth (in combination with a reduced cross-section for photoionization of the shallow C 1s core-level). Li2O/LiOH surface species could still be detected (i.e., O 1s at 530.2±0.2 eV), although their relative peak inten-sities were significantly reduced with respect to those from the LLZO lattice (i.e., O 1s at 527.6±0.2 eV, Li 1s at 53.7±0.2 eV, Zr 4s at 50.6±0.2 eV). HAXPES analysis after successive sput-tering steps is not able to remove the Li2O/LiOH species fully, although the respective O 1s peak intensity decreases relatively to that of O in the LLZO lattice (Figure 4b,c).
This indicates that the Li2O/LiOH species are not only pre-sent as a surface reaction layer, but are also formed along grain boundaries and open pores which intersect at the heat-treated
Figure 3. La 3d5/2, O 1s, C 1s, and Li 1s XPS spectra of a LLZO surface. a) After polishing in air without further heat treatment, b) after heat treatment (600 °C, 1 h, under Ar) and a brief exposure to air (< 30 s), c) after sputter cleaning (5 min, depth of ≈10 nm), and d) after sputter cleaning (10 min, depth of ≈20 nm) of the LLZO surface pertaining to (a). Here it is noted that the spectra referring to (a) were measured at a higher pass energy, resulting in a lower energy resolution (i.e., broader peaks).
LLZO surface (which is impossible to fully remove by gently sputter cleaning). In this regard, it is noted that the heat treat-ment at 600 °C mainly removes Li2CO3 and LiOH species; Li2O cannot evaporate or decompose at this temperature. Short air exposure of the heat-treated LLZO probably introduces some hydroxylation of remaining Li2O species at the surface and along grain boundaries and pores. In conclusion, the com-bined XPS/HAXPES analysis gives some new insights about the depth-resolved surface composition of the heat-treated LLZO surface after short air exposure (<30 s), as illustrated in Figure 4d. The current XPS/HAXPES findings are commen-surate with the surface contamination layer thickness value of < 10 nm obtained from soft X-ray absorption spectroscopy measurements, as reported by Cheng et al.[11] Gentle sputter cleaning can be used as an effective approach to remove Li-ion insulating Li2CO3 and LiOH species from the outer LLZO surface.
The above XPS/HAXPES findings indicate that a relatively clean LLZO surface is established by the heat-treatment in a shielding atmosphere at 600 °C. As a next step, the heat-treatment LLZO surface was coated with a thin Sb film with a nominal thickness of 50 nm (without intermediate exposure to air). The resulting Sb/LLZO system was investigated by lab-based HAXPES prior to sputtering, as well as after successive sputtering steps, in order to reveal the unperturbed chemical state of Sb at the buried Sb/LLZO interface (see Figure 5). The calculated probing depths for the La 3d, O 1s – Sb3d5/2, C 1s and Li 1s photoelectron lines, as recorded from the Sb/LLZO
system using Cr-Kα X-ray radiation equal 16.0, 16.8,17.6, and 19.2 nm, respectively. These probing depths are much larger than the typical thickness of the mixing zone in Sb and LLZO as induced by sputtering with 1 kV Ar ions at an incident angle of 45° (i.e., up to about 5 nm, as estimated by Monte-Carlo sim-ulations using the SRIM freeware). This implies that succes-sive cycles of sputtering and HAXPES analysis allows probing the unperturbed chemical states at the buried Sb/LLZO inter-face, which is not possible by conventional XPS sputter-depth profiling (using a soft X-ray source). HAXPES analysis of the Sb/LLZO system before sputtering only probes the 50 nm Sb overlayer, since substrate signals from La or Zr are not detected (Figure 5, sputter time of 0 min). The Sb film is mainly com-posed of Sb and Sb2O3, as evidenced from the Sb 3d5/2 peaks at 528.4 eV and 530.0 eV, respectively (as well as the intense plasmon peak from the Sb 4d photoelectron line at 48.4 eV,[27] which overlaps with the Zr 4s and Li 1s peaks). The La 3d5/2 and Zr 3d5/2 LLZO substrate intensities (i.e., LaLattice and ZrLattice) are first detected after 10 mins of sputtering, while the unperturbed Sb/LLZO interface is most effectively probed by HAXPES for sputtering times between 20 and 30 mins. Notably, HAXPES analysis does not detect any Li2CO3 and Li2O/LiOH species at the unperturbed Sb/LLZO interface (as is the case for the heat-treated LLZO surface without an Sb overlayer; see Figure 4b). This striking observation suggests that the deposition of Sb on the heat-treated LLZO surface can thermally activate a chemical reaction between Sb and remaining Li2O/LiOH species at the heat-treated LLZO surface to form LiSbO3.[28] Unfortunately,
Figure 4. La 3d5/2, O 1s, C 1s, and Li 1s HAXPES spectra of a LLZO surface after a) heat-treatment (600 °C, 1 h, under Ar) and a brief exposure to air (<30 s), b) sputter cleaning for 5 min (depth of ≈10 nm), and c) sputter cleaning for 10 min (depth of ≈20 nm). d) Schematic composition of the heat-treated LLZO surface after minimal (<30 s) exposure to air. Note the presence of Li2O and LiOH within the pores and along grain boundaries (GB) that intersect with the outer surface.
the individual O 1s and 3d5/2 spectral contributions from Sb2O3 and LiSbO3 cannot be resolved, since the respective chemical shift is too small (i.e., of the order of the peak width). Inter-estingly, contrary to Li2CO3 and LiOH compounds, which both possess a very low Li-ion conductivity of 10−7 mS cm−1,[29] the lit-erature suggests that LiSbO3 can be considered as a compelling Li-ion conductor, although no direct measurements of its Li-ion conductivity have been performed so far.
Even more striking than the absence of Li2O/LiOH reaction products at the buried Sb/LLZO interface is the observation of an additional chemical species of Sb at 526.2 ± 0.2 eV, which has a significantly lower BE than the metallic Sb 3d5/2 peak at 528.4 ± 0.1 eV. The corresponding (negative) shift between metallic Sb and this interface species is as large as −2.2 ± 0.2 eV. Such a chemical species at the lower BE side of the metallic Sb 3d5/2 peak can only be rationalized by the formation of a LixSb alloy at the Sb/LLZO interface (note: ionic compounds of Sb, such as Sb2O3 and LiSbO3 should appear at the higher BE side of the metallic Sb 3d5/2 peak). It is well established that there are only two intermetallic bulk compounds in the Li-Sb system, namely Li3Sb and Li2Sb, which both have very narrow ranges of homogeneity; moreover, there is negligible solid solubility of Li in Sb, while there is some solubility of Sb in liquid Li, albeit very small (<0.01 at.% Sb)[30] The enthalpy of formation of both inter-metallic phases is highly exothermic and much larger for Li3Sb (i.e., −300 kJ mol−1) as compared to Li2Sb (−195 kJ mol−1).[30] Importantly, as revealed by Huggins et al. [31] Li-Sb alloys pos-sess a high Li-ion conductivity of 0.15 mS cm−1 (at 360 °C), resulting in a low Li/LLZO interfacial resistance.
Additionally, the observed results indicate that the mag-netron sputter-coating procedure likely has a double action. First, the plasma acts as a sputter-cleaning agent, mimicking the effect of Ar sputter cleaning observed on Figures 3 and 4. Second, the deposited Sb creates a physical protective barrier by Sb, preventing recontamination upon exposure to air during the quick sample transfer.
To verify the formation of Li3Sb and/or Li2Sb upon reac-tion with liquid Li, a liquid drop of Li with a temperature of
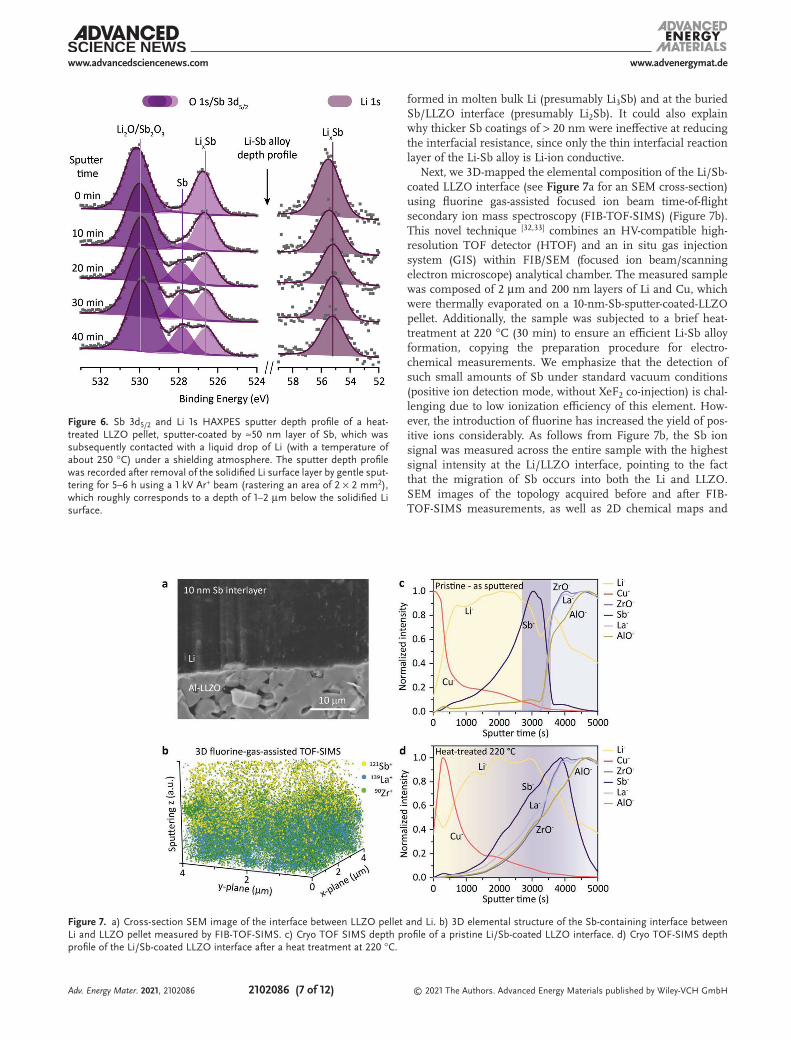
about 250 °C was placed next to an as-prepared Sb/LLZO sample at room temperature under a shielding atmosphere, and both entities were put in contact side-by-side. Next, the unknown depth of the Li-Sb reaction zone below the solidi-fied Li wetting layer with of skewed geometry (i.e., the Li wet-ting layer become thinner with increasing distance from the contact side) was allocated by successive cycles of sputtering (with 1kV Ar+/2 × 2 mm2), while monitoring the evolution of the Sb 3d5/2 – O 1s spectral region by HAXPES. The Li-Sb reaction zone was revealed after a total sputter time of about 5–6 h, which roughly corresponds to a depth of 1–2 µm below the solidified Li surface (see Figure 6). The formation of an intermetallic LixSb species by the reaction of the Sb overlayer with molten Li is evident across a sputter depth of a few hun-dreds of nanometers. In the Li-Sb reaction zone, a dominant Sb 3d5/2 peak from LixSb is present at the lower BE side of the metallic Sb 3d5/2 peak, as also observed at the buried Sb/LLZO interface in Figure 5. The absolute BE scale for the Sb/LLZO sample in Figure 5 might be shifted by band bending effects. However, the Sb 3d5/2 chemical shift between metallic Sb and Li3Sb and/or Li2Sb should be independent of band bending (and charging effects). Surprisingly, the chemical shift between Sb and the intermetallic LixSb compound formed by the liquid drop experiment is only −1.4 ± 0.2 eV, which is smaller than the respective shift −2.2 ± 0.2 eV, as determined for the Sb inter-metallic species at the buried Sb/LLZO interface (see Figure 5). In the liquid drop experiment, there is an excess reservoir of liquid Li. The finite solubility of Sb in liquid Li[30] then favors fast and continuous dissolution of Sb in the Li melt to form the most stable intermetallic phase, Li3Sb. On the contrary, for the deposition of a Sb overlayer on LLZO, the formation of a Li2Sb and/or Li3Sb interlayer will be rate-limited by the dissolution and solid-state diffusion of Li from the LLZO lattice into the Sb overlayer. Moreover, the solubility of Li into Sb is negligible.[30] Consequently, only a very thin Li2Sb reaction layer (instead of the Li-rich Li3Sb phase) forms at the Sb/LLZO interface during the Sb deposition step. This could rationalize the difference in chemical shifts between the intermetallic LixSb compounds
Figure 5. La 3d5/2, Sb 3d5/2, O 1s, Zr 3d5/2, Li 1s, Zr 4s, and Sb 4d HAXPES depth profile of a heat-treated LLZO surface, sputter-coated by ≈50 nm Sb layer.
formed in molten bulk Li (presumably Li3Sb) and at the buried Sb/LLZO interface (presumably Li2Sb). It could also explain why thicker Sb coatings of > 20 nm were ineffective at reducing the interfacial resistance, since only the thin interfacial reaction layer of the Li-Sb alloy is Li-ion conductive.
Next, we 3D-mapped the elemental composition of the Li/Sb-coated LLZO interface (see Figure 7a for an SEM cross-section) using fluorine gas-assisted focused ion beam time-of-flight secondary ion mass spectroscopy (FIB-TOF-SIMS) (Figure 7b). This novel technique [32,33] combines an HV-compatible high-resolution TOF detector (HTOF) and an in situ gas injection system (GIS) within FIB/SEM (focused ion beam/scanning electron microscope) analytical chamber. The measured sample was composed of 2 µm and 200 nm layers of Li and Cu, which were thermally evaporated on a 10-nm-Sb-sputter-coated-LLZO pellet. Additionally, the sample was subjected to a brief heat-treatment at 220 °C (30 min) to ensure an efficient Li-Sb alloy formation, copying the preparation procedure for electro-chemical measurements. We emphasize that the detection of such small amounts of Sb under standard vacuum conditions (positive ion detection mode, without XeF2 co-injection) is chal-lenging due to low ionization efficiency of this element. How-ever, the introduction of fluorine has increased the yield of pos-itive ions considerably. As follows from Figure 7b, the Sb ion signal was measured across the entire sample with the highest signal intensity at the Li/LLZO interface, pointing to the fact that the migration of Sb occurs into both the Li and LLZO. SEM images of the topology acquired before and after FIB-TOF-SIMS measurements, as well as 2D chemical maps and
Figure 6. Sb 3d5/2 and Li 1s HAXPES sputter depth profile of a heat-treated LLZO pellet, sputter-coated by ≈50 nm layer of Sb, which was subsequently contacted with a liquid drop of Li (with a temperature of about 250 °C) under a shielding atmosphere. The sputter depth profile was recorded after removal of the solidified Li surface layer by gentle sput-tering for 5–6 h using a 1 kV Ar+ beam (rastering an area of 2 × 2 mm2), which roughly corresponds to a depth of 1–2 µm below the solidified Li surface.
Figure 7. a) Cross-section SEM image of the interface between LLZO pellet and Li. b) 3D elemental structure of the Sb-containing interface between Li and LLZO pellet measured by FIB-TOF-SIMS. c) Cryo TOF SIMS depth profile of a pristine Li/Sb-coated LLZO interface. d) Cryo TOF-SIMS depth profile of the Li/Sb-coated LLZO interface after a heat treatment at 220 °C.
TOF-SIMS depth profiles can be found in the Figures S4–S6 in the Supporting Information.
Moreover, aiming to exclude an impact of the low melting tem-perature of Li on the distribution of the detected species across the interface, additional TOF-SIMS depth-profile measurements were performed at cryogenic temperature, before and after a heat treatment at 220 °C (Figure 7c,d). The obtained results also con-firmed the blurriness of the Cu/Li/Sb-coated LLZO interfaces with a wide distribution of Sb, Li, La, Zr and Al species across the interface region. They also demonstrate the mobility of the Sb species at the interface, indicating that the Sb at the interface is likely to migrate and dilute during the battery operations as well.
Another possible reaction of the Sb with other elements is not to be excluded. Yang et al.[34] reported Sb doping of Al-LLZO. They show that Sb is partly replacing the Zr and Li in the octahedral and the 24d tetrahedral sites of Al-LLZO structure, respectively. The estimated Li-ion conductivity of Sb-doped Al-LLZO ceramics was ≈0.41 mS cm−1 at RT. In this context, one can speculate that Sb acting as a dopant can pro-vide a highly conductive layer at the surface of the LLZO pellet.
2.3. Electrochemical Measurements
To examine the impact of the Sb coating on the effectiveness of the Li plating/stripping at the LLZO/Li interface, symmetrical cells were prepared by isostatically pressing Li on Sb-coated or only heat-treated LLZO pellets, followed by their heating at 220 °C under inert atmosphere. In accordance with Ohm’s law
and the impedance measurements, the overpotential of the sym-metrical cells comprising Sb-coated LLZO pellets is increasing at the increase of Sb-coating thickness from 10 to 100 nm (see Figure S7 in the Supporting Information). Then, galvanostatic cycling experiments were conducted at room temperature using current densities of 0.05 and 0.1 mA cm−2 (first 2 cycles) and then 0.2 mA cm−2 with a capacity limitation of 0.1 mAh cm−2 per half-cycle without the employment of external pressure.
The galvanostatic voltage profiles of symmetrical cells are shown in Figure 8a. As anticipated from the impedance spec-troscopy measurements (Figure 2; Figure S2, Supporting Information), the heat-treated and the Sb-coated samples dis-play very similar overpotentials in the early stages of galvano-static cycling. However, after 50 cycles (cumulative capacity of 10 mAh cm−2), the overpotential of the heat-treated sample starts to increase significantly. Cycling of the heat-treated system can be extended for weeks without short-circuit, but with large overpotential values of 1 V and −1 V for each half-cycle. These data are in line with cross-section SEM images (Figure 8b) taken before and after cycling, which indicate the formation of huge voids and Li whiskers at the Li/LLZO interface without Sb coating. The latter leads to a reduction of Li/LLZO contact area, which translates into a higher interfacial resistance and steep voltage curves during the stripping of Li. On the contrary, the Sb-coated system can be cycled up to 70 mAh cm−2 of cumu-lative capacity with only a minor increase of the overpotential up to 40–45 mV. The cross-sectional SEM images (Figure 8c) of Li/Sb-coated-LLZO interface before and after cycling clearly display the superior adhesion of Li on Sb-coated LLZO.
Figure 8. a) Voltage profiles of Li/LLZO/Li symmetrical cells comprising Sb-coated and uncoated LLZO pellets at current densities of 0.05 and 0.1 mA cm−2 (first 2 cycles) and 0.2 mA cm−2 (from 3rd cycle onward). The measurements were performed at room temperature, without the employment of external pressure, and with a capacity limitation of 0.1 mAh cm−2 per half-cycle. b) Cross-section SEM images of a pristine and cycled symmetrical cell com-posed of a heat-treated LLZO pellet without Sb coating. c) Cross-section SEM micrographs of a pristine and cycled sample symmetrical cell comprising Sb-coated LLZO pellet.
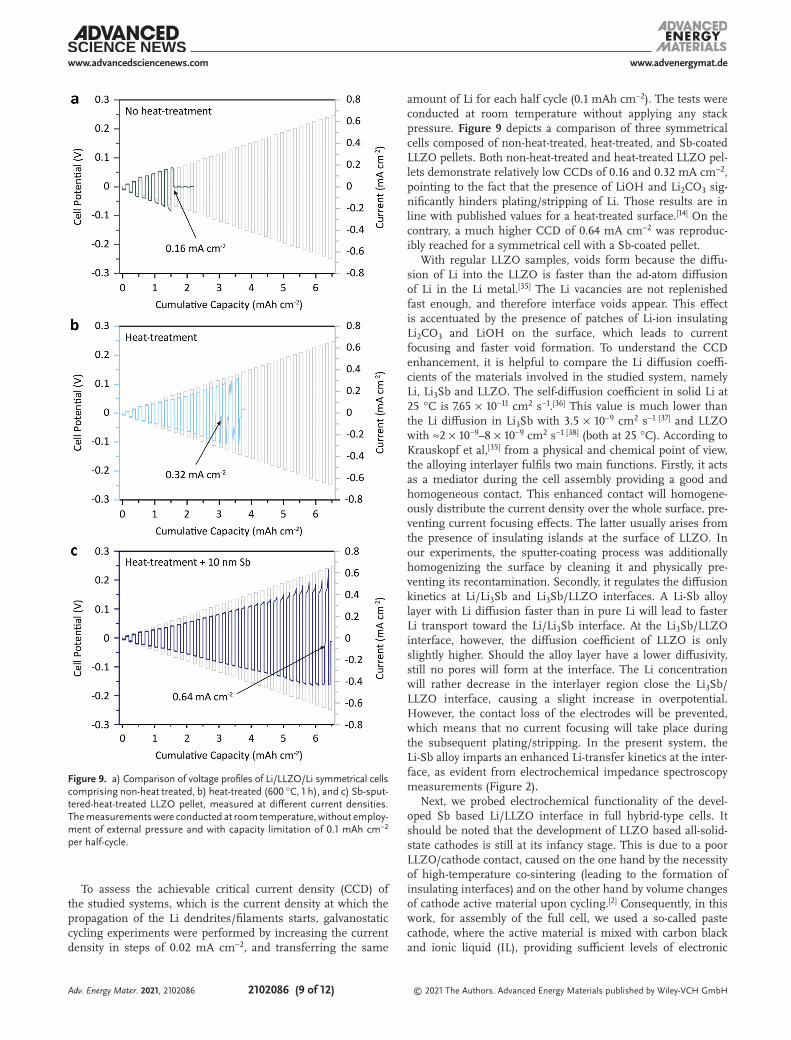
To assess the achievable critical current density (CCD) of the studied systems, which is the current density at which the propagation of the Li dendrites/filaments starts, galvanostatic cycling experiments were performed by increasing the current density in steps of 0.02 mA cm−2, and transferring the same
amount of Li for each half cycle (0.1 mAh cm−2). The tests were conducted at room temperature without applying any stack pressure. Figure 9 depicts a comparison of three symmetrical cells composed of non-heat-treated, heat-treated, and Sb-coated LLZO pellets. Both non-heat-treated and heat-treated LLZO pel-lets demonstrate relatively low CCDs of 0.16 and 0.32 mA cm−2, pointing to the fact that the presence of LiOH and Li2CO3 sig-nificantly hinders plating/stripping of Li. Those results are in line with published values for a heat-treated surface.[14] On the contrary, a much higher CCD of 0.64 mA cm−2 was reproduc-ibly reached for a symmetrical cell with a Sb-coated pellet.
With regular LLZO samples, voids form because the diffu-sion of Li into the LLZO is faster than the ad-atom diffusion of Li in the Li metal.[35] The Li vacancies are not replenished fast enough, and therefore interface voids appear. This effect is accentuated by the presence of patches of Li-ion insulating Li2CO3 and LiOH on the surface, which leads to current focusing and faster void formation. To understand the CCD enhancement, it is helpful to compare the Li diffusion coeffi-cients of the materials involved in the studied system, namely Li, Li3Sb and LLZO. The self-diffusion coefficient in solid Li at 25 °C is 7.65 × 10⁻¹¹ cm2 s−1.[36] This value is much lower than the Li diffusion in Li3Sb with 3.5 × 10⁻⁹ cm2 s−1 [37] and LLZO with ≈2 × 10⁻⁹–8 × 10⁻⁹ cm2 s−1 [38] (both at 25 °C). According to Krauskopf et al,[35] from a physical and chemical point of view, the alloying interlayer fulfils two main functions. Firstly, it acts as a mediator during the cell assembly providing a good and homogeneous contact. This enhanced contact will homogene-ously distribute the current density over the whole surface, pre-venting current focusing effects. The latter usually arises from the presence of insulating islands at the surface of LLZO. In our experiments, the sputter-coating process was additionally homogenizing the surface by cleaning it and physically pre-venting its recontamination. Secondly, it regulates the diffusion kinetics at Li/Li3Sb and Li3Sb/LLZO interfaces. A Li-Sb alloy layer with Li diffusion faster than in pure Li will lead to faster Li transport toward the Li/Li3Sb interface. At the Li3Sb/LLZO interface, however, the diffusion coefficient of LLZO is only slightly higher. Should the alloy layer have a lower diffusivity, still no pores will form at the interface. The Li concentration will rather decrease in the interlayer region close the Li3Sb/LLZO interface, causing a slight increase in overpotential. However, the contact loss of the electrodes will be prevented, which means that no current focusing will take place during the subsequent plating/stripping. In the present system, the Li-Sb alloy imparts an enhanced Li-transfer kinetics at the inter-face, as evident from electrochemical impedance spectroscopy measurements (Figure 2).
Next, we probed electrochemical functionality of the devel-oped Sb based Li/LLZO interface in full hybrid-type cells. It should be noted that the development of LLZO based all-solid-state cathodes is still at its infancy stage. This is due to a poor LLZO/cathode contact, caused on the one hand by the necessity of high-temperature co-sintering (leading to the formation of insulating interfaces) and on the other hand by volume changes of cathode active material upon cycling.[2] Consequently, in this work, for assembly of the full cell, we used a so-called paste cathode, where the active material is mixed with carbon black and ionic liquid (IL), providing sufficient levels of electronic
Figure 9. a) Comparison of voltage profiles of Li/LLZO/Li symmetrical cells comprising non-heat treated, b) heat-treated (600 °C, 1 h), and c) Sb-sput-tered-heat-treated LLZO pellet, measured at different current densities. The measurements were conducted at room temperature, without employ-ment of external pressure and with capacity limitation of 0.1 mAh cm−2 per half-cycle.
and ionic conductivity, accordingly.[19] Ionic liquids have indeed been proven to significantly improve the ionic trans-port at the cathode/LLZO interface, as reported by Passerini et al.[39] As a cathode material, we chose vanadium pentoxide (V2O5)[40] because of its high theoretical capacity upon lithiation (274 mAh g−1 for the two-electron reaction) and relatively high average discharge voltage of 2.6 V versus Li+/Li. This indicates that in combination with a metallic lithium anode, it may offer an energy density of up to 712 Wh kg−1. This is higher than that of LiFePO4 (578 Wh kg−1), LiNi1/3Mn1/3Co1/3O2 (610 Wh kg−1) and LiCoO2 (546 Wh kg−1) commercial Li-ion cathodes. More-over, to the best of our knowledge, a V2O5 cathode has not been investigated in Li-garnet SSBs.
In short, the paste was prepared by mixing 240 mg of V2O5 (41 wt.%), 80 mg of CB (13.7 wt.%) and 119 µl of 0.3M LiTFSI in PY14TFSI ionic liquid electrolyte (45.3 wt.%). The paste electrode was deposited directly on the heat-treated surface of LLZO, and then covered with an Al foil current collector. The average loading of V2O5 active material was ≈2.3 mg cm−2. The cells were tested at room temperature and without applying external pressure. The applied currents were normalized to the surface area of the Li anode.Figure 10a shows the voltage profiles of a V2O5|Sb-coated-
LLZO|Li full cell measured at different current densities of 0.05, 0.1, 0.2, and 0.3 mA cm−2
. During a discharge step, i.e., a lithia-tion of the cathode, three distinct plateaus at approximately 3.3, 3.1 and 2.3 V versus Li+/Li were observed at all current den-sities, indicating a 3-step lithiation mechanism. As previously reported,[41] the first and second plateaus are attributed to the formation of Li0.5V2O5 and LiV2O5, respectively. The third pla-teau corresponds to the phase transition from LiV2O5 to Li2V2O5. The results demonstrate that the increase of the current den-sity from 0.05, 0.1 mA cm−2, and then to 0.3 mA cm−2 leads to significant decrease of reversible charge storage capacity from 250 mAh g−1 (0.58 mAh cm−2) to 157 mAh g−1 (0.35 mAh cm−2) and 71 mAh g−1 (0.16 mAh cm−2), respectively. However, when the current density was decreased back to 0.2 mA cm−2, 0.1 mA cm−2 and 0.05 mA cm−2, nearly complete capacity recovery with 109, 157 and ≈200 mAh g−1 (0.45 mAh cm−2) was achieved (Figure 10b). A significant drop in capacity at high current density underlines the necessity for improving
the charge-transfer properties of the V2O5 cathode/LLZO interface and Li-ion/electronic percolation within the com-posite V2O5 cathode. Similar full-cell measurements with a LiNi0.5Mn0.3Co0.2O2 paste cathode were performed with the same composition. They can be found in the Supporting infor-mation (Figure S8, Supporting Information).
3. Conclusion
We have examined Sb as a compelling interfacial layer between LLZO solid-state electrolyte and metallic Li, enabling to improve the Li wettability on the LLZO surface. A side-by-side comparison of Sb layers of different thicknesses on the order of 5 to 100 nm showed that the areal specific interface resistance of a LLZO pellet sputtered with ≈10 nm Sb layer has the lowest value of 4.1(1) Ohm cm2 compared to those of thinner (5 nm), thicker (20–100 nm) Sb coatings or non-coated LLZO surface. We determined that the Li/10-nm-Sb-LLZO/Li symmetrical cells exhibit a high critical current density of up to 0.64 mA cm−2 and low overpotentials of 40–50 mV at a current density of 0.2 mA cm−2 at room temperature and without the employment of external pressure. Using an advanced set of surface charac-terization methods such as XPS/HAXPES and TOF-SIMS, we revealed that the major factor governing an efficient plating/stripping of Li at the Sb-coated LLZO surface is the formation of a Li-Sb alloy, which enables an efficient Li-ion and electronic percolation at the Li/LLZO interface and effectively mitigates the formation of cavities and Li whiskers upon plating/strip-ping of Li. The electrochemical performance of Sb-coated LLZO solid-state electrolyte has also been assessed with an intercalation-type V2O5 cathode. Li/Sb-coated-LLZO/V2O5 full cells delivered stable areal capacities of around 0.45 mAh cm−2, with a peak current density of 0.3 mA cm−2.
4. Experimental SectionPreparation of Garnet Al-LLZO Pellets: Commercial LLZO powder
(AmpceraTM, Al-doped LLZO, 500 nm nano-powder) was pressed uniaxially inside of 10 or 13 mm2 pressing dyes at the pressure of ≈15 kN. The obtained green pellets were further isostatically pressed at 1000 kN
Figure 10. a) Typical galvanostatic charge-discharge voltage profiles and b) cyclic stability measurements of V2O5|Sb-coated-LLZO|Li full cell at current densities of 0.05, 0.1, 0.2, and 0.3 mA cm−2.
and subsequently pre-polished from all sides with polishing paper to remove any impurities at the surface. Then, polished green pellets were covered from every side with pristine LLZO powder and sandwiched between two Al2O3 crucible lids prior to their insertion into a tube furnace (Gero Carbolite). The sintering of the pellets was performed at 1220 °C for 15 min (heating rate to 1220 °C: 450 °C h−1, cooling rate to 700 °C: 240 °C h−1, followed by natural cooling) under a nitrogen atmosphere with constant gas flow. Afterward, the sintered pellets were coarse-polished down to a thickness of 1 mm, followed by fine polishing with a grit size of 1200. The resulting pellets were then placed on ≈5 mm thick LLZO pillars and heat-treated in an Ar glovebox at 600 °C for 1 h.
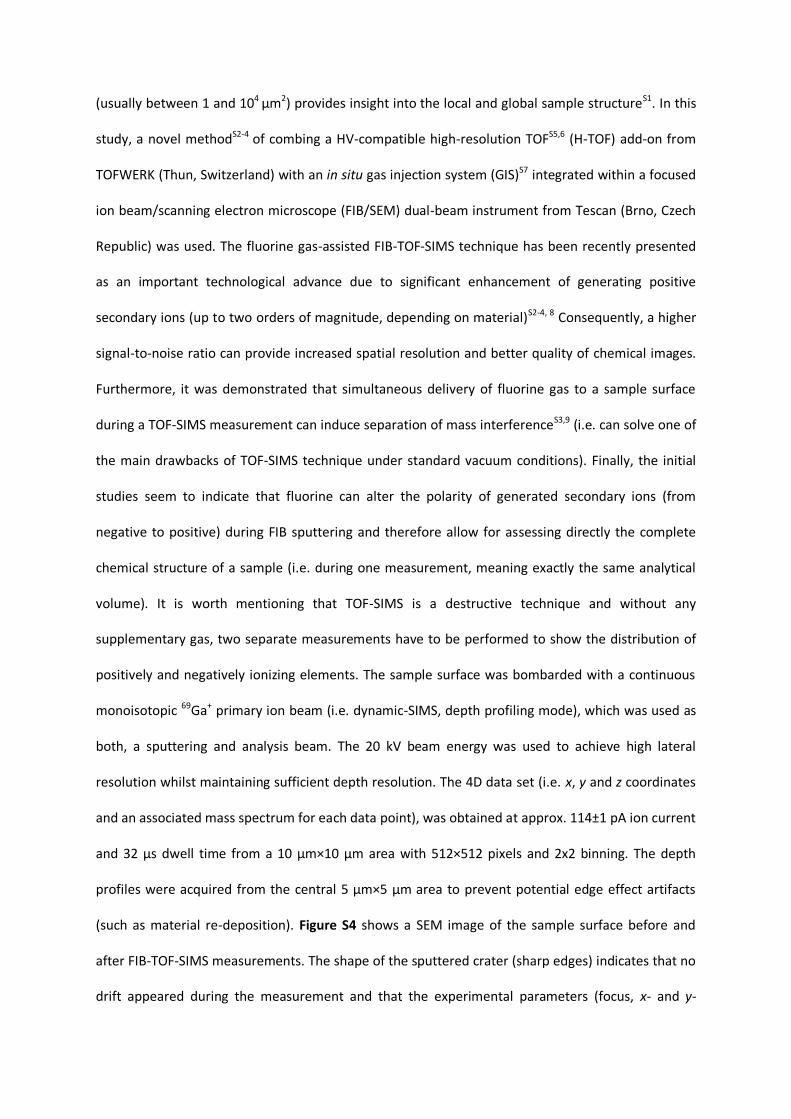
Characterization: Powder X-ray diffraction (XRD) was measured on a STOE STADI P powder X-ray diffractometer in reflection mode (Mo-Kα1 irradiation, λ = 0.7093 Å). SEM and EDX analysis was performed using a Hitachi TM3030Plus Tabletop microscope with an acceleration voltage of 10 kV. XPS/HAXPES analysis was performed using a PHI Quantes spectrometer (ULVAC-PHI), equipped with a conventional low-energy Al-Kα source (1486.6 eV) and a high energy Cr-Kα (5414.7 eV) X-ray source. Both sources are high flux focused monochromatic X-ray beams. The energy scale of the hemispherical analyzer was calibrated according to ISO 15 472 by referencing the Au 4f7/2 and Cu 2p3/2 main peaks (as measured in situ for corresponding sputter-cleaned, high-purity metal references) to the recommended BE positions of 83.96 eV and 932.62 eV, respectively. Charge neutralization during each measurement cycle was accomplished by a dual beam charge neutralization system, employing low energy electron and argon ion beams (1 V Bias, 20 µA current). More details can be found in the Supporting Information. TOF-SIMS depth profiling was performed with an UHV dedicated standalone TOF-SIMS5 system from IONTOF (Germany). For sputtering, a Cs+-ion gun was employed with an acceleration voltage of 2 kV on an area of 300 × 300 µm2. The primary ion source used for analyzing was Bi+ ions with an acceleration voltage of 25 kV. The negative-charged ions extracted from a 50 × 50 µm2 area within the sputtering crater were used for the analysis. The measurements were performed in the negative mode without a GIS system. For the fluorine gas-assisted 3D FIB-TOF-SIMS measurements, a novel approach[32,42] of combining a HV-compatible high-resolution TOF-SIMS detector (HTOF from TOFWERK, Switzerland) with an in-situ gas injection system integrated within a FIB-SEM (Tescan, Czech Republic) was used. The sample was bombarded with a 20 kV 69Ga+ primary ion beam (used for sputtering and analysis), and the 4D data set (x,y,z and associated mass spectrum for each data point) was obtained at approx. 114 ± 1 pA ion current and 32 µs dwell time from a 10 µm × 10 µm area with 512 × 512 pixels and 2 × 2 binning. The depth profiles of positive ions were acquired from the central 5 µm × 5 µm area to prevent potential edge effect artifacts. Mass spectra were calibrated using the secondary ion signals of the main sample elements (7Li+, 27Al+, 63Cu+, 121Sb+ and 139La+) and the primary ion beam (69Ga+). More details can be found in the Supporting Information.
Sb Coating: Sb was sputtered at room temperature onto the LLZO pellets by a radio frequency magnetron sputtering (Orion, AJA International Inc.). The films were prepared using an Sb target (Plasmaterials) under Ar flow (50 sccm). The film thickness was tuned by measuring the deposition rate with a quartz crystal microbalance (QCM) and adjusting the deposition time accordingly.
Symmetrical Cell Preparation: Symmetrical cells comprising non-heat-treated, heat-treated and Sb-coated Al-LLZO pellets were prepared using an identical procedure: 6 or 8 mm wide discs of laminated Li (50 µm) on Cu foil (9 µm) were isostatically pressed at 1000 kN for at least 10 min onto the opposite sides of Al-LLZO pellet under inert conditions. Then, the resulting symmetrical cells were heat-treated at 220 °C on a heating plate under an inert Ar atmosphere (30 min for each side).
The Preparation of the V2O5 Cathode Paste: V2O5 cathode paste was prepared by mixing powders of vanadium pentoxide (240 mg, GfE) and carbon black Super P (80 mg, Imerys) with 0.3M LiTFSI (99%, Sigma Aldrich) in PY14TFSI (99%, Sigma Aldrich) ionic liquid (190 µl), corresponding to a V2O5 weight content of ≈41 wt%. The mixture was ground thoroughly for at least 15 min in a mortar under inert conditions, followed by its casting onto a bare surface of heat-treated Al-LLZO using
a spatula. Afterwards, the prepared electrode was covered with an Al foil current collector.
Electrochemical Testing: Symmetrical and full cells were tested inside of the Ag glovebox using a multichannel workstation (MPG-2, Bio-Logic SAS). Cells were placed between two coin-cell spacers and fixed by clamps with negligible pressure of 0.15 MPa. Electrochemical impedance spectroscopy measurements were conducted using a frequency range of 10 MHz to 0.1 Hz with a sinus amplitude of 10 mV. Symmetrical cells were cycled in galvanostatic mode using current densities of 0.02–1.2 mA cm−2, transferring typically 0.1 mAh cm−2 per semi cycle. Full cell testing was performed in a voltage range from 3.8 to 2.0 V, with current densities from 0.05 to 0.3 mA cm−2. Typical active material loadings was ≈2.3 mg cm−2.
Supporting InformationSupporting Information is available from the Wiley Online Library or from the author.
AcknowledgementsK.V.K. and M.V.K. acknowledge partial financial support from Empa-Fraunhofer ICS project “IE4B” (under ICON funding scheme). The authors are grateful to the research facilities of ETH Zurich (ETH Electron Microscopy Center, Department of Chemistry and Applied Biosciences) and Empa (Empa Electron Microscopy Center and Laboratory for Mechanics of Materials & Nanostructures) for access to the instruments and for technical assistance.
Conflict of InterestThe authors declare no conflict of interest.
Data Availability StatementThe data that support the findings of this study are available from the corresponding author upon reasonable request.
[1] a) X.-B. Cheng, R. Zhang, C.-Z. Zhao, Q. Zhang, Chem. Rev. 2017, 117, 10403; b) J. Janek, W. G. Zeier, Nat. Energy 2016, 1, 16141; c) D. Lin, Y. Liu, Y. Cui, Nat. Nanotechnol. 2017, 12, 194; d) S. Randau, D. A. Weber, O. Kötz, R. Koerver, P. Braun, A. Weber, E. Ivers-Tiffée, T. Adermann, J. Kulisch, W. G. Zeier, F. H. Richter, J. Janek, Nat. Energy 2020, 5, 259.
[2] K. J. Kim, M. Balaish, M. Wadaguchi, L. Kong, J. L. M. Rupp, Adv. Energy Mater. 2021, 11, 2002689.
[3] a) A. J. Samson, K. Hofstetter, S. Bag, V. Thangadurai, Energy Environ. Sci. 2019, 12, 2957; b) K. V. Kravchyk, F. Okur, M. V. Kovalenko, ACS Energy Lett. 2021, 6, 2202.
[4] C. Wang, K. Fu, S. P. Kammampata, D. W. McOwen, A. J. Samson, L. Zhang, G. T. Hitz, A. M. Nolan, E. D. Wachsman, Y. Mo, V. Thangadurai, L. Hu, Chem. Rev. 2020, 120, 4257.
[5] S. Afyon, K. V. Kravchyk, S. Wang, J. v. d. Broek, C. Hänsel, M. V. Kovalenko, J. L. M. Rupp, J. Mater. Chem. A 2019, 7, 21299.
[6] a) Q. Liu, Z. Geng, C. Han, Y. Fu, S. Li, Y.-b. He, F. Kang, B. Li, J. Power Sources 2018, 389, 120; b) K. Kerman, A. Luntz, V. Viswanathan, Y.-M. Chiang, Z. Chen, J. Electrochem. Soc. 2017, 164, A1731.
[7] X. Han, Y. Gong, K. Fu, X. He, G. T. Hitz, J. Dai, A. Pearse, B. Liu, H. Wang, G. Rubloff, Y. Mo, V. Thangadurai, E. D. Wachsman, L. Hu, Nat. Mater. 2017, 16, 572.
[8] H. Huo, J. Luo, V. Thangadurai, X. Guo, C.-W. Nan, X. Sun, ACS Energy Lett. 2020, 5, 252.
[9] W. Xia, B. Xu, H. Duan, X. Tang, Y. Guo, H. Kang, H. Li, H. Liu, J. Am. Ceram. Soc. 2017, 100, 2832.
[10] A. Sharafi, S. Yu, M. Naguib, M. Lee, C. Ma, H. M. Meyer, J. Nanda, M. Chi, D. J. Siegel, J. Sakamoto, J. Mater. Chem. A 2017, 5, 13475.
[11] L. Cheng, E. J. Crumlin, W. Chen, R. Qiao, H. Hou, S. F. Lux, V. Zorba, R. Russo, R. Kostecki, Z. Liu, K. Persson, W. Yang, J. Cabana, T. Richardson, G. Chen, M. Doeff, Phys. Chem. Chem. Phys. 2014, 16, 18294.
[12] L. Cheng, C. H. Wu, A. Jarry, W. Chen, Y. Ye, J. Zhu, R. Kostecki, K. Persson, J. Guo, M. Salmeron, G. Chen, M. Doeff, ACS Appl. Mater. Interfaces 2015, 7, 17649.
[13] M. Wang, J. Sakamoto, J. Power Sources 2018, 377, 7.[14] A. Sharafi, E. Kazyak, A. L. Davis, S. Yu, T. Thompson, D. J. Siegel,
N. P. Dasgupta, J. Sakamoto, Chem. Mater. 2017, 29, 7961.[15] H. Huo, Y. Chen, N. Zhao, X. Lin, J. Luo, X. Yang, Y. Liu, X. Guo,
X. Sun, Nano Energy 2019, 61, 119.[16] M. M. Besli, C. Usubelli, M. Metzger, V. Pande, K. Harry,
D. Nordlund, S. Sainio, J. Christensen, M. M. Doeff, S. Kuppan, ACS Appl. Mater. Interfaces 2020, 12, 20605.
[17] N. J. Taylor, S. Stangeland-Molo, C. G. Haslam, A. Sharafi, T. Thompson, M. Wang, R. Garcia-Mendez, J. Sakamoto, J. Power Sources 2018, 396, 314.
[18] K. Liu, R. Zhang, M. Wu, H. Jiang, T. Zhao, J. Power Sources 2019, 433, 226691.
[19] Y. Shao, H. Wang, Z. Gong, D. Wang, B. Zheng, J. Zhu, Y. Lu, Y.-S. Hu, X. Guo, H. Li, X. Huang, Y. Yang, C.-W. Nan, L. Chen, ACS Energy Lett. 2018, 3, 1212.
[20] K. Fu, Y. Gong, Z. Fu, H. Xie, Y. Yao, B. Liu, M. Carter, E. Wachsman, L. Hu, Angew. Chem., Int. Ed. 2017, 56, 14942.
[21] W. Luo, Y. Gong, Y. Zhu, Y. Li, Y. Yao, Y. Zhang, K. Fu, G. Pastel, C.-F. Lin, Y. Mo, E. D. Wachsman, L. Hu, Adv. Mater. 2017, 29, 1606042.
[22] W. Luo, Y. Gong, Y. Zhu, K. K. Fu, J. Dai, S. D. Lacey, C. Wang, B. Liu, X. Han, Y. Mo, E. D. Wachsman, L. Hu, J. Am. Chem. Soc. 2016, 138, 12258.
[23] M. He, Z. Cui, C. Chen, Y. Li, X. Guo, J. Mater. Chem. A 2018, 6, 11463.
[24] A. Junji, T. Akira, K. Kunimitsu, K. Norihito, I. Yasushi, A. Junji, Chem. Lett. 2011, 40, 60.
[25] Y. Chen, E. Rangasamy, C. Liang, K. An, Chem. Mater. 2015, 27, 5491.[26] K. P. C. Yao, D. G. Kwabi, R. A. Quinlan, A. N. Mansour, A. Grimaud,
Y.-L. Lee, Y.-C. Lu, Y. Shao-Horn, J. Electrochem. Soc. 2013, 160, A824.[27] W. K. Liu, W. T. Yuen, R. A. Stradling, J. Vac. Sci. Technol., B: Nano-
technol. Microelectron.: Mater., Process., Meas., Phenom. 1995, 13, 1539.[28] Y. Inaguma, A. Aimi, D. Mori, T. Katsumata, M. Ohtake,
M. Nakayama, M. Yonemura, Inorg. Chem. 2018, 57, 15462.[29] a) S. Shi, Y. Qi, H. Li, L. G. Hector, J. Phys. Chem. C 2013, 117, 8579;
b) R. T. Johnson, R. M. Biefeld, J. D. Keck, Mater. Res. Bull. 1977, 12, 577.[30] J. Sangster, A. D. Pelton, J. Phase Equilibria 1993, 14, 514.[31] W. Weppner, R. A. Huggins, J. Solid State Chem. 1977, 22, 297.[32] a) A. Priebe, I. Utke, L. Pethö, J. Michler, Anal. Chem. 2019, 91,
11712; b) A. Priebe, E. Huszar, M. Nowicki, L. Pethö, J. Michler, Anal. Chem. 2021, 93, 10261.
[33] a) A. Priebe, L. Pethö, J. Michler, Anal. Chem. 2020, 92, 2121; b) A. Priebe, T. Xie, L. Pethö, J. Michler, J. Anal. At. Spectrom. 2020, 35, 2997.
[34] T. Yang, Y. Li, W. Wu, Z. Cao, W. He, Y. Gao, J. Liu, G. Li, Ceram. Int. 2018, 44, 1538.
[35] T. Krauskopf, F. H. Richter, W. G. Zeier, J. Janek, Chem. Rev. 2020, 120, 7745.
[36] E. Dologlou, Glass Phys. Chem. 2010, 36, 570.[37] W. Weppner, R. A. Huggins, J. Electrochem. Soc. 1977, 124, 1569.[38] R. H. Brugge, R. J. Chater, J. A. Kilner, A. Aguadero, J. Phys. Energy
2021, 3, 034001.[39] S. A. Pervez, G. Kim, B. P. Vinayan, M. A. Cambaz, M. Kuenzel,
M. Hekmatfar, M. Fichtner, S. Passerini, Small 2020, 16, 2000279.[40] Y. Wang, K. Takahashi, K. H. Lee, G. Z. Cao, Adv. Funct. Mater. 2006,
16, 1133.[41] J. Wu, I. Byrd, C. Jin, J. Li, H. Chen, T. Camp, R. Bujol, A. Sharma,
H. Zhang, ChemElectroChem 2017, 4, 1181.[42] A. Priebe, L. Pethö, E. Huszar, T. Xie, I. Utke, J. Michler, ACS Appl.
for Adv. Energy Mater., DOI: 10.1002/aenm.202102086
Building a Better Li-Garnet Solid Electrolyte/Metallic LiInterface with Antimony
Romain Dubey, Jordi Sastre, Claudia Cancellieri, FarukOkur, Alexander Forster, Lea Pompizii, AgnieszkaPriebe, Yaroslav E. Romanyuk, Lars P. H. Jeurgens,Maksym V. Kovalenko,* and Kostiantyn V. Kravchyk*
Supporting Information
Building a Better Li-Garnet Solid Electrolyte/Metallic Li Interface with Antimony