Page 1
©Mentor Plus 2014 All Rights Reserved
Building a Customer Focused Business Dashboard
What you can measure you can manage.
Presenter: Edi Osborne, CEO Mentor Plus Business Intuitive
Scaling New Heights 2014 San Antonio, Texas
Page 2
©Mentor Plus 2014 All Rights Reserved
©Mentor Plus 2014 All Rights Reserved
What we’ll cover: You’ll learn how to: • Communicate the value of having a balanced perspective on
the business • Develop key performance measures to populate any
dashboard • Facilitate a Cycle of Customer Interaction (CCI) session with
your clients and your own firm. • How to elevate mission critical activities to the level of
performance standards.
Scaling New Heights 2014 Scaling New Heights 2014
Page 3
©Mentor Plus 2014 All Rights Reserved
“If you can measure that of which you speak, and can express it by a number, you know something of your
subject; but if you cannot measure it, your knowledge is meager and unsatisfactory.”
- William Thomson, Lord Kelvin
1st Baron Kelvin of Largs (1824–1907) British physicist, Kelvin scale of temperature
quoted in Stigler, The History of Statistics, p.1
Scaling New Heights 2014
Page 4
©Mentor Plus 2014 All Rights Reserved
Building Your Business Dashboard
Presented by: Insert your name here
Page 5
©Mentor Plus 2014 All Rights Reserved
Over the years, with the introduction of super highways, more cars on the road,
and consumers demanding to drive more reliable vehicles, dashboards have
gotten much more sophisticated.
Page 6
©Mentor Plus 2014 All Rights Reserved
Similarly, today’s businesses being operated on the information super highway, along with ever increasing
competition and demands from consumers, has lead to the development
of a more sophisticated business dashboard.
Page 7
©Mentor Plus 2014 All Rights Reserved
©Mentor Plus 2014 All Rights Reserved
What is a Business Dashboard?
Ideally, it is a centralized reporting mechanism that provides real-time performance feedback about
activities that are critically important in helping a company achieve specific goals.
Real-time feedback gives decision makers the
opportunity to react to issues BEFORE they become problems.
Page 8
©Mentor Plus 2014 All Rights Reserved
©Mentor Plus 2014 All Rights Reserved
Today’s business dashboard not only provides for more indicators than its early predecessors, it also provides a balance of both leading and lagging indicators.
Here’s what we mean . . .
Page 9
©Mentor Plus 2014 All Rights Reserved
©Mentor Plus 2014 All Rights Reserved
Traditional Management Dashboard Model
If you want to measure success the focus is on:
Revenue – Expenses = Profit
(Lagging Indicators)
Page 10
©Mentor Plus 2014 All Rights Reserved
©Mentor Plus 2014 All Rights Reserved
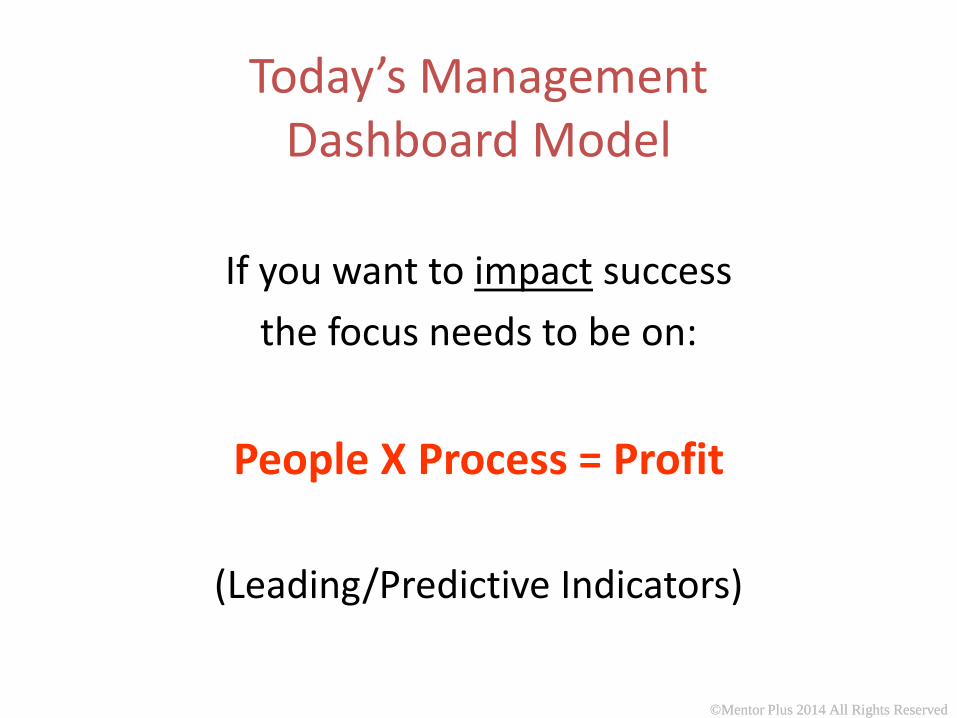
Today’s Management Dashboard Model
If you want to impact success the focus needs to be on:
People X Process = Profit
(Leading/Predictive Indicators)
Page 11
©Mentor Plus 2014 All Rights Reserved
©Mentor Plus 2014 All Rights Reserved
It’s the difference between focusing on what has already happened
and what needs to be done.
Another way to think about it . . .
Page 12
©Mentor Plus 2014 All Rights Reserved
©Mentor Plus 2014 All Rights Reserved
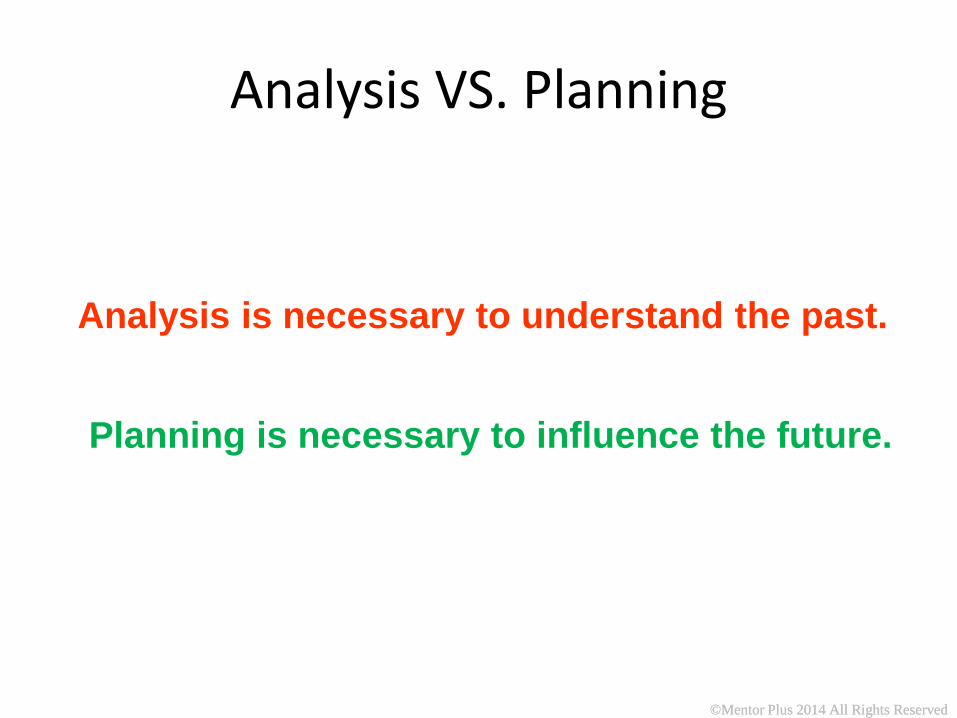
Analysis VS. Planning
Analysis is necessary to understand the past.
Planning is necessary to influence the future.
Page 13
©Mentor Plus 2014 All Rights Reserved
©Mentor Plus 2014 All Rights Reserved
Building Your Business Dashboard
Establishing a Plan
Data
1) Collecting Data
Knowledge
3) Knowledge through Analysis
Information
2) Organizing Information
Wisdom
4) Applied Wisdom
Page 14
©Mentor Plus 2014 All Rights Reserved
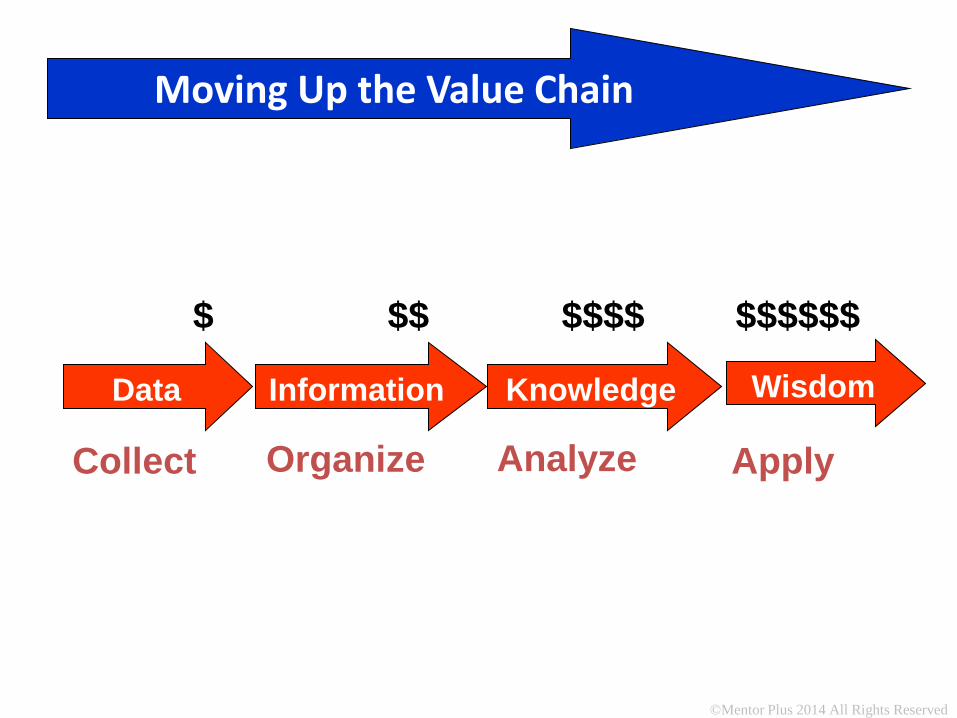
Moving Up the Value Chain
Collect
Data
$
Analyze
Knowledge
$$$$
Apply
Wisdom
Organize
Information
$$ $$$$$$
Page 15
©Mentor Plus 2014 All Rights Reserved
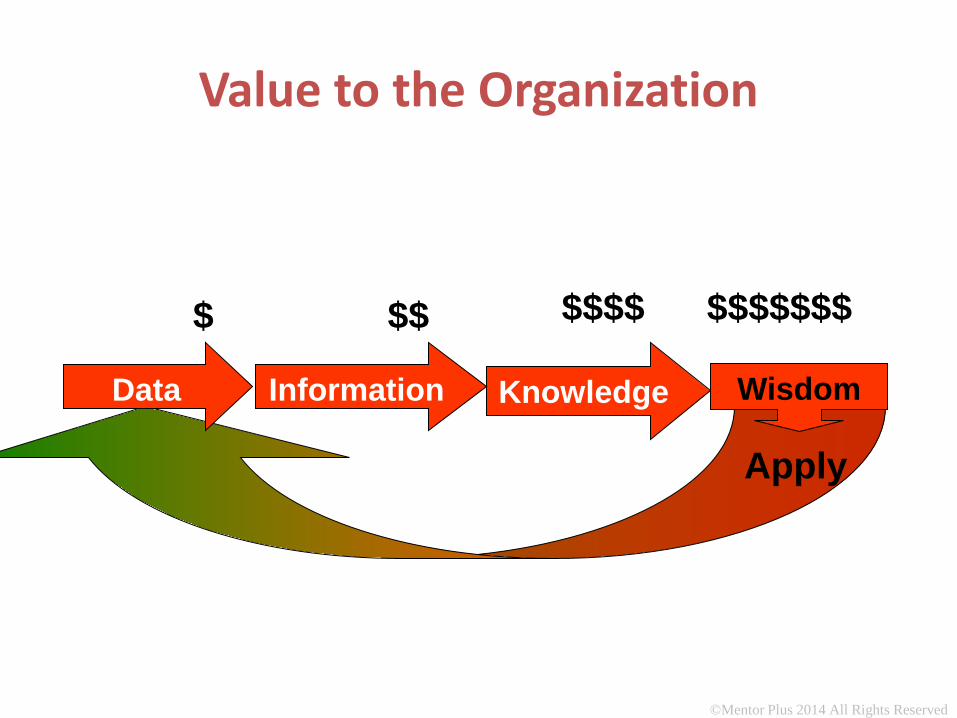
Value to the Organization
Data
$
Knowledge
$$$$
Apply
Wisdom
$$$$$$$
Information
$$
Page 16
©Mentor Plus 2014 All Rights Reserved
Establishing a Plan
Page 17
©Mentor Plus 2014 All Rights Reserved
Starting with the question:
In five years you’ll arrive, the question is where?
Page 18
©Mentor Plus 2014 All Rights Reserved
©Mentor Plus 2014 All Rights Reserved
What is your vision?
What are your goals?
What strategy will you employ to achieve your goals?
Page 19
©Mentor Plus 2014 All Rights Reserved
©Mentor Plus 2014 All Rights Reserved
Vision without action is merely a dream. Action without vision just passes the time. Vision with action can change the world.
- Joel Barker
Page 20
©Mentor Plus 2014 All Rights Reserved
Step 1 Collecting Data
Collect
Data
Analyze
Knowledge
Apply
Wisdom
Organize
Information
Page 21
©Mentor Plus 2014 All Rights Reserved
©Mentor Plus 2014 All Rights Reserved
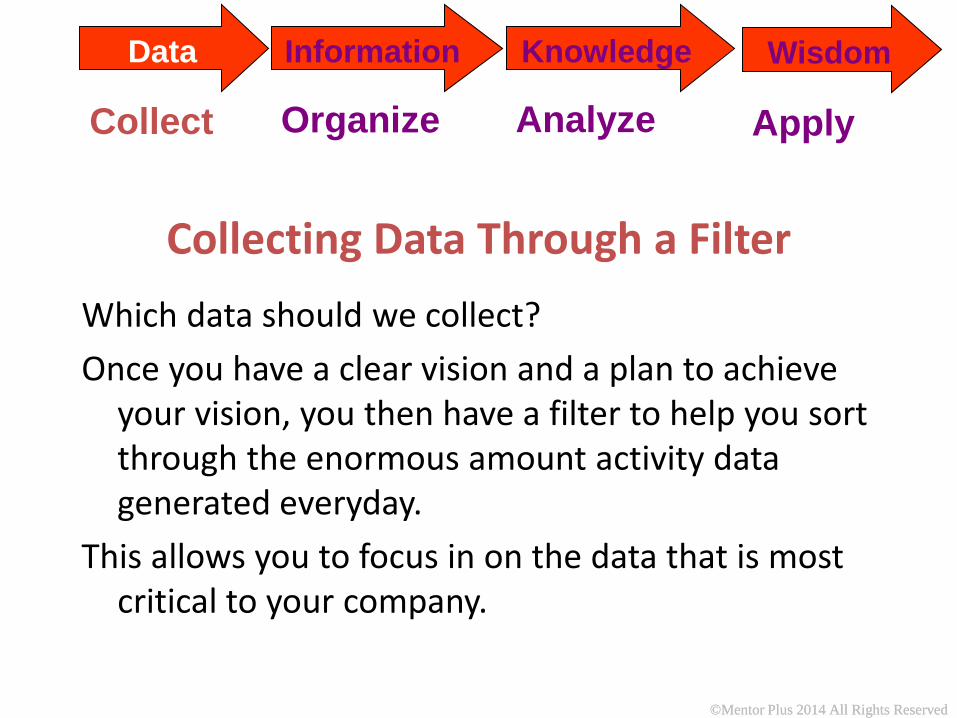
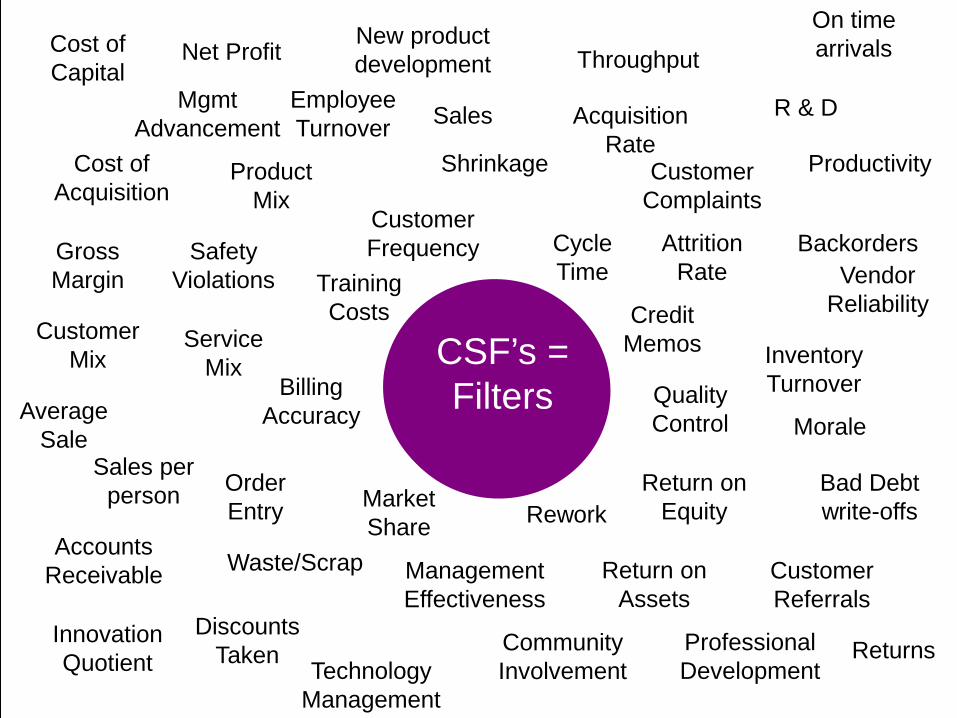
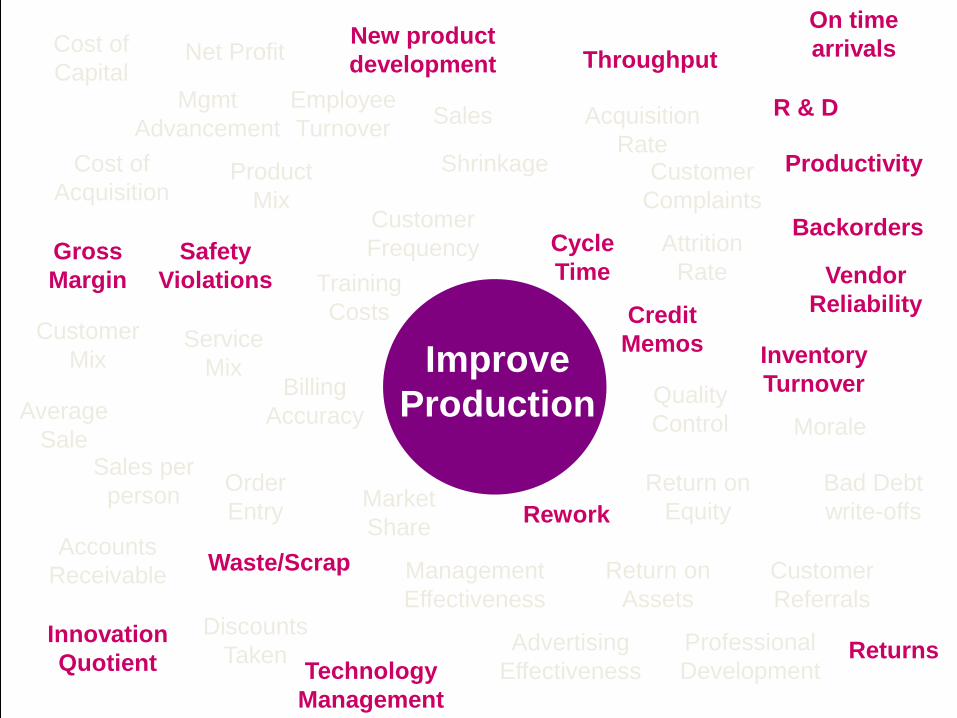
Collecting Data Through a Filter Which data should we collect? Once you have a clear vision and a plan to achieve
your vision, you then have a filter to help you sort through the enormous amount activity data generated everyday.
This allows you to focus in on the data that is most critical to your company.
Collect
Data
Analyze
Knowledge
Apply
Wisdom
Organize
Information
Page 22
©Mentor Plus 2014 All Rights Reserved
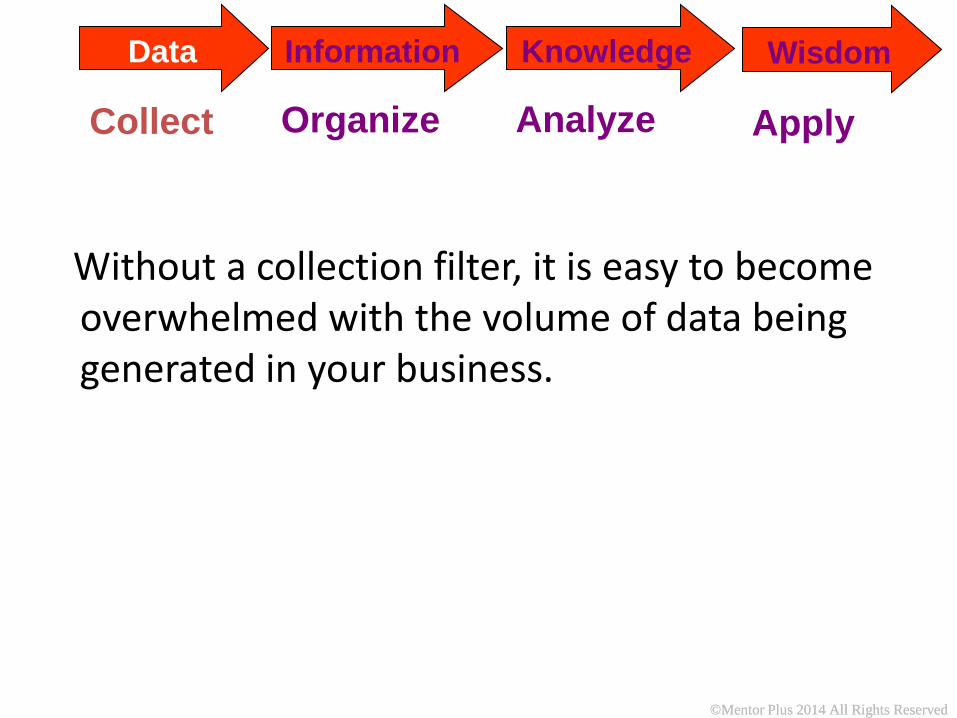
©Mentor Plus 2014 All Rights Reserved
Without a collection filter, it is easy to become overwhelmed with the volume of data being generated in your business.
Collect
Data
Analyze
Knowledge
Apply
Wisdom
Organize
Information
Page 23
©Mentor Plus 2014 All Rights Reserved
©Mentor Plus 2014 All Rights Reserved
Business Activities spin off
data
Billing Accuracy
Sales per person
Discounts Taken
Bad Debt write-offs
Cycle Time
Average Sale
Mgmt Advancement
Rework
Productivity Cost of Acquisition
Customer Mix
Order Entry
Customer Referrals
Inventory Turnover
Customer Frequency
Community Involvement
Acquisition Rate
Net Profit
Safety Violations
On time arrivals
Sales
Backorders
Management Effectiveness
Service Mix
Technology Management
Quality Control
Accounts Receivable
Cost of Capital Throughput
Customer Complaints
Vendor Reliability
Return on Equity
Credit Memos
Employee Turnover
Morale
Return on Assets
Innovation Quotient Returns
Gross Margin
Product Mix
Professional Development
Waste/Scrap
Shrinkage
Attrition Rate
Market Share
New product development
Training Costs
R & D
CSF’s = Filters
Page 24
©Mentor Plus 2014 All Rights Reserved
©Mentor Plus 2014 All Rights Reserved
Improve Cash Flow
Cost of Acquisition
Safety Violations
Customer Mix
Customer Complaints
On time arrivals
Sales per person
Vendor Reliability
Sales
Credit Memos
Order Entry
Employee Turnover
Backorders
Morale
Customer Referrals
Management Effectiveness
Discounts Taken
Innovation Quotient Returns
Gross Margin
Cycle Time
Inventory Turnover
Product Mix
Service Mix
Average Sale
Customer Frequency
Technology Management
Advertising Effectiveness
Professional Development
Quality Control
Mgmt Advancement
Rework
Waste/Scrap
Shrinkage Productivity
Attrition Rate
Acquisition Rate
Market Share
Billing Accuracy
Return on Equity
Return on Assets
Bad Debt write-offs
Accounts Receivable
Net Profit Cost of Capital Throughput
New product development
Training Costs
R & D
Page 25
©Mentor Plus 2014 All Rights Reserved
©Mentor Plus 2014 All Rights Reserved
Increase Market Share
Cost of Acquisition
Safety Violations
Customer Mix
Customer Complaints
On time arrivals
Sales per person
Vendor Reliability
Sales
Credit Memos
Order Entry
Employee Turnover
Backorders
Morale
Customer Referrals
Management Effectiveness
Discounts Taken
Innovation Quotient Returns
Gross Margin
Cycle Time
Inventory Turnover
Product Mix
Service Mix
Average Sale
Customer Frequency
Technology Management
Advertising Effectiveness
Professional Development
Quality Control
Mgmt Advancement
Rework
Waste/Scrap
Shrinkage Productivity
Attrition Rate
Acquisition Rate
Market Share
Billing Accuracy
Return on Equity
Return on Assets
Bad Debt write-offs
Accounts Receivable
Net Profit Cost of Capital Throughput
New product development
Training Costs
R & D
Page 26
©Mentor Plus 2014 All Rights Reserved
©Mentor Plus 2014 All Rights Reserved
Improve Production
Cost of Acquisition
Safety Violations
Customer Mix
Customer Complaints
On time arrivals
Sales per person
Vendor Reliability
Sales
Credit Memos
Order Entry
Employee Turnover
Backorders
Morale
Customer Referrals
Management Effectiveness
Discounts Taken
Innovation Quotient Returns
Gross Margin
Cycle Time
Inventory Turnover
Product Mix
Service Mix
Average Sale
Customer Frequency
Technology Management
Advertising Effectiveness
Professional Development
Quality Control
Mgmt Advancement
Rework
Waste/Scrap
Shrinkage Productivity
Attrition Rate
Acquisition Rate
Market Share
Billing Accuracy
Return on Equity
Return on Assets
Bad Debt write-offs
Accounts Receivable
Net Profit Cost of Capital Throughput
New product development
Training Costs
R & D
Page 27
©Mentor Plus 2014 All Rights Reserved
©Mentor Plus 2014 All Rights Reserved
Improve Profitability
Cost of Acquisition
Safety Violations
Customer Mix
Customer Complaints
On time arrivals
Sales per person
Vendor Reliability
Sales
Credit Memos
Order Entry
Employee Turnover
Backorders
Morale
Customer Referrals
Management Effectiveness
Discounts Taken
Innovation Quotient Returns
Gross Margin
Cycle Time
Inventory Turnover
Product Mix
Service Mix
Average Sale
Customer Frequency
Technology Management
Advertising Effectiveness
Professional Development
Quality Control
Mgmt Advancement
Rework
Waste/Scrap
Shrinkage Productivity
Attrition Rate
Acquisition Rate
Market Share
Billing Accuracy
Return on Equity
Return on Assets
Bad Debt write-offs
Accounts Receivable
Net Profit Cost of Capital Throughput
New product development
Training Costs
R & D
Page 28
©Mentor Plus 2014 All Rights Reserved
©Mentor Plus 2014 All Rights Reserved
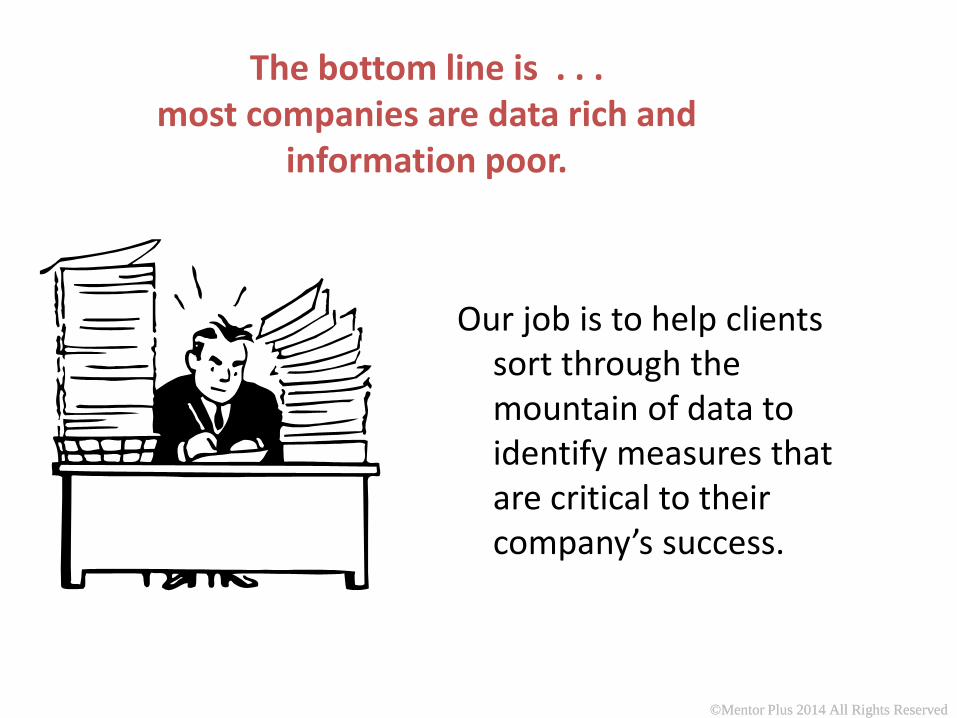
The bottom line is . . . most companies are data rich and
information poor.
Our job is to help clients sort through the mountain of data to identify measures that are critical to their company’s success.
Page 29
©Mentor Plus 2014 All Rights Reserved
©Mentor Plus 2014 All Rights Reserved
When gathering and organizing measures there are four things to keep in mind:
1. Baseline Measurement – Hawthorne Effect
2. Standardized Data – Performance Standards – Documented Procedures
3. Multi-dimensional approach to identifying critical measures
– Cycle of Customer Interaction – Process Mapping – Hierarchy of Measures – Benchmarks
4. Ownership – Involved – Accountable – Easy to understand – Empowered to Innovate
Page 30
©Mentor Plus 2014 All Rights Reserved
You don’t grow companies. You grow people and people grow companies.
author unknown
Page 31
©Mentor Plus 2014 All Rights Reserved
Step 2 Organizing Information
Collect
Data
Analyze
Knowledge
Apply
Wisdom
Organize
Information
Page 32
©Mentor Plus 2014 All Rights Reserved
Once we’ve figured out which data is most relevant to the specific goals of your company, the next step is to construct your business dashboard so you can access the information you need to manage your business more effectively.
Collect
Data
Analyze
Knowledge
Apply
Wisdom
Organize
Information
Page 33
©Mentor Plus 2014 All Rights Reserved
Total Sales
New Customers
50
40
30
20
10
Productivity 120%
100%
90%
75%
1%
5%
10%
T
T
T T
T
Your Business Dashboard
Check Engine!!!
Today’s Critical Numbers
Page 34
©Mentor Plus 2014 All Rights Reserved
©Mentor Plus 2014 All Rights Reserved
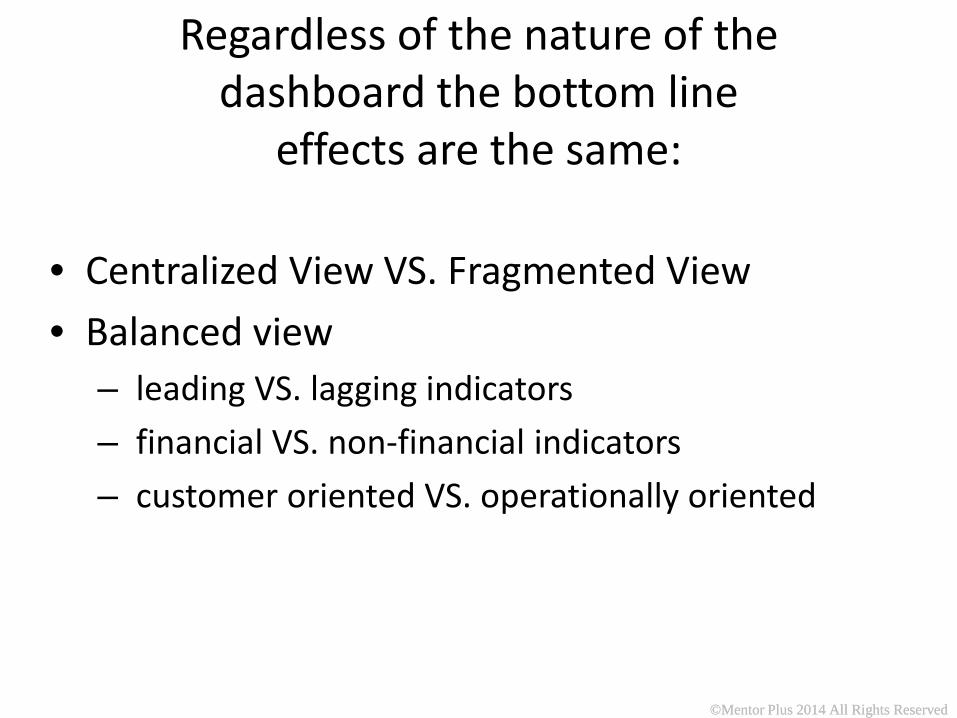
Regardless of the nature of the dashboard the bottom line
effects are the same: • Centralized View VS. Fragmented View
• Balanced view – leading VS. lagging indicators – financial VS. non-financial indicators – customer oriented VS. operationally oriented
Page 35
©Mentor Plus 2014 All Rights Reserved
Step 3 Knowledge through Analysis
Collect
Data
Analyze
Knowledge
Apply
Wisdom
Organize
Information
Page 36
©Mentor Plus 2014 All Rights Reserved
Asking questions will get you the performance you are after far better than dictating
demands.
- Dan James (1951– ) American Entrepreneur, Composer, Inventor, College
Educator, Sales Manager
Page 37
©Mentor Plus 2014 All Rights Reserved
©Mentor Plus 2014 All Rights Reserved
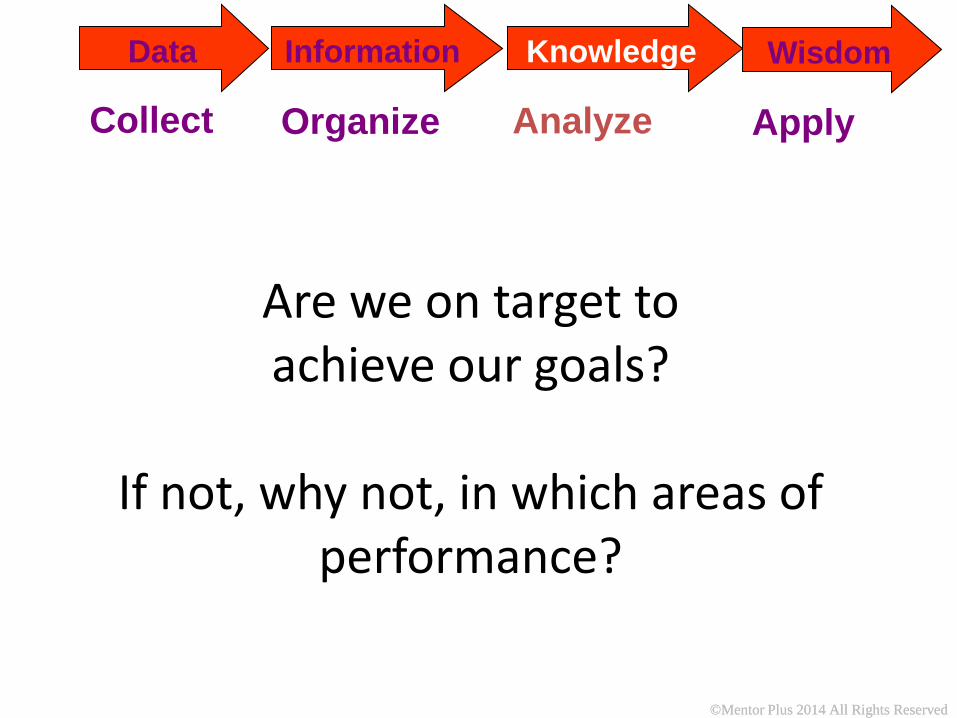
Are we on target to achieve our goals?
If not, why not, in which areas of
performance?
Collect
Data
Analyze
Knowledge
Apply
Wisdom
Organize
Information
Page 38
©Mentor Plus 2014 All Rights Reserved
©Mentor Plus 2014 All Rights Reserved
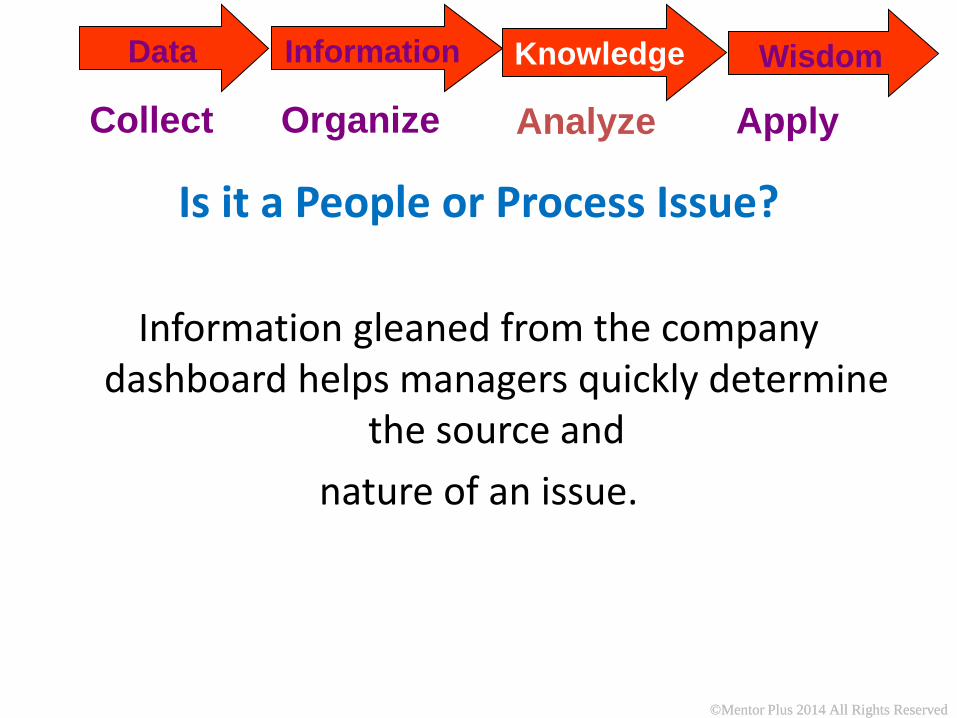
Is it a People or Process Issue?
Information gleaned from the company dashboard helps managers quickly determine
the source and nature of an issue.
Collect
Data
Analyze
Knowledge
Apply
Wisdom
Organize
Information
Page 39
©Mentor Plus 2014 All Rights Reserved
©Mentor Plus 2014 All Rights Reserved
Armed with specific knowledge to address a given issue the next step is to respond to the issue BEFORE it becomes a problem.
Collect
Data
Analyze
Knowledge
Apply
Wisdom
Organize
Information
Page 40
©Mentor Plus 2014 All Rights Reserved
Step 4 Applied Wisdom
Collect
Data
Analyze
Knowledge
Apply
Wisdom
Organize
Information
Page 41
©Mentor Plus 2014 All Rights Reserved
©Mentor Plus 2014 All Rights Reserved
Applied Wisdom employs experience, innovation, and science.
• Experience serves as a reference for what has happened in the past.
• Innovation stimulates the opportunity to do it better in the future.
• Science determines which approach will yield the greatest leverage.
Collect
Data
Analyze
Knowledge
Apply
Wisdom
Organize
Information
Page 42
©Mentor Plus 2014 All Rights Reserved
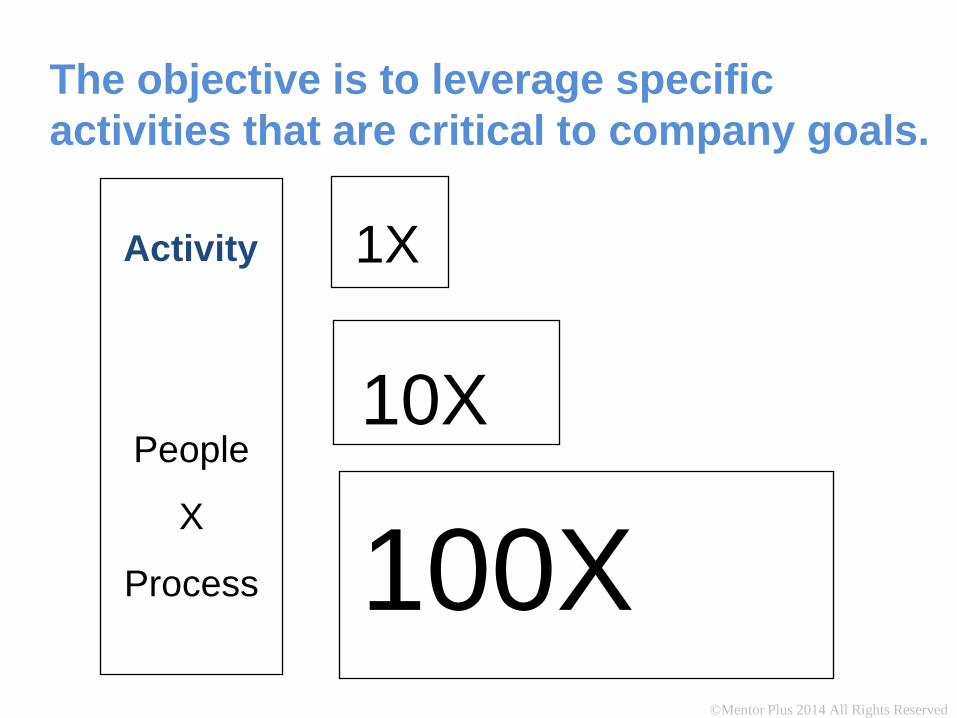
Activity
People
X
Process
1X
10X
100X
The objective is to leverage specific activities that are critical to company goals.
Page 43
©Mentor Plus 2014 All Rights Reserved
©Mentor Plus 2014 All Rights Reserved
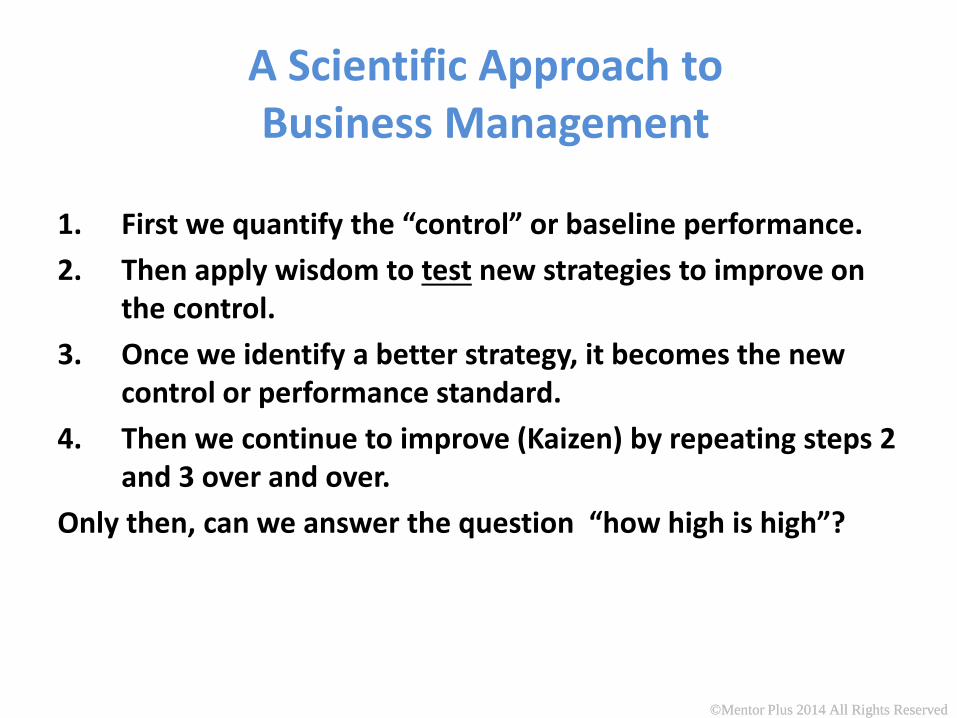
A Scientific Approach to Business Management
1. First we quantify the “control” or baseline performance. 2. Then apply wisdom to test new strategies to improve on
the control. 3. Once we identify a better strategy, it becomes the new
control or performance standard. 4. Then we continue to improve (Kaizen) by repeating steps 2
and 3 over and over. Only then, can we answer the question “how high is high”?
Page 44
©Mentor Plus 2014 All Rights Reserved
©Mentor Plus 2014 All Rights Reserved
Applied Wisdom serves as a platform for Kaizen (Continuous Improvement).
This ultimately serves to leverage both the
people and processes of an organization.
Collect
Data
Analyze
Knowledge
Apply
Wisdom
Organize
Information
Page 45
©Mentor Plus 2014 All Rights Reserved
If you find a good solution and become attached to it, the solution may become
your next problem.
- Dr. Robert Anthony American management educator,
author, US assistant secretary of defense
Page 46
©Mentor Plus 2014 All Rights Reserved
©Mentor Plus 2014 All Rights Reserved
If you can’t measure it, you can’t manage it. If you can’t manage it, you can’t leverage it. That which gets measured, gets done. That which gets rewarded, gets done again.
Collect
Data
Analyze
Knowledge
Apply
Wisdom
Organize
Information
Page 47
©Mentor Plus 2014 All Rights Reserved
©Mentor Plus 2014 All Rights Reserved
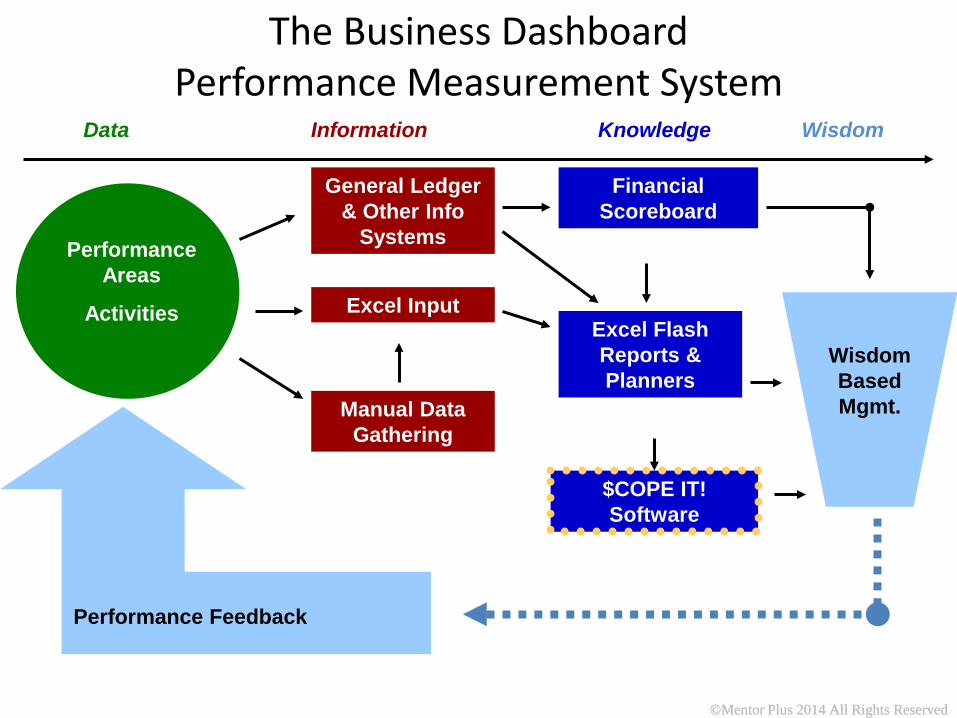
Data Information Knowledge Wisdom
The Business Dashboard Performance Measurement System
Manual Data Gathering
General Ledger & Other Info
Systems
Excel Input
Financial Scoreboard
Excel Flash Reports & Planners
$COPE IT! Software
Wisdom Based Mgmt.
Performance Feedback
Performance Areas
Activities
Page 48
©Mentor Plus 2014 All Rights Reserved
©Mentor Plus 2014 All Rights Reserved
The Process Reviewed Establishing a Plan 1) Collecting Data 2) Organizing Information 3) Knowledge through Analysis 4) Applied Wisdom
Collect
Data
Analyze
Knowledge
Apply
Wisdom
Organize
Information
Page 49
©Mentor Plus 2014 All Rights Reserved
©Mentor Plus 2014 All Rights Reserved
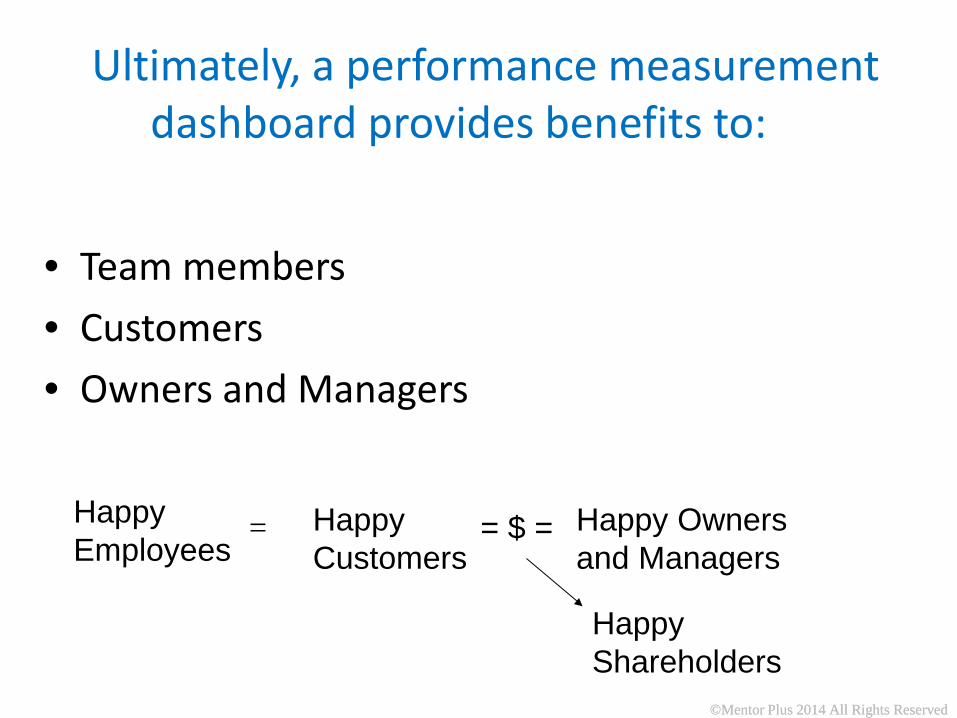
Ultimately, a performance measurement dashboard provides benefits to:
• Team members • Customers • Owners and Managers
Happy Employees
Happy Customers
Happy Owners and Managers
= = $ =
Happy Shareholders
Page 50
©Mentor Plus 2014 All Rights Reserved
People perform best when they understand the “rules of play” and
the scoring method is clear.
The people side of performance measurement . . .
Page 51
©Mentor Plus 2014 All Rights Reserved
©Mentor Plus 2014 All Rights Reserved
The customer side of performance measurement . . .
Customers can expect a consistently positive experience from an
organization where the “rules of play” are followed.
Page 52
©Mentor Plus 2014 All Rights Reserved
©Mentor Plus 2014 All Rights Reserved
The owner/manager side of performance measurement . . .
A business that provides clear expectations and real-time
performance feedback can be managed on a real-time basis and
therefore, has greater control over its destiny.
Page 53
©Mentor Plus 2014 All Rights Reserved
©Mentor Plus 2014 All Rights Reserved
The shareholder side of performance measurement . . .
Businesses that operate with leading indicators are better predictors and managers of
future outcomes.
Page 54
©Mentor Plus 2014 All Rights Reserved
Where performance is measured, performance improves. Where performance is measured and reported, the rate of improvement accelerates.
- Thomas S. Monson (1927– ) American religious leader, advertising executive,
MBA & honorary doctorate from BYU © by Intellectual Reserve, Inc. Used by permission.
Page 55
©Mentor Plus 2014 All Rights Reserved
Mapping the Customer Cycle of Interaction
Page 56
©Mentor Plus 2014 All Rights Reserved
©Mentor Plus 2014 All Rights Reserved
Your client’s perspective is the only reality that matters.
Page 57
©Mentor Plus 2014 All Rights Reserved
©Mentor Plus 2014 All Rights Reserved
Facilitation Benefits:
• Learn to map the customer experience • Get everyone on the “same page” • Optimize growth opportunities • Eliminate wasted efforts • Create a WOW experience! • Create a great lasting impression
Page 58
©Mentor Plus 2014 All Rights Reserved
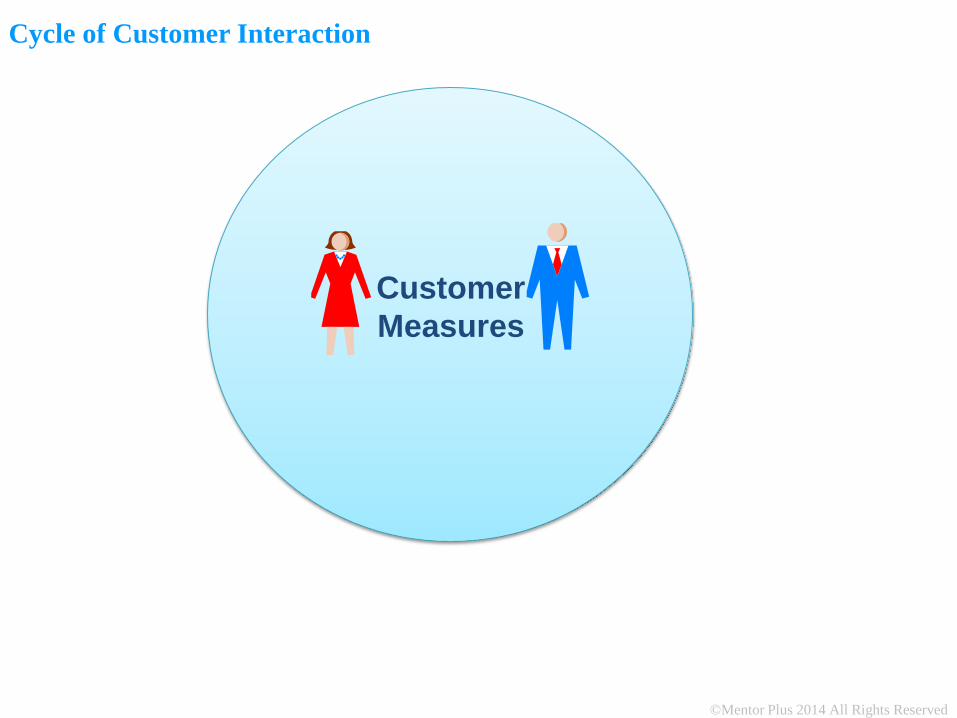
Customer Measures
Process Cycle of Customer Interaction
Page 59
©Mentor Plus 2014 All Rights Reserved
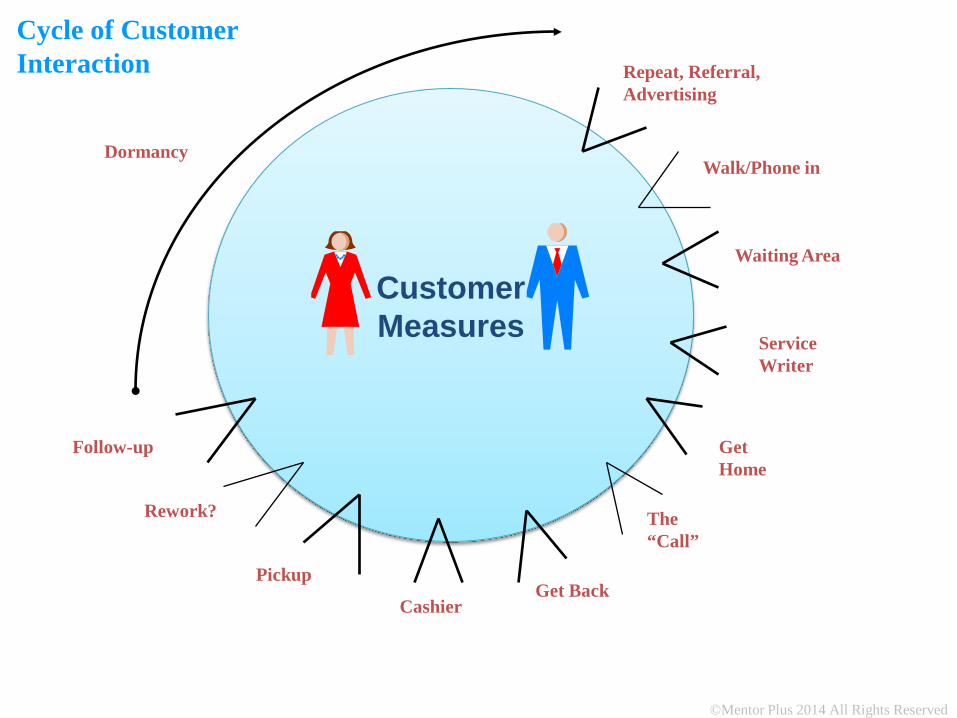
Repeat, Referral, Advertising
Walk/Phone in
Waiting Area
Service Writer
Get Home
The “Call”
Get Back Cashier
Rework?
Pickup
Follow-up
Customer Measures
Dormancy
Process Cycle of Customer Interaction
Page 60
©Mentor Plus 2014 All Rights Reserved
Cycle of Customer Interaction
Operational Measures
Repeat, Referral, Advertising
Walk/Phone in
Waiting Area
Service Writer
Get Home
The “Call”
Get Back Cashier
Rework?
Pickup
Follow-up
Dormancy
WOW Delight
Memorable
Customer Measures
Process
Page 61
©Mentor Plus 2014 All Rights Reserved
Cycle of Customer Interaction
Operational Measures
Repeat, Referral, Advertising
Walk/Phone in
Waiting Area
Service Writer
Get Home
The “Call”
Get Back Cashier
Rework?
Pickup
Follow-up
Dormancy
Delight
Memorable
Customer Measures
WOW
Process
Page 62
©Mentor Plus 2014 All Rights Reserved
Waiting Area
Waiting Area
• Goal - 5 min. or less wait • Set Performance Standards • Outline Supporting Operational
Procedures • Set up Monitoring/Reporting Feedback
Systems • Set up Reward Systems
Process Cycle of Customer Interaction
Page 63
©Mentor Plus 2014 All Rights Reserved
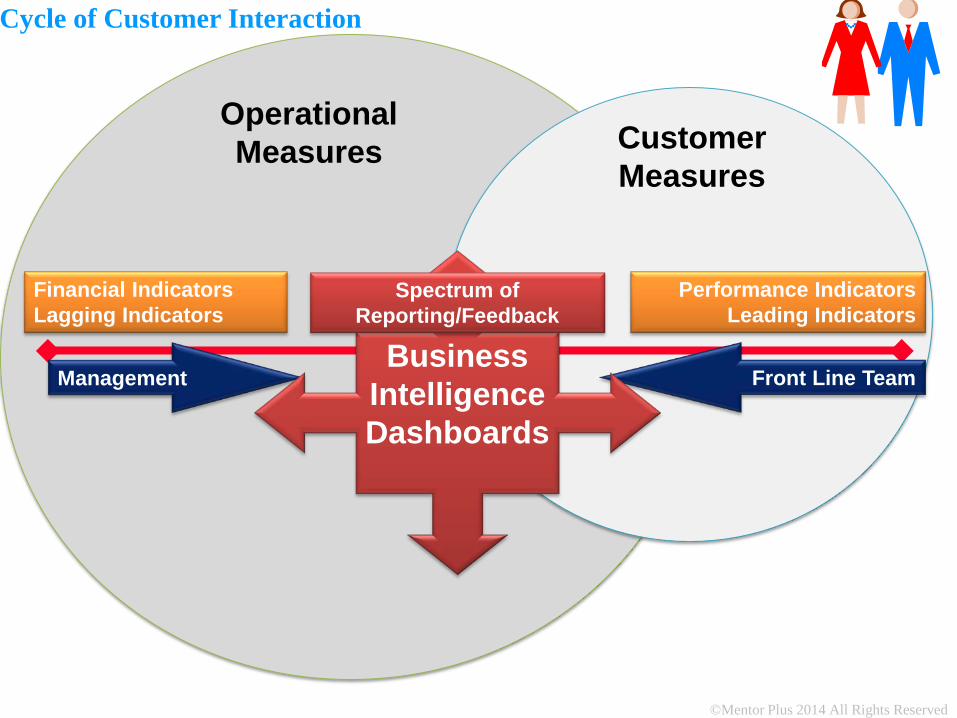
Cycle of Customer Interaction
Customer Measures
Financial Indicators Lagging Indicators
Performance Indicators Leading Indicators
Management Front Line Team Business
Intelligence Dashboards
Spectrum of Reporting/Feedback
Operational Measures
Page 64
©Mentor Plus 2014 All Rights Reserved
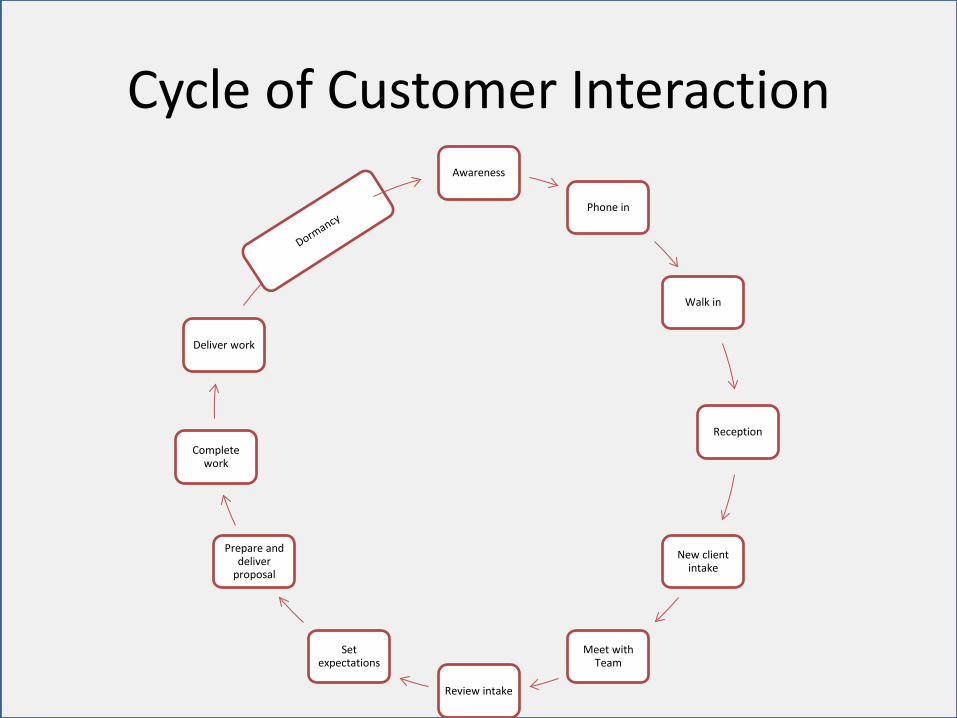
Cycle of Customer Interaction Awareness
Phone in
Walk in
Reception
New client intake
Meet with Team
Review intake
Set expectations
Prepare and deliver
proposal
Complete work
Deliver work
Page 65
©Mentor Plus 2014 All Rights Reserved
©Mentor Plus 2014 All Rights Reserved
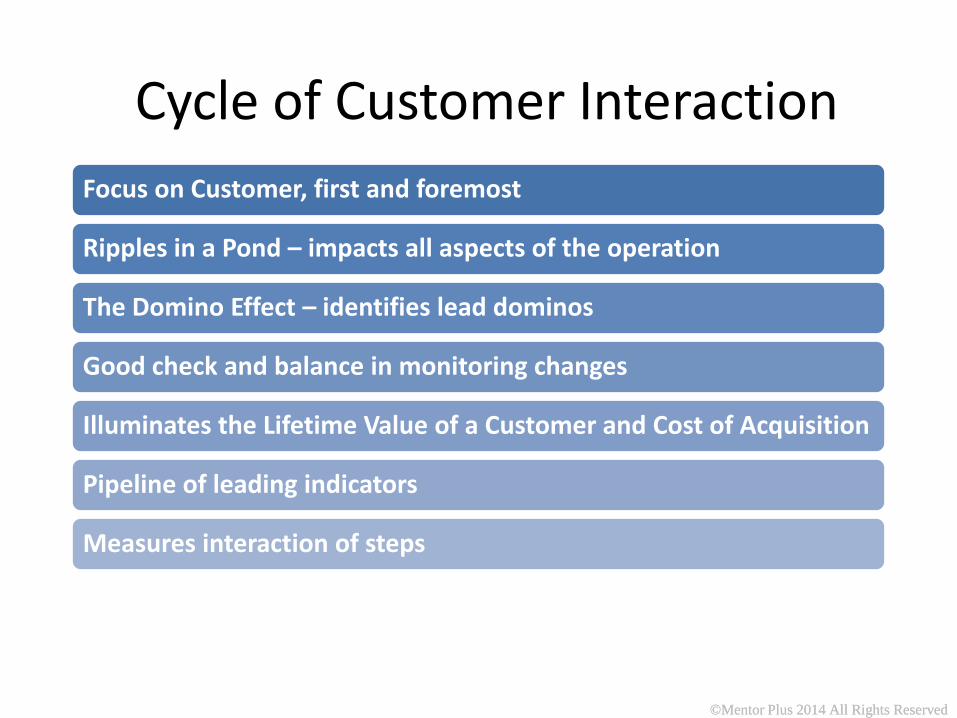
Cycle of Customer Interaction Focus on Customer, first and foremost
Ripples in a Pond – impacts all aspects of the operation
The Domino Effect – identifies lead dominos
Good check and balance in monitoring changes
Illuminates the Lifetime Value of a Customer and Cost of Acquisition
Pipeline of leading indicators
Measures interaction of steps
Process Step 2 Mapping the Measures
Page 66
©Mentor Plus 2014 All Rights Reserved
©Mentor Plus 2014 All Rights Reserved
Taking the Cycle of Customer Interaction a step further . . .
We can help clients translate critical activities into company performance standards. This creates an environment where the “rules of
play” are very clear.
Page 67
©Mentor Plus 2014 All Rights Reserved
©Mentor Plus 2014 All Rights Reserved
Science and Standards
Performance Standards lead to more consistent, reliable performance measures.
The key to implementing successful Performance Standards is getting “buy-in” from the team.
The team needs to take ownership of the process. Their performance needs to be measured, recognized, and appropriately rewarded.
Concepts
Page 68
©Mentor Plus 2014 All Rights Reserved
©Mentor Plus 2014 All Rights Reserved
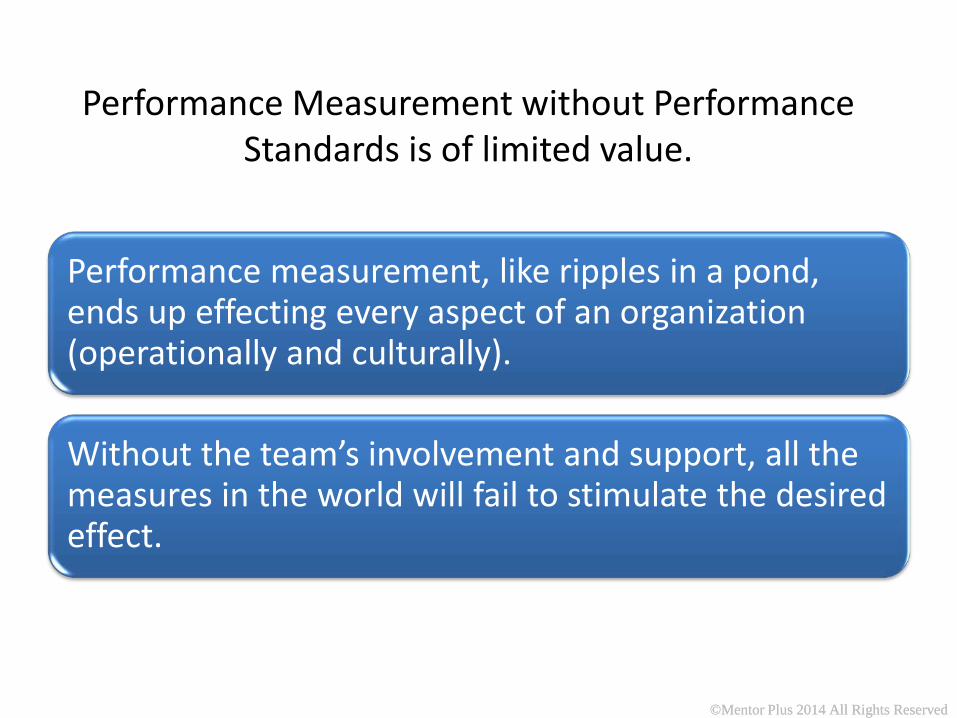
Performance Measurement without Performance Standards is of limited value.
Performance measurement, like ripples in a pond, ends up effecting every aspect of an organization (operationally and culturally).
Without the team’s involvement and support, all the measures in the world will fail to stimulate the desired effect.
Concepts
Page 69
©Mentor Plus 2014 All Rights Reserved
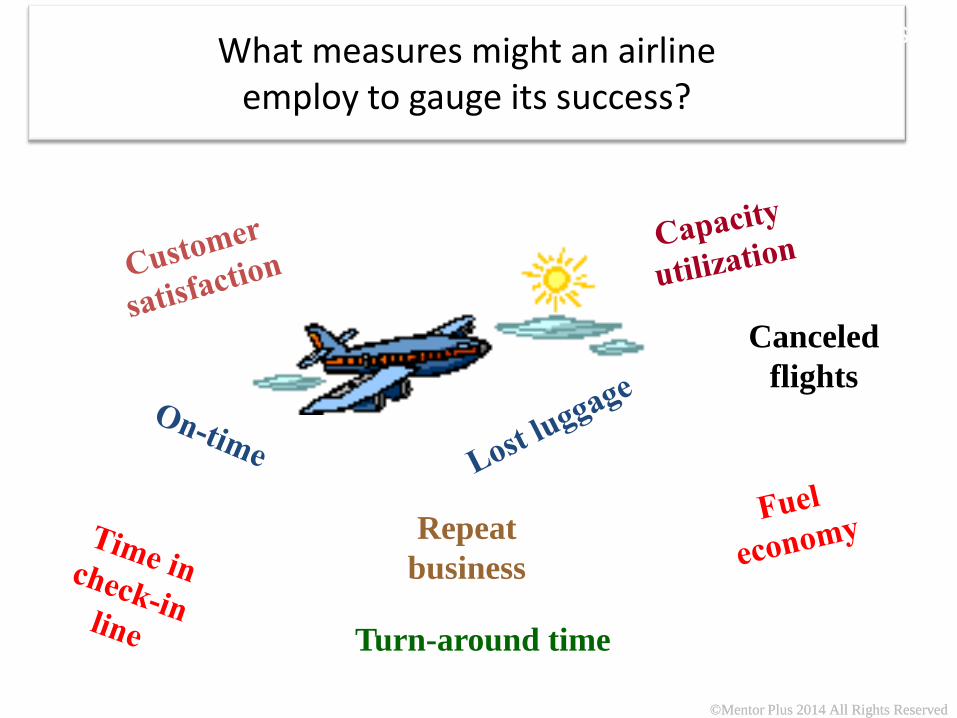
How is it that some airlines out perform others?
Is it their people or their process?
Concepts
Page 70
©Mentor Plus 2014 All Rights Reserved
©Mentor Plus 2014 All Rights Reserved
What measures might an airline employ to gauge its success?
Repeat business
Canceled flights
Turn-around time
Concepts
Page 71
©Mentor Plus 2014 All Rights Reserved
It’s Both People and Process
People and Process are a reflection of the values of an organization. The values are the (the unspoken rules) heart of company culture.
Concepts
Page 72
©Mentor Plus 2014 All Rights Reserved
©Mentor Plus 2014 All Rights Reserved
Happy Employees Yield Happy Customers
Any given team will value their customers only as much as they feel
valued by their teammates and their leaders.
Concepts
Page 73
©Mentor Plus 2014 All Rights Reserved
The key to consistently delivering Fabled Service* resides with the team.
“We support their efforts by establishing clear and meaningful Performance Standards and giving the tools and
training needed to act on them.”
*Betsy Sanders, “Mother” of Nordstrom Customer Service Author: Fabled Service
Concepts
Page 74
©Mentor Plus 2014 All Rights Reserved
©Mentor Plus 2014 All Rights Reserved
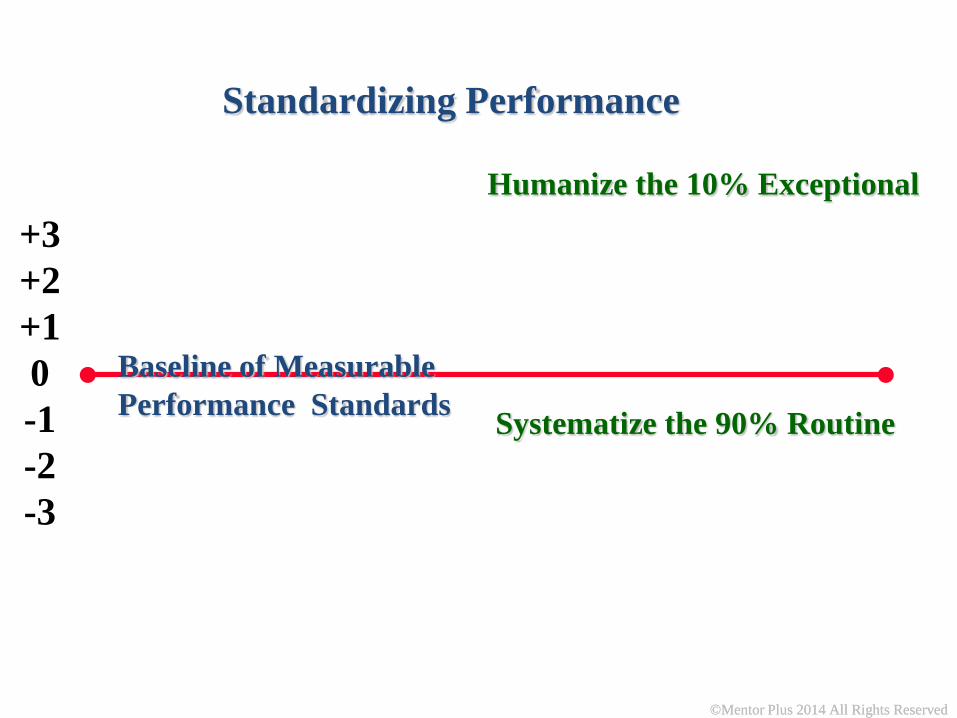
Standardizing Performance
Baseline of Measurable Performance Standards Systematize the 90% Routine
Humanize the 10% Exceptional
Concepts
+3 +2 +1 0 -1 -2 -3
Page 75
©Mentor Plus 2014 All Rights Reserved
Employees are very good at living up to our lack of expectations.
Who is at fault?
Page 76
©Mentor Plus 2014 All Rights Reserved
©Mentor Plus 2014 All Rights Reserved
Examples of Performance Standards
• Painting contractor’s “List of Permissions” • Accounting Firm Audit “List of Permissions”
Page 77
©Mentor Plus 2014 All Rights Reserved
You don’t grow companies. You grow people and
people grow companies.
author unknown
Page 78
©Mentor Plus 2014 All Rights Reserved
©Mentor Plus 2014 All Rights Reserved
Moments of Truth Jan Carlzon
“Our goal is not to make one thing 1000% better but to make 1000 things 1% better.”
Page 79
©Mentor Plus 2014 All Rights Reserved
©Mentor Plus 2014 All Rights Reserved
Take Away Tools
• Step-by-Step how to conduct a Cycle of Customer Interaction instructions
• Sample CCI based Key Performance Indicators for Dentist and Plummer
Page 80
©Mentor Plus 2014 All Rights Reserved
©Mentor Plus 2014 All Rights Reserved
Session Wrap-up
• A Balanced approach to business management yields sustainable growth
• Business dashboards can be applied to any business, any industry
• We facilitate the process, the client and their team drive the content
• Start with the Cycle of Customer Interaction – elevate 3-5 points of contact to Performance Standards
Scaling New Heights 2014
Page 81
©Mentor Plus 2014 All Rights Reserved
Your questions?
My question: What will you take away from this
session?
Scaling New Heights 2014 San Antonio, Texas