Abstract Advances in information technology have led tobehavioral changes in people and submission of curriculumvitae (CV) via the Internet has become an often-seen phe-nomenon. Without any technological support for the filter-ing process, recruitment can be difficult. In this research, amethod combining five-factor personality inventory, supportvector machine (SVM), and multi-criteria decision-making(MCDM) method was proposed to improve the quality ofrecruiting appropriate candidates. The online questionnairepersonality testing developed by the International Person-ality Item Pool (IPIP) was utilized to identify the personaltraits of candidates and both SVM and MCDM were em-ployed to predict and support the decision of personnelchoice. SVM was utilized to predict the fitness of candi-dates, while MCDM was employed to estimate the perfor-mance for a job placement. The results show the proposedsystem provides a qualified matching according to the re-sults collected from enterprise managers.
Over the years, personality trait has already been the bestcheckered reputation as a predictor of work performance.In 2005, over 40 percent of CEOs stated that the most im-portant operational challenge was to find, hire, and retain aqualified employee [12]. About 66 percent of CEOs listedhigh-quality employees as the most important factor con-tributing to the growth of their company [12]. Ultimately,improving the quality of recruitment would allocate the rightpersonnel to the right position, which consequently enablesthe employees to achieve greater work performances andsignificantly reduce the employee training cost. Therefore,a highly qualitative process of employee hiring and alloca-tion would effectively increase the core competitiveness ofthe firms and it is also very beneficial to the firms for facingtoday’s dynamic global marketplace.
Companies are made up of people. In order to operate acompany successfully and smoothly, managers have to hiresuitable employees with different expertise. The cooperationof employees and managers allows the enterprises to achievethe business goal and vision. In order to reach this goal, itis necessary for enterprises to achieve the effective perfor-mance of employees. Effectiveness in work performance be-gins with qualitative employee selection. Therefore, person-nel directors are constantly faced with the problem of choos-ing the appropriate personnel from a mutually exclusiveset of personnel pool. However, it is very time-consumingand laborious to identify candidates with the right potentialtraits. Consequently, an improvement in the quality of hiringcan be a great work performance booster for the organizationand assure the firm of its continual growth.
The match among an employee’s knowledge, skills, andabilities (KSA), and other more abstract characteristics, suchas personality and value orientations, has been used as a ma-
jor recruiting criterion in the past three decades. Personal-ity characteristics and the corresponding measures have in-creasingly been used by human resource professionals andmanagers to evaluate the suitability of job applicants. Hu-man choice behavior could be seen as a process of identify-ing the significant difference between alternatives [23]. Per-sonality characteristics can be utilized to screen personneldifferentiation. Over the years, researchers have acknowl-edged and documented the fact that personality could be agood predictor of work outcomes in a wide variety of jobsranging from skilled, semiskilled to executives. Specifically,the taxonomy of personality characteristics, such as Five-Factor Model (FFM) or the Big Five, has motivated a se-ries of meta-analytic studies. While these studies provideda much more optimistic view of the ability of personalitymeasures to predict job performance, we intend to proposean expert system to facilitate personnel recruitment for hu-man resource development.
Most decision-making problems or choice problemsfaced in the real world fall into the multi-attribute evaluationcategory. For the personnel choice problem, the factors to beconsidered usually include the personality factors, traits andskills that can be seen as the attributes of a person. In ad-dition, recruiting a qualified person or promoting a suitableemployee to a new position could be portrayed as a decision-making process. In the paper, exploiting the learning abilityof the Support Vector Machine (SVM) and the Techniquefor Order Preference by Similarity to Ideal Solution (TOP-SIS) method of multi-criteria decision-making (MCDM),a qualitative personnel recruitment system was proposed.The proposed framework could be used to discover the suit-able work/department for different types of personnel. Also,it could be used to estimate the possible work performanceof personnel, if he/she is located to some specific position.
Personality is one of the most important influential fac-tors when people are facing work pressure. That is, per-sonality significantly affects human behaviors and attitudesin both daily life and work. In this study, personality traitis utilized as a significant element for building the depart-ments’ human resource personality model. This model aimsto predict the fitness of a job position with either current em-ployees or new job applicants. According to the results ofpersonality match and performance prediction, the proposedsystem can give managers valuable suggestions of person-nel recruitment. Managers and the high-level executives canunderstand and discover the potential of existing employeeseasily from the proposed model when they need to carry outjob adjustments within the organization or select the mostappropriate candidates from new applicants. It is especiallyuseful when managers decide to promote a qualified em-ployee to a new job or a new position, or to choose the suit-able employees to form a new team for a specific project.
The remaining part of this paper is organized as follows.Section 2 introduces related works. In Sect. 3 we detail the
whole framework combining FFM personality trait,SVM and MCDM. Section 4 describes the practicalexperiments, and results and evaluations. Section 5 drawsthe conclusions of this study and offers suggestions for fur-ther research.
2 Related work
2.1 Personality trait
Personality is often defined as a group of characteristics thatstructure one’s reactions to oneself. Dunn et al. [13] haveshown that during the hiring decision, managers weight in-dividual personality characteristics as if they were as impor-tant as general mental ability. Furthermore, research showsthat personality contributes incremental validity in the pre-diction of job performance above and beyond that accountedfor by other predictors, including general mental ability andbiodata [28, 30, 32]. Barrick and Mount [2] summarizedthe role of personality at work in seven divergent researchstreams to demonstrate that personality matters because itpredicts and explains the behaviors at work. Thus, in orderto resolve the problem of the match between personality ofemployee and jobs, we focus on the personality trait of can-didates. In addition to conventional “Curriculum Vitae-Job(CV-Job)” matching, we discuss its role in personnel selec-tion and its correction with job performance.
Pre-recruitment activities are increasingly emphasized asthe first step in the hiring process. Beagrie [3] has estimatedthat two thirds of medium to large organizations use somekind of psychological testing, including aptitude as well aspersonality in-job applicant screening. Another survey indi-cates that all top 100 companies in Great Britain reportedusing personality tests as part of their hiring procedure [12,31]. One of the most prevalent reasons for using personal-ity testing is its contribution to improve the fitness betweenpersonality traits of job-seeker and work position. That willfurther increase the work satisfaction rate and reduce theturnover rate. The personality should be examined beforemaking a hiring decision. It appears that personality testinghas been increasingly used as a component of the personnelselection process.
Tzeng et al. [36] used SVM to predict the turnover rateof nurses. Their model used working motivation, job satis-faction, and stress levels as classifiers to predict the intentionof job withdrawal of nurses. However, it did not consider thepersonality of the nurses. In other words, it neglects the per-sonality effect of nurses’ suitability for their job or the workof health care in this study. Hong et al. [16] proposed anothermethod for predicting employees’ stay or leave in an orga-nization according to job performance. In these works, theSVM classifiers only utilize the job performances of staff
Building a qualitative recruitment system via SVM with MCDM approach
as the basis for categorization. The possibility of intentionto leave an organization of a worker is judged according toworking performance alone. The most basic characteristicof people was disregarded. That is, it did not take reasonsfor the lower work performance into account-whether thepersonality of employees is unsuitable for their jobs.
2.2 Personality assessment and five factor model
Seminal work in clarifying the five dimensions has been pro-posed by Costa and McCrae [10]. They developed a modelof personality known as the “Five Factor Model of Person-ality” namely FFM or Big Five trait. FFM reveals small tononexistent mean score differences between the racial orethnic groups [17, 18, 29]. Barrick and Mount [2] arguedthat it is of enormous significance because most organiza-tions are keenly interested in hiring a more diverse work-force. Goodstein and Lanyon also credit the FFM for provid-ing a universally accepted set of dimensions for describinghuman behaviors at work [14].
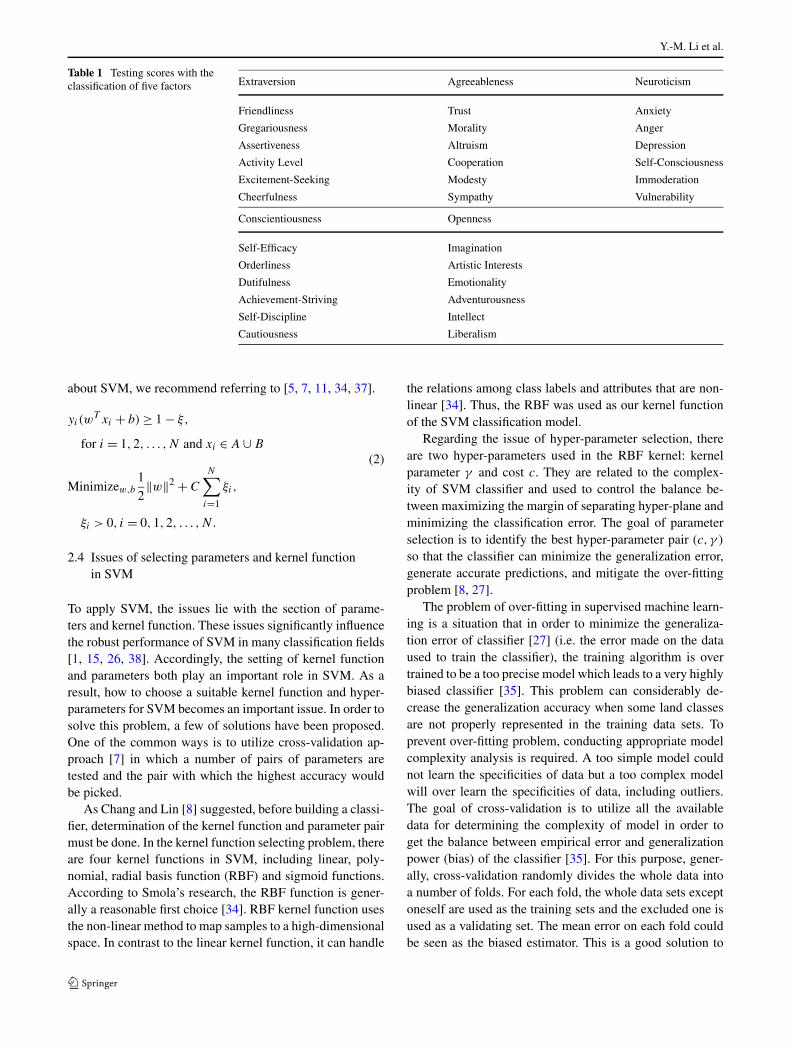
There are five taxonomies of personality characteristicsidentified in this personality assessment model, such asExtraversion, Agreeableness, Emotional Stability, Consci-entiousness, and Openness to Experience. They provide aglobal description of basic personality traits in a more gen-eral construct. After completing the personality assessmentthrough the IPIP-NEO questionnaire, the testing results with30 scores are classified into the five factors as shown in fol-lowing Table 1.
The long-version personality questionnaire developed byIPIP-NEO (International Personality Item Pool Representa-tion of the NEO PI-R) [6] containing 120 items is includedin this study as the personality trait testing tool due to thefollowing reasons:
1. NEO-PI-R’s scales have proven to be useful tools in anumber of applied fields.
2. IPIP representation is freely available in the public do-main.
3. The instrument is relatively short (most people completethe questionnaire in 15–25 minutes) such that it is suit-able for online testing and estimation.
2.3 Support vector machine
The Support Vector Machine (SVM) was derived from theVapnik’s structural risk minimization principle [5, 37] whichis a novel machine learning algorithm for data classificationand regression [11, 22]. It allows large information (trainingset) as a linear or nonlinear combination to divide data forclassification [7]. The basic idea of SVM is to seek the opti-mal separating hyper-plane (support vectors) which is madeup of elements with the ability to distinguish the data fromthe training set. Intuitively, the larger margin between two
hyper-planes can get the higher classification accuracy [7].The optimal separating hyper-plane has the maximal marginto each data group for separating the training data points intoclasses. It could effectively reduce the empirical risk basedon the bounds of the generalization error, i.e. classificationerror on unseen examples [37].
SVM is one of useful supervised machine learning mech-anisms based on classifier training, parameter validating,and performance testing [11]. The classifier training is totransform the training data into a higher dimensional fea-ture space and the parameter validating is to find the op-timal hyper-plane that maximizes the margin between dif-ferent classes by different parameter settings such that anavailable classifier could be achieved. SVM could classifyunknown data into the most appropriate data category/labelaccording to the hyper-plane. Performance testing is basedon the classification accuracy rate determination. One of themain attractions of using SVM is that it is capable of learn-ing in sparse and high-dimensional feature spaces with veryfew training examples. Based on statistical learning algo-rithm, SVM has already been widely employed in many dif-ferent research domains and real-world applications such asbiological information analysis [26], intrusion detection ofinformation security [1, 22, 33], image classification [38],and document categorization [15, 32]. So far, SVM has al-ready become one of the standard tools for machine learningand data mining.
The simplest model of SVM is called the maximal marginclassifier. As shown in (1), SVM attempts to place a linearboundary between the two different classes and to orient thisline in such a way that the margin 1/‖w‖ is maximized [7,37]. SVMs derive a class decision by determining the sepa-rate boundary with maximum distance to the closest points,namely support vectors (SVs), of the training data set.
yi(wT xi + b) ≥ 1,
for i = 1,2, . . . ,N and xi ∈ A ∪ B (1)
Minimizew,b
1
2‖w‖2.
When two classes cannot be completely separated, thisapproach may not be feasible due to overlapping distribu-tion. Therefore, the slack variable ξ is introduced to modifythe maximum margin classifier that allows for misclassifiedexamples. As shown in (2), the generalized optimal marginclassifier, called soft margin classifier, can soften the hardconstraint of separating cases completely. The soft marginclassifier will choose a most possible class for the misclas-sified examples, also keeping the maximum margin to thenearest correct classification examples, if there is no hyper-plane that can clearly split examples. For more information
Y.-M. Li et al.
Table 1 Testing scores with theclassification of five factors Extraversion Agreeableness Neuroticism
Friendliness Trust Anxiety
Gregariousness Morality Anger
Assertiveness Altruism Depression
Activity Level Cooperation Self-Consciousness
Excitement-Seeking Modesty Immoderation
Cheerfulness Sympathy Vulnerability
Conscientiousness Openness
Self-Efficacy Imagination
Orderliness Artistic Interests
Dutifulness Emotionality
Achievement-Striving Adventurousness
Self-Discipline Intellect
Cautiousness Liberalism
about SVM, we recommend referring to [5, 7, 11, 34, 37].
yi(wT xi + b) ≥ 1 − ξ,
for i = 1,2, . . . ,N and xi ∈ A ∪ B
(2)
Minimizew,b
1
2‖w‖2 + C
N∑
i=1
ξi,
ξi > 0, i = 0,1,2, . . . ,N.
2.4 Issues of selecting parameters and kernel functionin SVM
To apply SVM, the issues lie with the section of parame-ters and kernel function. These issues significantly influencethe robust performance of SVM in many classification fields[1, 15, 26, 38]. Accordingly, the setting of kernel functionand parameters both play an important role in SVM. As aresult, how to choose a suitable kernel function and hyper-parameters for SVM becomes an important issue. In order tosolve this problem, a few of solutions have been proposed.One of the common ways is to utilize cross-validation ap-proach [7] in which a number of pairs of parameters aretested and the pair with which the highest accuracy wouldbe picked.
As Chang and Lin [8] suggested, before building a classi-fier, determination of the kernel function and parameter pairmust be done. In the kernel function selecting problem, thereare four kernel functions in SVM, including linear, poly-nomial, radial basis function (RBF) and sigmoid functions.According to Smola’s research, the RBF function is gener-ally a reasonable first choice [34]. RBF kernel function usesthe non-linear method to map samples to a high-dimensionalspace. In contrast to the linear kernel function, it can handle
the relations among class labels and attributes that are non-linear [34]. Thus, the RBF was used as our kernel functionof the SVM classification model.
Regarding the issue of hyper-parameter selection, thereare two hyper-parameters used in the RBF kernel: kernelparameter γ and cost c. They are related to the complex-ity of SVM classifier and used to control the balance be-tween maximizing the margin of separating hyper-plane andminimizing the classification error. The goal of parameterselection is to identify the best hyper-parameter pair (c, γ )
so that the classifier can minimize the generalization error,generate accurate predictions, and mitigate the over-fittingproblem [8, 27].
The problem of over-fitting in supervised machine learn-ing is a situation that in order to minimize the generaliza-tion error of classifier [27] (i.e. the error made on the dataused to train the classifier), the training algorithm is overtrained to be a too precise model which leads to a very highlybiased classifier [35]. This problem can considerably de-crease the generalization accuracy when some land classesare not properly represented in the training data sets. Toprevent over-fitting problem, conducting appropriate modelcomplexity analysis is required. A too simple model couldnot learn the specificities of data but a too complex modelwill over learn the specificities of data, including outliers.The goal of cross-validation is to utilize all the availabledata for determining the complexity of model in order toget the balance between empirical error and generalizationpower (bias) of the classifier [35]. For this purpose, gener-ally, cross-validation randomly divides the whole data intoa number of folds. For each fold, the whole data sets exceptoneself are used as the training sets and the excluded one isused as a validating set. The mean error on each fold couldbe seen as the biased estimator. This is a good solution to
Building a qualitative recruitment system via SVM with MCDM approach
select the parameters for getting the appropriate complexityof classifiers.
2.5 Multi-criteria decision-making
A Multi-Criteria Decision-Making (MCDM) problem is tofind the best, compromised or optimal solution from all fea-sible alternatives evaluated on multiple and usually con-flicting criteria, both quantitative and qualitative [21, 24,25]. MCDM simplify the complex human decision-makingprocess into the distance measure between criteria and al-ternatives. For multiple attribute decision making, TOPSIScan be an appropriate tool [19]. MCDM is employed to se-lect a solution from several alternatives according to variouscriteria. To choose the qualified applicants in terms of sev-eral manager-defined capability preferences and personalityfactors is a MCDM problem. Therefore, the MCDM methodcan be applied to the recruitment process with complex andunintelligible information to support the decision of man-agers.
The technique of order preference by similarity to anideal solution (TOPSIS) is a method of multi-criteria analy-sis model [20]. The basic idea of the TOPSIS is that eachalternative may be viewed as an n-dimensional pattern. Itis developed from the concept that the chosen alternativeshould have the shortest distance from the positive ideal so-lution (PIS) and the farthest from the negative-ideal solu-tion (NIS) for solving a multiple-criteria decision-makingproblem [9]. In short, the ideal solution is composed of allbest values attainable by the criteria, whereas the negativeideal solution is made up of all worst values attainable bythe criteria. In addition, the preference among alternatives isranked according to their similarity to the ideal solutions.The similarity is estimated by the Euclidean distance. Inprinciple, the best alternative should be farthest from theNIS and closest to the PIS. However, an alternative can han-dle the shortest distance from the PIS, but not the farthestEuclidean distance from the NIS [39]. This article does notelaborate on the approach that has been successfully adoptedin several studies. For the detailed processes of the TOPSISmethod, refer to [20, 39].
Suppose that a MCDM problem has m alternativesdenoted as A1,A2, . . . ,Am from which decision-makershave to choose, and also n decision criteria denoted asC1,C2, . . . ,Cn with which alternative performance is mea-sured, a typical MCDM problem can be expressed in matrixformat D as below:
D = [xij ]m×n =
⎡
⎢⎢⎢⎣
C1 C2 · · · Cn
A1 x11 x12 · · · x1n
A2 x21 x22 · · · x2n...
......
...
Am xm1 xm2 · · · xmn
⎤
⎥⎥⎥⎦
m×n
,
i = 1,2, . . . ,m; j = 1,2, . . . , n, (3)
where xij ,∀i, j are the ratings of alternative Ai with respectto criterion Cj .
In order to transform the various criteria scales into anobjective comparable scale, a normalized decision matrix R
is obtained through linear scale transformation:
rij = xij√∑mi=1 x2
ij
, i = 1,2, . . . ,m; j = 1,2, . . . , n
R = [rij ]m×n =
⎡
⎢⎢⎢⎣
C1 C2 · · · Cn
A1 r11 r12 · · · r1n
A2 r21 r22 · · · r2n...
......
...
Am rm1 rm2 · · · rmn
⎤
⎥⎥⎥⎦
m×n
, (4)
i = 1,2, . . . ,m; j = 1,2, . . . , n.
The normalized method above preserves the property thatthe ranges of the normalized to [0,1].
Considering the different importance of each criterion,we can construct the weighted normalized decision matrixW as below:
where wj denotes the relative importance with respect to xj ,and w1,w2, . . . ,wn should satisfy
∑nj=1 wj = 1.
Let A+ and A− denote the PIS and the NIS, respectively.The distance of each alternative from A+ and A− can becurrently calculated as below:
A+ ={(
maxi=1,...,m
vij |j ∈ Cp
),(
mini=1,...,m
vij |j ∈ Cn
)},
(6)A− =
{(max
i=1,...,mvij |j ∈ Cp
),(
mini=1,...,m
vij |j ∈ Cn
)}
Cp and Cn are the set of positive criteria (such as profit)and the set of negative criteria (such as cost) respectively.S+
i denotes the Euclidean Distance between the alternativeand the PIS and S−
i denotes the Euclidean Distance betweenthe alternative and NIS.
S+i =
√√√√n∑
j=1
(vij − v+j )2, S−
i =√√√√
n∑
j=1
(vij − v−j )2, (7)
for i = 1,2, . . . ,m; j = 1,2, . . . , n.
Y.-M. Li et al.
In order to rank the order of all alternatives and the bestsolution can therefore be chosen from among a set of fea-sible alternatives, the positive performance index (PI+) andnegative performance index (PI−) should be estimated asbelow:
PI−i = S−
i
S+i + S−
i
, PI+i = S+
i
S+i + S−
i
. (8)
3 The system framework
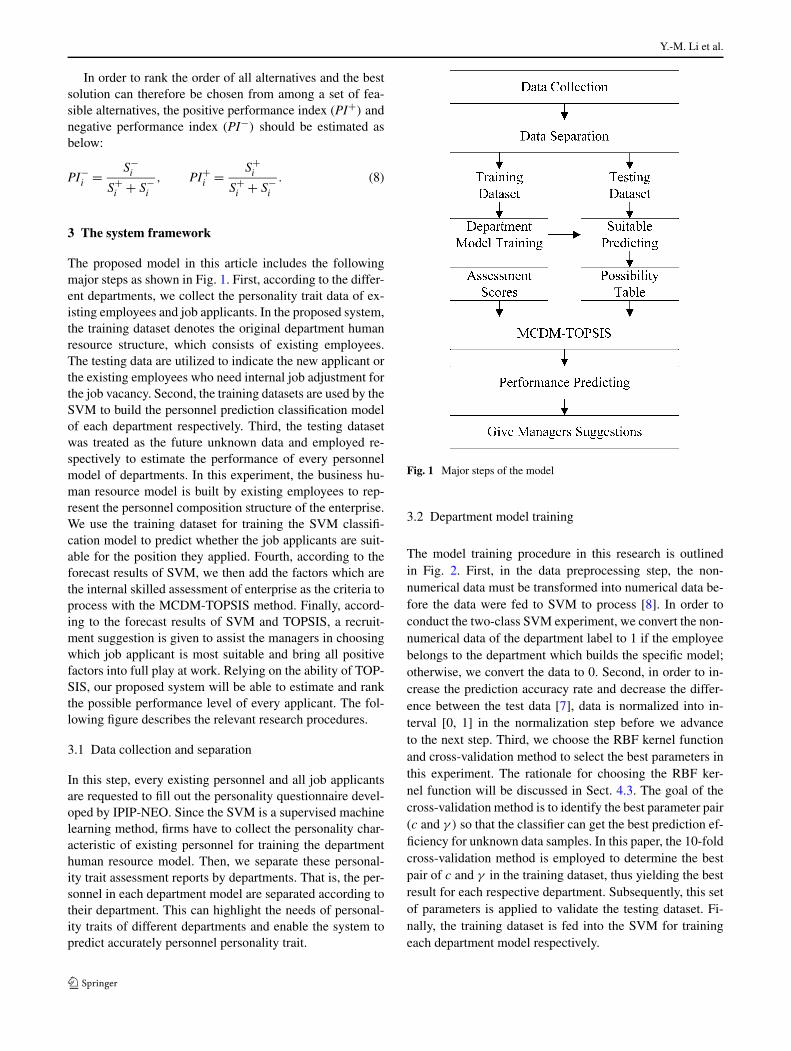
The proposed model in this article includes the followingmajor steps as shown in Fig. 1. First, according to the differ-ent departments, we collect the personality trait data of ex-isting employees and job applicants. In the proposed system,the training dataset denotes the original department humanresource structure, which consists of existing employees.The testing data are utilized to indicate the new applicant orthe existing employees who need internal job adjustment forthe job vacancy. Second, the training datasets are used by theSVM to build the personnel prediction classification modelof each department respectively. Third, the testing datasetwas treated as the future unknown data and employed re-spectively to estimate the performance of every personnelmodel of departments. In this experiment, the business hu-man resource model is built by existing employees to rep-resent the personnel composition structure of the enterprise.We use the training dataset for training the SVM classifi-cation model to predict whether the job applicants are suit-able for the position they applied. Fourth, according to theforecast results of SVM, we then add the factors which arethe internal skilled assessment of enterprise as the criteria toprocess with the MCDM-TOPSIS method. Finally, accord-ing to the forecast results of SVM and TOPSIS, a recruit-ment suggestion is given to assist the managers in choosingwhich job applicant is most suitable and bring all positivefactors into full play at work. Relying on the ability of TOP-SIS, our proposed system will be able to estimate and rankthe possible performance level of every applicant. The fol-lowing figure describes the relevant research procedures.
3.1 Data collection and separation
In this step, every existing personnel and all job applicantsare requested to fill out the personality questionnaire devel-oped by IPIP-NEO. Since the SVM is a supervised machinelearning method, firms have to collect the personality char-acteristic of existing personnel for training the departmenthuman resource model. Then, we separate these personal-ity trait assessment reports by departments. That is, the per-sonnel in each department model are separated according totheir department. This can highlight the needs of personal-ity traits of different departments and enable the system topredict accurately personnel personality trait.
Fig. 1 Major steps of the model
3.2 Department model training
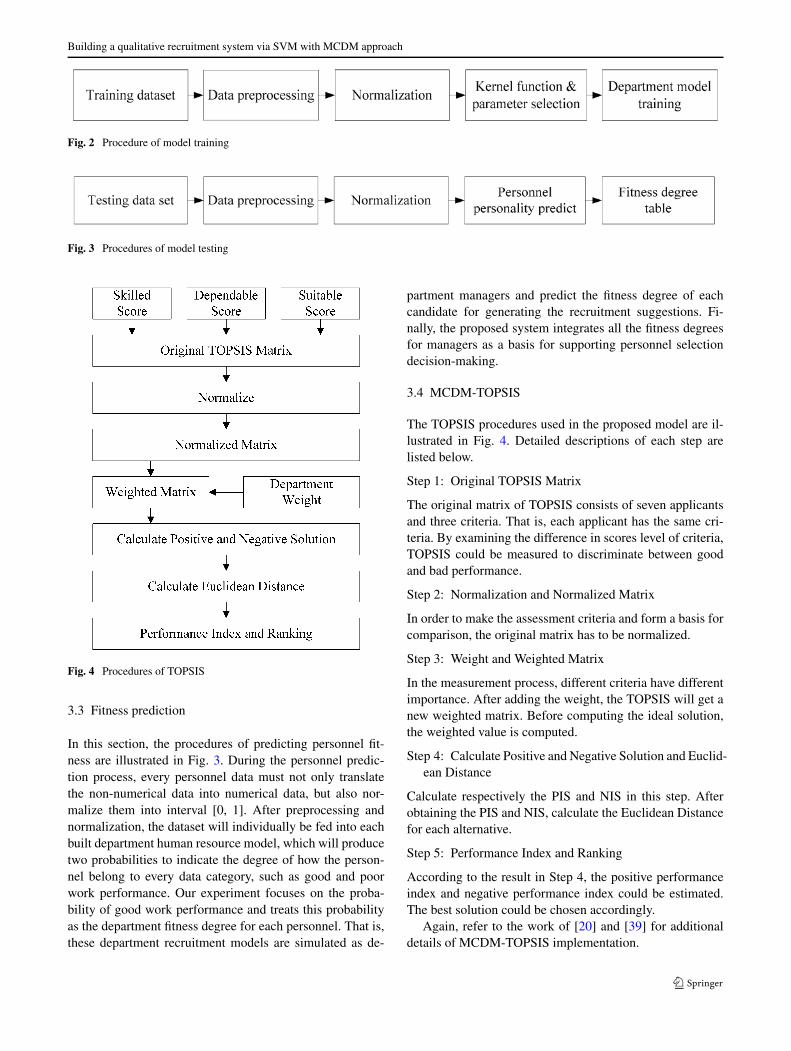
The model training procedure in this research is outlinedin Fig. 2. First, in the data preprocessing step, the non-numerical data must be transformed into numerical data be-fore the data were fed to SVM to process [8]. In order toconduct the two-class SVM experiment, we convert the non-numerical data of the department label to 1 if the employeebelongs to the department which builds the specific model;otherwise, we convert the data to 0. Second, in order to in-crease the prediction accuracy rate and decrease the differ-ence between the test data [7], data is normalized into in-terval [0, 1] in the normalization step before we advanceto the next step. Third, we choose the RBF kernel functionand cross-validation method to select the best parameters inthis experiment. The rationale for choosing the RBF ker-nel function will be discussed in Sect. 4.3. The goal of thecross-validation method is to identify the best parameter pair(c and γ ) so that the classifier can get the best prediction ef-ficiency for unknown data samples. In this paper, the 10-foldcross-validation method is employed to determine the bestpair of c and γ in the training dataset, thus yielding the bestresult for each respective department. Subsequently, this setof parameters is applied to validate the testing dataset. Fi-nally, the training dataset is fed into the SVM for trainingeach department model respectively.
Building a qualitative recruitment system via SVM with MCDM approach
Fig. 2 Procedure of model training
Fig. 3 Procedures of model testing
Fig. 4 Procedures of TOPSIS
3.3 Fitness prediction
In this section, the procedures of predicting personnel fit-ness are illustrated in Fig. 3. During the personnel predic-tion process, every personnel data must not only translatethe non-numerical data into numerical data, but also nor-malize them into interval [0, 1]. After preprocessing andnormalization, the dataset will individually be fed into eachbuilt department human resource model, which will producetwo probabilities to indicate the degree of how the person-nel belong to every data category, such as good and poorwork performance. Our experiment focuses on the proba-bility of good work performance and treats this probabilityas the department fitness degree for each personnel. That is,these department recruitment models are simulated as de-
partment managers and predict the fitness degree of eachcandidate for generating the recruitment suggestions. Fi-nally, the proposed system integrates all the fitness degreesfor managers as a basis for supporting personnel selectiondecision-making.
3.4 MCDM-TOPSIS
The TOPSIS procedures used in the proposed model are il-lustrated in Fig. 4. Detailed descriptions of each step arelisted below.
Step 1: Original TOPSIS Matrix
The original matrix of TOPSIS consists of seven applicantsand three criteria. That is, each applicant has the same cri-teria. By examining the difference in scores level of criteria,TOPSIS could be measured to discriminate between goodand bad performance.
Step 2: Normalization and Normalized Matrix
In order to make the assessment criteria and form a basis forcomparison, the original matrix has to be normalized.
Step 3: Weight and Weighted Matrix
In the measurement process, different criteria have differentimportance. After adding the weight, the TOPSIS will get anew weighted matrix. Before computing the ideal solution,the weighted value is computed.
Step 4: Calculate Positive and Negative Solution and Euclid-ean Distance
Calculate respectively the PIS and NIS in this step. Afterobtaining the PIS and NIS, calculate the Euclidean Distancefor each alternative.
Step 5: Performance Index and Ranking
According to the result in Step 4, the positive performanceindex and negative performance index could be estimated.The best solution could be chosen accordingly.
Again, refer to the work of [20] and [39] for additionaldetails of MCDM-TOPSIS implementation.
Y.-M. Li et al.
4 Experiment and results
4.1 Data description
The dataset used in this study is collected from a real busi-ness environment. Empirical dataset regarding the job per-formance of employees is given by an enterprise, whichhas already become the most scaled IC and LCD precisionequipment manufacturer since 1978. The enterprise fromwhich our used data collected is located in northern Taiwanand has many different service sites in central and southernTaiwan and China. In order to conduct this study, this firmprovided their work performance scores of job assessmentand the skill evaluation values of employees in seven differ-ent departments.
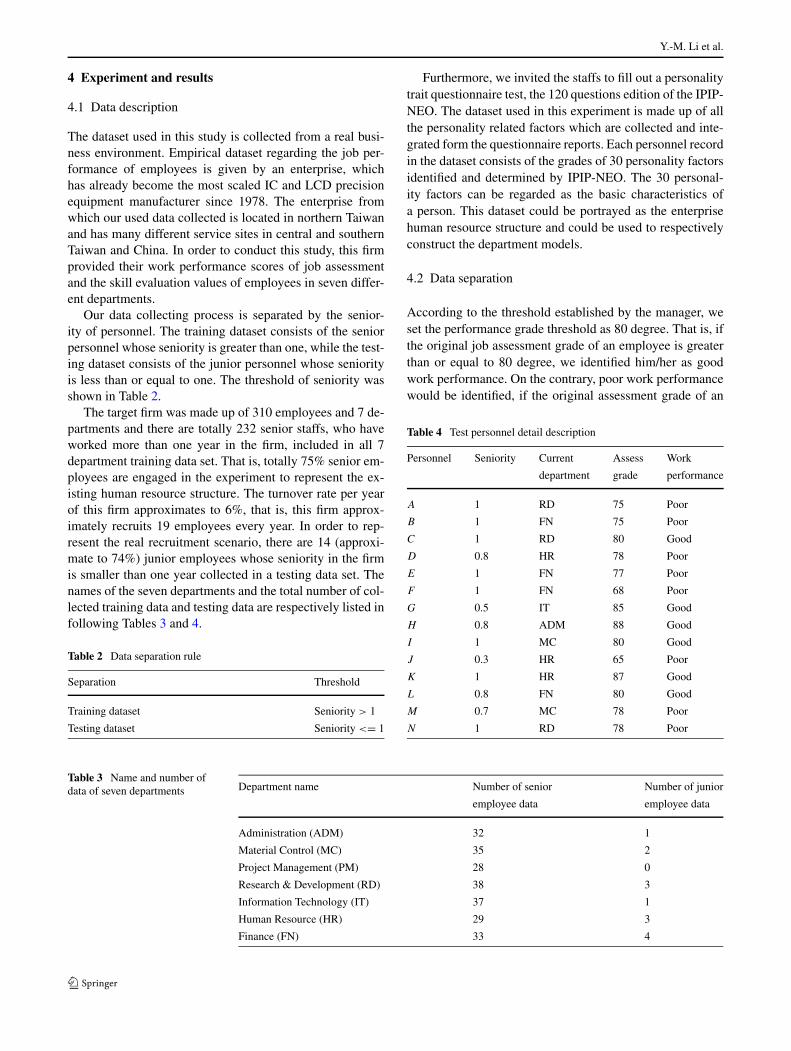
Our data collecting process is separated by the senior-ity of personnel. The training dataset consists of the seniorpersonnel whose seniority is greater than one, while the test-ing dataset consists of the junior personnel whose seniorityis less than or equal to one. The threshold of seniority wasshown in Table 2.
The target firm was made up of 310 employees and 7 de-partments and there are totally 232 senior staffs, who haveworked more than one year in the firm, included in all 7department training data set. That is, totally 75% senior em-ployees are engaged in the experiment to represent the ex-isting human resource structure. The turnover rate per yearof this firm approximates to 6%, that is, this firm approx-imately recruits 19 employees every year. In order to rep-resent the real recruitment scenario, there are 14 (approxi-mate to 74%) junior employees whose seniority in the firmis smaller than one year collected in a testing data set. Thenames of the seven departments and the total number of col-lected training data and testing data are respectively listed infollowing Tables 3 and 4.
Table 2 Data separation rule
Separation Threshold
Training dataset Seniority > 1
Testing dataset Seniority <= 1
Furthermore, we invited the staffs to fill out a personalitytrait questionnaire test, the 120 questions edition of the IPIP-NEO. The dataset used in this experiment is made up of allthe personality related factors which are collected and inte-grated form the questionnaire reports. Each personnel recordin the dataset consists of the grades of 30 personality factorsidentified and determined by IPIP-NEO. The 30 personal-ity factors can be regarded as the basic characteristics ofa person. This dataset could be portrayed as the enterprisehuman resource structure and could be used to respectivelyconstruct the department models.
4.2 Data separation
According to the threshold established by the manager, weset the performance grade threshold as 80 degree. That is, ifthe original job assessment grade of an employee is greaterthan or equal to 80 degree, we identified him/her as goodwork performance. On the contrary, poor work performancewould be identified, if the original assessment grade of an
Table 4 Test personnel detail description
Personnel Seniority Current Assess Work
department grade performance
A 1 RD 75 Poor
B 1 FN 75 Poor
C 1 RD 80 Good
D 0.8 HR 78 Poor
E 1 FN 77 Poor
F 1 FN 68 Poor
G 0.5 IT 85 Good
H 0.8 ADM 88 Good
I 1 MC 80 Good
J 0.3 HR 65 Poor
K 1 HR 87 Good
L 0.8 FN 80 Good
M 0.7 MC 78 Poor
N 1 RD 78 Poor
Table 3 Name and number ofdata of seven departments Department name Number of senior Number of junior
employee data employee data
Administration (ADM) 32 1
Material Control (MC) 35 2
Project Management (PM) 28 0
Research & Development (RD) 38 3
Information Technology (IT) 37 1
Human Resource (HR) 29 3
Finance (FN) 33 4
Building a qualitative recruitment system via SVM with MCDM approach
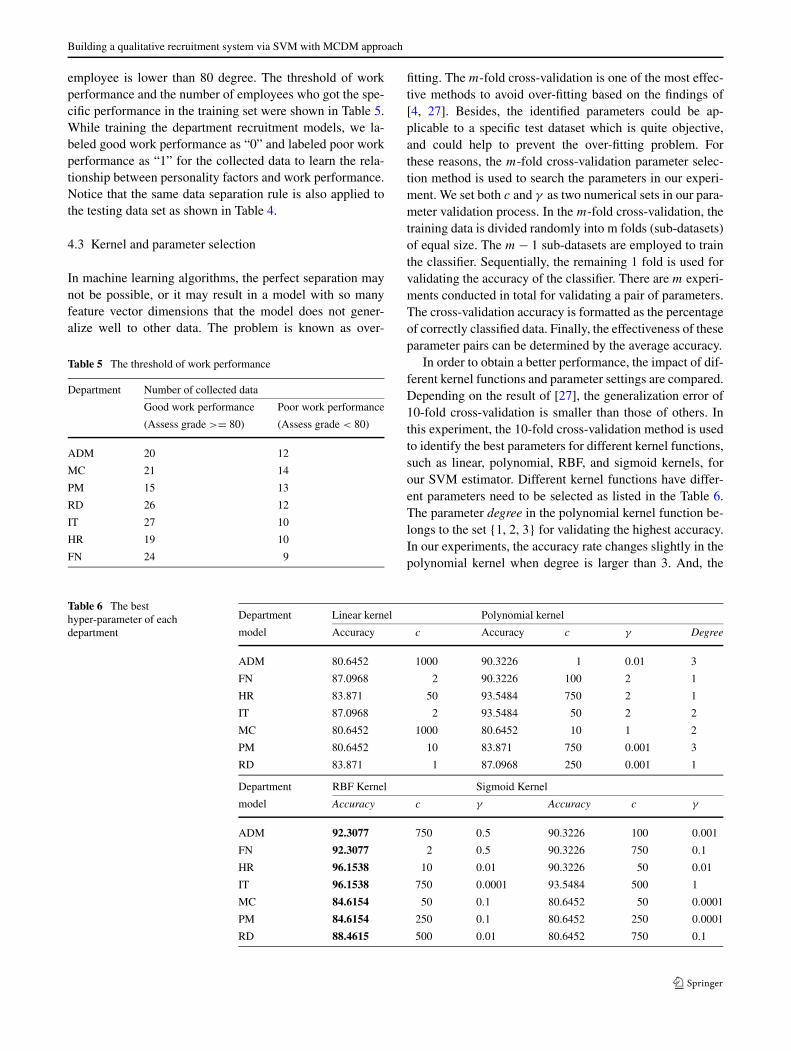
employee is lower than 80 degree. The threshold of workperformance and the number of employees who got the spe-cific performance in the training set were shown in Table 5.While training the department recruitment models, we la-beled good work performance as “0” and labeled poor workperformance as “1” for the collected data to learn the rela-tionship between personality factors and work performance.Notice that the same data separation rule is also applied tothe testing data set as shown in Table 4.
4.3 Kernel and parameter selection
In machine learning algorithms, the perfect separation maynot be possible, or it may result in a model with so manyfeature vector dimensions that the model does not gener-alize well to other data. The problem is known as over-
Table 5 The threshold of work performance
Department Number of collected data
Good work performance Poor work performance
(Assess grade >= 80) (Assess grade < 80)
ADM 20 12
MC 21 14
PM 15 13
RD 26 12
IT 27 10
HR 19 10
FN 24 9
fitting. The m-fold cross-validation is one of the most effec-tive methods to avoid over-fitting based on the findings of[4, 27]. Besides, the identified parameters could be ap-plicable to a specific test dataset which is quite objective,and could help to prevent the over-fitting problem. Forthese reasons, the m-fold cross-validation parameter selec-tion method is used to search the parameters in our experi-ment. We set both c and γ as two numerical sets in our para-meter validation process. In the m-fold cross-validation, thetraining data is divided randomly into m folds (sub-datasets)of equal size. The m − 1 sub-datasets are employed to trainthe classifier. Sequentially, the remaining 1 fold is used forvalidating the accuracy of the classifier. There are m experi-ments conducted in total for validating a pair of parameters.The cross-validation accuracy is formatted as the percentageof correctly classified data. Finally, the effectiveness of theseparameter pairs can be determined by the average accuracy.
In order to obtain a better performance, the impact of dif-ferent kernel functions and parameter settings are compared.Depending on the result of [27], the generalization error of10-fold cross-validation is smaller than those of others. Inthis experiment, the 10-fold cross-validation method is usedto identify the best parameters for different kernel functions,such as linear, polynomial, RBF, and sigmoid kernels, forour SVM estimator. Different kernel functions have differ-ent parameters need to be selected as listed in the Table 6.The parameter degree in the polynomial kernel function be-longs to the set {1, 2, 3} for validating the highest accuracy.In our experiments, the accuracy rate changes slightly in thepolynomial kernel when degree is larger than 3. And, the
Table 6 The besthyper-parameter of eachdepartment
Department Linear kernel Polynomial kernel
model Accuracy c Accuracy c γ Degree
ADM 80.6452 1000 90.3226 1 0.01 3
FN 87.0968 2 90.3226 100 2 1
HR 83.871 50 93.5484 750 2 1
IT 87.0968 2 93.5484 50 2 2
MC 80.6452 1000 80.6452 10 1 2
PM 80.6452 10 83.871 750 0.001 3
RD 83.871 1 87.0968 250 0.001 1
Department RBF Kernel Sigmoid Kernel
model Accuracy c γ Accuracy c γ
ADM 92.3077 750 0.5 90.3226 100 0.001
FN 92.3077 2 0.5 90.3226 750 0.1
HR 96.1538 10 0.01 90.3226 50 0.01
IT 96.1538 750 0.0001 93.5484 500 1
MC 84.6154 50 0.1 80.6452 50 0.0001
PM 84.6154 250 0.1 80.6452 250 0.0001
RD 88.4615 500 0.01 80.6452 750 0.1
Y.-M. Li et al.
parameter coef in polynomial and sigmoid kernels does notsignificantly affect results. The default value setting of thisparameter is zero in both kernels.
The parameters tried in the validation process are γ ∈{2,1,0.5,0.1,0.01,0.001,0.0001} and c ∈ {1000,750,500,
250,100,50,10,2,1}. Then, we perform a cross-validationprocess for each parameter pair (γ, c) to obtain the high-est classification accuracy. That is, we first set γ = 2 andc ∈ {1000,750,500,250,100,50,10,2,1} to validate allpairs such as {(2, 1000), (2, 750),. . . , (2,1)}, then sequen-tially set γ = 1 until all pairs are validated. Finally, the pa-rameter pair with the highest accuracy would be picked.The highest performance of different department recruit-ment model with various kernel functions and parametersettings are displayed in Table 6.
Since the polynomial and RBF kernels could handlethe nonlinear relation between class labels and attributes[8, 34], how the performances of each department clas-sifier built by polynomial and RBF kernels outperformothers’ can be observed. Although the polynomial kernelalso could handle the nonlinear relationship between labelsand attributes, it has more hyper-parameters (4 parameters:c, γ,degree and coef ) than the RBF kernel (2 parameters:c and γ ) also, the model training time is much longer thanRBF kernel, and the accuracy is lower than RBF kernel.
Theoretically, the accuracy of an SVM model is largelydependent on the selection of the model parameters such as c
and γ . Dependent on data distribution, these two parameterscontrol the tradeoff between allowing training errors (sep-arating accuracy) and forcing the margins of hyper-planesthat permit some misclassifications. In general, a more com-plex classifier will adopt larger parameter values. Practi-cally, the skills and personality traits of employees fromdifferent departments should be different. Varied weightsfor different personality and skill factors are considered inhiring, reallocating, and performance assessment. Due tothe staff personality structure variation, the complexity ofeach department model would be different. In our experi-ment, different departments also consider different person-ality types/traits in the recruitment process. For instance,department ADM (Administration) particularly considersthe factors belonging to five personality factor categories(“Extraversion”, “Agreeableness”, “Neuroticism”, “Consci-entiousness”, and “Openness”). However, the main task ofdepartment FN (Finance) is related to company accounts.The manager especially focuses on the factors belonging totwo personality factor categories (“Conscientiousness” and“Agreeableness”). The recruitment decision of ADM depart-ment will be more complex, compared with the recruitmentdecision of FN (Finance). We can also observe that the val-ues of c and r in the ADM department are higher than thosein FN department.
4.4 Results of SVM personality prediction
We utilize these built department recruitment models for themanagers to obtain the fitness degree of each candidate forsupporting the recruitment decision. The process to achievethe fitness degree of each candidate in each department isdescribed as follows. After an individual junior employeedata is fed into each built department recruitment model, theSVM model will output the probability (fitness degree) thatthe applicant would get a good work performance in eachdepartment. The higher probability of getting a good workperformance in a department intuitively represents that theapplicant has a higher fitness level in working in a depart-ment.
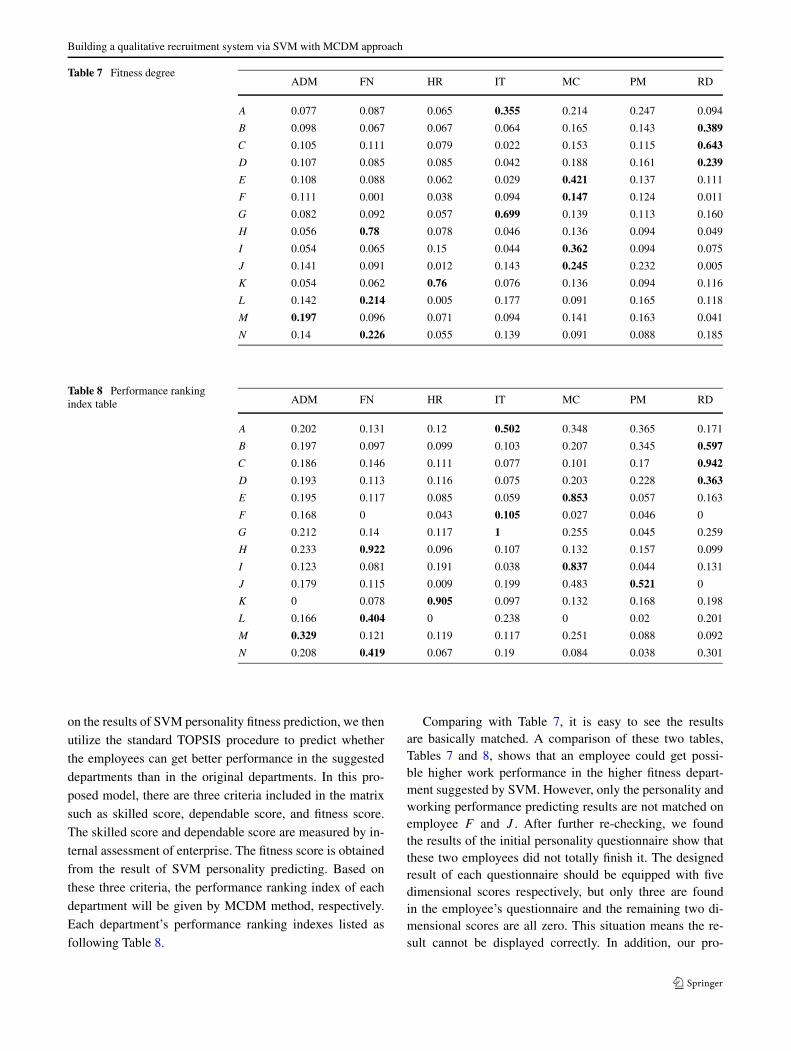
The department fitness degree of applicants would be in-dividually judged by each department model. Table 7 showsthe fitness degree between the 14 junior employees and var-ious departments. Each numerical value in the table repre-sents the fitness degree of the personnel to work in a specificdepartment. For example, employee A has 7.7% fitness forworking in the ADM department and 35.5% fitness in the ITdepartment.
In accordance with the department fitness degree, thismodel provides the fitness table to help managers with mak-ing human resource decisions. For instance, which job-hunter would be most suitable to hire for which departmentor the employee who got lower work performance should bereassigned to which position.
Let us see the following two cases:
Case 1: Assume the firm is about to hire new employees ofIT department, and there are 14 applicants (identified asA ∼ N) applying for this job. If this firm plans to hire twoemployees, A and G will be nominated according to the ta-ble of fitness degrees. Note that since G is a new incomingemployee, his/her work performance has not been evalu-ated by the firm while we collect the questionnaire report.The assessment grade will be estimated later when his/herseniority is enough. The estimating result is totally corre-sponding to our prediction.
Case 2: Assume the firm plans to transfer F in the depart-ment FN to another department because his/her assessmentgrade is merely 68. According to the table of fitness degree,the proposed model will suggest the manager to transfer F
from FN to MC department.
So far, based on personality questionnaire and SVM, ourproposed system can automatically score the fitness betweenjob’s personality requirement and candidate’s personalitytrait in addition to the conventional Job-CV matching, andthen generates the best set of job candidates.
4.5 Results of TOPSIS performance prediction
Extend the cases above; assume that the managers actuallytransferred the employees to the specific departments. Based
Building a qualitative recruitment system via SVM with MCDM approach
Table 7 Fitness degreeADM FN HR IT MC PM RD
A 0.077 0.087 0.065 0.355 0.214 0.247 0.094
B 0.098 0.067 0.067 0.064 0.165 0.143 0.389
C 0.105 0.111 0.079 0.022 0.153 0.115 0.643
D 0.107 0.085 0.085 0.042 0.188 0.161 0.239
E 0.108 0.088 0.062 0.029 0.421 0.137 0.111
F 0.111 0.001 0.038 0.094 0.147 0.124 0.011
G 0.082 0.092 0.057 0.699 0.139 0.113 0.160
H 0.056 0.78 0.078 0.046 0.136 0.094 0.049
I 0.054 0.065 0.15 0.044 0.362 0.094 0.075
J 0.141 0.091 0.012 0.143 0.245 0.232 0.005
K 0.054 0.062 0.76 0.076 0.136 0.094 0.116
L 0.142 0.214 0.005 0.177 0.091 0.165 0.118
M 0.197 0.096 0.071 0.094 0.141 0.163 0.041
N 0.14 0.226 0.055 0.139 0.091 0.088 0.185
Table 8 Performance rankingindex table ADM FN HR IT MC PM RD
A 0.202 0.131 0.12 0.502 0.348 0.365 0.171
B 0.197 0.097 0.099 0.103 0.207 0.345 0.597
C 0.186 0.146 0.111 0.077 0.101 0.17 0.942
D 0.193 0.113 0.116 0.075 0.203 0.228 0.363
E 0.195 0.117 0.085 0.059 0.853 0.057 0.163
F 0.168 0 0.043 0.105 0.027 0.046 0
G 0.212 0.14 0.117 1 0.255 0.045 0.259
H 0.233 0.922 0.096 0.107 0.132 0.157 0.099
I 0.123 0.081 0.191 0.038 0.837 0.044 0.131
J 0.179 0.115 0.009 0.199 0.483 0.521 0
K 0 0.078 0.905 0.097 0.132 0.168 0.198
L 0.166 0.404 0 0.238 0 0.02 0.201
M 0.329 0.121 0.119 0.117 0.251 0.088 0.092
N 0.208 0.419 0.067 0.19 0.084 0.038 0.301
on the results of SVM personality fitness prediction, we thenutilize the standard TOPSIS procedure to predict whetherthe employees can get better performance in the suggesteddepartments than in the original departments. In this pro-posed model, there are three criteria included in the matrixsuch as skilled score, dependable score, and fitness score.The skilled score and dependable score are measured by in-ternal assessment of enterprise. The fitness score is obtainedfrom the result of SVM personality predicting. Based onthese three criteria, the performance ranking index of eachdepartment will be given by MCDM method, respectively.Each department’s performance ranking indexes listed asfollowing Table 8.
Comparing with Table 7, it is easy to see the resultsare basically matched. A comparison of these two tables,Tables 7 and 8, shows that an employee could get possi-ble higher work performance in the higher fitness depart-ment suggested by SVM. However, only the personality andworking performance predicting results are not matched onemployee F and J . After further re-checking, we foundthe results of the initial personality questionnaire show thatthese two employees did not totally finish it. The designedresult of each questionnaire should be equipped with fivedimensional scores respectively, but only three are foundin the employee’s questionnaire and the remaining two di-mensional scores are all zero. This situation means the re-sult cannot be displayed correctly. In addition, our pro-
Y.-M. Li et al.
posed double-layered employee choosing system providesan error-checking function for helping firms avoid assigninginappropriate jobs to employees.
4.6 Evaluations and discussions
In our experiment, employee G is totally new employee ofthe IT department. He/she has not yet been involved in anyinternal performance measurement from the firm in the datacollection period. Fortunately, after the performance predic-tion, employee G has already had his first assess grade 85showed in Table 4. Comparing with our performance rank-ing indexes Table 8 (employee G is the one who is mostsuitable work in IT department) and the firm identified workperformance threshold (assess grade ≥ 80 indicates goodwork performance), our proposed predict mechanism actu-ally got accurate results.
After the experiment, we also interviewed with execu-tives of the human resource department of the firm. Accord-ing to the experimental results, the executives thought, incomparison to their existing personnel work performancemeasurement, our proposed mechanism performs better.Our proposed model can avoid employing inappropriate em-ployees due to people’s selfish motives. The model makesthe recruitment more fair and objective. Based on the experi-mental results and personnel manager’s opinions, we believethat the proposed human resource prediction framework isreally beneficial for the business. In particular, better qual-ity of recruitment could significantly reduce the employeestraining cost (e.g. time and expense) and enable employeesto be skilled at their work position faster. In addition, wefound that the fitness between the characteristics of job andthe personality trait of candidate is more important than theskilled score of candidate when an enterprise would like torecruit a new employee.
Comparing the results of SVM fitness degree predictionin Table 7 with the results of TOPSIS prediction that joinsskilled score in Table 8, we found that only personnel F gotthe different prediction. This shows the personality is a keyfactor for impacting whether a person is suitable for a partic-ular job. This is different from traditional thinking that theskilled score is more important than personality. A partialexplanation for this may lie in the fact that personnel couldget the necessary skill of job by general training but the nec-essary personality is hard to be trained.
Although our findings show that the work performance isclosely related to the personality of an employee, the effectsof personality are cumulative and compound over time. Be-cause they have to face the pressure, knowledge, skills, andabilities of their work, the personality of personnel mightbe changeable. Therefore, firstly, to continuously collect thepersonality trait data of different departments in this frame-work would be needed, in order to distinguish the person-ality type of work performance significantly, including high
and low work performance. Secondly, in order to make moreaccurate predictions, the job applicants and the employeeswho get low work performance and need to relocate workposition should answer the questionnaire while they applyfor the work or relocate to another position.
While this body of research has the demonstrable merit ofoffering valuable insights into personnel recruitment basedon 232 available and usable personality test reports includedin the training dataset, the enterprise can keep collectingmore personality and performance data of personnel to im-prove the prediction accuracy. Particularly, that would beable to efficiently improve the accuracy of SVM classifierfor the fitness between personality and job position predict-ing.
5 Conclusion
Enterprises are now in an era of global talent search. The pri-mary motivation behind this study was in the development ofa qualitative recruitment system that could help enterprisesrecruit the right personnel for the right position. Because oflimited resources on recruiting budgets, accurate candidateemployment is indeed a managerial issue. Therefore, it isvital to develop a useable and reliable model for predictingand discovering talented employees. The present study en-hances the previous studies’ findings by providing a muchmore detailed examination of personnel recruitment.
In this study, the model is a combination of the crediblequestionnaire developed by IPIP-NEO, SVM classifier, andTOPSIS. Unlike existing methods, we use the SVM withprobability estimates to first obtain the most likely classesthat represent the fitness degree of candidates and then deter-mine the possible work performance based on the TOPSIS.First, the questionnaire was used to analyze the personalityof personnel. The personality trait was utilized as job fitnessmeasurement criteria of personnel or job applicant. Second,the fitness degree between the personnel’s personality typeand department is estimated by SVM. Finally, based on per-sonality fitness, joining skill score and dependable scoregiven by firms’ internal assessment, TOPSIS method is usedfor determining and ranking the possible work performancelevel of each candidate. The position adjustment or recruit-ment suggestion would be given to managers. Most of theCEOs thought that to find, hire, and retain a qualified em-ployee is the greatest challenge for operating enterprises andthe most important factor contributing to company growth.We believe this proposed model can not only be used topredict suitable candidate for the vacancy but also the pos-sible job performance estimation after the candidate actu-ally takes up the vacancy. Furthermore, the proposed modelcould be used for job recruitment as well as for decantingthe employees’ work performance.
Building a qualitative recruitment system via SVM with MCDM approach
There are several directions for extending this research:(i) what is the relationship between the big five factors andthe company’s existing work performance measurement fac-tors? Future work can hopefully clarify this important rela-tionship concern. (ii) How to develop a more efficient wayto determine the parameters of the SVM model when thehuman resource structure in a business division has beenchanged? Appropriate parameter selection is a critical taskfor improving the prediction effectiveness of the model.
Acknowledgements This research was supported by the NationalScience Council of Taiwan (Republic of China) under the Grant NSC96-2416-H-009-017.
References
1. Ambwani T (2003) Multi class support vector machine implemen-tation to intrusion detection. In: Proceedings of the internationaljoint conference of neural networks, vol 3, pp 2300–2305
2. Barrick MR, Mount MK (2003) Yes, personality matters: movingon to more important matters. Human Perform 18(4):359–372
3. Beagrie S (2005) Personnel today—how to excelat psychometric assessments. Availableat http://www.personneltoday.com/articles/2005/03/22/28745/psychometrics-how-to-excel-at-psychometric-assessments.html.Accessed 23 Dec 2007
4. Bengio Y, Grandvalet Y (2004) No unbiased estimator of the vari-ance of k-fold cross-validation. J Mach Learn Res 5:1089–1105
5. Boser BE, Guyon IM, Vapnik VN (1992) A training algorithmfor optimal margin classifiers. In: Proceedings of the fifth annualworkshop on computational learning theory pp 144–152
6. Buchanan T, Johnson JA, Goldberg LR (2005) Implementing afive-factor personality inventory for use on the Internet. Eur J PersAssess 21(2):116–128
7. Burges CJC (1998) A tutorial on support vector machine for pat-tern recognition. Data Min Knowl Discov 2(2):121–167
8. Chang CC, Lin CJ (2003) LIBSVM: A library for supportvector machines, 2001. Software and documents available athttp://www.csie.ntu.edu.tw/~cjlin/libsvm. Accessed 10 Feb 2008
9. Chen MF, Tzeng GH (2004) Combining grey relation and TOPSISconcepts for selecting an expatriate host country. Math ComputModel 40(13):1473–1490
10. Costa PT Jr, McCrae RR (1992) NEO PI-R professional manual.Psychological Assessment Resources, Odessa
11. Cristianini N, Shawe-Taylor J (2000) An introduction to supportvector machines and other kernel-based learning methods. CUP,Cambridge
12. Deloitte, Touche (2006) Technology fast 500 CEO survey results.The Economist Intelligence Unit, The CEO’s role in talent man-agement, United States, 2006
13. Dunn WS, Mount MK, Barrick MR, Ones DS (1995) Relative im-portance of personality and general mental ability in managers’judgments of applicant qualifications. J Appl Psychol 80(4):500–509
14. Goodstein LD, Lanyon RI (1999) Applications of personality as-sessment to the workplace: a review. J Bus Psychol 13(3):291–322
15. He J, Tan AH, Tan CL (2003) On machine learning methods forChinese document categorization. Appl Intell 18(3):311–322
16. Hong WC, Pai PF, Huang YY, Yang SL (2005) Application ofsupport vector machines in predicting employee turnover basedon job performance. In: Lecture notes in computer science, vol3610. Springer, Berlin, pp 668–674
17. Hough LM (1998) Personality at work: issues and evidence. In:Hakel M (ed) Beyond multiple choice: evaluating alternative totraditional testing for selection. Erlbaum Assoc, Hillsdale
18. Hough LM, Oswald FL, Ployhart RE (2001) Determinants, de-tection, and amelioration of adverse impact in personnel selectionprocedures: Issues, evidence, and lessons learned. Int J Sel Assess9(1):152–194
19. Hu YC (2008) Classification performance evaluation of single-layer perceptron with Choquet integral-based TOPSIS. Appl Intell29(3):204–215
20. Hwang CL, Yoon K (1981) Multiple attribute decision making.Springer, Berlin
21. Kuo MS, Tzeng GH, Huang WC (2007) Group decision-makingbased on concepts of ideal and anti-ideal points in a fuzzy envi-ronment. Math Comput Model 45(3–4):324–339
23. Li S (2004) A behavioral choice model when computational abil-ity matters. Appl Intell 20(2):147–163
24. Li DF (2007) Compromise ratio method for fuzzy multi-attributegroup decision making. Appl Soft Comput 7(3):807–817
25. Li YM, Kao CP (2009) TREPPS: a trust-based recommender sys-tem for peer production services. Exp Syst Appl 36(2):3263–3277
26. Maglogiannis I, Zafiropoulos E, Anagnostopoulos I (2007) An in-telligent system for automated breast cancer diagnosis and prog-nosis using SVM based classifiers. Appl Intell 30(1):24–36
27. Markatou M, Tian H, Biswas S, Hripcsak G (2005) Analysis ofvariance of cross-validation estimators of the generalization error.J Mach Learn Res 6:1127–1168
28. McHenry JJ, Hough LM, Toquam JL, Hanson MA, Ashworth S(1990) Project A validity results—the relationship between pre-dictor and criterion domains. Pers Psychol 43(2):335–354
29. Mount MK, Barrick MR (1995) The Big Five personality dimen-sions: implications for research and practice in human resourcemanagement. Res Pers Human Resour Manag 13:153–200
30. Mount MK, Witt A, Barrick MR (2000) Incremental validity ofempirically-keyed biographical scales over GMA and the big fivepersonality constructs. Pers Psychol 53(2):299–323
31. Periatt JA, Chakrabarty S, Lemay SA (2007) Using personal-ity traits to select customer-oriented logistics personnel. TranspJ 46(1):22–37
32. Schmidt FL, Hunter JE (1998) The validity and utility of selectionmethods in personnel psychology: practical and theoretical impli-cations of 85 years of research findings. Psychol Bull 124(2):262–274
34. Smola AJ (1998) Learning with kernels. PhD thesis, Departmentof Computer Science, Technical University Berlin, Germany
35. Sterlin P (2007) Overfitting prevention with cross-validation. Mas-ter thesis, University Pierre and Marie Curie (Paris VI): Paris,France
36. Tzeng HM, Hsieh JG, Lin YL (2004) Predicting with a supportvector machine nurses’ intention to quit: a new approach to setup an early warning mechanism in human resource management.Comput Inform Nurs 22(4):232–242
37. Vapnik VN (1995) Statistical learning theory. Wiley, New York38. Wong WT, Shih FY, Liu J (2007) Shape-based image retrieval
using support vector machines, Fourier descriptors and self-organizing maps. Inf Sci 177(8):1878-1891
Yung-Ming Li is an Associate Pro-fessor at the Institute of Informa-tion Management, National ChiaoTung University in Taiwan. He re-ceived his Ph.D. in InformationSystems from the University ofWashington. His research interestsinclude Peer-to-Peer networks, In-ternet economics, and business in-telligence. His research has ap-peared in IEEE/ACM Transactionson Networking, Decision SupportSystems, Electronic Commerce Re-search and Applications.
Cheng-Yang Lai is a Ph.D. studentat the Institute of Information Man-agement, National Chiao Tung Uni-versity. He received his B.S. andM.S. degrees in Department of In-formation Management from theChung Hua University, Taiwan. Hisresearch interests include recom-mender systems, social computingand electronic commerce. His re-search has appeared in Hawaii In-ternational Conference on SystemSciences (HICSS).
Chien-Pang Kao received his M.S.degree from Institute of Informa-tion Management, National ChiaoTung University, Taiwan and B.S.degree in Management InformationSystems from the National YunlinUniversity of Science and Tech-nology, Taiwan. His research in-terests focus on recommender sys-tems, business intelligence and elec-tronic commerce. His research hasappeared in Expert Systems withApplications.


![A Fusion of ICA and SVM for Detection Computer Attacks...implements an anomaly detection model using one-class SVM. Finally, the third type [18] establishes multi-class SVM at the](https://static.documents.pub/doc/80x56/5fe5fdcc6be2c9621839e96f/a-fusion-of-ica-and-svm-for-detection-computer-implements-an-anomaly-detection.jpg)
