17
Building an Even Stronger Business Fourth Quarter 2015 Supplemental Information For Earnings Conference Call February 4, 2016 Aggregates Essential Material | Valuable Asset
Building an Even Stronger Business
Fourth Quarter 2015 Supplemental Information For Earnings Conference Call
February 4, 2016
Aggregates Essential Material | Valuable Asset
Supplemental Information for 4Q’15 Earnings Conference Call – February 4, 2016
Important Disclosures – Forward Looking Statements
This document contains forward-looking statements. Statements that are not historical fact, including statements about Vulcan's beliefs and expectations, are forward-looking statements. Generally, these statements relate to future financial performance, results of operations, business plans or strategies, projected or anticipated revenues, expenses, earnings (including EBITDA and other measures), dividend policy, shipment volumes, pricing, levels of capital expenditures, intended cost reductions and cost savings, anticipated profit improvements and/or planned divestitures and asset sales. These forward-looking statements are sometimes identified by the use of terms and phrases such as "believe," "should," "would," "expect," "project," "estimate," "anticipate," "intend," "plan," "will," "can," "may" or similar expressions elsewhere in this document. These statements are subject to numerous risks, uncertainties, and assumptions, including but not limited to general business conditions, competitive factors, pricing, energy costs, and other risks and uncertainties discussed in the reports Vulcan periodically files with the SEC. Forward-looking statements are not guarantees of future performance and actual results, developments, and business decisions may vary significantly from those expressed in or implied by the forward-looking statements. The following risks related to Vulcan's business, among others, could cause actual results to differ materially from those described in the forward-looking statements: those associated with general economic and business conditions; the timing and amount of federal, state and local funding for infrastructure; changes in Vulcan’s effective tax rate that can adversely impact results; the increasing reliance on information technology infrastructure for Vulcan’s ticketing, procurement, financial statements and other processes could adversely affect operations in the event such infrastructure does not work as intended or experiences technical difficulties or is subjected to cyber attacks; the impact of the state of the global economy on Vulcan’s businesses and financial condition and access to capital markets; changes in the level of spending for private residential and private nonresidential construction; the highly competitive nature of the construction materials industry; the impact of future regulatory or legislative actions; the outcome of pending legal proceedings; pricing of Vulcan's products; weather and other natural phenomena; energy costs; costs of hydrocarbon-based raw materials; healthcare costs; the amount of long-term debt and interest expense incurred by Vulcan; changes in interest rates; the impact of Vulcan's below investment grade debt rating on Vulcan's cost of capital; volatility in pension plan asset values and liabilities which may require cash contributions to the pension plans; the impact of environmental clean-up costs and other liabilities relating to previously divested businesses; Vulcan's ability to secure and permit aggregates reserves in strategically located areas; Vulcan's ability to manage and successfully integrate acquisitions; the potential of goodwill or long-lived asset impairment; the potential impact of future legislation or regulations relating to climate change or greenhouse gas emissions or the definition of minerals; and other assumptions, risks and uncertainties detailed from time to time in the reports filed by Vulcan with the SEC. All forward-looking statements in this communication are qualified in their entirety by this cautionary statement. Vulcan disclaims and does not undertake any obligation to update or revise any forward-looking statement in this document except as required by law.
2
Supplemental Information for 4Q’15 Earnings Conference Call – February 4, 2016
Fourth Quarter 2015 Key Figures - Total
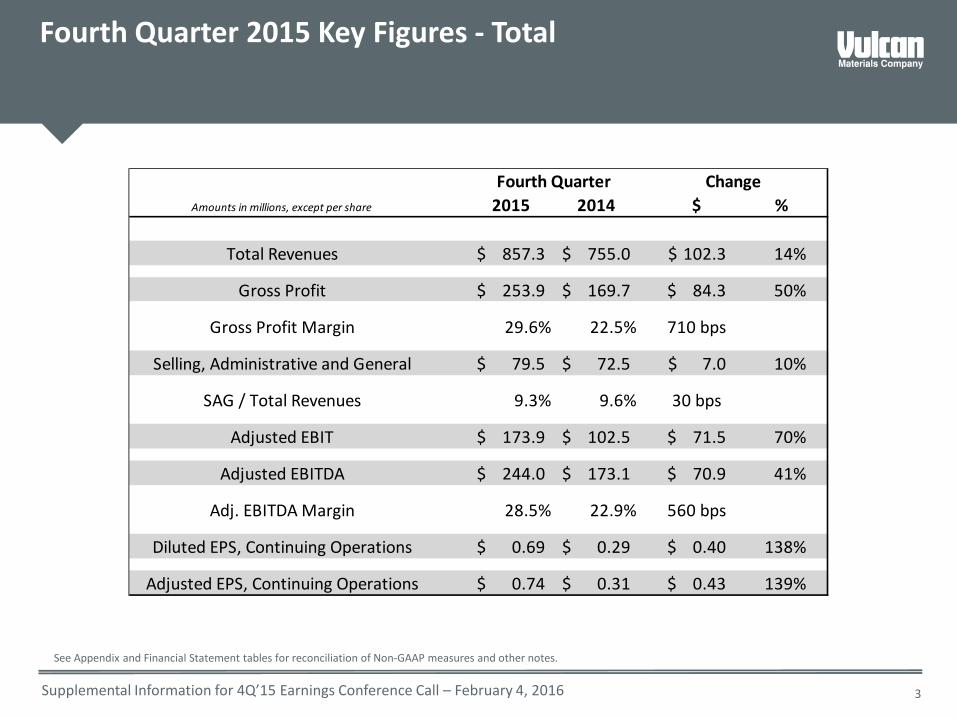
See Appendix and Financial Statement tables for reconciliation of Non-GAAP measures and other notes.
3
Amounts in millions, except per share 2015 2014 $ %
Total Revenues 857.3$ 755.0$ 102.3$ 14%
Gross Profit 253.9$ 169.7$ 84.3$ 50%
Gross Profit Margin 29.6% 22.5% 710 bps
Selling, Administrative and General 79.5$ 72.5$ 7.0$ 10%
SAG / Total Revenues 9.3% 9.6% 30 bps
Adjusted EBIT 173.9$ 102.5$ 71.5$ 70%
Adjusted EBITDA 244.0$ 173.1$ 70.9$ 41%
Adj. EBITDA Margin 28.5% 22.9% 560 bps
Diluted EPS, Continuing Operations 0.69$ 0.29$ 0.40$ 138%
Adjusted EPS, Continuing Operations 0.74$ 0.31$ 0.43$ 139%
Fourth Quarter Change
Supplemental Information for 4Q’15 Earnings Conference Call – February 4, 2016
Fourth Quarter 2015 Key Figures – Segments
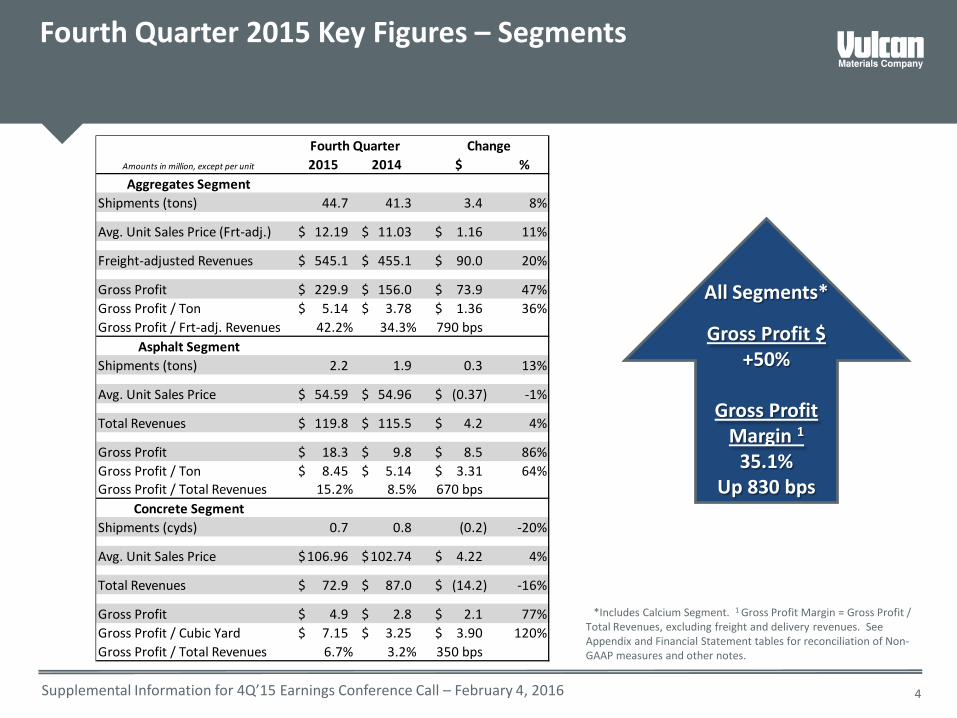
*Includes Calcium Segment. 1 Gross Profit Margin = Gross Profit / Total Revenues, excluding freight and delivery revenues. See Appendix and Financial Statement tables for reconciliation of Non-GAAP measures and other notes.
4
All Segments*
Gross Profit $ +50%
Gross Profit
Margin 1
35.1% Up 830 bps
Amounts in million, except per unit 2015 2014 $ %Aggregates Segment
Shipments (tons) 44.7 41.3 3.4 8%
Avg. Unit Sales Price (Frt-adj.) 12.19$ 11.03$ 1.16$ 11%
Freight-adjusted Revenues 545.1$ 455.1$ 90.0$ 20%
Gross Profit 229.9$ 156.0$ 73.9$ 47%Gross Profit / Ton 5.14$ 3.78$ 1.36$ 36%Gross Profit / Frt-adj. Revenues 42.2% 34.3% 790 bps
Asphalt SegmentShipments (tons) 2.2 1.9 0.3 13%
Avg. Unit Sales Price 54.59$ 54.96$ (0.37)$ -1%
Total Revenues 119.8$ 115.5$ 4.2$ 4%
Gross Profit 18.3$ 9.8$ 8.5$ 86%Gross Profit / Ton 8.45$ 5.14$ 3.31$ 64%Gross Profit / Total Revenues 15.2% 8.5% 670 bps
Concrete SegmentShipments (cyds) 0.7 0.8 (0.2) -20%
Avg. Unit Sales Price 106.96$ 102.74$ 4.22$ 4%
Total Revenues 72.9$ 87.0$ (14.2)$ -16%
Gross Profit 4.9$ 2.8$ 2.1$ 77%Gross Profit / Cubic Yard 7.15$ 3.25$ 3.90$ 120%Gross Profit / Total Revenues 6.7% 3.2% 350 bps
Fourth Quarter Change
Supplemental Information for 4Q’15 Earnings Conference Call – February 4, 2016
Full Year 2015 Key Figures - Total
See Appendix and Financial Statement tables for reconciliation of Non-GAAP measures and other notes.
5
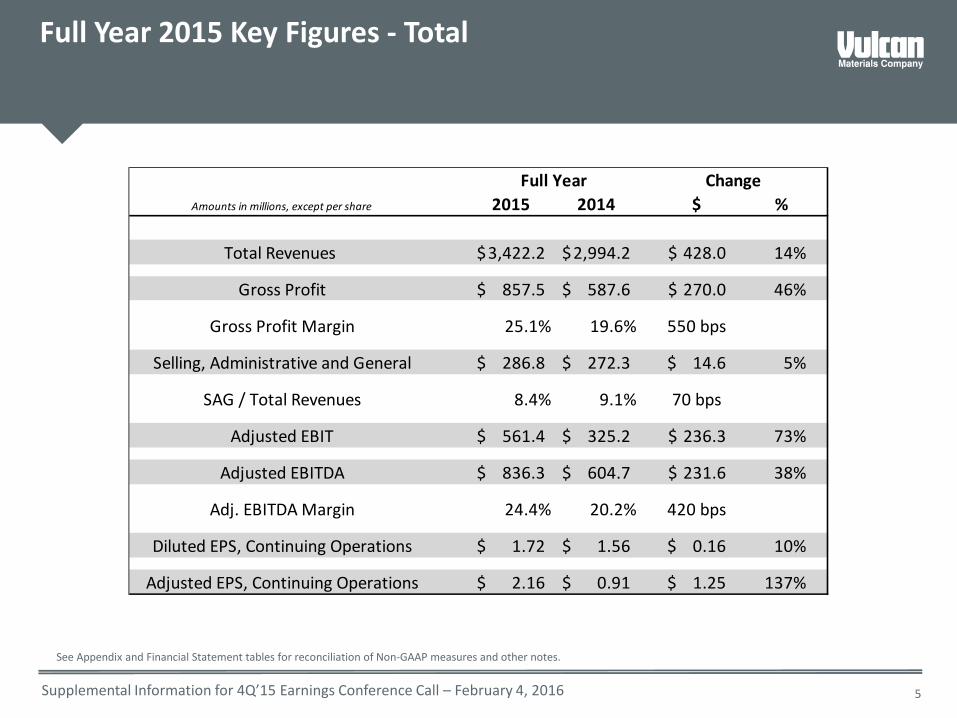
Amounts in millions, except per share 2015 2014 $ %
Total Revenues 3,422.2$ 2,994.2$ 428.0$ 14%
Gross Profit 857.5$ 587.6$ 270.0$ 46%
Gross Profit Margin 25.1% 19.6% 550 bps
Selling, Administrative and General 286.8$ 272.3$ 14.6$ 5%
SAG / Total Revenues 8.4% 9.1% 70 bps
Adjusted EBIT 561.4$ 325.2$ 236.3$ 73%
Adjusted EBITDA 836.3$ 604.7$ 231.6$ 38%
Adj. EBITDA Margin 24.4% 20.2% 420 bps
Diluted EPS, Continuing Operations 1.72$ 1.56$ 0.16$ 10%
Adjusted EPS, Continuing Operations 2.16$ 0.91$ 1.25$ 137%
Full Year Change
Supplemental Information for 4Q’15 Earnings Conference Call – February 4, 2016
Full Year 2015 Key Figures - Segments
6
*Includes Calcium Segment. 1 Gross Profit Margin = Gross Profit / Total Revenues, excluding freight and delivery revenues. See Appendix and Financial Statement tables for reconciliation of Non-GAAP measures and other notes.
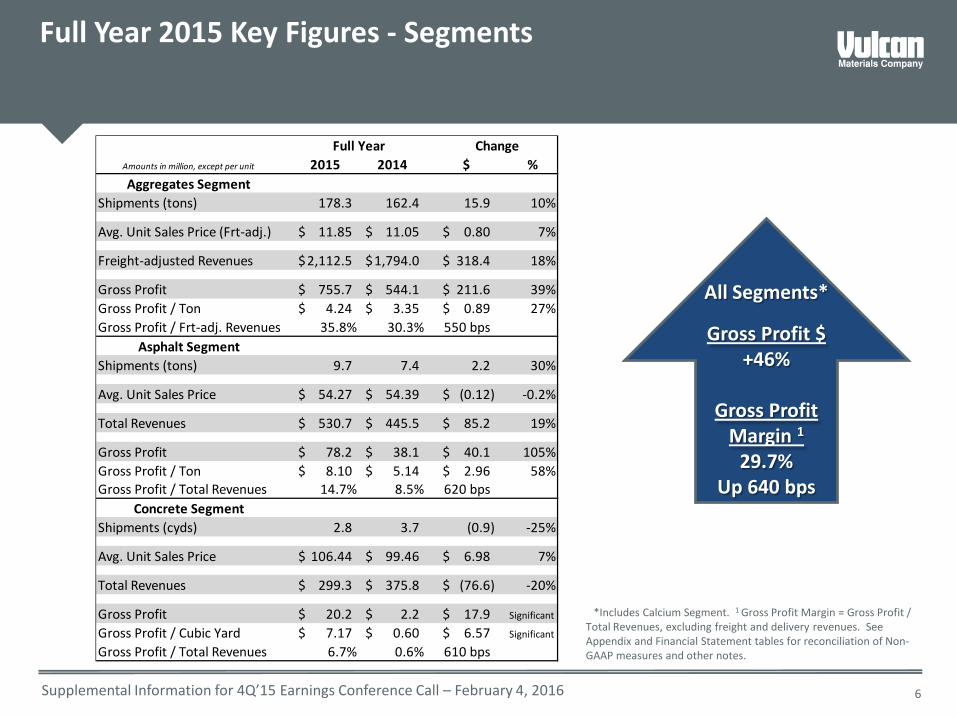
All Segments*
Gross Profit $ +46%
Gross Profit
Margin 1
29.7% Up 640 bps
Amounts in million, except per unit 2015 2014 $ %Aggregates Segment
Shipments (tons) 178.3 162.4 15.9 10%
Avg. Unit Sales Price (Frt-adj.) 11.85$ 11.05$ 0.80$ 7%
Freight-adjusted Revenues 2,112.5$ 1,794.0$ 318.4$ 18%
Gross Profit 755.7$ 544.1$ 211.6$ 39%Gross Profit / Ton 4.24$ 3.35$ 0.89$ 27%Gross Profit / Frt-adj. Revenues 35.8% 30.3% 550 bps
Asphalt SegmentShipments (tons) 9.7 7.4 2.2 30%
Avg. Unit Sales Price 54.27$ 54.39$ (0.12)$ -0.2%
Total Revenues 530.7$ 445.5$ 85.2$ 19%
Gross Profit 78.2$ 38.1$ 40.1$ 105%Gross Profit / Ton 8.10$ 5.14$ 2.96$ 58%Gross Profit / Total Revenues 14.7% 8.5% 620 bps
Concrete SegmentShipments (cyds) 2.8 3.7 (0.9) -25%
Avg. Unit Sales Price 106.44$ 99.46$ 6.98$ 7%
Total Revenues 299.3$ 375.8$ (76.6)$ -20%
Gross Profit 20.2$ 2.2$ 17.9$ Significant
Gross Profit / Cubic Yard 7.17$ 0.60$ 6.57$ Significant
Gross Profit / Total Revenues 6.7% 0.6% 610 bps
Full Year Change
Supplemental Information for 4Q’15 Earnings Conference Call – February 4, 2016
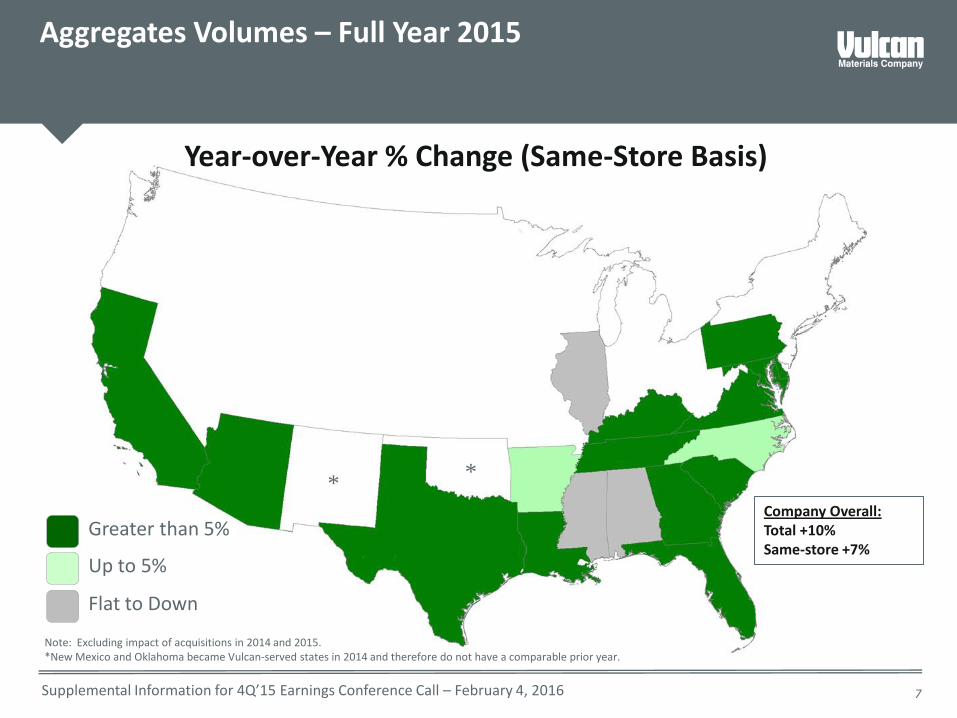
Greater than 5%
Up to 5%
Flat to Down
Aggregates Volumes – Full Year 2015
Year-over-Year % Change (Same-Store Basis)
Company Overall: Total +10% Same-store +7%
Note: Excluding impact of acquisitions in 2014 and 2015. *New Mexico and Oklahoma became Vulcan-served states in 2014 and therefore do not have a comparable prior year.
* *
7
Supplemental Information for 4Q’15 Earnings Conference Call – February 4, 2016
Aggregates Results – Unit Profitability
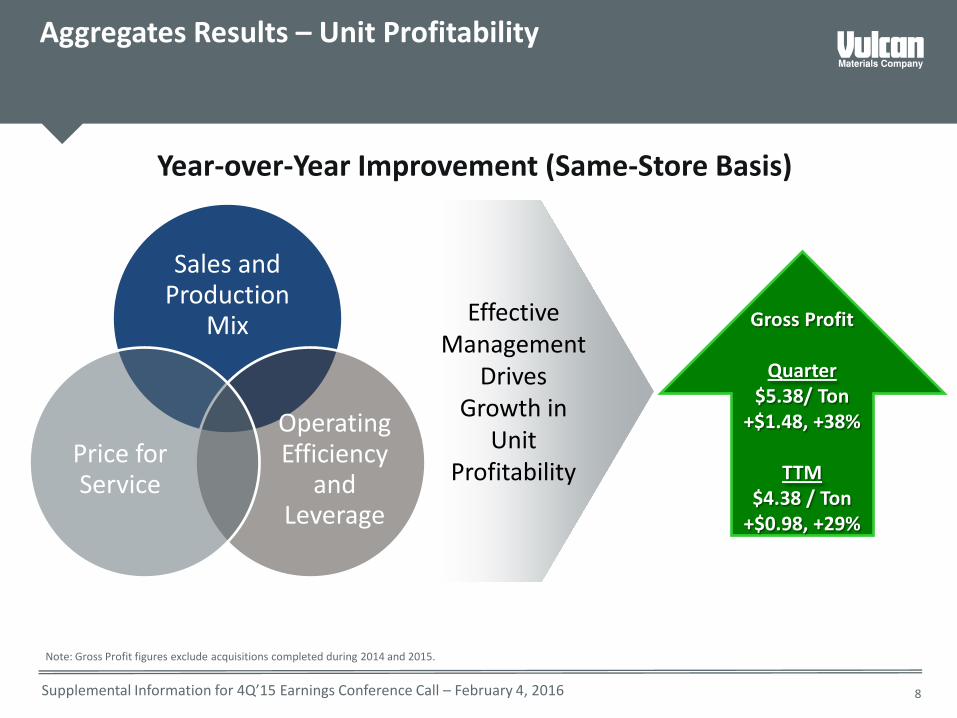
Year-over-Year Improvement (Same-Store Basis)
Sales and Production
Mix
Operating Efficiency
and Leverage
Price for Service
Effective Management
Drives Growth in
Unit Profitability
Note: Gross Profit figures exclude acquisitions completed during 2014 and 2015.
8
Gross Profit
Quarter $5.38/ Ton
+$1.48, +38%
TTM $4.38 / Ton
+$0.98, +29%
Supplemental Information for 4Q’15 Earnings Conference Call – February 4, 2016
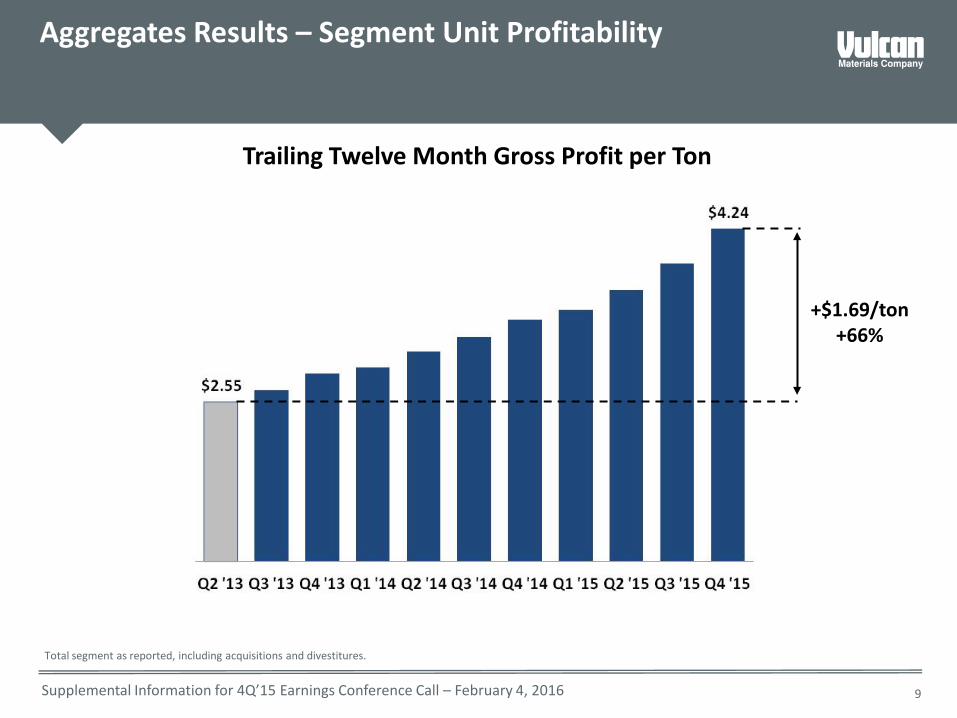
Aggregates Results – Segment Unit Profitability
Trailing Twelve Month Gross Profit per Ton
9
+$1.69/ton +66%
Total segment as reported, including acquisitions and divestitures.
Supplemental Information for 4Q’15 Earnings Conference Call – February 4, 2016
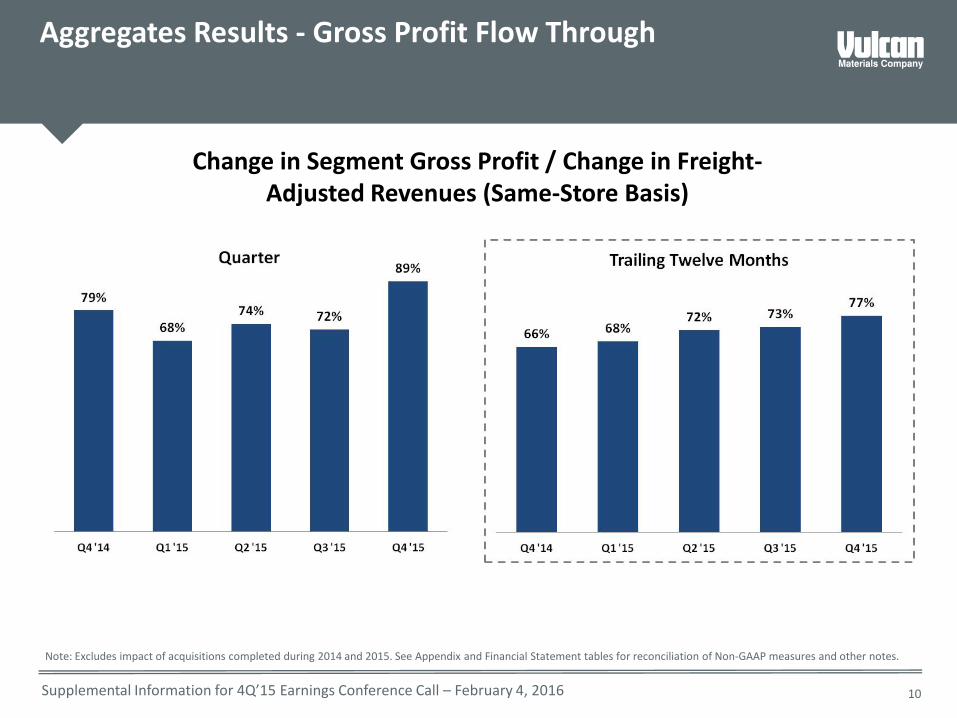
Aggregates Results - Gross Profit Flow Through
Note: Excludes impact of acquisitions completed during 2014 and 2015. See Appendix and Financial Statement tables for reconciliation of Non-GAAP measures and other notes.
Change in Segment Gross Profit / Change in Freight-Adjusted Revenues (Same-Store Basis)
10
Supplemental Information for 4Q’15 Earnings Conference Call – February 4, 2016 11
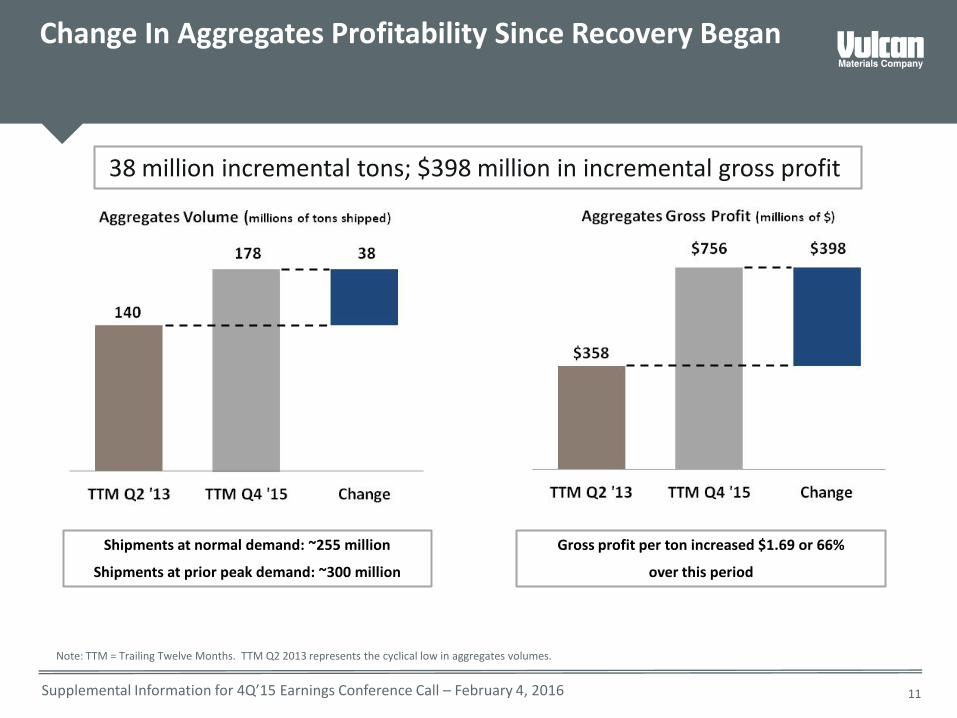
38 million incremental tons; $398 million in incremental gross profit.
Change In Aggregates Profitability Since Recovery Began
Shipments at normal demand: ~255 million
Shipments at prior peak demand: ~300 million
Gross profit per ton increased $1.69 or 66%
over this period
Note: TTM = Trailing Twelve Months. TTM Q2 2013 represents the cyclical low in aggregates volumes.
Supplemental Information for 4Q’15 Earnings Conference Call – February 4, 2016
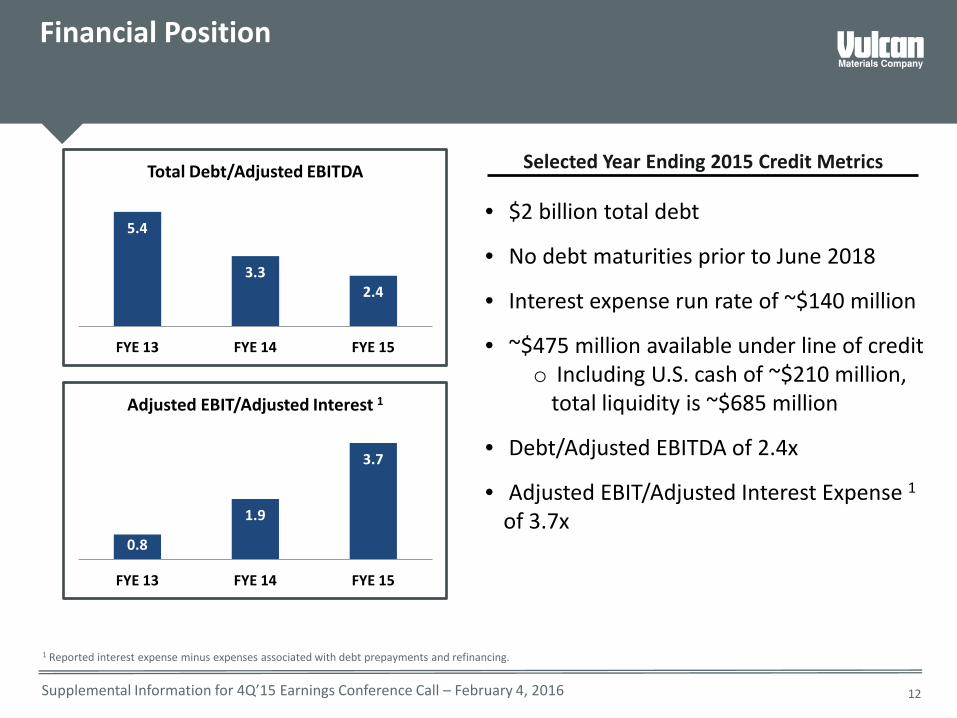
Financial Position
5.4
3.3 2.4
FYE 13 FYE 14 FYE 15
Total Debt/Adjusted EBITDA
0.8
1.9
3.7
FYE 13 FYE 14 FYE 15
Adjusted EBIT/Adjusted Interest 1
1 Reported interest expense minus expenses associated with debt prepayments and refinancing.
Selected Year Ending 2015 Credit Metrics
• $2 billion total debt
• No debt maturities prior to June 2018
• Interest expense run rate of ~$140 million
• ~$475 million available under line of credit o Including U.S. cash of ~$210 million,
total liquidity is ~$685 million
• Debt/Adjusted EBITDA of 2.4x
• Adjusted EBIT/Adjusted Interest Expense 1 of 3.7x
12
Supplemental Information for 4Q’15 Earnings Conference Call – February 4, 2016 13
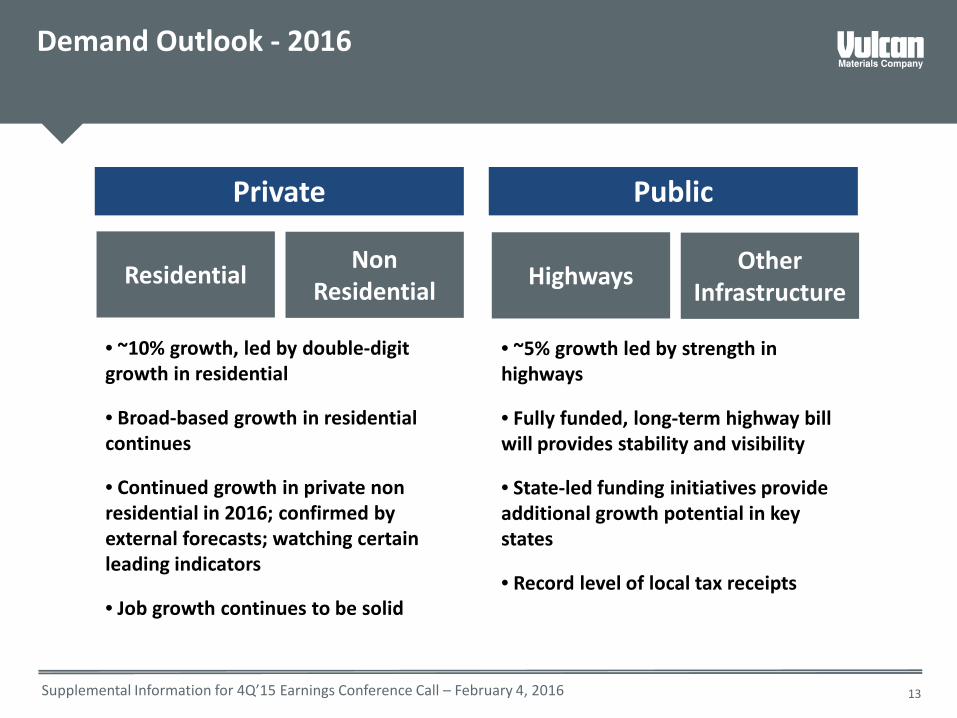
• ~10% growth, led by double-digit growth in residential
• Broad-based growth in residential continues
• Continued growth in private non residential in 2016; confirmed by external forecasts; watching certain leading indicators
• Job growth continues to be solid
• ~5% growth led by strength in highways
• Fully funded, long-term highway bill will provides stability and visibility
• State-led funding initiatives provide additional growth potential in key states
• Record level of local tax receipts
Demand Outlook - 2016
Private Public
Residential Non Residential Highways Other
Infrastructure
Supplemental Information for 4Q’15 Earnings Conference Call – February 4, 2016
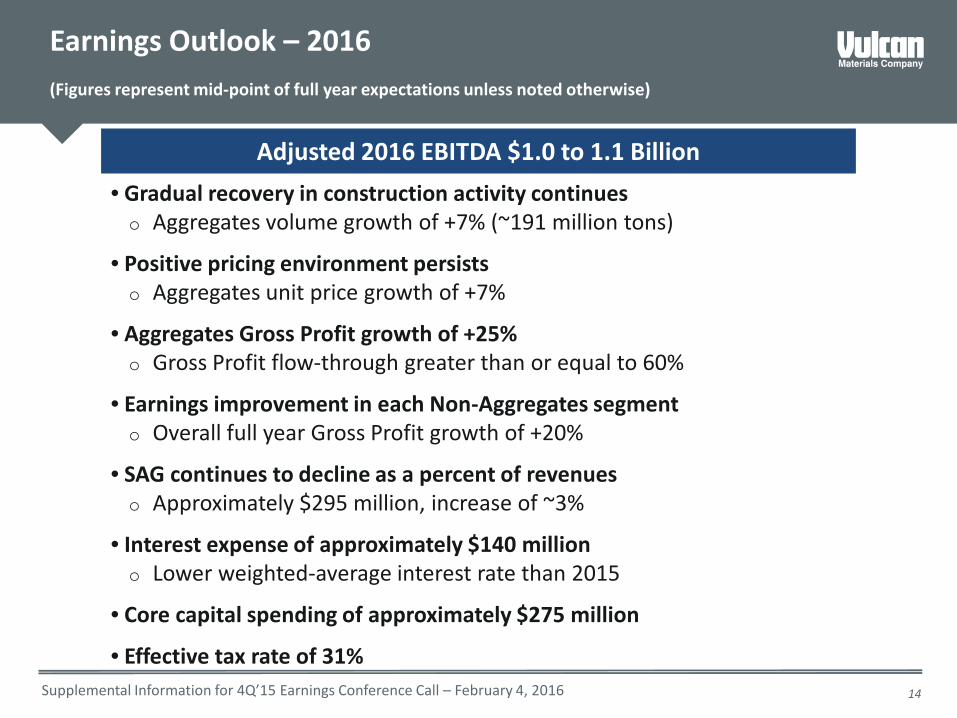
• Gradual recovery in construction activity continues o Aggregates volume growth of +7% (~191 million tons)
• Positive pricing environment persists o Aggregates unit price growth of +7%
• Aggregates Gross Profit growth of +25% o Gross Profit flow-through greater than or equal to 60%
• Earnings improvement in each Non-Aggregates segment o Overall full year Gross Profit growth of +20%
• SAG continues to decline as a percent of revenues o Approximately $295 million, increase of ~3%
• Interest expense of approximately $140 million o Lower weighted-average interest rate than 2015
• Core capital spending of approximately $275 million
• Effective tax rate of 31%
Earnings Outlook – 2016 (Figures represent mid-point of full year expectations unless noted otherwise)
14
Adjusted 2016 EBITDA $1.0 to 1.1 Billion
Supplemental Information for 4Q’15 Earnings Conference Call – February 4, 2016 15
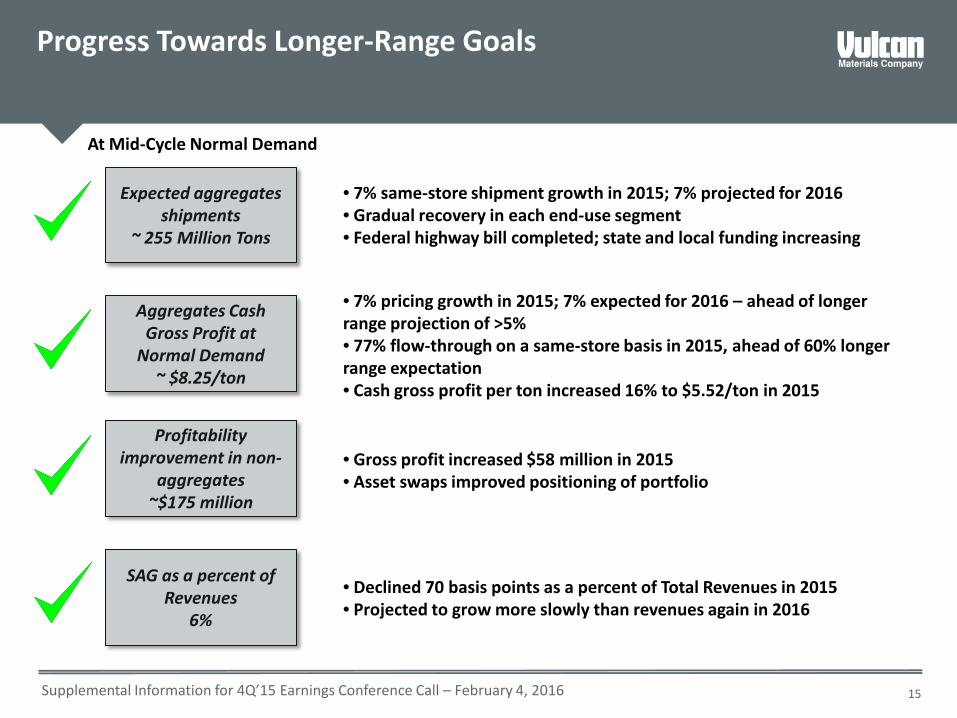
SAG as a percent of Revenues
6%
Expected aggregates shipments
~ 255 Million Tons
Aggregates Cash Gross Profit at
Normal Demand ~ $8.25/ton
Profitability improvement in non-
aggregates ~$175 million
• 7% same-store shipment growth in 2015; 7% projected for 2016 • Gradual recovery in each end-use segment • Federal highway bill completed; state and local funding increasing
At Mid-Cycle Normal Demand
Progress Towards Longer-Range Goals
• 7% pricing growth in 2015; 7% expected for 2016 – ahead of longer range projection of >5% • 77% flow-through on a same-store basis in 2015, ahead of 60% longer range expectation • Cash gross profit per ton increased 16% to $5.52/ton in 2015
• Gross profit increased $58 million in 2015 • Asset swaps improved positioning of portfolio
• Declined 70 basis points as a percent of Total Revenues in 2015 • Projected to grow more slowly than revenues again in 2016
Supplemental Information for 4Q’15 Earnings Conference Call – February 4, 2016
Appendix: Reconciliation of Non-GAAP Measures
Source: Company documents filed or furnished to the SEC.
16
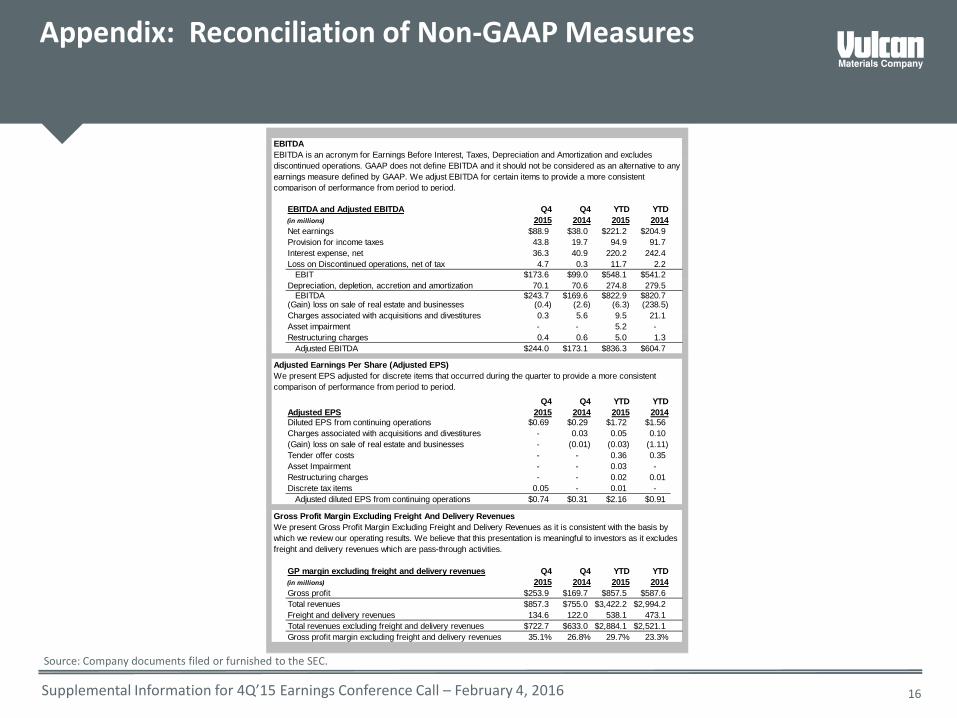
EBITDA
EBITDA and Adjusted EBITDA Q4 Q4 YTD YTD(in millions) 2015 2014 2015 2014Net earnings $88.9 $38.0 $221.2 $204.9Provision for income taxes 43.8 19.7 94.9 91.7 Interest expense, net 36.3 40.9 220.2 242.4 Loss on Discontinued operations, net of tax 4.7 0.3 11.7 2.2
EBIT $173.6 $99.0 $548.1 $541.2Depreciation, depletion, accretion and amortization 70.1 70.6 274.8 279.5
EBITDA $243.7 $169.6 $822.9 $820.7(Gain) loss on sale of real estate and businesses (0.4) (2.6) (6.3) (238.5) Charges associated with acquisitions and divestitures 0.3 5.6 9.5 21.1 Asset impairment - - 5.2 - Restructuring charges 0.4 0.6 5.0 1.3
Adjusted EBITDA $244.0 $173.1 $836.3 $604.7
Adjusted Earnings Per Share (Adjusted EPS)
Q4 Q4 YTD YTDAdjusted EPS 2015 2014 2015 2014Diluted EPS from continuing operations $0.69 $0.29 $1.72 $1.56Charges associated with acquisitions and divestitures - 0.03 0.05 0.10 (Gain) loss on sale of real estate and businesses - (0.01) (0.03) (1.11) Tender offer costs - - 0.36 0.35 Asset Impairment - - 0.03 - Restructuring charges - - 0.02 0.01 Discrete tax items 0.05 - 0.01 -
Adjusted diluted EPS from continuing operations $0.74 $0.31 $2.16 $0.91
Gross Profit Margin Excluding Freight And Delivery Revenues
GP margin excluding freight and delivery revenues Q4 Q4 YTD YTD(in millions) 2015 2014 2015 2014Gross profit $253.9 $169.7 $857.5 $587.6Total revenues $857.3 $755.0 $3,422.2 $2,994.2Freight and delivery revenues 134.6 122.0 538.1 473.1 Total revenues excluding freight and delivery revenues $722.7 $633.0 $2,884.1 $2,521.1Gross profit margin excluding freight and delivery revenues 35.1% 26.8% 29.7% 23.3%
We present Gross Profit Margin Excluding Freight and Delivery Revenues as it is consistent with the basis by which we review our operating results. We believe that this presentation is meaningful to investors as it excludes freight and delivery revenues which are pass-through activities.
We present EPS adjusted for discrete items that occurred during the quarter to provide a more consistent comparison of performance from period to period.
EBITDA is an acronym for Earnings Before Interest, Taxes, Depreciation and Amortization and excludes discontinued operations. GAAP does not define EBITDA and it should not be considered as an alternative to any earnings measure defined by GAAP. We adjust EBITDA for certain items to provide a more consistent comparison of performance from period to period.
Supplemental Information for 4Q’15 Earnings Conference Call – February 4, 2016
Appendix: Reconciliation of Non-GAAP Measures
Source: Company documents filed or furnished to the SEC.
17
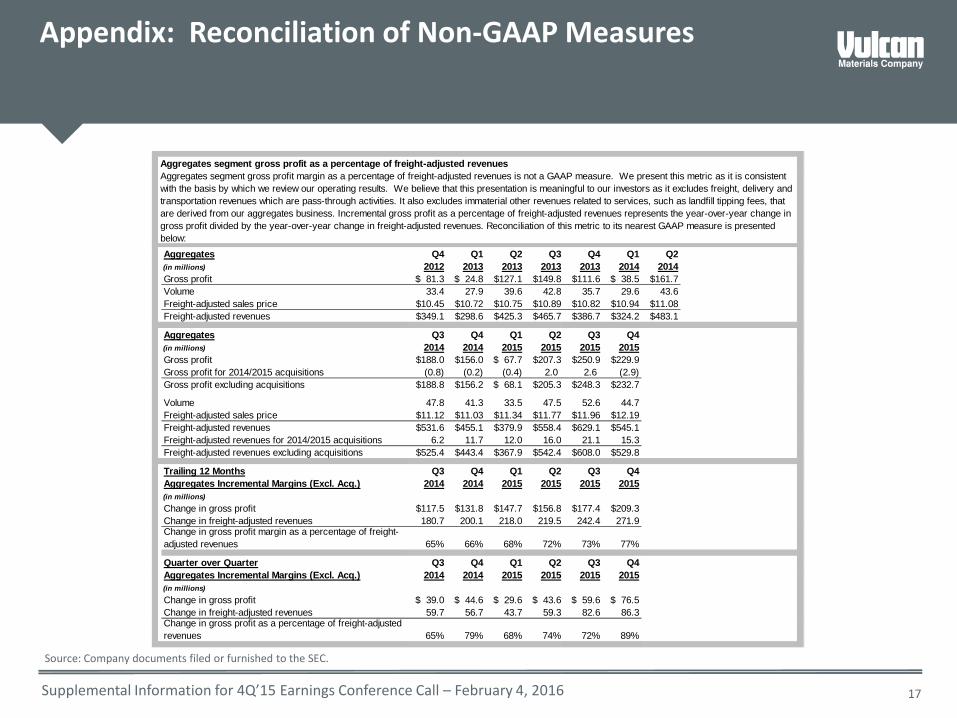
Aggregates segment gross profit as a percentage of freight-adjusted revenues
Aggregates Q4 Q1 Q2 Q3 Q4 Q1 Q2(in millions) 2012 2013 2013 2013 2013 2014 2014Gross profit $ 81.3 $ 24.8 $127.1 $149.8 $111.6 $ 38.5 $161.7 Volume 33.4 27.9 39.6 42.8 35.7 29.6 43.6Freight-adjusted sales price $10.45 $10.72 $10.75 $10.89 $10.82 $10.94 $11.08 Freight-adjusted revenues $349.1 $298.6 $425.3 $465.7 $386.7 $324.2 $483.1
Aggregates Q3 Q4 Q1 Q2 Q3 Q4(in millions) 2014 2014 2015 2015 2015 2015Gross profit $188.0 $156.0 $ 67.7 $207.3 $250.9 $229.9
(0.8) (0.2) (0.4) 2.0 2.6 (2.9) $188.8 $156.2 $ 68.1 $205.3 $248.3 $232.7
Volume 47.8 41.3 33.5 47.5 52.6 44.7Freight-adjusted sales price $11.12 $11.03 $11.34 $11.77 $11.96 $12.19 Freight-adjusted revenues $531.6 $455.1 $379.9 $558.4 $629.1 $545.1
6.2 11.7 12.0 16.0 21.1 15.3Freight-adjusted revenues excluding acquisitions $525.4 $443.4 $367.9 $542.4 $608.0 $529.8
Trailing 12 Months Q3 Q4 Q1 Q2 Q3 Q4Aggregates Incremental Margins (Excl. Acq.) 2014 2014 2015 2015 2015 2015(in millions)Change in gross profit $117.5 $131.8 $147.7 $156.8 $177.4 $209.3 Change in freight-adjusted revenues 180.7 200.1 218.0 219.5 242.4 271.9
65% 66% 68% 72% 73% 77%
Quarter over Quarter Q3 Q4 Q1 Q2 Q3 Q4Aggregates Incremental Margins (Excl. Acq.) 2014 2014 2015 2015 2015 2015(in millions)Change in gross profit $ 39.0 $ 44.6 $ 29.6 $ 43.6 $ 59.6 $ 76.5 Change in freight-adjusted revenues 59.7 56.7 43.7 59.3 82.6 86.3
65% 79% 68% 74% 72% 89%
Aggregates segment gross profit margin as a percentage of freight-adjusted revenues is not a GAAP measure. We present this metric as it is consistent with the basis by which we review our operating results. We believe that this presentation is meaningful to our investors as it excludes freight, delivery and transportation revenues which are pass-through activities. It also excludes immaterial other revenues related to services, such as landfill tipping fees, that are derived from our aggregates business. Incremental gross profit as a percentage of freight-adjusted revenues represents the year-over-year change in gross profit divided by the year-over-year change in freight-adjusted revenues. Reconciliation of this metric to its nearest GAAP measure is presented below:
Change in gross profit margin as a percentage of freight-adjusted revenues
Change in gross profit as a percentage of freight-adjusted revenues
Gross profit for 2014/2015 acquisitionsGross profit excluding acquisitions
Freight-adjusted revenues for 2014/2015 acquisitions


