17
BUILDING A BETTER TWITTER CALENDAR
| Date post: | 22-Jul-2016 |
| Category: |
Documents |
| Upload: | madalina-andreea |
| View: | 12 times |
| Download: | 1 times |

B U I L D I N G A BETTER TWITTER CALENDAR

2
TABLE OF CONTENTSIntroduction | 03
Finding a Good Tweet Cadence | 04
Tweeting at the Right Time for Site Traffic | 07
Repetitive Content: When Does Your Audience Lose Interest? | 11
10 Tips for Crafting the Perfect Tweet | 13
Conclusion | 16

3
INTRODUCTION With so many options on how to approach marketing efforts on Twitter, such as what type of Tweet to post or time of day to post, using data to drive campaigns helps ensure that brands are making the best decisions. You may already rely on some type of data to drive your Twitter campaigns, but is it enough?
In this guide, we outline best practices for understanding your Twitter audience and how to build a calendar that sets your brand up for success. We’ll cover ways to find your best cadence and frequency, time your Tweets, and craft Tweets that produce the results you want.

FINDING A GOOD TWEET CADENCE
Tips for testing your
ideal post frequency
5
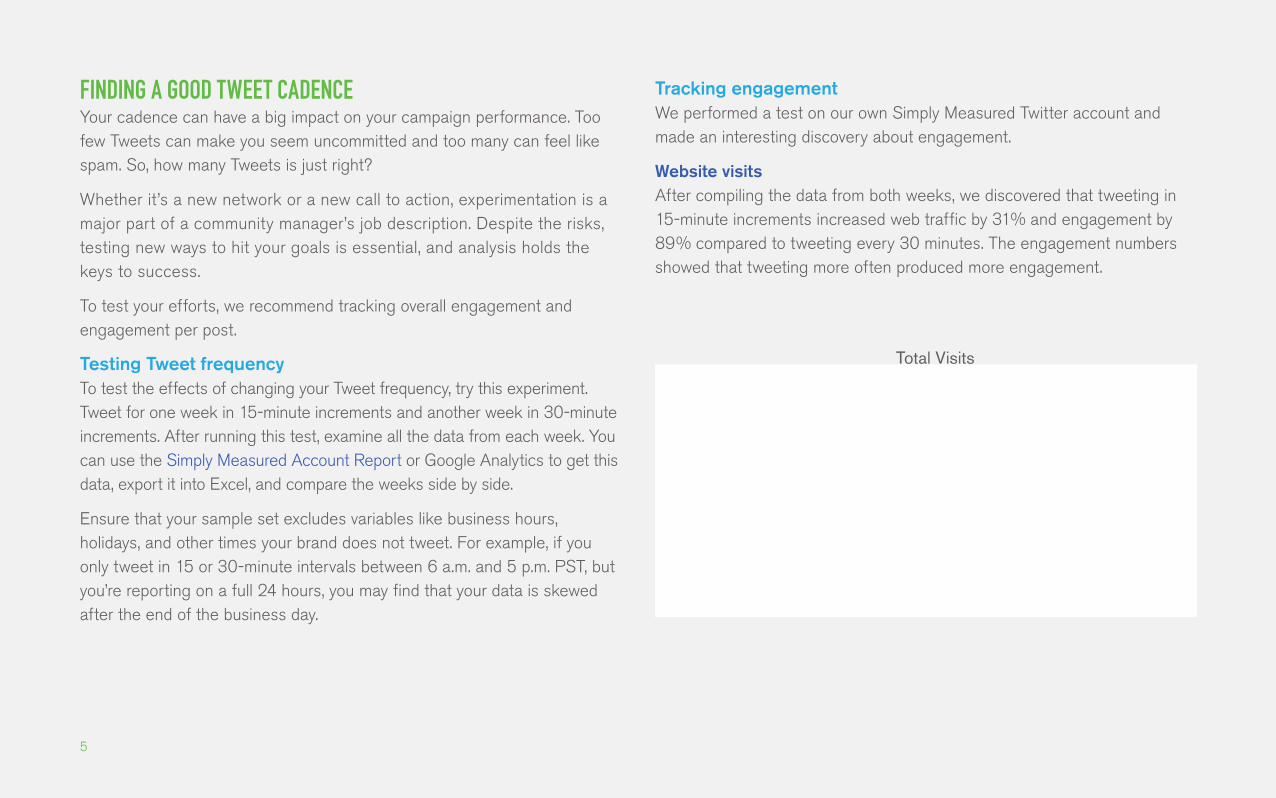
FINDING A GOOD TWEET CADENCE Your cadence can have a big impact on your campaign performance. Too few Tweets can make you seem uncommitted and too many can feel like spam. So, how many Tweets is just right?
Whether it’s a new network or a new call to action, experimentation is a major part of a community manager’s job description. Despite the risks, testing new ways to hit your goals is essential, and analysis holds the keys to success.
To test your efforts, we recommend tracking overall engagement and engagement per post.
Testing Tweet frequency To test the effects of changing your Tweet frequency, try this experiment. Tweet for one week in 15-minute increments and another week in 30-minute increments. After running this test, examine all the data from each week. You can use the Simply Measured Account Report or Google Analytics to get this data, export it into Excel, and compare the weeks side by side.
Ensure that your sample set excludes variables like business hours, holidays, and other times your brand does not tweet. For example, if you only tweet in 15 or 30-minute intervals between 6 a.m. and 5 p.m. PST, but you’re reporting on a full 24 hours, you may find that your data is skewed after the end of the business day.
Tracking engagement We performed a test on our own Simply Measured Twitter account and made an interesting discovery about engagement.
Website visits After compiling the data from both weeks, we discovered that tweeting in 15-minute increments increased web traffic by 31% and engagement by 89% compared to tweeting every 30 minutes. The engagement numbers showed that tweeting more often produced more engagement.
Total Visits
6
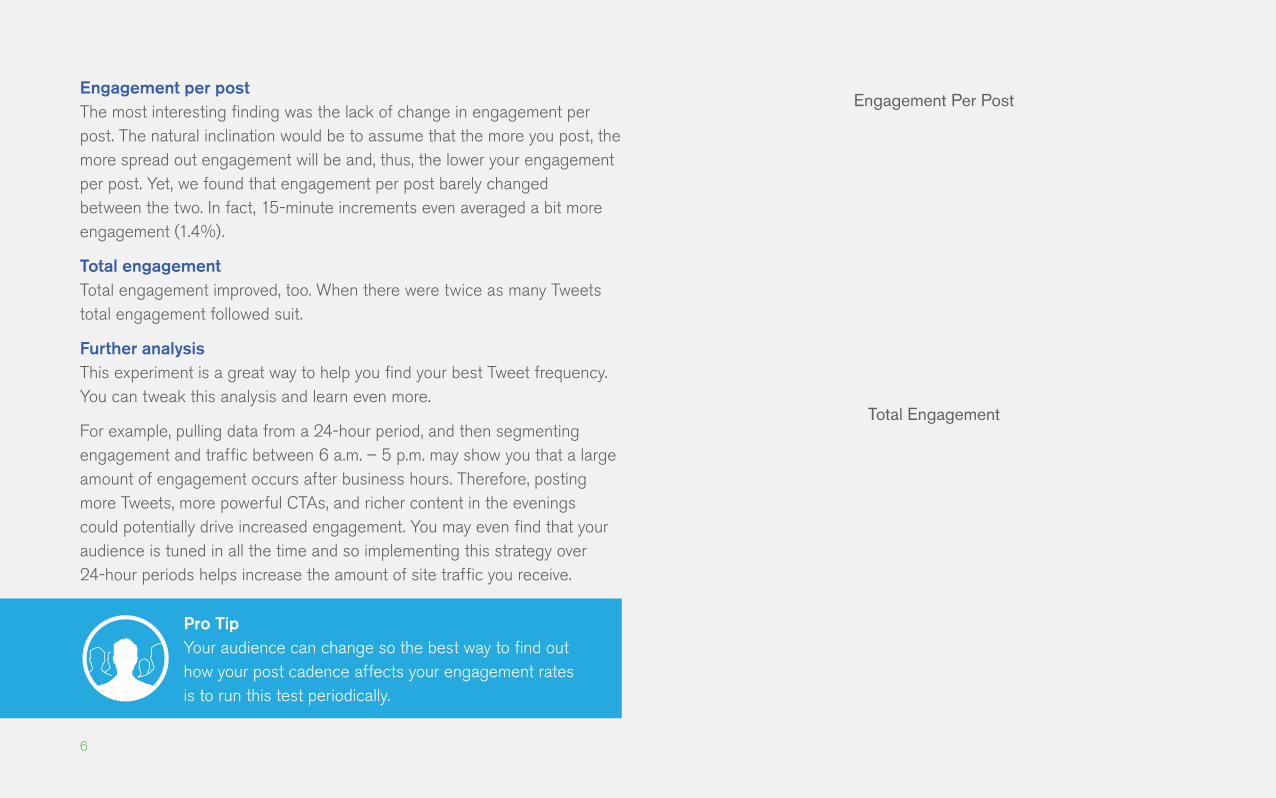
Engagement per post The most interesting finding was the lack of change in engagement per post. The natural inclination would be to assume that the more you post, the more spread out engagement will be and, thus, the lower your engagement per post. Yet, we found that engagement per post barely changed between the two. In fact, 15-minute increments even averaged a bit more engagement (1.4%).
Total engagement Total engagement improved, too. When there were twice as many Tweets total engagement followed suit.
Further analysis This experiment is a great way to help you find your best Tweet frequency. You can tweak this analysis and learn even more.
For example, pulling data from a 24-hour period, and then segmenting engagement and traffic between 6 a.m. – 5 p.m. may show you that a large amount of engagement occurs after business hours. Therefore, posting more Tweets, more powerful CTAs, and richer content in the evenings could potentially drive increased engagement. You may even find that your audience is tuned in all the time and so implementing this strategy over 24-hour periods helps increase the amount of site traffic you receive.
Pro Tip Your audience can change so the best way to find out how your post cadence affects your engagement rates is to run this test periodically.
Engagement Per Post
Total Engagement
TWEETING AT THE RIGHT TIME FOR SITE TRAFFIC
What time of day do you
get the most visitors?
8
TWEETING AT THE RIGHT TIME FOR SITE TRAFFIC Getting people from Twitter to your website is likely a key goal for your campaigns, but greater frequency isn’t always best for getting users to take action. Tweeting in 15-minute intervals, everyday, between the hours of 5 a.m. and 9 p.m. would produce 64 Tweets per day. Producing such a large number of Tweets can require a lot of effort and may or may not work for driving traffic to your website. That’s why it’s important to prioritize times and days to Tweet rather than trying to cover each hour of the day evenly. The key metric to test for site traffic is click-through data from Twitter to the brand website.
Testing Tweet times To test site traffic you’ll need two tools: your Tweet data in an Excel file and access to Google Analytics.
Gather the data You’ll want to identify how many Tweets were sent each hour. This can be done manually or by using a Simply Measured Twitter account report, but the end result you’re aiming for is a bucket of Tweets for each hour of the day.
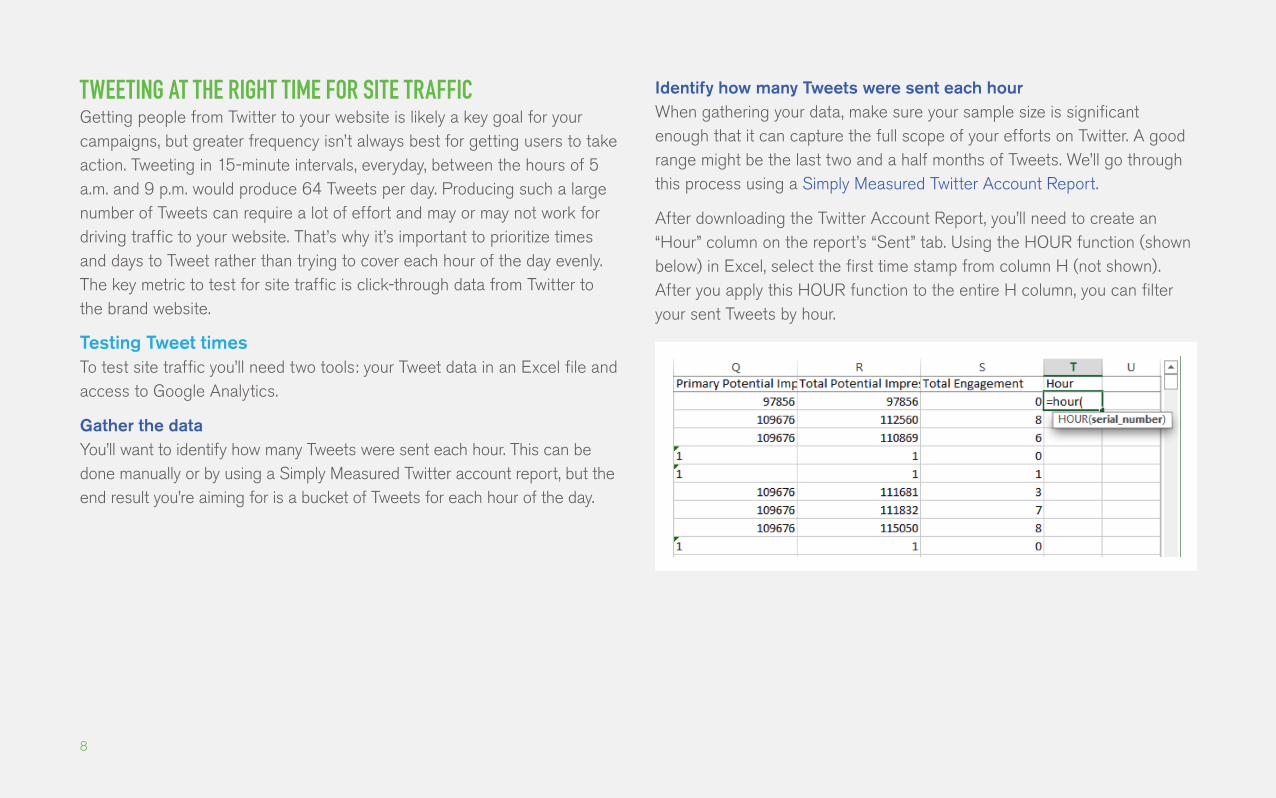
Identify how many Tweets were sent each hour When gathering your data, make sure your sample size is significant enough that it can capture the full scope of your efforts on Twitter. A good range might be the last two and a half months of Tweets. We’ll go through this process using a Simply Measured Twitter Account Report.
After downloading the Twitter Account Report, you’ll need to create an “Hour” column on the report’s “Sent” tab. Using the HOUR function (shown below) in Excel, select the first time stamp from column H (not shown). After you apply this HOUR function to the entire H column, you can filter your sent Tweets by hour.
9
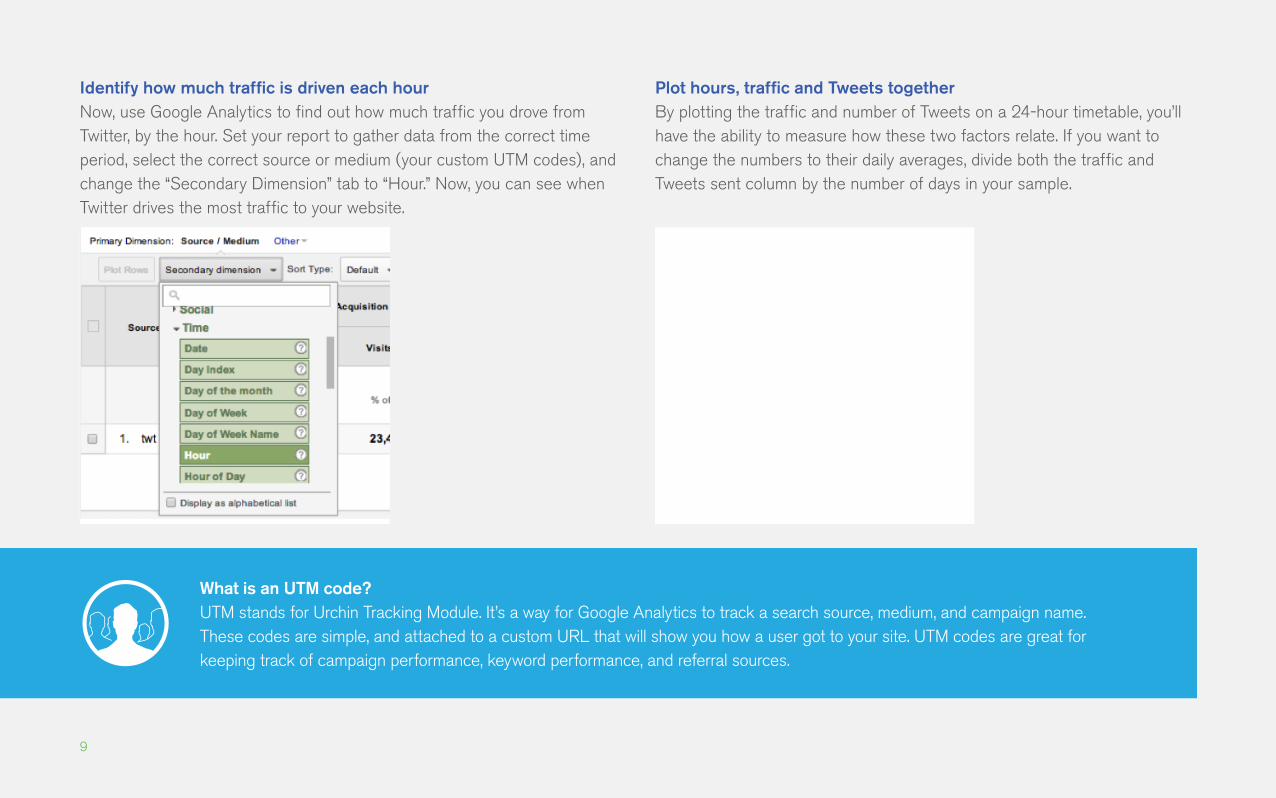
Identify how much traffic is driven each hour Now, use Google Analytics to find out how much traffic you drove from Twitter, by the hour. Set your report to gather data from the correct time period, select the correct source or medium (your custom UTM codes), and change the “Secondary Dimension” tab to “Hour.” Now, you can see when Twitter drives the most traffic to your website.
Plot hours, traffic and Tweets together By plotting the traffic and number of Tweets on a 24-hour timetable, you’ll have the ability to measure how these two factors relate. If you want to change the numbers to their daily averages, divide both the traffic and Tweets sent column by the number of days in your sample.
What is an UTM code? UTM stands for Urchin Tracking Module. It’s a way for Google Analytics to track a search source, medium, and campaign name. These codes are simple, and attached to a custom URL that will show you how a user got to your site. UTM codes are great for keeping track of campaign performance, keyword performance, and referral sources.
10
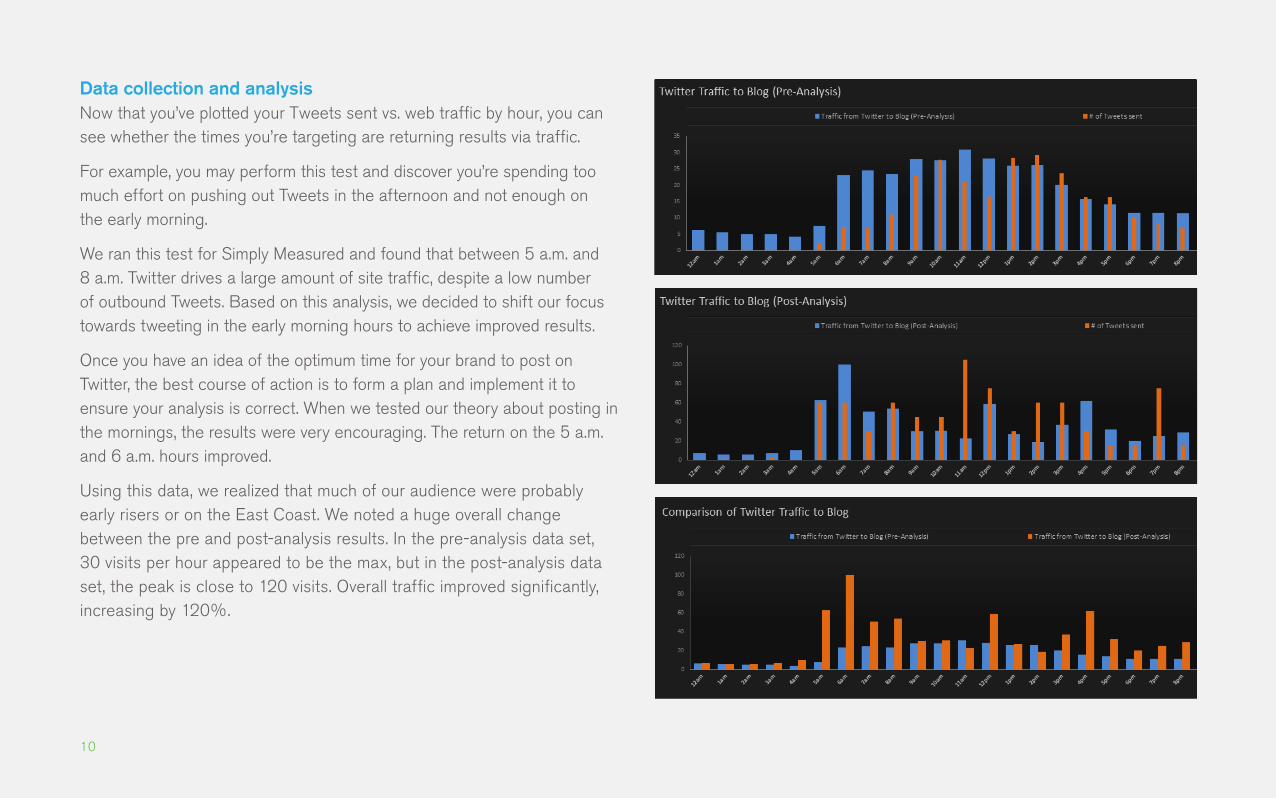
Data collection and analysis Now that you’ve plotted your Tweets sent vs. web traffic by hour, you can see whether the times you’re targeting are returning results via traffic.
For example, you may perform this test and discover you’re spending too much effort on pushing out Tweets in the afternoon and not enough on the early morning.
We ran this test for Simply Measured and found that between 5 a.m. and 8 a.m. Twitter drives a large amount of site traffic, despite a low number of outbound Tweets. Based on this analysis, we decided to shift our focus towards tweeting in the early morning hours to achieve improved results.
Once you have an idea of the optimum time for your brand to post on Twitter, the best course of action is to form a plan and implement it to ensure your analysis is correct. When we tested our theory about posting in the mornings, the results were very encouraging. The return on the 5 a.m. and 6 a.m. hours improved.
Using this data, we realized that much of our audience were probably early risers or on the East Coast. We noted a huge overall change between the pre and post-analysis results. In the pre-analysis data set, 30 visits per hour appeared to be the max, but in the post-analysis data set, the peak is close to 120 visits. Overall traffic improved significantly, increasing by 120%.

REPETITIVE CONTENT: WHEN DOES YOUR
AUDIENCE LOSE INTEREST?
Test how your audience
responds to the same post
over a period of time
12
REPETITIVE CONTENT: WHEN DOES YOUR AUDIENCE LOSE INTEREST? The words “engagement rate of decay” may sound frightening. This topic is the subject of a number of studies about how many times a piece of content can be re-sent to the same audience without fatiguing readers. One study in particular looked at the engagement rate of decay using Twitter’s lead generation cards.
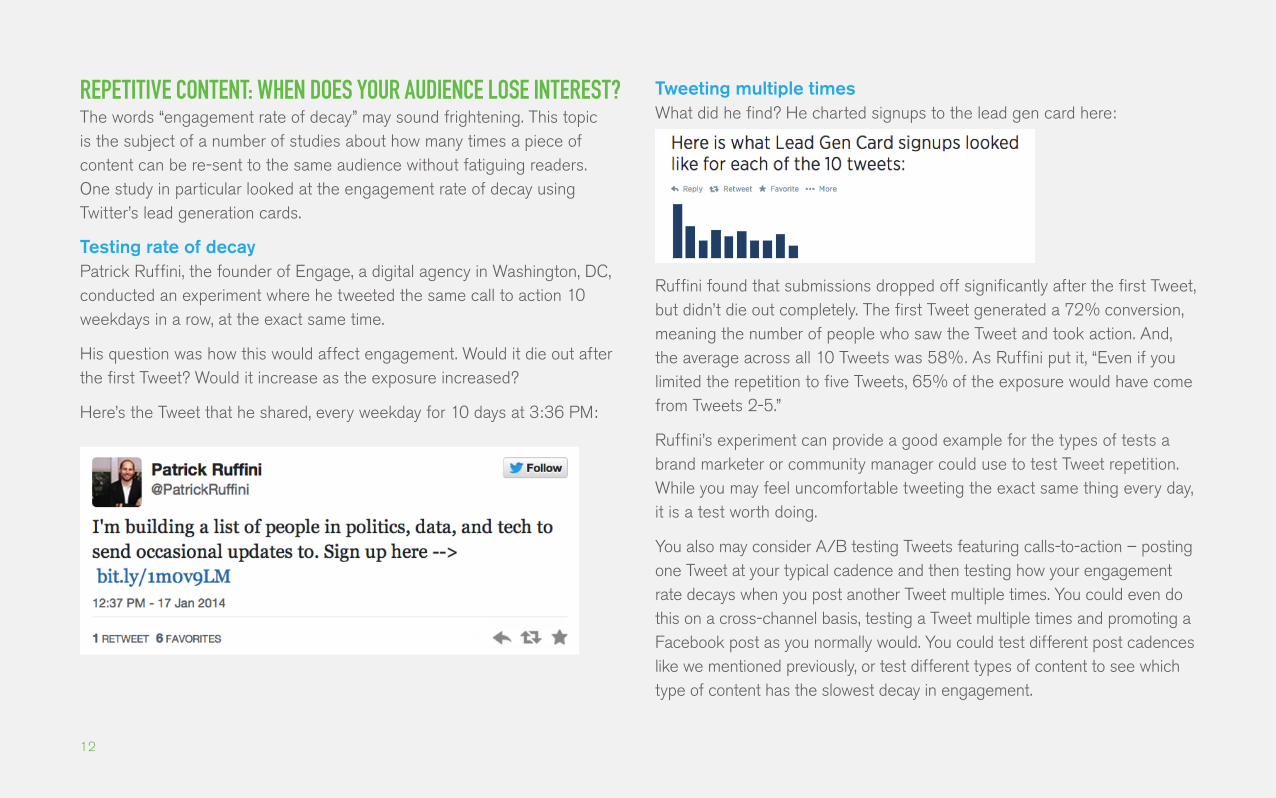
Testing rate of decay Patrick Ruffini, the founder of Engage, a digital agency in Washington, DC, conducted an experiment where he tweeted the same call to action 10 weekdays in a row, at the exact same time.
His question was how this would affect engagement. Would it die out after the first Tweet? Would it increase as the exposure increased?
Here’s the Tweet that he shared, every weekday for 10 days at 3:36 PM:
Tweeting multiple times What did he find? He charted signups to the lead gen card here:
Ruffini found that submissions dropped off significantly after the first Tweet, but didn’t die out completely. The first Tweet generated a 72% conversion, meaning the number of people who saw the Tweet and took action. And, the average across all 10 Tweets was 58%. As Ruffini put it, “Even if you limited the repetition to five Tweets, 65% of the exposure would have come from Tweets 2-5.”
Ruffini’s experiment can provide a good example for the types of tests a brand marketer or community manager could use to test Tweet repetition. While you may feel uncomfortable tweeting the exact same thing every day, it is a test worth doing.
You also may consider A/B testing Tweets featuring calls-to-action – posting one Tweet at your typical cadence and then testing how your engagement rate decays when you post another Tweet multiple times. You could even do this on a cross-channel basis, testing a Tweet multiple times and promoting a Facebook post as you normally would. You could test different post cadences like we mentioned previously, or test different types of content to see which type of content has the slowest decay in engagement.

TEN TIPS FOR CRAFTING THE PERFECT TWEET
Learn to write Tweets that
catch people’s attention

14
TEN TIPS FOR CRAFTING THE PERFECT TWEET While timing and frequency are important, we want to include some tips on what you’re actually sending out. To get a better understanding of what makes a Tweet successful, we looked at the data from the 100 top brands analyzed for our Twitter Marketing Study, and compiled traits of their top Tweets.
These ten tips are based off an analysis of over 129,000 Tweets from the Interbrand 100 top global brands. We suggest you test them on your own Twitter feeds.
1. Size matters: Use Twitter’s specified aspect ratio for your post images.
2. Use hashtags and links together: Tweets with hashtags and links outperform Tweets with just one or another.
3. Give clear CTAs: Tweets containing the word “click” average 35% more engagement than the brand average.
4. Create urgency: Tweets containing the words “right now” or “today” average higher engagement than the brand average.
15
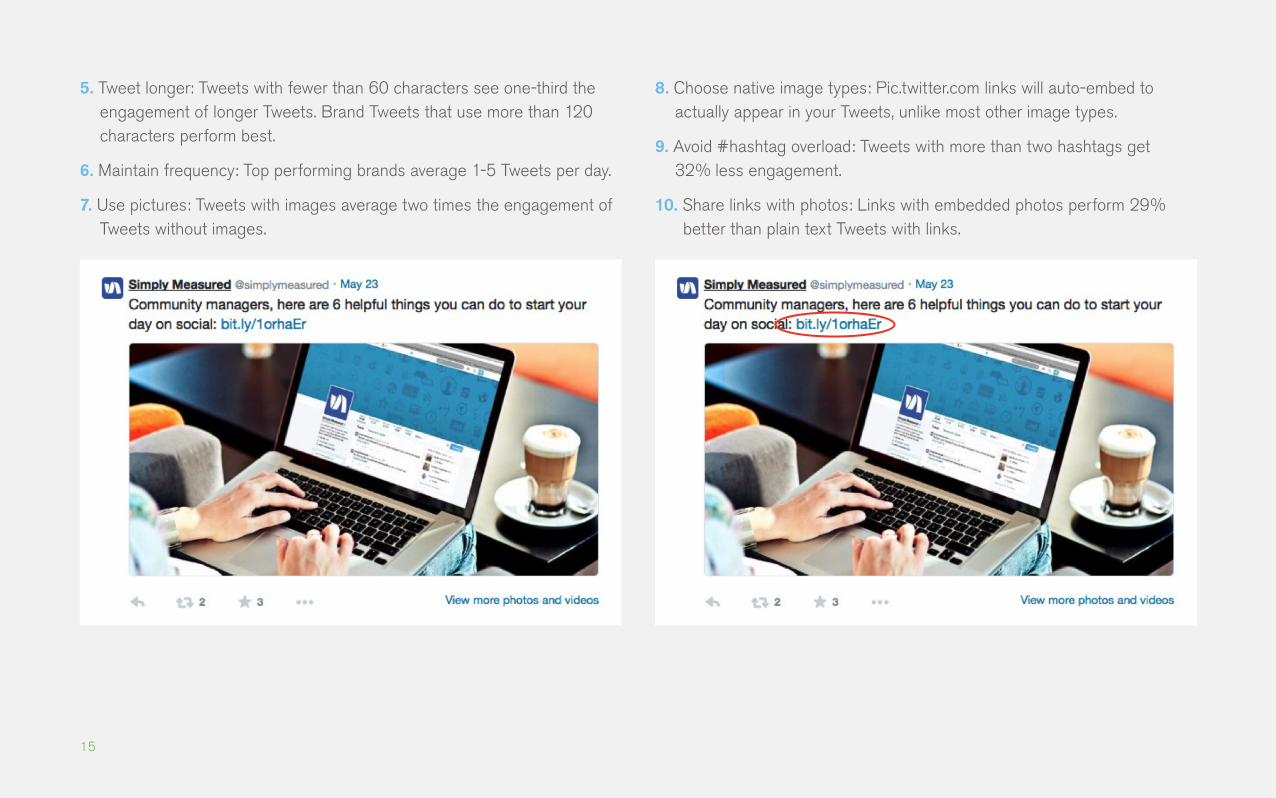
5. Tweet longer: Tweets with fewer than 60 characters see one-third the engagement of longer Tweets. Brand Tweets that use more than 120 characters perform best.
6. Maintain frequency: Top performing brands average 1-5 Tweets per day.
7. Use pictures: Tweets with images average two times the engagement of Tweets without images.
8. Choose native image types: Pic.twitter.com links will auto-embed to actually appear in your Tweets, unlike most other image types.
9. Avoid #hashtag overload: Tweets with more than two hashtags get 32% less engagement.
10. Share links with photos: Links with embedded photos perform 29% better than plain text Tweets with links.

16
CONCLUSION In your efforts to build an effective and efficient content calendar for Twitter, you can use data and experimentation to find the best cadence of posts and times to Tweet. In addition, testing your engagement rate of decay will allow you craft Tweets that earn more activity from your audience over a longer period of time. Finally, composing Tweets that have a higher impact will improve all of the Twitter content you share.

ABOUT SIMPLY MEASURED
Want to try Simply Measured?
Request a Free 14 Day Trial
Copyright © 2010–2014 Simply Measured, Inc. All Rights Reserved.
Simply Measured is a fast-growing team of data geeks dedicated to making the world of analytics and reporting a better, more beautiful place.
Our goal is to put the tools to understand business data in the hands of business users. We think reporting should be simple, beautiful, and accessible for everyone – not just data scientists. Our software streamlines the process from data to deliverables and eliminates the countless hours spent on everyday reporting tasks. We do this by putting cloud data sources at your fingertips, providing a marketplace of best practice reports, and generating beautiful deliverables on the web, in Excel, and in PowerPoint with a couple of clicks.


