180
Building business through packaging ANNUAL REPORT 2017

Building business through packaging
A N N UA L R E P O RT 2 0 1 7

Overview
Financials at a Glance 4
Who We Are 6
What We Do 7
Where We Are 8
Products 12
Innovation 14
Strategic Report
Chairman’s Statement 20
Chief Executive’s Review 24
Operations Review 28
Business Model 32
Strategy 34
Risk Report 36
Finance Review 44
Sustainability 54
People 60
Governance
Board of Directors 68
Corporate Governance Statement 72
Directors’ Report 78
Audit Committee Report 80
Remuneration Report 84
Nomination Committee Report 101
Financial Statements
Statement of Directors’ Responsibilities 104
Independent Auditors’ Report 105
Consolidated Income Statement 112
Consolidated Statement of Comprehensive Income 113
Consolidated Balance Sheet 114
Company Balance Sheet 115
Consolidated Statement of Changes in Equity 116
Company Statement of Changes in Equity 117
Consolidated Statement of Cash Flows 118
Company Statement of Cash Flows 119
Notes to the Consolidated Financial Statements 120
Shareholder Information 176

1
The Smurfit Kappa Group strives to be a customer-orientated, market led company where the satisfaction of customers, the personal development of employees and respect for local communities and the environment are seen as being inseparable from the aim of creating value for the shareholders.
AT A G L A N C E
Sustainable Growth
Integration
Geographic Diversity
Innovation
Corrugated packaging is a valuable merchandising tool as well as the most sustainable, cost effective, environmentally friendly and versatile transport and merchandising medium. We are committed to helping our customers grow sales and reduce costs.
Smurfit Kappa is an integrated business. We produce 5.9 million tonnes (over 10.8 billion square metres) of corrugated packaging using the majority of the 6.0 million tonnes of containerboard produced within our own mill system. Integration provides certainty of quality and supply of paper for our operations and, in turn, our customers.
We are a highly innovative, design-led company. With over 700 designers across our business and over 7,000 packaging concepts, we use cutting edge technology to provide innovative designs in packaging and display for our customers.
Our primary goal is to support our customers through the dedication and creativity of our people. Our people are highly motivated, well trained and have unrivalled packaging expertise which provides the foundation for our innovation.

Smurfit Kappa Annual Report 20172
VISIONOur vision is to be a globally admired business, dynamically delivering secure and superior returns for all stakeholders.

3
Strategic Report Governance FinancialsOverview
Overview
Financials at a Glance 4
Who We Are 6
What We Do 7
Where We Are 8
Products 12
Innovation 14

Well positioned for future growth in 2018 and beyond
Smurfit Kappa Annual Report 20174
F I N A N C I A L S AT A G L A N C E
R E V E N U E (€ million)
E B I T DA* (€ million)
E B I T DA M A RG I N TO R E V E N U E * (%)
N E T D E BT * (€ million)
€8,562
€1,240 14.5 €2,805
€820 €576
O P E R AT I N G P RO F I T B E FO R E E XC E P T I O N A L I T E M S (€ million)
P RO F I T B E FO R E I N CO M E TA X(€ million)
2016
830
2016
654
2017
8,562
2016
8,159
2017
820
2017
576
2017
14.5
2016
2,9411,236
20162017
1,240
2016
15.1
2017
2,805
*These financial key performance indicators are not defined under International Financial Reporting Standards (‘IFRS’). Definitions and an explanation for the use of these Alternative Performance Measures (‘APMs’) are included in the Finance Review of this Annual Report.

5
Strategic Report Governance FinancialsOverview
N E T D E BT TO E B I T DA*(ratio)
BA S I C E A R N I N GS P E R S H A R E (cent)
P R E- E XC E P T I O N A L E A R N I N GS P E R S H A R E * (cent)
2.3x
177.2 185.3
€307 15.0
F R E E C A S H F LOW *(€ million)
R E T U R N O N C A P I TA L E M P LOY E D *(%)
20162017
15.415.0
2016
189.4
2017
185.3
20162017
2.42.3
20162017
303307
189.4
20162017
177.2

Smurfit Kappa Annual Report 20176
W H O W E A R E
A leading provider of paper-based packaging solutions
Smurfit Kappa (‘SKG’), a FTSE 100 company, is one of the leading providers of paper-based packaging solutions in the world, with around 46,000 employees in approximately 370 production sites across 35 countries and with revenue of €8.6 billion in 2017. We are located in 22 countries in Europe and 13 in the Americas. We are the only large-scale pan-regional player in Latin America.
We manufacture, distribute and sell containerboard, corrugated containers and other paper-based packaging products such as solidboard, graphicboard and bag-in-box. In Europe, our business is highly integrated and includes a system of mills and plants that primarily produces a full line of containerboard that is converted into corrugated containers. Given this high degree of integration, particularly in terms of containerboard, the Group’s end customers are primarily in the corrugated packaging market, which uses the packaging for product protection and product merchandising purposes.
In Latin America, we are the largest pan-regional producer of containerboard and corrugated containers.
With our pro-active team, we relentlessly use our extensive experience and expertise, supported by our scale, to open up opportunities for our customers. We collaborate with forward thinking customers by sharing superior product knowledge, market understanding and insights in packaging trends to ensure business success in their markets. We have an unrivalled portfolio of paper-packaging solutions, which is constantly updated with our market-leading innovations. This is enhanced through the benefits of our integration, with optimal paper design, logistics, timeliness of service and our packaging plants sourcing most of their raw materials from our own paper mills.
Our products, which are 100% renewable and produced sustainably, improve the environmental footprint of our customers.
EntrepreneurshipWe value entrepreneurial spirit and a decentralised management style with staff functions challenging and supporting the operations, with experience, expertise and ingenuity.
PeopleOur goal is to attract, engage, develop and retain our 46,000 employees, offering them the opportunity to achieve their full potential in a safe and open work environment.
EnvironmentOur objective is to protect the environment and progressively improve our performance on emissions to air and discharges to water and soil.

7
Strategic Report Governance FinancialsOverview
W H AT W E D O
CustomersWe provide customers with innovative customer-focused, sustainable and cost-efficient packaging and logistics solutions.
Shareholder ReturnsOur vision is to be a globally recognised and respected business delivering secure and superior returns for all stakeholders.
Meet Stakeholder CommitmentsWe are determined to meet our commitments and will put in place the necessary resources to support their achievement.
Paper
Packaging
Recycling
Forestry
We manufacture a wide range of papers mainly used for packaging purposes. Our total global paper and board capacity is approximately 7 million tonnes per annum.
We design, manufacture and supply paper-based packaging to package, promote and protect our customers’ products. We manufacture over 10.8 billion square metres of corrugated packaging and have key supply positions in solidboard, folding carton and tube markets.
We provide recycling solutions to ensure our clients’ corrugated packaging and paper is recycled responsibly, efficiently and reliably. We reprocess over 6 million tonnes of recovered paper across the globe.
We own approximately 103,000 hectares of forest globally. Our forest estate management is based on sustainable development principles, promoting economic growth, a responsible use of natural resources and fostering social equity.

Smurfit Kappa Annual Report 20178
W H E R E W E A R E
As a world leader in paper-based packaging, we have operations in 35 countries across the globe
Our two operating segments in Europe and the Americas consist of approximately 370 operations across 35 countries. The Europe segment, which is highly integrated, includes a system of mills and plants that primarily produces a full line of containerboard, that is converted into corrugated containers, in addition to other types of paper, such as solidboard and sack kraft paper, and paper-based packaging, such as solidboard packaging and folding cartons. This segment includes the Group’s bag-in-box operations. The Americas segment comprises all the Group’s forestry, paper, corrugated, paper sack and folding carton activities in a number of Latin American countries and in the United States.
We operate in 22 countries in Europe and are the European leader in corrugated packaging and containerboard with key positions in several other packaging and paper market segments. We also have three bag-in-box facilities, located in Argentina, Canada and Mexico, which are managed as part of our European
bag-in-box operations. The Group operates in 13 countries in the Americas and is the largest pan-regional producer of containerboard and corrugated containers in Latin America.
In terms of world market positions, the Group is one of the largest producers of corrugated packaging.
The Group’s large manufacturing footprint provides it with a competitive advantage because the corrugated packaging market is a localised market and corrugated box plants need to be close to customers (generally 300 kilometres or less) due to the relatively high cost of transporting the product. Approximately 60% of the Group’s corrugated customers are in the fast moving consumer goods (‘FMCG’) sector, comprising food, beverage and household consumables, the remainder being split across a wide range of different industries.
In 2017, the Group’s Europe and Americas segments accounted for approximately 75% and 25% of revenue respectively.
O U R B U S I N E S S I N N U M B E RS
M I L L S
36
OT H E R P RO D U C T I O N FAC I L I T I E S
33
CO N V E RT I N G P L A N TS
248
TOTA L CO U N T R I E S O F O P E R AT I O N
35
F I B R E
48FO R E ST RY P L A N TAT I O N S ( H ECTA R ES)
103,000
O U R G LO BA L SA L E S VO LU M E S
E U RO P EVolumes (Million Tonnes)
Kraftliner 1.6
Recycled Containerboard 3.1
Other Paper & Board 0.8
Corrugated 4.5
Solidboard Packaging 0.1
T H E A M E R I C A S Volumes (Million Tonnes)
Containerboard 1.3
Other Paper & Board 0.3
Corrugated 1.4
Other Paper-based Packaging 0.1

9
Strategic Report Governance FinancialsOverview
G RO U P O P E R AT I O N S
Virgin Mills
Recycled Mills
Corrugated
Cartons
Paper Sacks
Bag-in-box
Recovered Fibre
Forestry

A N I N T EG R AT E D M O D E L
PRODUCTSOur world-class, award winning, paper-based packaging designers are setting the global benchmark for creativity and innovation. They work closely with our customers, continuously striving to develop new, innovative and sustainable products to help our customers meet and exceed their evolving requirements.
Smurfit Kappa Annual Report 201710

11
Strategic Report Governance FinancialsOverview

Smurfit Kappa Annual Report 201712
P R O D U C TS
Retail Ready Packaging Huggies
The right packaging makes products highly visible and easier to navigate, reinforcing the brand and driving sales.
E-commerce Packaging La Poste-Colissimo
Our e-commerce packaging always provides the highest levels of protection and delivers the ultimate unboxing experience.
Point of Sale Displays Bull Dog
Our point of sale displays help brands to attract shopper attention and alert them to new products
or promotions which drives increased sales.
Bag-in-box Packaging Wyld Wood
The shelf life of liquid, or semi-liquid food products, can be extended with one of our innovative bag-in-box solutions.

13
Strategic Report Governance FinancialsOverview
Industrial Packaging
Budweg
We have analysed over 45,000 supply chains globally to ensure products arrive
in optimal condition, no matter how demanding the requirements.
Consumer Packaging Deanston
Our holistic approach to consumer packaging design considers the vital role it plays in attracting and communicating a brand’s value to shoppers.
Standard Packaging Boni
We supply cost effective and risk-free solutions by applying our unique performance packaging
technology.
Food Packaging Riviere
Our range of paper-based food contact packaging ensures that goods remain fresh and protected whilst meeting all the relevant legislative requirements for food hygiene.
Smurfit Kappa Annual Report 201714
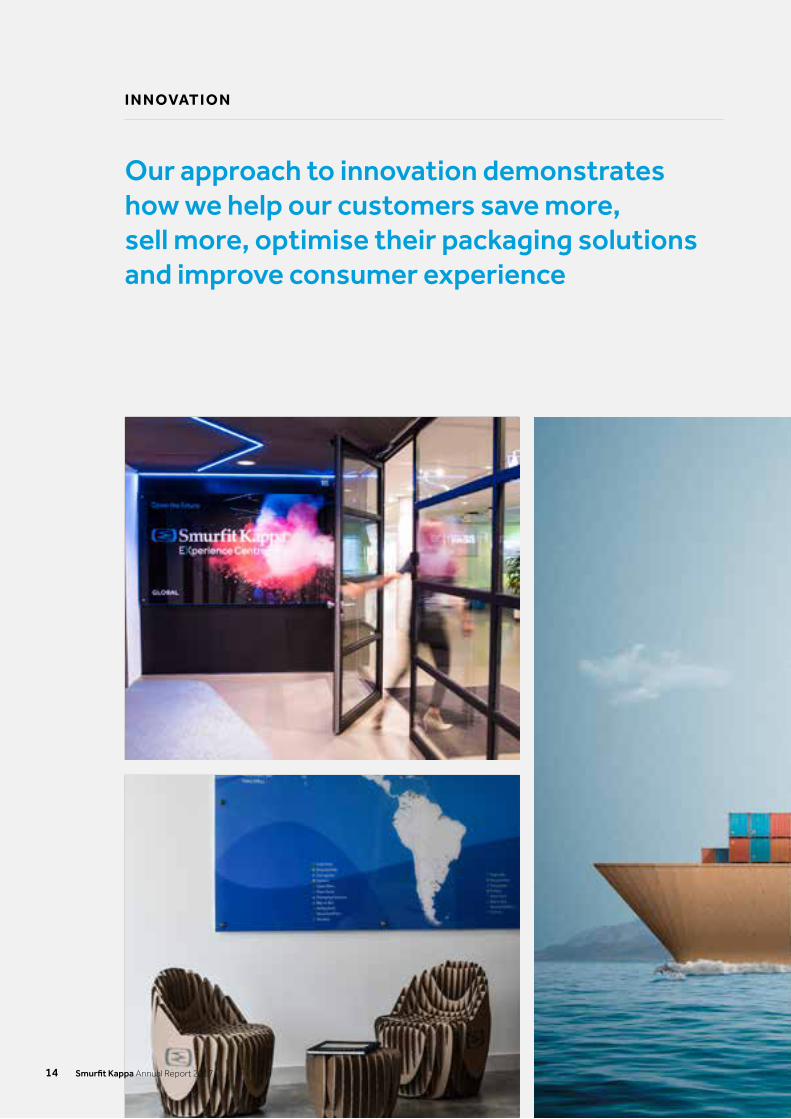
I N N OVAT I O N
Our approach to innovation demonstrates how we help our customers save more, sell more, optimise their packaging solutions and improve consumer experience

15
Strategic Report Governance FinancialsOverview
H OW W E I N N OVAT E
Our innovation process starts by understanding our customers’ markets
Knowledge, experience and passion
The science of innovation
Innovation challenges the status quo and is a fundamental part of our strategy. Our approach to innovation is market driven and focused on solving our customers’ challenges. Whether through product development, process improvement or optimising supply-chain efficiency, our innovation process starts by understanding our customers’ markets.
At Smurfit Kappa, innovation is data driven. We therefore have a supporting network of laboratories, facilities and applications to help us create fit-for-purpose, cost-effective and sustainable packaging solutions. Our unique services, such as SupplySmart, ShelfSmart and eSmart described below, are based on scientific knowledge of how packaging behaves in the supply chain, so we can optimise the performance of the packaging to deliver tangible business benefits
We look past our products and go one step further to provide our customers with the best data and analysis to make better business decisions with minimal risk.
Our primary goal is to support our customers through the dedication and creativity of our people. Our people are highly motivated, well trained and have unrivalled packaging expertise which provides the foundation for our innovation.
A customer focus

Smurfit Kappa Annual Report 201716
I N N OVAT I O N
S M A RT A P P L I C AT I O N S A N D M AC H I N E SYST E M S E X P E RT I S E H E L P O U R C U STO M E RS W I N I N T H E I R M A R K E T P L AC E
SupplySmart Driving supply chain performance through optimised packaging solutions Analysing supply chains to give credible cost take-out options Ensuring that your packaging is fit for purpose, not just lower cost Scientifically backed approach 60,000 supply chains analysed Packaging and automation, we understand both worlds
ShelfSmart Increasing the visibility and on shelf presence of our customers’ product Increased visibility improves the probability of the product being purchased Data from over 50,000 shoppers analysed Scientifically backed approach Early adopters seeing their sales increase by over 10%
eSmart Driving eCommerce growth through packaging Focusing on 12 key areas, including packaging processes, supply chain
efficiency and consumer experience Optimising the packaging portfolio Over 500 eCommerce packaging designs created 4,000 eCommerce supply chains analysed
Machine Systems Building machine systems since 1967 8,200 machines installed Enabling customers to increase productivity and reduce labour costs Enabling customers to optimise their packaging design for on shelf presence Supported by industry leading depth of data

Strategic Report Governance FinancialsOverview
17
G LO BA L N E T WO R K O F E X P E R I E N C E C E N T R E S
Helping change how corrugated packaging is perceivedOur worldwide Experience Centres are a way for us to share knowledge with customers and help them gain real business value from hands-on experience.
When people discuss the power of experience in packaging, it’s usually in relation to the end consumer. Whether it’s the way a product is presented on a shelf, or how a package opens when an online delivery arrives, retailers and marketers focus on impressing consumers to create a ‘moment of truth’ – driving a purchase or inspiring future brand loyalty.
Of course these are vitally important moments in the packaging lifecycle – but there are countless others occurring throughout the supply chain, such as packing, palletisation and distribution to name a few. And each of these details can mean the difference between a product arriving on time and in perfect condition, or turning up late and damaged.
We created the Smurfit Kappa Experience Centres to give our customers hands-on experience of the impact of packaging at every step of the supply chain, right through to the shopper and consumer. We believe it’s incredibly powerful to be able to see the different stages at work in the packaging process, to problem solve in real-time and be inspired by what others have done.
During the year, the Group continued to expand its network of Global Experience Centres opening our first centres in the Americas in Dallas, Texas, and in Cali, Colombia. The expansion of our Global Experience Centre network continues to drive real value for customers and fundamentally changes how corrugated packaging is seen within our customers’ world.
Currently, the Group has 23 Experience Centres and plans to open more across Europe and the Americas in 2018. At these centres, customers come to explore how packaging can meet their business needs, learn from leading behavioural insights, analyse supply chain trends and observe our advanced packaging and design tools.

A N I N T EG R AT E D M O D E L
CORRUGATED PLANTSOur corrugated plants are continuously delivering high quality, innovative, sustainable and biodegradable packaging to our customers. Smurfit Kappa is one of the largest producers of corrugated packaging in the world. Pictured is the corrugator at our Smurfit Kappa March facility in the UK.
Smurfit Kappa Annual Report 201718

19
Strategic Report Governance FinancialsOverview
Strategic Report
Chairman’s Statement 20
Chief Executive’s Review 24
Operations Review 28
Business Model 32
Strategy 34
Risk Report 36
Finance Review 44
Sustainability 54
People 60
Smurfit Kappa Annual Report 201720
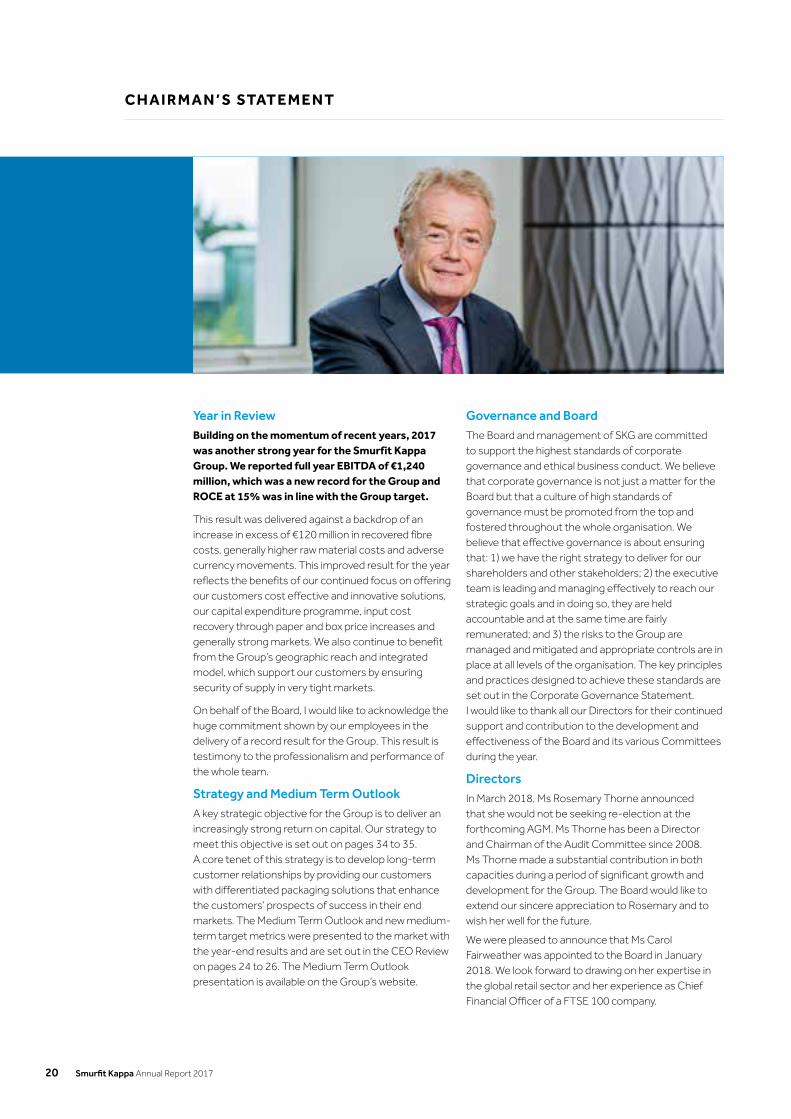
C H A I R M A N ’ S STAT E M E N T
Year in ReviewBuilding on the momentum of recent years, 2017 was another strong year for the Smurfit Kappa Group. We reported full year EBITDA of €1,240 million, which was a new record for the Group and ROCE at 15% was in line with the Group target.
This result was delivered against a backdrop of an increase in excess of €120 million in recovered fibre costs, generally higher raw material costs and adverse currency movements. This improved result for the year reflects the benefits of our continued focus on offering our customers cost effective and innovative solutions, our capital expenditure programme, input cost recovery through paper and box price increases and generally strong markets. We also continue to benefit from the Group’s geographic reach and integrated model, which support our customers by ensuring security of supply in very tight markets.
On behalf of the Board, I would like to acknowledge the huge commitment shown by our employees in the delivery of a record result for the Group. This result is testimony to the professionalism and performance of the whole team.
Strategy and Medium Term OutlookA key strategic objective for the Group is to deliver an increasingly strong return on capital. Our strategy to meet this objective is set out on pages 34 to 35. A core tenet of this strategy is to develop long-term customer relationships by providing our customers with differentiated packaging solutions that enhance the customers’ prospects of success in their end markets. The Medium Term Outlook and new medium-term target metrics were presented to the market with the year-end results and are set out in the CEO Review on pages 24 to 26. The Medium Term Outlook presentation is available on the Group’s website.
Governance and BoardThe Board and management of SKG are committed to support the highest standards of corporate governance and ethical business conduct. We believe that corporate governance is not just a matter for the Board but that a culture of high standards of governance must be promoted from the top and fostered throughout the whole organisation. We believe that effective governance is about ensuring that: 1) we have the right strategy to deliver for our shareholders and other stakeholders; 2) the executive team is leading and managing effectively to reach our strategic goals and in doing so, they are held accountable and at the same time are fairly remunerated; and 3) the risks to the Group are managed and mitigated and appropriate controls are in place at all levels of the organisation. The key principles and practices designed to achieve these standards are set out in the Corporate Governance Statement. I would like to thank all our Directors for their continued support and contribution to the development and effectiveness of the Board and its various Committees during the year.
DirectorsIn March 2018, Ms Rosemary Thorne announced that she would not be seeking re-election at the forthcoming AGM. Ms Thorne has been a Director and Chairman of the Audit Committee since 2008. Ms Thorne made a substantial contribution in both capacities during a period of significant growth and development for the Group. The Board would like to extend our sincere appreciation to Rosemary and to wish her well for the future.
We were pleased to announce that Ms Carol Fairweather was appointed to the Board in January 2018. We look forward to drawing on her expertise in the global retail sector and her experience as Chief Financial Officer of a FTSE 100 company.

21
Strategic Report Governance FinancialsOverview
Ms Fairweather brings an extensive range of skills and experience to the Board and will be a valuable contributor to the future success of SKG. It is planned that Carol will become Chairman of the Audit Committee following the forthcoming AGM.
Operational VisitsAs part of an ongoing programme, the Board travelled to Austria during the year where we visited our Nettingsdorfer mill and our Interwell corrugated operation, toured the plants and met the local management teams during the visit. The Board was also pleased to meet and review our current performance and medium-term strategy with the senior management teams from Europe and the Americas. These visits continue to be extremely valuable in giving the members of the Board a deeper first-hand understanding of the strength and extent of our local businesses, their strategic positioning and the enterprise of our teams at all levels throughout the organisation. During 2017, I made additional visits to various facilities in Europe and in the Americas, covering mills, corrugated plants and other operations. As always, I came away extremely impressed by the competence and commitment of our people right across our operations.
DifferentiationThe Group has a business profile that is unique and sets us apart from our peers and with operations in Europe, North America and Latin America, our geographic footprint and diversity are key strengths. We continue to be the best-positioned supplier of differentiated paper-based packaging solutions in our chosen markets, providing customers with innovative, consumer-focused, sustainable and cost-efficient packaging and logistics solutions that in turn helps to drive the sale of their products.
The Group differentiates itself in the market through a continuous focus on providing better insights into customer requirements, through superior service, quality and delivery and through our strong customer relationships. Our proactive team draws upon our extensive experience and expertise and, together with the benefits and capability provided by the scale of our converting operations, all supported by our self-sufficiency in paper supply, to open up opportunities for our customers. We collaborate with forward-thinking customers by sharing our superior product knowledge, our market understanding and our insights into packaging trends to help our customers achieve business success in their markets. We have an unrivalled portfolio of paper-packaging solutions, which we constantly update with our market-leading innovations. The benefits of this are enhanced by our strong vertical integration which includes optimal paper design, quality, logistics,
timeliness of service and the fact that our packaging plants source most of their paper from our own mills.
As we start 2018, the benefits of paper-based packaging are being increasingly recognised as the most sustainable, biodegradable solution for both our customers and their end customers. SKG continues to invest in and develop these innovative and sustainable packaging applications which will further broaden our product portfolio. These investments will continue to ensure security of supply for our customers and help them address growing trends such as e-commerce and increasing supply chain complexity.
The Group is clearly established as a key partner to many of our customers, working in their industries and in many cases within their operations to define and meet their increasingly complex packaging needs. This is evidenced by the sizeable market share that SKG has with the major international branded companies as well as with local customers in the 35 countries in which we operate. Customer partnering is an area on which we continue to place significant emphasis and which will see important ongoing developments over the next number of years.
SustainabilityEnvironmental responsibility, corporate social responsibility (including our most important responsibility – safety) and circular business models that use resources efficiently are all becoming ever more essential to global business operations. All three of these are at the heart of our sustainable business model and Board and management have adopted them as core values at SKG. We welcome and embrace the challenge to make our products, operations, raw materials and supply chain more environmentally sustainable, more circular and more socially robust year-on-year and, in doing so, to make a contribution to tackling climate change. As well as the challenges and business opportunities it provides, we see sustainability as a key platform for differentiation in a competitive market and I am particularly pleased to acknowledge the third-party recognition of our work in this area, especially the awards we have received from key customers and industry groups.
This is covered in greater detail in our tenth annual Sustainable Development Report, for a summary of which see pages 54 to 58 of this Annual Report. The full report is available on the Sustainability page of the Group’s website.

Smurfit Kappa Annual Report 201722
AcquisitionsThe Group completed three acquisitions in 2017, primarily in Russia and Greece, for a total consideration of approximately €55 million. We acquired an integrated corrugated plant in Moscow making us the largest international corrugated packaging producer in Russia. We also entered the Greek market for the first time by purchasing a high-end display and corrugated business in Thessaloniki which provides us with a platform for future expansion in the region. The Group continues to evaluate potential acquisitions capable of delivering long-term value and is well positioned to pursue any opportunities that arise. Through suitable disciplined acquisitions and organic growth, supported by our ongoing capital investment programme, we remain committed to developing and strengthening our global reach and further improving our packaging offering to multinational customers.
Capital StructureThe Group has a stable financing base with a long-term and well-spread maturity profile. The Group’s credit rating of Ba1/BB+ contributes to a lower cost of capital and access to the widest range of financing options available. These positions were achieved as a result of the Group’s continuing consistent ability to generate strong free cash flows together with active management of its debt portfolio. The strength of the Group’s capital base together with consistent delivery of strong free cash flows provides a solid and cost effective support to the Group’s growth agenda over the medium-term.
DividendsReflecting the Board’s continued confidence in the strength and capabilities of the business, we are proposing a 12% increase in the final dividend from 57.6 cent to 64.5 cent per share. Combined with an interim dividend of 23.1 cent per share paid in October 2017, this will bring the total dividend to 87.6 cent, a 10% increase year-on-year. This is the sixth consecutive year of significant dividend increase, reflecting that fact that our dividend is a core component of our commitment to driving value for shareholders.
OutlookWhile we continue to experience currency volatility, wage inflation as well as higher energy and other input costs, 2018 has seen the continuation of good demand in Europe, further input cost recovery and signs of improvement in our Americas business. The Group has exciting plans in place to continue the development of our business, enhance our industry leadership into the future and, in the process, deliver ongoing strong returns for our shareholders.
Liam O’Mahony Chairman

Strategic Report Governance FinancialsOverview
23

Smurfit Kappa Annual Report 201724
C H I E F E X EC U T I V E ’ S R E V I E W
2017 OverviewI am pleased to report our full-year EBITDA was €1,240 million, a record for the Group, with an EBITDA margin of 14.5%.
In Europe, EBITDA increased by 3% to €955 million. This was achieved despite increased raw material input costs and adverse currency impacts. Average recovered fibre input prices were 14% higher for the full year. The benefits of prior years’ capital investments, input cost recovery together with strong volume growth were fundamental in achieving this result. EBITDA margin for the year was 14.9% against 15.1% in 2016. Reported box volume growth was over 3% for the full year. Adjusting for acquisitions and working days, the year-on-year growth in total corrugated volume was over 3% for the year.
Input cost recovery in corrugated pricing continued to progress throughout the year with further progress expected in 2018.
The strength of the Group’s European integrated model has delivered security of supply to all our customers in what has been an extremely tight market. This security of supply ensures our customers have a sustainable, biodegradable packaging solution that meets their supply chain requirements, available at all times and from certified sustainable sources.
In recycled containerboard, price increases of over €100 per tonne achieved earlier in 2017 were maintained, buoyed by strong demand. Due to increased demand, rising input costs in raw materials, energy, chemicals and labour and a volatile outlook for recovered fibre costs, the Group announced a further price increase of €60 per tonne in December. Against a backdrop of weakening recovered fibre prices, a price increase of €30 per tonne was implemented in February 2018.
Kraftliner has remained in tight supply through 2017 with the Group implementing price increases totalling €150 per tonne during the year. As in the case of recycled containerboard, with demand for kraftliner containerboard remaining robust, the Group announced a further price increase of €60 per tonne in December, €30-€40 per tonne of which was implemented in February 2018. Our integrated position remains a key differentiator in meeting our customers’ packaging requirements at a time of scarce availability, especially in kraftliner.
In 2017, the Group completed the acquisitions of Soyuz, near Moscow in Russia, and Chatziioannou, near Thessaloniki in Greece. The Group also acquired the assets of Litbag, a Portuguese producer of bags for bag-in-box.
Recovered fibre costs were also higher year-on-year in the Americas. The Group continues to anticipate a long-term upward trend in pricing for this raw material.
In the Americas, EBITDA at €311 million was down 8% on 2016. The EBITDA margin in the Americas for the year reduced to 14.4% from 16.8% in 2016. Corrugated volumes increased by 2% year-on-year excluding Venezuela.
The results were impacted by a number of factors including: increased export prices for containerboard from the United States into Latin America, where our system is short of kraftliner; an increase of 26% in recovered fibre costs; adverse currency movements; adverse natural events; and some countries that experienced an unexpected slowdown in the fourth quarter which now shows signs of reversing.
The Group continues to recover these input cost pressures as we move into 2018. The region will also benefit in 2018 from the investments made in our mill in Los Reyes in Mexico as well as the expansion of the Papelsa mill in Colombia. At full run rate, these two projects will integrate an additional 140,000 tonnes of containerboard into our corrugated system.

25
Strategic Report Governance FinancialsOverview
Capital StructureNet debt was €2,805 million at the end of December, resulting in a net debt to EBITDA ratio of 2.3x compared to 2.4x at the end of 2016. The Group’s balance sheet continues to provide considerable financial strategic flexibility, subject to the stated leverage range of 2.0x to 3.0x through the cycle and SKG’s Ba1/BB+ credit rating.
At 31 December 2017, the Group’s average interest rate was 4.1% compared to 4.3% at 31 December 2016. The Group’s diversified funding base and long dated maturity profile of 3.4 years provide a stable funding outlook.
As a key focus we will continue to balance the maintenance of a strong capital structure with our growth objectives through 2018 and beyond.
Medium Term OutlookAs part of a ground up strategic review over the last year with each of our approximately 370 operating units across the globe, we have developed an extensive market/customer driven plan for the next four to five years to support our customer offering.
We intend to:
n Use our innovative market offering and leading sustainability credentials to enhance box demand
n Deliver on multiple sources of earnings growth
n Deploy capital to deliver increased long-term returns either through capital expenditure or M&A
The plan assumes demand growth not solely reliant on market/GDP but also as a result of SKG’s innovation led growth as we develop customer relationships both existing and prospective using our unique business applications coupled with our value selling process to grow profitably in the marketplace.
Against this backdrop of demand growth, inflationary cost pressures across our manufacturing cost bases, we plan to invest across three main areas:
n Having identified the growth areas of our business, investing to achieve that growth and associated return
n Maintaining the paper balance and integration of our system to ensure the continuous supply of our innovative paper products to our packaging solutions system and to continue to ensure certainty of supply to our end customers
n Cost reduction projects to ensure that the returns and value created and maximised through management of both the fixed and variable cost elements of our business are maintained
This investment plan is both ambitious and flexible. However, should an M&A opportunity present itself which negates the requirement for internal investment, we have the ability to flex our plans accordingly.
Today we see an opportunity to enhance returns by increasing our spend above maintenance capital expenditure by approximately €1.6 billion over the next four years. This will result in a total capital expenditure outlay of approximately €2.9 billion over the period.
A copy of the Medium Term Outlook presentation is available on the Group’s website.
Medium Target MetricsUpon completion and the full ramp up of our investment plans, we are targeting a new ROCE target through the cycle of 17%.
Our credit rating has been the solid underpin to all our capital allocation decisions, designed to give certainty to our stakeholders in relation to the strength of our balance sheet. We are targeting a new reduced net debt to EBITDA range of 1.75 times to 2.5 times through the cycle.
Commercial Offering and InnovationSKG has an unrivalled market offering which helps our customers succeed in their chosen markets. This is underpinned by our unique differentiation and market understanding as well as our market-leading product innovations, all of which are supported by our ongoing capital expenditure programmes and our leading sustainable business practices across all operations.
The scale of our operations, together with our extensive experience and expertise, enable us to open up opportunities for our customers. We work together with our customers as much as possible – sharing product knowledge and market understanding and insights into packaging trends to help bring them tangible success in their markets. We have an unrivalled portfolio of paper-packaging solutions, which we are constantly updating with market-leading innovations.
During the year the Group continued to expand its network of global experience centres with the opening in June of our first centre in the Americas in Dallas, Texas. In October, we opened our first Experience Centre in South America in Cali, Colombia. The expansion of our global experience centre network continues to drive real value for customers and fundamentally changes how corrugated packaging is seen within our customers’ world. The Group opened an Experience Centre in Mexico City in the first quarter of 2018.
In 2017, the Group added to the existing portfolio of industry leading business applications that help our customers win in their marketplace. Our unique eCommerce packaging service, eSmart, launched in October 2017, allows our experts to scrutinise and optimise the performance of our customers packaging across 12 different areas, from optimising their planning and increasing supply chain efficiency to delivering a positive customer experience. SupplySmart, launched in September 2017, is a combination of unique tools, data and expertise, enabling our customers to optimise the role of packaging
Smurfit Kappa Annual Report 201726
C H I E F E X EC U T I V E ’ S R E V I E W ( CO N T I N U E D )
across their supply chains, giving them reassurance that they can make fully risk assessed decisions that will deliver measurable cost savings.
These services complement ShelfSmart, launched in 2016, an application that allows our brand owners to use the Group’s technology to evaluate, measure and validate their on-shelf shopper marketing strategies in test conditions, rapidly delivering optimised Shelf-Ready Packaging that disrupts and engages shoppers.
The Group was recognised with 43 awards for design, print and sustainability across our global operations in 2017, with 17 awards in the fourth quarter alone. These awards were spread across Colombia, the Czech Republic, France, Germany, Ireland, the Netherlands, Poland, Russia, Switzerland and the United Kingdom.
I would like to thank all our customers worldwide for the continuing confidence and trust they place in us and we look forward to continuing to work with them to enhance their success in their marketplaces.
Corporate Social ResponsibilityIn our tenth annual Sustainable Development Report, released in May 2017, we highlighted the Group’s continued progress and commitment to social and environmental best practices. As part of the Group’s commitment to the local communities in which we have the privilege to operate, our local operations made, in conjunction with our related foundations, close to €5 million of social investments focused on the education of disadvantaged children and young people. SKG is a leader in the area of corporate social responsibility, which has been recognised by a number of third party organisations, and we are committed to supporting the communities in which we operate.
Our PeopleOur key competitive advantage and point of differentiation is our people, both as individuals and as members of cohesive teams. Our continued focus is on recruiting, developing, motivating and retaining skilled employees dedicated to working as a team to support and service our diverse customer base. In our People Vision, we strive to be a great place to work for all our employees and a company of choice for targeted talent.
In 2017, our second global employee engagement survey, MyVoice, was held, building on the first survey that took place in 2014. With 84% of our employees taking the time to participate in the survey, we have the assurance that our employees have confidence in MyVoice as an effective opportunity to have their voice heard on their work experience in Smurfit Kappa.
We recorded improvements in all our regions (Group, Europe and the Americas), with engagement levels up in all the different drivers of our engagement model. At the same time, further areas of improvement arose and specific areas of intervention were identified, reconfirming that engagement is a continuous journey.
The safety of every member of the workforce is a key consideration for the Group. In 2017, the Health and Safety performances of the Group improved significantly, reaching the lowest ever level of Lost Time Accident frequency in our recent history. This achievement opens up the opportunity to move to a more sophisticated Health and Safety metric in 2018, the Total Recordable Injury Rate (‘TRIR’) frequency. While the Health and Safety performances of the Group improved significantly in 2017, tragically, two employees sustained fatal injuries in separate accidents during the year, details of which are set out in the Sustainability review.
I would like to acknowledge the effort and commitment of our approximately 46,000 employees in the 35 countries in which we operate for their significant contribution to the results achieved in 2017. We look forward to the opportunities of 2018, to delivering on our medium-term targets and to making SKG the safest and most customer-focused company in which to work in our industry.
Tony Smurfit Group Chief Executive Officer
27
Strategic Report Governance FinancialsOverview

Smurfit Kappa Annual Report 201728
O P E R AT I O N S R E V I E W
In 2017, we continued to realise the benefits of our capital expenditure programme, which included a number of high return investments in our mill systems along with the ‘Quick Win’ programme.
Revenue for 2017 was €8,562 million compared to €8,159 million in 2016. The year-on-year increase of €403 million equated to 5% and reflected higher reported revenue in both Europe and in the Americas. Net negative currency movements, primarily in the Americas, were partly offset by a positive hyperinflationary adjustment and the contribution from acquisitions. The resulting underlying(1) move was an increase of €515 million or over 6%, with relatively stronger growth in the Americas.
EBITDA for 2017 was €1,240 million compared to €1,236 million in 2016, with earnings growth in Europe and lower Group Centre costs, partly offset by lower earnings in the Americas. The underlying move in EBITDA was an increase of €41 million, equating to 3%, with higher earnings in both Europe and the Americas.
€430mAmount invested in our business in 2017
€460m Average capital spend over the last three years
€8,562mRevenue 2017
€1,240mEBITDA 2017
Revenue for 2017 was €8,562 million
(1) Underlying in relation to financial measures throughout this Annual Report excludes acquisitions, disposals, currency and hyperinflation movements, where applicable.

29
Strategic Report Governance FinancialsOverview
EuropeThe Europe segment is the larger of the Group’s two segments, accounting for 75% of its revenue and 77% of its EBITDA in 2017. It comprises primarily our integrated containerboard mills and corrugated operations as well as the bag-in-box and solidboard businesses.
Following the acquisition in late 2017 of the Chatziioannou corrugated plant in Greece, the Group has facilities in 22 countries in Europe. These comprise 21 mills (of which 15 produce containerboard), 190 converting plants (the majority of which produce corrugated packaging products) and 27 other production facilities carrying out related activities. The mills are supported by 15 recovered fibre collection facilities and two wood procurement operations.
The Group’s European containerboard mill system consists of three kraftliner mills in Sweden, France and Austria, which between them produced approximately 1.6 million tonnes of brown and white kraftliner in 2017 and 12 recycled containerboard mills which produced approximately 3.1 million tonnes of paper.
We also have two virgin fibre based mills in Spain, which produced approximately 150,000 tonnes of sack kraft paper and 80,000 of machine glazed (‘MG’) paper in 2017. Our four other recycled mills in Germany together produced approximately 490,000 tonnes of solidboard and boxboard and 80,000 tonnes of graphicboard in 2017.
On the conversion side, the operations comprise 53 sheet plants and 106 corrugated plants which produced approximately 8.5 billion square metres (4.5 million tonnes) in 2017. In addition, we have 31 plants which produce high-end differentiated packaging products such as litho-laminated corrugated products, display units and solidboard-based packaging, all of which extend the range of the packaging solutions in our portfolio. Our converting operations are supported by a number of other small plants producing pre-print packaging, fulfilment activities and other packaging related products. Our European-managed bag-in-box operations comprise eight plants located in Europe, Argentina, Canada and Mexico.
Revenue for the Europe segment was €6,404 million in 2017 compared to €6,146 million in 2016, with underlying growth of €275 million and the contribution from acquisitions, partly offset by negative currency movements, principally in respect of Sterling. As reported, EBITDA increased by €27 million or 3% to €955 million from €928 million in 2016, with an underlying increase of €31 million.
The year-on-year increase in our European EBITDA, which was achieved despite increased raw material input costs and adverse currency movements, reflected the benefits of our capital expenditure programme, ongoing input cost recovery and strong growth in most markets. With a relatively larger increase in revenue, however, the EBITDA margin was 14.9% compared to 15.1% in 2016.
In 2017, the Group continued to experience significant cost headwinds in Europe in the form of higher recovered fibre costs. Average input prices were up by 14% year-on-year, representing a headwind against 2016 of approximately €80 million for our paper mills. The Group continues to anticipate a long-term upward trend in recovered fibre pricing, which should provide positive support to the containerboard price and, in turn, to the packaging business in the medium-term.
In recycled containerboard, the price increases of over €100 per tonne achieved earlier in the year were maintained, buoyed by strong demand.
Kraftliner has remained in tight supply throughout 2017 with the Group implementing price increases totalling €150 per tonne during the year.
Total corrugated volumes for the year were up almost 3% on 2016, with boxes up over 3%. The Group continued its recovery of raw material cost rises through corrugated price increases in 2017 and further cost recovery is expected as we progress through 2018. For the full year, the Group’s average corrugated pricing in Europe was almost 1% higher than in 2016.
The AmericasThe Group’s operations in the Americas consist of 15 paper mills in six countries (Argentina, Brazil, Colombia, Mexico, the United States and Venezuela) producing containerboard, boxboard and sack paper with a combined production of 1.6 million tonnes in 2017. The mills are supported by 31 recovered fibre facilities in eight countries and forestry operations in Colombia and Venezuela. We have 45 corrugated plants in 10 countries with a 2017 production of approximately 2.3 billion square metres (1.4 million tonnes). We also have 13 other converting plants in seven countries producing mainly paper sacks or folding cartons, a preprint facility and three foam packaging plants in Mexico and two flexible packaging plants, one in the United States and one in El Salvador.

Smurfit Kappa Annual Report 201730
O P E R AT I O N S R E V I E W ( CO N T I N U E D )
The Group’s Americas business continues to provide geographic diversification and growth opportunities. Revenue of €2,158 million in 2017 was €145 million higher than in 2016, with underlying growth more than offsetting net negative currency and hyperinflationary movements. Driven partly by negative currency movements, EBITDA for the Americas fell by €28 million to €311 million in 2017 from €339 million in 2016. The underlying year-on-year move in EBITDA was an increase of €5 million.
The reported EBITDA of €311 million and a 14.4% margin came in below our expectations. The result was impacted by a number of factors including increased export prices for containerboard from the United States into Latin America, where our system is short of kraftliner, increased recovered fibre costs, negative currency movements and adverse natural events. Recovered fibre costs in the Americas were 26% higher in 2017 than in 2016, representing a significant headwind of approximately €40 million for the operations. In addition, some countries experienced an unexpected slowdown in the fourth quarter but this is now showing signs of reversing.
Excluding Venezuela, where shipments were 35% lower than in 2016, reported corrugated volumes in the Americas were 2% higher overall in 2017.
In Colombia, corrugated volumes were up 2% for the year as a whole but with a contraction in demand since September as a combination of higher interest rates and local VAT rates impacted local consumption. This is expected to normalise in 2018. The Group’s operations are also set to benefit from continued input cost recovery and the ramp up of the Papelsa mill expansion which started up in late 2017. At its full run-rate, the mill will deliver an additional 40,000 tonnes of recycled containerboard for integration.
In Mexico, corrugated volumes were up 3% for the year as a whole. Although volumes in the fourth quarter were flat year-on-year, margins improved compared to the third quarter as the Group prioritised input cost recovery over volume. We expect both margins to improve and volumes to recover as we progress through 2018 with the region also benefitting from the ramp-up of the new paper machine (PM-6) at the Los Reyes mill which started in mid-2017.
In the United States, our margins and profitability improved year-on-year as price increases progressed and our Texas mill continued to perform well. Corrugated volumes were lower than in 2016, however, due to some rationalisation projects in our operations in California, along with the impact of adverse natural events during the second half of the year.
Our Argentinean business had a difficult year due to macro-economic reforms which now seem to be showing signs of progress as we enter 2018. In Brazil, the economy continues to show signs of recovery. Corrugated volumes were up 10% in 2017 and, with relatively stable raw material costs and ongoing input cost recovery, the Group’s operations in Brazil reported a strong set of results, which were up significantly on 2016.
The Group’s operations in Venezuela continue to perform in extremely difficult circumstances. The macro situation remains uncertain and we continue to monitor events as they unfold. Although corrugated shipments were significantly lower in 2017, we continue to export containerboard to other Group operations in the region. The business represented 2% of Group EBITDA in 2017 compared to 3% in 2016. As a result of higher inflation in 2017, net assets in Venezuela increased to €128 million as at 31 December 2017 (31 December 2016: €91 million).

31
Strategic Report Governance FinancialsOverview
Smurfit Kappa Annual Report 201732
B U S I N E S S M O D E L
Virgin Fibres Paper Mill
ConsumersRecovered Fibres
Sorting Recycled Paper
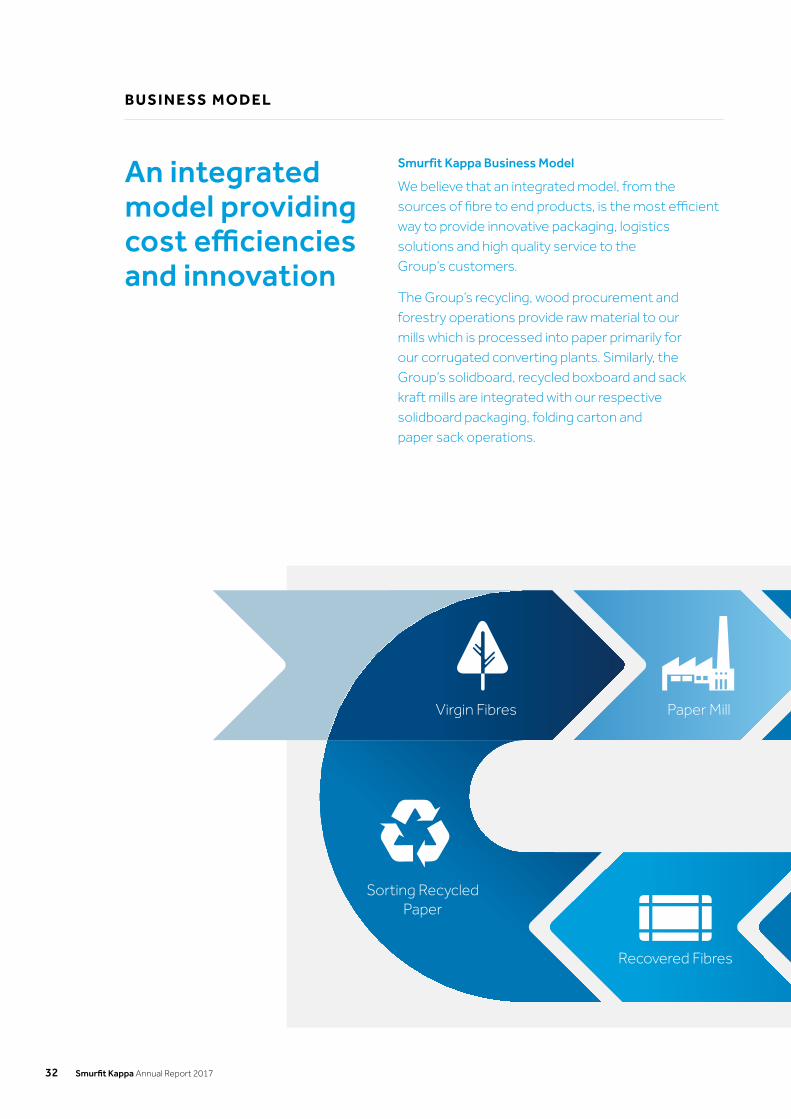
Smurfit Kappa Business Model
We believe that an integrated model, from the sources of fibre to end products, is the most efficient way to provide innovative packaging, logistics solutions and high quality service to the Group’s customers.
The Group’s recycling, wood procurement and forestry operations provide raw material to our mills which is processed into paper primarily for our corrugated converting plants. Similarly, the Group’s solidboard, recycled boxboard and sack kraft mills are integrated with our respective solidboard packaging, folding carton and paper sack operations.
An integrated model providing cost efficiencies and innovation
33
Strategic Report Governance FinancialsOverview
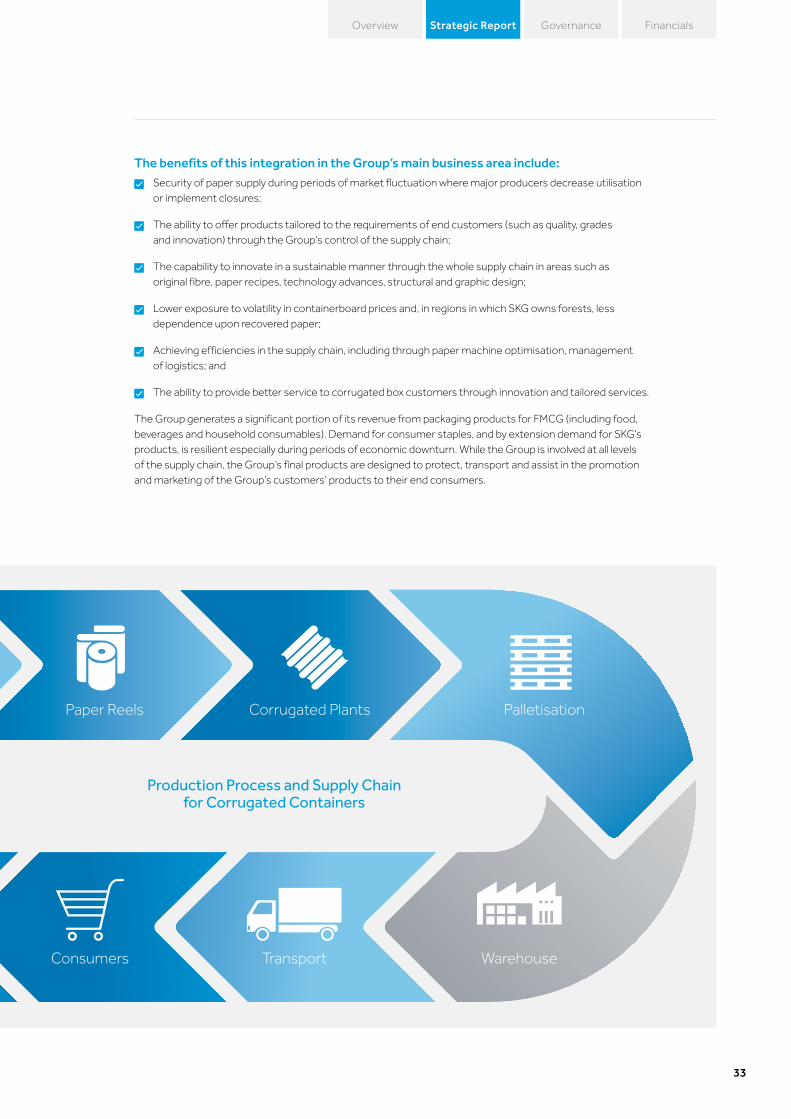
Production Process and Supply Chain for Corrugated Containers
Paper Reels Corrugated Plants Palletisation
WarehouseTransportConsumers
The benefits of this integration in the Group’s main business area include: Security of paper supply during periods of market fluctuation where major producers decrease utilisation
or implement closures;
The ability to offer products tailored to the requirements of end customers (such as quality, grades and innovation) through the Group’s control of the supply chain;
The capability to innovate in a sustainable manner through the whole supply chain in areas such as original fibre, paper recipes, technology advances, structural and graphic design;
Lower exposure to volatility in containerboard prices and, in regions in which SKG owns forests, less dependence upon recovered paper;
Achieving efficiencies in the supply chain, including through paper machine optimisation, management of logistics; and
The ability to provide better service to corrugated box customers through innovation and tailored services.
The Group generates a significant portion of its revenue from packaging products for FMCG (including food, beverages and household consumables). Demand for consumer staples, and by extension demand for SKG’s products, is resilient especially during periods of economic downturn. While the Group is involved at all levels of the supply chain, the Group’s final products are designed to protect, transport and assist in the promotion and marketing of the Group’s customers’ products to their end consumers.

Smurfit Kappa Annual Report 201734
ST R AT EGY
Strategic Objective
The Group’s objective is to develop long-term customer relationships by providing customers with differentiated packaging solutions that enhance the customers’ prospects of success in their end markets.
Delivering an increasingly strong return on capital
Our ambition is to maintain our premier position by delivering:
Superior customer satisfaction;
The most sustainable, biodegradable solution for our customers and their end customers;
Cost and operating efficiencies;
Proactive environmental awareness; and
Continuous improvement in the areas of health and safety and corporate social responsibility.
ST R AT EG I C P R I O R I T Y
Expand our market positions in Europe and the Americas through selective focused growth
ST R AT EG I C P R I O R I T Y
Become the supplier/partner of choice
ST R AT EG I C P R I O R I T Y
Enhance our operational excellence through the continuous upgrade of our customer offering
ST R AT EG I C P R I O R I T Y
Recruit, retain, develop and motivate the best people
ST R AT EG I C P R I O R I T Y
Maintain a disciplined approach to capital allocation and maintain the focus on cash generation
VisionOur vision is to be a globally admired business, dynamically delivering secure and superior returns for all stakeholders.

35
Strategic Report Governance FinancialsOverview
n Organic growth from increased market share through consolidating, and where appropriate, extending our leadership position; and
n Pursuit of accretive acquisitions in higher growth markets such as Eastern Europe and Latin America.
n Deepening SKG’s understanding of our customers’ world and developing proactive initiatives to improve their offering;
n Constantly innovating our products, service, quality and delivery in order to develop and/or maintain preferred supplier status; and
n Pursuing superior performance measured against clearly defined metrics in all aspects of our business and at all levels in our organisation.
n Improving the output from the Group’s high quality asset base through judicious capital investment, continuous improvement programmes, transfer of best practice, industrial engineering and other progressive initiatives;
n Increasing the proportion of differentiated ideas, products and services on offer to our customers through the use of the Group’s development and technology centres and our innovation tools and delivering the results to customers; and
n Ensuring that the driving force behind all our operations is one of customer satisfaction and excellence in the marketplace.
n High quality graduate and other recruitment initiatives, progressive goal setting, and performance appraisal programmes;
n Focused job training and coaching;
n Cross divisional in-house development programmes; and
n Selective executive development programmes.
n Preserving our credit rating and our position as a strong crossover credit;
n Capital spending to optimise our asset base and enhance operating efficiency;
n Acquiring strategically attractive and accretive assets; and
n Progressive dividend supported by strong free cash flow.

Smurfit Kappa Annual Report 201736
R I S K R E P O RT
The Board determines the nature and extent of the principal risks it is willing to take to achieve its strategic objectives. Risks are identified and evaluated and appropriate risk management strategies are implemented at each level in the organisation.
Risk Management and Internal ControlThe Board has overall responsibility for the Group’s system of risk management and internal control and for monitoring and reviewing its effectiveness, in order to safeguard shareholders’ investments and the Group’s assets. Such a system is designed to manage rather than eliminate the risk of failure to achieve business objectives and can therefore only provide reasonable and not absolute assurance against material misstatement or loss. The Board carries out a review of the effectiveness of the Group’s risk management and internal control systems at least annually.
Group executive management is responsible for implementing strategy and for the continued development of the Group’s operations within parameters set down by the Board. Day-to-day management of the Group’s operations is devolved to operational management within clearly defined authority limits and subject to tight reporting of financial performance. Management at all levels is responsible for internal control over the respective operations that have been delegated to them. As such, the system of internal control throughout the Group’s operations ensures that the organisation is capable of responding quickly to evolving operational and business risks and that significant internal control issues should they arise are reported promptly to appropriate levels of management.
The Board is responsible for determining the nature and extent of the principal risks it is willing to take to achieve its strategic objectives. Risk assessment and evaluation is an integral part of the management process throughout the Group. Risks are identified and evaluated, and appropriate risk management strategies are implemented at each level. The key business risks are identified by the senior management team. The Audit Committee and the Board in conjunction with senior management review the key business risks faced by the Group and determine the appropriate course of action to manage these risks. The Internal Audit function monitors compliance and considers the effectiveness of internal control throughout the Group. The Audit Committee meets with the Group Compliance Manager and the Group Internal Auditor at least quarterly in order to satisfy itself on the adequacy of the Group’s internal control system. The Chairman of the Audit Committee reports to the Board on all significant issues considered by the Committee.
Going ConcernAfter making enquiries, the Directors have a reasonable expectation that the Company and the Group as a whole, have adequate resources to continue in operational existence for the foreseeable future. For this reason, they continue to adopt the going concern basis in preparing the Consolidated Financial Statements.
Viability StatementThe Directors have assessed the prospects of the Group over a three-year period. The Directors consider this period to be appropriate as the Group’s strategic business plan is devised and assessed over a three-year period in line with the cyclical nature of the business in which the Group operates. A three-year consolidated financial model was built using a bottom up approach reflecting the Group’s current position and including management’s estimates of future profitability and assumptions for the Income Statement, Cash Flows and Balance Sheet. The model incorporates and considers the important indicators of underlying performance of the operations of the Group, EBITDA, EBITDA margin, Free Cash Flow, Net Debt to EBITDA, Return on Capital Employed and Earnings per Share.
The Directors have undertaken a robust assessment of the principal risks facing the Group, as detailed in this section, which would threaten the Group’s business model, future performance, solvency or liquidity. Using the principal risks identified, stress test scenario analysis has been applied to the Group’s consolidated financial model to assess the effect on the Group’s key indicators of underlying performance.
Based on the results of this analysis, the Directors confirm they have a reasonable expectation that the Group will be able to continue in operation and meet its liabilities as they fall due over the three-year period of their assessment.

RE
MO
TE
UN
LIK
ELY
PO
SS
IBL
EP
RO
BA
BL
E
CRITICALMODERATE MAJOR CATASTROPHIC
Cyber and Information
Security
Currency
Health& Safety
Anti-trustEconomicInput Costs
Business Interruption
EmployeeRecruitment& Retention
Pricing
Environmental
Venezuela
Occ
urre
nce
Impact
GrossNet
MINOR
Risk heat map
37
Strategic Report Governance FinancialsOverview

Smurfit Kappa Annual Report 201738
R I S K R E P O RT ( CO N T I N U E D)
R I S K D E S C R I P T I O N
If the current economic climate were to deteriorate, especially as a result of Brexit, and result in an increased economic slowdown which was sustained over any significant length of time, or the sovereign debt crisis (including its impact on the euro) were to re-emerge or exacerbate as a result of Brexit, it could adversely affect the Group’s financial position and results of operations.
R I S K D E S C R I P T I O N
The cyclical nature of the packaging industry could result in overcapacity and consequently threaten the Group’s pricing structure.
R I S K D E S C R I P T I O N
If operations at any of the Group’s facilities (in particular its key mills) were interrupted for any significant length of time it could adversely affect the Group’s financial position and results
of operations.
M I T I G AT I O N
n The Group supplies 60% of its packaging to FMCG customers whose consumption volumes remain relatively stable through market downturns.
n The Group’s customer base is spread across Europe and the Americas spanning 35 countries across multiple industries.
n The Group could significantly curtail capital expenditure and take additional cost cutting measures within a relatively short period as required.
n Stress testing for the viability statement indicates we will continue to have significant headroom on our covenants even in a sustained downturn.
M I T I G AT I O N
n As a highly integrated player we are better able to cope with the effects of cyclicality and capacity additions than a pure paper or corrugated producer.
n Our differentiation programmes ensure we are at the forefront of the industry in developing cost-efficient solutions for our customers through performance packaging, quality management, supply chain optimisation and strong sustainability credentials. This service offering distinguishes the Group from pure commodity suppliers, providing a support for more stable pricing.
n Our continuous investment programmes in our operations ensure we remain competitive and have low cost mill systems. In an environment of overcapacity, our well invested, low cost mill system will enable the Group to continue economic production through a period of lower prices while higher cost mills will be forced to shut.
M I T I G AT I O N
n The Group ensures that all facilities have adequate insurance to mitigate the impact of significant interruption.
n Operational contingency plans are in place for all mills and plants in the event of a shutdown, which have been demonstrated to work during shorter interruptions in the past.
n In Europe, the Group has a network of operations which can facilitate the transfer of significant volume to other mills in the event of a shutdown. Furthermore, our European Paper Sourcing operation centrally coordinates all external paper purchases for the European operations.
n There is continuous investment in a rigorous programme of preventative maintenance for all key mills and other plants.
R I S K A R E A Economic
R I S K A R E A
PricingR I S K A R E A
Business interruption
K E Y TO ST R AT EG I C O BJ EC T I V E S
Market position
Partner of choice
Operational excellence People Capital allocation
39
Strategic Report Governance FinancialsOverview
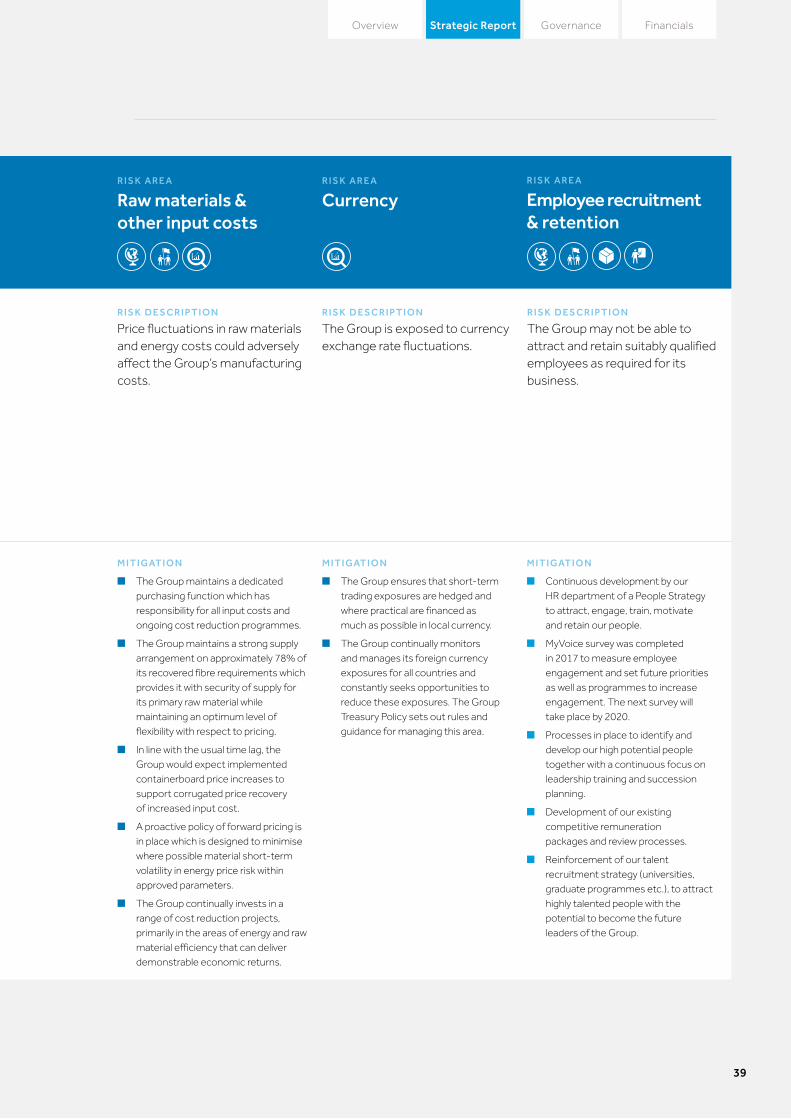
R I S K D E S C R I P T I O N
Price fluctuations in raw materials and energy costs could adversely affect the Group’s manufacturing costs.
R I S K D E S C R I P T I O N
The Group is exposed to currency exchange rate fluctuations.
R I S K D E S C R I P T I O N
The Group may not be able to attract and retain suitably qualified employees as required for its business.
M I T I G AT I O N
n The Group maintains a dedicated purchasing function which has responsibility for all input costs and ongoing cost reduction programmes.
n The Group maintains a strong supply arrangement on approximately 78% of its recovered fibre requirements which provides it with security of supply for its primary raw material while maintaining an optimum level of flexibility with respect to pricing.
n In line with the usual time lag, the Group would expect implemented containerboard price increases to support corrugated price recovery of increased input cost.
n A proactive policy of forward pricing is in place which is designed to minimise where possible material short-term volatility in energy price risk within approved parameters.
n The Group continually invests in a range of cost reduction projects, primarily in the areas of energy and raw material efficiency that can deliver demonstrable economic returns.
M I T I G AT I O N
n The Group ensures that short-term trading exposures are hedged and where practical are financed as much as possible in local currency.
n The Group continually monitors and manages its foreign currency exposures for all countries and constantly seeks opportunities to reduce these exposures. The Group Treasury Policy sets out rules and guidance for managing this area.
M I T I G AT I O N
n Continuous development by our HR department of a People Strategy to attract, engage, train, motivate and retain our people.
n MyVoice survey was completed in 2017 to measure employee engagement and set future priorities as well as programmes to increase engagement. The next survey will take place by 2020.
n Processes in place to identify and develop our high potential people together with a continuous focus on leadership training and succession planning.
n Development of our existing competitive remuneration packages and review processes.
n Reinforcement of our talent recruitment strategy (universities, graduate programmes etc.), to attract highly talented people with the potential to become the future leaders of the Group.
R I S K A R E A Raw materials & other input costs
R I S K A R E A Currency
R I S K A R E A Employee recruitment & retention

Smurfit Kappa Annual Report 201740
R I S K R E P O RT ( CO N T I N U E D)
K E Y TO ST R AT EG I C O BJ EC T I V E S
Market position
Partner of choice
Operational excellence People Capital allocation
R I S K D E S C R I P T I O N
Failure to maintain good health and safety practices may have an adverse effect on the Group’s business.
R I S K D E S C R I P T I O N
The Group is subject to a growing number of environmental laws and regulations, and the cost of compliance or the failure to comply with current and future laws and regulations may negatively affect the Group’s business.
R I S K D E S C R I P T I O N
The Group is subject to anti-trust and similar legislation in the jurisdictions in which it operates.
M I T I G AT I O N
n Health and Safety is a core consideration in all management reviews. The protection of the health and safety of the workforce is a continual focus in an industry with a broad profile of hazards.
n Increased focus is given to the strict adoption of good management, employee practices and a mind-set that complements existing risk mitigation measures.
n The Group has an established formal practice of investigating accidents and preparing safety bulletins which are shared across divisions.
M I T I G AT I O N
n The Group’s environmental structure ensures each mill has a manager who is responsible for environmental issues including monitoring air, noise and water emissions and ensuring that the mill is running within its permits.
n The Group’s environmental management is in contact with appropriate local authorities and environmental upgrades are made in consultation with them.
n All our paper and board mills with the exception of our mills in Brazil, which were acquired in December 2015, are operated under an EMS (Environmental Management System) (ISO 14001).
n The Group has an IT reporting system in over 300 sites ensuring environmental data is reported on a regular basis.
n The Group have a centralised co-ordination of all environmental activity providing a key interface to the EU, supported by a committee of senior executives who meet regularly to review such issues, and report directly to the CEO.
M I T I G AT I O N
n Group Competition Law Compliance Policy is in place and communicated to all employees. All senior management and market-facing employees are required to formally confirm adherence to the policy by signing a Competition Law Compliance Certificate on an annual basis.
n Group General Counsel advises and supports employees and management in this area.
n Regular communication and promotion of Competition Law Compliance and other similar legislation to staff and local management.
n Continuous process to ensure understanding of issues and implications of regulatory and legislative amendments.
Environmental
R I S K A R E A Legislation & regulation
Anti-trust
R I S K A R E A Health and Safety

41
Strategic Report Governance FinancialsOverview
R I S K D E S C R I P T I O N
The Group, similar to other large global companies, is susceptible to cyber attacks with the threat to the confidentiality, integrity and availability of data in its systems.
R I S K D E S C R I P T I O N
The Group is exposed to potential risks in relation to political
instability in Venezuela.
M I T I G AT I O N
n Formally documented policies in relation to information security including cyber security are in place.
n The Group maintains a framework to ensure awareness at each level of the organisation with regard to the implementation of cyber security. This framework is regularly audited.
n Specific controls are in place to prevent and detect security issues relating to business critical systems.
n Defined business continuity and IT disaster recovery plans are in place and are frequently tested.
n The Group is committed to ongoing capital expenditure as appropriate to continually enhance the IT infrastructure.
M I T I G AT I O N
n The Group’s Venezuelan operations have mitigated to some extent the loss of revenue due to the drop in corrugated volumes in the country by exporting paper to its operations in the United States and other Latin American countries. This export of paper is subject to: the availability of local raw materials to produce the paper; the quality of the paper being maintained to a satisfactory standard for our end markets; and the renewal of an export licence by the Government every six months.
n Net assets in Venezuela amounted to €128 million at year-end.
R I S K A R E A Cyber & information security
R I S K A R E A Venezuela

A N I N T EG R AT E D M O D E L
CONTAINERBOARDIn our 36 mills across the globe, we produce both virgin and recycled paper, primarily containerboard. Our mill in Pitea, Sweden (pictured) produces 700,000 tonnes of kraftliner annually, which is used within our corrugated system. This is one of the benefits of our integrated model, security of paper supply at all times.
Smurfit Kappa Annual Report 201742

43
Strategic Report Governance FinancialsOverview
Smurfit Kappa Annual Report 201744
F I N A N C E R E V I E W
ResultsThe Group’s net debt continues to reduce in both absolute and multiple terms, positioning the Group with considerable financial strategic flexibility.
At €8,562 million, revenue in 2017 was €403 million or 5% higher than in 2016, with growth in both Europe and the Americas. Net negative currency movements, primarily in the Americas, were partly offset by a positive hyperinflationary adjustment and the contribution from acquisitions. The resulting underlying move in revenue was an increase of €515 million, equating to over 6%, with higher comparable revenue in both Europe and the Americas.
European revenue rose by €258 million year-on-year, with underlying growth of €275 million and the contribution of €24 million from acquisitions, partly offset by negative currency movements of €41 million, mainly in respect of Sterling. The increase in underlying revenue equated to 4% and reflected both slightly higher average box prices in 2017 and volume growth of almost 3%. Although average corrugated box prices were only slightly higher than in 2016, prices improved progressively in the second half of 2017 reflecting the lag effect in recovering containerboard price increases through higher box prices. Further progress on input cost recovery is expected in 2018.
Reported revenue in the Americas was €145 million higher than in 2016, with underlying growth of €240 million, equating to 12%, together with the modest contribution for the full year of the acquisitions made in 2016 and the hyperinflationary adjustment in Venezuela partly offset by negative currency movements. The underlying growth in revenue across the region was driven by a combination of price and volume. Conditions varied across the region, with increased shipments in Mexico, Colombia and Brazil partly offset by lower volumes primarily in Venezuela but also in the United States, reflecting some rationalisation projects in our operations in California and Argentina. Despite a 35% drop in shipments,
revenue in Venezuela was higher in 2017 with inflationary pressures supporting pricing. Excluding Venezuela, comparable corrugated volumes in the Americas were 2% higher in 2017.
At €1,240 million in 2017 compared to €1,236 million in 2016, EBITDA was up €4 million with earnings growth in Europe and lower Group Centre costs partly offset by reduced earnings in the Americas.
At €955 million, reported EBITDA in Europe was €27 million higher than in 2016. This increase was achieved despite increased raw material input costs, and reflected the benefits of our capital expenditure programme, ongoing input cost recovery and strong growth in most markets. With a net negative currency movement of €6 million and a contribution of €2 million from acquisitions, underlying earnings were €31 million (equating to 3%) higher than in 2016.
At €311 million, reported EBITDA in the Americas was €28 million lower than in 2016 with generally reduced earnings across the region. Earnings were impacted by a number of factors including increased export prices for US containerboard into Latin America, increased recovered fibre costs, negative currency movements and adverse natural events. Allowing mainly for a negative currency movement of €40 million, the underlying year-on-year move in earnings was an increase of €5 million.
Allowing for currency movements, hyperinflation and acquisitions, the underlying year-on-year increase in EBITDA for the Group overall was €41 million, equating to over 3%.
The year-on-year growth of €4 million in reported EBITDA was more than offset by an increase of €11 million in the share-based payment expense and an increase of €3 million in the overall charge for depreciation, depletion and amortisation. As a result, the Group’s pre-exceptional operating profit decreased by €10 million to €820 million in 2017 compared to €830 million in 2016.

45
Strategic Report Governance FinancialsOverview
With increases in both cash and non-cash interest costs, the Group’s pre-exceptional net finance costs amounted to €219 million (costs of €248 million less income of €29 million) in 2017 compared to €175 million in 2016. Cash interest was €10 million higher year-on-year, mainly as a result of the impact of the bond issued in January 2017 and our exposure to the relatively high local interest rates in Latin America. Non-cash interest was €34 million higher in 2017, driven largely by a negative swing of €28 million from a net monetary gain in 2016 of €4 million relating to hyperinflation to a loss of €24 million in 2017.
As a result of the decrease of €10 million in operating profit together with the increase of €44 million in net finance costs and a decrease of €2 million in our share of associates’ profit, the pre-exceptional profit before tax was €56 million lower year-on-year at €601 million in 2017 compared to €657 million in 2016.
Exceptional ItemsExceptional items charged within operating profit in 2017 amounted to €23 million. These included impairment losses of €11 million relating to property, plant and equipment in one of our European mills and a corrugated plant in the United States. The remaining €12 million related to reorganisation and restructuring costs in the United States.
Exceptional finance costs of €2 million in 2017 represented the accelerated amortisation of the issue costs relating to the debt within our senior credit facility which was paid down with the proceeds of the €500 million bond issued in January 2017.
Exceptional items charged within operating profit in 2016 amounted to €15 million. These were reported in the fourth quarter and related to reorganisation and restructuring costs in Venezuela.
The exceptional finance income of €12 million in 2016 represented the profit on the sale of our shareholding in the Swedish company, IL Recycling.
Profit before Income TaxAfter exceptional items, the Group’s total profit before income tax amounted to €576 million in 2017, comprising the pre-exceptional profit of €601 million and a net exceptional charge of €25 million. In 2016, the total profit before income tax was €654 million, comprising the pre-exceptional profit of €657 million and a net exceptional charge of €3 million. The year-on-year decrease of €78 million reflected both the reduction of €56 million in the pre-exceptional profit and a higher net charge for exceptional items.
Income Tax ExpenseThe income tax expense in 2017 was €153 million (comprising a current tax charge of €191 million and a deferred tax credit of €38 million) compared to €196 million (comprising a current tax charge of €156 million and a deferred tax charge of €40 million) in 2016. The year-on-year decrease of €43 million arose mainly in the Americas.
The current tax expense was €35 million higher than in 2016, with an increase in Europe partly offset by a decrease in the Americas. In Europe, the current tax expense was higher by €56 million in 2017 reflecting the impact of the full utilisation in a number of countries of the Group’s historic tax losses together with other timing items. In the Americas, the current tax expense was €21 million lower than in 2016 reflecting the tax effects of lower profitability.
In 2017, there was a deferred tax credit of €38 million, broadly evenly split between Europe and the Americas, compared to a charge of €40 million, primarily in Europe, in 2016. The year-on-year movement includes the effects of the reversal of timing differences on which deferred tax liabilities were previously recognised, other credits and the use and recognition of tax losses.
The income tax expense includes a €6 million tax credit in respect of exceptional items compared to a €3 million credit in 2016.
Earnings per ShareThe basic earnings per share amounted to 177.2 cent in 2017 compared to 189.4 cent in 2016. On a diluted basis, our earnings per share in 2017 amounted to 175.8 cent compared to 187.5 cent in 2016.
The year-on-year decrease in the Group’s basic earnings per share equated to 6% and reflected the drop in the profit before income tax, including the impact of a higher charge for exceptional items, partly offset by the lower income tax expense. On a pre-exceptional basis, our earnings per share in 2017 decreased by 2% from 189.4 cent in 2016 to 185.3 cent.
The earnings per share figures are calculated on the basis of the weighted average number of shares in issue during the year, which was 235,369,000 in 2017 compared to 234,505,000 in 2016.

Smurfit Kappa Annual Report 201746
F I N A N C E R E V I E W ( CO N T I N U E D)
Financial Key Performance IndicatorsCertain financial measures set out below, are not defined under IFRS. These APMs are presented because we believe that they, and similar measures, are widely used in the paper and packaging manufacturing industry as a means of evaluating a company’s operating performance and financing structure.
These measures may not be comparable to other similarly titled measures of other companies and are not measurements under IFRS or other generally accepted accounting principles, and they should not be considered as substitutes for the information contained in our Financial Statements. These APMs have limitations as analytical tools, and should not be considered in isolation, or as a substitute for analysis of our operating income or cash flows as reported under IFRS.
We consider the following measures to be important indicators of the underlying performance of our operations.
EBITDA
D E F I N I T I O N
EBITDA is earnings before exceptional items, share-based payment expense, share of associates’ profit (after tax), net finance costs, income tax expense, depreciation and depletion (net) and intangible assets amortisation. It is an appropriate and useful measure used to compare recurring financial performance between periods. A reconciliation of profit to EBITDA is included below.
P E R FO R M A N C E
EBITDA of €1,240 million in 2017 was €4 million higher than in 2016, with earnings growth in Europe and lower Group Centre costs, partly offset by lower earnings in the Americas. The underlying move in EBITDA was an increase of €41 million, with earnings growth primarily in Europe. This was achieved despite increased raw material costs and reflected the benefits of our capital spend programme, on-going input cost recovery and strong growth in most markets. Reported corrugated shipments in Europe were almost 3% higher year-on-year while average box prices were almost 1% higher.
In the Americas, conditions varied across the region. Excluding Venezuela, where shipments were down 35% year-on-year, corrugated volumes in the Americas were 2% higher than in 2016. For the Group as a whole, absolute corrugated volumes were over 2% higher year-on-year.
EBITDA margin to Revenue
D E F I N I T I O N
EBITDA margin is a measure of profitability by taking our EBITDA divided by revenue.
P E R FO R M A N C E
With a marginal year-on-year increase in EBITDA compared to 5% in revenue, our EBITDA margin decreased from 15.1% in 2016 to 14.5% in 2017, with lower margins in both Europe and the Americas. While earnings in the European operations grew through higher corrugated volumes and slightly higher box prices, the benefit was offset by higher recovered fibre input prices. In the Americas, margins were generally lower across the region.
2017
EBITDA (€ million)
1,236
2016
1,240
20162017
15.114.5
EBITDA margin to revenue (%)
K E Y TO ST R AT EG I C O BJ EC T I V E S
Market position
Partner of choice
Operational excellence People Capital allocation

47
Strategic Report Governance FinancialsOverview
Reconciliation of Profit to EBITDA
2017 2016
€m €m
Profit for the financial year 423 458
Income tax expense 153 196
Exceptional items charged in operating profit 23 15
Share of associates’ profit (after tax) - (2)
Net finance costs (after exceptional items) 221 163
Depreciation, depletion (net) and amortisation 396 393
Share-based payment expense 24 13
EBITDA 1,240 1,236
Net Debt
D E F I N I T I O N
Net debt comprises borrowings net of cash and cash equivalents and restricted cash. We believe that this measure highlights the overall movement resulting from a company’s operating and financial performance.
P E R FO R M A N C E
Net debt amounted to €2,805 million at December 2017 compared to €2,941 million at December 2016. The year-on-year decrease of €136 million reflected the free cash flow of €307 million for the year and net positive translation adjustments of €115 million, partly offset by net investment and financing outflows of €268 million, net debt acquired and the amortisation of deferred debt issue costs.
Net Debt to EBITDA
D E F I N I T I O N
Leverage (ratio of net debt to EBITDA) is an important measure of our overall financial position.
P E R FO R M A N C E
With the benefit of both EBITDA growth and lower net debt, our leverage was 2.3 times at December 2017 compared to 2.4 times at December 2016.
Net debt (€ million)
20162017
2,9412,805
Net debt to EBITDA (ratio)
20162017
2.42.3
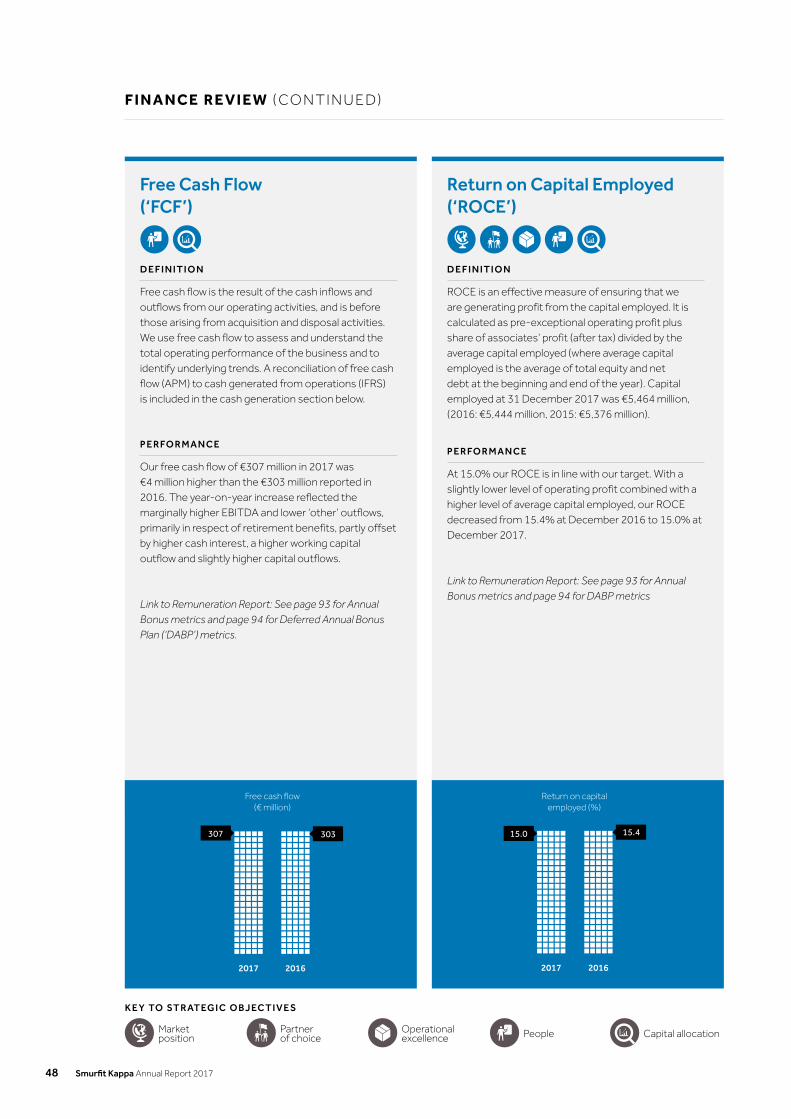
Smurfit Kappa Annual Report 201748
F I N A N C E R E V I E W ( CO N T I N U E D)
Free Cash Flow (‘FCF’)
D E F I N I T I O N
Free cash flow is the result of the cash inflows and outflows from our operating activities, and is before those arising from acquisition and disposal activities. We use free cash flow to assess and understand the total operating performance of the business and to identify underlying trends. A reconciliation of free cash flow (APM) to cash generated from operations (IFRS) is included in the cash generation section below.
P E R FO R M A N C E
Our free cash flow of €307 million in 2017 was €4 million higher than the €303 million reported in 2016. The year-on-year increase reflected the marginally higher EBITDA and lower ‘other’ outflows, primarily in respect of retirement benefits, partly offset by higher cash interest, a higher working capital outflow and slightly higher capital outflows.
Link to Remuneration Report: See page 93 for Annual Bonus metrics and page 94 for Deferred Annual Bonus Plan (‘DABP’) metrics.
Return on Capital Employed (‘ROCE’)
D E F I N I T I O N
ROCE is an effective measure of ensuring that we are generating profit from the capital employed. It is calculated as pre-exceptional operating profit plus share of associates’ profit (after tax) divided by the average capital employed (where average capital employed is the average of total equity and net debt at the beginning and end of the year). Capital employed at 31 December 2017 was €5,464 million, (2016: €5,444 million, 2015: €5,376 million).
P E R FO R M A N C E
At 15.0% our ROCE is in line with our target. With a slightly lower level of operating profit combined with a higher level of average capital employed, our ROCE decreased from 15.4% at December 2016 to 15.0% at December 2017.
Link to Remuneration Report: See page 93 for Annual Bonus metrics and page 94 for DABP metrics
Free cash flow (€ million)
20162017
303307
Return on capital employed (%)
20162017
15.415.0
K E Y TO ST R AT EG I C O BJ EC T I V E S
Market position
Partner of choice
Operational excellence People Capital allocation

49
Strategic Report Governance FinancialsOverview
Earnings per Share (‘EPS’)
D E F I N I T I O N
Pre-exceptional EPS serves as an effective indicator of a company’s profitability as it excludes exceptional one-off items and, in conjunction with other metrics such as ROCE, is a measure of the company’s financial strength. Given the fundamental repositioning of the Group through debt pay down and interest savings and, consequently, earnings growth and lower leverage, pre-exceptional EPS is an important measure for the Group. Pre-exceptional EPS is calculated by dividing profit attributable to owners of the parent, adjusted for exceptional items included in profit before income tax and income tax on exceptional items, by the weighted average number of ordinary shares in issue. The calculation of pre-exceptional EPS is shown in Note 10 to the Consolidated Financial Statements.
P E R FO R M A N C E
Our basic EPS in 2017 of 177.2 cent was 6% lower than 2016’s 189.4 cent, reflecting a €27 million decrease in the profit attributable to owners of the parent, with the €78 million decrease in the profit before income tax partly offset by a reduced income tax expense and a lower profit attributable to non-controlling interests. Our basic EPS in 2017 was impacted by a higher net exceptional charge than in 2016. With a net exceptional charge of €25 million in 2017, compared to only €3 million in 2016, our pre-exceptional EPS was 2% lower year-on-year at 185.3 cent compared to 189.4 cent in 2016.
Link to Remuneration Report: See page 93 for Annual Bonus metrics.
Pre-exceptional EPS (cent)
20162017
189.4185.3

Smurfit Kappa Annual Report 201750
F I N A N C E R E V I E W ( CO N T I N U E D)
Cash GenerationFree cash flow in 2017 was €307 million compared to €303 million in 2016. The year-on-year increase of €4 million reflected marginally higher EBITDA and lower ‘other’ outflows, offset partially by higher cash interest, a higher working capital outflow and slightly higher capital outflows.
Summary Cash Flow(1) 2017 2016
€m €m
EBITDA 1,240 1,236
Exceptional items (12) (15)
Cash interest expense (158) (148)
Working capital change (112) (95)
Current provisions (2) (8)
Capital expenditure (430) (499)
Change in capital creditors (28) 49
Tax paid (154) (151)
Sale of fixed assets 5 3
Other (42) (69)
Free cash flow 307 303
Share issues 1 -
Purchase of own shares (net) (10) (10)
Sale of businesses and investments 5 17
Purchase of businesses and investments (63) (44)
Dividends (195) (170)
Derivative termination (payments)/receipts (6) 13
Net cash inflow 39 109
Net debt acquired (6) (1)
Deferred debt issue costs amortised (12) (10)
Currency translation adjustments 115 9
Decrease in net debt 136 107
(1) The summary cash flow is prepared on a different basis to the Consolidated Statement of Cash Flows under IFRS (‘IFRS cash flow’) and as such the reconciling items between EBITDA and decrease/(increase) in net debt may differ to amounts presented in the IFRS cash flow. The principal differences are as follows:
(a) The summary cash flow details movements in net debt. The IFRS cash flow details movements in cash and cash equivalents.
(b) Free cash flow reconciles to cash generated from operations in the IFRS cash flow as shown in the table below. The main adjustments are in respect of cash interest, capital expenditure, tax payments and the sale of fixed assets and businesses.
(c) The IFRS cash flow has different sub-headings to those used in the summary cash flow.
• Current provisions in the summary cash flow are included within change in employee benefits and other provisions in the IFRS cash flow.
• The total of capital expenditure and change in capital creditors in the summary cash flow includes additions to intangible assets which is shown separately in the IFRS cash flow. It also includes capitalised leased assets which are excluded from additions to property, plant and equipment and biological assets in the IFRS cash flow.
• Other in the summary cash flow includes changes in employee benefits and other provisions (excluding current provisions), amortisation of capital grants, receipt of capital grants and dividends received from associates which are shown separately in the IFRS cash flow.
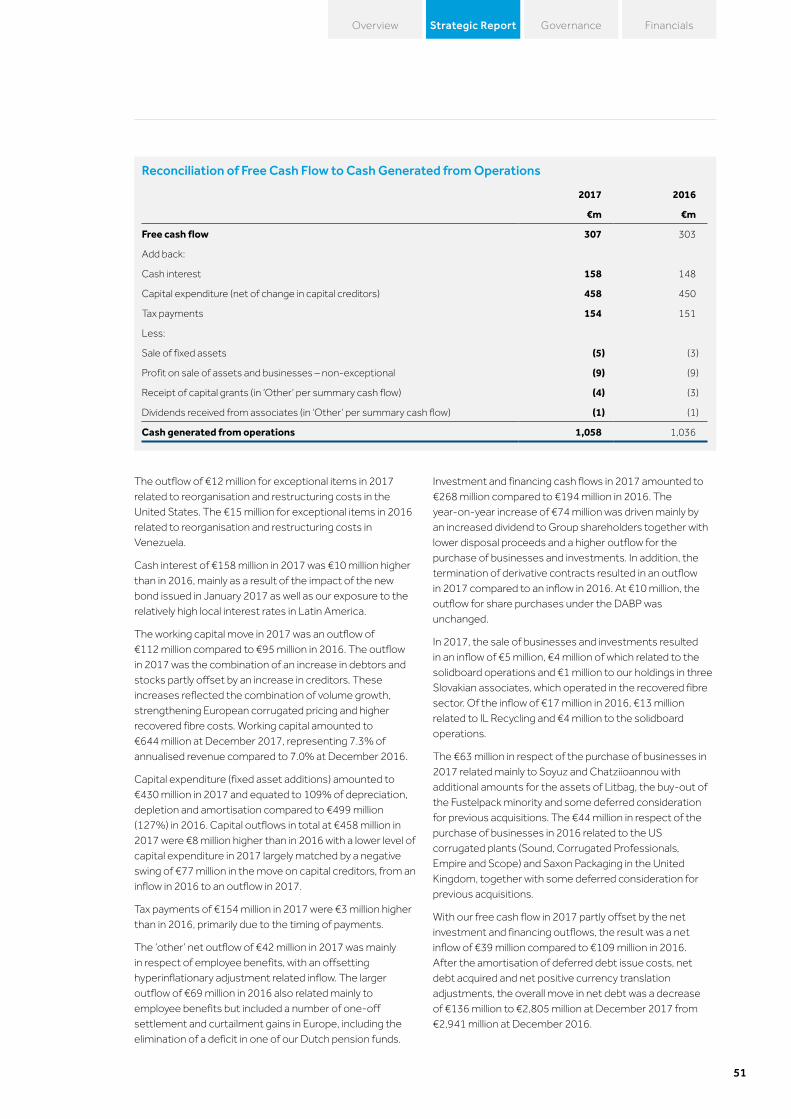
51
Strategic Report Governance FinancialsOverview
Reconciliation of Free Cash Flow to Cash Generated from Operations
2017 2016
€m €m
Free cash flow 307 303
Add back:
Cash interest 158 148
Capital expenditure (net of change in capital creditors) 458 450
Tax payments 154 151
Less:
Sale of fixed assets (5) (3)
Profit on sale of assets and businesses – non-exceptional (9) (9)
Receipt of capital grants (in ‘Other’ per summary cash flow) (4) (3)
Dividends received from associates (in ‘Other’ per summary cash flow) (1) (1)
Cash generated from operations 1,058 1,036
The outflow of €12 million for exceptional items in 2017 related to reorganisation and restructuring costs in the United States. The €15 million for exceptional items in 2016 related to reorganisation and restructuring costs in Venezuela.
Cash interest of €158 million in 2017 was €10 million higher than in 2016, mainly as a result of the impact of the new bond issued in January 2017 as well as our exposure to the relatively high local interest rates in Latin America.
The working capital move in 2017 was an outflow of €112 million compared to €95 million in 2016. The outflow in 2017 was the combination of an increase in debtors and stocks partly offset by an increase in creditors. These increases reflected the combination of volume growth, strengthening European corrugated pricing and higher recovered fibre costs. Working capital amounted to €644 million at December 2017, representing 7.3% of annualised revenue compared to 7.0% at December 2016.
Capital expenditure (fixed asset additions) amounted to €430 million in 2017 and equated to 109% of depreciation, depletion and amortisation compared to €499 million (127%) in 2016. Capital outflows in total at €458 million in 2017 were €8 million higher than in 2016 with a lower level of capital expenditure in 2017 largely matched by a negative swing of €77 million in the move on capital creditors, from an inflow in 2016 to an outflow in 2017.
Tax payments of €154 million in 2017 were €3 million higher than in 2016, primarily due to the timing of payments.
The ‘other’ net outflow of €42 million in 2017 was mainly in respect of employee benefits, with an offsetting hyperinflationary adjustment related inflow. The larger outflow of €69 million in 2016 also related mainly to employee benefits but included a number of one-off settlement and curtailment gains in Europe, including the elimination of a deficit in one of our Dutch pension funds.
Investment and financing cash flows in 2017 amounted to €268 million compared to €194 million in 2016. The year-on-year increase of €74 million was driven mainly by an increased dividend to Group shareholders together with lower disposal proceeds and a higher outflow for the purchase of businesses and investments. In addition, the termination of derivative contracts resulted in an outflow in 2017 compared to an inflow in 2016. At €10 million, the outflow for share purchases under the DABP was unchanged.
In 2017, the sale of businesses and investments resulted in an inflow of €5 million, €4 million of which related to the solidboard operations and €1 million to our holdings in three Slovakian associates, which operated in the recovered fibre sector. Of the inflow of €17 million in 2016, €13 million related to IL Recycling and €4 million to the solidboard operations.
The €63 million in respect of the purchase of businesses in 2017 related mainly to Soyuz and Chatziioannou with additional amounts for the assets of Litbag, the buy-out of the Fustelpack minority and some deferred consideration for previous acquisitions. The €44 million in respect of the purchase of businesses in 2016 related to the US corrugated plants (Sound, Corrugated Professionals, Empire and Scope) and Saxon Packaging in the United Kingdom, together with some deferred consideration for previous acquisitions.
With our free cash flow in 2017 partly offset by the net investment and financing outflows, the result was a net inflow of €39 million compared to €109 million in 2016. After the amortisation of deferred debt issue costs, net debt acquired and net positive currency translation adjustments, the overall move in net debt was a decrease of €136 million to €2,805 million at December 2017 from €2,941 million at December 2016.

Smurfit Kappa Annual Report 201752
F I N A N C E R E V I E W ( CO N T I N U E D)
The net positive currency translation adjustments of €115 million in 2017 related mainly to the US dollar, with its relative weakening against the euro reducing the value of our dollar denominated debt. The dollar weakened from US$1.05/euro at December 2016 to US$1.20 at December 2017, resulting in a positive currency translation adjustment of €99 million. The net positive currency translation adjustments of €9 million in 2016 related mainly to Sterling, with the relative strengthening of the euro reducing the value of our Sterling denominated debt, with offsetting negative adjustments, mainly in respect of the US dollar.
With net debt of €2,805 million and EBITDA of €1,240 million, our leverage ratio was 2.3 times at December 2017 compared to 2.4 times at December 2016. The improvement in our leverage is driven primarily by the lower level of net debt in 2017, with only a small increase in EBITDA year-on-year.
Capital Resources and LiquidityCommitted facilities (excluding short-term sundry bank loans and overdrafts) amounted to €4,385 million (2016: €4,007 million) of which €3,230 million (2016: €3,278 million) was utilised at 31 December 2017. The weighted average period until maturity of undrawn committed facilities is 2.4 years (2016: 3.0 years).
The Group’s net debt continues to reduce in both absolute and multiple terms, positioning the Group with considerable financial strategic flexibility subject to the medium-term leverage ratio range of 1.75 times to 2.5 times. Our growth strategy will be underpinned by strong cash flow generation, enabling the Group to maintain its Ba1/BB+ credit rating.
At 31 December 2017, the Group’s average interest rate was 4.1% compared to 4.3% in 2016.
The Group’s diversified funding base and long dated maturity profile at 3.4 years continue to provide a stable funding outlook. In terms of liquidity, the Group held cash on the balance sheet of €539 million at the end of the year that was further supplemented by available commitments under its revolving credit facility of approximately €834 million.
In January 2017, the Group issued €500 million of seven-year euro denominated senior notes at a coupon of 2.375%, the proceeds of which were used to prepay term debt under the senior credit facility, reduce indebtedness under existing securitisation facilities and for general corporate purposes. In February 2017, the Group increased the revolving credit facility under the senior credit facility by €220 million thereby further enhancing the Group’s liquidity.
In May 2017, the Group amended, restated and extended its €175 million receivables securitisation programme, which utilises the Group’s receivables in Austria, Belgium, Italy and the Netherlands, extending the maturity to February 2022 and reducing the margin of the variable funding notes from 1.70% to 1.375%.
The Group has a stable financing base with a long-term and well spread maturity profile. The Group’s credit rating of Ba1/BB+ contributes to a lower cost of capital and access to the widest range of financing options available. These positions were achieved as a result of the Group’s consistent ability to generate strong free cash flows together with active management of its debt portfolio. The strength of the Group’s capital base together with consistent delivery of strong free cash flows provides solid and cost effective support to the Group’s medium-term plans, which include investing €1.6 billion in capital projects in the years 2018 to 2021. This expenditure is in addition to the base level of approximately €320 million per annum for maintenance and environmental requirements and is focused on reducing costs, maintaining integration levels and catering for targeted growth.
The Group’s primary sources of liquidity are cash flow from operations and borrowings under the revolving credit facility. The Group’s primary uses of cash are for funding day-to-day operations, capital expenditure, debt service, dividends and other investment activity.
Market Risk and Risk Management PoliciesThe Board of Directors sets the Group’s treasury policies and objectives, which include controls over the procedures used to manage financial market risks. These are set out in detail in Note 29 to the Consolidated Financial Statements.
The Group is exposed to the impact of interest rate changes and foreign currency fluctuations arising from its investing and funding activities and its operations in different foreign currencies. Interest rate risk exposure is managed by achieving an appropriate balance of fixed and variable rate funding. As at 31 December 2017, the Group had fixed an average of 79% of its interest cost on borrowings over the following twelve months.
At 31 December 2017, the Group’s fixed rate debt comprised €200 million 5.125% senior notes due 2018, US$300 million 4.875% senior notes due 2018 (US$50 million swapped to floating), €400 million 4.125% senior notes due 2020, €500 million 3.25% senior notes due 2021, €500 million 2.375% senior notes due 2024, €250 million 2.75% senior notes due 2025 and US$292.3 million 7.50% senior debentures due 2025. In addition, the Group had €349 million in interest rate swaps with maturity dates ranging from October 2018 to January 2021.

53
Strategic Report Governance FinancialsOverview
The Group’s earnings are affected by changes in short-term interest rates as a result of its floating rate borrowings. For each one per cent increase in LIBOR/EURIBOR interest rates on these borrowings, the Group’s interest expense would increase, and income before taxes would decrease, by approximately €8 million over the following twelve months. Interest income on the Group’s cash balances would increase by approximately €5 million assuming a one per cent increase in interest rates earned on such balances over the following twelve months.
The Group uses foreign currency borrowings, currency swaps, options and forward contracts in the management of its foreign currency exposures.
ConclusionThe investments envisaged in our Medium Term Outlook are underpinned by the strength of the Group’s Balance Sheet. As a result, our new ROCE target is 17% with net debt to equity in the range of 1.75 times to 2.5 times through the cycle.
Ken Bowles Group Chief Financial Officer

Smurfit Kappa Annual Report 201754
S U STA I N A B I L I T Y
Sustainability is a central part of SKG’s business strategy. As a customer-oriented, market-led company, the satisfaction of customers, personal development of employees and respect for local communities and the environment are all inseparable from our goal of creating value for the shareholders.
In their daily lives, people need food, clothing and household goods. Robust paper-based packaging will protect these from damage and waste, while delivering them in an efficient and sustainable way. Estimated global population growth, from seven billion today to nine billion in 2050, will offer significant business opportunities and challenges to companies such as SKG. In response to rising global wealth and wellbeing, commerce will change and worldwide demand for packaging goods and services will continue to grow.
Since its foundation over 80 years ago, the circular economy has been at the core of the Group’s business and we intend to maintain our leading role as it becomes the industry standard. Climate change, limited natural resources, growing population and uneven distribution of wealth, are pressing global challenges that will require a response from industry. At SKG, these factors are the foundation of our circular model: sustainably sourcing our key raw materials, minimising our operational impact and lowering the environmental footprint of our customers and consumers.
Sustainability is a central part of SKG’s businessstrategy

55
Strategic Report Governance FinancialsOverview
Working towards global sustainability gives business new opportunities, while requiring us all to set common targets. The UN Sustainable Development Goals (‘SDGs’) provide relevant guidance, and SKG will play its part in making them a reality for our stakeholders. In our materiality assessment, we compared the SDGs against our business strategy and policies, as well as against stakeholder expectations. This allows us to strategically build on opportunities and minimise risks within the sustainability context.
The cornerstone of our sustainability strategy, as with all our work, is our Code of Business Conduct. We focus our sustainability efforts on five strategic priorities, identified through a robust materiality assessment process. These are explained in the table below.
FOREST CLIMATE CHANGE WATER WASTE PEOPLE
SCOPE OF THE STRATEGIC
PRIORITY
Covers forest management, biodiversity, fibre-sourcing and communicating how we use sustainable fibres through certified Chains of Custody. It also looks into efficient use of fibres, including recycling.
Covers energy use, climate change and greenhouse gas emissions.
Covers water intake and discharge from our processes. Our key concern is with the quality of our water discharge as we eventually release nearly all the water we use back into the environment.
Producing paper-based packaging generates very little waste. However, in the paper recycling process we receive additional extra materials that we cannot yet fully recycle. Our goal is to reduce the amount of these additional materials being sent to landfill.
This is built around three key elements: SKG as a responsible employer; Health and Safety at our operations; and commitments to our communities. All these elements are integral for our future success.
OUR COMMITMENTS
n All fibre produced and/or purchased will be Chain of Custody certified under FSC®, PEFC™ or SFI™.
n Over 90% of our packaging will be sold as Chain of Custody certified under FSC®, PEFC™ or SFI™.
n A 25% reduction in relative total fossil CO2 emissions compared to 2005 (scope 1 and 2) from our mill system by 2020.
n Collaborate with customers to calculate the carbon footprint of the packaging life cycle.
n A one-third reduction of COD (chemical oxygen demand) in water returned to the environment from our mill system by 2020 (compared to 2005).
n Perform environmental impact assessments of water use at our sites where relevant.
n Reduce waste generated at our paper and board mills and sent to landfill by 30% per produced tonne of paper by 2020 (compared to 2013).
n Operate with Health and Safety as a core value with zero fatalities and a 5% improvement in Health and Safety performance measures annually.
n Invest in our host communities contributing to social development.
n Be recognised as a great place to work by our current employees and a company of choice for targeted talent.

Smurfit Kappa Annual Report 201756
S U STA I N A B I L I T Y ( CO N T I N U E D)
SKG annually reports on its sustainability performance – the 2017 Sustainable Development Report will be published in the second quarter of 2018. SKG published its tenth Sustainable Development Report in May 2017, and it can be found on our website: smurfitkappa.com. All previous Sustainable Development Reports are also available. The Group’s Sustainable Development Reports covers an overview of SKG’s performance against its long-term sustainability commitments and sustainability strategy.
SKG is committed to the principles of the UN Global Compact and reports in line with the Global Reporting Initiative (‘GRI’) G4 comprehensive criteria, against which our sustainability data and reporting has been assured for eight years (the 2017 report will be the ninth assured report). This provides a transparency in SKG’s operational reporting and guarantees our credibility to stakeholders, especially customers, investors and the communities in which we operate.
Circular Approach Based on EvidenceFor many years our operations and products have been based on a circular model inspired by our raw material. Forests are a closed loop, from which we can positively benefit when they are used sustainably. Within our industry SKG has pioneered full Chain of Custody, enabling us to sell over 90% of our products as FSC®, PEFC™ or SFI™ certified, driving a sustainable loop for our raw materials.
Having integrated paper recycling operations in our business, we can efficiently manage our raw material sourcing, ensuring good quality in each region where we operate. We take our producer responsibility seriously, using 75% recycled fibres as our raw material. Sustainably sourcing our fibres benefits us and our stakeholders: with 100% Chain of Custody certified raw material sourcing and production, we have traceability systems that comply with regulations, and with customer and investor requirements.
Unsustainable forests and fibrous raw material are the main risks to our stakeholders. We enhance our customers’ brand value by guaranteeing risk-management through Forest Certification, and related Chain of Custody Certification. This leads to operational continuity and business growth for SKG.
SKG has led from the front on sustainability for the past decade. As part of that commitment to sustainable business practices, we have rigorously collected sustainability data on our operations for the past decade. We use this information to continually improve our process efficiency and meet our sustainability targets, such as reducing CO2 emissions. In our paper mills we are resource efficient, using raw materials and their by-products to their fullest. For example, our Piteå mill in Sweden is now run almost entirely on biofuels derived from the wood pulping process. In many mills, biogases from waste water treatment are fuel for heat and power production. Our Roermond mill has been internationally recognised for finding circular economic synergies with its neighbours.
Packaging
solutionseffi
ciency
Long
-ter
mpr
ofita
bilit
y
Compliance
Risk
management
Cost
efficiency
Measurable
targets
■ Circularity■ Inclusiveness■ Innovation
CIRCULARITY
CollaborationValue
Value
Customer
Bra
nd
Resource
Oppo
rtunities
Prco
ess
impr
ovem
ent
Driving EfficiencyBu
sine
ss G
rowth
Operational continuity
Sustainability in business strategy benefits through
multiple layers

57
Strategic Report Governance FinancialsOverview
Product development and innovation at SKG is data driven, with a proven scientific approach informing good business decisions. Data collected from our operations is combined with ongoing research and analysis of customer challenges and specific markets. We employ a range of tools, ‘Innotools’, uniquely exclusive to SKG, enabling us to create the optimal fit-for-purpose packaging solutions for our customers, thereby adding value to their businesses. Furthermore, the Innotools feed information to our customer value-added services: SupplySmart; ShelfSmart; and eSmart in the areas of supply chain optimisation, brand growth and eCommerce.
We are proud of the transparency we offer our stakeholders and the credibility that third-party assured data delivers. This strategy is integral to delivering business growth, operational continuity and efficiency.
Corporate Citizenship
Policies
SKG has specific policies on key areas of sustainability which are integral in improving future performance. These cover Environment, Sustainable Forestry, Social Citizenship and Health and Safety. These policies complement other policies in place, covering: Good Faith Reporting, Code of Business Conduct, Code of Ethics for Senior Financial Officers, Group Financial Reporting Guide, Group Treasury Policy, Financial Monitoring Policy, Treasury Compliance Programme and Competition Compliance Programme.
A report on Corporate Governance is detailed on pages 72 to 77 of this Annual Report.
Social Citizenship
SKG conducts a large part of its commitment to corporate social responsibility under the heading of Social Citizenship. SKG is committed to managing its business in accordance with its declared values which recognise that good social citizenship, reflected in the manner in which it interacts with its employees, business partners and local communities, is an essential ingredient in creating and maintaining a sustainable future.
SKG applies the principles of respect for human rights, freedom of association, fair compensation, and diversity regardless of age, gender, sexual orientation, ethnic origin, disability or nationality. Merit is the key determinant in recruitment and promotion.
SKG values open, constructive, regular and timely dialogue with its employees and their representatives, particularly in all matters affecting the business including safety, working conditions, profitability, business outlook, investment decisions or the terms and conditions of employment.
The European Works Council (‘EWC’), which was created to assist in the development of an open two-way communication process for all employees and unions on all such matters, had two meetings during the year, with an additional three meetings with the Select Committee of the EWC.
Matters typically discussed at the EWC include employment opportunities, financial status, projected developments, business conditions, relocation, curtailment or business closures and health and safety.
Implementing SKG’s Social Citizenship Policy is the responsibility of line management who are supported by the human resource managers at country, segment and Group level.
Modern Slavery Act
SKG is subject to the provisions of the UK Modern Slavery Act. In keeping with the United Nations Guiding Principles on Business and Human Rights and the Fundamental principles and Rights at Work developed by the International Labour Organisation, we are committed to the principles of respect, diversity, working fairly, fair pay, compensation and benefits and acquisition practices. They are maintained in every country in which we have a presence and are set out in our Code of Business Conduct, our Social Citizenship Policy Statement and our Sustainability Report.
SKG has thousands of suppliers globally and we believe that our suppliers are an integral part of the value chain of our business. We are committed to working with our suppliers in accordance with our sustainability principles and objectives which highlight our requirements in the areas of compliance, performance risk management, social responsibility and governance. Maintaining transparent and long-term relationships with suppliers is essential for our business. This partnership approach ensures we can audit suppliers on their compliance and our sustainable supply chain standards and, where they fall short, work with them to improve sustainability in their business.
In recognition of the nature and concern about modern slavery we continue to develop our principles and policies with respect to our employees and our suppliers to ensure compliance with the Modern Slavery Act. We issued a statement under section 54 of the Act in 2017 and will issue an updated statement in June 2018.
Communities
We engage in the communities in which we are located and strive to be seen as a good corporate citizen. We are transparent about our activities, and our mills and plants have an open-door policy for different stakeholder groups.
SKG invests significantly in its host communities, contributing to economic and social development. Internally and externally, we adhere to high ethical and professional standards, making the well-being and safety of people a priority within and outside our organisation.
Community involvement builds trust and improves communication. This plays a positive part in our development and mitigates risks related to operational continuity. In our charitable work we focus on self-help initiatives, education and health programmes for the less advantaged and especially for young people.

Smurfit Kappa Annual Report 201758
S U STA I N A B I L I T Y ( CO N T I N U E D)
Health and SafetySKG h as made the health and safety of its workforce an overriding consideration. It adopts a structured and systematic approach to the management of health and safety considerations in the workplace.
The SKG Health and Safety Policy statement states that:
“At Smurfit Kappa, we promote a health and safety culture founded on understanding, responsibility and accountability. Our vision is to operate with Health and Safety as a core value, not just a priority. We aim to continually improve our performance by adopting a structured systematic approach to the management of health and safety aspects supported by continual improvement of our systems”.
“It is Smurfit Kappa policy to implement good health and safety practice by adopting proven industry practice across the organisation” and “foster a work environment where every member of the workforce has an individual responsibility to execute their tasks in a safe, diligent and professional manner.”
The commitments within the revised Group health and safety policies are consistent with those of the internationally recognised OHSAS18001 occupational health and safety system specification.
Every facility within SKG adopts a suite of good health and safety management systems designed to protect employees, visitors to its sites, contractors and the public at large from injury and ill-health.
All performance reviews at plant, country, division and regional level include a review of recent health and safety performance. On a quarterly basis the Board receive a progress report outlining key health and safety developments.
SKG promotes the development and implementation of technical and engineering improvements through continual internal benchmarking of health and safety performance and promotes the introduction of innovative solutions through its annual health and safety awards programme.
SKG recognises the importance of strong leadership, continual employee involvement, and representation in the development and maintenance of a positive safety culture. To that extent, it maintains an interconnected and collaborative health and safety “expert community” that supports the operations management teams as they take steps, both locally and regionally, to address common and unique challenges. This expert network leverages the rich knowledge of employees in areas such as human resources, production, industrial design, and process control. This network positions SKG to deliver innovative solutions based on proven principles.
The safety of every member of the workforce is a key consideration for the Group. SKG devotes considerable time and effort to the management of health and safety aspects so that employees and subcontracted workers are aware of and follow the appropriate protective procedures.
The Group Health and Safety performance improved again in 2017 with a further reduction in the number of Lost Time Accidents compared to previous years due to a number of health and safety measures and initiatives implemented across the Group. Relative safety frequency has significantly reduced in 2017 with a reduction of almost 10%, reaching the lowest level in our most recent history.
Regrettably, we have to report two fatalities in 2017: one employee at our Elcorr site in the Netherlands suffered a fatal injury whilst operating a palletising line. Another employee at the forestry division in Venezuela sustained a fatal injury while cutting a tree which collapsed on him. The prevention of every accident is and will remain a key priority for the Group.
SKG is committed to making continual advances in its health and safety management processes. We regularly perform comprehensive health and safety verification and audit process tailored specifically to its global operations. Based on its internal health and safety operating standards, this audit process verifies the presence of the appropriate protective measures.

Strategic Report Governance FinancialsOverview
59

Smurfit Kappa Annual Report 201760
P EO P L E
As part of our overall business vision and strategy, we have developed a People Strategy to attract, engage, develop and retain talented people in SKG, offering both employees and potential employees the opportunities and conditions to become high-performers and to achieve their full potential.
The People Strategy is a key facilitator for achieving SKG’s short and long-term business targets, and is based on six main pillars and a number of foundations:
Each of these pillars is described in more detail below.
Safety and Well-being
Legal Framework | Industrial Relations | HR Information Systems | Internal Comms
We have developed a People Strategy to attract, engage, develop and retain talented people
S M U R F I T K A P PA
Mission and Strategy
Talent Attraction
Employee Engagement
People Development
Diversity & Inclusion
Performance Management
Compensation
1 2 3 4 5 6

61
Strategic Report Governance FinancialsOverview
P I L L A R 2
Employee EngagementWe believe that a company with engaged employees generates higher growth, faster innovation, greater customer satisfaction and better results, and that employees thrive in a better working environment.
Over the last three years since the first global employee engagement survey, MyVoice, was held in 2014, the Group has implemented over 1,000 actions across our plants and mills based on local results. The 84% response rate of the MyVoice survey in 2017 exceeded the already high response rate of 80% of the first survey. MyVoice was very well received, with our employees voicing their opinions on their work experience, their managers and working environment and on the potential areas of improvement.
In MyVoice 2017, we recorded improvements in the engagement scores of all our regions (Group, Europe and The Americas). Also, all the different drivers of engagement used in our engagement model saw a higher positive response, showing an overall positive
trend. Strong improvements were made in areas such as Career Opportunities, Communication and Reward and Recognition. Health and Safety came out at the top of all engagement drivers, once again exceeding external benchmarks. Overall our employees are strongly committed to the company and proud to be part of Smurfit Kappa. At the same time, further areas of improvement were identified, reconfirming that engagement is a continuing journey.
The MyVoice survey is considered a trusted tool for continuous improvement helping to make Smurfit Kappa an even greater place to work.
P I L L A R 1
Talent AttractionSKG aims at all times to match the right person to the right role. The underlying process is two-fold: ensuring that our existing talent is properly developed and that we are attracting new talent with the correct skill set.
The Group offers a number of graduate programmes which typically last two years and offer a number of challenging assignments and opportunities. The aim is to attract top talent in various disciplines and offer the candidates the prospect of a successful career at SKG.
Following the Group branding strategy ‘Open the Future’, we have now developed a global Employer Brand in order to calibrate all of our talent attraction programmes and approach the employee recruitment market in a unified manner. An employer branding campaign has been developed that invites talent to join SKG and shape the future of the Group under the tagline ‘Where will you take us?’. The campaign message is supported by a number of communications, promoting enriching the diversity and depth of the world of SKG.

Smurfit Kappa Annual Report 201762
P I L L A R 3
People DevelopmentDevelopment of our employees is a key objective for the Group. We encourage our employees to reach their potential through continuous training and personal development. We support several learning and development programmes at all levels in the organisation and promote opportunities for individual progression and learning activities.
Within our Smurfit Kappa Academy there are a wide range of learning and development initiatives including:
n Graduate Workshop
n Advanced Management Development Programme (‘AMD’)
n Global Manager Programme (‘GMP’)
n Open Leadership Programme @ INSEAD business school
n Business Economics Training
n Management for Continuous Improvement
n Value Selling Process
n English Immersion Programme.
In addition, across our operations, a wide range of training programmes are being delivered locally for both teams and individual employees, according to local needs and local development strategies. The Group believes that learning never stops and we seek to ensure that all employees in the organisation receive appropriate training.
P EO P L E ( CO N T I N U E D)
G R A D UAT E WO R K S H O P, E U RO P E 2 0 1 7
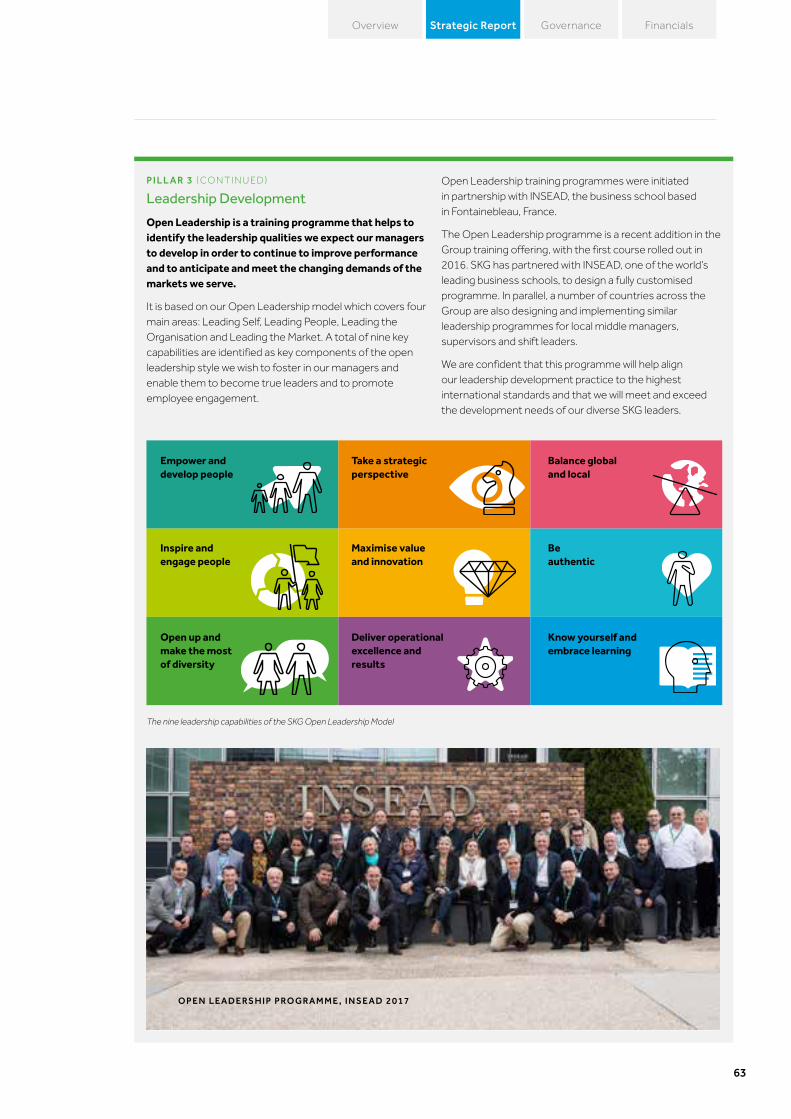
63
Strategic Report Governance FinancialsOverview
O P E N L E A D E RS H I P P RO G R A M M E , I N S E A D 2 0 1 7
P I L L A R 3 ( CO N T I N U E D)
Leadership Development
Open Leadership is a training programme that helps to identify the leadership qualities we expect our managers to develop in order to continue to improve performance and to anticipate and meet the changing demands of the markets we serve.
It is based on our Open Leadership model which covers four main areas: Leading Self, Leading People, Leading the Organisation and Leading the Market. A total of nine key capabilities are identified as key components of the open leadership style we wish to foster in our managers and enable them to become true leaders and to promote employee engagement.
Open Leadership training programmes were initiated in partnership with INSEAD, the business school based in Fontainebleau, France.
The Open Leadership programme is a recent addition in the Group training offering, with the first course rolled out in 2016. SKG has partnered with INSEAD, one of the world’s leading business schools, to design a fully customised programme. In parallel, a number of countries across the Group are also designing and implementing similar leadership programmes for local middle managers, supervisors and shift leaders.
We are confident that this programme will help align our leadership development practice to the highest international standards and that we will meet and exceed the development needs of our diverse SKG leaders.
The nine leadership capabilities of the SKG Open Leadership Model
Empower and develop people
Inspire and engage people
Open up and make the most of diversity
Take a strategic perspective
Maximise value and innovation
Deliver operational excellence and results
Balance global and local
Be authentic
Know yourself and embrace learning
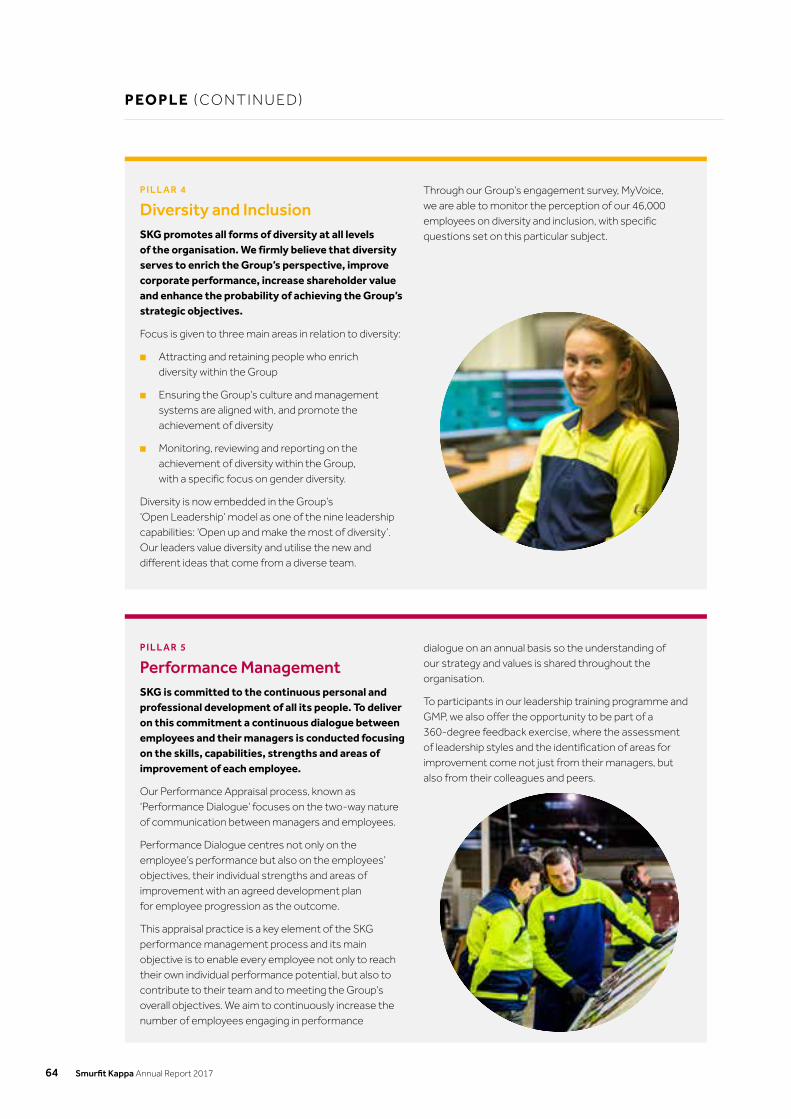
Smurfit Kappa Annual Report 201764
P EO P L E ( CO N T I N U E D)
P I L L A R 5
Performance ManagementSKG is committed to the continuous personal and professional development of all its people. To deliver on this commitment a continuous dialogue between employees and their managers is conducted focusing on the skills, capabilities, strengths and areas of improvement of each employee.
Our Performance Appraisal process, known as ‘Performance Dialogue’ focuses on the two-way nature of communication between managers and employees.
Performance Dialogue centres not only on the employee’s performance but also on the employees’ objectives, their individual strengths and areas of improvement with an agreed development plan for employee progression as the outcome.
This appraisal practice is a key element of the SKG performance management process and its main objective is to enable every employee not only to reach their own individual performance potential, but also to contribute to their team and to meeting the Group’s overall objectives. We aim to continuously increase the number of employees engaging in performance
dialogue on an annual basis so the understanding of our strategy and values is shared throughout the organisation.
To participants in our leadership training programme and GMP, we also offer the opportunity to be part of a 360-degree feedback exercise, where the assessment of leadership styles and the identification of areas for improvement come not just from their managers, but also from their colleagues and peers.
P I L L A R 4
Diversity and InclusionSKG promotes all forms of diversity at all levels of the organisation. We firmly believe that diversity serves to enrich the Group’s perspective, improve corporate performance, increase shareholder value and enhance the probability of achieving the Group’s strategic objectives.
Focus is given to three main areas in relation to diversity:
n Attracting and retaining people who enrich diversity within the Group
n Ensuring the Group’s culture and management systems are aligned with, and promote the achievement of diversity
n Monitoring, reviewing and reporting on the achievement of diversity within the Group, with a specific focus on gender diversity.
Diversity is now embedded in the Group’s ‘Open Leadership’ model as one of the nine leadership capabilities: ‘Open up and make the most of diversity’. Our leaders value diversity and utilise the new and different ideas that come from a diverse team.
Through our Group’s engagement survey, MyVoice, we are able to monitor the perception of our 46,000 employees on diversity and inclusion, with specific questions set on this particular subject.

65
Strategic Report Governance FinancialsOverview
P I L L A R 6
CompensationCompensation is a core part of our employee management strategy in SKG. We provide competitive rates of pay and ensure fair compensation practices across all our locations.
Where applicable we engage with unions, works councils and employee representatives to ensure fair and sustainable Collective Labour Wage Agreements. The employees are rewarded in line with their individual and business performance. In setting remuneration levels, SKG takes into consideration the employees’ performance appraisal, external benchmark data for their role in companies of similar size and scope while also ensuring reasonable internal equity within the Group.
SKG key objectives for its Compensation policy are to:
n Create a framework to enable the Group to attract and retain talented employees
n Motivate employees at every level of the organisation to achieve the Group’s objectives both short and long-term in order to create sustainable value
n Align with the Group’s values of supporting a performance culture
The overall employee benefit package is tailored to help meet a variety of short and long-term needs. The key elements of the package may include salary, performance related annual bonus, a long-term incentive plan (‘LTIP’) and pension benefits, all of which play a key role in driving performance throughout the organisation.
Safety and WellbeingAt SKG, we promote a Health and Safety culture founded on understanding, responsibility and accountability. Our vision is to operate with Health and Safety as a core value, not just a priority. We believe that operating safely is non-negotiable and no task is so important it can’t be done safely.
The Group Health and Safety performance improved again in 2017, with a reduction in the number of accidents compared to previous years due to a number of health and safety measures and initiatives implemented across the Group. Full details can be found on page 58 in the Sustainability section. This key focus was further highlighted as part of our annual Health and Safety Day where the theme this year was ‘Speak up & Be safe’.
In Smurfit Kappa, we champion the talent of over 46,000 employees and we recognise that our people have different skills and strengths as a result of their interests, education and experience. As a company, our responsibility is to identify the individual talents of our people and offer them the opportunity to develop and reach their full potential. Training and development is an essential part of this. We encourage all of our employees to embrace learning new information and skills, no matter what stage they are at in their Smurfit Kappa careers or whatever their level in the organisation. With the MyVoice engagement survey we regularly capture what our employees feel and think about working in Smurfit Kappa and this gives valuable insights on the areas where we can and will make improvements. We continue to implement actions to foster meritocracy and promote diversity and inclusion, equity and respect in a safe and open work environment.
Gianluca Castellini, Group VP Human Resources

Smurfit Kappa Annual Report 201766
A N I N T EG R AT E D M O D E L
PAPER MILLOur paper mills in both Europe and the Americas offer the widest range of high-quality paper grades supported by our unrivalled services. At our Los Reyes mill in Mexico, we recently invested in a high performing, state of the art machine (pictured). The mill’s capacity increased to 176,000 tonnes, which allows for the integration of additional containerboard into our corrugated system.

Strategic Report Governance FinancialsOverview
67
Governance
Board of Directors 68
Corporate Governance Statement 72
Directors’ Report 78
Audit Committee Report 80
Remuneration Report 84
Nomination Committee Report 101

Smurfit Kappa Annual Report 201768
B OA R D O F D I R EC TO RS
Liam O’Mahony | Chairman Age: 71 | Nationality: Irish
Liam O’Mahony joined the Board upon the Company being admitted to trading on the Irish Stock Exchange and the London Stock Exchange in March 2007. He was appointed Chairman in December 2008. He was the Chief Executive Officer of CRH plc from January 2000 until his retirement in December 2008, prior to which in a 37 year executive career within the CRH Group he held a number of senior management positions including Chief Executive of its US operations and Managing Director, Republic of Ireland and UK companies. He retired from the Board of CRH plc in 2011. He was previously Chairman of IDA Ireland.
Anthony Smurfit | Group Chief Executive Officer Age: 54 | Nationality: Irish
Anthony Smurfit has served as a Director of the Group since 1989 and was appointed Group Chief Executive Officer in September 2015. He has worked in various parts of the Smurfit Group both in Europe and the United States since he joined the Group. He was Group Chief Operations Officer from November 2002 to September 2015 and Chief Executive of Smurfit Europe from October 1999 to 2002 prior to which he was Deputy Chief Executive of Smurfit Europe and previously Chief Executive Officer of Smurfit France. He is a board member of the Irish Business and Employers’ Confederation and is a member of the European Round Table of Industrialists.
Ken Bowles | Group Chief Financial Officer Age: 46 | Nationality: Irish
Ken Bowles was appointed Group Chief Financial Officer in April 2016 and was appointed a Director in December 2016. He joined the Group in 1994 and has occupied a number of finance roles in various parts of the Group. In 2004 he was appointed as the Group’s first Head of Compliance, in 2007 he became the Group’s Head of Tax and in 2010 he was appointed Group Financial Controller. Mr Bowles is an associate member of the Institute of Chartered Management Accountants and holds a first class MBA from the UCD Graduate School of Business.
11
B OA R D CO M M I T T E E S
Audit Compensation Nomination
(1) Joined the Committee on IPO in 2007 or appointment date if later (See page 73)(2) Joined the Nomination Committee in 2013(3) Joined the Audit Committee in 2014 and the Compensation Committee in 2015(4) Joined the nomination committee in 2017

69
Strategic Report Governance FinancialsOverview
Frits BeurskensAge: 70 | Nationality: Dutch
Frits Beurskens has served as a Director of the Group since December 2005. He joined the Kappa Group in 1990 and held various Managing Director positions until his appointment as its President in 1996 which he held until the merger with Smurfit. He is a former Chairman of both the Confederation of European Paper Industries and the International Corrugated Cases Association and a former member of the Board of Sappi Limited. In December 2007 he was knighted and appointed by the Dutch Queen as Officer in the Order of Oranje Nassau.
Christel BoriesAge: 53 | Nationality: French
Christel Bories joined the Board in November 2012. Ms Bories joined Eramet SA in February 2017 and was appointed Group Chairman and Chief Executive Officer in May 2017. Ms Bories was previously Deputy Chief Executive Officer of Ipsen SA from March 2013 to March 2016. She was President and Chief Executive Officer of Constellium (formerly Engineered products, Rio Tinto) from 2007 to the end of 2011 prior to which she was a senior executive in both Pechiney and Alcan for fourteen years of which eight years was as the General Manager of the Packaging business. Ms Bories spent seven years in strategic consulting prior to her industrial experience. She is a non–executive Director of Legrand SA.
Carol FairweatherAge: 56 | Nationality: British
Carol Fairweather joined the Board in January 2018. Ms Fairweather was Chief Financial Officer and an executive Director of Burberry Group plc from July 2013 to January 2017. She joined Burberry in June 2006 and prior to her appointment as CFO, she held the position of Senior Vice President, Group Finance. Prior to joining Burberry, Ms Fairweather was Director of Finance at News International Limited from 1997 to 2005 and UK Regional Controller at Shandwick plc from 1991 to 1997. Ms Fairweather currently serves as a non-executive Director of Segro plc. Ms Fairweather is an Associate of the Institute of Chartered Accountants.
Irial FinanAge: 60 | Nationality: Irish
Irial Finan joined the Board in February 2012. He was Executive Vice President of The Coca-Cola Company and President of the Bottling Investments Group from 2004 until he stepped down from the role in December 2017 and retires in March 2018. Prior to this Mr Finan served as Chief Executive Officer of Coca-Cola Hellenic Bottling Company SA. He joined the Coca-Cola System in 1981. Mr Finan is responsible for the stewardship of The Coca-Cola Company’s Equity Investments. He also serves on the Boards of Coca-Cola European Partners plc and Coca-Cola Bottlers Japan Holdings plc. Mr Finan is a Fellow of the Institute of Chartered Management Accountants.
James LawrenceAge: 65 | Nationality: American
James Lawrence joined the Board in October 2015. He is currently Chairman of Great North Star LLC, an investment and advisory firm. He served as Chairman of Rothschild North America from 2012 to 2015 and previously served as Chief Executive Officer of Rothschild North America from 2010 to 2012. Prior to this, Mr Lawrence served as Chief Financial Officer and an executive Director of Unilever plc. Mr Lawrence joined Unilever from General Mills where he was Vice-Chairman and Chief Financial Officer. He previously also held senior positions with Northwest Airlines and Pepsico Inc. He is a non-executive Director of Avnet, Inc., International Consolidated Airlines Group S.A. and Aercap Holdings N.V,
2
11
CHAIRMAN11
11
1
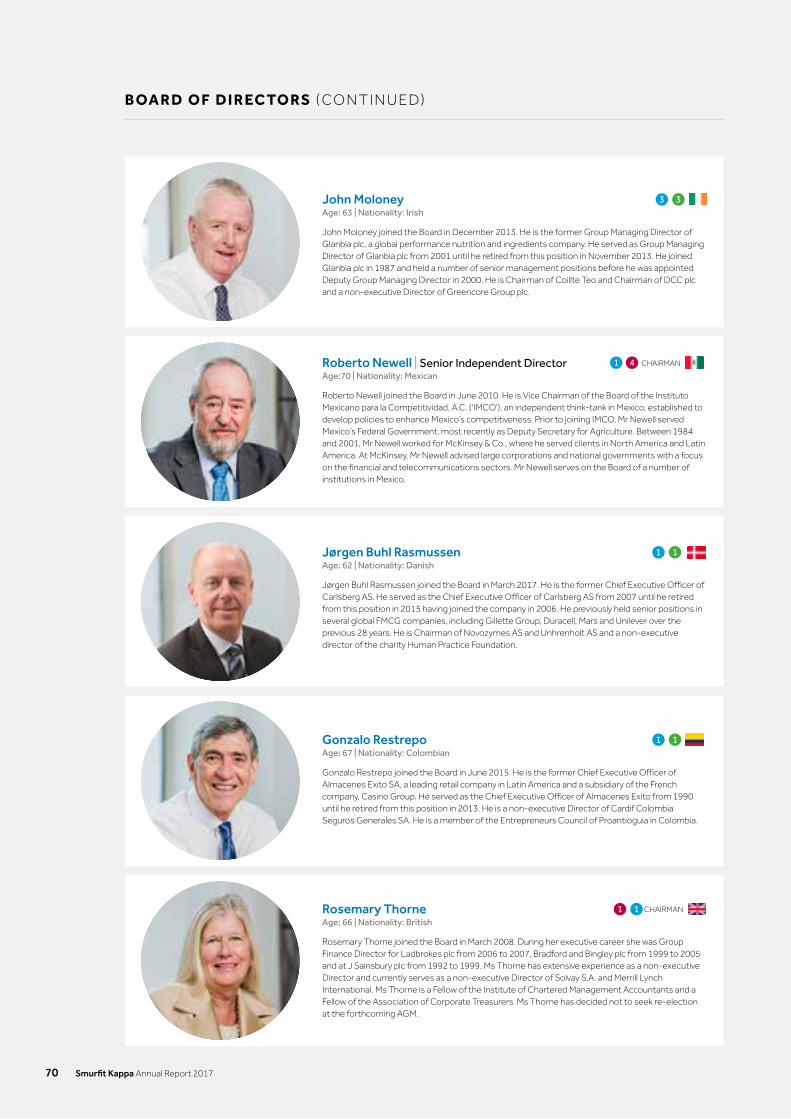
Smurfit Kappa Annual Report 201770
B OA R D O F D I R EC TO RS ( CO N T I N U E D)
John MoloneyAge: 63 | Nationality: Irish
John Moloney joined the Board in December 2013. He is the former Group Managing Director of Glanbia plc, a global performance nutrition and ingredients company. He served as Group Managing Director of Glanbia plc from 2001 until he retired from this position in November 2013. He joined Glanbia plc in 1987 and held a number of senior management positions before he was appointed Deputy Group Managing Director in 2000. He is Chairman of Coillte Teo and Chairman of DCC plc and a non-executive Director of Greencore Group plc.
Roberto Newell | Senior Independent DirectorAge:70 | Nationality: Mexican
Roberto Newell joined the Board in June 2010. He is Vice Chairman of the Board of the Instituto Mexicano para la Competitividad, A.C. (‘IMCO’), an independent think-tank in Mexico, established to develop policies to enhance Mexico’s competitiveness. Prior to joining IMCO, Mr Newell served Mexico’s Federal Government, most recently as Deputy Secretary for Agriculture. Between 1984 and 2001, Mr Newell worked for McKinsey & Co., where he served clients in North America and Latin America. At McKinsey, Mr Newell advised large corporations and national governments with a focus on the financial and telecommunications sectors. Mr Newell serves on the Board of a number of institutions in Mexico.
Jørgen Buhl RasmussenAge: 62 | Nationality: Danish
Jørgen Buhl Rasmussen joined the Board in March 2017. He is the former Chief Executive Officer of Carlsberg AS. He served as the Chief Executive Officer of Carlsberg AS from 2007 until he retired from this position in 2015 having joined the company in 2006. He previously held senior positions in several global FMCG companies, including Gillette Group, Duracell, Mars and Unilever over the previous 28 years. He is Chairman of Novozymes AS and Unhrenholt AS and a non-executive director of the charity Human Practice Foundation.
Gonzalo RestrepoAge: 67 | Nationality: Colombian
Gonzalo Restrepo joined the Board in June 2015. He is the former Chief Executive Officer of Almacenes Exito SA, a leading retail company in Latin America and a subsidiary of the French company, Casino Group. He served as the Chief Executive Officer of Almacenes Exito from 1990 until he retired from this position in 2013. He is a non-executive Director of Cardif Colombia Seguros Generales SA. He is a member of the Entrepreneurs Council of Proantioguia in Colombia.
Rosemary ThorneAge: 66 | Nationality: British
Rosemary Thorne joined the Board in March 2008. During her executive career she was Group Finance Director for Ladbrokes plc from 2006 to 2007, Bradford and Bingley plc from 1999 to 2005 and at J Sainsbury plc from 1992 to 1999. Ms Thorne has extensive experience as a non-executive Director and currently serves as a non-executive Director of Solvay S.A. and Merrill Lynch International. Ms Thorne is a Fellow of the Institute of Chartered Management Accountants and a Fellow of the Association of Corporate Treasurers. Ms Thorne has decided not to seek re-election at the forthcoming AGM.
33
11
11
CHAIRMAN11
1 CHAIRMAN4

71
Strategic Report Governance FinancialsOverview

Smurfit Kappa Annual Report 201772
The Directors are committed to maintaining the highest standards of corporate governance. This Corporate Governance Statement describes how throughout the financial year ended 31 December 2017 Smurfit Kappa Group plc applied the principles of the 2016 UK Corporate Governance Code (‘the Code’) published by the Financial Reporting Council (‘FRC’). The Directors believe that the Group has complied with the provisions of the Code throughout the year under review.
A copy of the Code can be obtained from the FRC’s website: frc.org.uk.
Board of DirectorsThe Board is primarily responsible for the long-term success of the Group, for setting the Group’s strategic aims, for the leadership and control of the Group and for reviewing the Group’s system of internal control and risk management. There is a clear division of responsibilities within the Group between the Board and executive management, with the Board retaining control of strategic and other major decisions under a formal schedule of matters reserved to it which includes:
n Approval of the Group’s strategy which is set out on page 34
n Board appointments including those of the Chairman and Group Chief Executive Officer
n Agreement of terms of appointment of the Chairman, Group Chief Executive Officer and other executive Directors
n Agreement of any fundamental changes to the Group management and control structure
n Approval of the annual financial budgets
n Approval of capital expenditure above fixed limits
n Approval of material acquisitions and disposals of businesses
n Approval of the Interim Management Statements, the Interim Report, the Preliminary Results Release and the Annual Report
n Establishment and review of corporate governance policy and practice
n Monitoring of the Group’s risk management and internal control systems
n Confirming that the Annual Report and Consolidated Financial Statements, taken as a whole, are fair, balanced and understandable and provides the information necessary for shareholders to assess the position and performance of the Group, its business model and strategy.
As recommended by the Code, the roles of Chairman and Group Chief Executive Officer are held by separate individuals and the division of responsibilities between them is clearly established and has been set out in writing and approved by the Board. The Board has delegated responsibility for the day-to-day management of the Group, through the Group Chief Executive Officer, to executive management. The Group Chief Executive Officer is responsible for implementing strategy and policy as approved by the Board. As discussed below, the Board has also delegated some of its responsibilities to Committees of the Board. The powers of Directors are determined by Irish legislation and the Articles of Association of the Company. The Directors have access to independent professional advice at the Group’s expense, if and when required. No such advice was sought by any Director during the year. The Board Committees are provided with sufficient resources to undertake their duties.
Membership, Board Size and IndependenceFollowing the appointment of Ms Fairweather, there are thirteen Directors on the Board, comprising: a non-executive Chairman, two executive Directors and ten non-executive Directors. A list of Directors is set out on page 73 and biographical details are set out on pages 68 to 70. The Board considers that the Board comprising thirteen Directors is not so large as to be unwieldy and that the Directors with a broad spread of nationalities, backgrounds and expertise bring the breadth and depth of skills, knowledge and experience that are required to effectively lead the Group.
The Group has in place an effective Board which provides the highest standards of governance to an internationally diverse business with interests spanning three continents and 35 individual countries. Each of the Group’s non-executive Directors has broad-based international business expertise and many have gained significant and relevant industry specific expertise over a number of years. The composition of the Board reflects the need, as outlined by the Code, for an effective Board to maintain a balance of “skills, knowledge and experience”. The experience of each Director is set out in their biographies which are detailed on pages 68 to 70.
The Board through the Nomination Committee reviews the composition of the Board on an annual basis. This includes a review of refreshment and renewal policies, Board diversity, including gender diversity and the skills, knowledge and experience of the Directors.
In particular, a central aspect of maintaining Board effectiveness is an ongoing programme of Board refreshment, which fosters the sharing of diverse perspectives in the boardroom and the generation of new ideas and business ideas. During the year, the Board’s ongoing refreshment continued, with the appointment of Jørgen Buhl Rasmussen and Carol Fairweather to the Board. The Board continues to include an appropriate balance of longer serving and more recently appointed Directors.
Following these reviews, the Board is satisfied that the Board and its Committees are performing effectively and that the balance of skill, experience, diversity, independence and knowledge of the Group are sufficient to enable the Directors to discharge their respective duties and responsibilities effectively and believe the Board has a sufficient balance of diversity. The culture of the Board is open, transparent and collegiate. The Chairman demonstrates leadership and encourages an open and transparent style around the Board table.
The Code recommends that, apart from the Chairman, at least half of the Board of Directors of a listed company should comprise non-executive Directors determined by the Board to be independent. During the year under review the Company complied with the Code recommendation on Board independence. The Chairman was independent on appointment.
The Board reviewed the composition of the Board and determined that Ms Bories, Ms Fairweather, Mr Finan, Mr Lawrence, Mr Moloney, Mr Newell, Mr Rasmussen, Mr Restrepo and Ms Thorne are independent. In reaching that conclusion the Board took into account the principles relating to independence contained in the Code and specifically whether any non-executive Director:
CO R P O R AT E G OV E R N A N C E STAT E M E N T

73
Strategic Report Governance FinancialsOverview
n has been an employee of the Group;
n has or had within the last three years, a material business relationship with the Group;
n receives remuneration from the Group other than a Director’s fee;
n has close family ties with any of the Group’s advisers, Directors or senior employees;
n holds cross-directorships or has significant links with other Directors through involvement in other companies or bodies;
n represents a significant shareholder; or
n has served on the Board for more than nine years from the date of their first election.
The Board is satisfied that the independence of the relevant Directors is not compromised by these or any other factors.
While Mr Beurskens was previously an employee of the Group and Ms Thorne has served on the Board for more than nine years, the Board does not believe these facts compromise their independence of judgement, their contribution to the Board or the quality of their oversight.
Executive and Non-executive Directors – Experience and SkillsEach of the executive Directors has extensive experience of the paper-based packaging industry. Their knowledge is backed up by the general business skills of the individuals involved and previous relevant experience. The non-executive Directors use their broad based skills, their diverse range of business and financial experiences and their international backgrounds in reviewing and assessing any opportunities or challenges facing the Group and play an important role in developing the Group’s strategy and scrutinising the performance of management in meeting the Group’s goals and objectives. Two of the non-executive Directors have the additional benefit of many years exposure to paper-based packaging companies either as employees, directors or stakeholders which complements the experiences of the executive Directors.
Appointments, Retirement and Re-election to the BoardAny Director co-opted to the Board by the Directors is subject to election by the shareholders at the first Annual General Meeting (‘AGM’) after their appointment and, pursuant to the Articles of Association of the Company, all Directors are subject to re-election at intervals of no more than three years. However, in accordance with the Code, the Directors individually retire at each AGM and submit themselves for re-election if appropriate.
The procedures governing the appointment and replacement of Directors are contained in the Company’s Articles of Association. Changes to the Articles of Association must be approved by the shareholders in accordance with Irish company law.
The standard letter of appointment of non-executive Directors will be available for inspection at the AGM and is available on request, from the Company Secretary.
Each of the Directors, other than Ms Thorne, are offering themselves for re-election at the 2018 AGM.
External DirectorshipsThe Board believes that there is benefit for the Group if executive Directors hold non-executive directorships with other companies as it enhances their overall business experience. Consequently, the executive Directors are encouraged to accept a small number of external appointments as non-executive Directors or on industry associations. Directors are permitted to retain any payments received in respect of such appointments.
Director Role Independent Appointment Date *
Liam O’Mahony Non-executive Chairman ** 2007
Anthony Smurfit Group Chief Executive Officer No 1989
Ken Bowles Group Chief Financial Officer No 2016
Frits Beurskens Non-executive Director – former Executive No 2005
Christel Bories Non-executive Director Yes 2012
Carol Fairweather Non-executive Director Yes 2018
Irial Finan Non-executive Director Yes 2012
James Lawrence Non-executive Director Yes 2015
John Moloney Non-executive Director Yes 2013
Roberto Newell Non-executive Director Yes 2010
Jørgen Buhl Rasmussen Non-executive Director Yes 2017
Gonzalo Restrepo Non-executive Director Yes 2015
Rosemary Thorne Non-executive Director Yes 2008
* For Smurfit Kappa Group plc or its predecessor companies. SKG returned to the ISE and LSE in March 2007** On his appointment as Chairman in December 2008 Mr O’Mahony was independent

Smurfit Kappa Annual Report 201774
CO R P O R AT E G OV E R N A N C E STAT E M E N T ( CO N T I N U E D)
RemunerationDetails of remuneration paid to Directors (executive and non-executive) are set out in the Remuneration Report on pages 84 to 100. Non-executive Directors are paid fees for their services and none of their remuneration is performance related. They are not eligible to participate in the Group’s annual bonus scheme or long-term incentive plans (‘LTIP’). Non-executive Directors’ fees are not pensionable. The Remuneration Policy and the Remuneration Report will be presented to shareholders for the purposes of a non-binding advisory vote at the AGM on 4 May 2018. A new LTIP will also be presented to the shareholders at that meeting.
ChairmanMr Liam O’Mahony who joined the Board upon the Company being admitted to trading on the ISE and the LSE in March 2007 was appointed Chairman in December 2008. As recommended by the Code, the Chairman was independent at his time of appointment. The Chairman is responsible for the leadership of the Board and the efficient and effective working of the Board. He sets and manages the Board agenda in order that at appropriate times it addresses all matters reserved to the Board and ensures that adequate time is available for discussion on strategy and the strategic issues facing the Group. He ensures that the Directors receive accurate, timely and clear information, and that the Directors are updated periodically on the views or concerns of the major investors. He also ensures that a culture of openness and debate is fostered to facilitate the effective contribution of the non-executive Directors to the Board.
Senior Independent DirectorMr Roberto Newell was appointed the Group’s Senior Independent Director in May 2017. His duties include being available to shareholders if they have concerns which cannot be resolved through the Chairman or Group Chief Executive Officer or where contact with either of them is inappropriate. He is available to serve as an intermediary for other Directors where necessary. The Senior Independent Director also conducts an annual evaluation of corporate governance compliance, the operation and performance of the Board, the Directors, its Committees and the Chairman’s performance in conjunction with the other non-executive Directors on an annual basis except in the year when an external evaluation takes place.
Group SecretaryThe Directors have access to the advice and services of the Group Secretary who is responsible to the Board for ensuring that Board procedures are followed, applicable rules and regulations are complied with and that the Board is advised on its corporate governance obligations and developments in best practice. The Group Secretary is responsible for formal minuting of any unresolved concerns that any Director may have with the operation of the Company. During the year, there were no such unresolved issues. The Group Secretary also acts as secretary to all of the Board Committees.
Board MeetingsThe Board meets at least five times each year with additional meetings as required. The Board met five times in 2017. Details of the meetings held during the period are contained in the schedule on page 77, which also includes information on individual attendance. The Board holds at least one of its meetings each year at a Group operation to give the Directors an opportunity to meet with a wider range of management and to see and remain familiar with the Group’s operating activities. In 2017 the July Board meeting was held in Austria at our Nettingsdorfer Mill. The Board is supplied on a timely basis in advance of Board meetings with a Board Report comprising strategic updates, operational, financial, health and safety, and investor relations information together with Board papers on key issues in a form and of a quality to enable it to discharge its duties effectively. The Board papers also include the minutes of all Board Committee meetings and at each Board meeting the Chairman of each Committee gives a report on major agenda items discussed at Committee meetings held since the last Board meeting.
When Directors are unable to attend a meeting, having been advised in the Board papers circulated prior to the meeting of the matters to be discussed, they are given an opportunity to make their views known to the Chairman or the Group Chief Executive Officer prior to the meeting.
Induction and DevelopmentOn appointment, all non-executive Directors receive comprehensive briefing documents on the Group, its operations and their duties as a Director. They are also given presentations by the senior management team and are given the opportunity to visit sites and meet with the local management. During the year Directors meet with senior management at Board meetings, on individual site visits and at the annual visit by the Board to a Group operation. Directors also receive regular briefings and presentations on a wide range of the Group’s activities together with all significant analyst and rating reports. All Directors are encouraged to go for training to ensure they are kept up to date on relevant legal developments or changes in best practice.
Succession Planning and DiversityThe Board believes that appointing the best people to the Group’s Board is critical to the success of the Company and as a result all appointments are made purely on merit regardless of gender, race, religion, age or disability. The Board recognises that diversity is an essential cornerstone for building long-term business success and ensures different perspectives are introduced into Board discussion. The Board considers gender, tenure and a wide geographical experience base to be essential aspects of diversity for a company with businesses in 35 countries worldwide, with eight nationalities represented on the Board. This policy plays a key role in the Group’s succession planning when considering new appointments to the Board. Suitable candidates are selected on the basis of their relevant experience, employment background, skills, knowledge and insight, having due regard to the benefits of diversity to the Board. For example, Ms Fairweather, whose appointment as non-executive Director was confirmed by the Board in December 2017, has significant expertise in the global retail sector and this, together with her experience as Chief Financial Officer of a FTSE 100 company, will add to the Board’s skill base. Her biography is set out on page 69.
During the year the Nomination Committee evaluated the composition of the Board with respect to the balance of skills, knowledge, experience and diversity, including geographical and

75
Strategic Report Governance FinancialsOverview
gender diversity, on the Board and updated a policy document on Board succession which was approved by the Board.
External Board EvaluationAn independent external Board evaluation was carried out in 2016 by ICSA Board Evaluation (‘ICSA’), a division of the Institute of Chartered Secretaries and Administrators who also carried out the previous evaluation in 2013.
The overall outcome was positive and indicated that the Board was operating effectively and cohesively with performance being rated “very good” and in the upper quartile of a six point scale ranging from poor to excellent. ICSA was part of an organisation that supplied some IT services to the Group, however, the annual value of the contract was not material to either party.
Internal Board EvaluationThe Senior Independent Director co-ordinates an annual evaluation of corporate governance compliance, the operation and performance of the Board, the Directors, its Committees and the performance of the Chairman except in years when an external evaluation is carried out. This is achieved through the completion of a detailed questionnaire by each Director and separate discussions with each Director. An evaluation was carried out during the fourth quarter of 2017 and indicated that a robust consensus exists that the Board is functioning effectively, both as a Board and at Committee level. The Chairman conducts an annual evaluation of the performance of the Directors. The Committees undertake an annual evaluation of their performance and report back to the Board. At least once a year the Chairman meets with the non-executive Directors without the executive Directors to review the Board’s performance. The Board discusses the results of its evaluations in order to identify and address areas in which the effectiveness of the Board might be improved.
Share Ownership and DealingDetails of Directors’ shareholdings are set out on pages 97 and 99. The Group has a policy on dealing in shares that applies to restricted persons comprising all Directors, and senior management and certain other employees. Under the policy, restricted persons are required to obtain clearance from prescribed persons before dealing. Restricted persons are prohibited from dealing in SKG securities during designated closed periods and at any other time when the individual is in possession of Inside Information (as defined by the Market Abuse Regulation (EU 596/2014)).
Board CommitteesAs recommended by the Code, the Board has established three Committees to assist in the execution of specific matters within its responsibility. These are the Audit Committee, the Compensation Committee and the Nomination Committee. The responsibilities of each of these Committees are set out clearly in written terms of reference, which are reviewed annually and are available on the Group’s website. The Chairman of each Committee reports to the Board on the major agenda items discussed since the last Board meeting and the minutes of all Committee meetings are circulated to all of the Directors.
The current membership of each Committee, details of attendance and each member’s tenure are set out in the individual Committee reports on pages 80 to 101.
Stock Exchange ListingsSKG, which is incorporated in Ireland and subject to Irish company law, has a premium listing on the London Stock Exchange and a secondary listing on the Irish Stock Exchange.
Communication with ShareholdersThe Board gives a high priority to effective communications with shareholders and recognises the benefits of shareholder engagement in order to foster mutual understanding of the Company’s strategy and the views of major investors. On a day-to-day basis, contact with institutional shareholders is the responsibility of the Group Chief Executive Officer, the Group Chief Financial Officer and the Head of Investor Relations.
There is regular dialogue with individual shareholders, as well as general presentations, plant visits, attendance at relevant conferences and conference calls and presentations at the time of the release of the annual and quarterly results. Investors and analysts also attend the Group’s Innovation and Sustainability Awards exhibition which is held every 18 months. The Chairman, Group Chief Executive Officer, Group Chief Financial Officer, Chief Executive Officer Europe and the Chief Executive Officer the Americas also participate in these events. The Chairman, Senior Independent Director and any other member of the Board are available to meet major investors if required. The Chairman also had a number of meetings with major shareholders during the year. As part of the revisions to the remuneration framework proposed on pages 86 to 90, the Compensation Committee actively engaged with, and received feedback from a significant proportion of the Group’s shareholders.
The papers for each Board meeting include a comprehensive report summarising investor relations activity during the preceding period including contacts between executive management and current and prospective institutional shareholders. The views and issues highlighted by shareholders are also included in the report.
The Group issues its annual and quarterly results promptly to shareholders and also publishes them on the Group’s website: smurfitkappa.com. The Group operates an investor relations section on the website, which in addition to the annual and quarterly reports, contains investor presentations and all press releases immediately after their release to the Stock Exchange.
The Group also has an Investor Relations web app which makes it easier for investors to learn about the Group and keep in touch with relevant corporate activity.
The Group’s AGM affords each shareholder the opportunity to question the Chairman of the Board, the Chairmen of all Committees and all other Board members. The Notice of the AGM and related papers together with the Annual Report are sent to shareholders at least 20 working days before the meeting. In addition, the Group responds throughout the year to numerous queries from shareholders on a broad range of issues.
Shareholder Meetings and Shareholder RightsShareholders’ meetings are governed by the Articles of Association of the Company and the Companies Acts 2014 (the ‘Companies Act’).
The Company must hold an AGM each year in addition to any other shareholder meeting in that year and must specify that meeting as such in the notices calling it. The Directors may convene general meetings. Extraordinary general meetings

Smurfit Kappa Annual Report 201776
CO R P O R AT E G OV E R N A N C E STAT E M E N T ( CO N T I N U E D)
may also be convened as provided by the Companies Act. Notice of a general meeting must be provided as required by the Companies Act.
At its general meetings the Company proposes a separate resolution on each substantially separate issue and does not bundle resolutions together inappropriately. Resolutions on the receipt of the Annual Report and the approval of the Directors’ Remuneration Report and Remuneration Policy are put to shareholders at the AGM.
The Chairman of the Board of Directors or, in his absence, another Director nominated by the Directors will preside as chairman of a general meeting. Ordinary Shares carry voting rights. Three members entitled to vote at the meeting present either in person or by proxy constitute a quorum. Votes may be given either personally or by proxy. On a show of hands, every member present in person and every proxy will have one vote and on a poll, every member present in person or by proxy, shall have one vote for every share carrying voting rights of which he is the holder. The following persons may demand a poll: the Chairman of a general meeting, at least five members present in person or by proxy having the right to vote at the meeting, any member(s) present in person or by proxy representing at least one-tenth of the total voting rights of all the members having the right to vote at the meeting, or, a member(s) present in person or by proxy holding shares on which an aggregate sum has been paid up equal to not less than one-tenth of the total sum paid up on all the shares conferring that right.
The Companies Act provides for a number of key powers of general meetings, including the right to elect or re-elect a Director, the right to give authority to the Company to disapply pre-emption rights, the right to give authority to the Company to buy back shares and the right to amend the Memorandum and Articles of Association of the Company.
The Companies Act also provides for a number of shareholder rights in respect of the general meeting and the methods of exercising of those rights, which are set out in the notes to the Notice of the AGM, including the right a) to table agenda items and resolutions for inclusion on the agenda of an annual general meeting b) to table a draft resolution in respect of an item already on the agenda of the general meeting c) to ask questions in relation to an item on the agenda of a general meeting and d) to appoint a proxy electronically.
Code of Business ConductThe Smurfit Kappa Code of Business Conduct includes principles of best practice in this area which apply to the Group’s Board of Directors, officers and employees worldwide. We also require individuals, entities, agents or anyone acting on the Group’s behalf to comply with its Code. The Code is available on the Group’s website: smurfitkappa.com and is translated into 17 languages.
SustainabilitySustainability is concerned with ensuring that the human and natural environment remains intact both today and into the future as we continue to use natural resources. SKG manages its business in a way which recognises its key responsibilities in all aspects of its corporate social responsibility especially in the areas of Environment, Sustainable Forestry, Social Citizenship and Health and Safety. The Group’s principles are summarised on pages 54 to 58 and are described in detail in the Sustainable Development Report for 2016 which is available on the Group’s website. The Sustainable Development Report for 2017 will be published in the second quarter of 2018.
Risk Management and Internal ControlThe Board has overall responsibility for the Group’s system of risk management and internal control and for monitoring and reviewing its effectiveness, in order to safeguard shareholders’ investments and the Group’s assets. Details in relation to Risk Management and Internal Control are included in the Risk Report on page 36.
The Directors confirm there is an ongoing process for identifying, evaluating and managing the principal risks faced by the Group which is in accordance with the FRC’s Guidance on Risk Management, Internal Control and Related Financial and Business Reporting. This process has been in place throughout the accounting period and up to the date of approval of the Annual Report and Consolidated Financial Statements and is subject to regular review by the Board.
The Directors confirm that they have carried out a robust assessment of the principal risks facing the Group’s business model, future performance, solvency and liquidity. The Directors also confirm they have conducted an annual review of the effectiveness of the Group’s risk management and system of internal control up to and including the date of approval of the Annual Report and Consolidated Financial Statements. This had regard to the principal risks that could affect the Group’s business (as outlined on pages 36 to 41), the methods of managing those risks, the controls that are in place to contain them and the procedures to monitor them.
Financial ReportingAs part of its overall system of internal control, the Group has in place control and risk management systems to govern the Group’s financial reporting process and the process for the preparation of the Group’s Consolidated Financial Statements. The requirements for producing financial information are governed by the Group’s Financial Reporting Guide and Financial Monitoring Policy which gives guidance on the maintenance of records that accurately and fairly reflect transactions, provide reasonable assurance that transactions are recorded correctly to permit the preparation of Consolidated Financial Statements in accordance with International Financial Reporting Standards and that require reported data to be reviewed and reconciled. These systems include the following financial reporting controls: access controls, reconciliations, verification controls, asset security controls and segregation of duties. Segment management and the Group’s executive management team review the results of the operations on a monthly basis. The Group’s executive management team receive detailed monthly reports from all operations and meet with the segment management at least on a quarterly basis to review the year to date results against budget and rolling forecasts enabling them to monitor and challenge any variance against the expected financial outcome for the period. Internal Audit review financial controls in different locations on a test basis each year and report quarterly to the Audit Committee. Each operation through to segment level is required to self-assess on the effectiveness of its financial control environment.
This includes the completion of an Internal Control Questionnaire which is reviewed by the Group Financial Controller and audited on a test basis by Internal Audit. Senior management representations with respect to the Group Consolidated Financial Statements showing a true and fair view are also required and supplied at year-end.

77
Strategic Report Governance FinancialsOverview
Directors’ ReportThe Change of Control, Capital Structure and Purchase of Own Shares information are set out on pages 78 and 79 in the Directors’ Report and form part of this Corporate Governance Statement.
Attendance at Board Meetings during the Year to 31 December 2017
A* B*
L. O’Mahony 5 5
F. Beurskens 5 5
C. Bories 5 4
T. Brodin** 2 2
I. Finan 5 5
J. Lawrence 5 5
G. McGann** 2 2
J. Moloney 5 5
R. Newell 5 5
J. Buhl Rasmussen** 4 4
G. Restrepo 5 5
R. Thorne 5 5
A. Smurfit 5 5
K. Bowles 5 5
* Column A indicates the number of meetings held during the period the Director was a member of the Board and was eligible to attend and Column B indicates the number of meetings attended.
** Mr Rasmussen joined the Board in March 2017. Mr McGann and Mr Brodin retired from the Board in May 2017.
Smurfit Kappa Group plc has a secondary listing on the Irish Stock Exchange. For this reason, Smurfit Kappa Group plc is not subject to the same ongoing listing requirements as those which would apply to an Irish company with a primary listing on the Irish Stock Exchange including the requirement that certain transactions require the approval of shareholders. For further information, shareholders should consult their own financial adviser.
Smurfit Kappa Annual Report 201778
D I R EC TO RS ’ R E P O RT
Report of the DirectorsThe Directors submit their Report and Audited Financial Statements for the financial year ended 31 December 2017.
Principal Activity and Business ReviewThe Group is an integrated paper and paperboard manufacturer and converter whose operations are divided into Europe and the Americas. Geographically, the major economic environments in which the Group conducts its business are Europe (principally the Eurozone, Sweden and the United Kingdom) and the Americas (principally Argentina, Brazil, Colombia, Mexico, Venezuela and the United States).
The Chairman’s Statement, Chief Executive’s Review, Operations Review, Strategy Statement, Finance Review (including financial risk management policies), Sustainability Strategy and People Strategy on pages 20 to 30 and 34 to 65 report on the performance of the Group during the year and on future developments.
Results for the YearThe results for the year are set out in the Consolidated Income Statement on page 112. The profit attributable to the owners of the parent amounted to €417 million (2016: €444 million).
Financial key performance indicators are set out in the Finance Review on pages 46 to 49. The Consolidated Financial Statements for the financial year ended 31 December 2017 are set out in detail on pages 112 to 175.
DividendsIn October 2017, an interim dividend of 23.1 cent per share was paid to holders of ordinary shares. The Board is recommending a final dividend of 64.5 cent per share for 2017. Subject to shareholders’ approval at the AGM on 4 May 2018, it is proposed to pay the final dividend on 11 May 2018 to all holders of ordinary shares on the share register at the close of business on 13 April 2018.
Research and DevelopmentThe Company’s subsidiaries are engaged in ongoing research and development aimed at providing innovative paper-based packaging solutions and improving products and processes and expanding product ranges. Expenditure on research and development in the year amounted to €7 million.
Accounting RecordsThe Directors are responsible for ensuring that adequate accounting records, as outlined in Section 281-286 of the Companies Act, are kept by the Company. The Directors are also responsible for the preparation of the Annual Report. The Directors have appointed professionally qualified accounting personnel with appropriate expertise and have provided adequate resources to the finance function in order to ensure that those requirements are met. The accounting records of the Company are maintained at the Group’s principal executive offices located at Beech Hill, Clonskeagh, Dublin 4, D04 N2R2.
DirectorsThe members of the current Board of Directors are named on pages 68 to 70 together with a short biographical note on each Director.
Mr Thomas Brodin and Mr Gary McGann acted as non-executive Directors of the Company until the conclusion of the 2017 AGM (5 May 2017), at which they did not seek re-election. Mr Jørgen Buhl Rasmussen was appointed to the Board as a non-executive director in March 2017 and Ms Carol Fairweather was appointed to the Board as a non-executive Director on 1 January 2018.
Ms Rosemary Thorne has indicated she will not seek re-election at the forthcoming AGM.
Any Director co-opted to the Board by the Directors is subject to election by the shareholders at the first AGM after their appointment and, pursuant to the Articles of Association of the Company, all Directors are subject to re-election at intervals of no more than three years. However, in compliance with the Code, all Directors will retire at the 2018 AGM and other than Ms Thorne will offer themselves for re-election.
To enable shareholders to make an informed decision, reference should be made to pages 68 to 70 which contains a biographical note on each Director offering themselves for re-election and to the Notice of the AGM which explains why the Board believes the relevant Directors should be re-elected. The Directors intend to confirm at the AGM that the performance of each individual seeking re-election continues to be effective and demonstrates commitment to the role.
Shareholders are referred to the information contained in the Corporate Governance Statement on pages 72 to 77 concerning the operation of the Board and the composition and functions of the Committees of the Board.
Directors’ and Secretary’s InterestsDetails of the Directors’ and Company Secretary’s interests in the share capital are set out in the Remuneration Report on pages 97 and 99 and are incorporated into this Directors’ Report.
Principal Risks and UncertaintiesUnder Irish company law (Section 327 of the Companies Act), the Directors are required to give a description of the principal risks and uncertainties which it faces. These principal risks and uncertainties are set out on pages 38 to 41, and form part of this report as required by Section 327 of the Companies Act.
Corporate GovernanceUnder Section 1373 of the Companies Act, the Directors’ Report is required to include a Corporate Governance Statement. The Directors’ Corporate Governance Statement is set out on pages 72 to 77 and forms part of this report. The Audit Committee Report, the Remuneration Report and the Nomination Committee Report are set out on pages 80 to 101.
Purchase of Own SharesSpecial resolutions will be proposed at the AGM to renew the authority of the Company, or any of its subsidiaries, to purchase up to 10% of the Company’s ordinary shares in issue at the date of the AGM and in relation to the maximum and minimum prices at which treasury shares (effectively shares purchased by the Company and not cancelled) may be re-issued off-market by the Company. If granted, the authority will expire on the earlier of the date of the AGM in 2019 or 3 August 2019.
A similar authority was granted at the AGM in 2017, which is due to expire on the earlier of the date of the AGM in 2018 or 4 August 2018.
Information on own shares is set out in Note 23 to the Consolidated Financial Statements.
Change of ControlOn a change of control following a bid, the Lenders under the Senior Credit Facility would have the option to cancel the commitments under the facility and/or to declare all outstanding amounts immediately due and payable, and under the Senior Notes Indentures the Group is obliged to offer to repurchase the notes at 101% of the principal amount due.

79
Strategic Report Governance FinancialsOverview
Substantial HoldingsThe table above shows all notified shareholdings in excess of 3% of the issued ordinary share capital of the Company as at 31 December 2017 and 22 March 2018.
Subsidiary and Associated UndertakingsA list of the Group’s principal subsidiaries and associates as at 31 December 2017 is set out in Note 35 to the Consolidated Financial Statements.
Capital StructureDetails of the structure of the Company’s capital are set out in Note 23 to the Consolidated Financial Statements and are deemed to form part of this Directors’ Report. Details of the Group’s long-term incentive plans are set out in the Remuneration Report and Note 26 to the Consolidated Financial Statements and are incorporated into this Directors’ Report.
Directors Compliance StatementThe Directors acknowledge that they are responsible for securing compliance by the Company of its relevant obligations as set out in the Companies Act (the ‘Relevant Obligations’).
The Directors further confirm that there is a Compliance Policy Statement in place setting out the Company’s policies which, in the Directors’ opinion, are appropriate to ensure compliance with the Company’s Relevant Obligations.
The Directors also confirm that appropriate arrangements and structures are in place which, in the Directors’ opinion, are designed to secure material compliance with the Company’s Relevant Obligations. For the financial year ended 31 December 2017, the Directors, with the assistance of the Audit Committee, have conducted a review of the arrangements and structures in place. In discharging their responsibilities under Section 225 of the Companies Act, the Directors relied on the advice of persons who the Directors believe have the requisite knowledge and experience to advise the Company on compliance with its Relevant Obligations.
Disclosure of Information to the Statutory AuditorEach of the Directors individually confirm that:
n In so far as they are aware, there is no relevant audit information of which the Company’s Statutory Auditor is unaware; and
n They have taken all the steps that they ought to have taken as Directors in order to make themselves aware of any relevant audit information and to establish that the Company’s Statutory Auditor is aware of such information.
Statutory AuditorA formal external audit tender process has now been completed by the Audit Committee on behalf of the Board and KPMG have been selected by the Board as the new Statutory Auditors in respect of the financial year ending 31 December 2018. A shareholder resolution at the AGM is required for the appointment of new Statutory Auditors and the Board is recommending that KPMG be appointed.
PricewaterhouseCoopers (‘PwC’), intend to resign as Statutory Auditors upon conclusion of the 2017 Statutory Audit, and have confirmed, in accordance with Section 400 of the Companies Act, that there are no circumstances connected with their resignation which should be brought to the attention of members or creditors of the Company.
A. Smurfit K. Bowles
Directors
22 March 2018
31 December 2017 22 March 2018
Number ofshares
% of issued ordinaryshare capital
Numberof shares
% of issued ordinaryshare capital
Norges Bank 16,534,422 6.98% 16,534,422 6.97%
BlackRock, Inc 9,942,727 4.20% 9,942,727 4.19%
GIC Private Limited 7,478,221 3.16% 7,478,221 3.15%
Janus Henderson Group plc - - 7,699,368 3.25%

Smurfit Kappa Annual Report 201780
AU D I T CO M M I T T E E R E P O RT
As Chairman of the Audit Committee it is my pleasure to report to you on our activities in relation to the financial year ended 31 December 2017.
Role of the Audit CommitteeThe Audit Committee (‘the Committee’) is responsible for providing oversight and assurance to the Board regarding: the integrity of the Group’s financial reporting; risk management and internal control processes; the internal audit function; the Statutory Audit arrangements; the governance framework and; whether the Annual Report and Consolidated Financial Statements, taken as a whole, are fair, balanced and understandable and provide the information necessary for shareholders to assess the Group’s performance, business model and strategy.
The role and responsibilities of the Committee are set out in its Terms of Reference which is available on the Group’s website: smurfitkappa.com. The Terms of Reference and the performance of the Committee were reviewed and the Committee is considered to be operating effectively and efficiently.
Membership of the CommitteeThe Board has reviewed the composition of the Committee during the year and is satisfied that the mix of business and financial experience enables the Committee to effectively fulfil its responsibilities. The Committee is currently comprised of nine independent non-executive Directors. Of these Ms Carol Fairweather, Mr Irial Finan, Mr James Lawrence, and I, the Committee Chairman, have recent and relevant financial experience. The Committee met five times during the year under review. Details of the Committee members and meetings attended are provided in the table below. The Group Chief Executive Officer, the Group Chief Financial Officer, the Group Internal Auditor, the Group Compliance Manager, and senior members of the Group finance team normally attend meetings of the Committee. The Statutory Auditor also attends all meetings and together with the Group Internal Auditor have direct access to the Committee Chairman at all times. In advance of every meeting, the Committee Chairman meets individually with the Group finance team, the Group Compliance Manager, the Group Internal Auditor and the Statutory Auditor.
Attendance record A* B* Appointment date
R. Thorne (Chairman) 5 5 2008
C. Bories 5 4 2012
T. Brodin ** 2 2 2008
C. Fairweather *** - - 2018
I. Finan 5 5 2012
J. Lawrence 5 4 2015
J. Moloney 5 5 2014
R. Newell 5 5 2010
J. Rasmussen *** 4 4 2017
G. Restrepo 5 5 2015
* Column A indicates the number of meetings held during the period the Director was a member of the Committee and was eligible to attend and Column B indicates the number of meetings attended.
** Mr Brodin retired from the Board in May 2017
*** Mr Rasmussen was appointed to the Board in March 2017 and Ms Fairweather was appointed to the Board in January 2018.
Financial Reporting and Significant Financial IssuesThe Group’s Consolidated Financial Statements are prepared by finance personnel with the appropriate level of qualifications and expertise. The Committee reviews any published financial information including the Annual Report and quarterly financial reports, and any other published information for statutory and regulatory compliance. The Committee reports its views to the Board to assist in the Board’s approval of the results announcements and the Annual Report.
The Committee assesses whether suitable accounting policies have been adopted and whether management has made appropriate estimates and judgements. The Committee reviews accounting papers prepared by management which provide details on the main financial reporting judgements. For example, in the current year the Committee considered a number of accounting papers in relation to developing matters in Venezuela and the impact of the increasingly difficult operating environment on the Group’s ability to control and direct the operational and strategic policies of its operations in the country.
Rosemary Thorne Chairman of the Audit Committee

81
Strategic Report Governance FinancialsOverview
The Committee also reviews reports by the Statutory Auditor on the hard-close and year-end audit procedures which highlight any issues identified from the work undertaken on the audit.
The significant issues that the Committee considered in relation to the Financial Statements are detailed below:
1. Goodwill Impairment Review
The Committee considered the risk of impairment in respect of the carrying value of goodwill held by the Group and reviewed the annual impairment test prepared by management. In particular it considered the judgements around the assumptions underlying the calculation of the value-in-use of the businesses being tested; including the reasonableness of the business plan and the overall macroeconomic assumptions underlying the valuation process and also the determination of an appropriate discount rate and terminal value.
Management have developed what the Committee considers to be an extensive, detailed and robust process to identify any potential impairment of goodwill at a cash–generating unit (‘CGU’) level. This is performed annually or where an impairment indicator has been separately identified. The business plan used in the impairment review was approved by the Board. The annual impairment test includes the engagement of independent experts to assist management with the development of an appropriate discount rate. They also consider other macroeconomic assumptions included in the forecasts as well as the terminal value multiple used.
The Committee addressed these matters using reports received from management outlining the basis for assumptions used and by reviewing the independent expert’s report. The Committee reviewed the methodology applied including ensuring the discount rate used was within an acceptable range and that the terminal value multiple used was appropriate. The Committee also considered a number of different scenarios to test the sensitivity of the model to changes in its key drivers and to understand the level of headroom available at a CGU level. The Committee noted that headroom in the French CGU had materially increased on the prior year and that the recent improved performance is forecast to continue.
The Committee also noted that headroom in Brazil was tight due to continued challenging operating conditions. It will remain on watch and be monitored throughout 2018.
Following this process, the Committee is satisfied that the judgements made by management are reasonable and that appropriate disclosures have been included in the Consolidated Financial Statements. The Committee concluded that the goodwill is not impaired and approved the disclosures in Note 13 to the Consolidated Financial Statements.
2. Venezuela
The Committee has considered the recent developments in Venezuela and their potential impact on the Group’s Consolidated Financial Statements as follows:
Exchange control
The Committee has discussed the exchange control mechanisms employed during the year. Based on the facts and circumstances, the Committee considered that the DICOM rate was the appropriate rate at which to consolidate the Venezuelan operations for the financial year ended 31 December 2017. The Committee also considered the impact of exchange control on the net assets of its operations and its cash balances in Venezuela. The Committee consider the disclosures in Note 3 to the Consolidated Financial Statements to be appropriate.
Control
The Committee has reviewed accounting papers prepared by management which consider the Group’s ability to control and direct the operational and strategic policies of its operations in Venezuela in an increasingly difficult operating and political environment. After due consideration and discussion with management and our Statutory Auditor, the Committee is satisfied that the Group continues to control its operations in Venezuela and, as a result, continues to consolidate the results and net assets of these operations at year-end in accordance with the requirements of IFRS 10, Consolidated Financial Statements.
Inflation rate
During 2017, no official inflation statistics were published by the Central Bank of Venezuela. In the absence of such information, management engaged an independent expert to determine an estimate of the annual inflation rate, for the purposes of recording the hyperinflationary adjustments required by IAS 29. After due consideration and discussion with management, the Committee is satisfied that this inflation rate fairly reflects the inflationary environment in Venezuela in 2017.
Price control
The Committee has previously considered the law enacted in 2014 by the Venezuelan government that companies in Venezuela can only seek price increases if they have clearance that their margins are within certain guidelines. The Committee has considered the risk that if its Venezuelan operations cannot implement price increases in a timely manner to cover the increasing costs of raw material and labour as a result of inflation, that this may have an adverse impact on the results of the operations. Based on discussions with management and our consideration of these matters, the Committee is satisfied that these developments do not have an impact on the Group’s operations at 31 December 2017. The Committee will continue to monitor developments in this area with management.
3. Taxation – Valuation of Deferred Tax Assets
In conjunction with their goodwill impairment review, the Committee also assessed the recoverability of deferred tax assets. The value of deferred tax assets at 31 December 2017 was €200 million. The Committee reviewed the estimates of future profitability, which management provided and relied on management’s work with local tax specialists who considered any regulatory changes which would impact the recoverability of deferred tax assets.
The Committee concluded that the deferred tax asset recognised on the Group Consolidated Balance Sheet at 31 December 2017 was appropriate.
4. Employee Benefits
The Committee noted that the liability for post-retirement and other long-term employee benefits had decreased during 2017. The Group Compensation and Benefits Manager informed the Committee that the key driver was positive asset performance over 2017.
The Committee concluded that the assumptions used to calculate the pension liabilities are appropriate and consistent with market practice at the balance sheet date.

Smurfit Kappa Annual Report 201782
AU D I T CO M M I T T E E R E P O RT ( CO N T I N U E D)
5. Exceptional Items
The Committee noted that the exceptional items for the Group in 2017 were €25 million. Management presented the Committee with detailed assumptions and calculations in relation to the proposed exceptional items and discussed them in the context of the Group’s accounting policy for such matters and prior years’ disclosure of similar items.
The Committee concluded that the size and nature of the items disclosed as exceptional items complied with the Group’s accounting policy to be separately disclosed as exceptional items.
6. Treasury
During 2017, the Committee noted that the Group had completed a new Senior Notes issue with a seven-year maturity at a coupon of 2.375% on 24 January 2017.
The Committee also discussed management’s processes, procedures and controls in respect of the Group’s Treasury function.
The Committee concluded that the disclosure of financial instruments and key financial risks was appropriate at 31 December 2017.
Developments in IFRSThe Committee has received reports from management and discussed future accounting developments which are likely to affect the presentation of the Group’s Consolidated Financial Statements.
Review of Annual ReportThe Committee reviewed the Annual Report and Consolidated Financial Statements and were able to confirm to the Board that, in its view, taken as a whole, they were fair, balanced and understandable and provided the information necessary for shareholders to assess the Group’s performance, business model and strategy.
Risk Management and Internal ControlThe Committee has processes in place to satisfy itself on the adequacy of the Group’s risk management and internal control systems. For further details on the Group’s Risk Management and Internal Control please see the Risk Report on page 36.
WhistleblowingIn line with best practice, the Group has an independent and confidential whistleblowing procedure which allows all employees through anonymous submissions to raise concerns regarding accounting or auditing matters or questionable business practice. The Committee ensures through the Group Compliance Manager that arrangements are in place for a proportionate, independent investigation and appropriate follow up of such matters. It receives reports from the Group Compliance Manager on the follow up to all whistleblowing concerns received by the Company.
Internal AuditThe Group operates an internally resourced Internal Audit function which reports directly to the Committee. The Committee reviews Internal Audit, including its plan and performance and monitors its relationship with the Statutory Auditor. It reviews and assesses the quarterly Internal Audit reports together with management’s actions on findings to gain assurance as to the effectiveness of the internal control framework throughout the Group. A third party review of the effectiveness of the Internal Audit function was carried out in 2015 and the recommendations are being implemented.
Statutory AuditorThe Committee is responsible to the Board for recommendations on the appointment, re-appointment and removal of the Statutory Auditor. As part of this process the Committee assesses annually the independence and objectivity of the Statutory Auditor taking into account relevant professional and regulatory requirements and the relationship with the Statutory Auditor as a whole, including the provision of any non-audit services. The Committee monitors the Statutory Auditor’s performance, behaviour and effectiveness during the exercise of their duties, which informs the Committee’s decision to recommend re-appointment on an annual basis.
The Statutory Auditor attends all meetings of the Committee. The Committee discusses and agrees the scope of the annual audit plan with the Statutory Auditor before they commence. The Statutory Auditor provides reports at each Committee meeting on topics such as the control environment, key accounting matters and mandatory communications. It is standard practice for the Statutory Auditor to meet privately with the Committee without any member of management or the executive Directors being present so as to provide a forum to raise any matters of concern in confidence.
External Audit Tender ProcessAs noted in last year’s Audit Committee Report, the Committee approved the commencement of a formal audit tender process to select a new external Statutory Auditor for the year ending 31 December 2018. It was also noted that due to the EU (Statutory Audits) Regulations 2016 the incumbent Statutory Auditor, PwC, would not be invited to tender.
In March 2017, three main external audit firms were invited to submit detailed tender proposals. Following this, key site visits were held for the three firms in Ireland, Europe and the Americas including detailed site management presentations and presentations from the tendering firms. On evaluation of these meetings by management involved, it was agreed to invite two of the firms to make final presentations to the Chairman of the Audit Committee in July 2017. These presentations were also attended by the Group Chief Financial Officer, the Group Secretary and the Group Financial Controller.
Following these final presentations and discussions, the Committee and management recommended to the Board that KPMG be appointed Statutory Auditor for the year ending 31 December 2018. The Board accepted this recommendation and appointed KPMG as Statutory Auditor for the year ending 31 December 2018. This appointment will be put to shareholders for their approval at the AGM on 4 May 2018.
PwC intend to resign as Statutory Auditors upon conclusion of the 2017 Statutory Audit, and have confirmed, in accordance with Section 400 of the Companies Act, that there are no circumstances connected with their resignation which should be brought to the attention of members or creditors of the Company.

83
Strategic Report Governance FinancialsOverview
Statutory Auditor Non-audit ServicesThe Committee has agreed the types of permitted and non-permitted non-audit services and those which require explicit prior approval.
The Group has a policy governing the conduct of non-audit work by the Statutory Auditor. All contracts for non-audit services in excess of €50,000 must be notified to and approved by the Chairman of the Committee. The engagement of the Statutory Auditor to provide any non-audit services must be pre-approved by the Committee or entered into pursuant to pre-approval policies and procedures established by the Committee. The policy exists to ensure that the Statutory Auditor does not audit their own work, participate in activities that would normally be undertaken by management, have a mutuality of financial interest with the Group or act in an advocacy role for the Group. Details of the amounts paid to the Statutory Auditor during the year for audit and other services are set out in Note 5 on page 133. The value of non-audit services provided by PwC in 2017 amounted to €0.4 million (2016: €0.5 million). Non-audit services relates to the provision of tax advisory and other non-audit services. These services provided by the Group Statutory Auditor are considered by the Committee to be necessary in the interests of the business and, by their nature, these services could not easily be provided by another professional auditing firm.
The provision of tax advisory services and due diligence/transaction services may be permitted with the Committee’s prior approval. The provision of internal audit services, valuation work and any other activity that may give rise to any possibility of self-review are not permitted under any circumstance. During the year, there were no circumstances where PwC was engaged to provide services which might have led to a conflict of interests.
How the Committee has Addressed its ResponsibilitiesIn order to discharge the responsibilities set out in the Terms of Reference, the Committee in 2017:
n Reviewed with management the Group’s 2016 preliminary results announcement, its 2016 Annual Report, its 2017 first and third quarter results, its 2017 interim report and management’s annual going concern report and viability statement
n Reviewed the Statutory Auditor’s year-end audit report for December 2016, the limited procedures reports on the 2017 first and third quarter results and the limited procedures report on the 2017 interim report
n Reviewed the Statutory Auditor’s plan for the audit of the Group’s 2017 Consolidated Financial Statements, which included consideration of the scope of the audit, key risks to the Consolidated Financial Statements, the proposed audit fee and approval of the terms of engagement for the audit
n Carried out an external Audit Tender process as set out above and recommended to the Board that KPMG be appointed as the Statutory Auditors for the year ending 31 December 2018
n Addressed the annual fraud enquiries carried out by the Statutory Auditor as part of its year-end audit
n Reviewed on a quarterly basis the Statutory Auditor services and fees
n Reviewed on a quarterly basis cyber-attack reports
n Reviewed tax and accounting services and fees from firms other than the Statutory Auditor
n Reviewed the quarterly internal audit reports with the Group Internal Auditor and management and any consequent actions
n Approved the internal audit plan and the related resourcing of the function required to meet that plan
n Approved changes proposed to the Group Internal Audit Charter by the Group Internal Auditor and management
n Reviewed all reports submitted by the Group Compliance Manager which comprised an Internal Control Effectiveness Report, an Internal Control Questionnaire update for 2017, the Treasury Compliance Certifications, the Competition Law Policy Compliance Certification results, updates on the Group’s General Data Protection Regulation readiness project and various Whistleblower and Code of Conduct updates
n Reviewed the control environment and ensured that the Code of Business Conduct, the Code of Ethics for Senior Financial Officers, the Good Faith Reporting Policy, the Group Financial Reporting Guide, the Group Treasury Policy, the Financial Monitoring Policy, the Treasury Compliance Programme and the Competition Compliance Programme are up to date and embedded in the Group’s processes
n Had a presentation from and discussion with General Counsel on the Group’s Competition Law Policy
n Reviewed and approved the Group’s risk assessment framework (see Risk Management and Internal Control - page 76)
n Reviewed and approved each significant risk facing the Group together with the actions proposed by management to accept, avoid or mitigate risk
n Reviewed stress test scenarios applied to the three-year financial model based on the principal risks for the purpose of the viability statement
n Reviewed the Group’s monitoring processes over internal control
n Reviewed the Statutory Auditor’s report on the 2017 hard-close audit procedures and the 2017 year-end audit and also reviewed the confirmation of Statutory Auditor independence
n Reviewed the Committee’s performance and its Terms of Reference.
Finally having served ten years as a Board member, I will be stepping down at the AGM on 4 May 2018. I would like to thank my fellow Board members together with the senior management team and the finance team for their support over the years and I wish SKG continuing success in the future.
Rosemary Thorne Chairman of the Audit Committee
22 March 2018

Smurfit Kappa Annual Report 201784
R E M U N E R AT I O N R E P O RT
Dear ShareholderAs Chairman of SKG’s Compensation Committee, I am pleased to present our Directors’ Remuneration Report for the financial year ended 31 December 2017.
Although the Group is listed on the London Stock Exchange, given that the Group is incorporated in Ireland, it is not subject to the UK remuneration reporting regulations (The Large and Medium-sized Companies and Groups (Accounts and Reports) (Amendment) Regulations 2013) which apply to UK incorporated companies. Nevertheless, the Compensation Committee (‘the Committee’) recognises the importance of effective corporate governance and is therefore voluntarily adopting a number of the requirements of these reporting regulations. In line with this, the Committee is submitting a new Directors’ Remuneration Policy (which can be found on pages 86 to 90) to an advisory vote at the 2018 AGM, and has enhanced the disclosure provided within the annual Remuneration Report (which can be found on pages 84 to 100).
Remuneration Policy ReviewWhile the Group received strong shareholder support for the current Remuneration Policy at the 2017 AGM, the Policy was largely unchanged from the Policy approved at the 2014 AGM. Since the last substantive review, the Group has grown significantly, our strategy has continued to develop and likewise, shareholder expectations on remuneration have evolved. Consequently, during the course of 2017, the Committee undertook a full review of the current Remuneration Policy in place for executive Directors and other senior management to ensure that it continued to both support the Group’s strategic priorities and align with external views on executive compensation.
The Group’s strategic priorities
As set out in further detail earlier in the Annual Report, Smurfit Kappa’s strategic objective is to develop long-term customer relationships by providing customers with differentiated packaging solutions that enhance the customers’ prospects in their end markets. To deliver this, the Group’s key aims are:
n Expand our market positions in Europe and the Americas through selective focused growth
n Become the supplier partner of choice through the continuous upgrade of our customer offering
n Enhance our operational excellence
n Recruit, retain, develop and motivate the best people
n Maintain a disciplined approach to capital allocation and maintain the focus on cash generation.
Successful implementation of our strategy will ultimately result in the delivery of sustainable long-term shareholder value, strong profit growth and return on capital.
Outcome of the remuneration review
As part of the review of the current remuneration framework, the Committee identified the following key challenges with the Group’s current approach to remuneration:
n It placed significant pressure on the annual bonus plan, through the link between the annual bonus and the long-term incentive (with matching awards made on the portion of bonuses deferred into shares)
n Whilst broadly aligned to the Group’s strategic priorities the Committee was of the view that more could be done to centre the policy on the delivery of sustainable long-term shareholder value, strong profit growth and return on capital employed
n It was out of line with market practice and emerging views on executive compensation where there is a general preference for companies to operate simple remuneration structures with a single long-term incentive plan which operates separately from the annual bonus arrangements.
Within the context of the above, the Committee considered it appropriate to make one principal change to the current remuneration framework at Smurfit Kappa: the replacement of the current deferred annual bonus matching awards with a new performance share plan (‘PSP’), the key details of which can be found below.
Key area Approach going forward
Award limit Set at 225% of salary – which is unchanged from the current maximum level.Operationally, the Committee intends to make awards at this level for the CEO, whilst the maximum award for the CFO will be set at 180% of salary.
Time horizons From 2018 up to five years in total.Awards will be subject to a three-year performance period and a post vesting holding period such that they will be delivered to the executives pro-rata between years three and five from grant.
Performance measures
Aligned directly with the Group’s strategic priorities.Awards will be based on the following three performance measures (all equally weighted): return on capital employed; earnings per share; and relative total shareholder return against a bespoke group of global paper and packaging companies.
Underpin An underpin will apply to awards based on the underlying financial performance of the Group to provide the Committee with flexibility to consider the quality of the performance when determining out-turns.
Malus and clawback
Updated to be aligned with market practice. Further details of these are set out on page 87.
Irial Finan Chairman of the Compensation Committee

85
Strategic Report Governance FinancialsOverview
In addition to the above, to further increase alignment of the executives with shareholders, the Committee has increased the shareholding guidelines from their current level of 150% of salary to 300% of salary for the CEO and from 100% of salary to 200% of salary for the CFO.
Improved transparency
As part of the commitment to enhanced disclosure, the Committee recognises that market practice has evolved significantly in terms of disclosure. As such, the Committee has also made the following enhancements to our disclosure this year:
n Performance share awards – in line with the introduction of the new long-term incentive plan, for the first time, the Committee has disclosed the targets for long-term incentive awards on a prospective basis. Details of the targets for the 2018 performance share plan award can be found on page 91.
n Annual bonus – in line with best practice, the Committee has disclosed the financial targets used for the annual bonus (i.e. the 2017 annual bonus) in full, which can be found on page 93.
Shareholder consultation
As part of the revisions to the remuneration framework, the Committee actively engaged with a significant proportion of the Group’s shareholders and the proxy advisory bodies. The Committee listened to and reviewed feedback from shareholders, and the updated proposals set out above, including the proposed operational maximum PSP opportunity, the shareholding requirements and the enhanced disclosure in relation to annual bonus targets reflect the feedback received. The Committee was pleased with the support it received from shareholders on the approach going forward and on behalf of the Committee, I wanted to thank shareholders that actively engaged in the consultation process.
2017 Performance and Incentive Out-TurnsIn 2017, the Group delivered continued earnings growth with EBITDA of €1,240 million, a new record for the Group. The Group also delivered ROCE at 15.0%, strong free cash flow at €307 million and we invested approximately €430 million in our business to continue to build a platform to deliver performance and growth.
In February 2018, the Committee reviewed performance against the metrics under the annual bonus plan for 2017 and the Deferred Annual Bonus Plan (DABP) for the three years to 31 December 2017 and approved annual bonus awards of 41.4% of maximum and DABP awards vesting at 45% of maximum. Further details on these awards are set out on page 93 and 94, respectively.
ConclusionOn behalf of the Committee, I thank you for your continued support. We trust that you find the report informative and I hope you find the rationale provided for the new remuneration framework and the enhanced disclosure helpful. As always, I welcome any comments you have.
Irial Finan Chairman of the Compensation Committee
22 March 2018
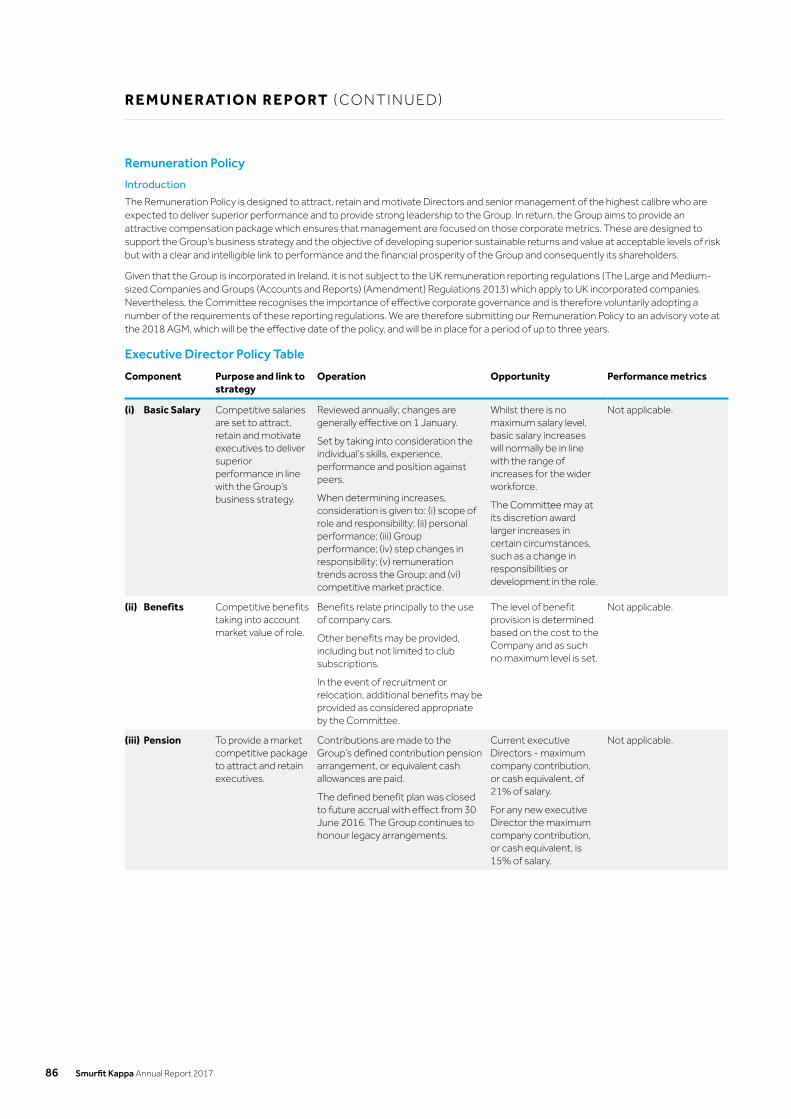
Smurfit Kappa Annual Report 201786
R E M U N E R AT I O N R E P O RT ( CO N T I N U E D)
Remuneration Policy
Introduction
The Remuneration Policy is designed to attract, retain and motivate Directors and senior management of the highest calibre who are expected to deliver superior performance and to provide strong leadership to the Group. In return, the Group aims to provide an attractive compensation package which ensures that management are focused on those corporate metrics. These are designed to support the Group’s business strategy and the objective of developing superior sustainable returns and value at acceptable levels of risk but with a clear and intelligible link to performance and the financial prosperity of the Group and consequently its shareholders.
Given that the Group is incorporated in Ireland, it is not subject to the UK remuneration reporting regulations (The Large and Medium-sized Companies and Groups (Accounts and Reports) (Amendment) Regulations 2013) which apply to UK incorporated companies. Nevertheless, the Committee recognises the importance of effective corporate governance and is therefore voluntarily adopting a number of the requirements of these reporting regulations. We are therefore submitting our Remuneration Policy to an advisory vote at the 2018 AGM, which will be the effective date of the policy, and will be in place for a period of up to three years.
Executive Director Policy Table
Component Purpose and link to strategy
Operation Opportunity Performance metrics
(i) Basic Salary Competitive salaries are set to attract, retain and motivate executives to deliver superior performance in line with the Group’s business strategy.
Reviewed annually; changes are generally effective on 1 January.
Set by taking into consideration the individual’s skills, experience, performance and position against peers.
When determining increases, consideration is given to: (i) scope of role and responsibility; (ii) personal performance; (iii) Group performance; (iv) step changes in responsibility; (v) remuneration trends across the Group; and (vi) competitive market practice.
Whilst there is no maximum salary level, basic salary increases will normally be in line with the range of increases for the wider workforce.
The Committee may at its discretion award larger increases in certain circumstances, such as a change in responsibilities or development in the role.
Not applicable.
(ii) Benefits Competitive benefits taking into account market value of role.
Benefits relate principally to the use of company cars.
Other benefits may be provided, including but not limited to club subscriptions.
In the event of recruitment or relocation, additional benefits may be provided as considered appropriate by the Committee.
The level of benefit provision is determined based on the cost to the Company and as such no maximum level is set.
Not applicable.
(iii) Pension To provide a market competitive package to attract and retain executives.
Contributions are made to the Group’s defined contribution pension arrangement, or equivalent cash allowances are paid.
The defined benefit plan was closed to future accrual with effect from 30 June 2016. The Group continues to honour legacy arrangements.
Current executive Directors - maximum company contribution, or cash equivalent, of 21% of salary.
For any new executive Director the maximum company contribution, or cash equivalent, is 15% of salary.
Not applicable.
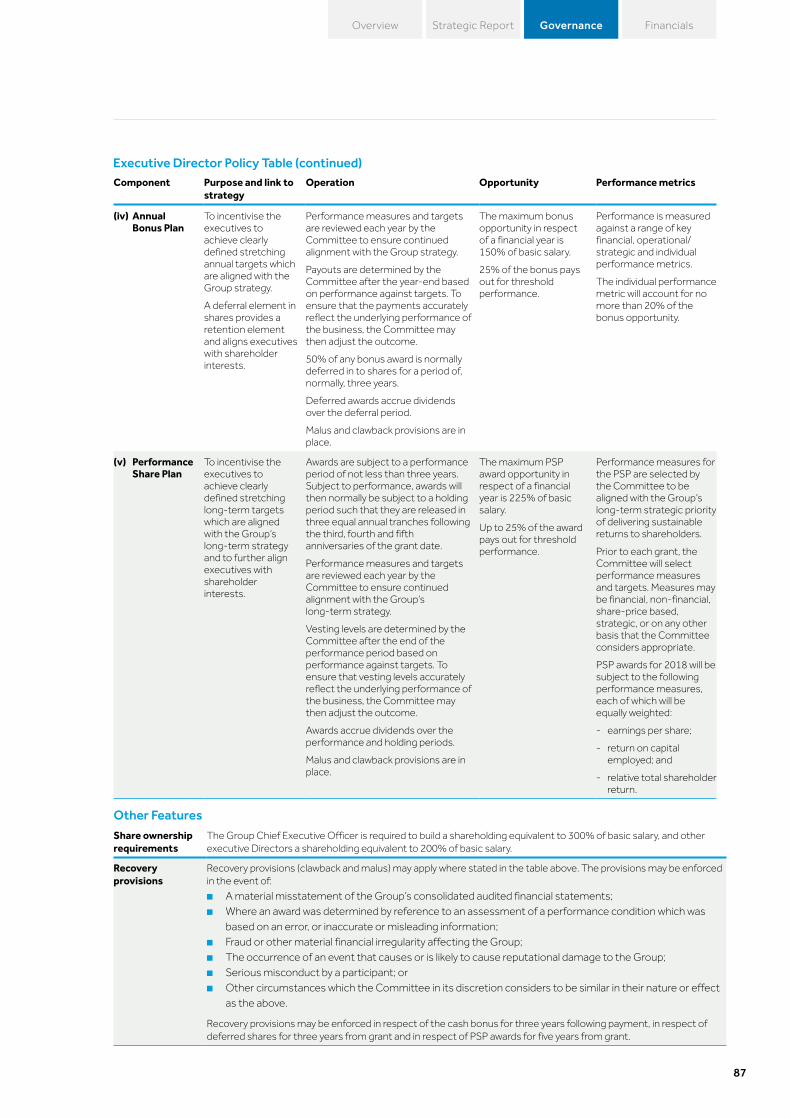
87
Strategic Report Governance FinancialsOverview
Component Purpose and link to strategy
Operation Opportunity Performance metrics
(iv) Annual Bonus Plan
To incentivise the executives to achieve clearly defined stretching annual targets which are aligned with the Group strategy.
A deferral element in shares provides a retention element and aligns executives with shareholder interests.
Performance measures and targets are reviewed each year by the Committee to ensure continued alignment with the Group strategy.
Payouts are determined by the Committee after the year-end based on performance against targets. To ensure that the payments accurately reflect the underlying performance of the business, the Committee may then adjust the outcome.
50% of any bonus award is normally deferred in to shares for a period of, normally, three years.
Deferred awards accrue dividends over the deferral period.
Malus and clawback provisions are in place.
The maximum bonus opportunity in respect of a financial year is 150% of basic salary.
25% of the bonus pays out for threshold performance.
Performance is measured against a range of key financial, operational/strategic and individual performance metrics.
The individual performance metric will account for no more than 20% of the bonus opportunity.
(v) Performance Share Plan
To incentivise the executives to achieve clearly defined stretching long-term targets which are aligned with the Group’s long-term strategy and to further align executives with shareholder interests.
Awards are subject to a performance period of not less than three years. Subject to performance, awards will then normally be subject to a holding period such that they are released in three equal annual tranches following the third, fourth and fifth anniversaries of the grant date.
Performance measures and targets are reviewed each year by the Committee to ensure continued alignment with the Group’s long-term strategy.
Vesting levels are determined by the Committee after the end of the performance period based on performance against targets. To ensure that vesting levels accurately reflect the underlying performance of the business, the Committee may then adjust the outcome.
Awards accrue dividends over the performance and holding periods.
Malus and clawback provisions are in place.
The maximum PSP award opportunity in respect of a financial year is 225% of basic salary.
Up to 25% of the award pays out for threshold performance.
Performance measures for the PSP are selected by the Committee to be aligned with the Group’s long-term strategic priority of delivering sustainable returns to shareholders.
Prior to each grant, the Committee will select performance measures and targets. Measures may be financial, non-financial, share-price based, strategic, or on any other basis that the Committee considers appropriate.
PSP awards for 2018 will be subject to the following performance measures, each of which will be equally weighted:
- earnings per share;
- return on capital employed; and
- relative total shareholder return.
Other FeaturesShare ownership requirements
The Group Chief Executive Officer is required to build a shareholding equivalent to 300% of basic salary, and other executive Directors a shareholding equivalent to 200% of basic salary.
Recovery provisions
Recovery provisions (clawback and malus) may apply where stated in the table above. The provisions may be enforced in the event of:
n A material misstatement of the Group’s consolidated audited financial statements;n Where an award was determined by reference to an assessment of a performance condition which was
based on an error, or inaccurate or misleading information;n Fraud or other material financial irregularity affecting the Group;n The occurrence of an event that causes or is likely to cause reputational damage to the Group;n Serious misconduct by a participant; orn Other circumstances which the Committee in its discretion considers to be similar in their nature or effect
as the above.
Recovery provisions may be enforced in respect of the cash bonus for three years following payment, in respect of deferred shares for three years from grant and in respect of PSP awards for five years from grant.
Executive Director Policy Table (continued)

Smurfit Kappa Annual Report 201788
R E M U N E R AT I O N R E P O RT ( CO N T I N U E D)
Notes to the Remuneration Policy Table
Committee discretion in relation to existing commitmentsThe Committee reserves the right to make any remuneration payments and payments for loss of office, notwithstanding that they are not in line with the policy set out above where the terms of the payment were agreed: (i) before the policy set out above, or any previous policy, came into effect, or (ii) at a time when the relevant individual was not a Director of the Company and the payment was not in consideration for the individual becoming a Director of the Company.
For these purposes, payments include the Committee satisfying awards of variable remuneration in relation to awards over shares made under the previous deferred annual bonus plan operated by the Group.
Committee discretion in relation to future operation of the Remuneration PolicyThe Committee will operate variable pay plans according to the respective rules of the plans.
The Committee also retains the discretion within the policy to amend targets and/or set different measures and weightings if events happen that cause it to determine that the original targets or conditions are no longer appropriate and the amendment is required so that the targets or conditions achieve their original purpose. Revised targets/measures will be, in the opinion of the Committee, no less difficult to satisfy than the original conditions.
The Committee may make minor amendments to the Remuneration Policy without obtaining shareholder approval for regulatory, exchange control, tax or administrative purposes or to take account of a change in legislation.
Approach to setting performance measures and targetsPerformance measures and targets (both short and long-term) are set each year taking into account a range of internal and external factors including sector and regulatory developments and the strategic progress of the Group. Performance targets will take account of market expectations with regards to future developments in the Group’s external environment, which in turn feed into specific objectives based on strategy.
The combination of performance measures and targets for the incentive arrangements (both short and long-term) are chosen to create direct alignment to the successful implementation of our strategy which will result in the delivery of sustainable long-term shareholder value.
Value and Composition of Remuneration PackagesThe Committee believes it is important, for executive Directors and the senior management that a significant portion of the package is performance related and a significant portion is delivered in shares to align their interests with shareholders. The potential value and composition of the executive Directors’ remuneration packages at below threshold, target and maximum scenarios under the proposed policy are set out in the charts below.
Value and composition of package CEO
€0.00m €1.00m €2.00m €3.00m €4.00m €5.00m €6.00m
Fixed
Target
Maximum
Long-term incentiveShort-term incentiveFixed Pay
100%
43% 37% 20%
25% 30% 45%
€0.00m €0.50m €1.00m €1.50m €2.00m €2.50m €3.00m
Fixed
Target
Maximum
100%
45% 39% 17%
27% 33% 40%
0% 10% 20% 30% 40% 50% 60% 70% 80% 90% 100%
Fixed
Target
Maximum
100%
43% 37% 20%
25% 30% 45%
0% 10% 20% 30% 40% 50% 60% 70% 80% 90% 100%
Fixed
Target
Maximum
100%
45% 39% 17%
27% 33% 40%
€1.4m
€3.1m
€5.5m
€0.7m
€1.6m
€2.7m
CFO€0.00m €1.00m €2.00m €3.00m €4.00m €5.00m €6.00m
Fixed
Target
Maximum
Long-term incentiveShort-term incentiveFixed Pay
100%
43% 37% 20%
25% 30% 45%
€0.00m €0.50m €1.00m €1.50m €2.00m €2.50m €3.00m
Fixed
Target
Maximum
100%
45% 39% 17%
27% 33% 40%
0% 10% 20% 30% 40% 50% 60% 70% 80% 90% 100%
Fixed
Target
Maximum
100%
43% 37% 20%
25% 30% 45%
0% 10% 20% 30% 40% 50% 60% 70% 80% 90% 100%
Fixed
Target
Maximum
100%
45% 39% 17%
27% 33% 40%
€1.4m
€3.1m
€5.5m
€0.7m
€1.6m
€2.7m
In developing the scenarios the following assumptions have been made:
n Salary: Salary at 1 January 2018.
n Benefits: Estimate based on benefits received in 2017.
n Pension: Cash in lieu rate or contribution rate applied to salary.
n Below Threshold: No pay-outs under any incentive plan.
n Target: Up to 70% of the maximum potential under the annual bonus plan and 25% of the maximum Performance Share Plan awards to be made in 2018 are earned.
n Maximum: The maximum potential under the incentive plans for 2018 is earned.
n Other: No share price, dividends or discount rate assumptions have been included.
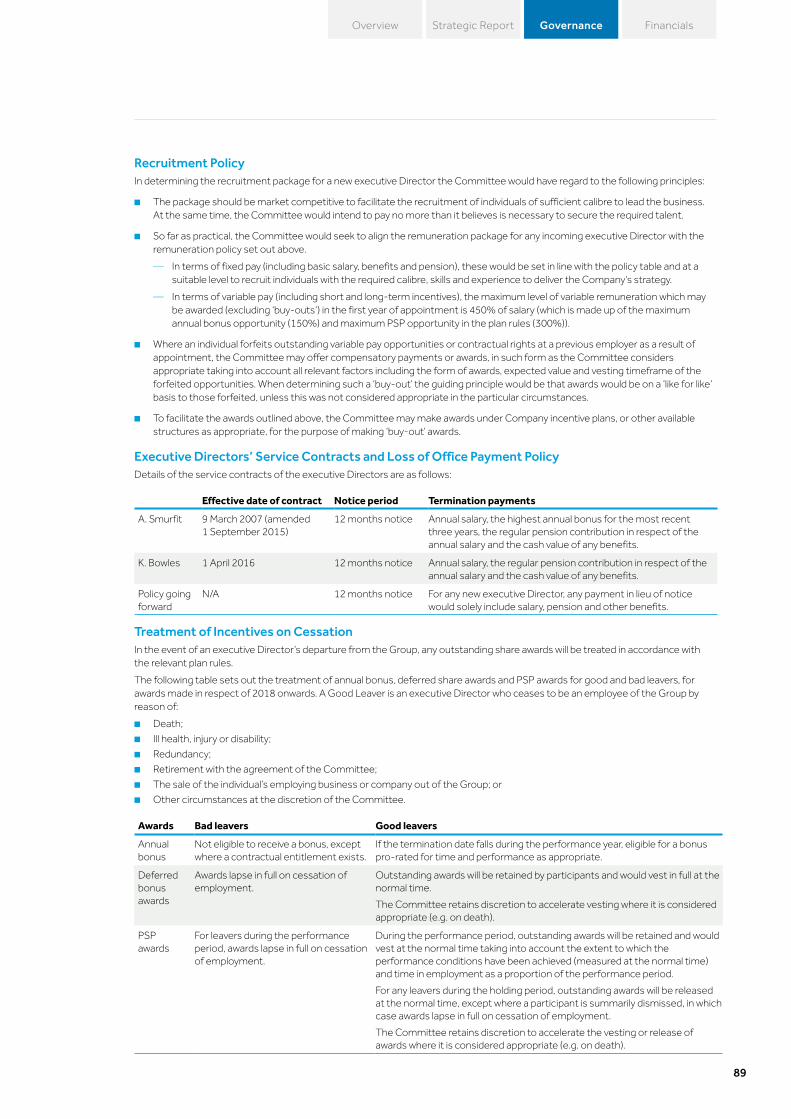
89
Strategic Report Governance FinancialsOverview
Recruitment PolicyIn determining the recruitment package for a new executive Director the Committee would have regard to the following principles:
n The package should be market competitive to facilitate the recruitment of individuals of sufficient calibre to lead the business. At the same time, the Committee would intend to pay no more than it believes is necessary to secure the required talent.
n So far as practical, the Committee would seek to align the remuneration package for any incoming executive Director with the remuneration policy set out above.
— In terms of fixed pay (including basic salary, benefits and pension), these would be set in line with the policy table and at a suitable level to recruit individuals with the required calibre, skills and experience to deliver the Company’s strategy.
— In terms of variable pay (including short and long-term incentives), the maximum level of variable remuneration which may be awarded (excluding ‘buy-outs’) in the first year of appointment is 450% of salary (which is made up of the maximum annual bonus opportunity (150%) and maximum PSP opportunity in the plan rules (300%)).
n Where an individual forfeits outstanding variable pay opportunities or contractual rights at a previous employer as a result of appointment, the Committee may offer compensatory payments or awards, in such form as the Committee considers appropriate taking into account all relevant factors including the form of awards, expected value and vesting timeframe of the forfeited opportunities. When determining such a ‘buy-out’ the guiding principle would be that awards would be on a ‘like for like’ basis to those forfeited, unless this was not considered appropriate in the particular circumstances.
n To facilitate the awards outlined above, the Committee may make awards under Company incentive plans, or other available structures as appropriate, for the purpose of making ‘buy-out’ awards.
Executive Directors’ Service Contracts and Loss of Office Payment PolicyDetails of the service contracts of the executive Directors are as follows:
Effective date of contract Notice period Termination payments
A. Smurfit 9 March 2007 (amended 1 September 2015)
12 months notice Annual salary, the highest annual bonus for the most recent three years, the regular pension contribution in respect of the annual salary and the cash value of any benefits.
K. Bowles 1 April 2016 12 months notice Annual salary, the regular pension contribution in respect of the annual salary and the cash value of any benefits.
Policy going forward
N/A 12 months notice For any new executive Director, any payment in lieu of notice would solely include salary, pension and other benefits.
Treatment of Incentives on CessationIn the event of an executive Director’s departure from the Group, any outstanding share awards will be treated in accordance with the relevant plan rules.
The following table sets out the treatment of annual bonus, deferred share awards and PSP awards for good and bad leavers, for awards made in respect of 2018 onwards. A Good Leaver is an executive Director who ceases to be an employee of the Group by reason of:
n Death;
n Ill health, injury or disability;
n Redundancy;
n Retirement with the agreement of the Committee;
n The sale of the individual’s employing business or company out of the Group; or
n Other circumstances at the discretion of the Committee.
Awards Bad leavers Good leavers
Annual bonus
Not eligible to receive a bonus, except where a contractual entitlement exists.
If the termination date falls during the performance year, eligible for a bonus pro-rated for time and performance as appropriate.
Deferred bonus awards
Awards lapse in full on cessation of employment.
Outstanding awards will be retained by participants and would vest in full at the normal time.
The Committee retains discretion to accelerate vesting where it is considered appropriate (e.g. on death).
PSP awards
For leavers during the performance period, awards lapse in full on cessation of employment.
During the performance period, outstanding awards will be retained and would vest at the normal time taking into account the extent to which the performance conditions have been achieved (measured at the normal time) and time in employment as a proportion of the performance period.
For any leavers during the holding period, outstanding awards will be released at the normal time, except where a participant is summarily dismissed, in which case awards lapse in full on cessation of employment.
The Committee retains discretion to accelerate the vesting or release of awards where it is considered appropriate (e.g. on death).

Smurfit Kappa Annual Report 201790
R E M U N E R AT I O N R E P O RT ( CO N T I N U E D)
In the event of a change of control, awards will be treated in line with the respective plan rules.
Awards under the Group’s legacy deferred annual bonus plan will be treated in line with the plan rules. A copy of the plan rules can be found on the Group’s website: smurfitkappa.com.
Non–executive Directors and the Chairman
Terms and conditions for non-executive Directors
All non-executive Directors have letters of appointment for a period of three years which are renewable but generally for no more than three terms in aggregate. In compliance with the UK Corporate Governance Code, all Directors will retire at each AGM and offer themselves for re-election. A copy of the letter of appointment is available for inspection at the Company’s registered office during normal business hours and at the AGM. Non-executive Directors are not eligible to participate in the annual bonus plan or the long-term incentive plans and their service as a non-executive Director is not pensionable.
Non-executive Director policy table
Approach to fees Operation Other items
Fees for the Chairman and non-executive Directors are set at an appropriate level to reflect the time commitment, responsibility and duties of the position and the contribution that is expected from non-executive Directors.
The remuneration of the non-executive Directors is determined by the Board within the limits set out in the Articles of Association.
The Chairman receives an aggregate fee.
The Remuneration Policy for non-executive Directors is to pay: (i) a basic annual fee; and (ii) fees for additional board responsibilities (including the senior independent director and chairmanship and membership of a committee).
Additional fees may also be paid where the time commitment in a particular year was significantly more than anticipated.
Non-executive Directors are reimbursed for travel and reasonable personal expenses (including any related tax liability on such expenses).
Additional fees or benefits may be provided at the discretion of the Board.
If a new Chairman or non-executive Director is appointed, the remuneration arrangements will normally be in line with those detailed in the table above.
Consideration of Remuneration Arrangements Throughout the GroupAs the Group is multinational, remuneration packages in each geographical location must be fair and competitive for that location and at a most senior level, on an international basis. Our objectives are to a) ensure that SKG can attract and retain talented employees of the calibre necessary for it to compete in all its markets, b) motivate employees at every level of the organisation to achieve the Group’s objectives both short and long-term in order to create sustainable value and c) align remuneration packages with the Group’s values of supporting a performance culture.
The employees are rewarded in line with their individual and business performance. In setting remuneration levels, SKG takes into consideration the employees’ performance appraisal, external benchmark data for their role in companies of similar size and scope in their geographical area while also ensuring reasonable internal equity within the Group.
Given the scale of the Group’s operations, the Group does not specifically invite employees to comment on the Directors’ Remuneration Policy.
Consideration of Shareholder ViewsThe Company is committed to ongoing shareholder dialogue when considering changes to the Remuneration Policy. As set out in the letter from the Committee Chairman, the Committee consulted extensively with shareholders on the proposed Remuneration Policy going forward and a number of changes were made to the original proposals to reflect the feedback received from shareholders, including the maximum operational award opportunity under the PSP for current executive Directors and the proposed shareholding requirement for the CEO.
End of Remuneration Policy

91
Strategic Report Governance FinancialsOverview
How We Will Implement Our Policy in 2018The following table sets out a summary of how our Remuneration Policy will be implemented in 2018 in respect of executive Directors.
Component Implementation in 2018
Chief Executive Officer Chief Financial Officer
Basic salary Salaries increased effective 1 January 2018 by 0.5%, which was below the increases for the wider workforce in the core countries in Europe which ranged between 1.1% - 3.5%.
A. Smurfit = €1,105,500 p.a. K. Bowles = €603,000 p.a.
Benefits Market competitive benefits provided in line with Remuneration Policy.
Pension A. Smurfit = 20.5% of salary (cash allowance) K. Bowles = 17% of salary (DC employer contribution)
Annual bonus Performance will be measured over one year against the following key financial, operational/strategic and individual performance metrics:
Measure Weighting
Earnings Before Interest and Tax 25%
ROCE 25%
Free Cash Flow 20%
Health and Safety 10%
Personal/Strategic Goals 20%
Actual targets have not been disclosed prospectively due to commercial sensitivity.
50% will be delivered in cash and 50% will be deferred into Company shares for three years.
A. Smurfit (maximum) = 150% of salary K. Bowles (maximum) = 150% of salary
Performance Share Plan Performance measured over three years against three equally weighted measures. Awards are subject to a holding period such that they are released in three equal tranches following the third, fourth and fifth anniversaries of the grant date.
Measure Threshold vesting(25% of maximum)
Maximum vesting(100% of maximum)
EPS (pre-exceptional items - cumulative over three-years)
720c 880c
ROCE (three-year average) 15.3% 18.7%
Relative Total Shareholder Return* Median performance Upper quartile
Straight line vesting between points
*Measured against the following peers: Billerud Korsnas, Cascades, DS Smith, Empresas Cmpc, Graphic Packaging, International Paper, Klabin, Mayr-Melnhof, Metsa Board, Mondi, Packaging Corporation of America, Stora Enso, UPM-Kymmene and WestRock.
A. Smurfit (maximum) = 225% of salary K. Bowles (maximum) = 180% of salary
Share ownership requirements
A. Smurfit is required to build a shareholding equivalent to 300% of basic salary.
K. Bowles is required to build a shareholding equivalent to 200% of basic salary.

Smurfit Kappa Annual Report 201792
R E M U N E R AT I O N R E P O RT ( CO N T I N U E D)
The table below sets out a summary of non-executive Director fees. There are no changes for 2018.
Annual fee
Chairman €350,000
Non-executive Director base fee €70,000
Additional fees:
Senior Independent Director fee €60,000
Audit Committee Chairman fee €60,000
Remuneration Committee Chairman fee €60,000
Committee membership fee €20,000
Total Executive Directors’ Remuneration in 2017The following table shows a single figure of total remuneration for each executive Director for the years 2017 and 2016. The individual remuneration in the tables below is also set out on page 98.
LTIP
Basicsalary Pension Benefits1
Total annualbonus2
Deferred matching
shares3
Share priceappreciation
element4 Total LTIP Total
€’000 €’000 €’000 €’000 €’000 €’000 €’000 €’000
Directors
2017
A. Smurfit 1,100 226 24 684 378 65 443 2,477
K. Bowles 600 102 32 372 73 13 86 1,192
2016
A. Smurfit 1,100 253 25 570 366 93 459 2,407
K. Bowles* 42 7 2 25 - - - 76
1 Benefits include the use of a company car, club subscriptions or cash equivalent.2 Includes the total bonus paid in respect of 2017 and 2016, including deferred amounts.3 Deferred matching shares - for 2017 this represents the matching shares that vested in February 2018 at the grant price in 2015. They
vested as a result of the achievement of the relevant performance targets for the three-year period ended 31 December 2017 (see page 94 for further details). For 2016 this represents the matching shares that vested in February 2017 at the grant price in 2014. They vested as a result of the achievement of the relevant performance targets for the three-year period ended 31 December 2016.
4 Share price appreciation element - the estimated additional value generated through share price growth over the grant price in 2015 and 2014. For the 2015 grants the share price used is €28.19 compared to the grant price of €24.05 per share. For the 2014 grants the share price used is €25.39 compared to the grant price of €20.23 per share.
* Mr Bowles was appointed Group Chief Financial Officer on 1 April 2016 and a Director on 8 December 2016.
PensionsMr Smurfit and Mr Bowles participated in a Group contributory defined benefit pension plan based on an accrual rate of 1/60th of pensionable salary for each year of pensionable service and was designed to provide two thirds of salary at retirement for full service. The defined benefit plan which Mr Smurfit and Mr Bowles are members of closed to future accrual with effect from 30 June 2016 and was replaced by a defined contribution plan. All pension benefits are determined solely in relation to basic salary.
The Irish Finance Act 2006 effectively established a cap on pension provision by introducing a penalty tax charge on pension assets in excess of the higher of €5 million or the value of individual prospective pension entitlements as at 7 December 2005. As a result of these legislative changes, the Compensation Committee of SKG decided that Irish based executive Directors should have the option once they reached the cap of continuing to accrue pension benefits as previously, or of choosing an alternative arrangement with a similar overall cost to the Group.
Mr Smurfit (in 2017 and 2016) chose an alternative arrangement which involved capping his individual pension in line with the provisions of the Finance Act and receiving a supplementary taxable non-pensionable cash allowance, in lieu of prospective pension foregone. This was calculated based on actuarial advice as the equivalent of the reduction in SKG’s liability to the individual and spread over the term to retirement as annual compensation allowances and was fixed at 30 June 2016 on the closure of the defined benefit plan to future accrual. For 2017, the non-pensionable cash allowance for Mr Smurfit represented 20.5% of salary. For Mr Bowles a company contribution equal to 17% of salary was paid into the defined contribution plan.

93
Strategic Report Governance FinancialsOverview
Annual BonusExecutive Directors participate in an annual bonus scheme which was based on the achievement of clearly defined stretching annual financial targets, together with targets for Health and Safety and a comparison of the Group’s financial performance compared to that of its peer group.
2017 annual bonus
The key target areas as well as their weightings and the specific targets for the 2017 annual bonus plan are set out in the table below:
Performance metrics Threshold Target MaximumResultant payout
(% of max.)
EPS (25%)* 15.7% (63%) 118c 175c 232c
ROCE (25%)* 11.5% (46%) 11.5% 15% 18.4%
Free Cash Flow (20%)* - €363m €435m €507m
Peer Comparison** (20%)
Peer comparison ensures that results, especially in a cyclical industry, while market driven, are a result of the ongoing relative performance of the Group’s operations and management teams rather than windfall benefits.Performance is measured against six key factors. For 2017, the Group out-performed peer group benchmarks in terms of return on capital employed (both on an average and median basis) and therefore, 33% of this element will pay-out.
6.7% (33%)
Health and Safety (10%)The Group consolidated frequency rate of accidents was 0.381. 75% payout in range between 0.25 and 0.5.
7.5% (75%)
Total 41.4%
* Due to the distortionary effect of hyperinflation in Venezuela it is excluded from both targets and actual results.** The peer group used for the purpose of this measure was: Billerud Korsnas, Bio-PAPPEL, Cascades, DS Smith, International Paper,
Klabin, Metsa Board, Mondi, Norske Skog, Packaging Corporation of America, Stora Enso, UPM-Kymmene and WestRock.
Based on the above performance, the Committee approved the resultant annual bonuses for 2017:
2017Annual cash bonus Deferred shares Total bonus
Executive Directors €’000 €’000 €’000A. Smurfit 342 342 684
K. Bowles 186 186 372
In line with the Remuneration Policy, half of the bonuses shown above were paid in cash and half were deferred into Company shares which vest after three years subject to the continuity of employment of the executive or in certain circumstances based on normal good leaver provisions.
2016 annual bonus
As committed to shareholders, the following table sets out the financial performance targets used to determine 2016 annual bonus awards for executive Directors. Specific targets were not disclosed in the 2016 Annual Report as they were considered to be commercially sensitive at the time.
Performance metrics Threshold Target MaximumResultant payout
(% of max.)
EPS (25%)* 9.2% (37%) 148c 212c 276c
ROCE (25%)* 8.7% (35%) 12.5% 16% 19.6%
Free cash flow (20%)* - €337m €414m €490m
Peer Comparison (20%)** Above median/average in 2 out of 6 comparators. 6.7% (33%)
Health and Safety (10%)The Group consolidated frequency rate of accidents maintained below 0.5. 100% payout below 0.5.
10% (100%)
Total 34.6%
* Due to the distortionary effect of hyperinflation in Venezuela it is excluded from both targets and actual results.** The peer group used for the purpose of this measure was: Billerud Korsnas, Bio-PAPPEL, Cascades, DS Smith, International Paper,
Klabin, Metsa Board, Mondi, Norske Skog, Packaging Corporation of America, Stora Enso, UPM-Kymmene and WestRock.
189c
14.7%
€289m
194c
14.9%
€293m

Smurfit Kappa Annual Report 201794
R E M U N E R AT I O N R E P O RT ( CO N T I N U E D)
Deferred Annual Bonus Plan
Awards vesting in respect of performance to 31 December 2017
In 2015, Mr Smurfit and Mr Bowles were granted Matching Share Awards which vested based on the achievement of performance targets for the three-year period ending on 31 December 2017. As previously set out by the Committee, the matching awards in respect of the 2015-17 performance period were reduced to 2.25 times (from a normal maximum of 3 times). The targets for the three-year period ending on December 2017 which were set in 2015, were as follows:
Targets and Match Matrix Three-year performance period 2015 - 2017
ROCE
44.3% 47.6% 50.9%
Level of performance attained over three-year period
BelowThreshold Threshold Target Stretch
Below Threshold 0 0 0 0.5
FCF (€m) 1,064 Threshold 0 1 1.125 1.5
1,230 Target 0 1.125 1.6875 1.875
1,383 Stretch 0.5 1.5 1.875 2.25
ROCE and FCF for the three-year period to December 2017 amounted to 45.2% and €1.067 billion respectively and as a result a 1.018 times match from a maximum of 2.25 times was approved by the Committee in February 2018. Adjustments were made to exclude the effect of acquisitions and disposals and the hyperinflationary effects of Venezuela which happened during the three-year period to December 2017.
Awards granted during the year
During the year, executive Directors were granted deferred share awards (in respect of the 2016 annual bonus) and Matching Share Awards that may vest based on the achievement of performance targets for the three-year period ending on 31 December 2019.
Details of the executive Directors’ awards are set out below. Further detail on the executive Directors’ outstanding shares are set out on page 97.
Type of interest Face value1 % vesting at threshold Performance period
Deferred bonus €’000
A. Smurfit Deferred shares 285 n/a n/a
K. Bowles Deferred shares 132 n/a n/a
Matching shares
A. Smurfit Matching shares 285 22% 01/01/2017-31/12/2019
K. Bowles Matching shares 132 22% 01/01/2017-31/12/2019
1 Share price on the date of grant in February 2017 was €25.71.
Percentage Change in Group Chief Executive Officer Remuneration in Relation to All EmployeesDetails of the percentage change in the salary, annual bonus and benefits from 2016 to 2017 for the Group Chief Executive Officer and all employees are set out below:
Basic salary Total bonus Benefits
Group Chief Executive Officer % change 0% 20% (10%)
All employees % change 3.2% 8% n/a*
*It is not possible to calculate the percentage change in benefits for all employees for the purpose of this table.

95
Strategic Report Governance FinancialsOverview
Relative Importance of Spend on PayThe following tables set out the amounts and percentage change in profit, dividends and total employee costs for the financial years ended 31 December 2017 against 2016.
2017 2016
€m €m
Profit before income tax and exceptional items 601 657
Profit before income tax (‘PBT’) 576 654
Dividends paid to shareholders 191 166
Total employee costs1 2,075 1,972
1 Total employee costs for continuing operations, includes wages and salaries, social insurance costs, share-based payment expense, pension costs and redundancy costs for all employees, including Directors. The average full time equivalent number of employees, including Directors and part-time employees in continuing operations was 46,350 (2016: 45,524) with the increase being mainly due to the acquisitions made during the year.
Percentage Change of Spend on Pay 2017 vs 2016
(20%)
(10%)
0%
10%
20%
PBT andexceptionals
PBT Dividendspaid
5.2%
Total employee costs
15.5%
(11.9%)(8.5%)
Total Shareholder Return PerformanceThe performance graph below shows the Group TSR performance from 31 December 2008 to 31 December 2017 against the performance of the FTSE 100 and FTSE 250 over the same period. Both the FTSE 100 and FTSE 250 have been chosen as during the relevant period these are the two broad equity market indices of which the Group has been a member.
Total Return Indices - Smurfit Kappa vs FTSE 100 and FTSE 250
Smurfit Kappa FTSE 100 (euro) FTSE 250 (euro)
Tota
l sha
reho
lder
retu
rn (i
nd)
0
500
1,000
1,500
2,000
2017201620152014201320122011201020092008
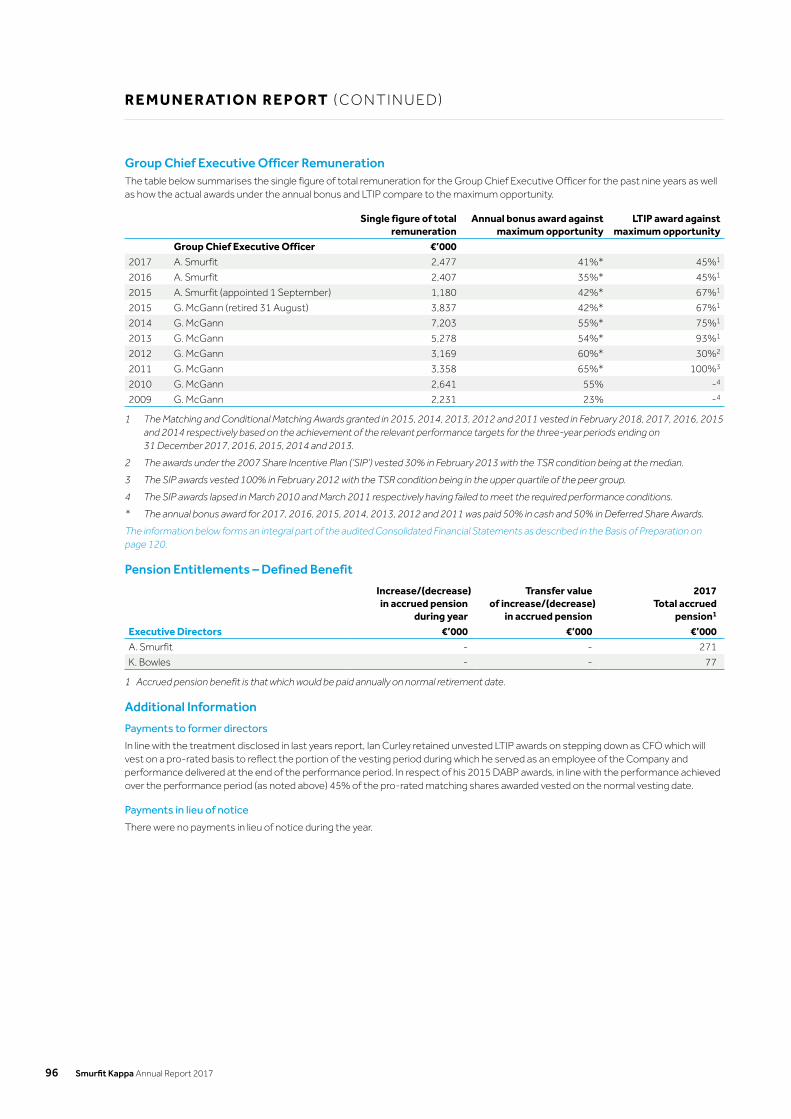
Smurfit Kappa Annual Report 201796
R E M U N E R AT I O N R E P O RT ( CO N T I N U E D)
Group Chief Executive Officer RemunerationThe table below summarises the single figure of total remuneration for the Group Chief Executive Officer for the past nine years as well as how the actual awards under the annual bonus and LTIP compare to the maximum opportunity.
Single figure of totalremuneration
Annual bonus award againstmaximum opportunity
LTIP award againstmaximum opportunity
Group Chief Executive Officer €’0002017 A. Smurfit 2,477 41%* 45%1
2016 A. Smurfit 2,407 35%* 45%1
2015 A. Smurfit (appointed 1 September) 1,180 42%* 67%1
2015 G. McGann (retired 31 August) 3,837 42%* 67%1
2014 G. McGann 7,203 55%* 75%1
2013 G. McGann 5,278 54%* 93%1
2012 G. McGann 3,169 60%* 30%2
2011 G. McGann 3,358 65%* 100%3
2010 G. McGann 2,641 55% -4
2009 G. McGann 2,231 23% -4
1 The Matching and Conditional Matching Awards granted in 2015, 2014, 2013, 2012 and 2011 vested in February 2018, 2017, 2016, 2015 and 2014 respectively based on the achievement of the relevant performance targets for the three-year periods ending on 31 December 2017, 2016, 2015, 2014 and 2013.
2 The awards under the 2007 Share Incentive Plan (‘SIP’) vested 30% in February 2013 with the TSR condition being at the median.
3 The SIP awards vested 100% in February 2012 with the TSR condition being in the upper quartile of the peer group.
4 The SIP awards lapsed in March 2010 and March 2011 respectively having failed to meet the required performance conditions.
* The annual bonus award for 2017, 2016, 2015, 2014, 2013, 2012 and 2011 was paid 50% in cash and 50% in Deferred Share Awards.
The information below forms an integral part of the audited Consolidated Financial Statements as described in the Basis of Preparation on page 120.
Pension Entitlements – Defined Benefit
Increase/(decrease)in accrued pension
during year
Transfer valueof increase/(decrease)
in accrued pension
2017Total accrued
pension1
Executive Directors €’000 €’000 €’000A. Smurfit - - 271
K. Bowles - - 77
1 Accrued pension benefit is that which would be paid annually on normal retirement date.
Additional Information
Payments to former directors
In line with the treatment disclosed in last years report, Ian Curley retained unvested LTIP awards on stepping down as CFO which will vest on a pro-rated basis to reflect the portion of the vesting period during which he served as an employee of the Company and performance delivered at the end of the performance period. In respect of his 2015 DABP awards, in line with the performance achieved over the performance period (as noted above) 45% of the pro-rated matching shares awarded vested on the normal vesting date.
Payments in lieu of notice
There were no payments in lieu of notice during the year.

97
Strategic Report Governance FinancialsOverview
Executive Directors’ Interests in Share Capital at 31 December 2017
NameOwned at 31
December 2016Owned at 31
December 2017Shareholding (% of salary)
Shareholding guideline *
(% of salary)Shareholding
guideline met?A. Smurfit 1,125,332 1,158,153 2,968% 150% Yes
K. Bowles 17,754 24,000 113% 100% Yes
* The new shareholding guideline being proposed will increase the CEO guideline to 300% and other executive directors to 200%.
Deferred Annual Bonus Plan Awards
Deferred Share Awards and Matching Share Awards
Deferred Share Awards and Matching Share Awards were granted to eligible employees in 2017 in respect of the financial year ended 31 December 2016. The Matching Share Awards may vest up to a maximum of 3 times the Deferred Share Award, based on the achievement of the relevant performance targets for the three-year period ending on 31 December 2019.
31 December *
2016Granted (Lapsed)
in year 2017
Sharesdistributed on vesting
31 December **2017
Marketprice on
awarddate Performance period
Deferred Matching Deferred Matching Deferred Matching Deferred Matching Directors
A. Smurfit 17,733 17,733 (17,733)1 (18,088)1 20.23 01/01/2014- 31/12/2016
15,450 15,450 15,4502 15,4502 24.05 01/01/2015- 31/12/2017
13,265 13,265 13,265 13,265 22.84 01/01/2016- 31/12/2018
11,093 11,093 11,093 11,093 25.71 01/01/2017- 31/12/2019
K. Bowles 5,742 3,828 (5,742)1 (3,905)1 20.23 01/01/2014- 31/12/2016
4,464 2,976 4,4642 2,9762 24.05 01/01/2015- 31/12/2017
3,559 3.559 3,559 3,559 22.84 01/01/2016- 31/12/2018
5,128 5,128 5,128 5,128 25.71 01/01/2017- 31/12/2019
Secretary
M. O’Riordan3 7,239 7,239 (7,239)1 (7,384)1 20.23 01/01/2014- 31/12/2016
5,364 5,364 5,3642 5,3642 24.05 01/01/2015- 31/12/2017
4,277 4,277 4,277 4,277 22.84 01/01/2016- 31/12/2018
4,012 4,012 4,012 4,012 25.71 01/01/2017- 31/12/2019
1 The deferred shares vested in February 2017 and were distributed. The market price at date of distribution was €25.39.
Based on the achievement of the relevant performance targets for the three-year period ending on 31 December 2016 the matching shares vested in February 2017 with a match of 1.02 times the level of the Matching Share Award and were distributed. The market price at the date of distribution was €25.39.
2 The deferred shares vested in February 2018.
Based on the achievement of the relevant performance targets for the three-year period ending on 31 December 2017 the matching shares vested in February 2018 with a match of 1.018 times the level of the Matching Share Award.
3 The 28,646 convertible shares held by M. O’Riordan at 31 December 2016 were exercised in February 2017 and the market price at the date of exercise was €25.39.
* or at date of appointment if later.** or at date of departure if earlier.
The market price of the Company’s shares at 31 December 2017 was €28.19 and the range during 2017 was €22.20 to €28.19.

Smurfit Kappa Annual Report 201798
R E M U N E R AT I O N R E P O RT ( CO N T I N U E D)
Directors’ Remuneration2017 2016
€’000 €’000Executive DirectorsBasic salary 1,700 1,333Annual cash bonus 528 362Pension 328 285Benefits 56 42Executive Directors’ remuneration 2,612 2,022
Average number of executive Directors 2 1
Non-executive DirectorsFees 1,360 1,265Non-executive Directors’ remuneration 1,360 1,265
Average number of non-executive Directors 11 11
Directors’ remuneration 3,972 3,287
Individual Remuneration for the Financial Year Ended 31 December 2017Basic salary
and feesAnnual
cash bonus Pension1 BenefitsTotal2017
Total2016
€’000 €’000 €’000 €’000 €’000 €’000Executive DirectorsA. Smurfit 1,100 342 226 24 1,692 1,663
K. Bowles2 600 186 102 32 920 62
I. Curley2 - - - - - 297
1,700 528 328 56 2,612 2,022
Non-executive DirectorsL. O’Mahony 350 350 300
F. Beurskens3 120 120 110
C. Bories 90 90 80
T. Brodin4 48 48 135
J. Buhl Rasmussen4 75 75 -
I. Finan 130 130 120
J. Lawrence 90 90 80
G. McGann4 30 30 80
J. Moloney 90 90 80
R. Newell 117 117 80
G. Restrepo 90 90 80
R. Thorne 130 130 120
1,360 1,360 1,265
1 Pension: The Irish Finance Act 2006 effectively established a cap on pension provision by introducing a penalty tax charge on pension assets in excess of the higher of €5 million or the value of individual prospective pension entitlements as at 7 December 2005. As a result of these legislative changes, the Compensation Committee of SKG in 2007 decided that Irish based executive Directors should have the option once they reached the cap of continuing to accrue pension benefits as previously, or of choosing an alternative arrangement with a similar overall cost to the Group.
Mr Smurfit in 2017 and 2016 chose the alternative arrangement and received a supplementary taxable non-pensionable cash allowance in lieu of contributions to a pension fund in the amount of €225,500 (2016: €225,500).
The aggregate amount of contributions paid to defined contribution schemes and defined benefit schemes in respect of Directors was €102,000 (2016: €32,097) and nil (2016: €27,500) respectively.
2 Mr Bowles who was appointed Group Chief Financial Officer on 1 April 2016 was appointed a Director on 8 December 2016. Mr Curley stepped down as Group Chief Financial Officer and Director on 31 March 2016.
3 Mr Beurskens’ fees include an additional fee of €30,000 (2016: €30,000) for services as a Director of a Group subsidiary.
4 Mr Buhl Rasmussen joined the Board in March 2017. Mr Brodin and Mr McGann retired in May 2017.

99
Strategic Report Governance FinancialsOverview
Share-based PaymentThe executive Directors receive Deferred Share Awards and Matching Share Awards, details of which are outlined on page 97 of this report. The share-based payment expense recognised in the Consolidated Income Statement for the executive Directors in the year totalled €1,077,296 (2016: €489,830).
Non-executive Directors’ Interests in Share Capital at 31 December 2017The interests of the non-executive Directors and Secretary in the shares of the Company as at 31 December 2017 which are beneficial unless otherwise indicated are shown below. The Directors and Secretary have no beneficial interests in any of the Group’s subsidiary or associated undertakings.
31 December2017**
31 December2016*
Ordinary SharesDirectorsL. O’Mahony 19,830 19,830F. Beurskens 2,500 2,500C. Bories 1,800 1,800T. Brodin** 30,000 30,000J. Buhl Rasmussen* 2,469 -I. Finan 8,650 8,650J. Lawrence 335,000 335,000G. McGann** 443,531 443,531J. Moloney 8,000 8,000R. Newell 4,965 4,965G. Restrepo - -R. Thorne 10,000 10,000SecretaryM. O’Riordan 115,018 110,018
* Or at date of appointment if later.** Or at date of departure if earlier.
End of information in the Remuneration Report that forms an integral part of the audited Consolidated Financial Statements.

Smurfit Kappa Annual Report 2017100
R E M U N E R AT I O N R E P O RT ( CO N T I N U E D)
The Compensation CommitteeThe Compensation Committee chaired by Mr Irial Finan currently comprises six non-executive Directors. The Directors’ biographical details on pages 68 to 70 demonstrate that the members of the Committee bring to it a wide range of experience in the area of senior executive remuneration in comparable companies.
The Committee receives advice from independent remuneration consultants, as appropriate, to supplement their own knowledge and to keep the Committee updated on current trends and practices. In 2017, the Committee received independent advice from its independent advisors Deloitte LLP on the approach to executive remuneration in the Group going forward, and received advice from Hay Group on the salaries of the executive Directors and the senior management team. The Committee considers that the advice provided by Deloitte LLP and Hay Group, who do not have any other affiliation with the Group, is objective and independent. The total fees paid to Deloitte LLP in relation to Remuneration Committee work during 2017 were £111,185 (excluding VAT).
The role and responsibilities of the Committee are set out in its Terms of Reference which is available on the Group’s website: smurfitkappa.com. The Terms of Reference and the performance of the Committee was reviewed and the Committee is considered to be operating effectively and efficiently. The Terms of Reference are reviewed each year by the Committee.
The Committee met five times during the year. Details of Committee members and meetings attended are provided in the table below. The Group Chief Executive Officer normally attends the meetings and the Group V.P. Human Resources attends when appropriate.
Attendance recordNumber of meetings
eligible to attendNumber of
meetings attendedAppointment
dateI. Finan (Chairman) 5 5 2012C. Bories 5 4 2012J. Buhl Rasmussen* 4 4 2017J. Moloney 5 5 2015L. O’Mahony 5 5 2007G. Restrepo 5 5 2015
* Mr Buhl Rasmussen joined the Board in March 2017.
Statement on Shareholder VotingThe Company is committed to ongoing shareholder dialogue when formulating remuneration policy. If there are substantial numbers of votes against resolutions in relation to directors’ remuneration, the Company will seek to understand the reasons for any such vote and will provide details of any actions in response to such a vote.
The following tables show the voting outcome at the 5 May 2017 AGM for the 2016 Directors’ Remuneration Report and the Remuneration Policy.
ItemVotes for and discretionary
% votes cast
Votes against
% votes cast
Total votes cast
Vote withheld
Directors’ Remuneration Report 124,091,647 86.9% 18,755,198 13.1% 142,846,845 544,748
Directors’ Remuneration Policy 138,700,200 98.8% 1,645,608 1.2% 140,345,808 3,045,785

101
Strategic Report Governance FinancialsOverview
N O M I N AT I O N CO M M I T T E E R E P O RT
As Chairman of the Nomination Committee I am pleased to present the report of the Committee in relation to the financial year ended 31 December 2017.
Role of the Nomination CommitteeThe role of the Nomination Committee (‘the Committee’) is to:
n lead the process for appointments to the Board and making recommendations to the Board
n evaluate the balance of skills, knowledge, experience and diversity, both gender and geographical, on the Board to ensure the Board continues to operate effectively
n prepare descriptions of the role and requirements for new appointees
n give full consideration to succession planning for Directors.
Where necessary, the Committee uses the services of external advisors in order to assist in the search for new appointments to the Board. They are provided with a brief which takes into consideration the skills, experience and diversity, both gender and geographical, required at the time to give balance to the Board. When suitable candidates have been identified some Committee members will meet with them and if a candidate is agreed upon, the Committee will then recommend the candidate to the Board. All appointments to the Board are approved by the Board as a whole. Non-executive Directors are expected to serve two three-year terms although they may be invited to serve for a further period.
All newly appointed Directors are subject to election by shareholders at the AGM following their appointment and in compliance with the Code, all Directors are required to retire at each AGM and offer themselves for re-election.
The terms and conditions of appointment of non-executive Directors are available for inspection at the Company’s registered office during normal business hours and at the AGM of the Company.
The role and responsibilities of the Committee are set out in its Terms of Reference which is available on the Group’s website: smurfitkappa.com. The Terms of Reference are reviewed each year by the Committee.
Membership of the CommitteeThe Committee is currently comprised of five non-executive Directors. The Committee met three times during the year under review. Details of Committee members and meetings attended are provided in the table below. The Group Chief Executive Officer normally attends meetings of the Committee.
Attendance record A* B* Appointment date
R. Newell - Chairman** 2 2 2017
T. Brodin** 2 2 2008
F. Beurskens 3 3 2013
J. Lawrence 3 3 2015
G. McGann** 1 1 2015
L. O’Mahony 3 3 2007
R. Thorne 3 3 2008
* Column A indicates the number of meetings held during the period the Director was a member of the Committee and was eligible to attend and Column B indicates the number of meetings attended.
** Mr Newell joined the Committee in May 2017 as Chairman. Mr Brodin and Mr McGann retired from the Board in May 2017.
Main Activities during the YearDuring the year the Committee evaluated the composition of the Board with respect to the balance of skills, knowledge, experience and diversity, including geographical and gender diversity on the Board and updated a policy document on Board succession.
The Committee instigated a search for a new non-executive Director in 2017 as part of the ongoing Board renewal process, using the services of an external advisor, KORN/FERRY Whitehead Mann, who do not have any other affiliation with the Group. Ms Fairweather was identified through a rigorous search and selection process. Following interviews with KORN/FERRY Whitehead Mann and a number of the Committee members, the Committee recommended Ms Fairweather for co-option to the Board. The appointment of Ms Fairweather, with effect from 1 January 2018, was confirmed by the Board in December 2017. Ms Fairweather has significant expertise in the global retail sector and this, together with her experience as Chief Financial Officer of a FTSE 100 company, will add to the Board’s skill base. Her biography is set out on page 69.
The Terms of Reference and the performance of the Committee was reviewed and the Committee is considered to be operating effectively and efficiently.
Roberto Newell Chairman of the Nomination Committee
22 March 2018
Roberto Newell Chairman of the Nomination Committee

Smurfit Kappa Annual Report 2017102
A N I N T EG R AT E D M O D E L
BAG-IN-BOXOur global bag-in-box operations produce innovative packaging solutions designed to extend the shelf life of liquid or semi-liquid food products. In 2014, we opened the ultra-modern and highly automated bag-in-box facility in Ibi Spain (pictured) which produces millions of taps and bags every month to meet growing demand.

Strategic Report Governance FinancialsOverview
103
Financials
Financial Statements
Statement of Directors’ Responsibilities 104
Independent Auditors’ Report 105
Consolidated Income Statement 112
Consolidated Statement of Comprehensive Income 113
Consolidated Balance Sheet 114
Company Balance Sheet 115
Consolidated Statement of Changes in Equity 116
Company Statement of Changes in Equity 117
Consolidated Statement of Cash Flows 118
Company Statement of Cash Flows 119
Notes to the Consolidated Financial Statements 120
Shareholder Information 176

Smurfit Kappa Annual Report 2017104
STAT E M E N T O F D I R EC TO RS ’ R E S P O N S I B I L I T I E S
The Directors are responsible for preparing the Annual Report and Consolidated Financial Statements in accordance with applicable laws and regulations.
Irish company law requires the Directors to prepare an Annual Report including Financial Statements for each financial year which give a true and fair view of the Group’s and the Company’s assets, liabilities and financial position at the end of the year and of the profit or loss of the Group for that financial year. The Directors have prepared the Group and the Company Financial Statements in accordance with International Financial Reporting Standards as adopted by the European Union and as regards the Company’s Financial Statements, in accordance with the provisions of the Companies Act.
In preparing the Financial Statements the Directors are required to:
n select suitable accounting policies and then apply them consistently;
n make judgments and estimates that are reasonable and prudent;
n comply with applicable International Financial Reporting Standards as adopted by the European Union, subject to any material departures disclosed and explained in the Financial Statements;
n include any additional information required by the Companies Act; and
n prepare the Financial Statements on the going concern basis, unless it is inappropriate to presume that the Group will continue in business.
The Directors are also required by Irish law and the Listing Rules to prepare a Directors’ Report and reports relating to Directors’ remuneration and corporate governance. In accordance with the Transparency (Directive 2004/109/EC) Regulations 2007 as amended (the ‘Transparency Regulations’), the Directors are required to include a management report containing a fair review of the business and a description of the principal risks and uncertainties facing the Group.
The Directors confirm that they have complied with the above requirements in preparing the 2017 Annual Report and Consolidated Financial Statements.
The Directors are responsible for:
n keeping accounting records that are sufficient to correctly record and explain the transactions of the Company;
n disclosing with reasonable accuracy at any time the financial position of the Company and the Group;
n maintaining adequate accounting records which enable those Financial Statements to be audited;
n ensuring that the Financial Statements comply with the Companies Act and as regards the Group Consolidated Financial Statements, Article 4 of the International Accounting Standards (‘IAS’) Regulation.
They are also responsible for safeguarding the assets of the Company and the Group and hence for taking reasonable steps for the prevention and detection of fraud and other irregularities.
The Directors are responsible for the maintenance and integrity of the corporate and financial information included on the Company’s website. Legislation in the Republic of Ireland concerning the preparation and dissemination of Financial Statements may differ from legislation in other jurisdictions.
Directors’ Statement Pursuant to the Transparency Regulations and UK Corporate Governance CodeEach of the Directors, whose names and functions are listed on pages 68 to 70, confirms that, to the best of each person’s knowledge and belief:
As required by the Transparency Regulations:
n the Annual Report and Consolidated Financial Statements, prepared in accordance with IFRS as adopted by the European Union, give a true and fair view of the assets, liabilities and financial position of the Company and the Group and of the profit of the Group; and
n the Directors’ Report contained in the Annual Report includes a fair review of the development and performance of the business and the position of the Company and the Group, together with a description of the principal risks and uncertainties that they face.
As required by the UK Corporate Governance Code:
n the Annual Report and Financial Statements, taken as a whole, provides the information necessary to assess the Group’s performance, business model and strategy and is fair, balanced and understandable.
On behalf of the Board
A. Smurfit Director and Group Chief Executive Officer
K. Bowles Director and Group Chief Financial Officer
22 March 2018

105
Strategic Report Governance FinancialsOverview
I N D E P E N D E N T AU D I TO RS ’ R E P O RT to the members of Smurfit Kappa Group plc
Report on the audit of the financial statements
OpinionIn our opinion, Smurfit Kappa Group plc’s Consolidated Financial Statements and Company Financial Statements (the “financial statements”):
n give a true and fair view of the Group’s and the Company’s assets, liabilities and financial position as at 31 December 2017 and of the Group’s profit and the Group’s and the Company’s cash flows for the year then ended;
n have been properly prepared in accordance with International Financial Reporting Standards (“IFRSs”) as adopted by the European Union and, as regards the Company’s Financial Statements, as applied in accordance with the provisions of the Companies Act 2014; and
n have been properly prepared in accordance with the requirements of the Companies Act 2014 and, as regards the Consolidated Financial Statements, Article 4 of the IAS Regulation.
We have audited the financial statements, included within the Annual Report, which comprise:
n the Consolidated and Company Balance Sheets as at 31 December 2017;
n the Consolidated Income Statement and Consolidated Statement of Comprehensive Income for the year then ended;
n the Consolidated and Company Statements of Cash Flows for the year then ended;
n the Consolidated and Company Statements of Changes in Equity for the year then ended; and
n the Notes to the Consolidated Financial Statements, which include a description of the significant accounting policies.
Certain required disclosures have been presented elsewhere in the Annual Report, rather than in the notes to the financial statements. These are cross-referenced from the financial statements and are identified as audited.
Our opinion is consistent with our reporting to the Audit Committee.
Basis for opinionWe conducted our audit in accordance with International Standards on Auditing (Ireland) (“ISAs (Ireland)”) and applicable law. Our responsibilities under ISAs (Ireland) are further described in the Auditors’ responsibilities for the audit of the financial statements section of our report. We believe that the audit evidence we have obtained is sufficient and appropriate to provide a basis for our opinion.
Independence
We remained independent of the Group in accordance with the ethical requirements that are relevant to our audit of the financial statements in Ireland, which includes IAASA’s Ethical Standard as applicable to listed public interest entities, and we have fulfilled our other ethical responsibilities in accordance with these requirements.
To the best of our knowledge and belief, we declare that non-audit services prohibited by IAASA’s Ethical Standard were not provided to the Group or the Company.
Other than those disclosed in note 5 to the financial statements, we have provided no non-audit services to the Group or the Company in the period from 1 January 2017 to 31 December 2017.
Our audit approach
Overview
Materiality
Audit scope
Key audit matters
Materiality
n €30 million (2016: €30 million) - Group financial statements
n Based on circa 2.5% of pre-exceptional EBITDA (earnings before exceptional items, share of associates’ profit (after tax), net finance costs, income tax expense, depreciation and intangible asset amortisation).
n €21.4 million (2016: €21.1 million) - Company financial statements
n Based on 1% of total assets
Audit scope
n The Group is structured along two operating segments being Europe and the Americas. The Consolidated Financial Statements are a consolidation of 365 operating plants and centralised functions spread across 35 countries. We conducted audit work in 22 countries.
n Taken together, the territories and functions where we performed our audit work accounted for 70% of Group revenues, 89% of the Group’s pre-exceptional EBITDA and 83% of the Group’s total assets.
Key audit matters
n Goodwill impairment assessment
n Venezuela – political and associated risks
n Taxation – valuation of deferred tax assets
n Employee benefits – valuation of retirement benefits liabilities

Smurfit Kappa Annual Report 2017106
I N D E P E N D E N T AU D I TO RS ’ R E P O RT ( CO N T I N U E D)
The scope of our audit
As part of designing our audit, we determined materiality and assessed the risks of material misstatement in the financial statements. In particular, we looked at where the directors made subjective judgements, for example in respect of significant accounting estimates that involved making assumptions and considering future events that are inherently uncertain. As in all of our audits we also addressed the risk of management override of internal controls, including evaluating whether there was evidence of bias by the directors that represented a risk of material misstatement due to fraud.
Key audit matters
Key audit matters are those matters that, in the auditors’ professional judgement, were of most significance in the audit of the financial statements of the current period and include the most significant assessed risks of material misstatement (whether or not due to fraud) identified by the auditors, including those which had the greatest effect on: the overall audit strategy; the allocation of resources in the audit; and directing the efforts of the engagement team. These matters, and any comments we make on the results of our procedures thereon, were addressed in the context of our audit of the financial statements as a whole, and in forming our opinion thereon, and we do not provide a separate opinion on these matters. This is not a complete list of all risks identified by our audit.
Key audit matter How our audit addressed the key audit matter
Goodwill impairment assessment
Refer to page 81 (Audit Committee Report), Note 2 Summary of significant accounting policies, Note 3 Significant accounting judgements, estimates and assumptions and Note 13 Goodwill and intangible assets.
At 31 December 2017 goodwill amounted to €2,284 million. The Group is required to annually test goodwill for impairment, irrespective of whether there are indicators that a CGU may be impaired.
The goodwill is allocated to 16 Cash Generating Units (CGUs), three of which each individually account for between 10% and 20% of the total carrying amount of goodwill. The three units are Europe France, Europe Benelux and Europe Germany, Austria and Switzerland as set out in Note 13 where the Directors’ annual impairment review is described in detail.
No impairment charge was recognised during the year in respect of goodwill.
We focused on this area given the scale of the assets and because the Group’s assessment of the carrying value of goodwill involves complex and subjective judgements in respect of the assumptions underpinning the value in use cash flow models used to determine the recoverable amount of each of the Group’s CGUs. These include assumptions in respect of future trading results of the Group, discount rates and terminal values.
We evaluated management’s assessment of the recoverable amount of each of the Group’s CGUs, paying particular attention to the CGUs that had limited headroom in the prior year (the France CGU and the Brazil CGU).
We evaluated the Directors’ future cash flow forecasts, including comparing them to the latest Board approved budget. In evaluating these forecasts we considered the reliability of management’s cash flow forecasting process by considering how actual historic results compared to budget. We also tested the mathematical accuracy of the cash flow model.
We challenged the appropriateness of the Group’s forecast trading assumptions included in the value in use cash flow model including those relating to volume, price and certain costs such as energy and recovered fibre over the nine year outlook period. Where appropriate, we compared the assumptions to external data such as RISI paper pricing forecasts, IMF economic growth indicators, IMF inflation forecasts and similar data.
We also considered the appropriateness of the discount rate used by management by assessing the assumptions used in determining the weighted average cost of capital against external benchmarks. We assessed the appropriateness of the Group’s earnings multiple used to calculate terminal values by reference to comparable industry multiples. Our valuation experts assisted us in assessing these assumptions. We concluded that the discount rates and earnings multiple used by management fell within a reasonable range.
We performed sensitivity analysis by changing certain key assumptions and considered the likelihood of such changes arising.
We understood the factors contributing to the increase in the value in use of the France CGU.
As set out in Note 13 the impairment test conducted in respect of the Brazil CGU continues to demonstrate low levels of headroom. Consequently the level of headroom available is sensitive to any material change in assumptions. We assessed the reasonableness of assumptions relating to volume, pricing, costs and discount rate by comparing to management’s budgets and forecasts and external data.
We considered the disclosures in the Annual Report in relation to these matters. The Directors have described their impairment review in detail in Note 13, including the impact on goodwill of changes to assumptions, in particular, the impact of changes in assumptions in respect of the Brazil CGU.
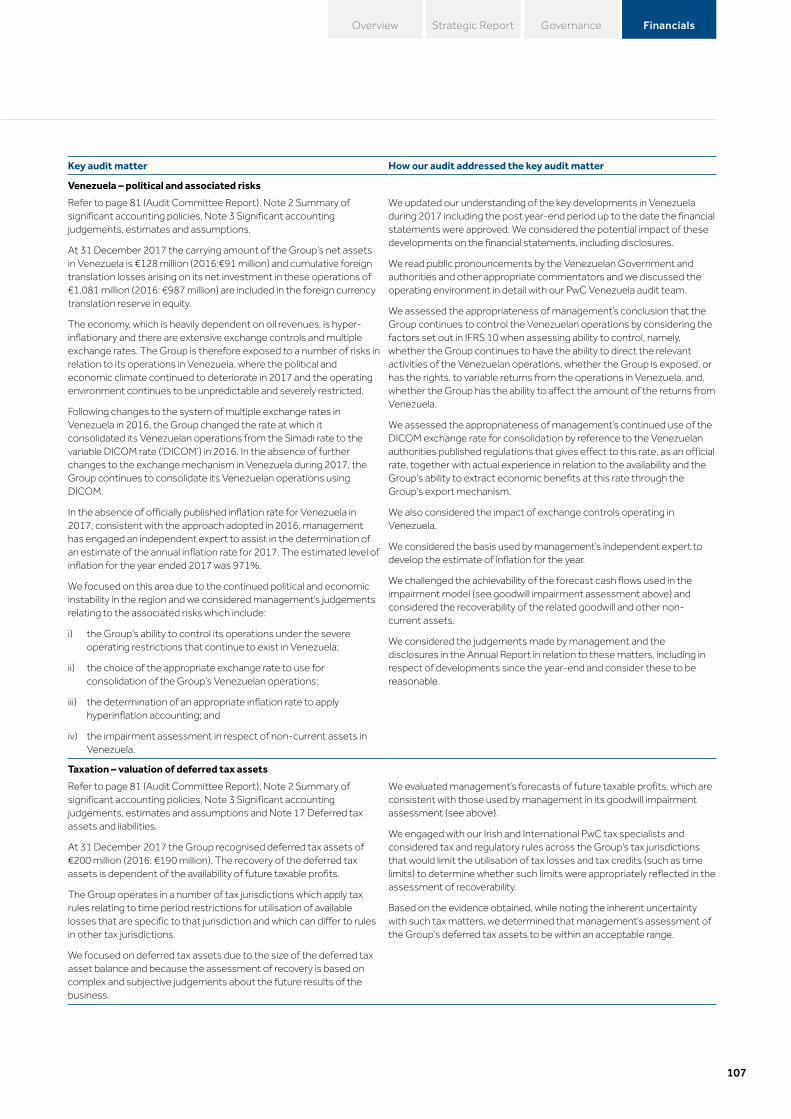
107
Strategic Report Governance FinancialsOverview
Key audit matter How our audit addressed the key audit matter
Venezuela – political and associated risks
Refer to page 81 (Audit Committee Report), Note 2 Summary of significant accounting policies, Note 3 Significant accounting judgements, estimates and assumptions.
At 31 December 2017 the carrying amount of the Group’s net assets in Venezuela is €128 million (2016:€91 million) and cumulative foreign translation losses arising on its net investment in these operations of €1,081 million (2016: €987 million) are included in the foreign currency translation reserve in equity.
The economy, which is heavily dependent on oil revenues, is hyper-inflationary and there are extensive exchange controls and multiple exchange rates. The Group is therefore exposed to a number of risks in relation to its operations in Venezuela, where the political and economic climate continued to deteriorate in 2017 and the operating environment continues to be unpredictable and severely restricted.
Following changes to the system of multiple exchange rates in Venezuela in 2016, the Group changed the rate at which it consolidated its Venezuelan operations from the Simadi rate to the variable DICOM rate (‘DICOM’) in 2016. In the absence of further changes to the exchange mechanism in Venezuela during 2017, the Group continues to consolidate its Venezuelan operations using DICOM.
In the absence of officially published inflation rate for Venezuela in 2017, consistent with the approach adopted in 2016, management has engaged an independent expert to assist in the determination of an estimate of the annual inflation rate for 2017. The estimated level of inflation for the year ended 2017 was 971%.
We focused on this area due to the continued political and economic instability in the region and we considered management’s judgements relating to the associated risks which include:
i) the Group’s ability to control its operations under the severe operating restrictions that continue to exist in Venezuela;
ii) the choice of the appropriate exchange rate to use for consolidation of the Group’s Venezuelan operations;
iii) the determination of an appropriate inflation rate to apply hyperinflation accounting; and
iv) the impairment assessment in respect of non-current assets in Venezuela.
We updated our understanding of the key developments in Venezuela during 2017 including the post year-end period up to the date the financial statements were approved. We considered the potential impact of these developments on the financial statements, including disclosures.
We read public pronouncements by the Venezuelan Government and authorities and other appropriate commentators and we discussed the operating environment in detail with our PwC Venezuela audit team.
We assessed the appropriateness of management’s conclusion that the Group continues to control the Venezuelan operations by considering the factors set out in IFRS 10 when assessing ability to control, namely, whether the Group continues to have the ability to direct the relevant activities of the Venezuelan operations, whether the Group is exposed, or has the rights, to variable returns from the operations in Venezuela, and, whether the Group has the ability to affect the amount of the returns from Venezuela.
We assessed the appropriateness of management’s continued use of the DICOM exchange rate for consolidation by reference to the Venezuelan authorities published regulations that gives effect to this rate, as an official rate, together with actual experience in relation to the availability and the Group’s ability to extract economic benefits at this rate through the Group’s export mechanism.
We also considered the impact of exchange controls operating in Venezuela.
We considered the basis used by management’s independent expert to develop the estimate of inflation for the year.
We challenged the achievability of the forecast cash flows used in the impairment model (see goodwill impairment assessment above) and considered the recoverability of the related goodwill and other non-current assets.
We considered the judgements made by management and the disclosures in the Annual Report in relation to these matters, including in respect of developments since the year-end and consider these to be reasonable.
Taxation – valuation of deferred tax assets
Refer to page 81 (Audit Committee Report), Note 2 Summary of significant accounting policies, Note 3 Significant accounting judgements, estimates and assumptions and Note 17 Deferred tax assets and liabilities.
At 31 December 2017 the Group recognised deferred tax assets of €200 million (2016: €190 million). The recovery of the deferred tax assets is dependent of the availability of future taxable profits.
The Group operates in a number of tax jurisdictions which apply tax rules relating to time period restrictions for utilisation of available losses that are specific to that jurisdiction and which can differ to rules in other tax jurisdictions.
We focused on deferred tax assets due to the size of the deferred tax asset balance and because the assessment of recovery is based on complex and subjective judgements about the future results of the business.
We evaluated management’s forecasts of future taxable profits, which are consistent with those used by management in its goodwill impairment assessment (see above).
We engaged with our Irish and International PwC tax specialists and considered tax and regulatory rules across the Group’s tax jurisdictions that would limit the utilisation of tax losses and tax credits (such as time limits) to determine whether such limits were appropriately reflected in the assessment of recoverability.
Based on the evidence obtained, while noting the inherent uncertainty with such tax matters, we determined that management’s assessment of the Group’s deferred tax assets to be within an acceptable range.

Smurfit Kappa Annual Report 2017108
Key audit matter How our audit addressed the key audit matter
Employee benefits – valuation of retirement benefits liabilities
Refer to page 81 (Audit Committee Report), Note 2 Summary of significant accounting policies, Note 3 Significant accounting judgements, estimates and assumptions and Note 25 Employee benefits.
The Group operates a number of pension plans and at 31 December 2017 the net employee benefit obligation amounted to €848 million (2016: €884 million). The liabilities in respect of these plans are valued on an actuarial basis and are subject to a number of actuarial assumptions which include the discount rate, inflation rate and mortality rate.
We focused on this area due to the size of the net employee benefit obligation balance and because there is inherent judgement in determining the actuarial assumptions.
We considered the Group pension arrangements and assessed the impact of any changes to the pension plans.
We considered the actuarial valuations of pension liabilities, with the assistance of our in-house actuarial experts, including both the methodologies and assumptions and determined that the key assumptions lay within an acceptable range.
We also considered the disclosure in Note 25 including the sensitivity analysis in relation to changes in the key actuarial assumptions of discount, mortality and inflation rates.
How we tailored the audit scope
We tailored the scope of our audit to ensure that we performed enough work to be able to give an opinion on the financial statements as a whole, taking into account the structure of the Group, the accounting processes and controls, and the industry in which the Group operates.
The Group is structured along two operating segments, Europe and the Americas. The nature of the Group’s activities is such that the corrugated paper plants are typically located close to their customer base and therefore the Group’s operations are significantly disaggregated. The Consolidated Financial Statements are a consolidation of 365 operating plants and centralised functions spread across 35 countries. Reporting units are structured by individual plants, grouping of plants or on a country basis depending on their management team and structure.
In determining our audit scope we first focus on individual reporting units and determined the type of work that needed to be performed at the reporting units by us, as the Group engagement team, or component auditors within PwC ROI and from other PwC network firms and other firms operating under our instruction. Where the work was performed by component auditors, we determined the level of involvement we needed to have in the audit work of those reporting units to be able to conclude whether sufficient appropriate audit evidence had been obtained as a basis for our opinion on the Consolidated Financial Statements as a whole.
Accordingly, we identified those reporting units which, in our view, required an audit of their complete financial information, due to their size and risk characteristics and to ensure appropriate coverage. These full scope reporting units amount to 70% of the Group’s revenue, 89% of the Group’s pre-exceptional EBITDA and 83% of the Group’s total assets. We allocated materiality levels and issued instructions to each component auditor. In addition to an audit report from each of the component auditors, we received detailed memoranda of examination on work performed and relevant findings which supplemented our understanding of the component, its results and the audit findings and we attended a number of local audit closing meetings and also reviewed certain component team’s working papers. In addition we identified certain other reporting units where specific audit procedures on certain balances were performed. This, together with additional procedures performed at Group level, gave us the evidence we needed for our opinion on the Consolidated Financial Statements as a whole.
Materiality
The scope of our audit was influenced by our application of materiality. We set certain quantitative thresholds for materiality. These, together with qualitative considerations, helped us to determine the scope of our audit and the nature, timing and extent of our audit procedures on the individual financial statement line items and disclosures and in evaluating the effect of misstatements, both individually and in aggregate on the financial statements as a whole.
Based on our professional judgement, we determined materiality for the financial statements as a whole as follows:
Consolidated financial statements Company financial statements
Overall materiality €30 million (2016: €30 million) €21.4 million (2016: €21.1 million)
How we determined it circa 2.5% of pre-exceptional EBITDA 1% of total assets
Rationale for benchmark applied
We have applied a rate of 2.5% to pre-exceptional EBITDA. In deciding that pre-exceptional EBITDA represented the appropriate benchmark we considered the strong weighting given to pre-exceptional EBITDA in assessing performance given both the specific circumstances of the Group and the industry norms and practice as indicated by brokerage reports, industry commentaries, communications with the investor community as well as internal management focus and reporting. We also considered materiality as determined to other commonly used benchmarks such as pre-exceptional profit before tax and determined that our chosen benchmark of €30 million to be reasonable in that context.
The entity is a holding Company whose main activity is the management of investments in subsidiaries.
I N D E P E N D E N T AU D I TO RS ’ R E P O RT ( CO N T I N U E D)

109
Strategic Report Governance FinancialsOverview
For each component in the scope of our Group audit, we allocated a materiality that is less than our overall Group materiality. The range of materiality allocated across components was €1 million to €9.5 million. Certain components were audited to a local statutory audit materiality that was also less than our overall Group materiality.
We agreed with the Audit Committee that we would report to them misstatements identified during our audit above €1 million (2016: €1 million) as well as misstatements below that amount that, in our view, warranted reporting for qualitative reasons.
Going concern
In accordance with ISAs (Ireland) we report as follows:
Reporting obligation Outcome
We are required to report if we have anything material to add or draw attention to in respect of the directors’ statement in the financial statements about whether the directors considered it appropriate to adopt the going concern basis of accounting in preparing the financial statements and the directors’ identification of any material uncertainties to the Group’s or the Company’s ability to continue as a going concern over a period of at least twelve months from the date of approval of the financial statements.
We have nothing material to add or to draw attention to. However, because not all future events or conditions can be predicted, this statement is not a guarantee as to the Group’s or the Company’s ability to continue as a going concern.
We are required to report if the directors’ statement relating to going concern in accordance with Rule 9.8.6R(3) of the Listing Rules of the UK Financial Conduct Authority is materially inconsistent with our knowledge obtained in the audit.
We have nothing to report.
Reporting on other informationThe other information comprises all of the information in the Annual Report other than the financial statements and our auditors’ report thereon. The directors are responsible for the other information. Our opinion on the financial statements does not cover the other information and, accordingly, we do not express an audit opinion or, except to the extent otherwise explicitly stated in this report, any form of assurance thereon.
In connection with our audit of the financial statements, our responsibility is to read the other information and, in doing so, consider whether the other information is materially inconsistent with the financial statements or our knowledge obtained in the audit, or otherwise appears to be materially misstated. If we identify an apparent material inconsistency or material misstatement, we are required to perform procedures to conclude whether there is a material misstatement of the financial statements or a material misstatement of the other information. If, based on the work we have performed, we conclude that there is a material misstatement of this other information, we are required to report that fact. We have nothing to report based on these responsibilities.
With respect to the Directors’ Report, we also considered whether the disclosures required by the Companies Act 2014 have been included.
Based on the responsibilities described above and our work undertaken in the course of the audit, ISAs (Ireland), the Companies Act 2014 (CA14) and the Listing Rules applicable to the Company (Listing Rules) require us to also report certain opinions and matters as described below (required by ISAs (Ireland) unless otherwise stated).
Directors’ Report
n In our opinion, based on the work undertaken in the course of the audit, the information given in the Directors’ Report for the year ended 31 December 2017 is consistent with the financial statements and has been prepared in accordance with the applicable legal requirements (CA14).
n Based on our knowledge and understanding of the Group and Company and their environment obtained in the course of the audit, we did not identify any material misstatements in the Directors’ Report (CA14).
Corporate governance statement
n In our opinion, based on the work undertaken in the course of the audit of the financial statements,
- the description of the main features of the internal control and risk management systems in relation to the financial reporting process; and
- the information required by section 1373(2)(d) of the Companies Act 2014;
included in the Corporate Governance Statement, is consistent with the financial statements and has been prepared in accordance with section 1373(2) of the Companies Act 2014.
n Based on our knowledge and understanding of the Company and its environment obtained in the course of the audit of the financial statements, we have not identified material misstatements in the description of the main features of the internal control and risk management systems in relation to the financial reporting process and the information required by section 1373(2)(d) of the Companies Act 2014 included in the Corporate Governance Statement (CA14).
n In our opinion, based on the work undertaken during the course of the audit of the financial statements, the information required by section 1373(2)(a),(b),(e) and (f) is contained in the Corporate Governance Statement (CA14).

Smurfit Kappa Annual Report 2017110
I N D E P E N D E N T AU D I TO RS ’ R E P O RT ( CO N T I N U E D)
The Directors’ assessment of the prospects of the Group and of the principal risks that would threaten the solvency or liquidity of the Group
We have nothing material to add or to draw attention to regarding:
n The Directors’ confirmation on page 76 of the Annual Report that they have carried out a robust assessment of the principal risks facing the Group, including those that would threaten its business model, future performance, solvency or liquidity.
n The disclosures in the Annual Report that describe those risks and explain how they are being managed or mitigated.
n The Directors’ explanation on page 36 of the Annual Report as to how they have assessed the prospects of the Group, over what period they have done so and why they consider that period to be appropriate, and their statement as to whether they have a reasonable expectation that the Group will be able to continue in operation and meet its liabilities as they fall due over the period of their assessment, including any related disclosures drawing attention to any necessary qualifications or assumptions.
We have nothing to report having performed a review of the Directors’ statement that they have carried out a robust assessment of the principal risks facing the Group and the Directors’ statement in relation to the longer-term viability of the Group. Our review was substantially less in scope than an audit and only consisted of making inquiries and considering the Directors’ process supporting their statements; checking that the statements are in alignment with the relevant provisions of the UK Corporate Governance Code (the “Code”); and considering whether the statements are consistent with the knowledge and understanding of the Group and the Company and their environment obtained in the course of the audit (Listing Rules).
Other code provisions
We have nothing to report in respect of our responsibility to report when:
n The statement given by the Directors on page 104 that they consider the Annual Report taken as a whole to be fair, balanced and understandable and provides the information necessary for the members to assess the Group’s and Company’s position and performance, business model and strategy is materially inconsistent with our knowledge of the Group and Company obtained in the course of performing our audit.
n The section of the Annual Report on page 83 describing the work of the Audit Committee does not appropriately address matters communicated by us to the Audit Committee.
n The Directors’ statement relating to the Company’s compliance with the Code does not properly disclose a departure from a relevant provision of the Code specified, under the Listing Rules, for review by the auditors.
Responsibilities for the financial statements and the audit
Responsibilities of the Directors for the financial statements
As explained more fully in the Statement of Directors’ Responsibilities set out on page 104, the Directors are responsible for the preparation of the financial statements in accordance with the applicable framework and for being satisfied that they give a true and fair view.
The Directors are also responsible for such internal control as they determine is necessary to enable the preparation of financial statements that are free from material misstatement, whether due to fraud or error.
In preparing the financial statements, the Directors are responsible for assessing the Group’s and the Company’s ability to continue as a going concern, disclosing as applicable, matters related to going concern and using the going concern basis of accounting unless the Directors either intend to liquidate the Group or the Company or to cease operations, or have no realistic alternative but to do so.
Auditors’ responsibilities for the audit of the financial statements
Our objectives are to obtain reasonable assurance about whether the financial statements as a whole are free from material misstatement, whether due to fraud or error, and to issue an auditors’ report that includes our opinion. Reasonable assurance is a high level of assurance, but is not a guarantee that an audit conducted in accordance with ISAs (Ireland) will always detect a material misstatement when it exists. Misstatements can arise from fraud or error and are considered material if, individually or in the aggregate, they could reasonably be expected to influence the economic decisions of users taken on the basis of these consolidated financial statements.
A further description of our responsibilities for the audit of the financial statements is located on the IAASA website at: https://www.iaasa.ie/getmedia/b2389013-1cf6-458b-9b8f-a98202dc9c3a/Description_of_auditors_responsibilities_for_audit.pdf
This description forms part of our auditors’ report.
Use of this report
This report, including the opinions, has been prepared for and only for the Company’s members as a body in accordance with section 391 of the Companies Act 2014 and for no other purpose. We do not, in giving these opinions, accept or assume responsibility for any other purpose or to any other person to whom this report is shown or into whose hands it may come save where expressly agreed by our prior consent in writing.

111
Strategic Report Governance FinancialsOverview
Other required reporting
Companies Act 2014 opinions on other mattersn We have obtained all the information and explanations which we consider necessary for the purposes of our audit.
n In our opinion the accounting records of the Company were sufficient to permit the Company financial statements to be readily and properly audited.
n The Company Balance Sheet is in agreement with the accounting records.
Companies Act 2014 exception reportingDirectors’ remuneration and transactions
Under the Companies Act 2014 we are required to report to you if, in our opinion, the disclosures of Directors’ remuneration and transactions specified by sections 305 to 312 of that Act have not been made. We have no exceptions to report arising from this responsibility.
AppointmentWe have been auditors since the date of incorporation of the Company on 24 January 2007. The period of total uninterrupted engagement is 11 years, covering the period ended 31 December 2007 to the year ended 31 December 2017.
Enda McDonagh for and on behalf of PricewaterhouseCoopers Chartered Accountants and Statutory Audit Firm Dublin
22 March 2018

Smurfit Kappa Annual Report 2017112
CO N S O L I DAT E D I N CO M E STAT E M E N TFor the Financial Year Ended 31 December 2017
2017 2016
Pre-exceptional Exceptional Total
Pre-exceptional Exceptional Total
Note €m €m €m €m €m €m
Revenue 4 8,562 - 8,562 8,159 - 8,159
Cost of sales 5 (5,997) (11) (6,008) (5,690) - (5,690)
Gross profit 2,565 (11) 2,554 2,469 - 2,469
Distribution costs 5 (667) - (667) (636) - (636)
Administrative expenses 5 (1,078) - (1,078) (1,003) - (1,003)
Other operating expenses 5 - (12) (12) - (15) (15)
Operating profit 820 (23) 797 830 (15) 815
Finance costs 8 (248) (2) (250) (215) - (215)
Finance income 8 29 - 29 40 12 52
Share of associates’ profit (after tax) 6 - - - 2 - 2
Profit before income tax 601 (25) 576 657 (3) 654
Income tax expense 9 (153) (196)
Profit for the financial year 423 458
Attributable to:
Owners of the parent 417 444
Non-controlling interests 6 14
Profit for the financial year 423 458
Earnings per share
Basic earnings per share – cent 10 177.2 189.4
Diluted earnings per share – cent 10 175.8 187.5

113
Strategic Report Governance FinancialsOverview
CO N S O L I DAT E D STAT E M E N T O F CO M P R E H E N S I V E I N CO M EFor the Financial Year Ended 31 December 2017
2017 2016
Note €m €m
Profit for the financial year 423 458
Other comprehensive income:
Items that may be subsequently reclassified to profit or loss
Foreign currency translation adjustments:
– Arising in the financial year (215) (80)
Effective portion of changes in fair value of cash flow hedges:
– Movement out of reserve 8 7
– New fair value adjustments into reserve (3) (7)
(210) (80)
Items which will not be subsequently reclassified to profit or loss
Defined benefit pension plans:
– Actuarial loss 25 (9) (148)
– Movement in deferred tax 9 1 23
(8) (125)
Total other comprehensive expense (218) (205)
Total comprehensive income for the financial year 205 253
Attributable to:
Owners of the parent 225 235
Non-controlling interests (20) 18
Total comprehensive income for the financial year 205 253

Smurfit Kappa Annual Report 2017114
CO N S O L I DAT E D BA L A N C E S H E E TAt 31 December 2017
2017 2016Note €m €m
ASSETSNon-current assetsProperty, plant and equipment 12 3,242 3,261
Goodwill and intangible assets 13 2,427 2,478
Available-for-sale financial assets 14 21 21
Investment in associates 15 13 17
Biological assets 16 110 114
Trade and other receivables 19 27 29
Derivative financial instruments 29 3 42
Deferred income tax assets 17 200 190
6,043 6,152
Current assetsInventories 18 838 779
Biological assets 16 11 10
Trade and other receivables 19 1,558 1,470
Derivative financial instruments 29 16 10
Restricted cash 22 9 7
Cash and cash equivalents 22 530 436
2,962 2,712
Total assets 9,005 8,864
EQUITY Capital and reserves attributable to owners of the parentEquity share capital 23 - -
Share premium 23 1,984 1,983
Other reserves 23 (678) (507)
Retained earnings 1,202 853
Total equity attributable to owners of the parent 2,508 2,329
Non-controlling interests 151 174
Total equity 2,659 2,503
LIABILITIESNon-current liabilitiesBorrowings 24 2,671 3,247
Employee benefits 25 848 884
Derivative financial instruments 29 26 12
Deferred income tax liabilities 17 148 183
Non-current income tax liabilities 33 30
Provisions for liabilities and charges 27 62 69
Capital grants 19 14
Other payables 28 17 13
3,824 4,452
Current liabilitiesBorrowings 24 673 137
Trade and other payables 28 1,779 1,705
Current income tax liabilities 37 21
Derivative financial instruments 29 10 27
Provisions for liabilities and charges 27 23 19
2,522 1,909
Total liabilities 6,346 6,361
Total equity and liabilities 9,005 8,864
A. Smurfit K. Bowles Director Director

115
Strategic Report Governance FinancialsOverview
CO M PA N Y BA L A N C E S H E E TAt 31 December 2017
2017 2016
Note €m €m
ASSETS
Non-current assets
Financial assets 14 2,067 2,055
2,067 2,055
Current assets
Amounts receivable from Group companies 19 197 166
197 166
Total assets 2,264 2,221
EQUITY
Capital and reserves attributable to owners of the parent
Equity share capital - -
Share premium 1,984 1,983
Share-based payment reserve 121 109
Retained earnings 155 124
Total equity 2,260 2,216
LIABILITIES
Current liabilities
Amounts payable to Group companies 28 4 5
Total liabilities 4 5
Total equity and liabilities 2,264 2,221
The Company earned a profit of €222 million for the financial year ended 31 December 2017 (2016: €288 million).
A. Smurfit K. Bowles Director Director

Smurfit Kappa Annual Report 2017116
CO N S O L I DAT E D STAT E M E N T O F C H A N G E S I N EQ U I T YFor the Financial Year Ended 31 December 2017
Attributable to owners of the parent
Equityshare
capitalShare
premiumOther
reserves(1)Retainedearnings Total
Non-controlling
interestsTotal
equity
€m €m €m €m €m €m €m
At 1 January 2017 - 1,983 (507) 853 2,329 174 2,503
Profit for the financial year - - - 417 417 6 423
Other comprehensive income
Foreign currency translation adjustments - - (189) - (189) (26) (215)
Defined benefit pension plans - - - (8) (8) - (8)
Effective portion of changes in fair value of cash flow hedges - - 5 - 5 - 5
Total comprehensive (expense)/income for the financial year - - (184) 409 225 (20) 205
Shares issued - 1 - - 1 - 1
Purchase of non-controlling interests - - - - - (15) (15)
Hyperinflation adjustment - - - 131 131 16 147
Dividends paid - - - (191) (191) (4) (195)
Share-based payment - - 23 - 23 - 23
Net shares acquired by SKG Employee Trust - - (10) - (10) - (10)
At 31 December 2017 - 1,984 (678) 1,202 2,508 151 2,659
At 1 January 2016 - 1,983 (425) 619 2,177 151 2,328
Profit for the financial year - - - 444 444 14 458
Other comprehensive income
Foreign currency translation adjustments - - (84) - (84) 4 (80)
Defined benefit pension plans - - - (125) (125) - (125)
Total comprehensive (expense)/income for the financial year - - (84) 319 235 18 253
Hyperinflation adjustment - - - 81 81 9 90
Dividends paid - - - (166) (166) (4) (170)
Share-based payment - - 12 - 12 - 12
Net shares acquired by SKG Employee Trust - - (10) - (10) - (10)
At 31 December 2016 - 1,983 (507) 853 2,329 174 2,503
(1) An analysis of Other reserves is provided in Note 23.

117
Strategic Report Governance FinancialsOverview
CO M PA N Y STAT E M E N T O F C H A N G E S I N EQ U I T YFor the Financial Year Ended 31 December 2017
Equityshare capital
Sharepremium
Share-basedpayment reserve
Retainedearnings Total equity
€m €m €m €m €m
At 1 January 2017 - 1,983 109 124 2,216
Profit for the financial year - - - 222 222
Dividends paid to shareholders - - - (191) (191)
Shares issued - 1 - - 1
Share-based payment - - 12 - 12
At 31 December 2017 - 1,984 121 155 2,260
At 1 January 2016 - 1,983 109 2 2,094
Profit for the financial year - - - 288 288
Dividends paid to shareholders - - - (166) (166)
At 31 December 2016 - 1,983 109 124 2,216

Smurfit Kappa Annual Report 2017118
CO N S O L I DAT E D STAT E M E N T O F C A S H F LOW SFor the Financial Year Ended 31 December 2017
2017 2016Note €m €m
Cash flows from operating activitiesProfit before income tax 576 654
Adjustment for:
Net finance costs 8 221 163
Depreciation charge 12 360 357
Impairment of assets 12 11 -
Amortisation of intangible assets 13 40 40
Amortisation of capital grants (2) (2)
Equity settled share-based payment expense 26 23 12
Profit on sale/purchase of assets and businesses (9) (13)
Share of associates’ profit (after tax) 6 - (2)
Net movement in working capital 20 (110) (94)
Change in biological assets (4) (4)
Change in employee benefits and other provisions (54) (87)
Other (primarily hyperinflation adjustments) 6 12
Cash generated from operations 1,058 1,036
Interest paid (161) (151)
Income taxes paid:
Irish corporation tax paid (14) (24)
Overseas corporation tax (net of tax refunds) paid (140) (127)
Net cash inflow from operating activities 743 734
Cash flows from investing activitiesInterest received 3 3
Business disposals 4 4
Additions to property, plant and equipment and biological assets (442) (427)
Additions to intangible assets 13 (16) (13)
Receipt of capital grants 4 3
Disposal of available-for-sale financial assets - 13
Increase in restricted cash (2) (2)
Disposal of property, plant and equipment 14 12
Disposal of associates 1 -
Dividends received from associates 15 1 1
Purchase of subsidiaries 32 (49) (35)
Deferred consideration paid (3) (9)
Net cash outflow from investing activities (485) (450)
Cash flows from financing activitiesProceeds from issue of new ordinary shares 1 -
Proceeds from bond issue 500 -
Proceeds from other debt issues - 250
Purchase of own shares (net) (10) (10)
Purchase of non-controlling interests (7) -
Decrease in other interest-bearing borrowings (78) (65)
Repayment of finance leases 21 (2) (3)
Repayment of borrowings (366) (169)
Derivative termination (payments)/receipts (6) 13
Deferred debt issue costs paid (10) (3)
Dividends paid to shareholders (191) (166)
Dividends paid to non-controlling interests (4) (4)
Net cash outflow from financing activities (173) (157)
Increase in cash and cash equivalents 21 85 127
Reconciliation of opening to closing cash and cash equivalentsCash and cash equivalents at 1 January 21 402 263
Currency translation adjustment 21 16 12
Increase in cash and cash equivalents 21 85 127
Cash and cash equivalents at 31 December 21, 22 503 402

119
Strategic Report Governance FinancialsOverview
CO M PA N Y STAT E M E N T O F C A S H F LOW SFor the Financial Year Ended 31 December 2017
2017 2016
€m €m
Cash flows from operating activities
Profit before income tax 222 288
Adjustment for:
Group creditor movements (1) 5
Net cash inflow from operating activities 221 293
Cash flows from financing activities
Group loan movements (31) (127)
Proceeds from issue of new ordinary shares 1 -
Dividends paid to shareholders (191) (166)
Net cash outflow from financing activities (221) (293)
Movement in cash and cash equivalents - -
Reconciliation of opening to closing cash and cash equivalents
Cash and cash equivalents at 1 January - -
Movement in cash and cash equivalents - -
Cash and cash equivalents at 31 December - -

Smurfit Kappa Annual Report 2017120
N OT E S TO T H E CO N S O L I DAT E D F I N A N C I A L STAT E M E N TSFor the Financial Year Ended 31 December 2017
1. General informationSmurfit Kappa Group plc (‘SKG plc’ or ‘the Company’) and its subsidiaries (together ‘SKG’ or ‘the Group’) manufacture, distribute and sell containerboard, corrugated containers and other paper-based packaging products such as solidboard, graphicboard and bag-in-box. The Company is a public limited company whose shares are publicly traded. It is incorporated and domiciled in Ireland. The address of its registered office is Beech Hill, Clonskeagh, Dublin 4, D04 N2R2, Ireland.
The Consolidated Financial Statements of the Group for the financial year ended 31 December 2017 were authorised for issue in accordance with a resolution of the Directors on 22 March 2018.
2. Summary of significant accounting policies
Statement of complianceThe Consolidated Financial Statements have been prepared in accordance with International Financial Reporting Standards (‘IFRS’) issued by the International Accounting Standards Board (‘IASB’) as adopted by the European Union (‘EU’), those parts of the Companies Act 2014 applicable to companies reporting under IFRS and Article 4 of the IAS Regulation. The Company Financial Statements have been prepared in accordance with IFRS adopted by the EU as applied in accordance with the provisions of the Companies Act 2014. IFRS adopted by the EU differ in certain respects from IFRS issued by the IASB. References to IFRS hereafter refer to IFRS adopted by the EU.
Basis of preparationThe Consolidated Financial Statements are presented in euro rounded to the nearest million. They have been prepared under the historical cost convention except for the following which are recognised at fair value: derivative financial instruments; available-for-sale financial assets; biological assets; share-based payments and; pension plan assets. Pension obligations are measured at the present value of the future estimated cash flows of benefits earned. The financial statements of subsidiaries whose functional currency is the currency of a hyperinflationary economy are stated in terms of the measuring unit currency at the end of the reporting period. This is the case for the Group’s subsidiaries in Venezuela.
The preparation of financial statements in accordance with IFRS requires the use of accounting judgements, estimates and assumptions that affect the reported amounts of assets, liabilities, income and expenses. The areas involving a higher degree of judgement and areas where assumptions and estimates are significant are discussed in the ‘Significant accounting judgements, estimates and assumptions’ note.
The Consolidated Financial Statements include the information in the Remuneration Report that is described as being an integral part of the Consolidated Financial Statements.
New and amended standards and interpretations effective during 2017The Group adopted Disclosure initiative – amendments to IAS 7 with effect from 1 January 2017. The amendments to IAS 7 require disclosure of changes in liabilities arising from financing activities. This information is disclosed in Note 21.
There were other changes to IFRS which became effective in 2017, however they did not result in material changes to the Group’s Consolidated Financial Statements.
New and amended standards and interpretations issued but not yet effective or early adopted
Financial instrumentsIFRS 9, Financial instruments, is the standard which will replace IAS 39, Financial Instruments: Recognition and Measurement. It has been completed in a number of phases with the final version issued by the IASB in July 2014 and endorsed by the EU in November 2016. The Standard addresses the classification, measurement and derecognition of financial assets and liabilities, introduces new rules for hedge accounting and a new impairment model for financial assets. IFRS 9 is effective for annual periods beginning on or after 1 January 2018. The Group will apply IFRS 9 from its effective date, with the practical expedients permitted under the standard. Comparatives for 2017 will not be restated.
The Group has assessed the impact of IFRS 9 in relation to the following areas which are relevant to the Group. Based on the assessment, the Group has determined there will be no material adjustment to retained earnings on application at 1 January 2018.
n The financial assets held by the Group include equity instruments currently classified as available-for-sale for which a fair value through other comprehensive income election is available under IFRS 9, accordingly the Group does not expect the new guidance to affect the classification and measurement of these financial assets. However, gains or losses realised on the sale of financial assets at fair value through other comprehensive income will no longer be transferred to profit or loss on sale, but instead will be reclassified within equity from the available-for-sale reserve to retained earnings.
n There will be no impact on the Group’s accounting of financial liabilities, as the new requirements only affect the accounting for financial liabilities that are designated at fair value through profit or loss and the Group does not have any such liabilities. The derecognition rules have been transferred from IAS 39 and have not been changed.
n The new hedge accounting rules will align the accounting for hedging instruments more closely with the Group’s risk management practices. As a general rule, more hedge relationships might be eligible for hedge accounting, as the standard introduces a more principles-based approach. The Group has evaluated the new rules for hedge accounting and has concluded that these will provide greater scope to apply hedge accounting and will facilitate the Group’s documentation of hedge accounting. The Group’s hedge documentation has been reworked in line with the new standard. The Group has established that all current hedge relationships will also qualify as continuing hedges upon the adoption of IFRS 9. Accordingly, the Group does not expect IFRS 9 to have a significant impact on its financial results.

121
Strategic Report Governance FinancialsOverview
2. Summary of significant accounting policies (continued)n The new impairment model requires the recognition of impairment provisions based on expected credit losses rather than only incurred
credit losses as is the case under IAS 39. It applies to financial assets classified at amortised cost, debt instruments measured at fair value through other comprehensive income, contract assets under IFRS 15 Revenue from Contracts with Customers, lease receivables, loan commitments and certain financial guarantee contracts. Based on the assessment undertaken by the Group, we do not expect that our impairment provisions will be materially affected by the new model.
n The new standard requires that when a financial liability measured at amortised cost is modified without being derecognised, a gain or loss should be recognised in the Consolidated Income Statement. Based on the assessment undertaken of the relevant original and modified cash flows, the Group does not expect IFRS 9 to have a material impact on its financial results.
n The new standard also introduces expanded disclosure requirements and changes in presentation. These are expected to change the nature and extent of the Group’s disclosures about its financial instruments particularly in the year of the adoption of the new standard.
Revenue recognitionIFRS 15, Revenue from Contracts with Customers, replaces IAS 18, Revenue and IAS 11, Construction contracts and related interpretations. IFRS 15 was endorsed by the EU in September 2016. IFRS 15 establishes principles for reporting the nature, amount, timing and uncertainty of revenue and cash flows arising from contracts with customers. It specifies how and when revenue should be recognised as well as requiring enhanced disclosures. The core principle of the standard requires an entity to recognise revenue to depict the transfer of goods or services to customers in an amount that reflects the consideration that it expects to be entitled to in exchange for transferring those goods or services to the customer. Revenue is recognised when an identified performance obligation has been met and the customer can direct the use of and obtain substantially all the remaining benefits from a good or service as a result of obtaining control of that good or service. IFRS 15 is effective for annual periods beginning on or after 1 January 2018, and the Group will apply IFRS 15 from its effective date using the modified retrospective approach.
The IASB developed a five-step model to be applied for recognising revenue from contracts with customers. The Group used this five-step approach to develop an impact assessment framework to assess the impact of IFRS 15 on the Group’s revenue transactions. The results of our IFRS 15 assessment framework and contract reviews indicated that the impact of applying IFRS 15 on our Consolidated Financial Statements is not material for the Group and there will be no adjustment to retained earnings on application at 1 January 2018. Details of the results of the assessment of those areas which are most relevant for the Group are as follows:
n Contracts with customers can be readily identified throughout the Group and involve the sale of containerboard, corrugated containers and other paper-based packaging products. Once a contract has been identified, under IFRS 15, an entity needs to identify the performance obligations in the contract. The Group reviewed its revenue contracts to identify the performance obligations included in the contract and concluded that the majority of customers’ contracts included a single performance obligation to provide a distinct product.
n IFRS 15 sets out guidance to determine the transaction price which is the amount of consideration to which an entity expects to be entitled in exchange for transferring promised goods or services to the customer excluding sales taxes. The Group has assessed the nature of its existing contractual arrangements and has considered in particular the effects of variable consideration and consideration payable to customers. The Group has reviewed its existing policies and has determined that the guidance in IFRS 15 will not have a material impact on its financial results.
n IFRS 15 requires revenue to be recognised when (point in time) or as (over time) the customer obtains control of a good or service. Revenue is recognised over time if one of the following three criteria is met: (1) the customer simultaneously receives and consumes the benefits provided by the entity’s performance as the entity performs; (2) the entity’s performance creates or enhances an asset that the customer controls as the asset is created or enhanced; or (3) the entity’s performance does not create an asset with an alternative use to the entity, and the entity has an enforceable right to payment for performance completed to date. We considered the impact of point 3 above on our current revenue recognition policy which currently recognises revenue at a point in time under IAS 18. Based on the Group’s assessment of factors relating to alternative use and enforceable right to payment, as it pertains to its contract manufacturing business, the Group has concluded that recognition of revenue at a point in time continues to be appropriate.
n IFRS 15 will increase the disclosures required in the Consolidated Financial Statements.

Smurfit Kappa Annual Report 2017122
N OT E S TO T H E CO N S O L I DAT E D F I N A N C I A L STAT E M E N TS ( CO N T I N U E D)For the Financial Year Ended 31 December 2017
2. Summary of significant accounting policies (continued)
LeasesIFRS 16, Leases issued in January 2016 by the IASB replaces IAS 17 Leases and related interpretations. IFRS 16 sets out the principles for the recognition, measurement, presentation and disclosure of leases for both the lessee and the lessor. For lessees, IFRS 16 eliminates the classification of leases as either operating leases or finance leases and introduces a single lessee accounting model whereby all leases are accounted for as finance leases, with some exemptions for short-term and low-value leases. The lessee will recognise a right-of-use asset representing its right to use the underlying asset and a lease liability representing its obligation to make lease payments. For lessors, IFRS 16 substantially carried forward the accounting requirement in IAS 17. IFRS 16 is effective for annual periods beginning on or after 1 January 2019, and subject to EU endorsement, the Group will apply IFRS 16 from its effective date.
The standard will primarily affect the accounting for the Group’s operating leases. The application of IFRS 16 will result in the recognition of additional assets and liabilities in the Consolidated Balance Sheet and in the Consolidated Income Statement it will replace the straight-line operating lease expense with a depreciation charge for the right-of-use asset and an interest expense on the lease liabilities. The Group’s non-cancellable operating lease commitments are detailed in the Lease obligations note, however, the Group has not yet determined to what extent these commitments will result in the recognition of an asset and a liability for future payments and how this will affect the Group’s profit or loss and classification of cash flows. Some of the commitments may be covered by the exemption for short-term and low-value leases. Also, the Group has not yet assessed what other adjustments, if any, are necessary, including whether it will exercise any lease renewal options and the extent to which the Group chooses to use practical expedients.
The Group is currently assessing the impact of applying IFRS 16.
Other changes to IFRS have been issued but are not yet effective for the Group. However, they are either not expected to have a material effect on the Consolidated Financial Statements or they are not currently relevant for the Group.
Basis of consolidationThe Consolidated Financial Statements include the annual Financial Statements of the Company and all of its subsidiaries and associates, drawn up to 31 December.
SubsidiariesSubsidiaries are entities controlled by the Group. They are consolidated from the date on which control is obtained by the Group; they cease to be consolidated from the date on which control is lost by the Group. Control exists when the Group is exposed, or has rights, to variable returns from its involvement with the entity and has the ability to affect those returns through its power over the entity. All significant subsidiaries have coterminous financial year ends. Where necessary, the accounting policies of subsidiaries have been modified to ensure consistency with the policies adopted by the Group. Intragroup transactions, intragroup balances and any unrealised gains and losses arising from intragroup transactions are eliminated in preparing the Consolidated Financial Statements, except to the extent that such a loss provides evidence of impairment. The Company’s investments in subsidiaries are carried at cost less impairment.
Non-controlling interests represent the portion of a subsidiary’s equity which is not attributable to the Group. They are presented separately in the Consolidated Financial Statements. Changes in ownership of a subsidiary which do not result in a change of control are treated as equity transactions.
AssociatesAssociates are entities in which the Group has significant influence arising from its power to participate in the financial and operating policy decisions of the investee. Associates are recognised using the equity method from the date on which significant influence is obtained until the date on which such influence is lost. Under the equity method investments in associates are recognised at cost and subsequently adjusted to reflect the post-acquisition movements in the Group’s share of the associates’ net assets. The Group profit or loss includes its share of the associates’ profit or loss after tax and the Group other comprehensive income includes its share of the associates other comprehensive income. The Group’s investment in associates includes goodwill identified on acquisition, net of any accumulated impairment losses. Losses in associates are not recognised once the Group’s carrying value reaches zero, except to the extent that the Group has incurred further obligations in respect of the associate. Unrealised gains arising from transactions with associates are eliminated to the extent of the Group’s interest in the entity. Unrealised losses are similarly eliminated to the extent that they do not provide evidence of impairment. Where necessary, the accounting policies of associates are modified to ensure consistency with Group accounting policies.
RevenueRevenue comprises the fair value of the consideration receivable for goods sold and services supplied to third party customers in the ordinary course of business. It excludes sales based taxes and is net of allowances for discounts and rebates. Revenue is recognised when delivery to the customer has taken place according to the terms of the sale, at which point the significant risks and rewards of ownership of the goods have passed to the customer. Revenue is recognised to the extent that it is probable that economic benefits will flow to the Group.
Foreign currencyItems included in the financial statements of each of the Group’s entities are measured using the currency of the primary economic environment in which the entity operates (‘the functional currency’). The Consolidated Financial Statements of the Group are presented in euro which is the presentation currency of the Group and the functional currency of the Company.
Transactions in foreign currencies are translated into the functional currency of the entity at the exchange rate ruling at the date of the transaction. Non-monetary assets and liabilities carried at cost are not subsequently retranslated. Non-monetary assets carried at fair value are subsequently remeasured at the exchange rate at the date of valuation.

123
Strategic Report Governance FinancialsOverview
2. Summary of significant accounting policies (continued)Monetary assets and liabilities denominated in foreign currencies are translated into functional currencies at the foreign exchange rate ruling at the balance sheet date. Foreign exchange differences arising on translation are recognised in profit or loss with the exception of differences on foreign currency borrowings that qualify as a hedge of the Group’s net investment in foreign operations. The portion of exchange gains or losses on foreign currency borrowing used to provide a hedge against a net investment in a foreign operation and that is determined to be an effective hedge is recognised in other comprehensive income. The ineffective portion is recognised immediately in the Consolidated Income Statement.
The assets and liabilities of entities that do not have the euro as their functional currency, including goodwill arising on consolidation, are translated to euro at the foreign exchange rates ruling at the balance sheet date. Their income, expenses and cash flows are translated to euro at average exchange rates during the year. However, if a Group entity’s functional currency is the currency of a hyperinflationary economy, that entity’s financial statements are first restated in accordance with IAS 29, Financial Reporting in Hyperinflationary Economies (see ‘Reporting in hyperinflationary economies’ below). Under IAS 29, income, costs and balance sheet amounts are translated at the exchange rates ruling at the balance sheet date.
Foreign exchange differences arising on translation of net investments including those arising on long-term intragroup loans deemed to be quasi-equity in nature are recognised in other comprehensive income. When a quasi-equity loan ceases to be designated as part of the Group’s net investment, accumulated currency differences are reclassified to profit or loss only when there is a change in the Group’s proportional interest. On disposal of a foreign operation, accumulated currency translation differences are reclassified to profit or loss as part of the overall gain or loss on disposal.
Reporting in hyperinflationary economiesWhen the economy of a country in which we operate is deemed hyperinflationary and the functional currency of a Group entity is the currency of that hyperinflationary economy, the financial statements of such Group entities are adjusted so that they are stated in terms of the measuring unit current at the end of the reporting period. This involves restatement of income and expenses to reflect changes in the general price index from the start of the reporting period and restatement of non-monetary items in the balance sheet, such as property, plant and equipment and inventories, to reflect current purchasing power as at the period end using a general price index from the date when they were first recognised. The gain or loss on the net monetary position for the year is included in finance costs or income. Comparative amounts are not restated. The restated income, expenses and balance sheets are translated to euro at the closing rate at the end of the reporting period. Differences arising on translation to euro are recognised in other comprehensive income.
Business combinationsThe Group uses the acquisition method in accounting for business combinations. Under the acquisition method, the assets, liabilities and contingent liabilities of an acquired business are initially recognised at their fair value at the date of acquisition. The cost of a business combination is measured as the aggregate of the fair values at the date of exchange of any assets transferred, liabilities incurred or assumed and equity instruments issued in exchange for control. When settlement of all or part of a business combination is deferred, the fair value of the deferred component is determined by discounting the amounts payable to their present value at the date of exchange. The discount component is unwound as an interest expense in the Consolidated Income Statement over the life of the obligation.
Where a business combination agreement provides for an adjustment to the cost of the combination which is contingent on future events, the contingent consideration is measured at fair value. Any subsequent re-measurement of the contingent amount is recognised in the Consolidated Income Statement if it is identified as a financial liability. When the initial accounting for a business combination is determined provisionally, any adjustments to the provisional values allocated to the identifiable assets and liabilities are made within twelve months of the acquisition date. Non-controlling interests are measured either, at their proportionate share of the acquiree’s identifiable net assets or, at fair value as at the acquisition date, on a case by case basis. Acquisition related costs are expensed as incurred.
Goodwill and impairmentGoodwill is the excess of the cost of an acquisition over the Group’s share of the fair value of the identifiable assets, liabilities and contingent liabilities acquired. When the fair value of the identifiable assets and liabilities acquired exceeds the cost of the acquisition the values are reassessed and any remaining gain is recognised immediately in the Consolidated Income Statement. Goodwill is allocated to the groups of cash-generating units (‘CGUs’) that are expected to benefit from the synergies of the combination. This is the lowest level at which goodwill is monitored for internal management purposes. After initial recognition goodwill is measured at cost less any accumulated impairment losses.
Goodwill is subject to impairment testing on an annual basis at a consistent time each year and at any time an impairment indicator is considered to exist. Impairment is determined by comparing the carrying amount to the recoverable amount of the groups of CGUs to which the goodwill relates. The recoverable amount is the greater of; fair value less costs to sell, and value-in-use. When the recoverable amount of the groups of CGUs is less than the carrying amount, an impairment loss is recognised.
Where goodwill forms part of a group of CGUs and part of the operation within that unit is disposed of, the goodwill associated with the operation disposed of is included in the carrying amount of the operation when determining the gain or loss on disposal of the operation. Goodwill disposed of in this circumstance is measured on the basis of the relative values of the operation disposed of and the portion of the group of CGUs retained.
In the year in which a business combination occurs, and the goodwill arising affects the goodwill allocation to CGUs, the groups of CGUs are tested for impairment prior to the end of that year. Impairment losses on goodwill are recognised in the Consolidated Income Statement and are not reversed following recognition.
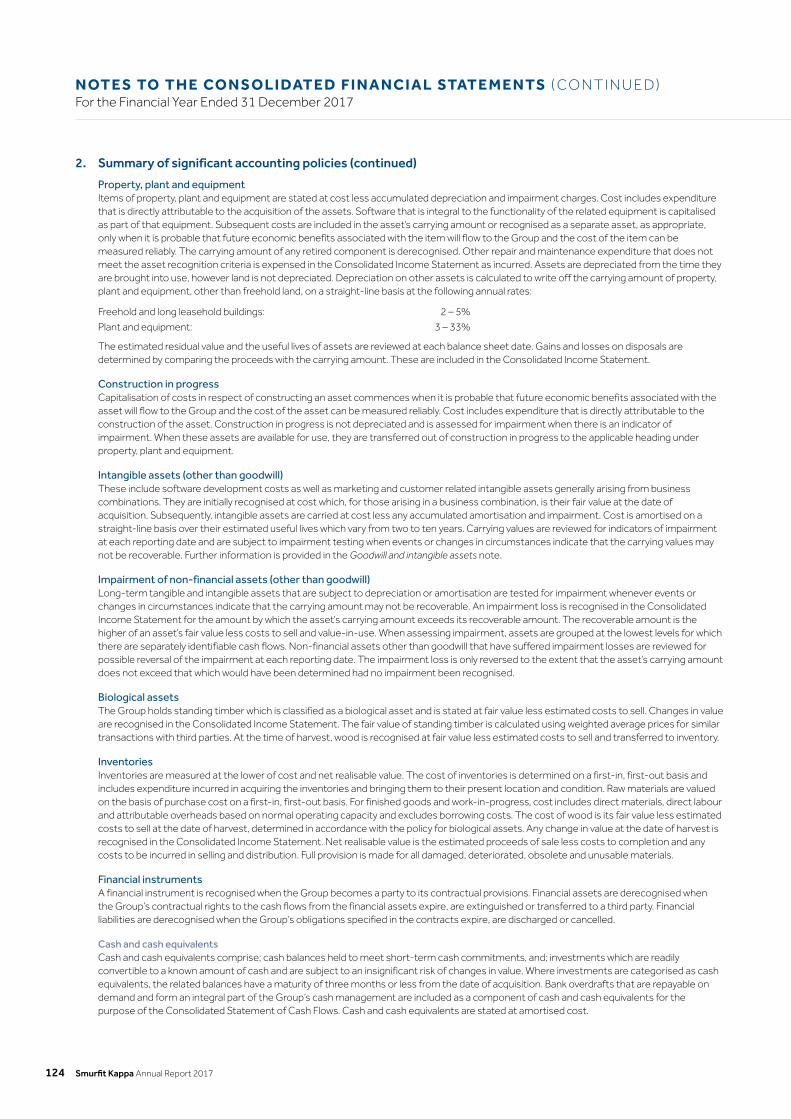
Smurfit Kappa Annual Report 2017124
N OT E S TO T H E CO N S O L I DAT E D F I N A N C I A L STAT E M E N TS ( CO N T I N U E D)For the Financial Year Ended 31 December 2017
2. Summary of significant accounting policies (continued)
Property, plant and equipmentItems of property, plant and equipment are stated at cost less accumulated depreciation and impairment charges. Cost includes expenditure that is directly attributable to the acquisition of the assets. Software that is integral to the functionality of the related equipment is capitalised as part of that equipment. Subsequent costs are included in the asset’s carrying amount or recognised as a separate asset, as appropriate, only when it is probable that future economic benefits associated with the item will flow to the Group and the cost of the item can be measured reliably. The carrying amount of any retired component is derecognised. Other repair and maintenance expenditure that does not meet the asset recognition criteria is expensed in the Consolidated Income Statement as incurred. Assets are depreciated from the time they are brought into use, however land is not depreciated. Depreciation on other assets is calculated to write off the carrying amount of property, plant and equipment, other than freehold land, on a straight-line basis at the following annual rates:
Freehold and long leasehold buildings: 2 – 5%
Plant and equipment: 3 – 33%
The estimated residual value and the useful lives of assets are reviewed at each balance sheet date. Gains and losses on disposals are determined by comparing the proceeds with the carrying amount. These are included in the Consolidated Income Statement.
Construction in progressCapitalisation of costs in respect of constructing an asset commences when it is probable that future economic benefits associated with the asset will flow to the Group and the cost of the asset can be measured reliably. Cost includes expenditure that is directly attributable to the construction of the asset. Construction in progress is not depreciated and is assessed for impairment when there is an indicator of impairment. When these assets are available for use, they are transferred out of construction in progress to the applicable heading under property, plant and equipment.
Intangible assets (other than goodwill)These include software development costs as well as marketing and customer related intangible assets generally arising from business combinations. They are initially recognised at cost which, for those arising in a business combination, is their fair value at the date of acquisition. Subsequently, intangible assets are carried at cost less any accumulated amortisation and impairment. Cost is amortised on a straight-line basis over their estimated useful lives which vary from two to ten years. Carrying values are reviewed for indicators of impairment at each reporting date and are subject to impairment testing when events or changes in circumstances indicate that the carrying values may not be recoverable. Further information is provided in the Goodwill and intangible assets note.
Impairment of non-financial assets (other than goodwill)Long-term tangible and intangible assets that are subject to depreciation or amortisation are tested for impairment whenever events or changes in circumstances indicate that the carrying amount may not be recoverable. An impairment loss is recognised in the Consolidated Income Statement for the amount by which the asset’s carrying amount exceeds its recoverable amount. The recoverable amount is the higher of an asset’s fair value less costs to sell and value-in-use. When assessing impairment, assets are grouped at the lowest levels for which there are separately identifiable cash flows. Non-financial assets other than goodwill that have suffered impairment losses are reviewed for possible reversal of the impairment at each reporting date. The impairment loss is only reversed to the extent that the asset’s carrying amount does not exceed that which would have been determined had no impairment been recognised.
Biological assetsThe Group holds standing timber which is classified as a biological asset and is stated at fair value less estimated costs to sell. Changes in value are recognised in the Consolidated Income Statement. The fair value of standing timber is calculated using weighted average prices for similar transactions with third parties. At the time of harvest, wood is recognised at fair value less estimated costs to sell and transferred to inventory.
InventoriesInventories are measured at the lower of cost and net realisable value. The cost of inventories is determined on a first-in, first-out basis and includes expenditure incurred in acquiring the inventories and bringing them to their present location and condition. Raw materials are valued on the basis of purchase cost on a first-in, first-out basis. For finished goods and work-in-progress, cost includes direct materials, direct labour and attributable overheads based on normal operating capacity and excludes borrowing costs. The cost of wood is its fair value less estimated costs to sell at the date of harvest, determined in accordance with the policy for biological assets. Any change in value at the date of harvest is recognised in the Consolidated Income Statement. Net realisable value is the estimated proceeds of sale less costs to completion and any costs to be incurred in selling and distribution. Full provision is made for all damaged, deteriorated, obsolete and unusable materials.
Financial instrumentsA financial instrument is recognised when the Group becomes a party to its contractual provisions. Financial assets are derecognised when the Group’s contractual rights to the cash flows from the financial assets expire, are extinguished or transferred to a third party. Financial liabilities are derecognised when the Group’s obligations specified in the contracts expire, are discharged or cancelled.
Cash and cash equivalentsCash and cash equivalents comprise; cash balances held to meet short-term cash commitments, and; investments which are readily convertible to a known amount of cash and are subject to an insignificant risk of changes in value. Where investments are categorised as cash equivalents, the related balances have a maturity of three months or less from the date of acquisition. Bank overdrafts that are repayable on demand and form an integral part of the Group’s cash management are included as a component of cash and cash equivalents for the purpose of the Consolidated Statement of Cash Flows. Cash and cash equivalents are stated at amortised cost.

125
Strategic Report Governance FinancialsOverview
2. Summary of significant accounting policies (continued)
Restricted cashRestricted cash comprises cash held by the Group but which is ring fenced or used as security for specific financing arrangements, and to which the Group does not have unfettered access. Restricted cash is stated at amortised cost.
Available-for-sale financial assetsEquity and debt investments are classified as available-for-sale and are stated at fair value. Changes in fair value are recognised directly in other comprehensive income, however impairment losses are recognised in the Consolidated Income Statement. On disposal the cumulative gain or loss recognised in other comprehensive income is reclassified to the Consolidated Income Statement as part of the gain or loss arising. When applicable, interest is recognised in profit or loss using the effective interest method.
BorrowingsBorrowings are recognised initially at fair value, net of transaction costs and are subsequently stated at amortised cost; any difference between the proceeds (net of transaction costs) and the redemption value is recognised in the Consolidated Income Statement over the period of the borrowings using the effective interest method. Fixed rate borrowings, which have been hedged to floating rates are measured at amortised cost adjusted for changes in value attributable to the hedged risk arising from changes in underlying market interest rates. Borrowings are classified as current liabilities unless the Group has an unconditional right to defer settlement of the liability for at least one year after the balance sheet date.
Securitised assetsThe Group has entered into a series of securitisation transactions involving certain of its trade receivables and the establishment of certain special purpose entities to effect these transactions. These special purpose entities are consolidated as they are considered to be controlled by the Group. The related securitised assets continue to be recognised on the Consolidated Balance Sheet.
Trade and other receivablesTrade and other receivables are recognised initially at fair value and subsequently measured at amortised cost using the effective interest method, less any provision for impairment. A provision for impairment of trade receivables is recognised when there is objective evidence that the Group will not be able to collect all amounts due according to the original terms of the receivables. Impairments are recognised in the Consolidated Income Statement once identified.
Trade and other payablesTrade and other payables are recognised initially at fair value and subsequently measured at amortised cost using the effective interest method.
Derivative financial instruments and hedging activitiesThe Group uses derivative financial instruments to manage certain foreign currency, interest rate and commodity price exposures. All derivatives are recognised at fair value. The treatment of changes in fair value depends on whether the derivative is designated as a hedging instrument, the nature of the item being hedged and the effectiveness of the hedge. The Group designates certain derivatives as follows:
n hedges of a particular risk associated with a recognised floating rate asset or liability or a highly probable forecast transaction (cash flow hedges);
n hedges of changes in the fair value of a recognised asset or liability (fair value hedges); and
n hedges of net investments in foreign operations (net investment hedges).
At inception the Group documents the relationship between the hedging instrument and hedged items, its risk management objectives and the strategy for undertaking the transaction. The Group also documents its assessment of whether the derivative is highly effective in offsetting changes in fair value or cash flows of hedged items, both at inception and in future periods.
The fair values of various derivative instruments used for hedging purposes are disclosed in the Financial instruments note. Movements on the cash flow hedging reserve in shareholders’ equity are shown in the Capital and reserves note. The full fair value of a hedging derivative is classified as a non-current asset or liability when its remaining maturity is more than one year; it is classified as a current asset or liability when its remaining maturity is less than one year. Non-hedging derivative assets and liabilities are classified as current or non-current based on expected realisation or settlement dates.
Cash flow hedgesChanges in the fair value of derivative hedging instruments designated as cash flow hedges are recognised in other comprehensive income to the extent that the hedge is effective. Amounts accumulated in other comprehensive income are reclassified to the Consolidated Income Statement in the same periods that the hedged items affect profit or loss. The reclassified gain or loss relating to the effective portion of interest rate swaps hedging variable rate borrowings is recognised in the Consolidated Income Statement within finance income or costs respectively. The gain or loss relating to the ineffective portion is recognised immediately in the Consolidated Income Statement within finance income or costs respectively. When the hedged item is a non-financial asset, the amount recognised in other comprehensive income is transferred to the carrying amount of the asset when it is recognised. In other cases, the amount recognised in other comprehensive income is transferred to the Consolidated Income Statement in the same period that the hedged item affects profit or loss.
If the hedging instrument no longer meets the criteria for hedge accounting, expires or is sold, terminated or exercised, then hedge accounting is discontinued prospectively. The cumulative gain or loss previously recognised in other comprehensive income remains there until the forecast transaction occurs, unless the hedged transaction is no longer expected to occur, in which case the cumulative gain or loss that was previously recognised in other comprehensive income is transferred to the Consolidated Income Statement.

Smurfit Kappa Annual Report 2017126
N OT E S TO T H E CO N S O L I DAT E D F I N A N C I A L STAT E M E N TS ( CO N T I N U E D)For the Financial Year Ended 31 December 2017
2. Summary of significant accounting policies (continued)
Fair value hedgesWhere derivative hedging instruments are designated as fair value hedges, any gain or loss arising from the remeasurement of the hedging instrument to fair value is reported in the Consolidated Income Statement together with any changes in the fair value of the hedged asset or liability that are attributable to the hedged risk. When the hedging instrument no longer meets the criteria for hedge accounting, the adjustment to the carrying amount of the hedged item is amortised to the Consolidated Income Statement over the period to maturity.
Net investment hedgesHedges of net investments in foreign operations are accounted for in a similar manner to cash flow hedges. Any gain or loss on the hedging instrument relating to the effective portion of the hedge is recognised in other comprehensive income. The gain or loss relating to the ineffective portion is recognised immediately in the Consolidated Income Statement within finance income or costs respectively. Gains and losses accumulated in other comprehensive income are reclassified to profit or loss when the foreign operation is sold.
Derivatives not designated as hedgesChanges in the fair value of derivatives which are not designated for hedge accounting are recognised in the Consolidated Income Statement.
Embedded derivativesDerivatives embedded in host contracts are treated as separate derivatives when their risks and characteristics are not closely related to those of host contracts and the host contracts are not carried at fair value through profit or loss. Changes in the fair value of separable embedded derivatives are recognised immediately in the Consolidated Income Statement.
Fair value hierarchyThe Group reports using the fair value hierarchy in relation to its assets and liabilities which are measured at fair value except for those which are exempt as defined under IFRS 13, Fair Value Measurement. The fair value hierarchy categorises into three levels the inputs to valuation techniques used to measure fair value, which are described as follows:
n Level 1: quoted prices (unadjusted) in active markets for identical assets or liabilities;
n Level 2: inputs, other than quoted prices included within Level 1, that are observable for the asset or liability either directly (as prices) or indirectly (derived from prices); and
n Level 3: inputs for the asset or liability that are not based on observable market data (unobservable inputs).
Impairment of financial assetsA financial asset is considered to be impaired if objective evidence indicates that one or more events have had a negative effect on its estimated future cash flows, or for equity securities, there is a significant or prolonged decline in value below its carrying amount. Impairment of a financial asset measured at amortised cost is calculated as the difference between its carrying amount and the present value of its estimated future cash flows discounted at the original effective interest rate. An impairment loss in respect of an available-for-sale financial asset is calculated by reference to its current fair value. Individually significant financial assets are tested for impairment on an individual basis. The remaining financial assets are assessed collectively in groups that share similar credit risk characteristics. Impairment losses are recognised in the Consolidated Income Statement including any cumulative loss in respect of an available-for-sale financial asset previously recognised in other comprehensive income. An impairment loss is reversed if the reversal can be objectively related to an event occurring after the impairment loss was recognised. For available-for-sale financial assets that are equity securities the reversal is recognised directly in other comprehensive income. For other financial assets the reversal is recognised in the Consolidated Income Statement.
ProvisionsA provision is recognised when the Group has a present legal or constructive obligation as a result of a past event, and it is probable that an outflow of resources will be required to settle the obligation and the amount can be reliably estimated. If the effect is material, provisions are determined by discounting the expected future cash flows at a pre-tax rate that reflects current market assessments of the time value of money and, where appropriate, the risks specific to the obligation. The increase in the provision due to the passage of time is recognised as a finance expense.
A contingent liability is not recognised but is disclosed where the existence of an obligation will only be confirmed by future events or where it is not probable that an outflow of resources will be required to settle the obligation or where the amount of the obligation cannot be measured with sufficient reliability. Contingent assets are not recognised but are disclosed where an inflow of economic benefits is probable.
Finance costs and incomeFinance costs comprise interest expense on borrowings (including amortisation of deferred debt issue costs), certain foreign currency translation losses related to financing, unwinding of the discount on provisions, impairment losses recognised on certain financial assets, borrowing extinguishment costs, net interest cost on net pension liability, net monetary loss arising in hyperinflationary economies, the interest element of finance lease payments and losses on derivative instruments that are not designated as hedging instruments and are recognised in profit or loss. Borrowing costs are recognised in profit or loss using the effective interest method. Borrowing costs that are directly attributable to the acquisition or construction of a qualifying asset are capitalised as part of the cost of that asset. All other borrowing costs are recognised as an expense in the Consolidated Income Statement.
Finance income comprises interest income on funds invested, certain foreign currency translation gains related to financing, net monetary gain arising in hyperinflationary economies, gains on derivative instruments that are not designated as hedging instruments and are recognised in profit or loss, dividend income and gains on the disposal of available-for-sale financial assets. Interest income is recognised as it accrues using the effective interest method. Dividend income is recognised on the date that the Group’s right to receive payment is established.

127
Strategic Report Governance FinancialsOverview
2. Summary of significant accounting policies (continued)
Income taxesThe income tax expense recognised in each financial year comprises current and deferred tax and is recognised in the Consolidated Income Statement, except to the extent that it relates to items recognised in other comprehensive income or directly in equity, in which case the related tax is similarly recognised in other comprehensive income or in equity.
Current income taxCurrent tax consists mainly of the expected tax payable or recoverable on the taxable income for the year using the applicable tax rates during the year and any adjustment to tax payable in respect of previous years.
Deferred income taxDeferred income tax is provided using the liability method, on temporary differences between the carrying amounts of assets and liabilities in the Consolidated Financial Statements and their tax bases. If the temporary difference arises from the initial recognition of an asset or liability in a transaction other than a business combination that at the time of the transaction does not affect accounting nor taxable profit or loss, it is not recognised. Deferred tax is provided on temporary differences arising on investments in subsidiaries and associates, except where the timing of the reversal of the temporary difference is controlled by the Group and it is probable that the temporary difference will not reverse in the foreseeable future. Deferred tax liabilities are not recognised if they arise from the initial recognition of goodwill.
The amount of deferred tax provided is based on the expected manner of realisation or settlement of the carrying amount of assets and liabilities, using tax rates enacted or substantively enacted at the balance sheet date. Deferred tax assets and liabilities are not subject to discounting.
A deferred tax asset is recognised only to the extent that it is probable that future taxable profits will be available against which the asset can be utilised. Deferred tax assets are reduced to the extent that it is no longer probable that the related tax benefit will be realised.
LeasesArrangements which transfer substantially all of the risks and rewards of ownership of an asset to the Group are classified as finance leases. They are capitalised at inception at the lower of the fair value of the leased asset and the present value of the minimum lease payments. Lease obligations, net of finance costs, are included in borrowings. The interest element of lease payments is expensed in the Consolidated Income Statement over the lease period so as to produce a constant periodic rate of interest. Assets acquired under finance leases are depreciated over the shorter of the useful life of the asset and the lease term.
Arrangements in which substantially all of the risks and rewards of ownership of an asset are not transferred to the Group by the lessor are classified as operating leases. Operating lease rentals, net of incentives received from the lessor, are expensed in the Consolidated Income Statement on a straight-line basis over the lease term.
Arrangements comprising transactions that do not take the legal form of a lease but convey the right to use an asset in return for payment, or a series of payments, are assessed to determine whether the arrangement contains a lease.
Retirement benefit obligationsThe Group operates both defined benefit and defined contribution pension plans throughout its operations in accordance with local conditions and practice. The defined benefit pension plans are funded by payments to separately administered funds or in certain countries, in accordance with local practices, scheme liabilities are unfunded and recognised as liabilities in the Consolidated Balance Sheet.
For defined contribution pension plans, once contributions have been paid, the Group has no further payment obligations. Contributions are recognised as an employee benefit expense as service is received from employees in the Consolidated Income Statement. Prepaid contributions are recognised as an asset only to the extent that a cash refund or a reduction in future payments is available.
The costs and liabilities of defined benefit pension plans are calculated using the projected unit credit method. Actuarial calculations are prepared by independent, professionally qualified actuaries at each balance sheet date. The present value of the defined benefit obligation is determined by discounting the estimated future cash outflows using interest rates of high-quality corporate bonds that are denominated in the currency in which the benefits will be paid, and that have terms approximating to the terms of the related obligation.
Defined benefit costs are categorised as: (1) service cost; (2) net interest expense or income; and (3) remeasurement. Service cost includes current and past service cost (which can be negative or positive) as well as gains and losses on settlements; it is included in operating profit. Past service cost is recognised at the earlier of the date when the plan amendment or curtailment occurs and the date that the Group recognises related restructuring costs. A gain or loss on settlement is recognised when the settlement occurs. Net interest is calculated by applying the discount rate to the net defined benefit asset or liability at the beginning of the year; it is included in finance costs. Remeasurement is comprised of the return on plan assets (excluding net interest) and actuarial gains and losses; it is recognised in other comprehensive income in the period in which it arises and is not subsequently reclassified to the Consolidated Income Statement.
The net surplus or deficit arising on the Group’s defined benefit pension plans, together with the liabilities associated with the unfunded plans, are shown either within non-current assets or liabilities in the Consolidated Balance Sheet. The defined benefit pension asset or liability comprises the total for each plan of the present value of the defined benefit obligation less the fair value of plan assets. Fair value of plan assets is based on market price information and in the case of published securities, it is the published bid price. Any pension asset is limited to the present value of economic benefits available in the form of refunds from the plans or reductions in future contributions. The deferred tax impact of pension plan surpluses and deficits is disclosed separately within deferred income tax assets or liabilities, as appropriate.

Smurfit Kappa Annual Report 2017128
N OT E S TO T H E CO N S O L I DAT E D F I N A N C I A L STAT E M E N TS ( CO N T I N U E D)For the Financial Year Ended 31 December 2017
2. Summary of significant accounting policies (continued)
Share-based paymentsThe Group grants equity settled share-based payments to certain employees as part of their remuneration; there are no cash-settled share-based payments. The fair value of grants is determined at the date of grant and is expensed in the Consolidated Income Statement over the vesting period with a corresponding increase in equity. Fair value incorporates the effect of market-based conditions. Non-market-based vesting conditions are only taken into account when assessing the number of awards expected to vest such that the cumulative expense recognised equates to the number of grants that actually vest. The periodic expense/credit recognised in the Consolidated Income Statement is calculated as the difference between the cumulative expense as estimated at the start and end of the period.
The cumulative expense is reversed when an employee in receipt of share options terminates service prior to completion of the vesting period or when a non-market-based performance condition is not expected to be met. No reversal of the cumulative charge is made where awards do not vest due to a market-based vesting condition.
Where the Group receives a tax deduction for share-based payments, deferred tax is provided on the basis of the difference between the market price of the underlying equity at the date of the financial statements and the exercise price of the option. As a result, the deferred tax impact will not directly correlate with the expense reported.
Proceeds received from the exercise of options, net of any directly attributable transaction costs, are credited to the share capital and share premium accounts.
Exceptional itemsThe Group has adopted an income statement format which seeks to highlight significant items within the Group results for the year. The Group believes this format is useful as it highlights one-off items, where significant, such as reorganisation and restructuring costs, profit or loss on disposal of operations, foreign exchange losses on currency devaluations, profit or loss on early extinguishment of debt, profit or loss on disposal of assets and impairment of assets. Judgement is used by the Group in assessing the particular items, which by virtue of their size and nature, are disclosed as exceptional items.
Emissions rights and obligationsAs a result of the European Union Emission Trading Scheme the Group receives free emission rights in certain countries. Rights are received annually and the Group is required to surrender rights equal to its actual emissions. A provision is only recognised when actual emissions exceed the emission rights granted. Any additional rights purchased are recognised at cost and they are not subsequently remeasured. Where excess certificates are sold to third parties, the Group recognises the consideration receivable within cost of sales in the Consolidated Income Statement.
Government grantsGovernment grants are recognised at their fair value when there is reasonable assurance that the grant will be received and the Group will comply with any related conditions. Grants that compensate the Group for expenses are offset against the related expense in the Consolidated Income Statement in the same accounting periods. Grants related to the cost of an asset are recognised in the Consolidated Income Statement over the useful life of the asset within administrative expenses.
Share capitalOrdinary shares are classified as equity. Incremental costs directly attributable to the issue of new shares or options are shown in equity as a deduction, net of tax, from the proceeds.
Own sharesOrdinary shares acquired by the Company or purchased on behalf of the Company are deducted from equity. No gain or loss is recognised in profit or loss on the purchase, sale, issue or cancellation of the Company’s ordinary shares.
Dividend distributionsDividend distributions to the Company’s shareholders are recognised as liabilities in the period in which the dividends are approved by the Company’s shareholders.
3. Significant accounting judgements, estimates and assumptionsPreparation of financial statements requires management to make judgements, estimates and assumptions that affect the reported amounts of revenues, expenses, assets and liabilities. These judgements, estimates and assumptions are subject to continuing re-evaluation and are based on historical experience and other factors, including expectations of future events that are believed to be reasonable. Actual outcomes may differ significantly from those estimates. The areas involving a higher degree of judgement or complexity, or areas where assumptions and estimates are significant are set out below.
Consolidation of structured entitiesThe Group is a party to an arrangement involving securitisation of certain of its trade receivables. The arrangement required the establishment of certain special purpose entities (‘SPEs’) which are not owned by the Group. However, the SPEs are consolidated as management consider them to be controlled by the Group. The securitised receivables and the borrowings of the SPEs are recognised in the Consolidated Balance Sheet.
The Group has established a trust which facilitates the operation of the Deferred Annual Bonus Plan. While the Group does not hold any of the equity of the trust, the Directors believe that the Group controls its activities and therefore the financial statements of the trust are included in the Consolidated Financial Statements.

129
Strategic Report Governance FinancialsOverview
3. Significant accounting judgements, estimates and assumptions (continued)
Estimated impairment of goodwill and other non-current assetsThe Group tests annually whether goodwill has suffered any impairment. The recoverable amounts of groups of CGUs have been determined based on value-in-use calculations. The principal assumptions used to determine value-in-use relate to future cash flows and the time value of money. Further information is detailed in the Goodwill and intangible assets note. Impairment tests in respect of property, plant and equipment are also performed on a CGU basis. Further information is contained in the Property, plant and equipment note.
Income taxesProvisions for taxes require judgement and estimation in interpreting tax legislation, current case law and the uncertain outcomes of tax audits and appeals. Where the final outcome of these matters differs from the amounts recognised, differences will impact the tax provisions once the outcome is known. In addition, the Group recognises deferred tax assets, mainly relating to unused tax losses, when it is probable that the assets will be recovered through future profitability and tax planning. The assessment of recoverability involves judgement.
Measurement of defined benefit obligationsThe cost of defined benefit pension plans and the present value of pension obligations are determined using actuarial valuations. These valuations involve making various assumptions that may differ significantly from actual developments in the future. The assumptions include determination of appropriate discount rates, future salary increases, inflation, mortality rates and future pension increases. Due to the complex nature of the valuations the Group employs an international network of professional actuaries to perform these valuations. The critical assumptions and estimates applied along with a sensitivity analysis are provided in the Employee benefits note.
ProvisionsThe amount recognised for a provision is management’s best estimate of the expenditure to be incurred. Provisions are remeasured at each balance sheet date based on the best estimate of the expected settlement amount. Changes to the best estimate of the settlement amount may result from changes in the amount or timing of the outflows or changes in discount rates.
Establishing lives for depreciation of property, plant and equipmentThe annual depreciation charge depends primarily on the estimated lives of each type of asset. Asset lives are reviewed annually and adjusted if necessary to reflect current thinking on remaining lives in light of technological change, prospective economic utilisation and the physical condition of the assets. Changes in asset lives could have a significant impact on depreciation charges.
Establishing lives for amortisation of intangible assetsThe amortisation charge is dependent on the estimated lives of each intangible asset. These lives are regularly reviewed and changed if necessary to reflect the expected period of consumption of future economic benefits. Changes in asset lives could have a significant impact on amortisation charges. Further details are included in the Goodwill and intangible assets note.
Fair value of derivatives and other financial instrumentsThe fair value of financial instruments that are not traded in an active market (for example, over-the-counter derivatives) is determined using valuation techniques. The Group uses its judgement to select a variety of methods and makes assumptions that are mainly based on market conditions existing at each balance sheet date. The Group uses recognised valuation techniques for various available-for-sale financial assets that are not traded in active markets. Fair value disclosures are set out in the Financial instruments note.
Measurement of share-based payment expenseThe Group operates certain share-based incentive plans which, subject to the occurrence of stated future events, grant the right to qualifying employees to shares in the Company. Estimating the number of these grants, and the periods over which it will be recognised in the Consolidated Income Statement, requires various management estimates and assumptions. Further details are provided in the Share-based payment note.
Venezuela
Exchange controlIn 2017, the Government continued to operate the DIPRO and DICOM exchange mechanisms. The Group consolidates its Venezuelan operations at the variable DICOM rate. The Group believes that DICOM is the most appropriate rate for accounting and consolidation, as it believes that this is the rate at which the Group extracts economic benefit. On this basis, in accordance with IFRS, the financial statements of the Group’s operations in Venezuela were translated at 31 December 2017 using the DICOM rate of VEF 3,345.00 per US dollar and the closing euro/US dollar rate of 1 euro = US$1.1993.
These currency exchange controls in Venezuela restrict our ability to convert amounts generated by our Venezuelan operations into US dollars, for instance for the payment of dividends.
Subsequent to the year end, the Venezuelan government implemented a reformed exchange rate system for the country. The DIPRO rate was eliminated and the government mandated that all future foreign exchange transactions be conducted at a renewed DICOM rate. The first auction under the new system was held on 1 February 2018 and the DICOM rate moved to VEF 25,000 per US dollar. A number of subsequent auctions were held up to 22 March 2018 and the DICOM rate closed at VEF 43,980 per US dollar.
Price controlIn 2014, the Venezuelan government decreed that companies could only seek price increases if they had clearance that their margins are within certain guidelines. The Group’s Venezuelan operations are operating within these guidelines. There is a risk that if the Group’s Venezuelan operations cannot implement price increases in a timely manner to cover the cost of their increasing raw material and labour costs as a result of inflation and the devaluation of currency it would have an adverse effect on its results of operations. In this volatile environment the Group continues to closely monitor developments, assess evolving business risks and actively manage its investments.

Smurfit Kappa Annual Report 2017130
N OT E S TO T H E CO N S O L I DAT E D F I N A N C I A L STAT E M E N TS ( CO N T I N U E D)For the Financial Year Ended 31 December 2017
3. Significant accounting judgements, estimates and assumptions (continued)Operating conditionsThe Group’s Venezuelan operations have mitigated to some extent the loss of revenue due to the drop in corrugated volumes in the country by exporting paper to the Group’s operations in other Latin American countries. This export of paper is subject to the availability of local raw materials to produce the paper, the quality of the paper being maintained to a satisfactory standard for our end markets and the renewal of an export licence by the Government every six months. There is a risk that if the quality of paper materially deteriorated due to a lack of raw materials or if the Group were unable to renew the export licence it would have an adverse effect on its results of operations.
ControlThe political climate in Venezuela continues to be unpredictable and the operating environment is severely restricted and difficult. The nationalisation of foreign owned companies or assets by the Venezuelan government remains a risk. Market value compensation would be either negotiated or arbitrated under applicable laws or treaties in these cases. However, the amount and timing of such compensation is necessarily uncertain.
The Group continues to control operations in Venezuela and, as a result, continues to consolidate all of the results and net assets of these operations at year-end in accordance with the requirements of IFRS 10, Consolidated Financial Statements.
In 2017, the Group’s operations in Venezuela represented approximately 2% (2016: 3%) of its EBITDA(1), 3% (2016: 2%) of its total assets and 5% (2016: 4%) of its net assets. In addition, cumulative foreign translation losses arising on its net investment in these operations amounting to €1,081 million (2016: €987 million) are included in the foreign currency translation reserve.
HyperinflationVenezuela was deemed hyperinflationary under IFRS in 2009. As a result, the Group has applied the hyperinflationary accounting requirements of IAS 29 to its Venezuelan operations with effect from 1 January 2009. To adjust income and expenses for the effects of hyperinflation, IAS 29 requires restatement (indexation) of income and expenses from the start of the reporting period. It also requires restatement of non-monetary assets, such as property, plant and equipment and inventories, from the date they were first recognised. The gain or loss on the net monetary position is included in finance income or costs. Comparative amounts are not restated. The restated financial statements are translated to euro at the closing rate, average rates are not used. Differences arising on translation to euro are recognised in other comprehensive income.
In 2017 and 2016 management engaged an independent expert to determine an estimate of the annual inflation rate. The estimated level of inflation for the year ended 31 December 2017 was 971% (2016: 333%).
As a result of the entries recorded in respect of hyperinflationary accounting under IFRS, the Consolidated Income Statement is impacted as follows: Revenue €30 million increase (2016: €62 million increase), EBITDA €13 million decrease (2016: €6 million increase) and profit after taxation €47 million decrease (2016: €29 million decrease). In 2017, a net monetary loss of €24 million (2016: €4 million net monetary gain) was recorded in the Consolidated Income Statement. The impact on the Group’s net assets and its total equity is an increase of €197 million (2016: €64 million increase).
The Venezuelan economy remains depressed and the political situation unpredictable, increasing the risk of future inflationary pressures and currency devaluations. The effect of high inflation without a corresponding devaluation of the exchange rate would result in a net monetary loss which may distort some of the Group’s key metrics. Were the exchange rate to devalue in line with inflation it would have an adverse effect on our results of operations in Venezuela. The Group will continue to monitor events as they unfold.
4. Segmental reportingThe Group has determined operating segments based on the manner in which reports are reviewed by the Chief Operating Decision Maker (‘CODM’). The CODM is determined to be the executive management team responsible for assessing performance, allocating resources and making strategic decisions. The Group has identified two operating segments: 1) Europe and 2) The Americas.
The Europe segment is highly integrated. It includes a system of mills and plants that primarily produces a full line of containerboard that is converted into corrugated containers. The Americas segment comprises all forestry, paper, corrugated and folding carton activities in a number of Latin American countries and the United States. Inter-segment revenue is not material. No operating segments have been aggregated for disclosure purposes.
Segment results, assets and liabilities include items directly attributable to a segment as well as those that can be allocated on a reasonable basis. Segment capital expenditure is the total cost incurred during the year to acquire segment assets that are expected to be used for more than one year. Additionally, there are central costs which represent corporate governance costs, including executive costs, and costs of the Group’s legal, company secretarial, pension administration, tax, treasury and controlling functions and other administrative costs.
Segment profit is measured based on EBITDA. Segment assets consist primarily of property, plant and equipment, biological assets, goodwill and intangible assets, inventories, trade and other receivables, deferred income tax assets and cash and cash equivalents. Group centre assets are comprised primarily of available-for-sale financial assets, derivative financial assets, deferred income tax assets, cash and cash equivalents and restricted cash. Segment liabilities are principally comprised of operating liabilities, deferred income tax liabilities and employee benefits. Group centre liabilities are comprised of items such as borrowings, employee benefits, derivative financial instruments, deferred income tax liabilities and certain provisions.
Capital expenditure comprises additions to property, plant and equipment (Note 12), goodwill and intangible assets (Note 13) and biological assets (Note 16), including additions resulting from acquisitions through business combinations (Note 32).
Inter-segment transfers or transactions are entered into under normal commercial terms and conditions that would also be available to unrelated third parties. Inter-segment transactions are not material.
(1) EBITDA is earnings before exceptional items, share-based payment expense, share of associates’ profit (after tax), net finance costs, income tax expense, depreciation and depletion (net) and intangible assets amortisation. A reconciliation of EBITDA to profit for the financial year is set out in Note 4.

131
Strategic Report Governance FinancialsOverview
4. Segmental reporting (continued)
EuropeThe
Americas Total EuropeThe
Americas Total2017 2017 2017 2016 2016 2016
Revenue and results €m €m €m €m €m €mRevenue 6,404 2,158 8,562 6,146 2,013 8,159
EBITDA before exceptional items 955 311 1,266 928 339 1,267
Segment exceptional items - (12) (12) - (15) (15)
EBITDA after exceptional items 955 299 1,254 928 324 1,252
Unallocated centre costs (26) (31)
Share-based payment expense (24) (13)
Depreciation and depletion (net)(1) (356) (353)
Amortisation (40) (40)
Impairment of assets (11) -
Finance costs (250) (215)
Finance income 29 52
Share of associates’ profit (after tax) - 2
Profit before income tax 576 654
Income tax expense (153) (196)
Profit for the financial year 423 458
AssetsSegment assets 6,348 2,142 8,490 6,195 2,196 8,391
Investment in associates 1 12 13 2 15 17
Group centre assets 502 456
Total assets 9,005 8,864
Liabilities Segment liabilities 2,444 467 2,911 2,371 507 2,878
Group centre liabilities 3,435 3,483
Total liabilities 6,346 6,361
Other segmental disclosuresCapital expenditure, including additions to goodwill, intangible assets and biological assets:
Segment expenditure 358 133 491 366 193 559
Group centre expenditure 1 1
Total expenditure 492 560
Depreciation and depletion (net):
Segment depreciation and depletion (net) 270 85 355 272 80 352
Group centre depreciation and depletion (net) 1 1
Total depreciation and depletion (net) 356 353
Amortisation:
Segment amortisation 14 25 39 14 25 39
Group centre amortisation 1 1
Total amortisation 40 40
Other significant non-cash charges:
Impairment of assets included in cost of sales 7 4 11 - - -
Total other significant non-cash charges 11 -
(1) Depreciation and depletion is net of fair value adjustments.

Smurfit Kappa Annual Report 2017132
N OT E S TO T H E CO N S O L I DAT E D F I N A N C I A L STAT E M E N TS ( CO N T I N U E D)For the Financial Year Ended 31 December 2017
4. Segmental reporting (continued)
Information about geographical areasThe following is a geographical analysis presented in accordance with IFRS 8, which requires disclosure of information about country of domicile (Ireland) and countries with material revenue and non-current assets.
Revenue RevenueNon-current
assetsNon-current
assets2017 2016 2017 2016
€m €m €m €mIreland 116 114 53 52
France 985 965 387 377
Germany 1,292 1,266 398 416
Mexico 769 711 163 158
United Kingdom 723 721 342 344
Other 4,677 4,382 2,165 2,225
8,562 8,159 3,508 3,572
Revenue is derived almost entirely from the sale of goods and is disclosed based on the location of production. No one customer represents greater than 10% of Group revenues. Non-current assets include marketing and customer-related intangible assets, software, investment in associates, biological assets and property, plant and equipment and are disclosed based on their location.
While the Group does not allocate goodwill by geographic area, if it were to ascribe goodwill to Ireland we estimate the amount would be less than 3% (2016: less than 3%) of the total goodwill of the Group of €2,284 million (2016: €2,298 million).
5. Cost and income analysis
2017 2016€m €m
Expenses by function:Cost of sales 6,008 5,690
Distribution costs 667 636
Administrative expenses 1,078 1,003
Other operating expenses 12 15
7,765 7,344
Exceptional items included in operating profit:Impairment of assets 11 -
Reorganisation and restructuring costs 12 15
23 15
Exceptional items charged within operating profit in 2017 amounted to €23 million. These related to impairment losses of €11 million for property, plant and equipment in one of our European mills and a corrugated plant in the Americas. The remaining €12 million relates to reorganisation and restructuring costs in the Americas.
Exceptional items charged within operating profit in 2016 amounted to €15 million. These related to reorganisation and restructuring costs in the Americas.

133
Strategic Report Governance FinancialsOverview
5. Cost and income analysis (continued)2017 2016
€m €mExpenses by nature:Raw materials and consumables 3,162 2,959Employee benefit expense excluding redundancy 2,034 1,928Energy 413 403Maintenance and repairs 427 404Transportation and storage costs 661 634Depreciation, amortisation and depletion 396 393Impairment of assets 11 -Reorganisation and restructuring costs 24 21Operating lease rentals 107 98Foreign exchange gains and losses (9) -Other expenses 539 504Total 7,765 7,344
Included within the expenses by nature above are research and development expenses of €7 million (2016: €7 million). Research and development expenses are included within administrative expenses in the Consolidated Income Statement.
Directors’ remuneration is shown in the Remuneration Report and in Note 31.
Auditors’ remuneration
PwC IrelandOther PwC
network firms Total PwC IrelandOther PwC
network firms Total2017 2017 2017 2016 2016 2016
€m €m €m €m €m €mAudit of entity financial statements 2.5 6.3 8.8 2.5 6.5 9.0
Other assurance services 0.2 0.2 0.4 0.7 - 0.7
Tax advisory services 0.2 - 0.2 0.2 0.1 0.3
Other non-audit services - 0.2 0.2 0.1 0.1 0.2
2.9 6.7 9.6 3.5 6.7 10.2
The audit fee for the Parent Company was €50,000 (2016: €50,000) which is payable to PwC, the Statutory Auditor.
6. Share of associates’ profit after tax2017 2016
€m €mProfit before tax - 3
Income tax expense - (1)
Profit after tax - 2
7. Employee benefit expense2017
Number2016
NumberAverage number of persons employed by the Group by geographical area (full time equivalents):Europe 28,441 27,809The Americas 17,909 17,715
46,350 45,524
2017 2016Note €m €m
The employee benefit expense comprises:Wages and salaries 1,596 1,552Social insurance costs 329 305Share-based payment expense 24 13Defined benefit expense 30 6Defined contribution plan expense 55 52Reorganisation and restructuring costs – redundancy (1) 12 6Charged to operating profit – pre-exceptional 2,046 1,934Charged to operating profit – exceptional - restructuring 5 15Charged to finance costs 25 24 23Actuarial loss on pension schemes recognised in other comprehensive income 25 9 148Total employee benefit expense 2,084 2,120
(1) These non-exceptional expenses are arising in respect of individually immaterial restructurings across the Group.

Smurfit Kappa Annual Report 2017134
N OT E S TO T H E CO N S O L I DAT E D F I N A N C I A L STAT E M E N TS ( CO N T I N U E D)For the Financial Year Ended 31 December 2017
8. Finance costs and income
Note 2017 2016€m €m
Finance costs: Interest payable on bank loans and overdrafts 52 56
Interest payable on finance leases and hire purchase contracts 1 -
Interest payable on other borrowings 119 106
Exceptional finance costs associated with debt restructuring 2 -
Unwinding discount element of provisions 27 1 1
Foreign currency translation loss on debt 27 12
Fair value loss on derivatives not designated as hedges - 17
Net interest cost on net pension liability 25 24 23
Net monetary loss – hyperinflation 24 -
Total finance costs 250 215
Finance income: Other interest receivable (3) (3)
Foreign currency translation gain on debt (14) (28)
Exceptional gain on sale of investment - (12)
Fair value gain on derivatives not designated as hedges (12) (5)
Net monetary gain – hyperinflation - (4)
Total finance income (29) (52)
Net finance costs 221 163
Exceptional finance costs of €2 million arose in the first quarter of 2017 and represented the accelerated amortisation of the issue costs relating to the debt within our senior credit facility which was paid down with the proceeds of January’s €500 million bond issue. The exceptional finance income in 2016 related to the gain of €12 million on the sale of our shareholding in the Swedish company, IL Recycling.
9. Income tax expenseIncome tax expense recognised in the Consolidated Income Statement
2017 2016€m €m
Current tax:
Europe 143 87
The Americas 48 69
191 156
Deferred tax (38) 40
Income tax expense 153 196
Current tax is analysed as follows: Ireland 20 14
Foreign 171 142
191 156
The income tax expense in 2017 is €43 million lower than in the comparable period in 2016.
The current tax expense has increased by €35 million compared to the prior period. In Europe the current tax expense is €56 million higher. The Group’s historic tax losses have now been fully utilised in a number of countries and the impact of this, together with other timing items, is included in the increased current tax expense in 2017. In the Americas, the current tax expense is €21 million lower and this reflects the tax effects of lower profitability.
There is a deferred tax credit of €38 million in 2017 compared to a deferred tax charge of €40 million in 2016. The movement in deferred tax includes the effects of the reversal of timing differences on which deferred tax liabilities were previously recognised, other credits and the use and recognition of tax losses.
The income tax expense includes a €6 million tax credit in respect of exceptional items compared to a €3 million credit in 2016.

135
Strategic Report Governance FinancialsOverview
9. Income tax expense (continued)
Reconciliation of the effective tax rateThe following table relates the applicable Republic of Ireland statutory tax rate to the effective tax rate (current and deferred) of the Group:
2017 2016€m €m
Profit before income tax 576 654
Profit before income tax multiplied by the standard rate of tax of 12.5% (2016: 12.5%) 72 82
Effects of:
Income subject to different rates of tax 78 75
Other items 4 47
Adjustment to prior period tax 1 (4)
Effect of previously unrecognised losses (2) (4)
153 196
Income tax recognised within equity
2017 2016€m €m
Recognised in the Consolidated Statement of Comprehensive Income:
Arising on defined benefit pension plans (1) (23)
Total recognised in the Consolidated Statement of Comprehensive Income (1) (23)
Arising on hyperinflation 14 9
Total recognised within equity 13 (14)
Factors that may affect the future tax expense and other disclosure requirements
Unremitted earnings in subsidiaries and associatesThe Group has not made a provision for deferred tax in relation to temporary differences applicable to investments in subsidiaries on the basis that the Group can control the timing of the reversal of the temporary difference and it is probable that the temporary difference will not reverse in the foreseeable future. The aggregate amount of this temporary timing difference is approximately €574 million (2016: €449 million). The Group is not committed to remit earnings from its subsidiaries but due to the absence of control in the context of associates (significant influence by definition) deferred tax liabilities are recognised where necessary in respect of the Group’s investment in these entities.
The total tax expense in future periods will be affected by changes to the corporation tax rates in force and legislative changes that broaden the tax base or introduce other minimum taxes in the countries in which the Group operates. The tax expense may also be impacted by changes in the geographical mix of earnings. The current tax expense may also be impacted, inter alia, by changes in the excess of tax depreciation (capital allowances) over accounting depreciation, the use of tax credits and the crystallisation of unrecognised deferred tax assets. There are no income tax consequences for the Company in respect of dividends which were proposed prior to the issuance of the Consolidated Financial Statements for which a liability has not been recognised.

Smurfit Kappa Annual Report 2017136
N OT E S TO T H E CO N S O L I DAT E D F I N A N C I A L STAT E M E N TS ( CO N T I N U E D)For the Financial Year Ended 31 December 2017
10. Earnings per share
BasicBasic earnings per share is calculated by dividing the profit attributable to owners of the parent by the weighted average number of ordinary shares in issue during the year less own shares.
2017 2016
Profit attributable to owners of the parent (€ million) 417 444
Weighted average number of ordinary shares in issue (million) 235 235
Basic earnings per share (cent) 177.2 189.4
DilutedDiluted earnings per share is calculated by adjusting the weighted average number of ordinary shares outstanding to assume conversion of all dilutive potential ordinary shares. These comprise convertible shares issued under the Share Incentive Plan, which were based on performance and the passage of time, deferred shares held in trust, which are based on the passage of time, and matching shares, which are performance-based in addition to the passage of time. Both deferred shares held in trust and matching shares are issued under the Deferred Annual Bonus Plan. Where the conditions governing exercisability of these shares have been satisfied as at the end of the reporting period, they are included in the computation of diluted earnings per ordinary share.
2017 2016
Profit attributable to owners of the parent (€ million) 417 444
Weighted average number of ordinary shares in issue (million) 235 235
Potential dilutive ordinary shares assumed (million) 2 2
Diluted weighted average ordinary shares (million) 237 237
Diluted earnings per share (cent) 175.8 187.5
Pre-exceptional 2017 2016
Profit attributable to owners of the parent (€ million) 417 444
Exceptional items included in profit before income tax (€ million) 25 3
Income tax on exceptional items (€ million) (6) (3)
Pre-exceptional profit attributable to owners of the parent (€ million) 436 444
Weighted average number of ordinary shares in issue (million) 235 235
Pre-exceptional basic earnings per share (cent) 185.3 189.4
Diluted weighted average ordinary shares (million) 237 237
Pre-exceptional diluted earnings per share (cent) 183.8 187.6
11. DividendsDuring the year, the final dividend for 2016 of 57.6 cent per share was paid to the holders of ordinary shares. In October, an interim dividend for 2017 of 23.1 cent per share was paid to the holders of ordinary shares.
The Board is recommending a final dividend of approximately 64.5 cent per share for 2017 subject to the approval of the shareholders at the AGM. It is proposed to pay the final dividend on 11 May 2018 to all ordinary shareholders on the share register at the close of business on 13 April 2018. The final dividend and interim dividends are paid in May and October in each year.

137
Strategic Report Governance FinancialsOverview
12. Property, plant and equipment
Land andbuildings
Plant andequipment Total
€m €m €mFinancial year ended 31 December 2016Opening net book amount 988 2,115 3,103
Reclassifications 42 (43) (1)
Additions 11 465 476
Acquisitions 10 56 66
Depreciation charge (48) (309) (357)
Retirements and disposals (1) (11) (12)
Hyperinflation adjustment 25 21 46
Foreign currency translation adjustment (23) (37) (60)
At 31 December 2016 1,004 2,257 3,261
At 31 December 2016Cost or deemed cost 1,562 5,117 6,679
Accumulated depreciation and impairment losses (558) (2,860) (3,418)
Net book amount 1,004 2,257 3,261
Financial year ended 31 December 2017Opening net book amount 1,004 2,257 3,261Reclassifications 56 (57) (1)Additions 1 401 402Acquisitions 23 15 38Depreciation charge (49) (311) (360)Impairments - (11) (11)Retirements and disposals (3) (1) (4)Hyperinflation adjustment 42 34 76Foreign currency translation adjustment (51) (108) (159)At 31 December 2017 1,023 2,219 3,242
At 31 December 2017Cost or deemed cost 1,617 5,235 6,852Accumulated depreciation and impairment losses (594) (3,016) (3,610)Net book amount 1,023 2,219 3,242

Smurfit Kappa Annual Report 2017138
N OT E S TO T H E CO N S O L I DAT E D F I N A N C I A L STAT E M E N TS ( CO N T I N U E D)For the Financial Year Ended 31 December 2017
12. Property, plant and equipment (continued)
Land and buildingsIncluded in land and buildings is an amount for land of €356 million (2016: €350 million).
Construction in progressIncluded in land and buildings and plant and equipment are amounts of €21 million (2016: €24 million) and €195 million (2016: €221 million) respectively, for construction in progress.
Assets pledged as security Assets with a carrying value of €26 million (2016: €36 million) are pledged as security for loans held by the Group.
Capitalised leased assetsIncluded in the net book amount of property, plant and equipment is an amount for capitalised leased assets of €13 million (2016: €14 million). The depreciation charge for capitalised leased assets was €2 million (2016: €1 million) and the related finance charges amounted to €1 million (2016: nil). The net carrying amount by class of assets at each balance sheet date is as follows:
2017 2016€m €m
Plant and equipment 3 2
Buildings 10 12
13 14
Capital commitmentsThe following capital commitments in relation to property, plant and equipment were authorised by the Directors, but have not been provided for in the Consolidated Financial Statements:
2017 2016€m €m
Contracted for 206 134
Not contracted for 324 191
530 325
ImpairmentsImpairment tests for items of property, plant and equipment are performed on a cash-generating unit basis when impairment triggers arise. In 2017, the Group recorded an impairment charge of €11 million in one of our European mills and a corrugated plant in the Americas due to difficult trading conditions. The recoverable amounts of property, plant and equipment are based on the higher of fair value less costs to sell and value-in-use. Value-in-use calculations are based on cash flow projections and discount rates for items of property, plant and equipment. Impairment charges are recognised within cost of sales in the Consolidated Income Statement.
Capitalised borrowing costsIn 2017, the Group capitalised borrowing costs of €3 million (2016: €2 million) on qualifying assets. Borrowing costs were capitalised at an average rate of 4.2% (2016: 4.1%).

139
Strategic Report Governance FinancialsOverview
13. Goodwill and intangible assets
Intangible assets
GoodwillMarketing
relatedCustomer
relatedSoftware
assets Total€m €m €m €m €m
Financial year ended 31 December 2016Opening net book amount 2,328 19 124 37 2,508
Additions - - 2 11 13
Acquisitions (30) (4) 29 - (5)
Amortisation charge - (2) (26) (12) (40)
Reclassifications - - - (1) (1)
Hyperinflation adjustment 25 - - 2 27
Foreign currency translation adjustment (25) (1) 3 (1) (24)
At 31 December 2016 2,298 12 132 36 2,478
At 31 December 2016Cost or deemed cost 2,488 17 197 162 2,864
Accumulated amortisation and impairment losses (190) (5) (65) (126) (386)
Net book amount 2,298 12 132 36 2,478
Financial year ended 31 December 2017Opening net book amount 2,298 12 132 36 2,478Additions - - 3 13 16Acquisitions 22 - 2 - 24Amortisation charge - (2) (25) (13) (40)Hyperinflation adjustment 42 - - - 42Foreign currency translation adjustment (78) (1) (13) (1) (93)At 31 December 2017 2,284 9 99 35 2,427
At 31 December 2017Cost or deemed cost 2,473 16 180 171 2,840Accumulated amortisation and impairment losses (189) (7) (81) (136) (413)Net book amount 2,284 9 99 35 2,427
The useful lives of intangible assets other than goodwill are finite and range from two to ten years. Amortisation is recognised as an expense within cost of sales and administrative expenses in the Consolidated Income Statement.
Marketing related intangible assets relate mainly to trade names which arise from business combinations and are amortised over their estimated useful lives of seven to ten years. Customer related intangible assets relate mainly to customer relationships which arise from business combinations. They are amortised over their estimated useful lives of two to ten years. Software assets relate to computer software, other than software for items of machinery that cannot operate without it; such software is regarded as an integral part of the related hardware and is classified as property, plant and equipment. Computer software assets have estimated useful lives of three to five years for amortisation purposes.
In 2017, goodwill of €22 million arose on the acquisition of Soyuz in Russia and Chatziioannou in Greece (Note 32). In 2016, goodwill of €20 million arose on the acquisition of Sound, Corrugated Professionals, Empire and Scope Packaging in the United States and Saxon Packaging in the United Kingdom. This was offset by a fair value adjustment of €50 million which related principally to Inpa and Paema, the two businesses acquired in Brazil in 2015.
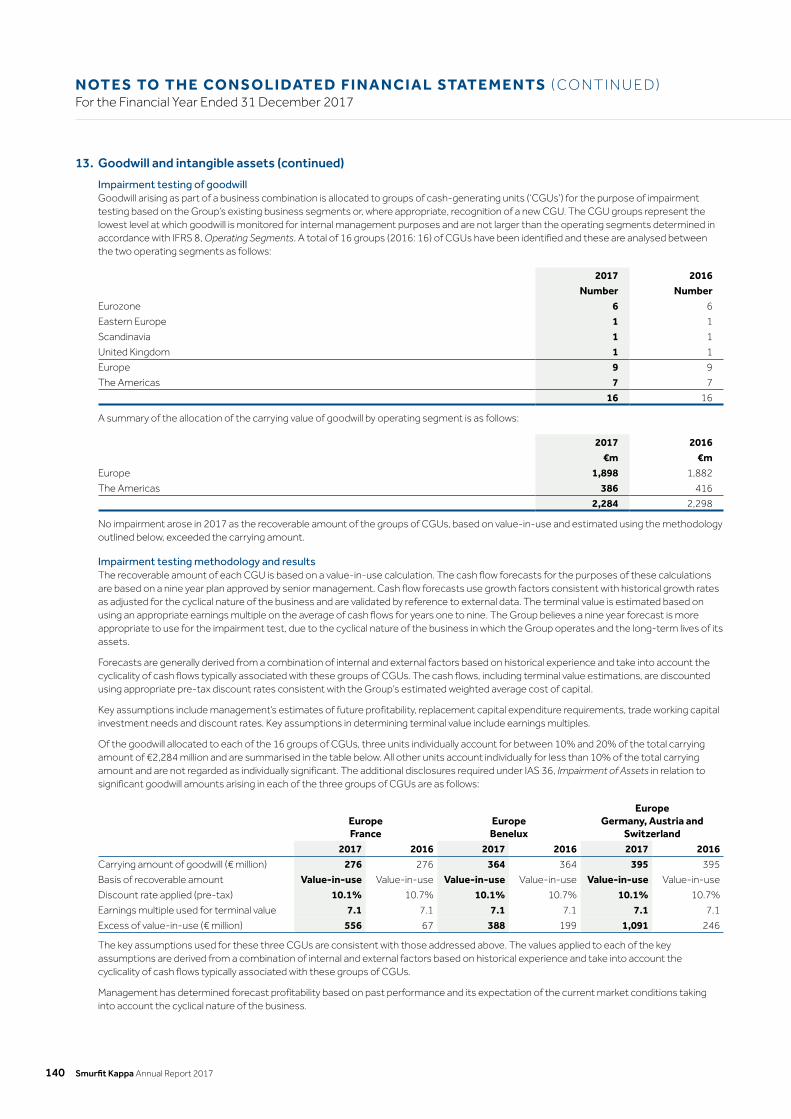
Smurfit Kappa Annual Report 2017140
N OT E S TO T H E CO N S O L I DAT E D F I N A N C I A L STAT E M E N TS ( CO N T I N U E D)For the Financial Year Ended 31 December 2017
13. Goodwill and intangible assets (continued)
Impairment testing of goodwillGoodwill arising as part of a business combination is allocated to groups of cash-generating units (‘CGUs’) for the purpose of impairment testing based on the Group’s existing business segments or, where appropriate, recognition of a new CGU. The CGU groups represent the lowest level at which goodwill is monitored for internal management purposes and are not larger than the operating segments determined in accordance with IFRS 8, Operating Segments. A total of 16 groups (2016: 16) of CGUs have been identified and these are analysed between the two operating segments as follows:
2017 2016Number Number
Eurozone 6 6
Eastern Europe 1 1
Scandinavia 1 1
United Kingdom 1 1
Europe 9 9
The Americas 7 7
16 16
A summary of the allocation of the carrying value of goodwill by operating segment is as follows:
2017 2016€m €m
Europe 1,898 1,882
The Americas 386 416
2,284 2,298
No impairment arose in 2017 as the recoverable amount of the groups of CGUs, based on value-in-use and estimated using the methodology outlined below, exceeded the carrying amount.
Impairment testing methodology and resultsThe recoverable amount of each CGU is based on a value-in-use calculation. The cash flow forecasts for the purposes of these calculations are based on a nine year plan approved by senior management. Cash flow forecasts use growth factors consistent with historical growth rates as adjusted for the cyclical nature of the business and are validated by reference to external data. The terminal value is estimated based on using an appropriate earnings multiple on the average of cash flows for years one to nine. The Group believes a nine year forecast is more appropriate to use for the impairment test, due to the cyclical nature of the business in which the Group operates and the long-term lives of its assets.
Forecasts are generally derived from a combination of internal and external factors based on historical experience and take into account the cyclicality of cash flows typically associated with these groups of CGUs. The cash flows, including terminal value estimations, are discounted using appropriate pre-tax discount rates consistent with the Group’s estimated weighted average cost of capital.
Key assumptions include management’s estimates of future profitability, replacement capital expenditure requirements, trade working capital investment needs and discount rates. Key assumptions in determining terminal value include earnings multiples.
Of the goodwill allocated to each of the 16 groups of CGUs, three units individually account for between 10% and 20% of the total carrying amount of €2,284 million and are summarised in the table below. All other units account individually for less than 10% of the total carrying amount and are not regarded as individually significant. The additional disclosures required under IAS 36, Impairment of Assets in relation to significant goodwill amounts arising in each of the three groups of CGUs are as follows:
EuropeFrance
EuropeBenelux
EuropeGermany, Austria and
Switzerland2017 2016 2017 2016 2017 2016
Carrying amount of goodwill (€ million) 276 276 364 364 395 395
Basis of recoverable amount Value-in-use Value-in-use Value-in-use Value-in-use Value-in-use Value-in-use
Discount rate applied (pre-tax) 10.1% 10.7% 10.1% 10.7% 10.1% 10.7%
Earnings multiple used for terminal value 7.1 7.1 7.1 7.1 7.1 7.1
Excess of value-in-use (€ million) 556 67 388 199 1,091 246
The key assumptions used for these three CGUs are consistent with those addressed above. The values applied to each of the key assumptions are derived from a combination of internal and external factors based on historical experience and take into account the cyclicality of cash flows typically associated with these groups of CGUs.
Management has determined forecast profitability based on past performance and its expectation of the current market conditions taking into account the cyclical nature of the business.

141
Strategic Report Governance FinancialsOverview
13. Goodwill and intangible assets (continued)The table below identifies the amounts by which each of the key assumptions must change in order for the recoverable amount to be equal to the carrying amount of the three CGUs identified as individually significant.
EuropeFrance
EuropeBenelux
EuropeGermany, Austria and
SwitzerlandIncrease in pre-tax discount rate 12.1 percentage points 9.2 percentage points 16.1 percentage pointsReduction in terminal value multiple 6.0 5.0 7.2Reduction in EBITDA 38% 32% 45%
The recoverable amount of the Brazil CGU is estimated to exceed the carrying amount of the CGU at 31 December 2017 by €22 million (2016: nil). The goodwill relating to our operations in Brazil represents approximately 3% of the Group’s total goodwill. Brazil was acquired in late 2015 and headroom was tight in 2016 due to a challenging first year of operations. The performance of Brazil improved during 2017, however, the headroom remains limited. It will continue to be monitored throughout 2018.
The table below identifies the amounts by which each of the key assumptions must change in order for the recoverable amount to be equal to the carrying amount for Brazil.
2017Increase in pre-tax discount rate 1.6 percentage pointsReduction in terminal value multiple 1.1Reduction in EBITDA 7%
The Directors and management have considered and assessed reasonably possible changes for other key assumptions and have not identified any instances that could cause the carrying amount of the Brazil CGU to exceed its recoverable amount.
For the other CGUs, any reasonable movement in the assumptions used in the impairment test would not result in an impairment.
The Group recognises that it is exposed to greater business risks in Venezuela than in some other countries. The goodwill relating to our operations in Venezuela represents approximately 2% of the Group’s total goodwill. The Group takes account of country risks in its impairment calculation.
14. Financial assets
Available-for-sale financial assets – Group
Listed (1) Unlisted Total€m €m €m
At 31 December 2016 1 20 21At 31 December 2017 1 20 21
(1) Listed on a recognised stock exchange
The Group follows the guidance of IAS 39 to determine when an available-for-sale financial asset is impaired. This determination requires significant judgement. In making this judgement, the Group evaluates, among other things, the duration and extent to which the fair value of an investment is less than cost, the financial health of and near-term business outlook for the investee, including factors such as industry and sector performance, and operational and financing cash flows.
At 31 December 2017, there are available-for-sale financial assets amounting to €10 million on which impairments have been recorded in prior years.
Investment in subsidiaries – Company
2017 2016€m €m
At 1 January 2,055 2,055
Capital contribution 12 -
At 31 December 2,067 2,055
15. Investment in associates
2017 2016€m €m
At 1 January 17 17
Share of profit for the financial year - 2
Dividends received from associates (1) (1)
Disposals (1) -
Foreign currency translation adjustment (2) (1)
At 31 December 13 17

Smurfit Kappa Annual Report 2017142
N OT E S TO T H E CO N S O L I DAT E D F I N A N C I A L STAT E M E N TS ( CO N T I N U E D)For the Financial Year Ended 31 December 2017
16. Biological assets
2017 2016€m €m
At 1 January 124 106
Increases due to new plantations 12 10
Harvested timber transferred to inventories (12) (10)
Change in fair value less estimated costs to sell 19 18
Foreign currency translation adjustment (22) -
At 31 December 121 124
Current 11 10
Non-current 110 114
At 31 December 121 124
Approximate harvest by volume (tonnes ‘000) 1,105 921
At 31 December 2017, the Group’s biological assets consist of 103,000 (2016: 103,000) hectares of forest plantations in Colombia and Venezuela which are held for the production of paper and packaging products or sale to third parties. These plantations provide the Group’s mills in these regions with a significant proportion of their total wood fibre needs.
The Group’s biological assets at 31 December 2017 are measured at fair value and have been categorised within level 2 of the fair value hierarchy. There were no transfers between any levels during the year. Level 2 fair values of forest plantations have been derived using the valuation techniques outlined in the accounting policy note for biological assets.
The Group is exposed to a number of risks related to its plantations:
Political risks in VenezuelaThe risk of nationalisation of foreign owned companies and assets by the Venezuelan government is disclosed in Note 3.
Regulatory and environmental risksThe Group is subject to laws and regulations in various countries in which it operates. The Group has established environmental policies and procedures aimed at compliance with local environmental and other laws. Management performs regular reviews to identify environmental risks and to ensure that the systems in place are adequate to manage those risks.
Supply and demand riskThe Group is exposed to risks arising from market fluctuations in the price and sales volume of similar wood. Where possible the Group manages this risk by aligning its harvest volume to demand for its manufactured products. Management performs regular industry trend analysis to ensure that the Group’s pricing structure is in line with the market and to ensure that projected harvest volumes are consistent with the expected demand.
Climate and other risksThe Group’s forests are exposed to the risk of damage from climatic changes, diseases, fires and other natural forces. The Group has extensive processes in place aimed at monitoring and mitigating those risks, including regular forest health inspections and industry pest and disease surveys.

143
Strategic Report Governance FinancialsOverview
17. Deferred tax assets and liabilitiesDeferred tax assets and liabilities are offset where there is a legally enforceable right to offset current tax assets and liabilities and where they relate to income taxes levied by the same tax authority on either a taxable entity or different taxable entities where their intention is to settle the balances on a net basis. This is set out below:
2017 2016€m €m
Deferred tax assets 460 416
Deferred tax assets/liabilities available for offset (260) (226)
200 190
Deferred tax liabilities 408 409
Deferred tax assets/liabilities available for offset (260) (226)
148 183
Deferred tax assets have been recognised in respect of deductible temporary differences to the extent that it is probable that taxable profit will be available against which the deductible temporary difference can be utilised.
Deferred tax assets have been recognised in respect of tax losses available for carry forward when the Group considers it is probable that future taxable profit will be available against which the unused tax losses can be utilised. Where the Group considers that the recovery of such losses is not probable no asset is recognised.
The movement in deferred tax during the year was as follows:
2017 2016Note €m €m
At 1 January – net asset 7 21
Movement recognised in the Consolidated Income Statement 9 38 (40)
Movement recognised in the Consolidated Statement of Comprehensive Income 9 1 23
Acquisitions and disposals (5) 6
Transfer between current and deferred tax - 1
Hyperinflation adjustment – recognised in equity 9 (14) (9)
Foreign currency translation adjustment 25 5
At 31 December – net asset 52 7
The movements in deferred tax assets and liabilities during the year, without taking into consideration the offsetting of balances within the same jurisdiction were as follows:
Retirementbenefit
obligations Tax lossesDerivativefair values Other Total
€m €m €m €m €mDeferred tax assetsAt 1 January 2016 110 192 2 145 449
Reclassifications - - - (2) (2)
Recognised in the Consolidated Income Statement (14) (44) - 8 (50)
Recognised in the Consolidated Statement of Comprehensive Income 23 - - - 23
Acquisitions and disposals - - - 6 6
Foreign currency translation adjustment (3) - - (7) (10)
At 31 December 2016 116 148 2 150 416Recognised in the Consolidated Income Statement (10) (15) - 87 62Recognised in the Consolidated Statement of Comprehensive Income 1 - - - 1Foreign currency translation adjustment (2) (2) - (15) (19)At 31 December 2017 105 131 2 222 460

Smurfit Kappa Annual Report 2017144
N OT E S TO T H E CO N S O L I DAT E D F I N A N C I A L STAT E M E N TS ( CO N T I N U E D)For the Financial Year Ended 31 December 2017
17. Deferred tax assets and liabilities (continued)
Acceleratedtax
depreciation
Intangibleassets
fair values
Biologicalassets fair
values Debtcosts Other Total
€m €m €m €m €m €mDeferred tax liabilitiesAt 1 January 2016 315 26 5 1 81 428
Reclassifications - - - - (3) (3)
Recognised in the Consolidated Income Statement 4 (3) - (1) (10) (10)
Recognised in equity - - - - 9 9
Foreign currency translation adjustment - - - - (15) (15)
At 31 December 2016 319 23 5 - 62 409Recognised in the Consolidated Income Statement (44) (11) (1) - 80 24Recognised in equity - - - - 14 14Acquisitions and disposals 5 - - - - 5Foreign currency translation adjustment - - - - (44) (44)At 31 December 2017 280 12 4 - 112 408
Deferred tax assets have not been recognised in respect of the following (tax effects):
2017 2016€m €m
Tax losses 13 15
Deferred interest 30 35
43 50
Derivative financial instruments 3 2
46 52
No deferred tax asset is recognised in respect of the above assets on the grounds that there is insufficient evidence that the assets will be recoverable. In the event that sufficient profits are generated in the relevant jurisdictions in the future these assets may be recovered.
No deferred tax assets have been recognised in respect of gross tax losses amounting to €49 million (2016: €56 million). The expiry dates in respect of these losses are as follows:
Expiry dates Tax losses2017
€m1 January 2018 to 31 December 2018 -1 January 2019 to 31 December 2019 -1 January 2020 to 31 December 2020 -Other expiry -Indefinite 49
49
18. Inventories
2017 2016€m €m
Raw materials 216 202
Work in progress 59 40
Finished goods 360 353
Consumables and spare parts 203 184
838 779

145
Strategic Report Governance FinancialsOverview
19. Trade and other receivablesGroup Group Company Company
2017 2016 2017 2016€m €m €m €m
Amounts falling due within one financial year:Trade receivables 1,398 1,338 - -Less: provision for impairment of receivables (34) (34) - -Trade receivables – net 1,364 1,304 - -Amounts receivable from associates 3 3 - -Other receivables 128 110 - -Prepayments and accrued income 63 53 - -Amounts due from Group companies - - 197 166
1,558 1,470 197 166Amounts falling due after more than one financial year:Other receivables 27 29 - -
1,585 1,499 197 166
The carrying amount of trade and other receivables equate to their fair values due to their short-term maturities.
The Group has securitised €585 million (2016: €557 million) of its trade receivables. The securitised receivables have not been derecognised as the Group remains exposed to certain related credit risk. As a result, both the underlying trade receivables and the associated borrowings are shown in the Consolidated Balance Sheet.
Amounts due from Group companies are unsecured, interest free and repayable on demand.
Impairment lossesThe movement in the full provision for impairment of receivables was as follows:
2017 2016€m €m
At 1 January 34 33Provision for impaired receivables during the financial year 5 6Receivables written off as uncollectable during the financial year (4) (6)Acquisitions 1 -Foreign currency translation adjustment (2) 1At 31 December 34 34
The provision for impaired receivables is included in administrative expenses in the Consolidated Income Statement. Receivables written off as uncollectable are generally eliminated from receivables and the provision for impairment of receivables when there is no expectation of recovering additional cash.
Receivable balances are continuously monitored and reviewed for indicators of impairment at each reporting date. Examples of the factors considered include evidence of financial difficulty of the customer, payment default, major concessions being sought by the customer or breach of contract. Significant balances are reviewed individually while smaller balances are grouped and assessed collectively. The concentration of risk associated with any one customer is low and historically, instances of material single customer related bad debts are rare.
Trade receivables that are less than three months past due are generally not considered impaired unless specific evidence of impairment is identified. At 31 December 2017 trade receivables of €217 million (2016: €189 million) were past due but not impaired. These relate to customers for which there is no recent history of default. The aged analysis of these receivables was as follows:
2017 2016€m €m
Past due 0 – 30 days 171 137Past due 30 – 60 days 32 37Past due 60 – 90 days 9 9Past due 90+ days 5 6
217 189
As 31 December 2017 specifically identified trade receivable balances of €29 million (2016: €29 million) were considered impaired and provided for. The ageing of this provision was as follows:
2017 2016€m €m
Not past due 1 1Past due 0 – 30 days - 1Past due 30 – 60 days - -Past due 60 – 90 days 1 1Past due 90+ days 27 26
29 29
In addition to the specific provision above, a portfolio provision of €5 million is held in the current year which is calculated based on historical data (2016: €5 million).

Smurfit Kappa Annual Report 2017146
N OT E S TO T H E CO N S O L I DAT E D F I N A N C I A L STAT E M E N TS ( CO N T I N U E D)For the Financial Year Ended 31 December 2017
20. Net movement in working capital2017 2016
€m €mChange in inventories (112) (60)
Change in trade and other receivables (136) (51)
Change in trade and other payables 138 17
Net movement in working capital (110) (94)
21. Movements of liabilities within cash flows arising from financing activities and net debt reconciliationLiabilities from financing activities Adjustments
Short-term borrowings
Long &medium
termborrowings
Leaseliabilities
Derivativesheld tohedge
long-termborrowings
Changes inliabilities
arising from
financingactivities
Derivativesheld tohedge
long-termborrowings
Cash and cash
equivalentsRestricted
cashNet
debt
€m €m €m €m €m €m €m €m €mAs at 31 December 2016 (101) (3,235) (14) 6 (3,344) (6) 402 7 (2,941)Cash flows (10) (33) 2 6 (35) (6) 85 2 46Acquired - (9) - - (9) - - - (9)Currency translation adjustment 12 87 - (37) 62 37 16 - 115Other non-cash movements (546) 530 - 3 (13) (3) - - (16)As at 31 December 2017 (645) (2,660) (12) (22) (3,339) 22 503 9 (2,805)
22 Cash and cash equivalents and restricted cashCash and cash equivalents
2017 2016€m €m
Cash and current accounts 196 140
Short-term deposits 334 296
Cash and cash equivalents 530 436
Cash and cash equivalents for the purposes of the Consolidated Statement of Cash FlowsCash and cash equivalents 530 436
Bank overdrafts and demand loans used for cash management purposes (27) (34)
Cash and cash equivalents in the Consolidated Statement of Cash Flows 503 402
Restricted cash 9 7
At 31 December 2017, cash of €1 million (2016: €2 million) was held in restricted securitisation bank accounts which were not available for transfer to other Group subsidiaries or for use outside the Group. A further €8 million (2016: €5 million) of restricted cash was held in other Group subsidiaries and by a trust which facilitates the operation of the Deferred Annual Bonus Plan.
23. Capital and reservesShare capitalThe authorised share capital of the Company comprises ordinary shares and various classes of convertible shares.
Restriction on transfer of sharesThe Directors, at their absolute discretion and without assigning any reason therefore, may decline to register any transfer of a share which is not fully paid or any transfer to or by a minor or person of unsound mind but this shall not apply to a transfer of such a share resulting from a sale of the share through a stock exchange on which the share is listed.
The Directors may also refuse to register any instrument of transfer (whether or not it is in respect of a fully paid share) unless it is: a) lodged at the Registered Office or at such other place as the Directors may appoint; b) accompanied by the certificate for the shares to which it relates and such other evidence as the Directors may reasonably require to show the right of the transferor to make the transfer; c) in respect of only one class of shares; and d) in favour of not more than four transferees.
All convertible shares (classes B, C, D convertible shares) are subject to restrictions as to their transferability. Generally they are not transferable either at all or without consent of the Directors, save by transmission on the death of a holder.
Ordinary sharesSubject to the Articles of Association of SKG plc, the holders of ordinary shares are entitled to share in any dividends in proportion to the number of shares held by them and are entitled to one vote for every share held by them at a general meeting. On a return of capital (whether on repayment of capital, liquidation or otherwise) the assets and/or capital legally available to be distributed shall firstly be distributed amongst the holders of ordinary shares, in proportion to the number of ordinary shares held by them, of the nominal value of their ordinary shares, secondly (to the extent available) distributed amongst the holders of convertible shares, in proportion to the number of convertible shares held by them, of the nominal value of their convertible shares and the balance (if any) shall be distributed amongst the holders of ordinary shares in proportion to the number of ordinary shares held by them.
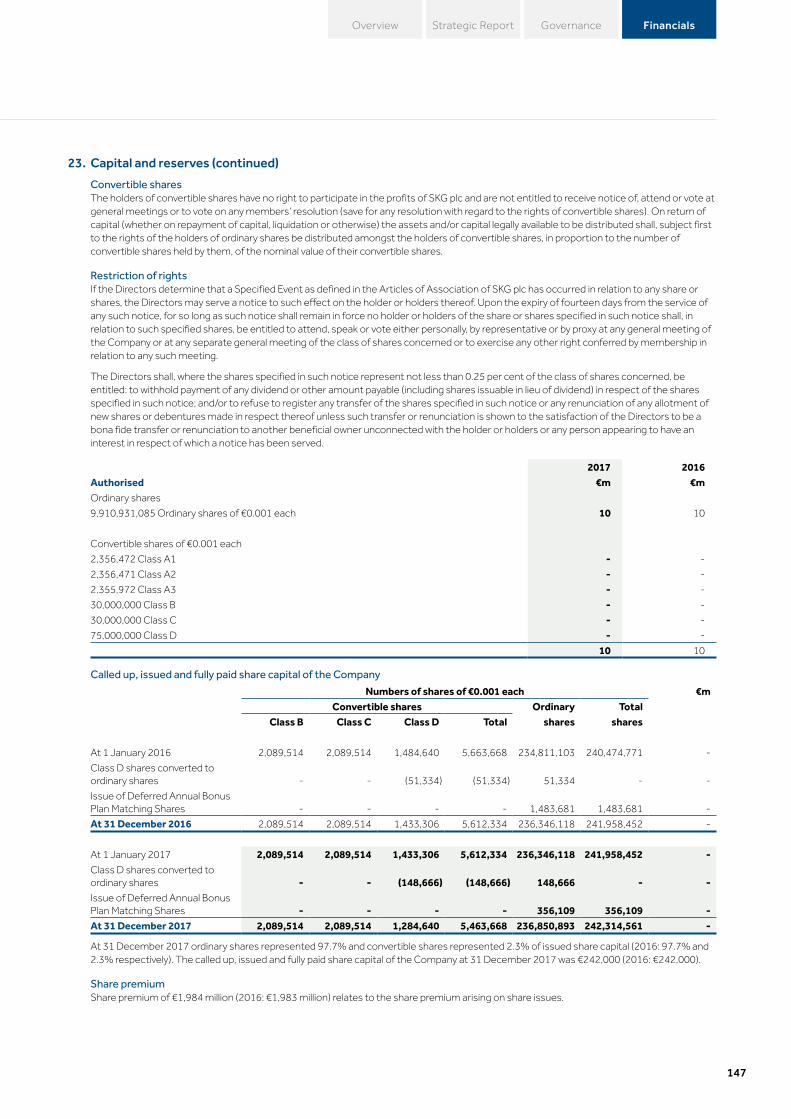
147
Strategic Report Governance FinancialsOverview
23. Capital and reserves (continued)
Convertible sharesThe holders of convertible shares have no right to participate in the profits of SKG plc and are not entitled to receive notice of, attend or vote at general meetings or to vote on any members’ resolution (save for any resolution with regard to the rights of convertible shares). On return of capital (whether on repayment of capital, liquidation or otherwise) the assets and/or capital legally available to be distributed shall, subject first to the rights of the holders of ordinary shares be distributed amongst the holders of convertible shares, in proportion to the number of convertible shares held by them, of the nominal value of their convertible shares.
Restriction of rightsIf the Directors determine that a Specified Event as defined in the Articles of Association of SKG plc has occurred in relation to any share or shares, the Directors may serve a notice to such effect on the holder or holders thereof. Upon the expiry of fourteen days from the service of any such notice, for so long as such notice shall remain in force no holder or holders of the share or shares specified in such notice shall, in relation to such specified shares, be entitled to attend, speak or vote either personally, by representative or by proxy at any general meeting of the Company or at any separate general meeting of the class of shares concerned or to exercise any other right conferred by membership in relation to any such meeting.
The Directors shall, where the shares specified in such notice represent not less than 0.25 per cent of the class of shares concerned, be entitled: to withhold payment of any dividend or other amount payable (including shares issuable in lieu of dividend) in respect of the shares specified in such notice; and/or to refuse to register any transfer of the shares specified in such notice or any renunciation of any allotment of new shares or debentures made in respect thereof unless such transfer or renunciation is shown to the satisfaction of the Directors to be a bona fide transfer or renunciation to another beneficial owner unconnected with the holder or holders or any person appearing to have an interest in respect of which a notice has been served.
2017 2016Authorised €m €mOrdinary shares
9,910,931,085 Ordinary shares of €0.001 each 10 10
Convertible shares of €0.001 each
2,356,472 Class A1 - -
2,356,471 Class A2 - -
2,355,972 Class A3 - -
30,000,000 Class B - -
30,000,000 Class C - -
75,000,000 Class D - -
10 10
Called up, issued and fully paid share capital of the Company
Numbers of shares of €0.001 each €mConvertible shares Ordinary Total
Class B Class C Class D Total shares shares
At 1 January 2016 2,089,514 2,089,514 1,484,640 5,663,668 234,811,103 240,474,771 -
Class D shares converted to ordinary shares - - (51,334) (51,334) 51,334 - -
Issue of Deferred Annual Bonus Plan Matching Shares - - - - 1,483,681 1,483,681 -
At 31 December 2016 2,089,514 2,089,514 1,433,306 5,612,334 236,346,118 241,958,452 -
At 1 January 2017 2,089,514 2,089,514 1,433,306 5,612,334 236,346,118 241,958,452 -Class D shares converted to ordinary shares - - (148,666) (148,666) 148,666 - -Issue of Deferred Annual Bonus Plan Matching Shares - - - - 356,109 356,109 -At 31 December 2017 2,089,514 2,089,514 1,284,640 5,463,668 236,850,893 242,314,561 -
At 31 December 2017 ordinary shares represented 97.7% and convertible shares represented 2.3% of issued share capital (2016: 97.7% and 2.3% respectively). The called up, issued and fully paid share capital of the Company at 31 December 2017 was €242,000 (2016: €242,000).
Share premiumShare premium of €1,984 million (2016: €1,983 million) relates to the share premium arising on share issues.

Smurfit Kappa Annual Report 2017148
N OT E S TO T H E CO N S O L I DAT E D F I N A N C I A L STAT E M E N TS ( CO N T I N U E D)For the Financial Year Ended 31 December 2017
23. Capital and reserves (continued)Other reservesOther reserves included in the Consolidated Statement of Changes in Equity are comprised of the following:
Reverseacquisition
reserve
Cash flowhedgingreserve
Foreigncurrency
translationreserve
Share-based
paymentreserve
Ownshares
Available-for-sale
reserve Total€m €m €m €m €m €m €m
At 1 January 2017 575 (22) (1,193) 165 (33) 1 (507)Other comprehensive incomeForeign currency translation adjustments - - (189) - - - (189)Effective portion of changes in fair value of cash flow hedges - 5 - - - - 5Total other comprehensive income/(expense) - 5 (189) - - - (184)
Share-based payment - - - 23 - - 23Net shares acquired by SKG Employee Trust - - - - (10) - (10)Shares distributed by SKG Employee Trust - - - (12) 12 - -At 31 December 2017 575 (17) (1,382) 176 (31) 1 (678)
Reverseacquisition
reserve
Cash flowhedgingreserve
Foreigncurrency
translationreserve
Share-based
paymentreserve
Ownshares
Available-for-sale
reserve Total€m €m €m €m €m €m €m
At 1 January 2016 575 (22) (1,109) 168 (38) 1 (425)Other comprehensive incomeForeign currency translation adjustments - - (84) - - - (84)Total other comprehensive expense - - (84) - - - (84)
Share-based payment - - - 12 - - 12Net shares acquired by SKG Employee Trust - - - - (10) - (10)Shares distributed by SKG Employee Trust - - - (15) 15 - -At 31 December 2016 575 (22) (1,193) 165 (33) 1 (507)
Reverse acquisition reserveThis reserve arose on the creation of a new parent of the Group prior to listing which was accounted for as a reverse acquisition.
Cash flow hedging reserveThis reserve comprises the effective portion of the cumulative net change in the fair value of cash flow hedging instruments (net of tax) related principally to floating rate debt which has been swapped into fixed interest using interest rate swaps.
Foreign currency translation reserveThis reserve comprises all foreign currency translation adjustments arising from the translation of the Group’s net investment in foreign operations as well as from the translation of liabilities that hedge those net assets.
Share-based payment reserveThis reserve represents the amounts credited to equity in relation to the share-based payment expense recognised in the Consolidated Income Statement, net of deferred shares distributed by the SKG Employee Trust to participants of the Deferred Annual Bonus Plan.
Own sharesThis represents ordinary shares acquired and disposed of by the SKG Employee Trust under the terms of the Deferred Annual Bonus Plan.
2017 2016€m €m
At 1 January 33 38Shares acquired/disposed by SKG Employee Trust 10 10Shares distributed by SKG Employee Trust (12) (15)At 31 December 31 33
As at 31 December 2017, the number of own shares held was 1,252,961 (2016: 1,500,846); their nominal value was €1,253 (2016: €1,501). In 2017, own shares were purchased at an average price of €25.71 (2016: €22.84) per share. The number of own shares held represents 0.5% (2016: 0.6%) of the total called up share capital of the Company. During the year the movement in SKG own shares consisted of 410,358 shares acquired by the SKG Employee Trust (2016: 447,514 shares), 559,071 shares distributed as part of the Deferred Annual Bonus Plan (2016: 1,190,437 shares) and 99,172 shares sold by the SKG Employee Trust (2016: nil). Each of these have the same nominal value as the ordinary shares.

149
Strategic Report Governance FinancialsOverview
23. Capital and reserves (continued)Available-for-sale reserveThis reserve includes the cumulative gains and losses arising on changes in the fair value of available-for-sale financial assets recognised in other comprehensive income. Net gains or losses are reclassified to the Consolidated Income Statement when the related assets are derecognised.
24. Borrowings
Analysis of total borrowings
2017 2016€m €m
Senior credit facility
– Revolving credit facility(1) – interest at relevant interbank rate +1.35%(5)(7) 2 1
– Term loan facility(2) – interest at relevant interbank rate +1.60%(5)(7) 485 741
US$292.3 million 7.50% senior debentures due 2025 (including accrued interest)(7) 245 279
Bank loans and overdrafts 154 167
2019 receivables securitisation variable funding notes(6) 88 182
2022 receivables securitisation variable funding notes(6) 4 114
2018 senior notes (including accrued interest)(3)(7) 455 488
€400 million 4.125% senior notes due 2020 (including accrued interest)(7) 405 404
€250 million senior floating rate notes due 2020 (including accrued interest)(4)(7) 250 249
€500 million 3.25% senior notes due 2021 (including accrued interest)(7) 497 496
€500 million 2.375% senior notes due 2024 (including accrued interest)(7) 498 -
€250 million 2.75% senior notes due 2025 (including accrued interest)(7) 249 249
Finance leases 12 14
Total borrowings 3,344 3,384
Analysed as follows: Current 673 137
Non-current 2,671 3,247
3,344 3,384
(1) Revolving credit facility (‘RCF’) of €845 million (available under the senior credit facility) due to be repaid in 2020. The RCF was increased by €220 million in February 2017. (a) Revolver loans – €6 million, (b) drawn under ancillary facilities and facilities supported by letters of credit – nil and (c) other operational facilities including letters of credit – €5 million.
(2) Term loan facility due to be repaid in certain instalments from 2018 to 2020. In January and February 2017, the Group prepaid €260 million of drawings under the term loan facility.
(3) €200 million 5.125% senior notes due 2018 and US$300 million 4.875% senior notes due 2018.(4) Interest at EURIBOR +3.5%.(5) The margins applicable under the senior credit facility are determined as follows:
Net debt/EBITDA ratio RCFTerm Loan
FacilityGreater than 3.0 : 1 1.85% 2.10%3.0 : 1 or less but more than 2.5 : 1 1.35% 1.60%2.5 : 1 or less but more than 2.0 : 1 1.10% 1.35%2.0 : 1 or less 0.85% 1.10%
(6) Secured loans and long-term obligations.(7) Unsecured loans and long-term obligations.
Included within the carrying value of borrowings are deferred debt issue costs of €28 million (2016: €30 million), all of which will be recognised in finance costs in the Consolidated Income Statement using the effective interest rate method over the remaining life of the borrowings.
Committed facilities (excluding short-term sundry bank loans and overdrafts) amounted to €4,385 million (2016: €4,007 million) of which €3,230 million (2016: €3,278 million) was utilised at 31 December 2017. The weighted average period until maturity of undrawn committed facilities is 2.4 years (2016: 3.0 years).
Maturity of undrawn committed facilities
2017 2016€m €m
Within 1 year - -
Between 1 and 2 years 151 60
More than 2 years 1,004 669
1,155 729

Smurfit Kappa Annual Report 2017150
N OT E S TO T H E CO N S O L I DAT E D F I N A N C I A L STAT E M E N TS ( CO N T I N U E D)For the Financial Year Ended 31 December 2017
24. Borrowings (continued)The Group’s primary sources of liquidity are cash flows from operations and borrowings under the revolving credit facility. The Group’s primary uses of cash are for funding day to day operations, capital expenditure, debt service, dividends and other investment activity including acquisitions.
The Group’s borrowing agreements contain certain covenants that restrict the Group’s flexibility in certain areas such as incurrence of additional indebtedness and incurrence of liens. The Group’s borrowing agreements also contain financial covenants, the primary ones being a maximum borrowings to EBITDA of 3.75 times and a minimum EBITDA to net interest of 3.00 times. The Group is in full compliance with the requirements of its covenant agreements throughout each of the periods presented.
In June 2014, the Group completed a €240 million five-year trade receivables securitisation programme. The new programme, which has a margin of 1.4% and a June 2019 maturity, amended, restated and extended the €250 million securitisation programme which had a November 2015 maturity and a margin of 1.5%. Receivables generated by certain of its operating companies in the United Kingdom, Germany and France are sold to special purpose subsidiaries and entities to support the funding provided by Lloyds Banking Group.
In May 2017, the Group completed a five-year trade receivables securitisation programme of up to €175 million. The new programme, which has a margin of 1.375% and a February 2022 maturity, amended, restated and extended the €175 million securitisation programme which had a margin of 1.7% and an April 2018 maturity. Receivables generated by certain of its operating companies in Austria, Belgium, Italy and the Netherlands are sold to a special purpose Group subsidiary to support the funding. A conduit of Coöperatieve Centrale Raiffeisen-Boerenleenbank B.A. (trading as Rabobank) provides €135 million of the funding and a conduit of Landesbank Hessen-Thüringen Girozentrale (trading as Helaba Bank) provides €40 million of the funding.
The sale of the securitised receivables under the Group’s securitisation programmes is not intended to, and does not, meet the requirements for derecognition under IAS 39, with the result that the sold receivables continue to be shown on the face of the Consolidated Balance Sheet and the notes issued which fund the purchase of these receivables continue to be shown as liabilities.
The gross amount of receivables collateralising the 2019 receivables securitisation at 31 December 2017 was €322 million (2016: €307 million). The gross amount of receivables collateralising the 2022 receivables securitisation at 31 December 2017 was €263 million (2016: €250 million). As the group retains a subordinated interest in the securitised receivables, the Group remains exposed to the credit risk of the underlying securitised receivables. Further details are set out in Note 29. In accordance with the contractual terms, the counterparty only has recourse to the securitised debtors. Given the short-term nature of the securitised debtors and the variable floating notes, the carrying amount of the securitised debtors and the associated liabilities reported on the Consolidated Balance Sheet is estimated to approximate to fair value. At 31 December 2017, cash of €1 million (2016: €2 million) was held in securitisation bank accounts which was not available for transfer to other Group subsidiaries or outside entities.
Certain subsidiaries are party to a senior credit facility, the details of which are set out in this note.
The following table sets out the average interest rates at 31 December 2017 and 2016 for each of the drawings under the senior credit facility.
Currency2017
Interest rate2016
Interest rateFacility A EUR 1.26% 1.26%
Facility A US$ 3.17% 2.37%
Facility A GBP 2.09% 1.86%
RCF EUR 0.98% 0.98%
Borrowings under the revolving credit facility are available to fund the Group’s working capital requirements, capital expenditure and other general requirements.
In January 2017, the Group issued €500 million of seven-year euro denominated senior notes at a coupon of 2.375%, the proceeds of which were used to prepay term debt under the senior credit facility, reduce indebtedness under existing securitisation facilities and for general corporate purposes. In February 2017, the Group increased the revolving credit facility under the senior credit facility by €220 million thereby further enhancing the Group’s liquidity.
Certain other maturity, interest rate repricing and key terms relating to the Group’s borrowings have been set out in Note 29.
25. Employee benefitsThe Group operates both defined benefit and defined contribution pension plans throughout its operations in accordance with local requirements and practices. These plans have broadly similar regulatory frameworks. The major plans are of the defined benefit type and are funded by payments to separately administered funds. In these defined benefit plans, the level of benefits available to members depends on length of service and their average salary over their period of employment or their salary in the final years leading up to retirement or leaving. While the majority of the defined benefit plans are funded, in certain countries, such as Germany, Austria and France, plan liabilities are unfunded and recognised as liabilities in the Consolidated Balance Sheet. In these countries, a full actuarial valuation of the unfunded liabilities is undertaken by independent actuaries on an annual basis. Responsibility for governance of the plans, including investment decisions and contribution schedules, lies with the Company and the boards of trustees.
The most significant defined benefit plans are in the United Kingdom, the Netherlands, Ireland and Germany. The most recent valuations of the significant funded plans are as follows:
Ireland 1 January 2016
Netherlands 31 December 2017
United Kingdom 31 March 2017 (near completion)
The expense for defined contribution pension plans for the financial year ended 31 December 2017 was €55 million (2016: €52 million).

151
Strategic Report Governance FinancialsOverview
25. Employee benefits (continued)The following is a summary of the Group’s employee benefit obligations and their related funding status:
2017 2016€m €m
Present value of funded or partially funded obligations (2,282) (2,320)
Fair value of plan assets 1,953 1,954
Deficit in funded or partially funded plans (329) (366)
Present value of wholly unfunded obligations (517) (517)
Amounts not recognised as assets due to asset ceiling (2) (1)
Net pension liability (848) (884)
In determining the defined benefit costs and obligations, all valuations are performed by independent actuaries using the projected unit credit method.
Financial AssumptionsThe main actuarial assumptions used to calculate liabilities under IAS19, Employee Benefits at 31 December 2017 and 31 December 2016 are as follows:
Eurozone Rest of Europe The Americas2017 2016 2017 2016 2017 2016
% % % % % %Rate of increase in salaries 1.60 – 2.60 1.50 – 2.75 2.90 2.25 – 3.70 1.50 – 5.98 3.00 – 5.50
Rate of increase to pensions in payment Nil – 1.60 Nil – 1.50 Nil – 2.54 Nil – 2.54 Nil – 4.00 Nil – 3.86
Discount rate for plan liabilities 1.70 1.80 2.35 – 2.55 2.55 – 2.75 3.60 – 8.20 4.10 – 7.65
Inflation 1.60 1.50 1.90 – 3.30 1.50 – 3.40 1.50 – 4.00 2.00 – 4.00
Mortality assumptionsIn assessing the Group’s post retirement liabilities, the mortality assumptions chosen for the principal plans above are based on the country’s population mortality experience, large pension scheme mortality experience and the plan’s own mortality experience. Following a mortality investigation carried out by the pension scheme trustees in the United Kingdom, the mortality tables have changed from those used last year. The change has resulted in a slightly lower life expectancy. In 2016, in the Netherlands, the life expectancies were slightly adjusted to show the same expectations across all plans. In Ireland, the assumptions used were adapted versions of the tables used for the 2016 actuarial valuation. In Germany, the mortality table used is that laid down by statutory authorities. Note that in all cases, the mortality tables used allow for future improvements in life expectancy.
The current life expectancies underlying the valuation of the plan liabilities for the significant plans are as follows:
Ireland United Kingdom Netherlands Germany2017 2016 2017 2016 2017 2016 2017 2016
Longevity at age 65 for current pensioners (years)Male 21.4 21.2 20.6 20.7 20.9 20.8 19.8 19.6
Female 23.9 23.7 22.4 22.7 23.8 23.7 23.8 23.7
Longevity at age 65 for current member aged 45 (years)Male 23.8 23.7 21.7 21.6 23.3 23.2 22.4 22.3
Female 25.9 25.8 23.7 23.9 26.2 26.1 26.3 26.2
The mortality assumptions for other plans are based on relevant standard mortality tables in each country.
Sensitivity analysisThe following table illustrates the key sensitivities to the amounts included in the Consolidated Financial Statements which would arise from adjusting certain key actuarial assumptions. The sensitivity of the defined benefit obligation to changes in actuarial assumptions has been calculated using the projected credit method, which is the same method used to calculate the pension liability in the Consolidated Balance Sheet. The methods and assumptions used in preparing the sensitivity analysis have not changed compared to the prior year. In each case all of the other assumptions remain unchanged:
Increase/(decrease) in pension liabilities
2017 2016Change in assumption €m €mIncrease discount rate by 0.25% (115) (114)
Decrease discount rate by 0.25% 123 121
Increase inflation rate by 0.25% 47 50
Decrease inflation rate by 0.25% (46) (46)
Increase in life expectancy by one year 106 95
The sensitivity information shown above has been determined by performing calculations of the liabilities using different assumptions.

Smurfit Kappa Annual Report 2017152
N OT E S TO T H E CO N S O L I DAT E D F I N A N C I A L STAT E M E N TS ( CO N T I N U E D)For the Financial Year Ended 31 December 2017
25. Employee benefits (continued)
Analysis of plan assets and liabilitiesPlan assets are comprised as follows:
2017 2016Quoted Unquoted Total Quoted Unquoted Total
€m €m €m €m €m €mEquities 505 - 505 527 - 527
Corporate bonds 268 - 268 312 - 312
Government bonds 287 - 287 271 - 271
Property 34 1 35 31 1 32
Cash 105 - 105 130 - 130
Insurance contracts 125 37 162 116 31 147
Liability driven investment 325 1 326 258 - 258
Other 265 - 265 277 - 277
1,914 39 1,953 1,922 32 1,954
Included in plan assets at 31 December 2017 under Property is an amount of €1.2 million (2016: €1.3 million) relating to the Group’s Gosport plant in the United Kingdom. This is the only self-investment in the Group by the defined benefit plans.
The actual return on plan assets for the financial year ended 31 December 2017 was a gain of €120 million (2016: a gain of €235 million).
An analysis of the assets held by the plans is as follows:
Eurozone Rest of Europe The Americas Total31 December 2017 €m €m €m €mEquities 329 155 21 505Corporate bonds 175 66 27 268Government bonds 252 28 7 287Property 14 20 1 35Cash 48 43 14 105Insurance contracts 157 5 - 162Liability driven investment 64 261 1 326Other 47 218 - 265Fair value of plan assets 1,086 796 71 1,953Present value of plan liabilities (1,683) (1,014) (102) (2,799)Amounts not recognised as assets due to asset ceiling - (2) - (2)Net pension liability (597) (220) (31) (848)
Eurozone Rest of Europe The Americas Total31 December 2016 €m €m €m €mEquities 324 174 29 527
Corporate bonds 185 102 25 312
Government bonds 220 47 4 271
Property 11 20 1 32
Cash 7 111 12 130
Insurance contracts 142 5 - 147
Liability driven investment 65 193 - 258
Other 74 201 2 277
Fair value of plan assets 1,028 853 73 1,954
Present value of plan liabilities (1,614) (1,108) (115) (2,837)
Amounts not recognised as assets due to asset ceiling - (1) - (1)
Net pension liability (586) (256) (42) (884)

153
Strategic Report Governance FinancialsOverview
25. Employee benefits (continued)
Analysis of the amount charged in the Consolidated Income StatementThe following tables set out the components of the defined benefit cost:
2017 2016€m €m
Current service cost 24 25
Administrative expenses 4 4
Past service cost (1) - (21)
Gain on settlement (2) - (5)
Actuarial loss arising on other long-term employee benefits 1 1
Charged to operating profit(3) 29 4
Net interest cost on net pension liability(4) 18 22
47 26
(1) The past service cost in 2016 of €21 million relates to the change from defined benefit to defined contribution arrangements in a number of countries in Europe.
(2) The gain on settlement in 2016 of €5 million was due to a release of reserves in the Irish defined benefit plan as a result of a 100% Transfer Option offered to all deferred pensioners and a release of reserves from the Norwegian defined benefit plan which was closed and replaced by a defined contribution plan.
(3) The amount charged to operating profit for current service cost excludes the hyperinflation adjustment of €1 million (2016: €2 million).
(4) Net interest cost on net pension liability excludes the hyperinflation adjustment of €6 million (2016: €1 million).
The defined benefit cost for 2017 includes a loss of €4 million (2016: gain of €7 million) which relates to other long-term employee benefits.
The expense recognised in the Consolidated Income Statement is charged to the following line items:
2017 2016€m €m
Cost of sales 15 4
Distribution costs and administrative expenses 14 -
Net interest on net pension liability 18 22
47 26
Analysis of actuarial (losses)/gains recognised in the Consolidated Statement of Comprehensive Income
2017 2016€m €m
Return on plan assets (excluding amounts in interest income) 76 182
Actuarial (loss)/gain due to experience adjustments (1) 4
Actuarial loss due to changes in financial assumptions (90) (344)
Actuarial gain due to changes in demographic assumptions 6 10
Total loss recognised in the Consolidated Statement of Comprehensive Income (9) (148)
2017 2016Movement in present value of defined benefit obligation €m €mAt 1 January (2,837) (2,702)
Current service cost (24) (25)
Contributions by plan participants (5) (5)
Interest cost (62) (75)
Actuarial gains and losses (86) (331)
Benefits paid by plans 158 108
Past service cost - 21
Acquisitions - (3)
Decrease arising on settlement - 18
Reclassification 3 -
Foreign currency translation adjustment 54 157
At 31 December (2,799) (2,837)

Smurfit Kappa Annual Report 2017154
N OT E S TO T H E CO N S O L I DAT E D F I N A N C I A L STAT E M E N TS ( CO N T I N U E D)For the Financial Year Ended 31 December 2017
25. Employee benefits (continued)
2017 2016Movement in fair value of plan assets €m €mAt 1 January 1,954 1,884
Interest income on plan assets 44 53
Return on plan assets (excluding amounts in interest income) 76 182
Administrative expenses (4) (4)
Contributions by employer 75 83
Contributions by plan participants 5 5
Benefits paid by plans (158) (108)
Decrease arising on settlements - (13)
Foreign currency translation adjustment (39) (128)
At 31 December 1,953 1,954
2017 2016Movement in asset ceiling €m €mAt 1 January (1) -
Variations of the effect of the asset ceiling limit (1) (1)
At 31 December (2) (1)
Employee benefit plan risksThe employee benefit plans expose the Group to a number of risks, the most significant of which are:
Asset volatility The plan liabilities are calculated using a discount rate set with reference to corporate bond yields. If assets underperform this yield, this will create a deficit. The plans hold a significant proportion of equities which, though expected to outperform corporate bonds in the long-term, create volatility and risk in the short-term. The allocation to equities is monitored to ensure it remains appropriate given the plans’ long-term objectives.
Changes in bond yields A decrease in corporate bond yields will increase the value placed on the plans’ liabilities, although this will be partially offset by an increase in the value of the plans’ bond holdings.
Inflation risk The plans’ benefit obligations are linked to inflation, and higher inflation will lead to higher liabilities (although, in most cases, caps on the level of inflationary increases are in place to protect against extreme inflation). The majority of the assets are either unaffected by or only loosely correlated with inflation, meaning that an increase in inflation will also increase the deficit.
Life expectancy The majority of the plans’ obligations are to provide benefits based on the life of the member, so increases in life expectancy will result in an increase in the liabilities.
In the case of the funded plans, the Group ensures that the investment positions are managed with an asset-liability matching (‘ALM’) framework that has been developed to achieve long-term investments that are in line with the obligations under the pension schemes. Within this framework, the Group’s ALM objective is to match assets to the pension obligations by investing in long-term fixed interest securities with maturities that match the benefit payments as they fall due and in the appropriate currency.
Maturity analysisThe expected maturity analysis is set out in the table below:
Projected amountsExpected benefit payments: €mFinancial year 2018 103Financial year 2019 102Financial years 2020-2022 324Financial years 2023-2027 582
The weighted average duration of the defined benefit obligation at 31 December 2017 is 17.03 years (2016: 16.96 years).
Most of the plans are closed to new entrants and therefore, under the projected unit credit method, the current service cost is expected to increase (all other elements remaining equal) as the members approach retirement and to decrease as members retire or leave service. The expected employee and employer contributions for the year ending 31 December 2018 for the funded schemes are €5 million and €44 million respectively. The expected employer contributions for unfunded schemes for the year ending 31 December 2018 are €28 million.

155
Strategic Report Governance FinancialsOverview
26. Share-based payment
Share-based payment expense recognised in the Consolidated Income Statement
2017 2016€m €m
Charge arising from the Deferred Annual Bonus Plan 23 12
The Group grants equity settled share-based payments to employees as part of their remuneration; there are no cash-settled share-based payments.
Deferred Annual Bonus PlanIn May 2011, the SKG plc Annual General Meeting approved the adoption of the 2011 Deferred Annual Bonus Plan (‘DABP’) which replaced the existing long-term incentive plan, the 2007 Share Incentive Plan.
The size of the awards to each eligible employee under the DABP is subject to the level of annual bonus earned by the employee in any year. The maximum annual potential bonus for eligible employees in the DABP is 150% of salary. The actual bonus earned in any financial year is based on the achievement of clearly defined stretching annual financial targets for some of the Group’s Key Performance Indicators (‘KPI’) being: Earnings per Share (‘EPS’), Return on Capital Employed (‘ROCE’) and Free Cash Flow (‘FCF’), together with targets for health and safety and a comparison of the Group’s financial performance to that of a peer group.
The structure of the plan is that 50% of any annual bonus earned for a financial year will be deferred into SKG plc shares (‘Deferred Shares’) to be granted in the form of a Deferred Share Award. The Deferred Shares will vest (i.e. become unconditional) after a three-year holding period based on a service condition of continuity of employment or in certain circumstances, based on normal good leaver provisions.
At the same time as the grant of a Deferred Share Award, a Matching Share Award can be granted up to the level of the Deferred Share Award. Following a three-year performance period, the Matching Shares could vest up to a maximum of 3 times the level of the Deferred Share Award. The maximum match was reduced to 2.25 times by the Compensation Committee for the awards for the 2015-2017 performance period and the 2016-2018 performance period. Matching Share Awards will vest provided that the Compensation Committee considers the Group’s ROCE and Total Shareholder Return (‘TSR’) to be competitive when compared to the constituents of a peer group of international paper and packaging companies over that performance period. The actual number of Matching Shares that will vest under the Matching Share Awards is dependent on the performance conditions of the Group’s FCF(1) and ROCE targets measured over the same three-year performance period on an inter-conditional basis and the multiplier will be calculated by interpolation.
The accounting for a deferred bonus payable in shares falls under IFRS 2, Share-based Payment. Under IFRS 2, when share awards are subject to vesting conditions, the related expense is recognised in profit or loss over the vesting period.
The total DABP charge for the year comprises two elements; a) a charge in respect of the Deferred Share Awards granted in respect of 2014, 2015, 2016 and to be granted in respect of 2017 and b) a charge in respect of the Matching Share Awards granted in respect of those years.
The actual performance targets assigned to the Matching Share Awards are set by the Compensation Committee on the granting of awards at the start of each three-year cycle. The Group is required to lodge the actual targets with the Group’s auditors prior to the grant of any awards under the DABP.
A summary of the activity under the DABP, for the period from 1 January 2016 to 31 December 2017 is presented below.
Number outstandingDeferred
Share AwardMatching
Share AwardAt 1 January 2016 2,221,078 1,458,555Granted in the year 447,514 261,501Forfeited in the year (22,898) (41,043)Additional match on vesting - 742,580Distributed in the year (1,190,437) (1,483,681)At 31 December 2016 1,455,257 937,912Granted in the year 393,651 237,337Forfeited in the year (36,876) (45,711)Additional match on vesting - 6,991Distributed in the year (559,071) (356,109)At 31 December 2017 1,252,961 780,420
The fair value of the awards granted in 2017 was €25.71 (2016: €22.84) which was the market value on the date of the grant.
Deferred Share Awards and Matching Share Awards were granted in 2017 to eligible employees in respect of the financial year ended 31 December 2016. The Matching Share Awards may vest based on the achievement of the relevant performance targets for the three-year period ending on 31 December 2019.
The Deferred Share Awards and Matching Share Awards which were granted in 2014 in respect of the financial year ended 31 December 2013 vested in February 2017 and were distributed to the relevant employees. The market price at the date of vesting was €25.39.
The Deferred Share Awards and Matching Share Awards which were granted in 2015 in respect of the financial year ended 31 December 2014 vested in February 2018 and were distributed to relevant employees. The market price at the date of vesting was €29.72. Details of the performance targets and results for the three-year period to 31 December 2017 are set out in the Remuneration Report.
(1) In calculating FCF, capital expenditure will be set at a minimum of 90% of depreciation for the three-year performance cycle.

Smurfit Kappa Annual Report 2017156
N OT E S TO T H E CO N S O L I DAT E D F I N A N C I A L STAT E M E N TS ( CO N T I N U E D)For the Financial Year Ended 31 December 2017
26. Share-based payment (continued)
2007 Share Incentive PlanThis scheme has expired for the purpose of issuing invitations to subscribe for convertible shares. However a number of convertible shares issued under this plan have not yet been converted to ordinary shares. Further details are provided below.
In March 2007, SKG plc adopted the 2007 Share Incentive Plan (the ‘2007 SIP’). The 2007 SIP was amended in May 2009. Incentive awards under the 2007 SIP were in the form of new class B and new class C convertible shares issued in equal proportions to Participants at a nominal value of €0.001 per share. On satisfaction of specified performance criteria the new class B and new class C convertible shares automatically convert on a one-to-one basis into class D convertible shares. The class D convertible shares may be converted by the holder into ordinary shares upon payment of the agreed conversion price. The conversion price for each D convertible share was set at the average market value of an ordinary share for the three dealing days immediately prior to the date that the Participant was invited to subscribe less the nominal subscription price. Each award has a life of ten years from the date of issuance of the new class B and new class C convertible shares. The performance period for the new class B and new class C convertible shares was three financial years.
The performance conditions for the new class B and new class C convertible shares awarded under the 2007 SIP during and from 2009 were subject to a performance condition based on the Group’s total shareholder return over the three-year period relative to the total shareholder return of a peer group of companies (‘TSR condition’). Under that condition, 30% of the new class C convertible shares would convert into D convertible shares if the Group’s total shareholder return was at the median performance level and 100% convert if the Group’s total shareholder return was at or greater than the upper quartile of the peer group. A sliding scale has been applied for performance between the median and upper quartiles.
However, notwithstanding that the TSR condition applicable to any such award may have been satisfied, the Compensation Committee retained an overriding discretion to disallow the vesting of the award, in full or in part, if, in its opinion the Group’s underlying financial performance or total shareholder return (or both) had been unsatisfactory during the performance period.
The Compensation Committee determined the performance conditions for awards granted under the 2007 SIP after consultation with the Irish Association of Investment Managers.
The Monte Carlo simulation approach was used to calculate the value of new class B convertible shares awarded from 2009 and all new class C convertible shares at grant date. The expected volatility rates applied were based upon the weighted average historical volatility of the Group’s business sector for a period equivalent to the expected life of the grants. The risk-free interest rates used were based upon euro-denominated government bonds with similar lives. The fair value of the convertible shares at the valuation dates was determined based upon the market price at that date.
The awards made in 2009 vested 100% in February 2012 with the TSR condition being in the upper quartile of the peer group. The awards made in 2010 vested 30% in February 2013 with the TSR condition being at the median. The Compensation Committee was of the opinion that the Group’s underlying financial performance and total shareholder return had been satisfactory during the performance period and therefore confirmed the vesting.
A summary of the activity under the 2007 SIP, as amended, for the period from 1 January 2016 to 31 December 2017 is presented below.
2017 2016Number of
convertibleshares
Weightedaverage
exercise price
Number ofconvertible
shares
Weightedaverage
exercise price(€ per share) (€ per share)
Outstanding at the beginning of the year 680,764 4.92 750,840 4.94
Exercised in the year (148,666) 4.84 (51,334) 5.15
Forfeited in the year - - (18,742) 5.10
Outstanding at the end of the year 532,098 4.95 680,764 4.92
Exercisable at the end of the year 532,098 4.95 680,764 4.92
The weighted average market price on the dates the convertible shares were exercised in the financial year ended 31 December 2017 was €25.28 (2016: €21.85).
2017 20162007 SIP, as amended, convertible shares outstanding at the end of the year (number) 532,098 680,764
Weighted average exercise price (€ per share) 4.95 4.92
Weighted average remaining contractual life (years) 1.9 2.9

157
Strategic Report Governance FinancialsOverview
27. Provisions for liabilities and charges
2017 2016€m €m
Current 23 19
Non-current 62 69
85 88
Deferred andcontingent
consideration Restructuring Environmental Legal Other Total€m €m €m €m €m €m
At 1 January 2016 23 17 5 8 33 86
Made during the financial year 6 2 - 2 20 30
Released during the financial year - (3) - (1) (1) (5)
Utilised during the financial year (9) (10) - (1) (17) (37)
Acquisitions - - - (3) 16 13
Reclassifications (3) - - - 1 (2)
Unwinding of discount - - - - 1 1
Foreign currency translation adjustment 1 - - - 1 2
At 31 December 2016 18 6 5 5 54 88Made during the financial year 11 4 - 1 27 43Released during the financial year - (1) (1) (2) (9) (13)Utilised during the financial year (3) (3) - (2) (18) (26)Reclassifications - - - - (2) (2)Unwinding of discount - - - - 1 1Foreign currency translation adjustment (3) - - - (3) (6)At 31 December 2017 23 6 4 2 50 85
Deferred and contingent considerationDeferred and contingent consideration represents the deferred element of acquisition consideration payable. The balance at 31 December 2017 relates to the acquisition of the following:
n Chatziioannou, an integrated corrugated plant in Greece (2017);
n Soyuz, an integrated corrugated plant in Russia (2017);
n Fustlepack, an integrated corrugated plant in Italy (2017);
n Sound Packaging, a sheet plant located in the US (2016);
n Corrugated Professionals, a sheet feeder located in the US (2016);
n INPA and Paema, two integrated paper-based packaging businesses in Brazil (2015); and
n Cartonera Rierba S.A., a packaging business in the Dominican Republic (2014).
The deferred and contingent consideration at 31 December 2016 related to the acquisition of the following:
n Sound Packaging (2016);
n Corrugated Professionals (2016);
n CYBSA (2015);
n Inspirepac (2015);
n INPA and Paema (2015);
n Cartonera Rierba S.A. (2014); and
n Baguin (2012).
RestructuringThese provisions relate to irrevocable commitments in respect of restructuring programmes throughout the Group. The provisions made in 2017 relate to the closure of the City of Industry plant in North America. The current year utilisation of the provision related largely to the closure of the Ponts and Marais and Nanterre plants in France. The Group expects that the majority of the provision balance remaining at 31 December 2017 will be utilised during 2018.
EnvironmentalProvisions for environmental costs mainly relate to the reinstatement of landfill sites and other remediation and improvement costs incurred in compliance with either local or national environmental regulations together with constructive obligations stemming from established practice. The timing of settlement of these provisions is not certain, particularly where provisions are based on past practice and there is no legal obligation.

Smurfit Kappa Annual Report 2017158
N OT E S TO T H E CO N S O L I DAT E D F I N A N C I A L STAT E M E N TS ( CO N T I N U E D)For the Financial Year Ended 31 December 2017
27. Provisions for liabilities and charges (continued)
LegalLegal represents provisions for certain legal claims brought against the Group by various parties in the ordinary course of business. Provisions are expensed in the Consolidated Income Statement within administrative expenses. Legal provisions are uncertain as to timing and amount as they are the subject of ongoing cases.
OtherOther comprises a number of provisions including: liabilities arising from onerous contracts, mainly relating to leased properties amounting to €18 million (2016: €13 million); employee compensation in certain countries in which we operate amounting to €16 million (2016: €21 million) and numerous other items which are not individually material and are not readily grouped together. The property leases have remaining lives ranging from one to seventeen years.
28. Trade and other payables
Group Group Company Company2017 2016 2017 2016
€m €m €m €mAmounts falling due within one financial year:Trade payables 1,061 1,016 - -
Amounts owed to associates – trading balances - 1 - -
Payroll taxes 38 35 - -
Value added tax 73 51 - -
Social insurance 55 55 - -
Accruals and deferred income 452 422 - -
Capital payables 79 99 - -
Other payables 21 26 - -
Amounts payable to Group companies - - 4 5
1,779 1,705 4 5
Amounts falling due after more than one financial year:Other payables 17 13 - -
1,796 1,718 4 5
The fair values of trade and other payables are not materially different from their carrying amounts.
Amounts owed to Group companies are unsecured, interest free and are repayable on demand.
29. Financial instruments
Financial instruments by categoryThe accounting policies for financial instruments have been applied to the line items below:
Loansand
receivables
Assets at fairvalue throughConsolidated
IncomeStatement
Derivativesused forhedging
Available-for-sale Total
31 December 2017 €m €m €m €m €mAssets per Consolidated Balance Sheet:
Available-for-sale financial assets - - - 21 21Derivative financial instruments - 5 14 - 19Trade and other receivables 1,474 - - - 1,474Cash and cash equivalents 530 - - - 530Restricted cash 9 - - - 9
2,013 5 14 21 2,053
The financial assets of the Company of €197 million consist of loans and receivables.

159
Strategic Report Governance FinancialsOverview
29. Financial instruments (continued)
Liabilities at fairvalue throughConsolidated
IncomeStatement
Derivativesused forhedging
Otherfinancial
liabilities Total 31 December 2017 €m €m €m €mLiabilities per Consolidated Balance Sheet:
Borrowings - - 3,344 3,344Derivative financial instruments 2 34 - 36Trade and other payables - - 1,432 1,432
2 34 4,776 4,812
The financial liabilities of the Company of €4 million consist of other financial liabilities.
Loansand
receivables
Assets at fairvalue throughConsolidated
IncomeStatement
Derivativesused forhedging
Available-for-sale Total
31 December 2016 €m €m €m €m €mAssets per Consolidated Balance Sheet:
Available-for-sale financial assets - - - 21 21
Derivative financial instruments - 9 43 - 52
Trade and other receivables 1,415 - - - 1,415
Cash and cash equivalents 436 - - - 436
Restricted cash 7 - - - 7
1,858 9 43 21 1,931
The financial assets of the Company of €166 million consist of loans and receivables.
Liabilities at fairvalue throughConsolidated
IncomeStatement
Derivativesused forhedging
Otherfinancial
liabilities Total 31 December 2016 €m €m €m €mLiabilities per Consolidated Balance Sheet:
Borrowings - - 3,384 3,384
Derivative financial instruments 20 19 - 39
Trade and other payables - - 1,392 1,392
20 19 4,776 4,815
The financial liabilities of the Company of €5 million consist of other financial liabilities.
Exposure to credit, interest rate, liquidity, energy and currency risks arise in the normal course of the Group’s business. Derivatives are generally used to economically hedge exposure to fluctuations in these risks.
Key financial risks and financial risk management resulting from the use of financial instruments and related sensitivity analysis
Financial and credit risk managementThe operating parameters and policies of the Group’s treasury management function are established under formal Board authority. The Treasury Policy covers the areas of funding, counterparty risk, foreign exchange, controls and derivatives. Risk arising on counterparty default is controlled within a framework of dealing with high quality institutions and, by policy, limiting the amount of credit exposure to any one bank or institution. The Group uses financial instruments, including fixed and variable rate debt to finance operations, for capital spending programs and for general corporate purposes. Additionally, financial instruments, including derivative instruments are used to hedge exposure to interest rate, commodity and foreign currency risks. The Group does not use financial instruments for trading purposes. The Group mitigates the risk that counterparties to derivatives will fail to perform by contracting with major financial institutions having high credit ratings and considers the likelihood of counterparty failure to be low. Trade debtors arise from a wide and varied customer base. There is no significant concentration of credit risk amongst any of the Group’s most significant financial assets. The Group also holds no collateral in respect of its principal credit exposures.
The successful management of the Group’s currency and interest rate exposure depends on a variety of factors, some of which are outside its control. The Group is exposed to the impact of interest rate changes and foreign currency fluctuations due to its investing and funding activities and its operations in foreign currencies. The Group manages interest rate exposure to achieve what management consider to be an appropriate balance of fixed and variable rate funding. To achieve this objective the Group enters into interest rate swaps, options and forward rate agreements. Interest rate swap agreements are primarily used to change the interest payable on its underlying borrowings from variable to fixed rate. The impact of any such swaps on the Group’s financial instruments has been set out in the tables below.

Smurfit Kappa Annual Report 2017160
N OT E S TO T H E CO N S O L I DAT E D F I N A N C I A L STAT E M E N TS ( CO N T I N U E D)For the Financial Year Ended 31 December 2017
29. Financial instruments (continued)The Group manages its balance sheet having regard to the currency exposures arising from its assets being denominated in a wide range of currencies. To this end, where foreign currency assets are funded by local borrowing, such borrowing is generally sourced in the currency of the related assets. The Group also hedges currency exposure through the use of currency swaps, options and forward contracts. The impact of these derivatives on the currency profile of the Group’s financial instruments has been set out in the tables below.
Further details on certain specific financial risks encountered have been set out below.
Interest rate riskThe Group is exposed to changes in interest rates, primarily changes in Euribor. The senior credit facility is variable rate debt, as are the Group’s securitisation facilities and the €250 million senior floating rate notes due 2020. Interest rate changes therefore generally do not affect the market value of such debt but do impact the amount of the Group’s interest payments and, therefore, its future earnings and cash flows, assuming other factors are held constant. At 31 December 2017, the Group had fixed an average of 79% (2016: 68%) of its interest cost on borrowings over the following 12 months. Holding all other variables constant, including levels of indebtedness, at 31 December 2017 a one percentage point increase in variable interest rates would have an estimated impact on pre-tax interest expense of approximately €8 million (including the effect of interest rate swaps) over the following 12 months. Interest income on our cash balances would increase by approximately €5 million, assuming a one percent increase in interest rates earned on such balances over the following twelve months.
The Group has entered into one or more interest rate protection agreements (principally interest rate swaps and cross currency interest rate swaps), which establish a fixed interest rate with respect to certain of its borrowings. In 2012 the Group entered into a cross currency interest rate swap to swap fixed rate debt into variable rate debt. A table setting out the fixed and variable rate debt together with the impact of the related interest and cross currency swaps has been set out below.
Currency sensitivityThe Group operates in the following principal currency areas (other than euro): Swedish Krona, Sterling, Latin America (comprising mainly Mexican Peso, Colombian Peso, Venezuelan Bolivar Fuerte and Brazilian Real), US Dollar and Eastern Europe (comprising mainly the Polish Zloty, the Czech Koruna and the Russian Rouble). At the end of 2017, approximately 99% (2016: 99%) of its non euro denominated net assets consisted of the Swedish Krona 29% (2016: 28%), Sterling 4% (2016: 2%), Latin American currencies 54% (2016: 56%), US Dollar 1% (2016: 2%) and Eastern European currencies 11% (2016: 11%). The Group believes that a strengthening of the euro exchange rate by 1% against all other foreign currencies from the 31 December 2017 rate would reduce shareholders’ equity by approximately €17 million (2016: €17 million).
Commodity price riskContainerboard
The Group is exposed to commodity price risks through its dependence on recovered paper, the principal raw material used in the manufacture of recycled containerboard. The price of recovered paper is dependent on both demand and supply conditions. Demand conditions include the production of recycled containerboard in Europe and the demand for recovered paper for the production of recycled containerboard outside of Europe, principally in Asia. Supply conditions include the rate of recovery of recovered paper, itself dependant on historic pricing related to the cost of recovery, and some slight seasonal variations.
Just over 1.05 metric tonnes of recovered paper are required to manufacture 1.0 metric tonne of recycled containerboard. Consequently, an increase in the price of recovered paper of, for example, €20 per tonne would increase the cost of production of recycled containerboard by approximately €21 per tonne. Historically, increases in the cost of recovered paper, if sustained, have led to a rise in the price of recycled containerboard, with a lag of one to two months.
The price of recovered paper can fluctuate significantly within a given year, affecting the operating results of the Group’s paper processing facilities. The Group seeks to manage this risk operationally rather than by entering into financial risk management derivatives. Accordingly, at each of 31 December 2017 and 2016, there were no derivatives held to mitigate such risks.
In addition, developing policy changes in the EU with regard to renewable energy sources have created an additional demand for wood, the principal raw material used in the manufacture of kraftliner. This has the effect of potentially increasing the price of wood and consequently the cost of the Group’s raw materials. At each of 31 December 2017 and 2016, the Group held no derivatives to mitigate such risks.
Energy
The cost of producing the Group’s products is also sensitive to the price of energy. The Group’s main energy exposure is to the cost of gas and electricity. These energy costs have experienced significant price volatility in recent years, with a corresponding effect on Group production costs. Natural gas prices, relevant to the Group, started the year at €17.46 per megawatt-hour, peaked at €19.79 per megawatt-hour in February 2017, decreased to €14.82 per megawatt-hour in August 2017 and stood at €19.47 per megawatt hour at the end of 2017, giving an average price of €17.01 for 2017. The Group has entered into a limited level of energy derivative contracts to economically hedge a portion of its energy costs in Sweden. The Group has also fixed a certain level of its energy costs through contractual arrangements directly with its energy suppliers.
Green energy levies in certain countries increased compared to the prior year, increasing energy costs. The Group’s overall energy costs were broadly in line with 2016.
The Group’s energy derivatives have been further detailed in the tables below.

161
Strategic Report Governance FinancialsOverview
29. Financial instruments (continued)
Liquidity riskThe Group is exposed to liquidity risk which arises primarily from the maturing of short-term and long-term debt obligations and derivative transactions. The Group’s policy is to ensure that sufficient resources are available either from cash balances, cash flows or undrawn committed bank facilities, to ensure all obligations can be met as they fall due. To achieve this objective, the Group:
n maintains cash balances and liquid investments with highly rated counterparties;
n limits the maturity of cash balances; and
n borrows the bulk of its debt needs under committed bank lines or other term financing and by policy maintains a minimum level of undrawn committed facilities.
The Group has entered into a series of borrowing arrangements in order to facilitate its liquidity needs in this regard and the key terms of those arrangements are described within Note 24 and within certain tables set out below. At each year-end, the Group’s rolling liquidity reserve (which comprises cash and undrawn committed facilities and which represents the amount of available cash headroom in the Group’s funding structure) was as follows:
2017 2016€m €m
Cash and cash equivalents 530 436
Committed undrawn facilities 1,155 729
Liquidity reserve 1,685 1,165
Current liabilities – borrowings due within one year (782) (245)
Net position 903 920
Management monitors rolling cash flow forecasts on an ongoing basis to determine the adequacy of the liquidity position of the Group. This process also incorporates a longer term liquidity review to ensure refinancing risks are adequately catered for as part of the Group’s strategic planning. The Group continues to benefit from its existing financing package and debt profile. In addition, the Group’s operating activities are cash generative and expect to be so over the foreseeable future; the Group has committed undrawn facilities of €1,155 million at 31 December 2017; and the Group has cash and cash equivalents of €530 million at 31 December 2017. The maturity dates of the Group’s main borrowing facilities as set out in Note 24, together with the liquidity analysis as set out in this note, more fully describes the Group’s longer term financing risks.
Capital risk managementThe Group’s objectives when managing capital are to safeguard the Group’s ability to continue as a going concern in order to provide returns for shareholders and benefits for other stakeholders and to maintain an optimal capital structure to reduce the overall cost of capital.
In managing its capital structure, the primary focus of the Group is the ratio of net debt as a multiple of EBITDA (earnings before exceptional items, share-based payment expense, share of associates’ profit (after tax), net finance costs, income tax expense, depreciation and depletion (net) and intangible asset amortisation). Maximum levels for this ratio are set under Board approved policy. At 31 December 2017 the net debt to EBITDA ratio of the Group was 2.3 times (net debt of €2,805 million) which compares to 2.4 times (net debt of €2,941 million) at the end of 2016. This gives the Group continuing headroom compared to the actual covenant level at 31 December 2017 of 3.75 times.
On the basis of pre-exceptional operating profit, the Group’s return on capital employed was 15.0% compared to 15.4% in 2016. The return on capital employed comprises pre-exceptional operating profit plus share of associates’ profit (after tax) as a percentage of average capital employed (where average capital employed is the average of total equity and net debt at the beginning and end of the year). Capital employed at 31 December 2017 was: €5,464 million, (2016: €5,444 million). The post-exceptional return on capital employed was 14.6% in 2017 (2016: 15.1%).
The capital employed of the Company at 31 December 2017 was €2,067 million (2016: €2,055 million).
Credit riskCredit risk arises from credit exposure to trade debtors, cash and cash equivalents including deposits with banks and financial institutions, derivative financial instruments and investments. The Group has no sovereign exposures and no material debtors with Government agencies. The maximum exposure to credit risk is represented by the carrying amount of each asset.
Trade debtors arise from a wide and varied customer base spread throughout the Group’s operations and as such there is no significant concentration of credit risk. Credit evaluations are performed on all customers over certain thresholds and all customers are subject to continued monitoring at operating company level.
Risk of counterparty default arising on cash and cash equivalents and derivative financial instruments is controlled within a framework of dealing with high quality institutions and, by policy, limiting the amount of credit exposure to any one bank or institution. Of the Group’s total cash and cash equivalents (including restricted cash) at 31 December 2017 of €539 million, 25% was with financial institutions in the A rating category of Standard & Poor’s or Moody’s and 56% was with financial institutions in the AA/Aa or higher rating category. The remaining 19% was represented mainly by cash held with banks in Ireland and Latin America which fell outside the A or higher ratings categories. At 31 December 2017 derivative transactions were with counterparties with ratings ranging from BB- to AA- with Standard & Poor’s or B3 to Aa2 with Moody’s.
At each reporting date, there were no significant concentrations of credit risk which individually represented more than 10% of the Group’s financial assets. A geographical analysis of the Group’s segment assets has been provided in Note 4.

Smurfit Kappa Annual Report 2017162
N OT E S TO T H E CO N S O L I DAT E D F I N A N C I A L STAT E M E N TS ( CO N T I N U E D)For the Financial Year Ended 31 December 2017
29. Financial instruments (continued)
Market risk – available-for-sale securitiesThe Group’s available-for-sale securities principally comprise an investment in an unlisted entity which operates in a similar paper processing market to the Group in Europe and which has a similar underlying risk profile to the general operational risks encountered by the Group in this market, and investments held relating to unfunded pension liabilities. These investments are being carried at their estimated fair value and the Group’s maximum exposure to risks associated with these investments is represented by their carrying amounts.
Investments are occasionally made in listed and unlisted entities of strategic importance to the Group and the policy for assessing impairment thereon is set out in Note 14.
Derivative positionsDerivative financial instruments recognised as assets and liabilities in the Consolidated Balance Sheet both as part of cash flow hedges and other economic hedges which do not meet the criteria for hedge accounting under IAS 39, have been set out below:
2017 2016€m €m
Non-current derivative assets Cash flow hedges:
Foreign currency forwards 1 1
Cross currency swaps 2 33
Fair value hedges:
Cross currency swaps - 8
Total non-current derivative assets 3 42
Current derivative assets Cash flow hedges:
Foreign currency forwards 2 1
Cross currency swaps 7 -
Fair value hedges:
Cross currency swaps 2 -
Not designated as hedges:
Foreign currency forwards 1 1
Cross currency swaps 3 7
Energy hedging contracts 1 1
Total current derivative assets 16 10
Total derivative assets 19 52
Non-current derivative liabilities Cash flow hedges:
Interest rate swaps (5) (11)
Cross currency swaps (21) (1)
Total non-current derivative liabilities (26) (12)
Current derivative liabilitiesCash flow hedges:
Interest rate swaps (5) (5)
Foreign currency forwards (2) (1)
Cross currency swaps (1) (1)
Not designated as hedges:
Foreign currency forwards - (1)
Cross currency swaps (2) (19)
Total current derivative liabilities (10) (27)
Total derivative liabilities (36) (39)
Net (liability)/asset on derivative financial instruments (17) 13
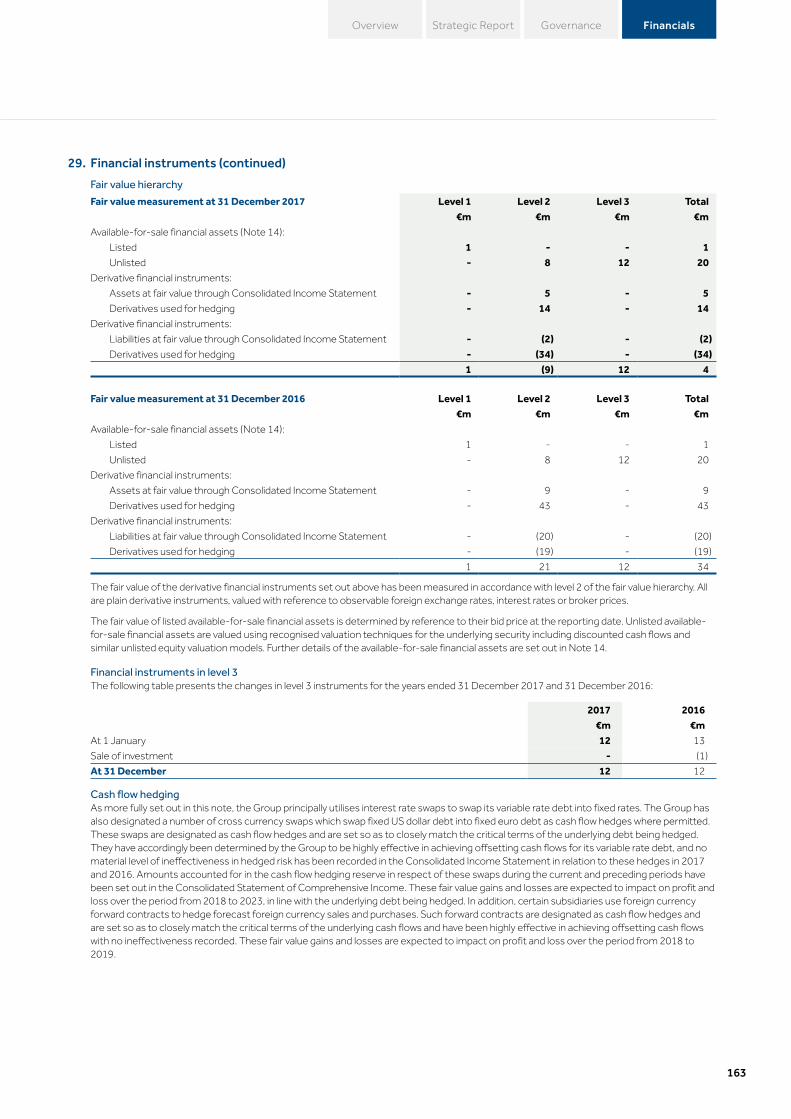
163
Strategic Report Governance FinancialsOverview
29. Financial instruments (continued)
Fair value hierarchy
Fair value measurement at 31 December 2017 Level 1 Level 2 Level 3 Total€m €m €m €m
Available-for-sale financial assets (Note 14):
Listed 1 - - 1Unlisted - 8 12 20
Derivative financial instruments:
Assets at fair value through Consolidated Income Statement - 5 - 5Derivatives used for hedging - 14 - 14
Derivative financial instruments:
Liabilities at fair value through Consolidated Income Statement - (2) - (2)Derivatives used for hedging - (34) - (34)
1 (9) 12 4
Fair value measurement at 31 December 2016 Level 1 Level 2 Level 3 Total€m €m €m €m
Available-for-sale financial assets (Note 14):
Listed 1 - - 1
Unlisted - 8 12 20
Derivative financial instruments:
Assets at fair value through Consolidated Income Statement - 9 - 9
Derivatives used for hedging - 43 - 43
Derivative financial instruments:
Liabilities at fair value through Consolidated Income Statement - (20) - (20)
Derivatives used for hedging - (19) - (19)
1 21 12 34
The fair value of the derivative financial instruments set out above has been measured in accordance with level 2 of the fair value hierarchy. All are plain derivative instruments, valued with reference to observable foreign exchange rates, interest rates or broker prices.
The fair value of listed available-for-sale financial assets is determined by reference to their bid price at the reporting date. Unlisted available-for-sale financial assets are valued using recognised valuation techniques for the underlying security including discounted cash flows and similar unlisted equity valuation models. Further details of the available-for-sale financial assets are set out in Note 14.
Financial instruments in level 3The following table presents the changes in level 3 instruments for the years ended 31 December 2017 and 31 December 2016:
2017 2016€m €m
At 1 January 12 13
Sale of investment - (1)
At 31 December 12 12
Cash flow hedgingAs more fully set out in this note, the Group principally utilises interest rate swaps to swap its variable rate debt into fixed rates. The Group has also designated a number of cross currency swaps which swap fixed US dollar debt into fixed euro debt as cash flow hedges where permitted. These swaps are designated as cash flow hedges and are set so as to closely match the critical terms of the underlying debt being hedged. They have accordingly been determined by the Group to be highly effective in achieving offsetting cash flows for its variable rate debt, and no material level of ineffectiveness in hedged risk has been recorded in the Consolidated Income Statement in relation to these hedges in 2017 and 2016. Amounts accounted for in the cash flow hedging reserve in respect of these swaps during the current and preceding periods have been set out in the Consolidated Statement of Comprehensive Income. These fair value gains and losses are expected to impact on profit and loss over the period from 2018 to 2023, in line with the underlying debt being hedged. In addition, certain subsidiaries use foreign currency forward contracts to hedge forecast foreign currency sales and purchases. Such forward contracts are designated as cash flow hedges and are set so as to closely match the critical terms of the underlying cash flows and have been highly effective in achieving offsetting cash flows with no ineffectiveness recorded. These fair value gains and losses are expected to impact on profit and loss over the period from 2018 to 2019.
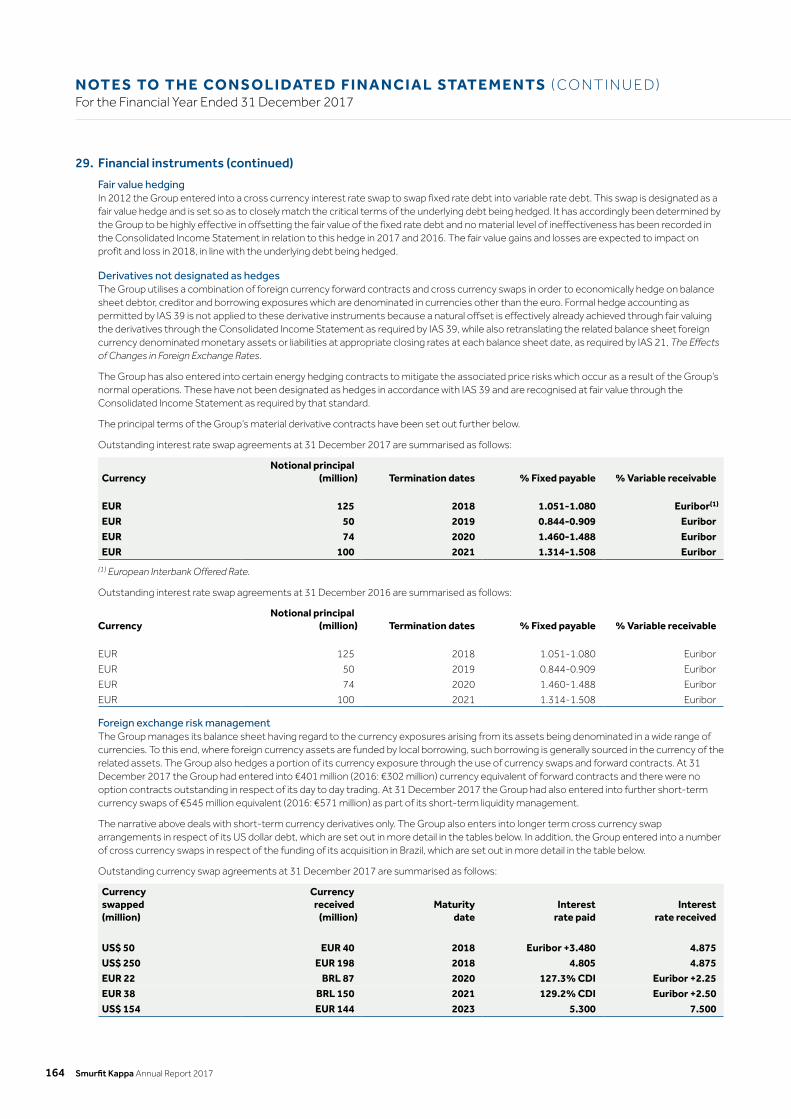
Smurfit Kappa Annual Report 2017164
N OT E S TO T H E CO N S O L I DAT E D F I N A N C I A L STAT E M E N TS ( CO N T I N U E D)For the Financial Year Ended 31 December 2017
29. Financial instruments (continued)
Fair value hedgingIn 2012 the Group entered into a cross currency interest rate swap to swap fixed rate debt into variable rate debt. This swap is designated as a fair value hedge and is set so as to closely match the critical terms of the underlying debt being hedged. It has accordingly been determined by the Group to be highly effective in offsetting the fair value of the fixed rate debt and no material level of ineffectiveness has been recorded in the Consolidated Income Statement in relation to this hedge in 2017 and 2016. The fair value gains and losses are expected to impact on profit and loss in 2018, in line with the underlying debt being hedged.
Derivatives not designated as hedgesThe Group utilises a combination of foreign currency forward contracts and cross currency swaps in order to economically hedge on balance sheet debtor, creditor and borrowing exposures which are denominated in currencies other than the euro. Formal hedge accounting as permitted by IAS 39 is not applied to these derivative instruments because a natural offset is effectively already achieved through fair valuing the derivatives through the Consolidated Income Statement as required by IAS 39, while also retranslating the related balance sheet foreign currency denominated monetary assets or liabilities at appropriate closing rates at each balance sheet date, as required by IAS 21, The Effects of Changes in Foreign Exchange Rates.
The Group has also entered into certain energy hedging contracts to mitigate the associated price risks which occur as a result of the Group’s normal operations. These have not been designated as hedges in accordance with IAS 39 and are recognised at fair value through the Consolidated Income Statement as required by that standard.
The principal terms of the Group’s material derivative contracts have been set out further below.
Outstanding interest rate swap agreements at 31 December 2017 are summarised as follows:
Currency Notional principal
(million) Termination dates % Fixed payable % Variable receivable
EUR 125 2018 1.051-1.080 Euribor(1)
EUR 50 2019 0.844-0.909 EuriborEUR 74 2020 1.460-1.488 EuriborEUR 100 2021 1.314-1.508 Euribor
(1) European Interbank Offered Rate.
Outstanding interest rate swap agreements at 31 December 2016 are summarised as follows:
Currency Notional principal
(million) Termination dates % Fixed payable % Variable receivable
EUR 125 2018 1.051-1.080 Euribor
EUR 50 2019 0.844-0.909 Euribor
EUR 74 2020 1.460-1.488 Euribor
EUR 100 2021 1.314-1.508 Euribor
Foreign exchange risk managementThe Group manages its balance sheet having regard to the currency exposures arising from its assets being denominated in a wide range of currencies. To this end, where foreign currency assets are funded by local borrowing, such borrowing is generally sourced in the currency of the related assets. The Group also hedges a portion of its currency exposure through the use of currency swaps and forward contracts. At 31 December 2017 the Group had entered into €401 million (2016: €302 million) currency equivalent of forward contracts and there were no option contracts outstanding in respect of its day to day trading. At 31 December 2017 the Group had also entered into further short-term currency swaps of €545 million equivalent (2016: €571 million) as part of its short-term liquidity management.
The narrative above deals with short-term currency derivatives only. The Group also enters into longer term cross currency swap arrangements in respect of its US dollar debt, which are set out in more detail in the tables below. In addition, the Group entered into a number of cross currency swaps in respect of the funding of its acquisition in Brazil, which are set out in more detail in the table below.
Outstanding currency swap agreements at 31 December 2017 are summarised as follows:
Currencyswapped(million)
Currencyreceived
(million) Maturity
dateInterest
rate paidInterest
rate received
US$ 50 EUR 40 2018 Euribor +3.480 4.875US$ 250 EUR 198 2018 4.805 4.875EUR 22 BRL 87 2020 127.3% CDI Euribor +2.25EUR 38 BRL 150 2021 129.2% CDI Euribor +2.50US$ 154 EUR 144 2023 5.300 7.500
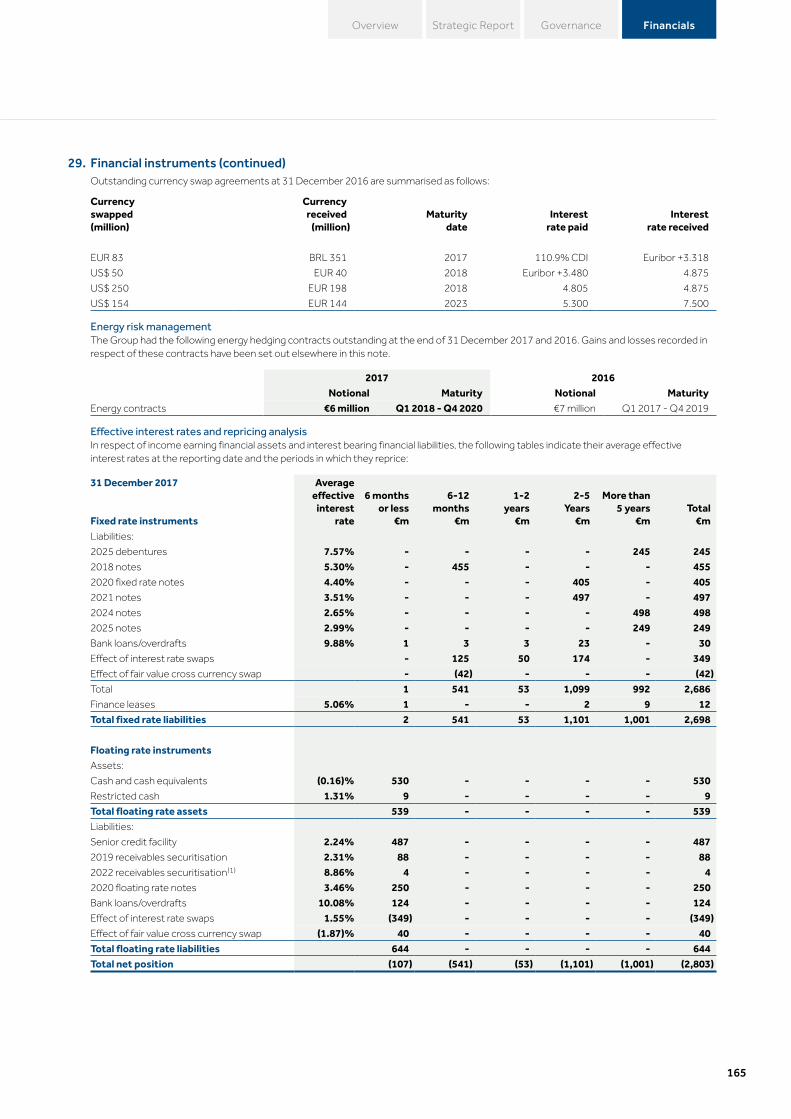
165
Strategic Report Governance FinancialsOverview
29. Financial instruments (continued)Outstanding currency swap agreements at 31 December 2016 are summarised as follows:
Currencyswapped(million)
Currencyreceived
(million) Maturity
dateInterest
rate paidInterest
rate received
EUR 83 BRL 351 2017 110.9% CDI Euribor +3.318
US$ 50 EUR 40 2018 Euribor +3.480 4.875
US$ 250 EUR 198 2018 4.805 4.875
US$ 154 EUR 144 2023 5.300 7.500
Energy risk managementThe Group had the following energy hedging contracts outstanding at the end of 31 December 2017 and 2016. Gains and losses recorded in respect of these contracts have been set out elsewhere in this note.
2017 2016Notional Maturity Notional Maturity
Energy contracts €6 million Q1 2018 - Q4 2020 €7 million Q1 2017 - Q4 2019
Effective interest rates and repricing analysisIn respect of income earning financial assets and interest bearing financial liabilities, the following tables indicate their average effective interest rates at the reporting date and the periods in which they reprice:
31 December 2017 Averageeffective
interestrate
6 monthsor less
€m
6-12months
€m
1-2years
€m
2-5Years
€m
More than5 years
€mTotal
€mFixed rate instrumentsLiabilities:
2025 debentures 7.57% - - - - 245 2452018 notes 5.30% - 455 - - - 4552020 fixed rate notes 4.40% - - - 405 - 4052021 notes 3.51% - - - 497 - 4972024 notes 2.65% - - - - 498 4982025 notes 2.99% - - - - 249 249Bank loans/overdrafts 9.88% 1 3 3 23 - 30Effect of interest rate swaps - 125 50 174 - 349Effect of fair value cross currency swap - (42) - - - (42)Total 1 541 53 1,099 992 2,686Finance leases 5.06% 1 - - 2 9 12Total fixed rate liabilities 2 541 53 1,101 1,001 2,698
Floating rate instruments Assets:
Cash and cash equivalents (0.16)% 530 - - - - 530Restricted cash 1.31% 9 - - - - 9Total floating rate assets 539 - - - - 539Liabilities:
Senior credit facility 2.24% 487 - - - - 4872019 receivables securitisation 2.31% 88 - - - - 882022 receivables securitisation(1) 8.86% 4 - - - - 42020 floating rate notes 3.46% 250 - - - - 250Bank loans/overdrafts 10.08% 124 - - - - 124Effect of interest rate swaps 1.55% (349) - - - - (349)Effect of fair value cross currency swap (1.87)% 40 - - - - 40Total floating rate liabilities 644 - - - - 644Total net position (107) (541) (53) (1,101) (1,001) (2,803)

Smurfit Kappa Annual Report 2017166
N OT E S TO T H E CO N S O L I DAT E D F I N A N C I A L STAT E M E N TS ( CO N T I N U E D)For the Financial Year Ended 31 December 2017
29. Financial instruments (continued)
31 December 2016 Averageeffective
interestrate
6 monthsor less
€m
6-12months
€m
1-2years
€m
2-5years
€m
More than5 years
€mTotal
€mFixed rate instrumentsLiabilities:
2025 debentures 7.57% - - - - 279 279
2018 notes 5.38% - - 488 - - 488
2020 fixed rate notes 4.41% - - - 404 - 404
2021 notes 3.52% - - - 496 - 496
2025 notes 3.00% - - - - 249 249
Bank loans/overdrafts 6.82% 4 2 2 8 6 22
Effect of interest rate swaps - - 125 224 - 349
Effect of fair value cross currency swap - - (47) - - (47)
Total 4 2 568 1,132 534 2,240
Finance leases 5.20% - - 1 2 10 13
Total fixed rate liabilities 4 2 569 1,134 544 2,253
Floating rate instruments Assets:
Cash and cash equivalents 0.03% 436 - - - - 436
Restricted cash 0.05% 7 - - - - 7
Total floating rate assets 443 - - - - 443
Liabilities:
Senior credit facility 1.95% 742 - - - - 742
2018 receivables securitisation(1) 1.73% 114 - - - - 114
2019 receivables securitisation 1.29% 182 - - - - 182
2020 floating rate notes 3.49% 249 - - - - 249
Bank loans/overdrafts 13.27% 145 - - - - 145
Effect of interest rate swaps 1.53% (349) - - - - (349)
Effect of fair value cross currency swap (2.32%) 40 - - - - 40
Total 1,123 - - - - 1,123
Finance leases 3.19% 1 - - - - 1
Total floating rate liabilities 1,124 - - - - 1,124
Total net position (685) (2) (569) (1,134) (544) (2,934)
(1) At the end of the financial year the carrying amount of the 2022 receivables securitisation programme was €4 million compared to €114 million at 31 December 2016. If the drawn amount had been unchanged year-on-year the average effective interest rate would be 1.12% (2016: 1.73%) due to the relative impact of deferred debt issue costs recognised in finance costs in the Consolidated Income Statement using the effective interest method over the remaining life of the programme.

167
Strategic Report Governance FinancialsOverview
29. Financial instruments (continued)
Liquidity analysisThe following table sets out the maturity or liquidity analysis of the Group’s financial liabilities and net settled derivative financial liabilities into the relevant maturity groupings based on the remaining period at the balance sheet date to the contractual maturity date:
31 December 2017
Weightedaverage
perioduntil
maturity(years)
No fixedterm
€m
Less than1 year
€m
1-2years
€m
2-5years
€m
More than5 years
€mTotal
€mLiabilities:
Trade and other payables - 1,432 - - - 1,432Senior credit facility 1.7 - 88 87 331 - 5062019 receivables securitisation 1.5 - 1 90 - - 912022 receivables securitisation 4.1 - - - 5 - 5Bank loans/overdrafts 1.1 27 108 11 15 9 1702025 debentures 7.8 - 18 18 55 299 3902018 notes 0.7 - 473 - - - 4732020 fixed rate notes 2.0 - 17 17 408 - 4422020 floating rate notes 2.8 - 8 8 258 - 2742021 notes 3.4 - 16 16 525 - 5572024 notes 6.0 - 12 12 36 518 5782025 notes 7.0 - 7 7 21 267 302
27 2,180 266 1,654 1,093 5,220Finance leases 5.9 - 3 2 4 7 16
27 2,183 268 1,658 1,100 5,236Derivative liabilities - 5 3 2 - 10Total liabilities 27 2,188 271 1,660 1,100 5,246
31 December 2016
Weightedaverage
perioduntil
maturity(years)
No fixedterm
€m
Less than1 year
€m
1-2years
€m
2-5years
€m
More than5 years
€mTotal
€mLiabilities:
Trade and other payables - 1,392 - - - 1,392
Senior credit facility 2.7 - 9 133 634 - 776
2018 receivables securitisation 1.3 - 1 115 - - 116
2019 receivables securitisation 2.5 - 2 2 184 - 188
Bank loans/overdrafts 1.0 33 99 28 21 2 183
2025 debentures 8.8 - 21 21 62 360 464
2018 notes 1.7 - 24 509 - - 533
2020 fixed rate notes 3.0 - 17 17 425 - 459
2020 floating rate notes 3.8 - 8 8 266 - 282
2021 notes 4.4 - 16 16 541 - 573
2025 notes 8.0 - 7 7 21 274 309
33 1,596 856 2,154 636 5,275
Finance leases 6.0 - 3 2 4 9 18
33 1,599 858 2,158 645 5,293
Derivative liabilities - 5 5 6 - 16
Total liabilities 33 1,604 863 2,164 645 5,309
The financial liabilities of the Company of €4 million (2016: €5 million) are repayable on demand.

Smurfit Kappa Annual Report 2017168
N OT E S TO T H E CO N S O L I DAT E D F I N A N C I A L STAT E M E N TS ( CO N T I N U E D)For the Financial Year Ended 31 December 2017
29. Financial instruments (continued)The following table sets out the liquidity analysis with regard to derivatives which do not net settle in the normal course of business (primarily foreign exchange contracts and currency swaps). The table shows the estimated timing of cash flows on the liability side of the contracts only:
Less than1 year 1-2 years 2-5 years
More than5 years Total
31 December 2017 €m €m €m €m €mLiabilities:
Cross currency swaps 806 14 76 152 1,048Foreign currency forwards 308 90 - - 398Total 1,114 104 76 152 1,446
Less than1 year 1-2 years 2-5 years
More than5 years Total
31 December 2016 €m €m €m €m €mLiabilities:
Cross currency swaps 702 257 23 159 1,141
Foreign currency forwards 256 46 - - 302
Total 958 303 23 159 1,443
Currency analysisThe table below sets out the Group’s financial assets and liabilities according to their principal currencies. Currency risk related to financial assets and liabilities denominated in currencies other than the Group’s presentation currency (euro) represents both transactional and translation risk. As at 31 December 2017 and 2016 the Company had no material financial assets or liabilities denominated in foreign currencies.
31 December 2017Euro Sterling
LatinAmerica(1) US dollar Other Total
€m €m €m €m €m €mTrade and other receivables 836 130 200 163 145 1,474Available-for-sale financial assets 21 - - - - 21Cash and cash equivalents 382 39 34 51 24 530Restricted cash 6 - - 2 1 9Total assets 1,245 169 234 216 170 2,034
Trade and other payables 905 107 145 150 125 1,432Senior credit facility 313 128 - 46 - 4872019 receivables securitisation 8 80 - - - 882022 receivables securitisation 4 - - - - 4Bank loans/overdrafts 25 - 111 18 - 1542025 debentures - - - 245 - 2452018 notes 201 - - 254 - 4552020 fixed rate notes 405 - - - - 4052020 floating rate notes 250 - - - - 2502021 notes 497 - - - - 4972024 notes 498 - - - - 4982025 notes 249 - - - - 249
3,355 315 256 713 125 4,764Finance leases 2 1 - 9 - 12Total liabilities 3,357 316 256 722 125 4,776
Impact of foreign exchange contracts 251 167 64 (191) (291) -Total (liabilities)/assets (2,363) (314) (86) (315) 336 (2,742)

169
Strategic Report Governance FinancialsOverview
29. Financial instruments (continued)
31 December 2016Euro Sterling
LatinAmerica(1) US dollar Other Total
€m €m €m €m €m €mTrade and other receivables 839 129 205 115 127 1,415
Available-for-sale financial assets 21 - - - - 21
Cash and cash equivalents 288 29 36 47 36 436
Restricted cash 5 - - 1 1 7
Total assets 1,153 158 241 163 164 1,879
Trade and other payables 887 111 143 136 115 1,392
Senior credit facility 568 125 - 49 - 742
2018 receivables securitisation 114 - - - - 114
2019 receivables securitisation 112 70 - - - 182
Bank loans/overdrafts 24 1 121 20 1 167
2025 debentures - - - 279 - 279
2018 notes 199 - - 289 - 488
2020 fixed rate notes 404 - - - - 404
2020 floating rate notes 249 - - - - 249
2021 notes 496 - - - - 496
2025 notes 249 - - - - 249
3,302 307 264 773 116 4,762
Finance leases 1 2 - 11 - 14
Total liabilities 3,303 309 264 784 116 4,776
Impact of foreign exchange contracts 154 142 107 (288) (150) (35)
Total (liabilities)/assets (2,304) (293) (130) (333) 198 (2,862)
(1) Latin America includes currencies such as the Mexican Peso, Colombian Peso, Venezuelan Bolivar Fuerte and Brazilian Real. These have been grouped together principally owing to their size and impact on the currency analysis tables within this note.

Smurfit Kappa Annual Report 2017170
N OT E S TO T H E CO N S O L I DAT E D F I N A N C I A L STAT E M E N TS ( CO N T I N U E D)For the Financial Year Ended 31 December 2017
29. Financial instruments (continued)
Fair valueThe following table sets out the fair value of the Group’s principal financial assets and liabilities. The determination of these fair values is based on the descriptions set out within Note 2.
2017 2016Carrying value Fair value Carrying value Fair value
€m €m €m €m
Trade and other receivables (1) 1,474 1,474 1,415 1,415
Available-for-sale financial assets (2) 21 21 21 21
Cash and cash equivalents (3) 530 530 436 436
Derivative assets (4) 19 19 52 52
Restricted cash (3) 9 9 7 7
2,053 2,053 1,931 1,931
Trade and other payables (1) 1,432 1,432 1,392 1,392
Senior credit facility (5) 487 487 742 742
2019 receivables securitisation (3) 88 88 114 114
2022 receivables securitisation (3) 4 4 182 182
Bank overdrafts (3) 154 154 167 167
2025 debentures (6) 245 298 279 330
2018 notes (6) 455 464 488 517
2020 fixed rate notes (6) 405 438 404 446
2020 floating rate notes (6) 250 270 249 270
2021 notes (6) 497 541 496 538
2024 notes (6) 498 526 - -
2025 notes (6) 249 266 249 255
4,764 4,968 4,762 4,953
Finance leases 12 12 14 14
4,776 4,980 4,776 4,967
Derivative liabilities (4) 36 36 39 39
4,812 5,016 4,815 5,006
Total net position (2,759) (2,963) (2,884) (3,075)
(1) The fair value of trade and other receivables and payables is estimated as the present value of future cash flows, discounted at the market rate of interest at the reporting date.
(2) The fair value of listed available-for-sale financial assets is determined by reference to their bid price at the reporting date. Unlisted available-for-sale financial assets are valued using recognised valuation techniques for the underlying security including discounted cash flows and similar unlisted equity valuation models.
(3) The carrying amount reported in the Consolidated Balance Sheet is estimated to approximate to fair value because of the short-term maturity of these instruments and, in the case of the receivables securitisation, the variable nature of the facility and repricing dates.
(4) The fair value of forward foreign currency and energy contracts is based on their listed market price if available. If a listed market price is not available, then fair value is estimated by discounting the difference between the contractual forward price and the current forward price for the residual maturity of the contract using a risk-free interest rate (based on government bonds). The fair value of interest rate swaps is based on discounting estimated future cash flows based on the terms and maturity of each contract and using market interest rates for a similar instrument at the measurement date.
(5) The fair value (level 2) of the senior credit facility is based on the present value of its estimated future cash flows discounted at an appropriate market discount rate at the balance sheet date.
(6) The fair value (level 2) is based on broker prices at the balance sheet date.
The fair value of the Company’s financial assets and financial liabilities approximates to their carrying values.

171
Strategic Report Governance FinancialsOverview
30. Lease obligations
Operating leasesFuture minimum lease payments under non-cancellable operating leases are as follows:
2017 2016€m €m
Within one year 90 86
Within two to five years 173 176
Over five years 87 93
350 355
The Group leases properties, plant and machinery and vehicles under operating leases. The leases have various terms, escalation clauses and renewal rights.
Finance leasesFuture minimum lease payments under finance leases together with the present value of the net minimum lease payments are as follows:
2017 2016
Minimumpayments
Present valueof minimum
paymentsMinimum
payments
Present valueof minimum
payments€m €m €m €m
Within one year 3 2 3 2
Within two to five years 5 3 6 4
Over five years 8 7 10 8
Total minimum lease payments 16 12 19 14
Less: amounts allocated to future finance costs (4) (5)
Present value of minimum lease payments 12 14
31. Related party transactionsThe principal related party relationships requiring disclosure under IAS 24, Related Party Disclosures pertain to the existence of subsidiaries and associates and transactions with these entities entered into by the Group and the identification and compensation of key management personnel as addressed in greater detail below.
Transactions with subsidiariesThe Consolidated Financial Statements include the Financial Statements of the Company and its subsidiaries and associates as documented in the accounting policies on page 122. A listing of the principal subsidiaries is provided on pages 173 to 174 of this document.
Sales to and purchases from, together with outstanding payables and receivables to and from, subsidiaries are eliminated in the preparation of the consolidated financial information in accordance with IFRS 10, Consolidated Financial Statements.
Transactions with associatesThe Group conducts certain transactions with associates in the normal course of business which are summarised as follows:
Sales and purchase of goods and services
2017 2016€m €m
Sale of goods 9 11
Purchase of goods - (3)
Rendering of services 1 1
Receiving of services (2) (2)
These transactions are undertaken and settled at normal trading terms. No guarantees are given or received by either party.
The receivables from related parties of €1 million (2016: €3 million) arise mainly from sale transactions and are due two months after the date of sale. The receivables are unsecured in nature and do not bear interest.
The payables to related parties are nil in the current year (2016: €1 million). These arise mainly from purchase transactions and are due two months after the date of purchase. The payables do not bear interest.
No provision has been made in 2017 or 2016 relating to balances with related parties.
Transactions with other related partiesThere were no transactions with other related parties during 2017. In the period to November 2016, the Group purchased, in the normal course of business, approximately 25,000 metric tonnes of paper amounting to approximately €14 million from Savon Sellu, a company which was controlled by Dermot Smurfit together with his brothers Dr. Michael Smurfit, former Chairman of the Group, and Alan Smurfit until November 2016.

Smurfit Kappa Annual Report 2017172
N OT E S TO T H E CO N S O L I DAT E D F I N A N C I A L STAT E M E N TS ( CO N T I N U E D)For the Financial Year Ended 31 December 2017
31. Related party transactions (continued)
Transactions with key management personnelFor the purposes of the disclosure requirements of IAS 24, the term ‘key management personnel’ (i.e. those persons having authority and responsibility for planning, directing and controlling the activities of the Company) comprises the Board of Directors and Secretary who manage the business and affairs of the Company.
2017 2016€m €m
Short-term employee benefits 4 3
Post-employment benefits 1 -
Share-based payment expense 1 1
Termination payment - 2
6 6
Information on the parent CompanyThe parent Company is an investment holding company and as a result, holds investments in the Group subsidiaries as financial assets. The parent Company also has receivables and payables with its subsidiaries entered into in the normal course of business. These balances are repayable on demand. The notes to the Company Balance Sheet disclose these various balances.
32. Business combinationsThe acquisitions completed by the Group during the year, together with percentages acquired and completion dates were as follows:
n Litbag, (100%, 10 February 2017), certain assets and the business of a bag-in-box company, located in Portugal;
n OAO Proizvodstvenno-Eksperimentalnaya Fabrika “Soyuz” (100%, 21 August 2017), an integrated corrugated plant, located in Moscow in Russia; and
n Chatziioannou Industrial and Commercial S.A. (100%, 24 November 2017), an integrated corrugated plant, located in Thessaloniki in Greece.
The assignment of fair values to identifiable net assets has been performed on a provisional basis for certain of these acquisitions due to their timing. In cases where the assessment of the fair value of individual items of property, plant and equipment has been completed, these fair values have been measured using a market based valuation methodology. Any amendments to these fair values will be made within the twelve month period from the date of acquisition, as permitted by IFRS 3, Business Combinations. None of the business combinations completed during the year were considered sufficiently material to warrant separate disclosure of the fair values attributable to those combinations.
Fair Value€m
Non-current assets
Property, plant and equipment 38Intangible assets 2
Current assets
Inventories 5Trade and other receivables 11Cash and cash equivalents 4
Non-current liabilities
Deferred income tax liabilities (5)Borrowings (9)Other payables (1)
Current liabilities
Borrowings (1)Trade and other payables (11)
Net assets acquired 33Goodwill 22Consideration 55
Settled by:
Cash 52Deferred consideration 3
55
The principal factors contributing to the recognition of goodwill are the realisation of cost savings and other synergies with existing entities in the Group which do not qualify for separate recognition as intangible assets.
None of the goodwill recognised is expected to be deductible for tax purposes.

173
Strategic Report Governance FinancialsOverview
32. Business combinations (continued)
Net cash outflow arising on acquisition €mCash consideration 52Less cash and cash equivalents acquired (net of bank overdrafts and demand loans used for cash management purposes) (3)Total 49
The gross contractual value of trade and other receivables as at the respective dates of acquisition amounted to €11 million. The fair value of these receivables is estimated at €11 million (all of which is expected to be recoverable).
Acquisition-related costs of €1 million were incurred and are included within administrative expenses in the Consolidated Income Statement.
The Group’s acquisitions in 2017 have contributed €17 million to revenue and €1 million of a profit for the financial year. The proforma revenue and profit of the Group for the year ended 31 December 2017 would have been €8,607 million and €425 million respectively had the acquisitions taken place at the start of the current reporting period.
No contingent liabilities were recognised on the acquisitions completed during the year.
There have been no acquisitions completed subsequent to the balance sheet date which would be individually material to the Group, thereby requiring disclosure under either IFRS 3, Business Combinations or IAS 10, Events after the Balance Sheet Date.
33. Profit dealt with in the parent CompanyIn accordance with Section 304 of the Companies Act 2014, the Company is availing of the exemption from presenting its individual Income Statement to the AGM and from filing it with the Registrar of Companies. A profit of €222 million (2016: a profit of €288 million) has been dealt with in the Income Statement of the Company.
34. Contingent liabilitiesDuring 2013, the Spanish Competition Authority (‘CNMC’) launched an investigation into several corrugated manufacturers based in Spain including SKG and the Spanish Association of Corrugated Cardboard Containers and Packaging Manufacturers (‘AFCO’). On 23 June 2015, SKG received notification from the CNMC of a fine for alleged anti-competitive conduct.
The Group considers that the fine is unjustified and that there is no basis upon which a fine can be levied. A formal appeal was lodged in December 2015 and the Group is confident of a successful outcome. Accordingly no provision has been made in respect of this fine in the Consolidated Financial Statements. In the event that the Group is unsuccessful in the appeal, the potential liability amounts to €8.1 million.
35. Principal subsidiariesEach of Smurfit Kappa Group plc, Smurfit Kappa Investments Limited, Smurfit Kappa Holdings Limited, Smurfit Kappa Corporation Designated Activity Company, Smurfit Kappa Funding Designated Activity Company and Smurfit Kappa Acquisitions Unlimited Company with an address at Beech Hill, Clonskeagh, Dublin 4, D04 N2R2, is a holding company with no operations of its own. Smurfit Kappa Acquisitions Unlimited Company is a Public Unlimited Company. A listing of the principal subsidiaries is set out below:
Subsidiaries(1) Principal activitiesCountry of incorporation(2)
Holding%
Cartón de Colombia, S.A.Calle 15 No. 18-109 Puerto Isaacs,Yumbo, Valle del Cauca, Colombia
Manufacture and sale of paperboard, paper sacks, writing paper and packaging products
Colombia 70
Cartón de Venezuela, S.A.Calle El Hatillo, Petare, Caracas, Municipio Sucre Edo. Miranda, 1070, Venezuela
Manufacture and sale of paperboard and packaging products
Venezuela 88
Grupo Smurfit México, S.A. de C.V.Torre Terret Norte Piso 8, Miguel de Cervantes Saavedra 301, Colonia Granada, Ciudad de México 11520, Mexico
Manufacture and sale of paperboard and packaging products
Mexico 100
Nettingsdorfer Papierfabrik AG & Co KGNettingsdorfer Straße 40,4053 Haid bei Ansfelden, Austria
Manufacture and sale of containerboard and holding company for Austrian operations which manufacture corrugated board
Austria 100
Smurfit International B.V.Warandelaan 2, 4904 PC Oosterhout,The Netherlands
Principal international holding company Netherlands 100
Smurfit Kappa de Argentina, S.A.Paque Saenz Pena 308 – 8th Floor,Buenos Aires, Argentina
Manufacture and sale of paperboard and packaging products
Argentina 100
Smurfit Kappa Deutschland GmbHTilsiter Straße 162,22047 Hamburg, Germany
Holding company for German operations whose principal activities are the manufacture and sale of paperboard, solidboard and packaging products
Germany 100

Smurfit Kappa Annual Report 2017174
N OT E S TO T H E CO N S O L I DAT E D F I N A N C I A L STAT E M E N TS ( CO N T I N U E D)For the Financial Year Ended 31 December 2017
Subsidiaries(1) Principal activitiesCountry of incorporation(2)
Holding%
Smurfit Kappa Europe B.V.Evert van den Beekstraat 1-104, 1118 CL Schiphol, The Netherlands
International holding company Netherlands 100
Smurfit Kappa Holdings Italia, S.p.A.Strada Serravalle 65,15067 Novi Ligure (AL), Italy
Holding company for Italian operations whose principal activities are the manufacture and sale of paperboard and packaging products
Italy 100
Smurfit Kappa Holdings US, Inc.1301 International Parkway,Suite 550, Sunrise,Florida 33323, United States
Holding company for North American and certain Mexican operations whose principal activities are the manufacture and sale of paperboard and packaging products
United States 100
Smurfit Kappa Ireland LimitedBeech Hill, Clonskeagh, Dublin 4, D04 N2R2, Ireland
Manufacture and sale of packaging products Ireland 100
Smurfit Kappa Kraftliner Piteå ABSE – 941 86, Piteå, Sweden
Manufacture and sale of containerboard and holding company for Swedish operations and other countries which manufacture and sell packaging products
Sweden 100
Smurfit Kappa Nederland B.V.Warandelaan 2, 4904 PC Oosterhout,The Netherlands
Holding company for Dutch operations which manufacture and sell paperboard and packaging products
Netherlands 100
Smurfit Kappa Nervión, S.A.B Arriandi s/n, 48215 lurreta,Vizcaya, Spain
Manufacture and sale of sack paper and holding company for Spanish and Portuguese operations whose principal activities are the manufacture and sale of paperboard and packaging products
Spain 100
Smurfit Kappa Packaging UK LimitedCunard Building, Pier Head, Liverpool, LS3 1SF, United Kingdom
Holding company for United Kingdom operations whose principal activities are the manufacture and sale of paperboard and packaging products
England 100
Smurfit Kappa Participações do Brasil Ltda.Rua Castilho, 392, Cj.162, Brooklin, São Paulo, SP-Brasil, CEP 04568-010
Holding company for Brazilian operations whose principal activities are the manufacture and sale of paperboard and packaging products
Brazil 100
Smurfit Kappa Participations SAS5 Avenue du Général de Gaulle,94160 Saint Mandé, France
Holding company for French operations whose activities are the manufacture and sale of paperboard and packaging products
France 100
Smurfit Kappa Treasury Unlimited CompanyBeech Hill, Clonskeagh, Dublin 4, D04 N2R2, Ireland
Finance company Ireland 100
(1) A full list of subsidiaries and associates will be annexed to the Annual Return of the Company to be filed with the Irish Registrar of Companies.(2) The companies operate principally in their countries of incorporation.
Section 357 GuaranteesPursuant to the provisions of Section 357, Companies Act 2014, Smurfit Kappa Group plc has irrevocably guaranteed all commitments entered into by certain of its Irish subsidiaries (including the liabilities of such subsidiaries) and as a result such subsidiaries have been exempted from the filing provisions of Section 347, Companies Act 2014. These Irish subsidiaries are as follows – Belgray Holdings Unlimited Company, Brenchley Limited, Claystoke Designated Activity Company, Damous Limited, DLRS (Holdings) Limited, DLRS Limited, Gorda Limited, Iona Print Limited, iVenus Limited, Jefferson Smurfit & Sons Limited, Margrave Investments Limited, Smurfit International Designated Activity Company, Smurfit Investments (Ireland) Limited, Smurfit Kappa Corporation Designated Activity Company, Smurfit Kappa Funding Designated Activity Company, Smurfit Kappa Holdings Limited, Smurfit Kappa Investments Limited, Smurfit Kappa Ireland Limited, Smurfit Kappa Irish Paper Sacks Limited, Smurfit Kappa Leasing Unlimited Company, Smurfit Kappa News Press Limited, Smurfit Kappa Packaging Limited, Smurfit Kappa Services Limited, Smurfit Kappa Treasury Unlimited Company, Smurfit Kappa Treasury Funding Designated Activity Company, Smurfit Kappa Treasury Receivables Designated Activity Company, Smurfit Natural Resources Limited, Smurfit Securities Limited.
Article 403 GuaranteesSmurfit Kappa Group plc has, in accordance with Article 403, Book 2 of the Dutch Civil Code, guaranteed the debts of its following Dutch subsidiaries – Adavale (Netherlands) B.V., Smurfit International B.V., Smurfit Corrugated B.V., Smurfit Holdings B.V., Smurfit Investments B.V., Packaging Investments Netherlands (PIN) B.V., Packaging Investments Holdings (PIH) B.V., Smurfit Kappa Europe B.V., Smurfit Kappa Nederland B.V., Smurfit Kappa Technical Services B.V., Smurfit Kappa Corrugated Benelux B.V., Smurfit Kappa TWINCORR B.V., Smurfit Kappa MNL Golfkarton B.V., Smurfit Kappa Van Dam Golfkarton B.V., Smurfit Kappa Vandra B.V., Smurfit Kappa Orko-Pak B.V., Smurfit Kappa ELCORR B.V., Smurfit Kappa Trobox Kartonnages B.V., Smurfit Kappa Zedek B.V., Smurfit Kappa North East Europe Head Office B.V., Kartonfabriek Brittania B.V., Smurfit Kappa Recycling B.V., Smurfit Kappa Development Centre B.V., Smurfit Kappa Paper Services B.V., Smurfit Kappa Roermond Papier B.V., Kappa Holding (Nederland) B.V., Smurfit Kappa RapidCorr Eindhoven B.V., Smurfit Kappa Group IS Nederland B.V., Smurfit Kappa Finance B.V., Smurfit Kappa Hexacomb B.V.
35. Principal subsidiaries (continued)

175
Strategic Report Governance FinancialsOverview
35. Principal subsidiaries (continued)
Non-controlling interestsThe total non-controlling interests at 31 December 2017 is €151 million (2016: €174 million), of which €121 million (2016: €132 million) relates to Cartón de Colombia S.A. The non-controlling interests in respect of the Group’s other subsidiaries are not considered to be material.
Name Principal activitiesCountry of incorporation
Ownership interest held by non-controlling interest %
2017 2016
Cartón de Colombia S.A. Manufacture and sale of paperboard, paper sacks, writing paper and packaging products
Colombia 30 30
The profit allocated to the non-controlling interest of this subsidiary in the Group’s financial statements is €8 million (2016: €14 million).
The total comprehensive expense allocated to the non-controlling interest of this subsidiary in the Group’s financial statements is €7 million (2016: income of €24 million).
Summarised financial informationThe following is summarised financial information for Cartón de Colombia S.A., prepared in accordance with IFRS. The information is before intercompany eliminations with other Group companies.
Summarised income statement
2017 2016€m €m
Revenue 362 342
Profit before income tax 46 58
Income tax expense (14) (13)
Profit for the financial year 32 45
Other comprehensive (expense)/income (49) 29
Total comprehensive (expense)/income (17) 74
Summarised balance sheet2017 2016
€m €m
Current assets 140 160
Non-current assets 407 435
Current liabilities (111) (123)
Non-current liabilities (53) (56)
Net assets 383 416
Summarised cash flow2017 2016
€m €m
Cash flows from operating activities 40 35
Cash flows from investing activities (45) (41)
Cash flows from financing activities 3 7
Net (decrease)/increase in cash and cash equivalents (2) 1
Dividends paid to non-controlling interest during the year(1) 3 4
(1) Included in cash flows from financing activities.
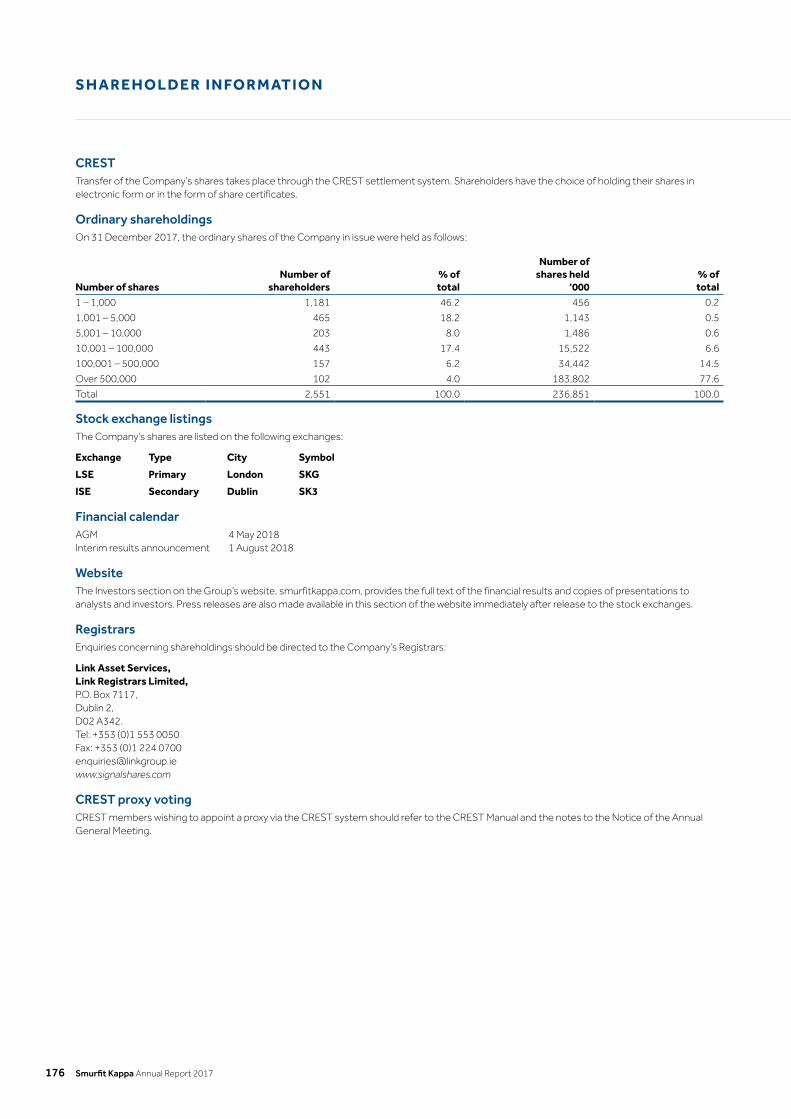
Smurfit Kappa Annual Report 2017176
S H A R E H O L D E R I N FO R M AT I O N
CRESTTransfer of the Company’s shares takes place through the CREST settlement system. Shareholders have the choice of holding their shares in electronic form or in the form of share certificates.
Ordinary shareholdingsOn 31 December 2017, the ordinary shares of the Company in issue were held as follows:
Number of shares Number of
shareholders% oftotal
Number ofshares held
‘000% oftotal
1 – 1,000 1,181 46.2 456 0.2
1,001 – 5,000 465 18.2 1,143 0.5
5,001 – 10,000 203 8.0 1,486 0.6
10,001 – 100,000 443 17.4 15,522 6.6
100,001 – 500,000 157 6.2 34,442 14.5
Over 500,000 102 4.0 183,802 77.6
Total 2,551 100.0 236,851 100.0
Stock exchange listingsThe Company’s shares are listed on the following exchanges:
Exchange Type City Symbol
LSE Primary London SKG
ISE Secondary Dublin SK3
Financial calendarAGM 4 May 2018Interim results announcement 1 August 2018
WebsiteThe Investors section on the Group’s website, smurfitkappa.com, provides the full text of the financial results and copies of presentations to analysts and investors. Press releases are also made available in this section of the website immediately after release to the stock exchanges.
RegistrarsEnquiries concerning shareholdings should be directed to the Company’s Registrars:
Link Asset Services, Link Registrars Limited, P.O. Box 7117, Dublin 2, D02 A342. Tel: +353 (0)1 553 0050 Fax: +353 (0)1 224 0700 [email protected] www.signalshares.com
CREST proxy votingCREST members wishing to appoint a proxy via the CREST system should refer to the CREST Manual and the notes to the Notice of the Annual General Meeting.

Printed on paper sourced from sustainably managed forests
Des
ign
by fa
brik
.ie
The photos in this report have been taken in a number of locations across the 35 countries in which we operate including Colombia, Germany, Mexico, the Netherlands, Spain, Sweden, Switzerland and the UK.
(Photos at our mill in Pitea, Sweden on page 42 and page 64 (top photo) were taken by Caroline Lundmark.)
Beech Hill, Clonskeagh, Dublin 4, Ireland +353 1 202 7000 | smurfitkappa.com
Smurfit Kappa Group plc


