JUTEI Edisi Volume.3 No.2 Oktober 2019 ISSN 2579-3675, e-ISSN 2579-5538 DOI 10.21460/jutei.2019.32.183 85 Building Data Warehouse and Dashboard of Church Congregation Data Ragil Yoga Irawan 1 , Budi Susanto 2 , Yuan Lukito 3 Informatics Department, Duta Wacana Christian University Jl. Dr. Wahidin Sudirohusodo No. 5 - 25, Yogyakarta, Indonesia 1 [email protected]2 [email protected]3 [email protected]Abstract— A data warehouse is essential for an organization to process and analyze data coming from the organization. Hence, a data warehouse together with a dashboard to visualize the processed data are built to accommodate the need of the church administrator to analyze a large set of church congregation data. The data warehouse is built using the Kimball principle. This Kimball principle emphasizes the implementation of a dimensional model in the data warehouse, not a relational model used in a regular transactional database. An ETL process that contains extract, transform and load processes is used to retrieve all data from the regular transactional database and transform the data so the data can be loaded into the data warehouse. A dashboard is then built to visualize the data from the data warehouse so the users can view the processed data easily. Users can also export the processed data into an excel file that can be downloaded from the dashboard. A web service is built to get data from the data warehouse and return it to the dashboard. Keywords— data warehouse, Kimball principle, church congregation, etl, dimensional model, dashboard, web service I. INTRODUCTION GKI (Gereja Kristen Indonesia/The Indonesian Christian Church) is a group consisting of Protestant Christian churches in Indonesia headquartered in Jakarta, Indonesia [1]. GKI Sinode Wilayah Jawa Tengah or Jawa Tengah Regional Synod of GKI is a smaller group of GKI located in Jawa Tengah province of Indonesia headquartered in Magelang, Jawa Tengah, Indonesia. With a large size of data being generated consistently from all churches in Jawa Tengah Regional Synod of GKI, it raises the need to process and analyze those data, therefore, the church administrators can comprehend the data related to the states of their churches. A data warehouse is chosen to store the data generated from the churches because of its ability to process and analyze a large size of data. Inmon [2] defined a data warehouse as a subject-oriented, integrated, non-volatile, and time-variant collection of data in support of management's decisions. A data warehouse is specially designed to store, filter, retrieve, and analyze very large collections of data [3]. Kimball principle is used to build a data warehouse [4]. Kimball principle emphasizes the use of dimensional modeling in the data warehouse. Data from a relational database will be loaded into the data warehouse using an ETL (Extract, Transform, Load) process. A web service will then be built to retrieve data from the data warehouse. The retrieved data will then be visualized through a dashboard. Users can view and analyze the processed data using this dashboard. The processed data can also be exported into an excel file using this dashboard. Höpken, Fuchs, Höll, Keil, and Lexhagen [5] researched how to utilize abundant tourism destination data of Sweden that is unused. In this research, a DMIS (Destination Management Information System) is built using the implementation of business intelligence methods, data warehouse, and OLAP (Online Analytical Processing) functions. It resulted in the success of demonstrating the effectiveness of the multidimensional modeling paradigm in support of robust and flexible OLAP analysis. Mali [6] researched how to use a data warehouse built using the Kimball method to analyze tennis players' performance. This research examined whether temperature, wind speed, court type, and court surface affect tennis players' performance. The data used in this research was the data of tennis tournament statistics for 2014. The goal of this research is to build a data warehouse and a dashboard of church congregation data of Jawa Tengah Regional Synod of GKI. This research is expected to benefit the users, in this case, the church administrators, in the form of helping them analyze church congregation data and make an annual report in a form of PURJ (Perlawatan Umum Rutin Jemaat/Routine General Visitation of Church Congregation) document. II. THEORETICAL FRAMEWORK Below are explanations of theories and methods used in this research. A. Jawa Tengah Regional Synod of GKI GKI Sinode Wilayah Jawa Tengah or Jawa Tengah Regional Synod of GKI is one of many synods of GKI located in the Jawa Tengah province of Indonesia headquartered in Magelang, Jawa Tengah, Indonesia. It consists of eight presbyteries, each of which has its churches. B. Data Warehouse Inmon [2] defined a data warehouse as a subject- oriented, integrated, non-volatile, and time-variant collection of data in support of management's decisions. It is subject- oriented because of its ability to be used to analyze a particular subject area, integrated because of its ability to
Transcript
JUTEI Edisi Volume.3 No.2 Oktober 2019 ISSN 2579-3675, e-ISSN 2579-5538 DOI 10.21460/jutei.2019.32.183
85
Building Data Warehouse and Dashboard of Church Congregation Data
Ragil Yoga Irawan1, Budi Susanto2, Yuan Lukito3
Informatics Department, Duta Wacana Christian University Jl. Dr. Wahidin Sudirohusodo No. 5 - 25, Yogyakarta, Indonesia
Abstract— A data warehouse is essential for an organization to process and analyze data coming from the organization. Hence, a data warehouse together with a dashboard to visualize the processed data are built to accommodate the need of the church administrator to analyze a large set of church congregation data. The data warehouse is built using the Kimball principle. This Kimball principle emphasizes the implementation of a dimensional model in the data warehouse, not a relational model used in a regular transactional database. An ETL process that contains extract, transform and load processes is used to retrieve all data from the regular transactional database and transform the data so the data can be loaded into the data warehouse. A dashboard is then built to visualize the data from the data warehouse so the users can view the processed data easily. Users can also export the processed data into an excel file that can be downloaded from the dashboard. A web service is built to get data from the data warehouse and return it to the dashboard. Keywords— data warehouse, Kimball principle, church congregation, etl, dimensional model, dashboard, web service
I. INTRODUCTION GKI (Gereja Kristen Indonesia/The Indonesian
Christian Church) is a group consisting of Protestant Christian churches in Indonesia headquartered in Jakarta, Indonesia [1]. GKI Sinode Wilayah Jawa Tengah or Jawa Tengah Regional Synod of GKI is a smaller group of GKI located in Jawa Tengah province of Indonesia headquartered in Magelang, Jawa Tengah, Indonesia. With a large size of data being generated consistently from all churches in Jawa Tengah Regional Synod of GKI, it raises the need to process and analyze those data, therefore, the church administrators can comprehend the data related to the states of their churches.
A data warehouse is chosen to store the data generated from the churches because of its ability to process and analyze a large size of data. Inmon [2] defined a data warehouse as a subject-oriented, integrated, non-volatile, and time-variant collection of data in support of management's decisions. A data warehouse is specially designed to store, filter, retrieve, and analyze very large collections of data [3].
Kimball principle is used to build a data warehouse [4]. Kimball principle emphasizes the use of dimensional modeling in the data warehouse. Data from a relational database will be loaded into the data warehouse using an ETL (Extract, Transform, Load) process. A web service will then be built to retrieve data from the data warehouse. The
retrieved data will then be visualized through a dashboard. Users can view and analyze the processed data using this dashboard. The processed data can also be exported into an excel file using this dashboard.
Höpken, Fuchs, Höll, Keil, and Lexhagen [5] researched how to utilize abundant tourism destination data of Sweden that is unused. In this research, a DMIS (Destination Management Information System) is built using the implementation of business intelligence methods, data warehouse, and OLAP (Online Analytical Processing) functions. It resulted in the success of demonstrating the effectiveness of the multidimensional modeling paradigm in support of robust and flexible OLAP analysis.
Mali [6] researched how to use a data warehouse built using the Kimball method to analyze tennis players' performance. This research examined whether temperature, wind speed, court type, and court surface affect tennis players' performance. The data used in this research was the data of tennis tournament statistics for 2014.
The goal of this research is to build a data warehouse and a dashboard of church congregation data of Jawa Tengah Regional Synod of GKI. This research is expected to benefit the users, in this case, the church administrators, in the form of helping them analyze church congregation data and make an annual report in a form of PURJ (Perlawatan Umum Rutin Jemaat/Routine General Visitation of Church Congregation) document.
II. THEORETICAL FRAMEWORK Below are explanations of theories and methods used in
this research.
A. Jawa Tengah Regional Synod of GKI GKI Sinode Wilayah Jawa Tengah or Jawa Tengah
Regional Synod of GKI is one of many synods of GKI located in the Jawa Tengah province of Indonesia headquartered in Magelang, Jawa Tengah, Indonesia. It consists of eight presbyteries, each of which has its churches.
B. Data Warehouse Inmon [2] defined a data warehouse as a subject-
oriented, integrated, non-volatile, and time-variant collection of data in support of management's decisions. It is subject-oriented because of its ability to be used to analyze a particular subject area, integrated because of its ability to
Ragil Yoga Irawan, Budi Susanto, Yuan Lukito
86
JUTEI Edisi Volume.3 No.2 Oktober 2019
ISSN 2579-3675, e-ISSN 2579-5538 DOI 10.21460/jutei.2019.32.183
integrates data from multiple data sources, non-volatile because of the data inside a data warehouse will not change once the data is loaded into it, and time-variant because of its ability to keep historical data.
C. Kimball Principle Kimball principle is a principle proposed by Kimball
that is used to build a data warehouse. Kimball principle emphasizes the use of dimensional modeling in the data warehouse [7]. Figure 1 below is the data warehouse architecture proposed by Kimball.
D. Dimensional Model Dimensional modeling is widely accepted as the
preferred technique for presenting analytic data because it can deliver data that's understandable to the business users and can deliver fast query performance [7]. Dimensional model is also chosen to build a data warehouse in this research because unlike the relational model in which the goals are to do transactional activities such as adding, updating, and deleting data, the main goal of the dimensional model is to read data stored in a data warehouse. A dimensional model stores data in a denormalized form, or at least partly denormalized form, while a relational model stores data in a normalized form to avoid redundancy [8].
Dimensional model implementation in a data warehouse can be achieved using a schema called star schema. This schema is called star schema because of its shape that resembles a star as depicted in figure 2 below.
Figure 2. Star Schema [7]
A star schema mainly consists of dimensional tables, hence, is called a dimensional model, and fact tables. A dimensional table is a table consisting of dimensions/descriptions of data composing a fact table. A fact table is a table consisting of facts related to a certain business process. Besides star schema, there is another
schema called snowflake schema because of its shape that resembles a snowflake as depicted in figure 3 below.
Figure 3. Snowflake schema
A snowflake schema is derived from a star schema by dividing one or some dimension tables into some smaller dimension table, therefore the dimension tables in this schema are partly normalized.
E. ETL Process An ETL (Extract, Transform, Load) process is used to
load church congregation data from the source database into the data warehouse. ETL processes are responsible for the extraction of the appropriate data from the sources, their transportation to a special-purpose area of the data warehouse where they will be processed, the transformation of the source data and the computation of new values (and, possibly records) in order to obey the structure of the data warehouse relation to which they are targeted, the isolation and cleansing of problematic tuples, in order to guarantee that business rules and databases constraints are respected and the loading of the cleansed, transformed data to the appropriate relation in the warehouse, along with the refreshment of its accompanying indexes and materialized views [9].
F. Dashboard A dashboard is a visual display of the most important
information needed to achieve one or more objectives; consolidated and arranged on a single screen so the information can be monitored at a glance [10]. The data stored in the data warehouse will be processed into useful information that will be visualized in a dashboard in forms of tables, diagrams, and graphs. Figure 4 below depicts an example of a dashboard.
G. Greenplum Database According to Pivotal Software, Inc. [11], Greenplum
Database is a massively parallel processing (MPP) database server with an architecture specially designed to manage large-scale analytic data warehouses and business intelligence workloads. MPP (also known as a shared-nothing architecture) refers to systems with two or more processors that cooperate to carry out an operation, each processor with its own memory, operating system and disks [11]. Greenplum Database is chosen in this research because
Building Data Warehouse and Dashboard of Church Congregation Data
JUTEI Edisi Volume.3 No.2 Oktober 2019 ISSN 2579-3675, e-ISSN 2579-5538 DOI 10.21460/jutei.2019.32.183
87
of its ability to handle and process a large quantity of data.
H. Pentaho Data Integration Pentaho Data Integration (PDI) provides the Extract,
Transform, and Load (ETL) capabilities that facilitate the process of capturing, cleansing, and storing data using a uniform and consistent format that is accessible and relevant to end-users and IoT technologies [12]. PDI, which also referred to as Kettle, provides a set of tools consisting of Spoon, Pan, Kitchen, and Carte. Spoon is the graphical interface used to create transformation and jobs. Pan is a batch-style command-line tool used to run transformations. Kitchen is a batch-style command-line tool used to run jobs. Carte is a web server that can be used to run jobs on remote servers. A transformation is a set of ETL processes that consists of retrieving data from the source databases, transforming the data, and loading the data into the target data storage. A job is a set of transformations.
I. Web Service A web service is a software system designed to support
interoperable machine-to-machine interaction over a network [13]. A web service is designed to communicate with another machine/application, unlike a regular web application that is designed to communicate directly with the users. A web service can return data in many formats such as XML (Extensible Markup Language) and JSON (JavaScript Object Notation). The web service built in this research is a RESTful web service, a web service that is based on REST (REpresentational State Transfer). A REST is an architectural style for networked hypermedia applications, primarily used to build web services that are lightweight, maintainable, and scalable [14]. The protocols used in a RESTful web service are the HTTP (HyperText Transfer Protocol) protocols such as GET, POST, PUT, and DELETE.
J. PURJ Document PURJ (Perlawatan Umum Rutin Jemaat/Routine
General Visitation of Church Congregation) document is an official annual church document consisting of church and the congregation data. This document is made to help the church administrators to analyze the church congregation data produced in one year.
III. RESEARCH METHODOLOGY
A. System Requirements The system of data warehouse and dashboard must meet
the non-functional requirements as explained below. 1. The ETL process can be executed automatically without
having the users to execute it manually. 2. The dashboard can be accessed using most web browsers. 3. The dashboard is using services provided by Auth0 to
handle the user's authentication process. The system of data warehouse and dashboard must meet
the non-functional requirements as explained below. 1. The system can execute an ETL process from the source
database into the data warehouse. 2. The system can display the data about a church in one
year in the form of a table. 3. Users can add or edit data about visi (vision), misi
(mission), and strategi pencapaian (achievement strategy) of the church.
4. The system can display the general data of the church congregation in one year in the form of a table.
5. The system can display the data of the church congregation on an age category, education category, job category, and ethnic group category in one year in the form of a table and a graph.
6. The system can display the data of the average attendance number in a church service and activity in one year in the form of a table and a graph.
7. The system can display the data of the amount of the church administrators and the church reverends in one year in the form of a table and a graph.
8. Users can download all of the data displayed in the dashboard in the form of an excel file called PURJ document.
B. Research Materials The data used in this research is a sample data of the
church congregation in the Jawa Tengah Regional Synod of GKI. This sample data contains information relevant to the church congregation and the church itself such as information about name, address, date of birth, family, and educational background of a church congregation. The data also contains information about the church's profile, information about the fields, the commissions or the teams, services' schedules, reverends, administrators of the church, and also information about events such as attestations, marriages, births, deaths, and baptism. Figure 5 below depicts the ERD of the source database.
Figure 5. The source database's ERD
Ragil Yoga Irawan, Budi Susanto, Yuan Lukito
88
JUTEI Edisi Volume.3 No.2 Oktober 2019
ISSN 2579-3675, e-ISSN 2579-5538 DOI 10.21460/jutei.2019.32.183
C. System Design 1) Flow Diagram: Figure 6 below depicts the flow diagram of the system.
Figure 6. System flow diagram
First, the data will be retrieved from the source database and will be transformed and loaded into the data warehouse by using the ETL process. Then, the data from the data warehouse will be visualized through a dashboard in the forms of tables and graphs. The data visualized in the dashboard is extracted from the data warehouse by using a RESTful web service. 2) Use Case Diagram: Figure 7 below depicts the use case diagram of the system.
Figure 7. Use case diagram
There are two types of user in this system, an administrator and a regular user. A regular user can access some functions such as login, PURJ download, view data
about the church, view data about the church congregation, view data about the attendance number, view data about the church administrators and view data about the church reverends. Meanwhile, an administrator can access all functions a regular user can access with the additions of being able to edit visi (vision), misi (mission), and strategi pencapaian (achievement strategy) data.
The login process will verify and authenticate login attempts and display a failed login page if the verification and authentication process failed. The edit data about visi (vision), misi (mission), and strategi pencapaian (achievement strategy) process will save the edited data into a database in the system. The data warehouse will provide the data for the PURJ download process, view data about the church process, view data about the church congregation process, view data about the attendance number process, view data about the church administrators process, and view data about the church reverends process. 3) System Architecture: Figure 8 below depicts the system architecture of the data warehouse and the dashboard.
Figure 8. System architecture
The ETL process will retrieve data from a relational database built with Apache Derby. Through the ETL process, relational data from the source database will be transformed into dimensional data and loaded into the data warehouse built with Greenplum Database. A RESTful web service is built using CakePHP, a PHP framework, to facilitate the retrieval of data from the data warehouse using SQL queries. Finally, a dashboard built using VueJS with Vuetify, a javascript framework with a material design will provide the data returned from the web service to the users and visualize it into tables and graphs. A service from Auth0 will be used to handle the authentication mechanism of the dashboard. 4) ERD (Entity Relationship Diagram): Figure 9 below depicts the ERD of the data warehouse but only with its primary keys.
The ERD of the data warehouse uses snowflake schema, that has a fact table (fact_kehadiran) and some dimensional tables (dim_gereja, dim_kebaktian, dim_kegiatan, and dim_waktu) that provide details to the fact table. Some of the dimensional tables also have their dimensional tables, to provide details to the dimensional table itself. This ERD model conforms to the Kimball principle for building a data
g y
Building Data Warehouse and Dashboard of Church Congregation Data
JUTEI Edisi Volume.3 No.2 Oktober 2019 ISSN 2579-3675, e-ISSN 2579-5538 DOI 10.21460/jutei.2019.32.183
89
warehouse, where a dimensional model is used for the data inside the data warehouse [7]. A more detailed ERD of the data warehouse with each of its attributes is depicted in figure 10 below.
Figure 9. Simple data warehouse ERD
Figure 10. More detailed data warehouse ERD
There is also a regular relational database built using MariaDB alongside the data warehouse. This database is built for storing data about users, visi (vision), misi (mission), and strategi pencapaian (achievement strategy). The ERD of the said database is depicted in figure 11 below.
Figure 11. Database ERD in the system to store data about visi (vision),
misi (mission), and strategi pencapaian (achievement strategy)
IV. RESULTS AND DISCUSSION The first and foremost thing to do is to make the tables
in the data warehouse using the Kimball principle. As
explained before, the Kimball principle is used to build a data warehouse where the data inside the data warehouse is stored in a dimensional model [7]. Thus, there will be a fact table and dimensional tables in the data warehouse to store the data from the source database after running an SQL script containing create dimensional tables and fact table commands.
Then, ETL processes will be executed to load the data from the source database to the data warehouse. Each of the tables on the data warehouse will have its transformation process to load data from the corresponding tables in the source database. Figure 12 below is one of those transformation processes, this transformation process belongs to dim_gereja table on the data warehouse.
Figure 12. Dim_gereja transformation
The "Table Gereja Input" process will retrieve data from gereja table in the source database. The data retrieved from gereja table in the source database is depicted in figure 13 below.
Figure 13. Data from gereja table
The next process is to do look up with the data from dim_klasis table in the data warehouse using the "Dim Klasis Stream Lookup" process. The purpose of this process is to retrieve the dimension key from dim_klasis table in the warehouse that matches the reference key of the klasis data from the data of the gereja table in the source database. Then, the "Dimension lookup/table" process will load the data from the previous process to the dim_gereja table in the data warehouse. The data loaded into the dim_gereja table in the data warehouse is depicted in figure 14 below.
Figure 14. Data loaded into dim_gereja table
For the fact table in the data warehouse (fact_kehadiran), it requires two transformation processes, because it has two source tables from the source database. Figure 15 and 16 below depicts one of the transformation processes of fact_kehadiran table in the data warehouse from the kehadiran_kebaktian table in the source database.
The "Kehadiran Kebaktian Table Input" process will retrieve data from kehadiran_kebaktian table in the source database. The data from kehadiran_kebaktian table in the source database is depicted in figure 17 below.
Ragil Yoga Irawan, Budi Susanto, Yuan Lukito
90
JUTEI Edisi Volume.3 No.2 Oktober 2019
ISSN 2579-3675, e-ISSN 2579-5538 DOI 10.21460/jutei.2019.32.183
The next process is to do look up with the data from dim_klasis and dim_gereja table in the data warehouse to retrieve the dimension key of dim_klasis and dim_gereja table in the data warehouse using "Dim_Klasis Stream Lookup" and "Dim Gereja Stream Lookup" process. The "Filter Bidang or Komisi" process will separate the types of kehadiran data retrieved from the source database. If it's a bidang type, then a look up will be executed with dim_bidang table in the data warehouse. If it's a komisi type, then a look up will be executed with dim_komisi table in the data warehouse. This process is intended to retrieve the dimension key according to the type of kehadiran data from the source table. Then, a look up process will be executed again with the dim_kebaktian, dim_gereja, and dim_waktu table to get the dimension key of the dim_kebaktian, dim_gereja, and dim_waktu. The last process is to load the data up until the last process to the fact_kehadiran table in the data warehouse. Figure 18 depicts the data loaded to the fact_kehadiran table in the data warehouse.
A job is then created to run all transformation processes of all the tables in the data warehouse sequentially. This process begins with setting the connection attributes of the source database and then using those attributes to connect with the said database. After the connections are successfully established, all of the transformation processes of all the tables in the data warehouse will be executed sequentially. Figure 19 below depicts the job explained before.
Figure 19. Job to run all transformations
Lastly, one more job is created to run the complete ETL process. Figure 20 depicts the job to run the complete ETL process.
Figure 20. Job to run the complete ETL process
This job starts with reading a CSV file containing the source database connections attributes, such as hostnames, database names, usernames, and passwords as depicted below.
Building Data Warehouse and Dashboard of Church Congregation Data
JUTEI Edisi Volume.3 No.2 Oktober 2019 ISSN 2579-3675, e-ISSN 2579-5538 DOI 10.21460/jutei.2019.32.183
91
After getting those attributes, this job will run the job in
figure 19. After the job is successfully executed, the whole ETL process is done. The job in figure 20 can be executed automatically without having the user manually executing it using a tool provided by Pentaho Data Integrator called kitchen. The users can run the job in figure 20 using below syntax.
After all the ETL processes are done, a RESTful web
service is built using CakePHP, a PHP framework, with a purpose to communicate directly with the data warehouse and the database containing data about visi (vision), misi (mission), and strategi pencapaian (achievement strategy). The source code below is the connections attributes in the web service to connect to the data warehouse and the said database.
This web service accepts HTTP request methods like GET, POST, PUT, and DELETE and then returns a JSON data according to the request method it gets. Below is the example of HTTP GET request that will return the data about the church.
Then, a dashboard is also built using Vue.js, a progressive javascript framework, accompanied by Vuetify, a material design library to serve the purpose of providing the users with visualized data retrieved from the data warehouse by sending HTTP requests to the RESTful web service explained before. Figure 21 below is the login page for the dashboard, built using the service provided by Auth0.
Figure 21. Dashboard login page
Figure 22 below is the main page of the dashboard after the user has been successfully logged in and when the user has not chosen any year and menu.
Figure 22. Dashboard main page
Figure 23 below is one example of the dashboard page containing visualized data from the data warehouse in a table form.
Figure 23. Data visualization in table form in the dashboard
ISSN 2579-3675, e-ISSN 2579-5538 DOI 10.21460/jutei.2019.32.183
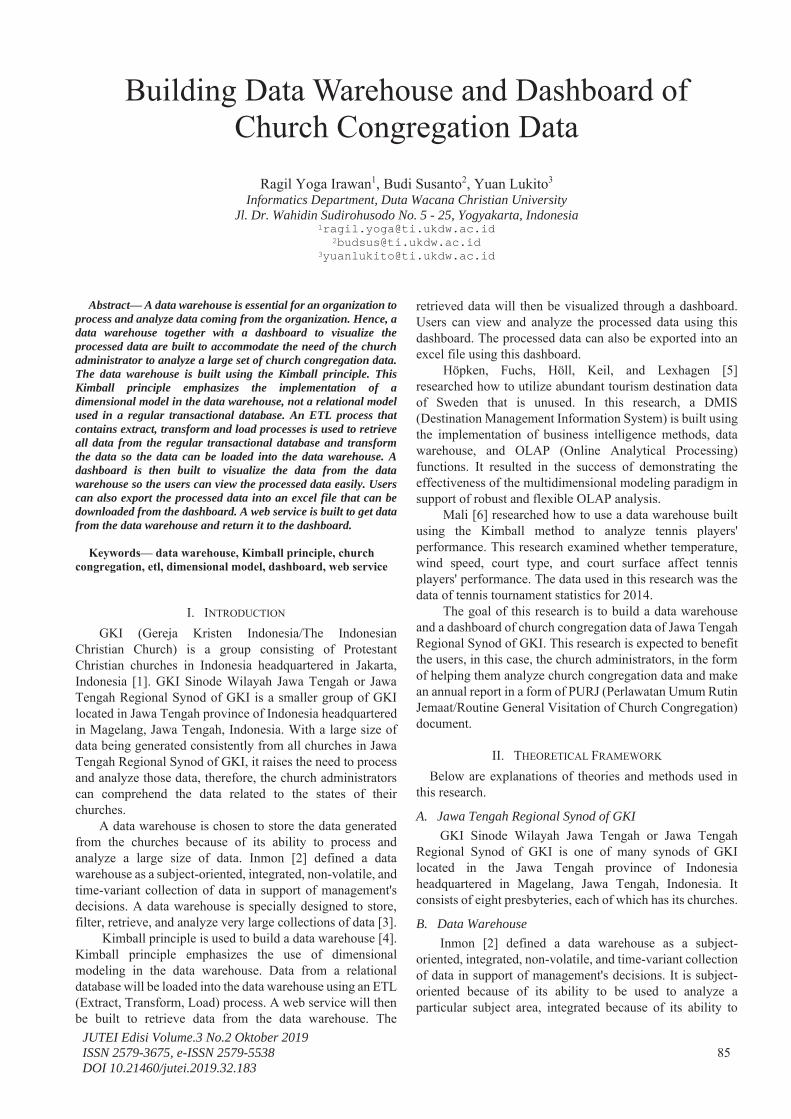
Figure 24 below is one example of the dashboard page containing visualized data from the data warehouse in a graph form.
Figure 24. Data visualization in graph form in the dashboard
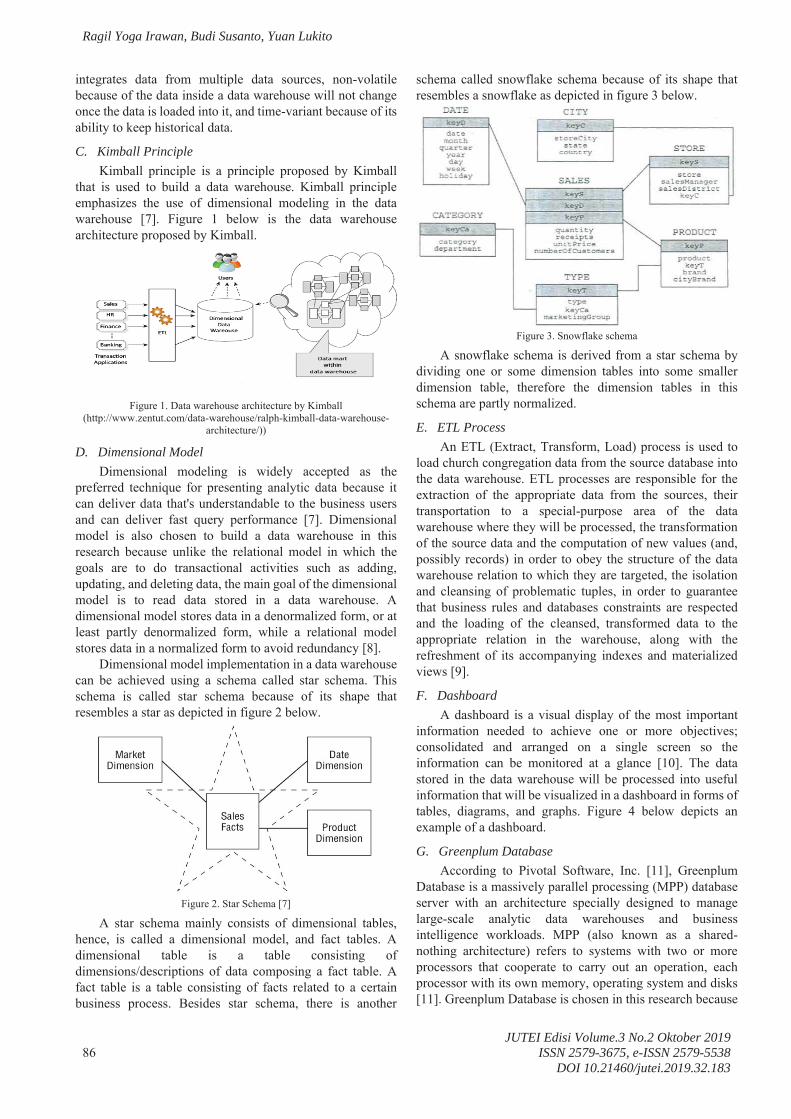
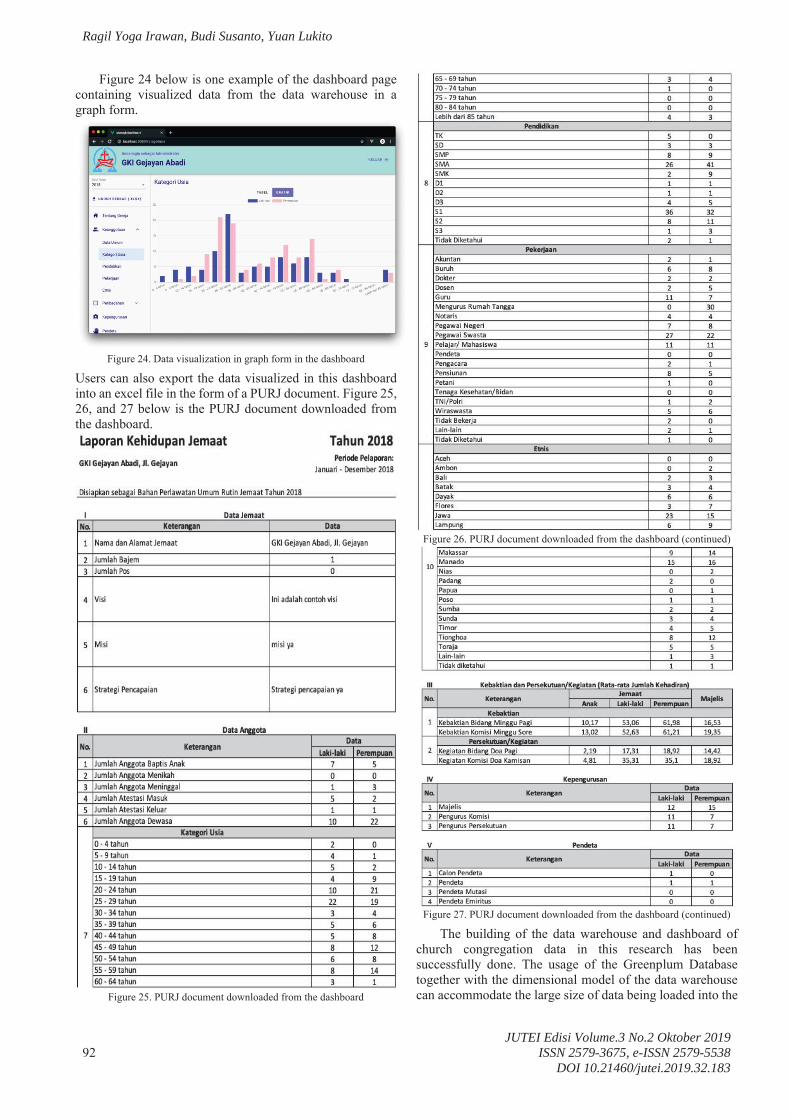
Users can also export the data visualized in this dashboard into an excel file in the form of a PURJ document. Figure 25, 26, and 27 below is the PURJ document downloaded from the dashboard.
Figure 25. PURJ document downloaded from the dashboard
Figure 26. PURJ document downloaded from the dashboard (continued)
Figure 27. PURJ document downloaded from the dashboard (continued)
The building of the data warehouse and dashboard of church congregation data in this research has been successfully done. The usage of the Greenplum Database together with the dimensional model of the data warehouse can accommodate the large size of data being loaded into the
g
Building Data Warehouse and Dashboard of Church Congregation Data
JUTEI Edisi Volume.3 No.2 Oktober 2019 ISSN 2579-3675, e-ISSN 2579-5538 DOI 10.21460/jutei.2019.32.183
93
data warehouse from the source database. The ETL process from the source database to the data warehouse has been done successfully with the help of the tools provided by Pentaho Data Integration. From the test conducted with the ETL process, the ETL process took about 51 seconds to complete all the transformations and jobs as in figure 28 below.
Figure 28. ETL process executing time
All of the functional and non-functional requirements of the system have been successfully fulfilled. Although, from the test conducted to the dashboard, it revealed that the data loading process to be visualized from the data warehouse is taken too much time. This can happen because of the tables' designs in the data warehouse is not efficient enough, or the SQL select query to retrieve the data from the data warehouse is poorly structured. But still, the system built has been able to meet the needs of the users.
V. CONCLUSION The data warehouse and the dashboard in this research
has been successfully made and running in Greenplum Database. The data in the data warehouse is loaded into the data warehouse from the source database using an ETL process. This data is then visualized into tables and graphs in a dashboard using a web service as a bridge between the data warehouse and the dashboard. Users can also export the data from the data warehouse into an excel file in the form of a PURJ document.
The data warehouse and the dashboard built in this research are far from perfect. As explained before, the data loading process to be visualized in the dashboard took too much time. For future research, the researcher can focus on building more efficient tables' designs in the data warehouse and making the SQL select query more robust so the system of the data warehouse and the dashboard can run more smoothly and the users can be having a good time using the system.
ACKNOWLEDGEMENTS We would like to express our biggest gratitude to the
Jawa Tengah Regional Synod of GKI for the materials provided during this research was being conducted. We would also like to thank the teachers, professors, and staff of Duta Wacana Christian University for providing insight and expertise that have been very helpful for the research. Lastly, we also thank our colleagues at Duta Wacana Christian University for the mental supports given during this research was being conducted. For without anyone mentioned before, this research would not be possible to be completed successfully.
REFERENCES [1] “Gereja Kristen Indonesia Sinode Wilayah Jawa Tengah (GKI SW
[2] W. H. Inmon, Building the Data Warehouse, 4th ed. Indianapolis, IN: Wiley Publishing, Inc., 2005.
[3] P. O’Donnell, D. Arnott, and M. Gibson, “Data Warehousing Development Methodologies: A Comparative Analysis,” in Decision Support in the Internet Age, 2002, pp. 387–398.
[4] R. Kimball and M. Ross, The Data Warehouse Toolkit: The
Definitive Guide to Dimensional Modeling, 3rd ed. Indianapolis, IN: John Wiley & Sons, Inc., 2013.
[5] W. Höpken, M. Fuchs, G. Höll, D. Keil, and M. Lexhagen, “Multi-Dimensional Data Modelling for a Tourism Destination Data Warehouse,” in Information and Communication Technologies in Tourism 2013, 2013, pp. 157–169.
[6] S. Mali, “Data Warehouse implementations to analyse Tennis Player performance in 2014,” 2016.
[7] P. Vassiliadis, “A Survey of Extract-Transform-Load Technology.,” Int. J. Data Warehous. Min., vol. 5, no. 3, pp. 1–27, 2009.
[8] J. Serra, “Building an Effective Data Wareheouse Architecture.” 2013.
[9] Pivotal Software Inc., “About the Greenplum Architecture,” 2019. . [10] S. Few, “Dashboard Confusion Revisited,” Visual Business
Intelligence Newsletter, 2007. [11] Pentaho Corporation, “Pentaho Data Integration,” 2017. . [12] W3C Working Group, “Web Services Glossary,” 2004. . [13] G. Alley, “Database vs Data Warehouse,” 2018. [Online].