47
Building Geo spatial Mashups to Visualize Information for Crisis Management Authors: Shubham Gupta and Craig A. Knoblock Presented By: Shrikanth Mayuram, Akash Saxena, Namrata Kaushik
| Date post: | 24-Dec-2015 |
| Category: |
Documents |
| Upload: | allan-simon |
| View: | 216 times |
| Download: | 0 times |

Building Geo spatial Mashups to Visualize Information for Crisis
ManagementAuthors:
Shubham Gupta and Craig A. Knoblock
Presented By:Shrikanth Mayuram,
Akash Saxena, Namrata Kaushik

Contents:
• Term Definitions• Problem Definition• Data Retrieval• Source Modeling• Data Cleaning• Data Integration• Data Visualization

Geospatial• Data that is geographic and spatial in nature
Information Visualization• Visualizing large data set in effective and judicious
manner to aid in decision making
Mash up• Heterogeneous data sources combined to suite users
needs *
Programming-by-demonstration• Enables user to write programs by demonstrating concrete
examples through UI
Term Definitions

Example of geospatial mashups
• WikiMapia (wikimapia.org)• Zillow (Zillow.com)• Yahoo’s Pipes (pipes.yahoo.com)• Intel’s MashMaker (mashmaker.intel.com)

Problem Addressed in Paper
• Existing tools use widgets• Requires understanding of program concepts• No customization for data visualization on
final mash up built• Emergency Management
o Heterogeneous Data Sourceso Time sensitive data visualization

Question?
• What are the problems associated with existing mash up building tools?a) Uses Widgets which requires programming conceptsb) No customization for data visualizationc) Heterogeneous data sourcesd) All of the above
Ans) d

Motivating Example

Drawbacks
• Time consumptiono Switching between data sourceo Analyzing data using Various software packages
Solution
• Programming by demonstration• Geospatial Mash up with
visualization techniques

Geospatial Mash up Developed for Analyst’s Scenario

Programming-By-Demonstration
• AdvantageoSaves time in constructing program. oMaking quick decisions by analyzing
data.oMakes this solution ideal when no time
for training.

Tool: Karma• Issues in mash-up creation process-
- Data Retrieval, Source Modeling, Data Cleaning, Data Integration and Data Visualization.
• Karma solves all above issues in one interactive process

Question?
• Question) Karma has the ability to work withexcel, text, database, semi-structured dataa) Trueb) False
Ans) True

Data Retrieval• The searching, selecting, and retrieving of
actual data from a personnel file, data bank, or other file.
• In karma
Figure 6: Extracting data from Evacuation Centers List(CSV Text file) using drag and drop in Karma

Data Retrieval Continued…
• Drag and Drop• Constructs query to get similar data.• Extracting semi-structured data using
wrappers. S/W Fetch Agent Platform Open Kapow
• Hence, a unified platform for accessing and extracting data from heterogeneous data sources.

Source Modeling• Process of learning Underlying model
of data source with help of semantic matching• In Karma
o User input by selecting the existing semantic type ranked by previous learning/hypothesis
o Or user defines new semantic typeo Karma learns and maintains repository of these
learnt semantic types.o Semantic type is a description of attribute that
helps in identifying the behavior of an attribute.

Data cleaning• The act of detecting and correcting corrupt or
inaccurate records from a record set, table, or database.
• Join operation aids data cleaning process.• In karma user specifies how clean data should
be.
Figure 7: Analyst provides example of cleaned data in Karma during data cleaning

Data Integration• Process of combining the data from multiple
sources to provide a unified view of data.• Major challenge here is to identify related
sources being manipulated for the process of integration.
• In karmao Automatic detection and ranking relation with other
sources based on attribute names and matching semantic types.

Data Integration
• Default weights change based on learning.
Figure 8: Data Integration in Karma

Question?
• In what sequence is the mash up built in Karma?a) Data Retrieval -> Data Cleaning -> Data Integration -> Source modeling -> Data Visualization
b) Data Retrieval -> Source modeling -> Data Cleaning -> Data Integration -> Data Visualization
c) Data Cleaning -> Source modeling -> Data Cleaning -> Data Integration -> Data Visualization
Ans) a
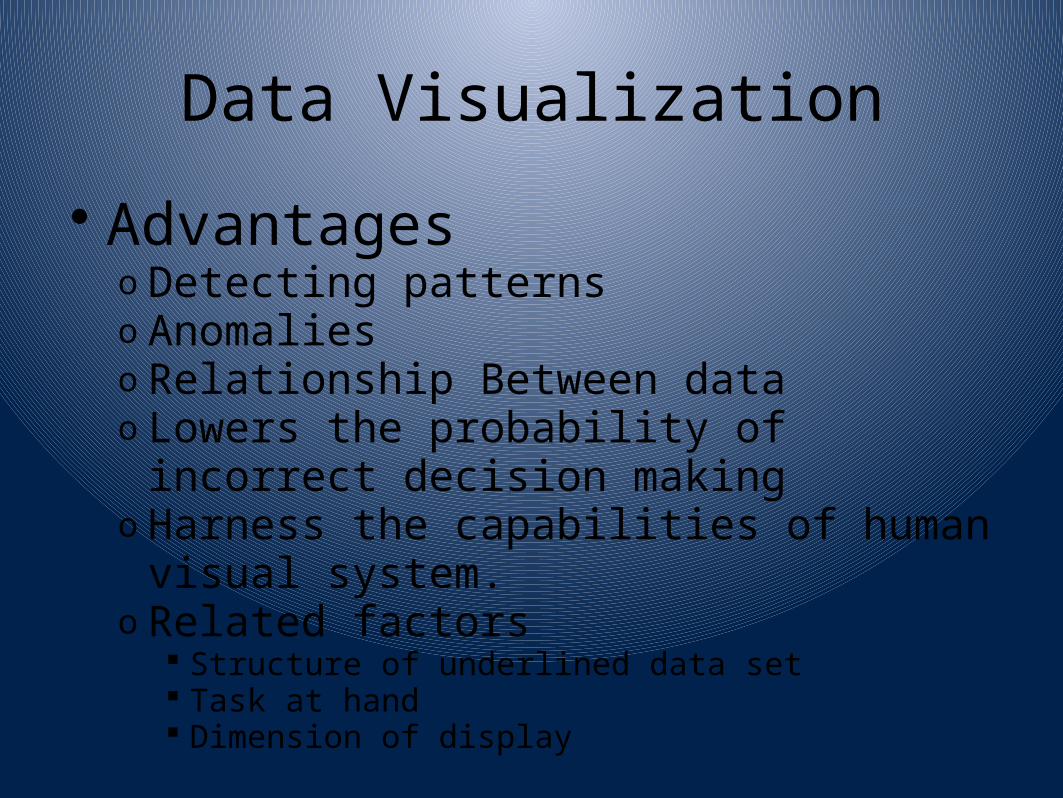
Data Visualization
• Advantageso Detecting patternso Anomalieso Relationship Between datao Lowers the probability of incorrect decision
makingo Harness the capabilities of human visual system.o Related factors
Structure of underlined data set Task at hand Dimension of display

Figure 9: Statistical Data in Table Format
Figure 10: Statistical Data Visualized as Chart

Figure 11: Sample data elements are dragged to the List Format interactive pane for bulleted list visualization.
A preview is also generated in the output preview window.

Figure 15: Data Visualization in List Format
Figure 14: Data Visualization in Table Format
Figure 13: Data Visualization in Paragraph Format
Figure 12: Data Visualization in Chart Format

Visualization in Karma
• Karma uses Google charts API that lets users generate charts dynamically.
• Uses semantic type generated during semantic mapping
• In geo spatial mash up this info appears as pop ups of markups.

Similar Tools• MIT’s Simile
o Emphasizes on Data Retrieval process

• CMU’s Marmiteo Has Widget approach, user requires Programming
Knowledge

• Intel’s Mash Makero Browser extension, mash up on only current site.o Data retrieval is limited to web pages & integration
requires expert user.
• All the above tools lack the data visualization feature.
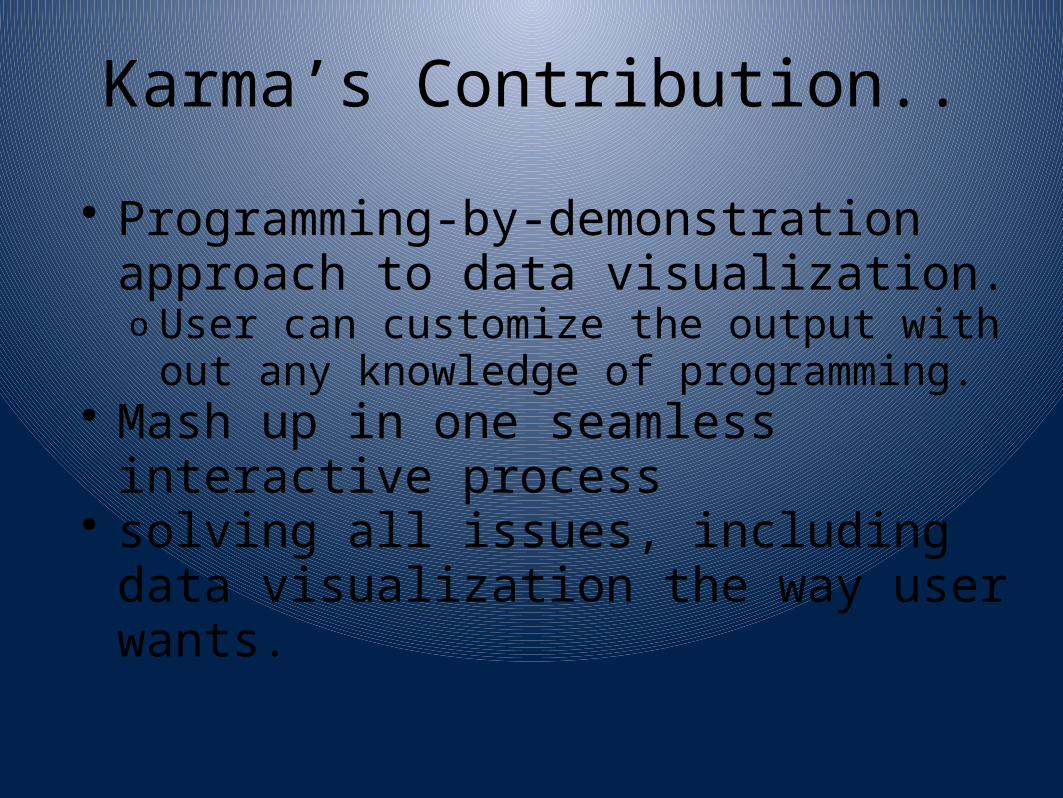
Karma’s Contribution..
• Programming-by-demonstration approach to data visualization.o User can customize the output with out any
knowledge of programming.• Mash up in one seamless interactive process• solving all issues, including data visualization
the way user wants.

Future Work
• To include more visualization formats such as scatter plots, 2D/3D iso surfaces and etc.
• Reading the geo spatial data to integrate with in karma.
• To save the plans for extracting and integrating the data, to apply when available.
References For the working of Karma watch this videohttp://www.youtube.com/watch?v=hKqcmsvP0No
• http://mashup.pubs.dbs.unileipzig.de/files/Wong2007Makingmashupswithmarmitetowardsenduserprogrammingfor.pdf
• Paper: Making Mash ups with Marmite: Towards End-User Programming for the Web - Wong and Hong
• http://www.simile-widgets.org/exhibit/
• Paper: Intel Mash Maker: Join the Web - rob ennals, Eric Brewer, Minos Garofalakis, Michael Shadle, Prashant Gandhi

Web-a-where: Geotagging Web Content
Authors: Einat Amitay, Nadav Har’El, Ron Sivan, Aya
Soffer

Contents
• Motivation• Problem• Ambiguity tackling till now• Tool: Web-a-Where• Page Focus Algorithm

Motivation• Understanding place names benefits
o Data Mining Systemso Search Engineso Location-based services for mobile deviceso Every page have 2 types of Geography associated with
it: source and target
Problem• Ambiguity of place names
o Name of person (Jack London) and place nameo Multiple places having same name i.e.US has 18 cities
named Jerusalemo Web Data to be processed huge so ambiguity resolution
should be fast

Ambiguity Tackling Till now• NER(Name Entity Recognition)
o Uses Natural Language Processing with statistical-learningo Machine learning from structure and context expensive require more
training data o e.g. Charlotte Best pizza o Slow for web data mining
• Data Miningo Grounding/Localization: Using glossaries and gazetteers ( general
knowledge like all places in atlas) • Plausible principles
o Single sense per discourse (Portland, OR …… Portland,…….)o Nearby locations in one context (Vienna, Alexandria – Northern
Virginia)• Web Pages
o URL, Language written in, phone numbers, zip codes, hyper link connection
o Requires a lot of information about postal details, phone directories easily available in US than other parts of world

• 3 Step processing to process any page • Spotting: Identify geo location
o Finds and disambiguates geographic names ( taxonomy approach) with help of gazetteer
• Disambiguation: Assign meaning and confidence • Focus Determination: Derive focus (Aggregate spots
and represent geographic focus of whole page)• Most of the work is theoretical but in this paper
experimental proof of effectiveness is provided for the tool.
Tool: Web-a-Where

Gazetteer• To resolve disambiguate associates place with
o canonical taxonomy node (Paris/France/Europe) o abbreviations(Alabama, AL), o world co-ordinates and o population o Geo/non-geo –e.g. Different languages -“Of” (Turkey)
Mobile is considered non-geo unless followed by Alabama.
Resolved by frequency and if not capitalized e.g. Asbestos(Quebec)
More frequency directly related to population – Metro , Indonesia
Short abbreviations not used- Too ambiguous- IN(Indiana or India). But helps in disambiguate other spots like “Gary, IN”
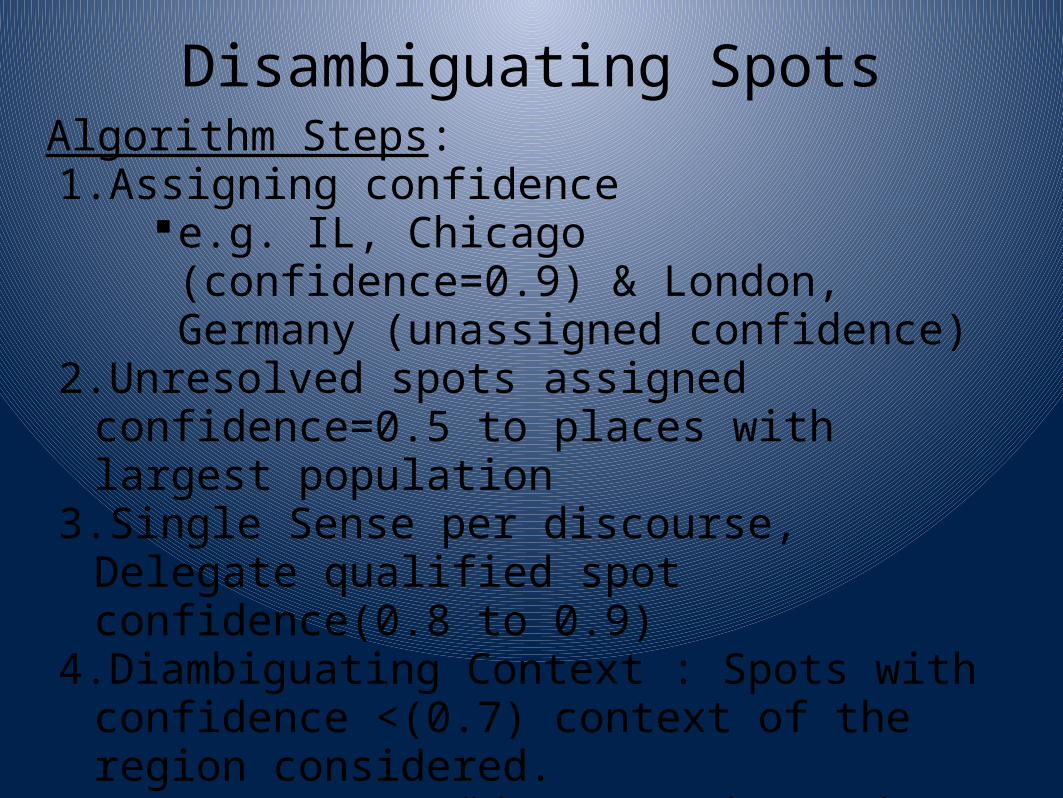
Disambiguating SpotsAlgorithm Steps:1.Assigning confidence
e.g. IL, Chicago (confidence=0.9) & London, Germany (unassigned confidence)
2.Unresolved spots assigned confidence=0.5 to places with largest population
3.Single Sense per discourse, Delegate qualified spot confidence(0.8 to 0.9)
4.Diambiguating Context : Spots with confidence <(0.7) context of the region considered.
e.g. page data “London and Hamilton” resolved by London -> England, UK &
Ontario, Canada Hamilton -> Ohio, USA & Ontario, Canada

Page Focus• Decides geographic mentions are incidental and which
constitute actual focus of the page Rationale of focus Algorithm e.g.- Search = California => page containing cities of
California rather than page containing San José, Chicago and Louisiana
• Several regions of focus e.g. News mentioning 2 countries• Coalesce into one region e.g. page listing 50 US-states have
page focus US• Coalescing into continents not productive• Page focus assigns higher weight if previous disambiguation
algorithm assigned high confidence and vice-versa

Outline of focus algorithm
• Mainly involves summing of taxonomy node• E.g. Page contains :
Orlando,Florida (Confidence 0.5)3 times Texas(Confidence 0.75)8times Fort Worth/Texas(0.75)
Final scores: 6.41 Texas/United States/North America4.50 Fort Worth/Texas/United States/North
America1.00 Orlando/Florida/United States (Second
Focus)

Focus Scoring Algorithm
• Algorithm loops over according to importance of various levels of taxonomy nodes.
• Algorithm stops after 4 nodes or when the confidence is lower than a threshold value.
• Algorithm skips over already covered node o E.g. United States/North America is contained in
North America
Question
• Focus Scoring Algorithm stops when-
A. Confidence is higher than a threshold value
B. Confidence is equal to threshold value
C. Confidence is lower than a threshold value
Ans) C

Testing Page Focus• Focus-Finding Algo is evaluated in first stage by
comparing its decision to those of human editors.• Second Stage: Open Directory Project(ODP)
Is the largest human-edited directory of the Web.• Random sample of about 20,000 web-pages from
ODP’s Regional section is chosen.• Web-a-Where is run on this sample and the foci is
compared to those listed in the ODP index.• Performed quite well. It found a page focus 92%
correct up to country level.

Evaluation of Geotagging Process
• Web-a-Where is tested on three different web-page collections:
Arbitrary Collection“.GOV Collection”“ODP Collection”
• All 3 collections were geotagged with a Web-a-Where and manually checked for correctness.
• Each geotags was labeled either “correct”, error of type “Geo/Non-Geo”, error of type “Geo/Geo”, or error of type “Not in Gazetteer”.


Question?
• Web-a-Where is run on the sample of web pages and the foci is comparedto those listed in the ODP index
A). TrueB). False
Ans) A

Future Work• Main source of error was due to Geo/Non-geo
ambiguityoTo resolve this rule out all the uncapitalized
words in properly-capitalized text, part-of-speech tagger
oBased on coordinates of places, linkage among Web-pages

Thank You!!!


