44
BUILDING ON LEARNINGS BENCHMARKING THE BUSINESS OF AGRICULTURE

BUILDING ON LEARNINGS BENCHMARKING THE BUSINESS OF AGRICULTURE

GROWTH OF FOOD DEMAND

ROLE OF GOVERNMENT POLICIES &
REGULATIONS
Inclusive
Value
Chain
Enabling
Environment
Policies, Laws
& Regulations
● Promote food production
● Facilitate access to ag inputs
● Encourage competitiveness
● Regulate competition
● Include small & local players
Government
Policymakers

THE VALUE OF BENCHMARKING
You [Socrates] have discovered the reasons
why some farmers are so successful
that husbandry yields them
all they need in abundance,
and others are so inefficient
that they find farming unprofitable.
I should like to hear the reasons in each case,
in order that we may do what is good
and avoid what is harmful.
Xenophon, 4th Century BC

THE VALUE OF BENCHMARKING

Benchmarking the Business of Agriculture aims to
identify and monitor policies and regulations that can
foster an enabling environment for the local and
regional business of agriculture and encourage and
inform policy changes that support inclusive
participation in agricultural markets.
BBA: A TOOL FOR IMPROVED POLICYMAKING
Comparable and actionable indicators
Identify good practices
Motivate reforms

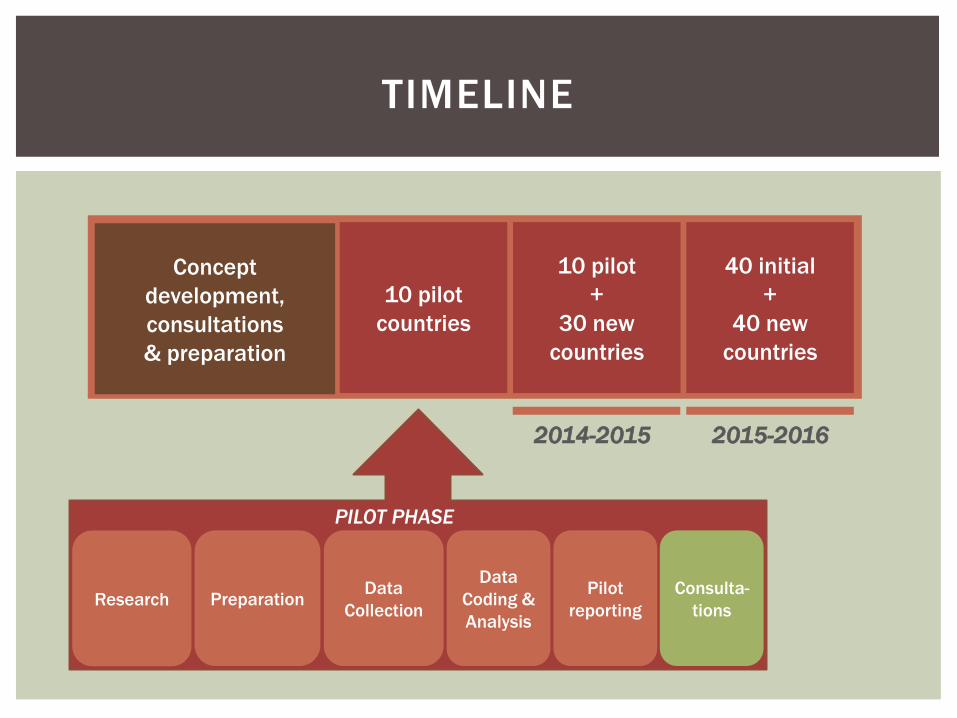
TIMELINE
10 pilot
countries
10 pilot
+
30 new
countries
40 initial
+
40 new
countries
Concept
development,
consultations
& preparation
2013-2014 2014-2015 2015-2016
TIMELINE
10 pilot
countries
10 pilot
+
30 new
countries
40 initial
+
40 new
countries
Concept
development,
consultations
& preparation
Research Preparation Data
Collection
Data
Coding &
Analysis
Pilot
reporting
Consulta-
tions
PILOT PHASE
2014-2015 2015-2016

THEMATIC COVERAGE
Access to Agricultural
Inputs (Seeds,
Fertilizer, Machinery)
Access to Agricultural
Finance
Access to Transport &
Storage
Access to Agricultural
Land
Access to Markets
(Domestic, Regional, Contract Farming)
Access to Water
Rural Electricity &
ICT
Benchmarking the Business of Agriculture

THEMATIC COVERAGE
LAND AG
FINANCE SEED FERT
AG
TRANSP MARKET
ICT RURAL
ELECTR
AG
MECHAN
CONTR
FARM
CORE TOPICS
INITIAL TESTING

TECHNICAL NOTE
Literature
Experts
Advisors

INDICATOR AREAS Literature
Experts
Advisors
DATA POINTS
/

QUESTIONNAIRES

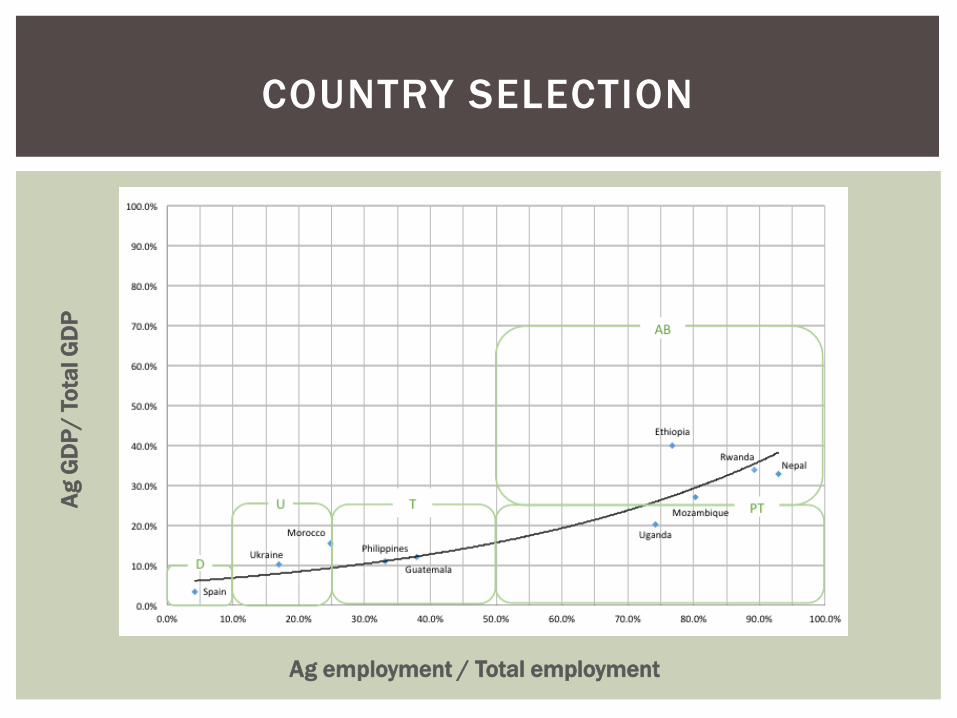
COUNTRY SELECTION
Ag employment / Total employment
Ag
GD
P/ T
ota
l G
DP
COUNTRY SELECTION
Ag employment / Total employment
Ag
GD
P/ T
ota
l G
DP

COUNTRY SELECTION

CONTRIBUTORS
Government institutions
Companies
Associations
Academia
Research institutions
NGOs/farmer organizations

COUNTRY VISITS
Morocco, Ukraine, Rwanda
Guatemala
Ethiopia, Philippines, Mozambique
November 2013
December 2013
February 2014
Nepal, Uganda, Spain March 2014

DESIGN TO ANALYSIS
Literature review &
expert consultations
Identification of indicators
and data points
Questionnaire draft,
review & translation
Administer questionnaires to local
experts
Collection & verification of
data
Data gaps filled through
desk research
Internal data review
Final data analysis &
report
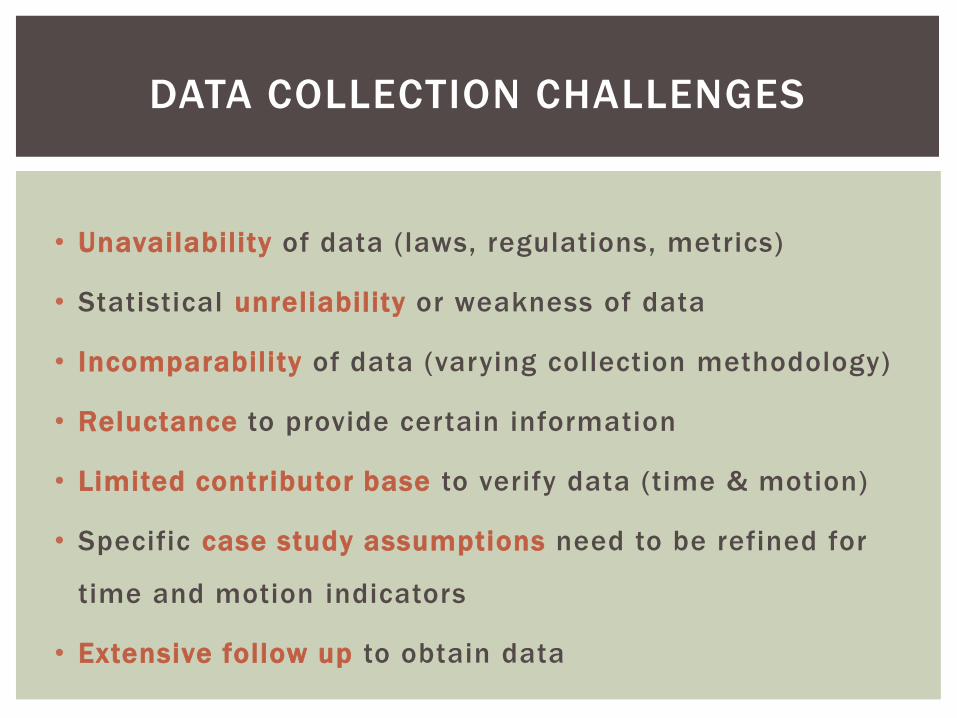
• Unavailability of data (laws, regulations, metrics)
• Statistical unreliability or weakness of data
• Incomparability of data (varying collection methodology)
• Reluctance to provide certain information
• Limited contributor base to verify data (time & motion)
• Specific case study assumptions need to be refined for
time and motion indicators
• Extensive follow up to obtain data
DATA COLLECTION CHALLENGES
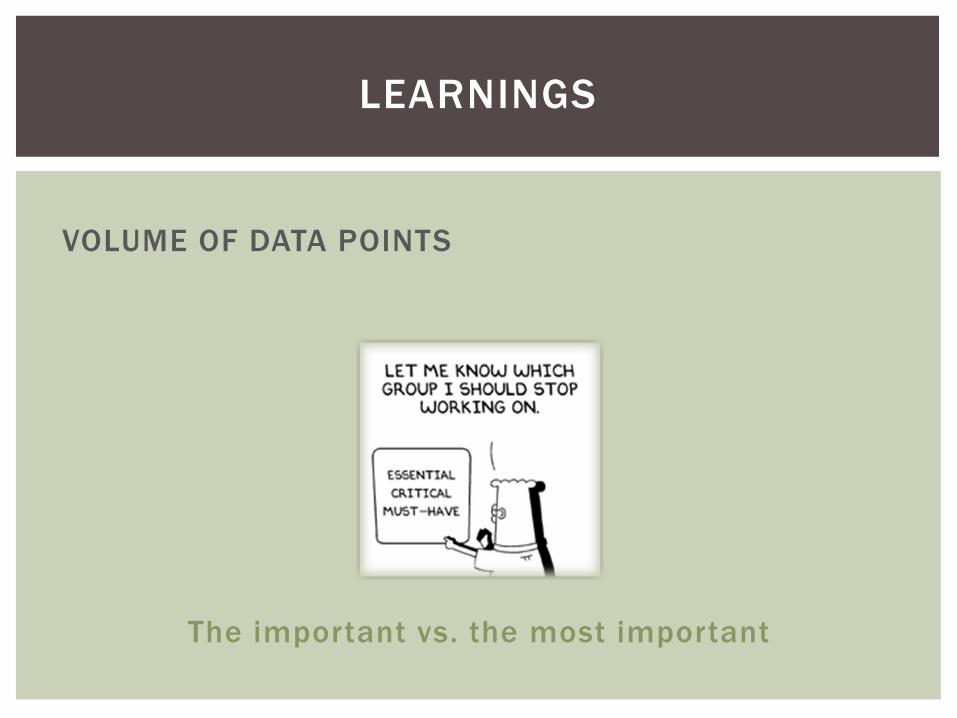
The important vs. the most important
LEARNINGS
VOLUME OF DATA POINTS

LEARNINGS
ROBUST AND COMPARABLE MEASUREMENTS

LEARNINGS
DATA COLLECTION WISDOM
• Interaction/relationship
with contributor
• Length of questionnaire
• Prepopulating surveys
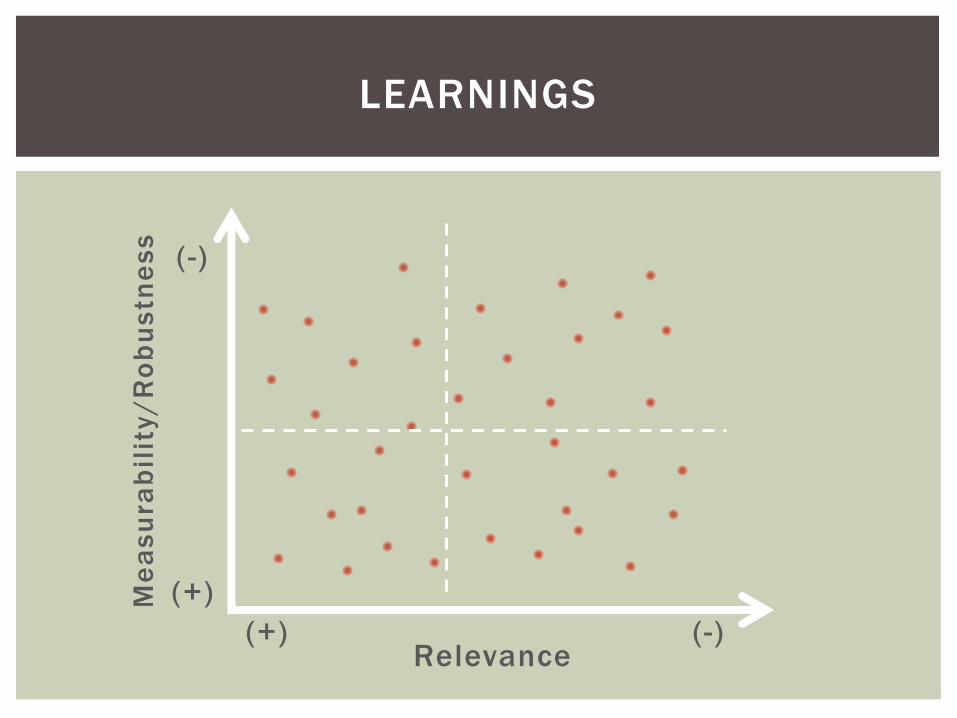
LEARNINGS M
ea
su
rab
ilit
y/
Ro
bu
stn
es
s
Relevance
(+)
(+) (-)
(-)

LEARNINGS : AG TRANSPORT ( TRU C K ING S ERV IC ES )
Starting trucking company
Licensing requirements/procedures
Market structure
Pricing regulation & freight allocation
Transport prices and costs
Axle-load regulation and inspections
Road blocks, tolls and fees
International agreements
Foreign trucking competition
Accessing appropriate vehicles
Road quality, access and density
Rural roads financing
Agricultural storage
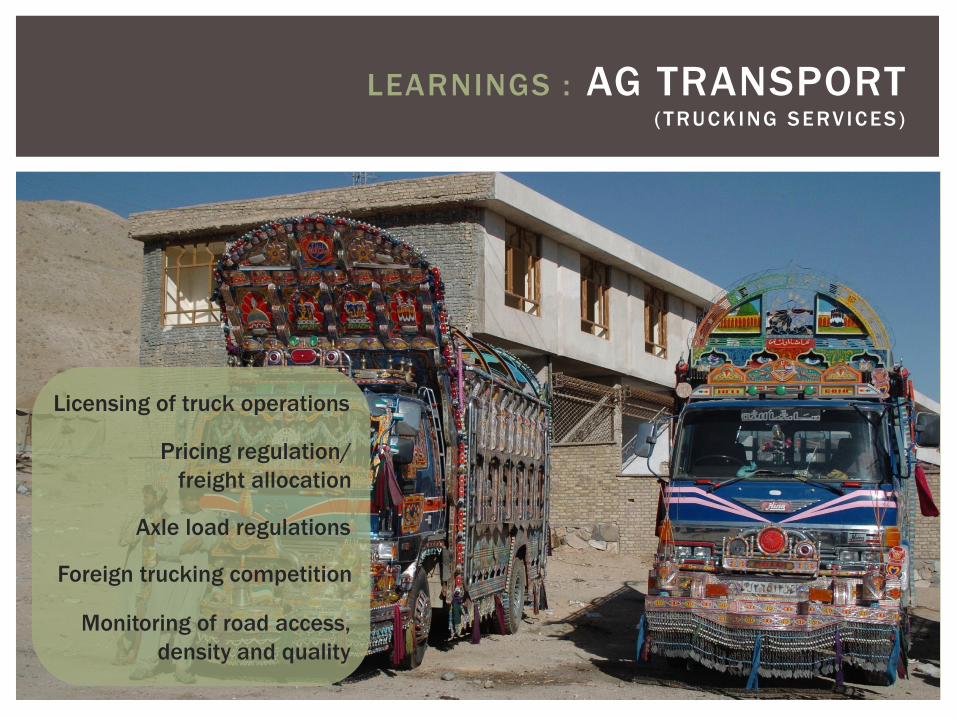
LEARNINGS : AG TRANSPORT ( TRU C K ING S ERV IC ES )
Licensing of truck operations
Pricing regulation/
freight allocation
Axle load regulations
Monitoring of road access,
density and quality
Foreign trucking competition

LEARNINGS : ACCESSING FINANCIAL SERVICES
Collateral laws
Average loan cost
Average interest rates
Deposit insurance schemes
# mobile banking users
% agricultural loans
E-money regulations
Asset risk weighting
Regulation of financial intermediaries
# loans secured by movable collateral
Warehouse receipt systems
# of bank branches in rural areas
Microinsurance schemes
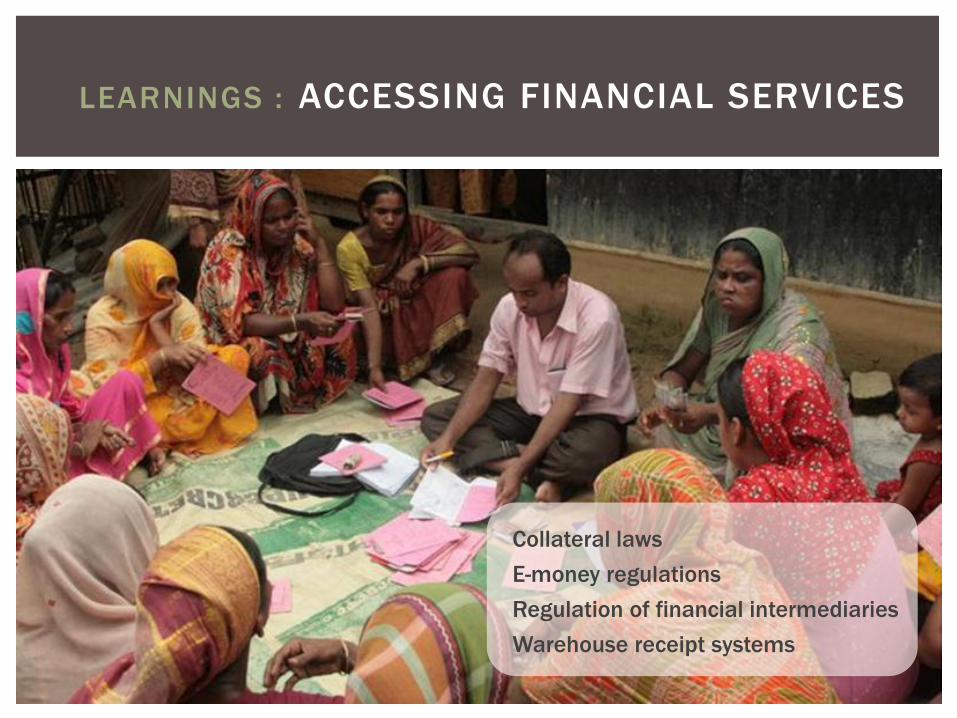
LEARNINGS : ACCESSING FINANCIAL SERVICES
Collateral laws
E-money regulations
Regulation of financial intermediaries
Warehouse receipt systems

DATA CLASSIFICATION
Laws,
regulations &
institutions
Policy
performance
& market
metrics
DATA
Policy
Regulatory
Market/Practice

CONSULTATIVE/FEEDBACK PROCESS
oMethodological approach
oAnalysis of indicators
oContributor strategy
CSOs
Technical
exper ts
Report review
Peer rev iewers
Countr y o f f ices
Donors
Technical
exper ts
Technical
exper ts June
2014
Sept
2014

LOOKING FORWARD
SCALE UP LAND
AG
FINANCE SEED FERT
AG
TRANSP MARKET
TOPICS
ICT ENVIRON
SUSTAIN WATER
MECHA-
NIZATION GENDER
LIVE-
STOCK

LOOKING FORWARD
DUE CONSIDERATION
OF SMALL FARMERS

BUILD & REFINE
INDICATORS
LOOKING FORWARD
Challenge of
choosing indicators
that are:
most relevant in determining “enability” of environment
measurable and statistically robust
fully comparable
distinctively address market linkages/opportunities for
smaller farmers

INDICATORS / DATA POINTS
PROCESS IN MOTION
TECHNICAL NOTE
QUESTIONNAIRES

PROCESS IN MOTION
Preparation
Remote
data
collection
Remote
+
In country
data collection
Data
coding &
analysis
2014-2015 IMPLEMENTATION
0%
10%
20%
30%
40%
50%
60%
70%
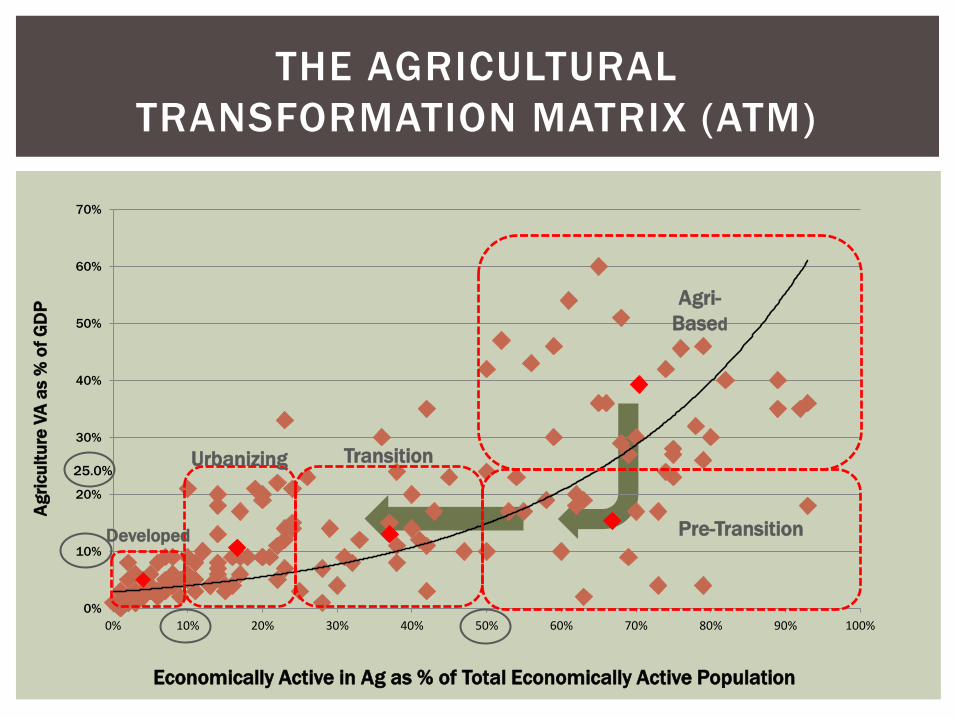
0% 10% 20% 30% 40% 50% 60% 70% 80% 90% 100%
Agri-
Based
Pre-Transition
Urbanizing Transition
Developed
THE AGRICULTURAL
TRANSFORMATION MATRIX (ATM)
Ag
ricu
ltu
re V
A a
s %
of
GD
P
Economically Active in Ag as % of Total Economically Active Population
25.0%
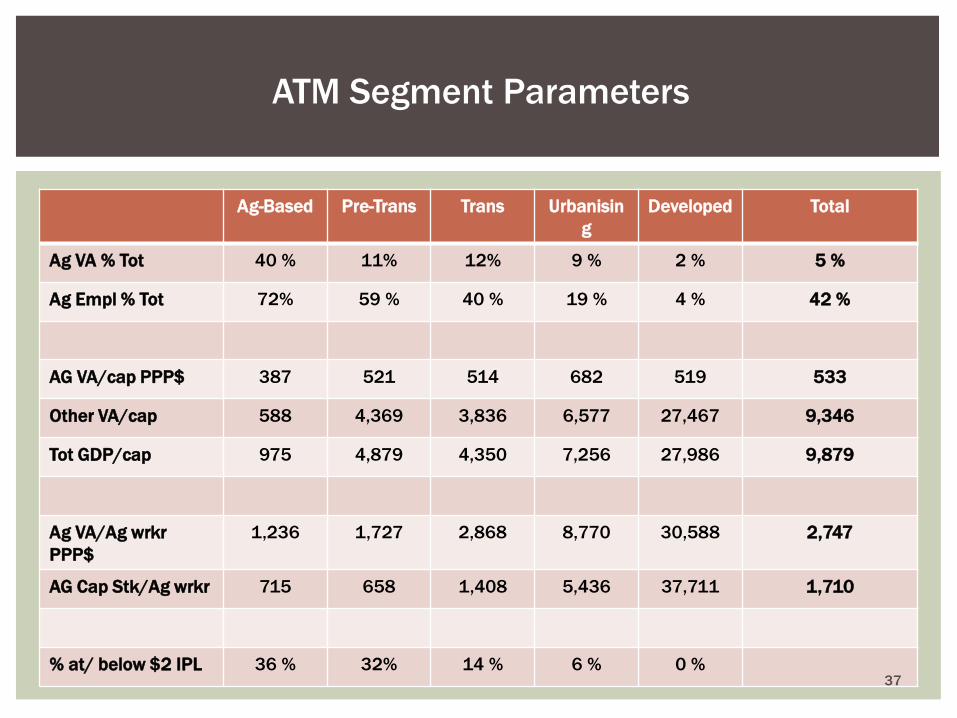
Ag-Based Pre-Trans Trans Urbanisin
g
Developed Total
Ag VA % Tot 40 % 11% 12% 9 % 2 % 5 %
Ag Empl % Tot 72% 59 % 40 % 19 % 4 % 42 %
AG VA/cap PPP$ 387 521 514 682 519 533
Other VA/cap 588 4,369 3,836 6,577 27,467 9,346
Tot GDP/cap 975 4,879 4,350 7,256 27,986 9,879
Ag VA/Ag wrkr
PPP$
1,236 1,727 2,868 8,770 30,588 2,747
AG Cap Stk/Ag wrkr 715 658 1,408 5,436 37,711 1,710
% at/ below $2 IPL 36 % 32% 14 % 6 % 0 %
ATM Segment Parameters
37

Not Classified
Ag-Based
Pre-Transition
Transition
Urbanising
Developed
Ag-Based
Pre-Transition
Urbanising Transition
Developed
l 38
Global

Sub Saharan Africa

South Asia
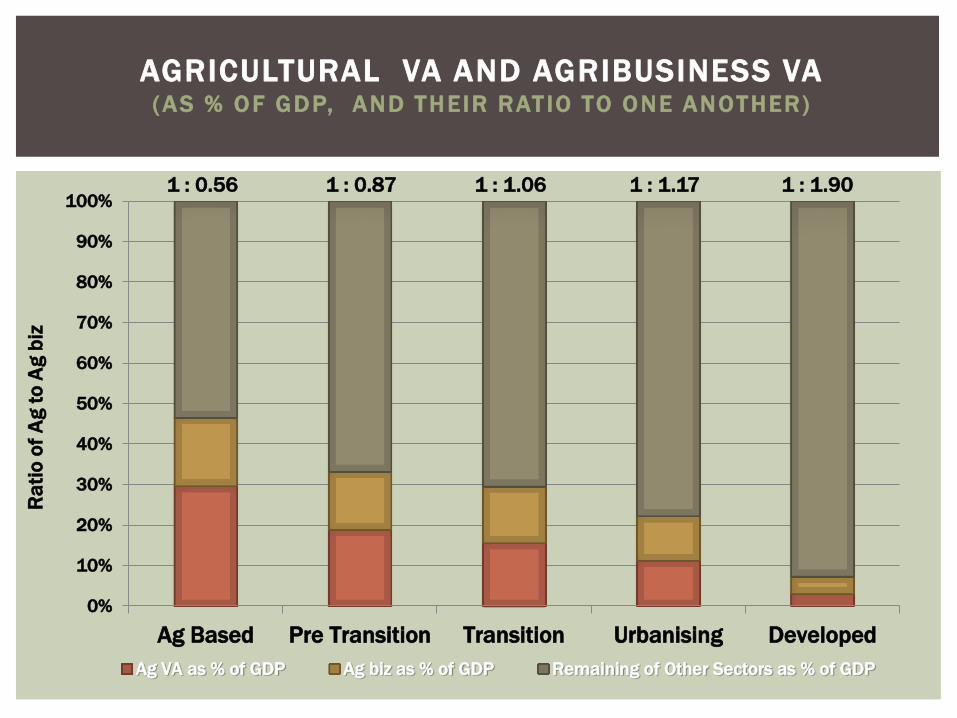
AGRICULTURAL VA AND AGRIBUSINESS VA (AS % OF GDP, AND THEIR RAT IO TO ONE ANOTHER)
0%
10%
20%
30%
40%
50%
60%
70%
80%
90%
100%
Ag Based Pre Transition Transition Urbanising Developed
Ag VA as % of GDP Ag biz as % of GDP Remaining of Other Sectors as % of GDP
Ra
tio
of
Ag
to
Ag
biz
1 : 0.56 1 : 0.87 1 : 1.06 1 : 1.17 1 : 1.90
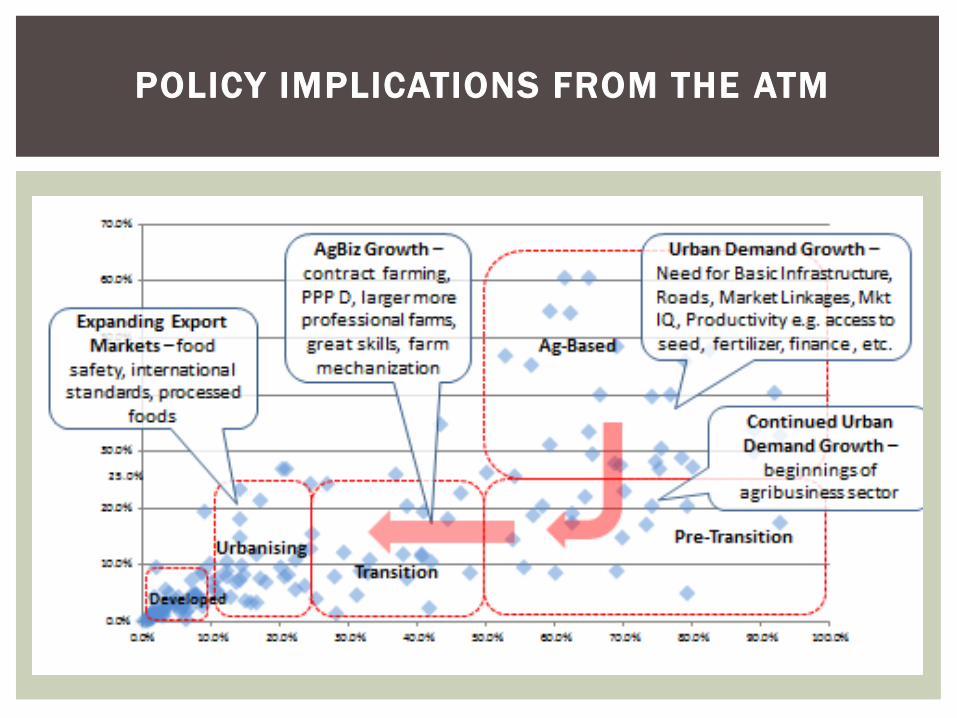
POLICY IMPLICATIONS FROM THE ATM

46% with 4
hours
69% with 4
hours

BUILDING ON LEARNINGS BENCHMARKING THE BUSINESS OF AGRICULTURE
Thank you


