114
BUILDING ON OUR FOUNDATIONS 2010 ANNUAL REPORT For personal use only
BUILDING ON OURFOUNDATIONS2010 ANNUAL REPORT
For
per
sona
l use
onl
y

CONTENTS
Actual Actual $m $m
REVENUE 2071.4 2199.0
Operating EBITDA 423.0 447.3
Share of Associates NPAT 1.4 2.5
Irregular Items 0.0 9.0
Reported EBITDA 424.4 458.8
Depreciation and Amortisation (168.6) (143.8)
EBIT 255.8 315.0
Net Finance Costs (166.8) (188.1)
Profi t before Tax, Associates, Borrowings & Other Costs and Signifi cant Items 89.0 126.9
Borrowing & Other Costs 0.0 (27.2)
Non Cash Items (5.9) (9.4)
Signifi cant Items 8.9 (328.1)
Profi t/(loss) Before Tax 92.0 (237.8)
Tax (Expense)/Benefi t (19.3) 21.7
NPAT/(NLAT) from ordinary operations 72.7 (216.1)
Minority interests (1.6) (2.2)
Npat/(Nlat) Attributable to Equity Holders 71.1 (218.3)
SPS distribution (12.1) (19.1)
NPAT Attributable to TPI Shareholders 59.0 (237.4)
Underlying NPAT Attributable to TPI Shareholders 55.7 72.3
SCORECARD FY10 FY09
$2.1b $423.0m REVENUE OPERATING EBITDA
1 CHAIRMAN’S LETTER 2 CEO’S REVIEW 3 BUILDING ON OUR FOUNDATIONS 8 SOLID WASTE 9 INDUSTRIALS 10 COMMERCIAL VEHICLES
AND MANUFACTURING 11 CORPORATE
$0.0b
$0.2b
$0.4b
$0.6b
$0.8b
$1.0b
$1.2b
1H0
8
2H
08
1H0
9
2H
09
1H10
2H
10
$0m
$50m
$100m
$150m
$200m
$250m
$300m
1H0
8
2H
08
1H0
9
2H
09
1H10
2H
10
For
per
sona
l use
onl
y

Transpacifi c Annual Report 2010 1
Chairman’s Report
Dear Shareholders
Welcome to our sixth annual report as a public company.
I am pleased to present the 2010 Annual Report, my fi rst as Chairman of your company.
Transpacifi c achieved a solid result for the year. While underlying earnings of
$56 million were down on the previous year we have continued to improve our fi nancial performance at the operational level. The net debt position of the company improved, through the recapitalisation completed in August 2009, ongoing capital management initiatives and cash fl ows generated by each of our divisions.
The year in many ways was one of consolidation and review, leading to many internal changes paving the way for the Group to take advantage of future opportunities.
There has also been a focus on improving our service to our customers and the communities in which we operate. Transpacifi c works closely with a wide range of valued customers across sectors from households and small business to heavy industry and mining. While levels of business activity are variable, we are seeing some trends of improvement in markets. In particular there is increasing demand for more environmentally sustainable services.
I would like to take this opportunity to note the company’s appreciation of the extraordinary dedication and leadership of Terry Peabody since he founded Transpacifi c 27 years ago, and particularly since its listing in 2005.
Mr Peabody retired as Executive Chairman in June, 2010 having made an outstanding contribution to the development of Transpacifi c – building a resilient business spanning a cross–section of industries. We look forward to further growth from this platform.
Safety and Environment
The safety of our employees, customers and the community is paramount at Transpacifi c and over the past Financial Year our commitment to a Zero Harm philosophy has been our priority.
An incident during the year at one of our WA operations, in which our team member Paul Fry was fatally injured, has reinforced to us that this is a continuous journey and one to which we must remain vigilant.
The number of our Lost Time Incidents continues to trend downwards, which is a refl ection of the concerted efforts of our business to minimise workplace risk. Transpacifi c’s recently enhanced safety leadership course is a quality indicator of our continued efforts in this regard. In June 2010 our licence under the Comcare self-insurance scheme in Australia was renewed for a further four years, which rewards us for our efforts.
There continues to be a strong environmental focus across the Transpacifi c Group. Our philosophy is that all waste is a resource and our aim is to incorporate recovery, recycling and reuse throughout our operations and those of our clients.
This extends to working with customers on a large scale by encouraging them to reduce their waste to landfi ll through our industry-leading Harvest recycling program – which takes care of packaging waste including cardboard, polystyrene and clear plastic – to our own Green Offi ce Guide which outlines ways our staff can make changes to reduce the impact Transpacifi c’s offi ces have on the natural environment.
Reorganising for the future
We expect to fi nd new business opportunities as the economies of Australia and New Zealand grow and recycling becomes more prevalent. To that end we have reorganised our structure streamlining our divisions into: Transpacifi c Cleanaway and Transpacifi c Waste Management; Transpacifi c Industrials; and Commercial Vehicles and Manufacturing.
The focus of this reorganised structure is to improve effi ciencies through synergies and better use of our assets.
The fi nal step in this process was a refreshing of our Five Year Business Plan which is now focused on the strategic objectives of organic growth, improved products and new offerings to our customers.
We are also enhancing the company’s systems and have spent much of the past fi nancial year developing an integrated Enterprise Resource Planning (“ERP”) system, which we plan to implement next year.
Governance
During FY10, Transpacifi c refreshed its Corporate Governance structures, with new independent Non-executive Directors and restructured Board Committees to enhance focus on reporting and risk management.
Thank you
The outlook for Transpacifi c is encouraging and I would like to extend my thanks to my fellow Board members for their ongoing advice and support, and to Transpacifi c’s senior management team led by Chief Executive Offi cer Trevor Coonan.
Together, the Board and the senior management team are positioning Transpacifi c for growth, sustainable outcomes and long-term value for our customers and shareholders.
Transpacifi c – with its integrated platform of operations and focus on organic growth – is well placed to take advantage of future demand for our increasingly diverse services and I look forward to guiding the company on that path.
Gene TilbrookChairman
For
per
sona
l use
onl
y
2
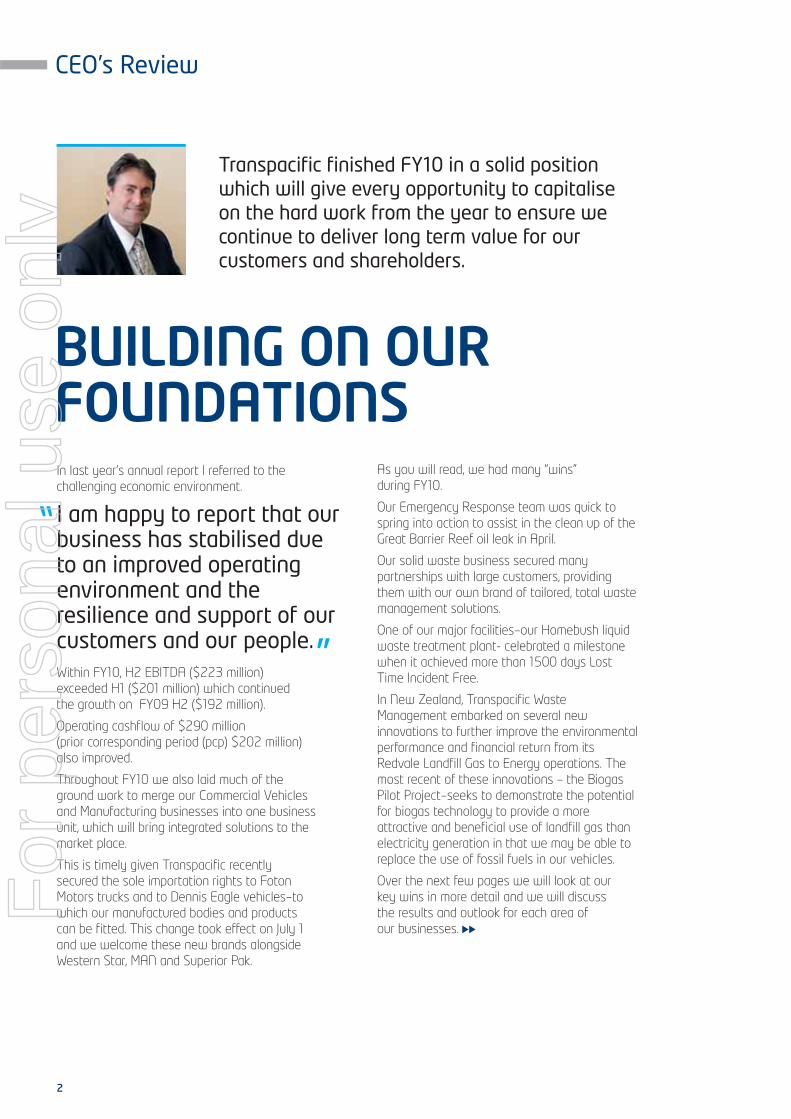
CEO’s Review
BUILDING ON OURFOUNDATIONS
Transpacifi c fi nished FY10 in a solid position which will give every opportunity to capitalise on the hard work from the year to ensure we continue to deliver long term value for our customers and shareholders.
”
”
In last year’s annual report I referred to the challenging economic environment.
I am happy to report that our business has stabilised due to an improved operating environment and the resilience and support of our customers and our people.Within FY10, H2 EBITDA ($223 million) exceeded H1 ($201 million) which continued the growth on FY09 H2 ($192 million).
Operating cashfl ow of $290 million (prior corresponding period (pcp) $202 million) also improved.
Throughout FY10 we also laid much of the ground work to merge our Commercial Vehicles and Manufacturing businesses into one business unit, which will bring integrated solutions to the market place.
This is timely given Transpacifi c recently secured the sole importation rights to Foton Motors trucks and to Dennis Eagle vehicles–to which our manufactured bodies and products can be fi tted. This change took effect on July 1 and we welcome these new brands alongside Western Star, MAN and Superior Pak.
As you will read, we had many “wins” during FY10.
Our Emergency Response team was quick to spring into action to assist in the clean up of the Great Barrier Reef oil leak in April.
Our solid waste business secured many partnerships with large customers, providing them with our own brand of tailored, total waste management solutions.
One of our major facilities–our Homebush liquid waste treatment plant- celebrated a milestone when it achieved more than 1500 days Lost Time Incident Free.
In New Zealand, Transpacifi c Waste Management embarked on several new innovations to further improve the environmental performance and fi nancial return from its Redvale Landfi ll Gas to Energy operations. The most recent of these innovations – the Biogas Pilot Project–seeks to demonstrate the potential for biogas technology to provide a more attractive and benefi cial use of landfi ll gas than electricity generation in that we may be able to replace the use of fossil fuels in our vehicles.
Over the next few pages we will look at our key wins in more detail and we will discuss the results and outlook for each area of our businesses.
For
per
sona
l use
onl
y

Transpacifi c Annual Report 2010 3
Due to the scale of Transpacifi c’s operations, we are able to signifi cantly reduce our overall processing costs, attracting clients from all over Australia.
”
”
AUSTRALIA’S LARGEST AND MOST SOPHISTICATED LIQUID TREATMENT PLANT
CEO’s Review
Building on our foundations
Located in Sydney’s western suburbs, the Homebush Bay liquid waste treatment plant is the largest treatment facility of its type in Australasia, processing in excess of 160 million litres of waste each year.
By June 2010, this plant, which is one of Transpacifi c’s major facilities, had achieved four years, or nearly 1500 days Lost Time Incident (LTI) free.
The Homebush plant is the most sophisticated facility of its kind in Australia, and the only plant able to treat such a large quantity and variety of liquid and hazardous waste materials.
It can handle many types of liquid wastes including acids, solvents, fuels, heavy metals, caustics, surfactants and pesticides.
Due to the scale of Transpacifi c’s operations, we are able to signifi cantly reduce our overall processing costs, attracting clients from all over Australia.
The size and storage capacity of the facility combined with a large tanker fl eet lends itself to assisting emergency response teams and fi re brigades during emergencies.
Over the past few years we have developed strong relationships with fi re brigades and other emergency services, assisting them with many large fi res that have occurred over this time.
Because we are a one-stop shop, we can respond with appropriate equipment, collection and treatment resources, 24 hours a day, seven days per week.
Each year the plant processes up to 40 million litres of leachate collected and piped from the nearby Olympic Village site.
Historically, the site housed abattoirs, brickworks and numerous landfi lls prior to its 2000 Olympic Games redevelopment.
Transpacifi c is continuously researching new treatment processes that will further reduce waste-to-landfi ll, energy and water usage, waste processing costs and the impact on the environment.F
or p
erso
nal u
se o
nly

4
Transpacifi c’s Commercial Vehicles Group has introduced two new brands of commercial trucks to Australia.
Foton Motors and Dennis Eagle add to our Western Star and MAN Fleets and will be rolled out through Transpacifi c’s existing dealer network.
These two new brands will complement our existing brands, providing many positive opportunities to Transpacifi c’s Commercial Vehicles business.
FOTON AND DENNIS EAGLE BROADENING TRANSPACIFIC’S PORTFOLIO
Foton
Foton Motors brings a proven track record of product innovation and manufacturing quality.
The Aumark 4.5T light commercial truck is the fi rst model in what will be a long line of models from Foton.
Targeted at tradespeople who have outgrown a one-tonne utility or van truck, Foton gives Transpacifi c the opportunity to reach the light commercial vehicle market, a market not reached by our existing MAN and Western Star networks.
Foton is the number one Commercial Vehicle manufacturer in China and by aligning with this brand Transpacifi c is in a position to capitalise on the positive opportunities this will bring in the future.
Foton vehicles are available at a competitive price and are fi tted with the latest Cummins ISF 2.8L engine and ZF 5-speed transmission for outstanding reliability, performance and fuel economy.
Dennis Eagle
Transpacifi c’s Commercial Vehicles Group has searched the globe for the very best product that could meet the diffi cult and demanding operational needs of an Australian refuse collection vehicle.
As well as providing Transpacifi c with a new, cost effi cient refuse collection vehicle, Dennis Eagle vehicles will also service the broader refuse industry.
Dennis Eagle will allow Transpacifi c to enter a niche market, not accessible to our existing Western Star or MAN networks.
Transpacifi c intends to take maximum advantage of vertical integration opportunities by working closely with Superior Pak which will provide body manufacturing to the Transpacifi c Dennis Eagle fl eet.
The Dennis Eagle will provide a more rationalised fl eet long term with one platform to lower maintenance, training, overhead and operational costs.
Left: Dennis Eagle vehicle with a Superior Pak body
Right: Foton Motors Vehicle
with a Superior Pak body
e
CEO’s Review
Building on our foundations (continued)
ll
For
per
sona
l use
onl
y

Transpacifi c Annual Report 2010 5
The contract will help Westfi eld reach the goal of reducing the amount of waste sent to landfi ll. ”
”
TRANSPACIFIC PROVIDING POSITIVE SOLUTIONS TO WESTFIELD
Transpacifi c will partner with Westfi eld retail centres to provide solid waste and recycling solutions across eight shopping centres in Western Australia, South Australia and the ACT.
The contract was announced in January 2010 and will help Westfi eld reach the goal of reducing the amount of waste sent to landfi ll.
Originally Transpacifi c worked with Westfi eld by taking care of its liquid waste. This relationship has grown and Transpacifi c now offers a total waste management solution.
Transpacifi c conducted comprehensive audits of the Westfi eld centres and identifi ed a number of ways Westfi eld could streamline its waste management systems and increase recycling opportunities.
As well as educating Westfi eld retailers and cleaners to segregate their waste and recycling Transpacifi c also redesigned signage in the loading docks to ensure all separated waste is placed in the correct receptacles, thereby encouraging greater recycling.
Transpacifi c has also provided an SMS option to Westfi eld for its compactors. This system is called SMS Track.
One of the features of this system is when any of the Westfi eld compactors reach the three-quarter full mark an SMS will alert both Westfi eld and Transpacifi c that the container will need to be scheduled for collection.
By using this system Westfi eld will always know when the next collection is scheduled and the notifi cation will streamline the collection process making it easier for Transpacifi c to allocate vehicles.
Transpacifi c’s manufacturing arm Superior Pak will also play an important role in this contract by refurbishing and building a number of new compactors.
For
per
sona
l use
onl
y

6
This was an excellent example of Transpacifi c’s varied capabilities and the way we can carry out extensive operations like this, providing a range of solutions and services that other companies can’t match. ”
”
TRANSPACIFIC HELPS IN THE CLEAN UP OF THE GREAT BARRIER REEF OIL LEAK
In April 2010, the bulk carrier Shen Neng 1 ran aground on the Great Barrier Reef at Douglas Shoals. Oil leaks were detected and authorities feared the vessel could break up resulting in further oil being leaked into the Marine Park.
After salvage crews moved fuel from the Shen Neng 1 onto a local bunker barge, Transpacifi c’s emergency response team was appointed to remove fuel from the barge, transport it and store it off-site in Gladstone.
Transpacifi c used a boom to transfer 1,250 tonnes of fuel from the barge to six of Transpacifi c’s fuel trucks that transported the oil to storage tanks in Gladstone and Brisbane.
Transpacifi c Industrial Solutions General Manager Steve Rooks said: “Transpacifi c was the only one who had the expertise, the equipment and the network of contacts to be able to successfully carry out an operation of this scale.”
“We had the labour force, the trucks, and the equipment on standby for days while we waited for the most up to date information and we were able to act immediately when required.
“This was an excellent example of Transpacifi c’s varied capabilities and the way we can carry out extensive operations like this, providing a range of solutions and services that other companies can’t match,” he said.
This major win for Transpacifi c’s Industrial Services business has lead to Transpacifi c becoming the preferred contractor for SVITZER Salvage, part of the A P Moller Maersk Group.
Transpacifi c and SVITZER Salvage are continuing their cooperation and are presently working on developing other projects in Australia.
CEO’s Review
Building on our foundations (continued)F
or p
erso
nal u
se o
nly

Transpacifi c Annual Report 2010 7
The project seeks to demonstrate the potential for biogas technology to provide a more attractive and benefi cial use of landfi ll gas than electricity generation.”
”
BIOGAS PILOT PROJECT FOR REDVALE
Transpacifi c New Zealand has recently introduced several new innovations to further improve the environmental performance and fi nancial return from its Redvale Landfi ll Gas to Energy operations.
The Redvale operation currently generates 9MW of electricity for the local grid which is soon to be increased to 11MW.
The most recent of these innovations is the biogas pilot project to produce and use fuel (or pipeline) quality biogas from raw landfi ll gas at the Redvale Landfi ll site.
The project seeks to demonstrate the potential for biogas technology to provide a more attractive and benefi cial use of landfi ll gas than electricity generation.
Producing biogas from landfi ll gas, rather than generating electricity, will allow Transpacifi c to avoid the unstable electricity Spot Price market. The process will also produce an output which directly offsets and potentially replaces the use
of fossil fuels (and associated greenhouse gasses), providing a greater global environmental benefi t.
It is anticipated the biogas will be suitable for use as a vehicle fuel and, potentially, for injection into the natural gas network. Both of these benefi cial uses will be tested in a second phase of the pilot project, which is to be started soon.
Transpacifi c Managing Director, New Zealand Tom Nickels said: “It is conceivable that in the future biogas produced from Redvale would be of suffi cient quantity to power Transpacifi c’s entire New Zealand collection fl eet, with potential for surplus sales for regional bus fl eets for example.”
The project is a collaboration between Transpacifi c, National Institute of Water & Atmospheric Research (NIWA) and Greenlane Biogas, a New Zealand technology supplier that has provided the biogas unit (called a MANUKA unit) which has been installed at the Redvale generation site.
For
per
sona
l use
onl
y

8
SOLID WASTE
SOLID WASTE CAPABILITIES
NICK BADYKCHIEF OPERATING OFFICER TRANSPACIFIC CLEANAWAY
TOM NICKELSMANAGING DIRECTORNEW ZEALAND
Transpacifi c Cleanaway
Despite a challenging economic climate throughout Australia, FY10 culminated in the Solid Waste Division posting good results.
The Division has achieved three half on half periods of growth which supports the restructure and cost controls implemented throughout the year. We also enjoyed an increase in both customer activity and returns from commodity prices.
Some highlights of the year include:
• The commencement of a partnership with a large automotive manufacturer
• The successful tender of a number of key municipal contracts
• Partnerships with a number of large retailers across the country
We aim to continue with a number of exciting business improvement and information technology projects that were commenced in FY10. We will also continue to build our presence in the fi eld of alternate waste technologies.
Another key area of focus will be on the delivery of our Strategic Objectives across the Collections and Post Collections businesses which are aimed at lifting our market share across the country.
Transpacifi c Waste Management
In New Zealand our businesses continued to focus on providing innovative waste and resource recovery solutions for our customers, increasing recovery of recyclable materials, introducing new services and developing new business segments.
During the second half of FY10, activity levels began to improve and in the January to June period we delivered higher profi ts than the same period in FY09 and in the fi rst half of FY10 – a pleasing end to the year.
Some highlights of the year include:
• Opening the new TTS Auckland facility upgrade for liquid, hazardous and medical waste processing
• Introducing our Waste Minimisation Education program with dedicated expert staff to work with customers assisting them in their recovery, recycle and reuse initiatives
• Winning preferred supplier tender from NZ Post, helping them achieve a 61.3% increase in recycled/recovered material
An important outcome of the strategic review process led to some realignment within our business streams, providing a more integrated structure to springboard enhanced operational synergies and effi ciencies.
Our future focus will continue to be on our customers, innovation and operational enhancements, underpinned by investment in implementation of our strategic objectives.
CEO’s Review
Divisional Overview
$1023.6m
REVENUE
$263.7m
EBITDA
$150.0m
EBIT
COLLECTIONS
Municipal, residential, commercial and industrial collection services of:
general waste
recyclables
construction and demolition waste
medical waste
organic waste
POST COLLECTION
Ownership and management of:
waste transfer stations
resource recovery and recycling facilities
landfi lls
alternative waste treatment (AWT) facilities
COMMODITIES TRADING
Sales of recyclables to the domestic and international marketplace, ensuring the long term sustainability of our limited natural resources:
paper and cardboard
metals
plastics
glass
2H10
1H10
2H09
1H09
508.4
515.2
473.6
564.5
2H10
1H10
2H09
1H09
136.9
126.8
119.4
144.1
2H10
1H10
2H09
1H09
78.7
71.3
69.9
98.3
For
per
sona
l use
onl
y

Transpacifi c Annual Report 2010 9
TONY RODERICKCHIEF OPERATING OFFICER TRANSPACIFIC INDUSTRIALS
INDUSTRIALS
INDUSTRIALS CAPABILITIES
Industrial Services
Transpacifi c’s Industrial Services businesses retained their respective market shares throughout FY10, despite subdued conditions, and concentrated on strengthening core competencies and capabilities.
This has positioned us well to capitalise on recovering market conditions.
Key strategic developments focussed on new market segments were identifi ed throughout FY10 and we are well placed to deliver on these in FY11.
Margins showed a recovery toward the end of FY10 due to a continued focus on operating and overhead effi ciencies.
Our Emergency Response capabilities were recognised during FY10 when the business was contracted to remove bunker fuels and oily waters from the Sheng Neng 1 coal carrier, which had struck the Great Barrier Reef. Transpacifi c’s national footprint enabled us to immediately respond to such an event.
Technical Services
The second half of FY10 showed improvement on the fi rst in volume and revenue. We expect this improvement to continue into FY11.
During FY10 we employed a strategy to ensure market share was not lost during diffi cult times where the manufacturing sector was extremely subdued. This proved to be successful and has positioned the business well for the future.
Following Transpacifi c’s restructure, and the subsequent formation of the Industrials Group, our new internal synergies allowed us to work together on a number of key projects. One such joint effort between the Liquid and Industrial Services divisions meant we could complete work on the Shen Neng 1 (as mentioned earlier).
Hydrocarbons
This group performed well throughout FY10. Favorable weather conditions realised higher than anticipated bitumen sales right through until June 30. Used oil collections remained high throughout the year and fully exploited our geographic spread of storage facilities.
Strategies put in place throughout the year will see the ongoing strength and growth of our refi neries over the next fi ve years.
$578.0m
REVENUE
$128.9m
EBITDA
$83.4m
EBIT
TECHNICAL SERVICES
Collection, treatment, processing, recycling of:
liquid and hazardous waste
industrial waste
grease trap waste
oily waters
used mineral and cooking oils
INDUSTRIAL SERVICES
Total waste management business solutions including:
industrial cleaning
vacuum tanker loading
site remediation
sludge management
parts washing
concrete remediation
CCTV
asbestos removal
refractory services
HYDROCARBONS
Refi ning, recycling, production and manufacture of:
used mineral oils
fuel and base oils
bituminous–based applications and coatings
2H10
1H10
2H09
1H09
292.1
285.9
283.6
324.3
2H10
1H10
2H09
1H09
67.2
61.7
67.6
80.0
2H10
1H10
2H09
1H09
44.5
38.9
44.4
58.4
For
per
sona
l use
onl
y

10
COMMERCIAL VEHICLES & MANUFACTURINGCommercial Vehicles
FY10 results for CVG were again impacted as Australian Transport Companies continued to delay new capital purchases and the Australian Heavy Duty Truck market decreased a further 11/% (2009 saw a decrease of 26%).
For Western Star it was a year of two halves with Market Share for the fi rst half further decreasing to 6.8% and then a dramatic increase to 10.3% for the second half as exchange rates improved and stock levels stabilised.
For MAN the All Wheel Drive segment servicing the Mining Industry continued with no activity however there are signifi cant signs of recovery for FY11.
The MAN Bus business continued to perform well achieving a Market Share of 13.4% in the Australian Heavy Duty Bus segment.
The new Parts Distribution Centre continues to perform with process continuing to create further effi ciencies. The CVG Parts business continues to grow year on year and is performing fi nancially.
During FY10 CVG completed Distribution agreements with Dennis Eagle in the UK for the supply of a purpose built refuse truck. These trucks will be imported in rolling chassis format and will be fi tted with full engine, transmission and drivelines in CVG’s own facility, making the truck a perfect fi t for the Australian Refuse Market.
A distribution agreement was also fi nalised with Foton of China. CVG will receive a limited volume of trucks 4.5 ton GVM in FY 11 and will slowly expand the product range over the ensuing years.
CVG will continue to work with Western Star and MAN to widen the current product portfolio. Various engineering projects have been committed to by both suppliers and new models for MAN will arrive in FY11 and for Western Star in FY12.
Manufacturing
Slowing capital expenditure of major clients and greater competition lead to a challenging manufacturing environment in FY10.
Throughout the fi nancial year our Superior Pak brand continued to grow in strength through increased activity at equipment shows, demonstration vehicles and a concentrated sales presence.
Highlights of the year include:
• Acquisition of Nylex Plastics in August 2009. Nylex is the second largest manufacturer of plastic two wheel bins and other waste related and general products for associated industries
• A major contract win with a municipal council, which included manufacturing over 90 vehicles and seven years of contract maintenance. This is reported to be the largest waste management manufacturing contract in the Southern Hemisphere
• Contracts for the installation of stationary compactors at a number of major facilities, including Westfi eld, Holden, Uncle Tobys and Streets
• Finalised the consolidation of our manufacturing and service facilities into three main manufacturing plants. These are in Bundaberg (mobile equipment), Tamworth (static and parts washers) and Seaford (plastics) and are supported by six Australian and New Zealand capital city service and parts centres
After a successful year of consolidation we have now laid the platform for an exciting year of growth through FY11 and with the merger between Commercial Vehicles and Manufacturing ahead we should move into an even stronger market position together.
PAUL GLAVACMANAGING DIRECTOR, COMMERCIAL VEHICLES AND MANUFACTURING
HAROLD GRUNDELLEXECUTIVE GENERAL MANAGER NEW ZEALAND, COMMERCIAL VEHICLES AND MANUFACTURING
$447.7m
REVENUE
$34.3m
EBITDA
$30.4m
EBIT
2H10
1H10
2H09
1H09
263.1
184.6
243.1
283.2
2H10
1H10
2H09
1H09
22.9
11.4
8.7
31.3
2H10
1H10
2H09
1H09
20.9
9.5
7.2
29.9
COMMERCIAL VEHICLES AND MANUFACTURING CAPABILITIES
COMMERCIAL VEHICLES MANUFACTURING
Dealer network provides services for an independent network of dealerships, including:
servicing
parts distribution
training
after sales support
warranty functions
The Brisbane and Tauranga (NZ) Truck Centres provide:
heavy vehicle sales
repairs and servicing
Importation and distribution of:
Western Star trucks chassis and associated parts
MAN trucks chassis, bus chassis and associated parts
Foton trucks chassis and associated parts
Dennis Eagle truck chassis and associated parts
Manufacture and servicing of:
vehicle bodies
parts washers
plastic and steel bins
waste compaction units
CEO’s Review
Divisional Overview (continued)F
or p
erso
nal u
se o
nly
Transpacifi c Annual Report 2010 11
CORPORATEThe corporate services division continued to build on the foundations laid across the Group in the previous fi nancial year.
As you can see, at Transpacifi c we have worked very hard to position ourselves to capitalise on exciting future opportunities.
The progress and achievements Transpacifi c has enjoyed is a testament to the ingenuity of our people and the depth and breath of the solutions we can provide.
Our people and our customers remain the cornerstones of our continued success and I look forward to continuing our journey delivering and exceeding on our total waste management promise and providing vehicle and industrial solutions.
Trevor CoonanChief Executive Offi cer
STEVE BARNARDGENERAL MANAGER CORPORATE SERVICES
KEVIN CAMPBELLCHIEF FINANCIAL OFFICER
MURRAY FLOYDGENERAL COUNSEL
STEVEN JOHNSTONECHIEF RISK OFFICER
A key Corporate function is safety across the Group. We have continued to successfully operate under an externally certifi ed Integrated Management System meeting the requirements of key Australian standards and we achieved the following key statistics;
• 11,700 Zero Harm Observations of our work activities
• 7,500 staff communication sessions and Toolbox Talks
• 1,200 workplace site inspections• Rollout across the Group of a new
safety leadership programme• 232 internal and external audits• 12,300 employee and contractor
drug and alcohol screenings• 16% improvement in Lost Time
Incident Frequency Rate to 2.51 for the Group
The initial licence period of two years for the self insurance of our Australian workers compensation via the Commonwealth’s Comcare scheme was recently extended for a further four years, demonstrating our priority focus on employment safety. This allows us to continue with the implementation of our plans for enhanced injury management and return to work outcomes.
Transpacifi c’s very capable in-house team of environmental specialists continued its ongoing reviews and site-specifi c assessments across the entire group. We continue to be totally committed to the use of best practice environmental procedures and compliance across the Group. In FY10 we reported under the Energy Effi ciency Opportunities Act and National Greenhouse and Energy Reporting Act for the fi rst time.
Our Human Resources department is implementing a fully integrated people
management application that will “go live” during 2011.
The Group’s rewards framework was reviewed, resulting in the implementation of a job evaluation system and an enhanced incentive program for senior and middle managers which includes a balanced scorecard from 2011.
Our Continuous Improvement department continued to introduce business effi ciency opportunities across the Group. The quarterly “Chairman’s Awards” continue to encourage and motivate staff and strategic partnerships were strengthened with our key business partners and suppliers through contract reviews and renewals for all key services.
Transpacifi c progressed our fi ve-year IT roadmap by focussing on standardising our ERP systems. We moved to a more secure and effi cient data network and provided enhanced extranet reporting to some of our key customers.
Our property team continued its review and assessment of the Group’s ongoing property and premises needs across all of its 370 sites, focussing on our valuable landfi ll properties.
Transpacifi c’s Chief Risk Offi cer, appointed in March 2010, is responsible for updating and refi ning the existing risk management processes within the Group, execution of the annual internal audit plan and management of the independent KPMG-provided Whistleblower function. To ensure a best practice approach to internal auditing within Transpacifi c, KPMG has also been appointed to assist Transpacifi c with the completion of the annual internal audit plan.
During FY10 the legal team has dealt with matters ranging from acquisitions, commercial matters, competition law compliance training and dispute resolution. In the coming year we shall continue to ensure that we fully understand the needs of our businesses and provide them with the appropriate tools to address legal risks and to assist them in complying with the regulatory environment in which they operate.
waste management prom
Trevor Coonan
For
per
sona
l use
onl
y

12
Gene Tilbrook was Finance Director at Wesfarmers Limited until his retirement in May 2009. Gene joined Wesfarmers in 1985 and held a number of commercial positions in its Business Development Department and at Wesfarmers Energy. He previously worked in corporate fi nance and in systems engineering. He led Wesfarmers’ business development group, becoming Executive Director, Business Development in 2002 and Finance Director in 2005.
He is a Non-Executive Director of Fletcher Building Ltd (appointed September 2009), GPT Group (appointed May 2010), NBN Co Ltd (appointed September 2009) and QR Limited (appointed April 2010).
Bruce Brown is currently a non-executive Director of Campbell Brothers Limited (appointed October 2005), an ASX listed company with diversifi ed operations globally which involve the provision of analytical laboratory services and also the distribution of chemicals and hospitality supplies. Mr Brown held fi nance and senior management positions with that company since 1976.
In 1990, Mr Brown was appointed Chief Executive Offi cer of Campbell Brothers Limited and three years later became its Managing Director. He resigned as Chief Executive Offi cer in 2005. Mr Brown has been integral to that company’s signifi cant growth and ongoing success in a broad range of industries.
Mr Brown was also a Director and Chairman of Flight Centre Ltd (December 2005 – November 2007).
Rajiv Ghatalia is a Managing Director of Warburg Pincus Asia LLC. He focusses on the fi rm’s leveraged buy-out and special situations activities including fi nancial services in Asia. Prior to joining Warburg Pincus in 2005, he was at Goldman Sachs, where he was a partner and co-head of investment banking, Asia Pacifi c (excluding Japan). Rajiv received a B.A. in economics from the University of Pennsylvania, a B.S. in accounting from The Wharton School at the University of Pennsylvania and an M.B.A. from Harvard Business School. He is a Director of Titan Group Investment Limited, and was previously a Director of Nikko Asset Management.
Bruce Allan is a mining engineer who has some 47 years’ experience working in the Australian resources industry, having held senior industry management positions with major organisations such as Rio Tinto and BHP Billiton, retiring from BHPB – Illawarra Coal as Vice President Operations in 2004, to form his own consulting business.He is currently Chairman of the Queensland Mines Rescue Service, a private industry organisation providing specialist services to the Queensland coal industry. Mr Allan is a Director of the Illawarra Retirement Trust, a large retirement organisation based in New South Wales and a non-executive director of Centennial Coal Limited, an ASX listed company (appointed December 2007).
Gene Tilbrook- Independent
Non-Executive Chairman- Chairman of the Nomination
Committee- Member of the Audit Committee- Member of the Risk &
Compliance Committee
Bruce Brown - Independent
Non-Executive Director- Member of the Audit
Committee- Member of the Human
Resources Committee
Rajiv Ghatalia- Non-Executive Director- Member of the Human
Resources Committee- Member of the Nomination
Committee
Bruce Allan - Independent
Non-Executive Director- Member of the Audit Committee- Member of the Risk &
Compliance Committee
Board of DirectorsF
or p
erso
nal u
se o
nly

Transpacifi c Annual Report 2010 13
Martin Hudson- Independent
Non-Executive Director- Chairman of the Risk &
Compliance Committee- Acting Chairman of the
Audit Committee
Kellie Smith - Company Secretary
Graham Mulligan - Independent
Non-Executive Director- Chairman of the Human
Resources Committee- Member of the Nomination
Committee
Trevor Coonan - Chief Executive Offi cer- Executive Director
Graham Mulligan is the Principal of International Infrastructure Ventures Pty Ltd, an independent consulting company which specialises in providing advisory services to major projects in the infrastructure, transport and oil industries. He holds both science and accountancy qualifi cations and has considerable experience as a senior executive in the international petroleum, infrastructure and transport industries. This included over 16 years with the New Zealand Oil & Gas Limited Group where he was both a Director and Senior Executive.
He has held a number of other Senior Executive roles, including CEO Port of Brisbane Corporation and Managing Director of Port Wellington Limited. He is a former Chairman of the Petroleum Exploration Association of New Zealand and is currently a Non-Executive Director of Chalmers Limited (appointed October 2009) and Roc Oil Company Limited (appointed September 2010).
Martin Hudson was Senior Vice President Commercial Affairs and Chief Legal Counsel at Foster’s Group Limited until his retirement in July 2009. He was previously Company Secretary and Chief General Counsel at Southcorp Limited, Chief General Counsel to the Pacifi c Dunlop Group of Companies and a partner (and then Managing Partner/Chairman in the Melbourne Offi ce) of national law fi rm Freehills. At both Foster’s and Southcorp he was responsible to the Board for corporate governance matters. Martin is a non-executive Director of NM Superannuation Pty Ltd (the Trustee of Axa Asia Pacifi c Holdings Limited’s public superannuation funds) and was previously a member of Freehill’s National Board and a non-executive director MLC Building Society as well as numerous companies in the Foster’s and Southcorp Groups. He has over 40 years of international legal and senior management experience.
Trevor Coonan joined Transpacifi c as Chief Financial Offi cer in 2004 prior to its listing on the ASX. Since that time Trevor has overseen and been actively involved in Transpacifi c strategy and acquisitions and in conveying the acquisitions and expectations to shareholders and the market. On 1 July 2007, Trevor was appointed CEO. Prior to joining the company he was a director with PriceWaterhouseCoopers. Trevor holds a Bachelor of Commerce degree and is a Chartered Accountant.
Kellie Smith joined Transpacifi c as Group Corporate Accountant in 2004 prior to its listing on the ASX. In 2005 she became Company Secretary. Kellie holds a Bachelor of Commerce (Honours) degree and is a Chartered Accountant.
For
per
sona
l use
onl
y

Financial Report
14
Corporate Governance
Transpacifi c Industries Group Ltd (Transpacifi c or the Company) and its Board of Directors are committed to fulfi lling their corporate governance obligations and responsibilities in the best interests of the Company and its stakeholders, and fully support the Australian Securities Exchange’s (ASX) Corporate Governance Principles and Recommendations (ASX guidelines).
Throughout the reporting period Transpacifi c has enhanced its corporate governance framework to meet industry and market expectations, and best practice guidelines. This has included the appointment, in September 2009, of three additional Non-Executive Directors (two of whom are independent); the creation of a Risk and Compliance Committee, and separate Nomination and Human Resources Committees of the Board; the adoption of new Charters for the Board and each of its Committees; the appointment of a Chief Risk Offi cer; the appointment of KPMG as Internal Auditors; and the appointment in June 2010 of an independent Non-Executive Director (Mr Gene Tilbrook) as Chairperson of the Board.
Copies of the Charters, codes and policies in respect of Transpacifi c’s corporate governance practices referred to in this Statement are available on the corporate governance section of the Transpacifi c website – www.transpacifi c.com.au
Principle 1: Lay solid foundations for management and oversight
The Transpacifi c Board operates under a Charter which sets out the role, powers and responsibilities of the Board. The Board is responsible for the overall corporate governance of the Company. The Board Charter sets out the following objectives of the Board:
• to provide strategic guidance for Transpacifi c and effective oversight of its management and its business activities;
• to optimise Transpacifi c’s performance so as to create and build sustainable value for shareholders within a framework of appropriate risk assessment and management; and
• to ensure Transpacifi c’s legal and other obligations to all legitimate stakeholders are being achieved.
The primary responsibilities of the Board towards achievement of these objectives are also set out in the Charter as follows:
• oversight of Transpacifi c, including its control and accountability systems;
• contribute to the development of, and fi nal approval of, management’s corporate strategy and performance objectives;
• monitoring the implementation of the policies, strategies and objectives of Transpacifi c;
• appointing, and, where appropriate, removing the Chief Executive Offi cer, and approving his/her terms of engagement and termination benefi ts;
• ratifying the appointment and, where appropriate, the removal of members of the Executive Management team, approving their terms of engagement and termination benefi ts, and monitoring their performance;
• promulgating clear standards of ethical behaviour required of Directors and key executives and encourage observance of those standards;
• reviewing, ratifying and monitoring systems of risk management, internal compliance and control, codes of conduct and legal compliance;
• protecting Transpacifi c’s fi nancial position and its ability to meet its debts and other obligations as they fall due; and
• ensuring Transpacifi c’s fi nancial report complies with relevant accounting standards and presents a true and fair view.
The Board Charter is regularly reviewed to ensure it remains consistent with the Board’s objectives and responsibilities.
The Chief Executive Offi cer is responsible to the Board for the day-to-day management of Transpacifi c.
Evaluating the performance of Executive Management
The Board is responsible for monitoring and evaluating the performance of the members of the Executive Management team. Throughout the reporting period a review of the management structure of Transpacifi c was undertaken, and the job descriptions for all Senior Executives were reviewed and updated as part of this process, along with the process for evaluating their performance.
For
per
sona
l use
onl
y

Transpacifi c Annual Report 2010 15
There was no formal performance evaluation of the members of the Executive Management team during the fi nancial year, other than the Chief Executive Offi cer as discussed in Principle 2.
Principle 2: Structure the Board to add value
Transpacifi c’s Constitution calls for at least three but not more than 10 Directors. Throughout the reporting period, the Board comprised six Non-Executive Directors (fi ve of whom were independent), and two Executive Directors. Profi les of each Director, outlining their appointment dates, qualifi cations, directorships of other listed companies (including those held at any time in the three years immediately before the end of the fi nancial year), experience and expertise, are set out on pages 12 to 13 of the Annual Report. At the end of the reporting period one of the Executive Directors, Mr Peabody, resigned.
Director independence
As required under the Board Charter and ASX guidelines, the Board comprises a majority of independent Non-Executive Directors.
The Charter states that Transpacifi c will regard a Non-Executive Director as independent if he or she is not a member of management and is free of any business or other relationship that could materially interfere with, or could reasonably be perceived to materially interfere with, the independent exercise of their judgement.
When determining the independent status of a Non-Executive Director, the Board will take into account whether that Director:
• is a substantial shareholder of Transpacifi c or an offi cer of, or otherwise associated directly with, a substantial shareholder of Transpacifi c;
• is employed, or has previously been employed in an executive capacity by Transpacifi c, and there has not been a period of at least three years between ceasing such employment and serving on the Board;
• has within the last three years been:
– a principal of a material professional adviser to the Transpacifi c Group;
– a material consultant to the Transpacifi c Group; or
– an employee materially associated with the service provided by such adviser or consultant to the Transpacifi c Group;
• is a material supplier or customer of the Transpacifi c Group, or an offi cer of or otherwise associated directly or indirectly with a material supplier or customer; or
• has a material contractual relationship with the Transpacifi c Group other than as a Director of Transpacifi c.
Whether or not a material relationship exists will be determined, on a case-by-case basis, giving consideration to the nature of the relationship and the circumstances of the Director. Materiality will be considered from the perspective of the Company, the Director, and the person or entity with which the Director has a relationship.
Applying these criteria the Board has determined that all Directors are independent, with the exception of:
• Mr Terry Peabody – Executive Director (resigned 30 June 2010) and substantial shareholder of Transpacifi c;
• Mr Trevor Coonan – Executive Director and Chief Executive Offi cer;
• Mr Rajiv Ghatalia – Non-Executive Director and Managing Director Warburg Pincus Asia, an entity related to a substantial shareholder of Transpacifi c.
Chair of the Board
The Board Charter requires an independent Non-Executive Director to hold the position of Chairperson of the Board, unless the Board otherwise resolves. The Board had determined that it was appropriate that the Company’s founder, Mr Terry Peabody, who was not an independent Director, hold the position of Executive Chairman because of his particular vision, skills and deep industry knowledge. This appointment was not in accord with recommendation 2.2 of the ASX guidelines. Mr Peabody resigned as Executive Chairman on 3 June 2010 and as a Director on 30 June 2010. Mr Gene Tilbrook, an independent Non-Executive Director, became Chairman on 3 June 2010.
The Board confi rms that as a result of the appointment of Mr Tilbrook as Non-Executive Chairman, the current corporate governance practices of the Company are consistent with the ASX guidelines.
For
per
sona
l use
onl
y

16
Financial Report
The roles of the Chairperson and Chief Executive Offi cer are not exercised by the same person, as Mr Trevor Coonan is the Chief Executive Offi cer.
Confl icts of interest
Directors are required to keep the Board advised, on an ongoing basis, of any interest that could potentially confl ict with those of Transpacifi c. A Director who has an actual or potential confl ict of interest or a material personal interest in a matter is required to declare that potential or actual confl ict of interest to the Board. If the Board determines that there is a material confl ict of interest, the Board may require the relevant Director to:
(a) not receive the relevant papers;
(b) not be present at the meeting while the matter is considered; and
(c) not participate in any decision on the matter.
The Board may resolve to permit a Director to have an involvement in a matter involving a potential or actual confl ict of interest. In such instances the Board will minute full details of the basis of the determination and the nature of the confl ict, including a formal resolution concerning the matter.
Board committees
The Board has restructured its committees during the reporting period, and now carries out a number of its duties and responsibilities through the following Board Committees:
• Audit Committee – (formerly the Audit, Risk and Compliance Committee);
• Risk and Compliance Committee – established 18 March 2010;
• Human Resources Committee – (formerly the Nomination and Remuneration Committee);
• Nomination Committee – established 31 May 2010.
These committees replace the former Audit, Risk and Compliance Committee and Nomination and Remuneration Committee which operated throughout the remainder of the reporting period.
The Charter of each Board Committee sets out the respective duties and responsibilities of that particular committee.
Details of individual Director’s memberships of Board Committees are provided in the biographies included on pages 12 to 13 of the Annual Report.
Directors’ attendance at Board and Board Committee meetings
The number of Board and Board Committee meetings held and attendance by Directors at these meetings is set out in the Directors’ Report on page 24.
The Non-Executive Directors receive regular briefi ngs on Transpacifi c’s operations from the Senior Executive team, undertake site visits, and receive presentations from external parties in a range of fi elds.
The Non-Executive Directors meet without the presence of management during the course of regular Board meetings, and on other occasions as required outside regular Board meetings.
Independent advice
The Board and each of the committees have the authority to seek any information it requires from any employee or external party, including the Internal and External Auditors. Any Directors may take such independent legal, fi nancial or other advice as it considers necessary to fulfi l its duties, at the expense of the Company. Before the external advice is sought consent needs to be obtained from the Chairperson of the Board. The Chairperson may determine that any external advice received by an individual Director be circulated to the remainder of the Board.
Nomination Committee
The Nomination Committee consists entirely of Non-Executive Directors, and is chaired by the Board Chairperson. The members of the committee are:
G T Tilbrook (Chairman)
G D Mulligan
R A Ghatalia
The committee meets as required, and at least twice per year. Details of meetings of the former Nomination and Remuneration Committee, which was responsible for nomination matters throughout the reporting period, are set out on page 24.
The committee’s role is to assist the Board to ensure that it is of an effective composition, size and commitment to adequately discharge its responsibilities and duties. Its duties include:
• reviewing, assessing and making recommendations to the Board on the necessary and desirable competencies of the Directors and relevant Board Committees;
• evaluating the Board’s performance;
• overseeing the selection and appointment practices for Non-Executive Directors of Transpacifi c; and
• reviewing Board succession plans.
Corporate Governance (continued)F
or p
erso
nal u
se o
nly

Transpacifi c Annual Report 2010 17
Performance evaluation
Under its Charter, the Nomination Committee is responsible for undertaking regular reviews of the Board’s effectiveness, and the effectiveness of the Board Committees and individual Directors.
During the reporting period an external consultant was engaged to conduct a comprehensive review of the Board, its committees and individual Directors, including the Chief Executive Offi cer. This review involved surveys and interviews with each Director, Transpacifi c’s Senior Executives and relevant external persons.
Individual Directors received feedback from the Chairman on a confi dential basis. The results were also considered by the Board as a whole.
Principle 3: Promote ethical and responsible decision making
Code of Conduct
Transpacifi c recognises that its reputation is an essential element to its success, and that its reputation is directly attributable to the ethical behaviour of those who represent it. Transpacifi c has developed a Corporate Code of Conduct (the Code) which sets out certain basic principles that all Directors, employees, contractors and consultants are expected to follow in all dealings related to Transpacifi c, to ensure that Transpacifi c’s business is conducted in accordance with the laws and regulations of the countries in which it operates.
The Code is fully endorsed by the Board and is regularly reviewed and updated as necessary to ensure it refl ects the highest standards of behaviour and professionalism and the practices necessary to maintain confi dence in Transpacifi c’s integrity.
Any breach of the Code is considered a serious matter, which may result in disciplinary action, including termination of employment.
A copy of the Code is available on the Transpacifi c website – www.transpacifi c.com.au
Whistleblower Policy
Transpacifi c employees who are aware of any serious misconduct or unethical behaviour that contravenes the Corporate Code of Conduct, or any Transpacifi c policies or the law, are encouraged to report this to their manager or make a report under the Transpacifi c FairCall program.
The Whistleblower Policy provides that all reports will be investigated in an appropriate manner, and that feedback on the outcome of the investigation will be provided to the person making the report where appropriate.
The Company will not tolerate any reprisals, discrimination, harassment, intimidation or victimisation against any person suspected of making a report of unacceptable conduct.
Securities Trading Policy
Transpacifi c’s Securities Trading Policy reinforces the Corporations Act 2001 restrictions in relation to insider trading, and prohibits its Directors, Senior Executives and other employees from dealing in Transpacifi c shares at any time if that person is in possession of price-sensitive information that has not been made public.
Under the policy:
• Employees other than Directors and Senior Executives must not deal in TPI Securities, except during the following Trading Windows:
– for a period of up to six weeks from the day after the release of Transpacifi c’s half-year and full-year results to the ASX;
– for a period of up to six weeks from the day after the Annual General Meeting has been held;
– at any time Transpacifi c has a prospectus open; or
– at any other time the Board declares trading permissible in a written note to all staff and the ASX.
• Before any Director or Senior Executive deals in any Transpacifi c securities at any time, including during Trading Windows, he or she must discuss the proposed dealing with, and obtain written approval from:
– the Chairman, in the case of Directors and Senior Executives; or
– in the case of the Chairman, the Chairman of the Risk and Compliance Committee.
• Directors, Senior Executives and other employees are prohibited from engaging in short-term or speculative trading in Transpacifi c securities, as well as trading in derivatives.
• No Director, Senior Executive or employee (to the extent their margin loan is considered material) may directly or indirectly enter into any margin loan facility against Transpacifi c securities unless the prior written consent of the Chairperson of the Board is obtained.
The Securities Trading Policy is available on the Transpacifi c website – www.transpacifi c.com.au
Principle 4: Safeguard integrity in fi nancial reporting
Audit Committee
Transpacifi c has established an Audit Committee, which consists entirely of independent Non-Executive Directors as follows:
M M Hudson (Acting Chairman)
B R Brown
G T Tilbrook
B S Allan
For
per
sona
l use
onl
y

18
Financial Report
The committee has appropriate fi nancial expertise and all members are fi nancially literate and have an appropriate understanding of the industries in which Transpacifi c operates. The committee meets as required, normally at least four times per year – see page 24 for details of meetings. The Chairperson of this committee is also a member of the Risk and Compliance Committee. The Chairperson of the Board is not permitted to chair this committee.
The committee’s role is to assist the Board to independently verify and safeguard the integrity of Transpacifi c’s fi nancial reporting, and review and evaluate all material capital management fi nancing and treasury risk management proposals. The committee’s primary responsibilities are to:
• assess whether the Company’s external reporting is legally compliant, consistent with committee members’ information and knowledge, and suitable for shareholder needs;
• assess the management processes supporting external reporting;
• liaise with the External Auditors and ensure that the annual statutory audit and half-year review are conducted in an effective manner;
• make recommendations for the appointment or removal of the External and the Internal Auditors;
• on an annual basis, assess the performance and independence of the External and Internal Auditors;
• monitor the coordination of the internal and external audits;
• approve the external audit plan; and
• in conjunction with the Risk and Compliance Committee, approve the internal audit plan.
The committee has the authority to seek any information it requires from any employee or external party, including the Internal and External Auditors.
At each meeting the committee meets with the Internal and External Auditors without management present.
Certifi cation under section 295A of the Corporations Act 2001
In accordance with section 295A of the Corporations Act 2001, Senior Management performing the chief executive and chief fi nancial offi cer functions have provided a written statement to the Board (Declaration) confi rming that, in their opinion:
• the Company’s fi nancial report presents a true and fair view of the Company’s fi nancial condition and operating results and is in accordance with applicable accounting standards; and
• the Company’s fi nancial records for the fi nancial year have been properly maintained in accordance with section 286 of the Corporations Act 2001.
This written statement also confi rms to the Board that the Declaration was founded on a sound system of risk management and internal control and that the system to the extent it relates to fi nancial reporting was operating effectively and effi ciently in all material respects.
Independence of the External Auditor
Ernst & Young were appointed as the Company’s External Auditors in November 2009. The lead external audit partner is required to rotate after a maximum of fi ve years.
Ernst & Young has provided an independence declaration to the Board for the fi nancial year ended 30 June 2010. The independence declaration forms part of the Directors’ Report and is provided on page 38 of this Annual Report.
Principle 5: Make timely and balanced disclosure
Transpacifi c has adopted a Continuous Disclosure Policy which sets out the procedures and requirements expected of all employees of the Company, including Directors and Senior Executives to ensure compliance with its continuous disclosure obligations under the ASX Listing Rules and the Corporations Act 2001.
The Continuous Disclosure Policy is available on the Transpacifi c website – www.transpacifi c.com.au
Principle 6: Respect the rights of shareholders
Transpacifi c is committed to ensuring shareholders are provided with full, open and timely material information about its activities. In addition to compliance with its continuous disclosure obligations under the ASX Listing Rules, Transpacifi c achieves this through:
• ensuring that all communications with shareholders, including the annual report and notice of annual general meeting, satisfy statutory requirements and are easily understandable;
• ensuring that all shareholders have the opportunity to receive external communications issued by the Company. All Company announcements and information released are available via a link to the ASX website under the investor section of the Transpacifi c website;
• encouraging shareholders to attend annual general meetings to hear the Chairman’s address, and to use the opportunity to ask questions. If shareholders are unable to attend in person, they are encouraged to participate through the appointment of a proxy, or proxies; and
• the Company’s External Auditor attends the annual general meetings to answer questions from shareholders about the conduct of the audit and the preparation and content of the Independent Audit Report. Shareholders attending the meeting are made aware that they may ask such questions of the Auditor, and are provided an opportunity to submit written questions prior to the meeting.
A copy of the Shareholder Communication Policy is available on the Transpacifi c website – www.transpacifi c.com.au
Corporate Governance (continued)F
or p
erso
nal u
se o
nly

Transpacifi c Annual Report 2010 19
Principle 7: Recognise and manage risk
The Board recognises that effective risk management processes are imperative to the Company achieving its business objectives and to the Board meeting its corporate governance responsibilities.
Risk and Compliance Committee
The Risk and Compliance Committee (created during the reporting period out of the former Audit, Risk and Compliance Committee to allow for more focus on the risks that face Transpacifi c) consists entirely of Non-Executive Directors. The members of the committee are:
M M Hudson (Chairman)
B S Allan
G T Tilbrook
G D Mulligan
The committee meets as required, normally at least four times per year – see page 24 for details. The Chairperson of this committee is also a member of the Audit Committee.
The committee is responsible for:
• ensuring Transpacifi c addresses all legal and other obligations to all legitimate stakeholders including employees, shareholders and other external counterparties;
• establishing a sound system of risk oversight, management and internal control;
• ensuring that Transpacifi c’s systems and processes are properly controlled and functioning effectively;
• with the Audit Committee, approve the internal audit plan; and
• actively promoting ethical and responsible decision making within Transpacifi c.
Detailed control procedures cover management accounting, fi nancial reporting, project appraisal, environment, health and safety, IT security, compliance and other risk management issues. Numerous risk management controls are embedded in the Company’s risk management and reporting systems, including:
• guidelines and limits for approval of all expenditure inclusive of capital expenditure and investments;
• policies and procedures for the management of fi nancial risk and treasury operations, including hedging exposure to foreign currencies and interest rates;
• annual budgeting and monthly reporting systems for all divisions, which enable monitoring of progress against performance targets, evaluation of trends and variances to be acted upon;
• preparation and ongoing review of fi ve-year strategic plans for all divisions;
• health and safety programs and targets; and
• due diligence procedures for acquisitions.
Transpacifi c appointed a Chief Risk Offi cer in March 2010 who is responsible for updating and refi ning the existing risk management processes within Transpacifi c, and implementing a detailed internal audit function across the Group. To ensure a best practice approach to internal auditing with TPI, KPMG has also been appointed to assist Transpacifi c with the completion of the annual internal audit plan.
At each meeting the Risk and Compliance Committee meets with the Internal Auditors without Management present.
Certifi cation under section 295A of the Corporations Act 2001
The written statement provided to the Board under section 295A of the Corporations Act 2001, referred to above in respect of Principle 4, confi rmed that the Declaration was founded on a sound system of risk management and internal control and that the system is operating effectively in all material respects in relation to fi nancial reporting risks.
Occupational Health, Safety and Environment (OHSE)
Transpacifi c recognises the importance of OHSE issues and is committed to a Zero Harm philosophy. Transpacifi c:
• monitors its compliance with all legislation;
• continually assesses and improves the impact of its operations on the environment; and
• encourages employees to actively participate in the management of OHSE issues.
The OHSE department conducts management systems, operational and licensing audits throughout the year as part of the Compliance Management Strategy. Transpacifi c has an externally certifi ed Integrated Management System meeting the requirements of AS 4801 (Occupational Health and Safety), ISO 14001 (Environment) and ISO 9001 (Quality).
A Greenhouse Gas Emissions Policy has been implemented across the Group. The policy is focused on improving our environmental footprint through the reduction of greenhouse gas emissions. Energy effi ciency and emission reduction strategies will be assessed and implemented to help Transpacifi c achieve this goal.
Information on compliance with signifi cant environmental regulations is set out in the Directors’ Report.
For
per
sona
l use
onl
y

Financial Report
20
Principle 8: Remunerate fairly and responsibly
Human Resources Committee
The Board has recently moved the human resources responsibilities of the former Nomination and Remuneration Committee to a Human Resources Committee. The role of this committee is to assist the Board in ensuring Transpacifi c has in place appropriate human resources strategies and remuneration and employment policies that are consistent with best practice and business requirements, and that Transpacifi c adopts and complies with remuneration and employment policies that:
• attract, retain and motivate high calibre executives and directors so as to encourage enhanced performance of Transpacifi c;
• are consistent with the human resource needs of Transpacifi c;
• motivate management to pursue the long-term growth and success of Transpacifi c within an appropriate control framework; and
• demonstrate a clear relationship between executive performance and remuneration.
The Human Resources Committee consists entirely of Non-Executive Directors, as follows:
G D Mulligan (Chairman)
B R Brown
R A Ghatalia
The committee meets as required and at least four times per year – see page 24 for more details.
Remuneration Report
The Remuneration Report, which has been included in the Directors’ Report, provides information on Transpacifi c’s remuneration policies and payment details for Directors and Senior Executives.
Corporate Governance (continued)F
or p
erso
nal u
se o
nly

Transpacific Annual Report 2010 21
Transpacific Industries Group Ltd ABN 74 101 155 220
FINANCIAL REPORT Financial Year Ended 30 June 2010
Contents
Directors’ Report 22
Auditor’s Independence Declaration 38
Statement of Financial Position 39
Statement of Comprehensive Income 40
Statement of Changes in Equity 42
Statement of Cash Flows 43
Notes to the Financial Statements 44
Directors’ Declaration 110
Independent Audit Report to the Members 111
Shareholder Information 112
For
per
sona
l use
onl
y

22
Directors’ Report
The Directors present their report together with the financial report of Transpacific Industries Group Ltd (“the Company”) and of the Group, being the Company and its subsidiaries for the financial year ended 30 June 2010 and the auditor’s report thereon.
Directors
The names of Directors of the Company at any time during or since the end of the financial year are as follows. Directors were in office for this entire period unless otherwise stated. T E Peabody – Executive Chairman (resigned as Chairman 3 June 2010 and Director 30 June 2010)
G T Tilbrook – Non-Executive Chairman (appointed Director 3 September 2009 and Chairman 3 June 2010)
T J Coonan – Executive Director and Chief Executive Officer
H W Grundell – Executive Director (resigned 3 September 2009)
B R Brown – Non-Executive Director and Deputy Chairman
G D Mulligan – Non-Executive Director
B S Allan – Non-Executive Director
R A Ghatalia – Non-Executive Director (appointed 1 September 2009)
M M Hudson – Non-Executive Director (appointed 14 September 2009)
The office of Company Secretary is held by K L Smith, B.Com (Hons), CA.
Particulars of Directors’ qualifications, experience and special responsibilities are detailed on pages 12 to 13 of the Annual Report.
Principal Activities
During the financial year the principal continuing activities of the Group consisted of:
• solid waste, including its collection, transportation, recycling, disposal at, and management of, landfills;
• management of liquid waste, including its collection, transportation, treatment and disposal;
• the collection, re-refining, processing and sale of hydrocarbon and cooking oils;
• site remediation, contaminated site clean-up, dredging, composting and biosolids management;
• industrial solutions including industrial cleaning, high pressure water blasting, total waste management business solutions and lease out of parts washers;
• commercial vehicles and parts importing and sales; and
• manufacturing of parts washer machines, waste compaction systems and bins.
No significant changes in the nature of the activities of the Group occurred during the year.
Dividends and Distributions
Details of dividends and distributions in respect of the financial year are as follows:
2010
$’000 2009 $’000
ORDINARY SHARES:
Final dividend for the year ended 30 June 2009 - 0 cents per share (2008: 10.1 cents) - 29,621
Interim dividend for the year ended 30 June 2010 - 0 cents per share (2009: 0 cents) - -
TOTAL DIVIDENDS PAID - 29,621
For
per
sona
l use
onl
y

Transpacific Annual Report 2010 23
2010 $’000
2009 $’000
SPS PREFERENCE SECURITIES: Distribution of $2.31 per unit paid on 15 October 2009 (2009: $4.02) 5,775 10,050 Distribution of $2.54 per unit paid on 15 April 2010 (2009: $3.60) 6,350 9,000 TOTAL DISTRIBUTIONS PAID 12,125 19,050 TOTAL DIVIDENDS AND DISTRIBUTIONS PAID 12,125 48,671
In accordance with certain restrictions on payment of future dividends agreed with WPX Nominees B.V. (“the Cornerstone Investor”), syndicate banks and USPP noteholders, the Directors have decided not to declare a final dividend for 2010.
The payment of the SPS preference securities distribution for the period ending 30 September 2010 of $7,175,000 ($2.87 per unit) is to be paid on 15 October 2010. The financial effect of this distribution has not been brought to account in the financial statements for the year ended 30 June 2010 and will be recognised in subsequent financial reports.
All dividends and distributions paid and proposed are fully franked.
Review of Operations, Financial Position, Business Strategies and Prospects
The Group net profit after income tax attributable to ordinary equity holders of Transpacific Industries Group Ltd for the year ended 30 June 2010 was $59.0 million (2009: loss $237.4 million).
The 2010 results include a mark to market for change in the fair value of derivative financial instruments and warrants of $11.7 million profit (pre-tax). Additional results commentary is included in the CEO’s report on page 2.
The 2009 results were negatively affected by significant items including:
• mark to market of listed investments, financial instruments and intangible assets of $282.6 million (pre-tax); • provision re-estimates of $43.3 million (pre-tax); • borrowing costs on syndicated banking facilities of $27.2 million (pre-tax); and • other items of $2.1 million (pre-tax).
Underlying net profit after income tax for the year ended 30 June 2010 (excluding significant items) was $55.7 million (2009: $72.3 million (excluding profit on repurchase of convertible bonds and significant items)).
In August 2009, the Group concluded a major recapitalisation project raising $801 million from the issue of 649,657,609 fully paid ordinary shares. $704 million of these proceeds were used to reduce debt. This process delivered a strengthened statement of financial position and long-term extensions to the Group’s syndicated debt facilities. The syndicated debt maturities have been extended into new four and five year tranches due in July 2013 and July 2014.
Significant Changes in the State of Affairs
Other than matters mentioned in this report, no other significant changes in the state of affairs of the Group occurred during the financial year under review.
Events Subsequent to Reporting Date
There has not arisen in the interval between the end of the financial year and the date of this report any item, transaction or event of a material and unusual nature likely, in the opinion of the Directors of the Company, to affect significantly the operations of the Group, the results of those operations, or the state of affairs of the Group, in future financial years.
For
per
sona
l use
onl
y

24
Directors’ Report (continued)
Likely Developments and Expected Results of Operations
Material likely developments and expected results of operations of the Group have been notified to the market and include investigation of further acquisitions and market opportunities.
Further information about likely developments in the operations of the Group and the expected results of those operations in future financial years have not been included in this report because disclosure of the information would be likely to result in unreasonable prejudice to the Group.
Environmental Regulation
The Group’s operations are subject to significant environmental regulation.
The Group holds environmental licences for its sites throughout Australia and New Zealand.
The Group is committed to achieving the highest standards of environmental performance. There were no material breaches of environmental statutory requirements and no material prosecutions during the year. The aggregate fines paid during the year were $95,023 but are not considered material.
Meetings of Directors
The number of Directors’ meetings (including meetings of committees of Directors) and number of meetings attended by each of the Directors of the Company during the financial year are
BOARD MEETINGS
AUDIT RISK MANAGEMENT AND COMPLIANCE
COMMITTEE
AUDIT COMMITTEE
DIRECTOR
MEETINGS HELD WHILE A DIRECTOR
NUMBER ATTENDED
MEETINGS HELD WHILE A MEMBER
NUMBER ATTENDED
MEETINGS HELD WHILE
A MEMBER NUMBER
ATTENDED
T E Peabody 15 12 * * * * G T Tilbrook 12 11 4 4 2 2 T J Coonan 15 15 * * * * H W Grundell 3 3 * * * * B R Brown 15 15 5 5 2 2 G D Mulligan 15 15 5 4 * *
B S Allan 15 12 5 5 2 1 R A Ghatalia 12 12 * * * * M M Hudson 12 11 4 4 2 2
RISK COMMITTEE NOMINATION &
REMUNERATION COMMITTEE HUMAN RESOURCES
COMMITTEE
DIRECTOR
MEETINGS HELD WHILE A DIRECTOR
NUMBER ATTENDED
MEETINGS HELD WHILE A MEMBER
NUMBER ATTENDED
MEETINGS HELD WHILE
A MEMBER NUMBER
ATTENDED
T E Peabody * * 5 5 1 0 G T Tilbrook 2 2 * * * * T J Coonan * * * * * * H W Grundell * * * * * * B R Brown * * 5 5 1 1 G D Mulligan 2 2 5 5 1 1 B S Allan 2 2 * * * *
R A Ghatalia * * 4 4 1 1 M M Hudson 2 2 * * * *
* Not a member of the relevant committee.
For
per
sona
l use
onl
y

Transpacific Annual Report 2010 25
Directors’ Interests
The relevant interest of each Director in the shares and options over such instruments issued by the companies within the Group and other related body corporates, as notified by the Directors to the Australian Securities Exchange in accordance with s205G(1) of the Corporations Act 2001, at the date of this report is as follows
ORDINARY
SHARES
OPTIONS OVER UNISSUED
ORDINARY SHARES
PERFORMANCE RIGHTS
EXECUTIVE T J Coonan - - 2,074,079 NON-EXECUTIVE G T Tilbrook 30,000 - - B R Brown 200,000 - -
G D Mulligan 82,810 - - B S Allan 25,653 - - R A Ghatalia - - - M M Hudson 7,000 - -
Mr Coonan has a call option to purchase 1,275,384 shares from the counterparties, exercisable at any time until 5 August 2014. The purchase price is:
PURCHASE BEFORE PRICE PER SHARE
5 August 2010 $3.253
5 August 2011 $3.528
5 August 2012 $3.826
5 August 2013 $4.149
5 August 2014 $4.500
The counterparties to the Put and Call options have a put option which requires the purchase of 1,275,384 shares after 5 August 2014, at a purchase price of $4.50 per share. The put option may be exercised immediately if Mr Coonan is dismissed from employment by the Group for cause, or leaves to take a position with a competitor of the Group.
REMUNERATION REPORT (AUDITED)
REMUNERATION POLICY
The key driver of the Company’s remuneration policy is to attract and retain top quality Directors and Executives to ensure the continued success of the Group for the benefit of all stakeholders.
During the 2010 financial year, the Board worked closely with management and external consultants to conduct a complete review of the Senior Executive remuneration structure, including incentive programs. Details of the remuneration structure are set out in this report.
The remuneration report is set out under the following main headings:
A. Human Resources Committee
B. Non-Executive Directors’ Remuneration
C. Executive Director and Senior Executive Remuneration Policy and Structure
D. Key Executive Contract Terms
E. Remuneration of Executive Directors and Key Management Personnel
F. Share Based Remuneration
This Remuneration Report outlines the Director and Executive remuneration arrangements of the Group in accordance with the requirements of the Corporations Act 2001 and its Regulations. This information has been audited as required by section 308(3C) of the Act.
For
per
sona
l use
onl
y

26
Directors’ Report (continued)
For the purposes of this report, key management personnel (KMP) of the Group are defined as those persons having authority and responsibility for planning, directing and controlling the major activities of the Group, directly or indirectly, including any Director (whether Executive or otherwise) of the parent company, and includes the five highest remunerated Executives of the Group.
A. Human Resources Committee
The Human Resources Committee assists the Board in ensuring the Group establishes appropriate human resources strategies and remuneration and employment policies consistent with best practices and business requirements, and adopts and complies with remuneration and employment policies that: • attract, retain and motivate high calibre Executives and Directors so as to encourage enhanced performance
of the Group; • are consistent with the human resources needs of the Group; • motivate management to pursue the long-term growth and success of the Group within an appropriate risk
and control framework; and • demonstrate a clear relationship between Executive performance and remuneration.
B. Non-Executive Directors’ Remuneration
Non-Executive Directors are paid Directors’ fees which reflect the demands that are made on, and the responsibilities of, those Directors. Non-Executive Directors’ fees and payments are reviewed annually by the Board and are determined within an aggregate Directors’ fee pool limit, which is periodically recommended for approval by shareholders. The Board seeks to set aggregate remuneration at a level that provides the Group with the ability to attract and retain Directors of the highest calibre, whilst incurring a cost that is acceptable to shareholders. The maximum aggregate Director fee pool limit currently stands at $750,000 per annum, to be apportioned among the Non-Executive Directors as the Board determines in its absolute discretion. The Board will make a recommendation to the November 2010 annual general meeting to increase the aggregate Directors’ fee pool limit to $1.2 million as a result of the appointment of a Non-Executive Chairman, an increase in the number of Non-Executive Directors, and to ensure fees paid are comparable with other companies of a similar size. For the year ended 30 June 2010, Non-Executive Directors were paid a flat fee of $125,000 (inclusive of superannuation) per annum. Should the increased fee pool be approved, it is intended that for the year ending 30 June 2011 the Non-Executive Chairman receive a fee of $275,000 and Non-Executive Directors receive a fee of $125,000 (excluding Mr Ghatalia). It is also intended that the Chair of the Audit Committee receive a fee of $30,000 and the Chairs of the Risk and Compliance Committee and the Human Resource Committee receive a fee of $20,000 each. The fees of the Chairs of the Committees reflect the additional work required by the Directors holding such positions.
For
per
sona
l use
onl
y
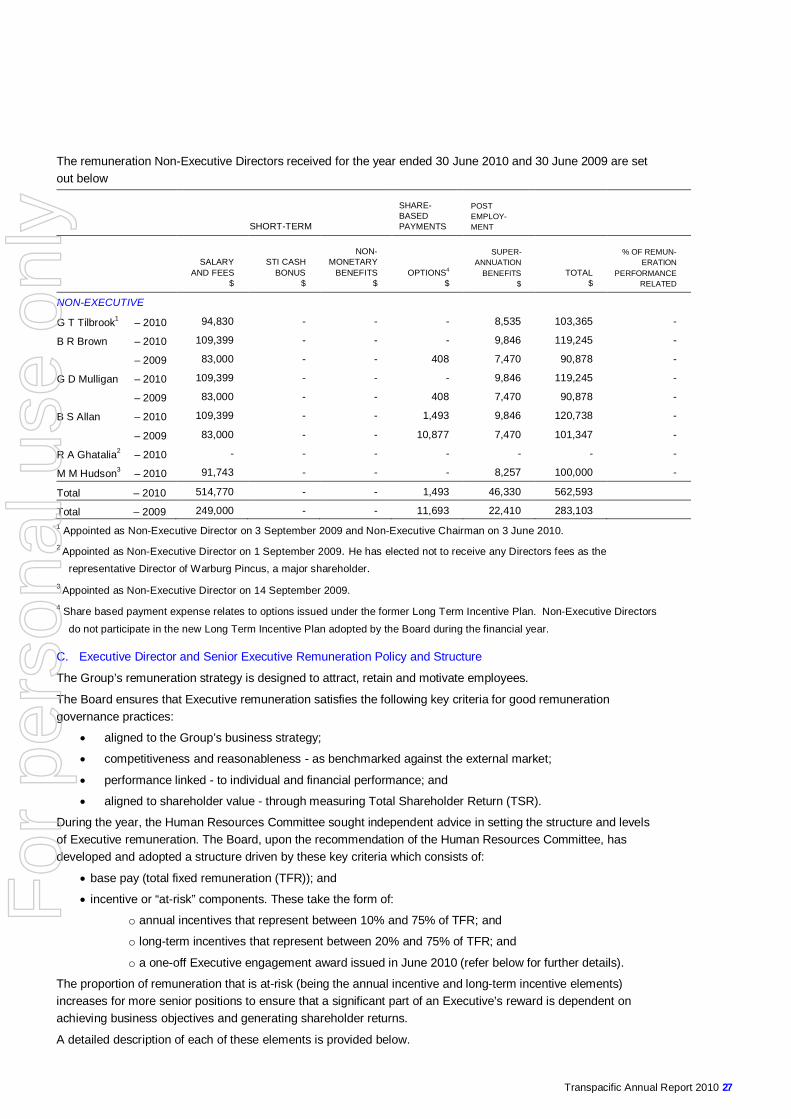
Transpacific Annual Report 2010 27
The remuneration Non-Executive Directors received for the year ended 30 June 2010 and 30 June 2009 are set out below
SHORT-TERM
SHARE-BASED PAYMENTS
POST EMPLOY-MENT
SALARY AND FEES
$
STI CASH BONUS
$
NON-MONETARY
BENEFITS $
OPTIONS4 $
SUPER-ANNUATION
BENEFITS $
TOTAL $
% OF REMUN-ERATION
PERFORMANCE RELATED
NON-EXECUTIVE
G T Tilbrook1 – 2010 94,830 - - - 8,535 103,365 -
B R Brown – 2010 109,399 - - - 9,846 119,245 -
– 2009 83,000 - - 408 7,470 90,878 -
G D Mulligan – 2010 109,399 - - - 9,846 119,245 -
– 2009 83,000 - - 408 7,470 90,878 -
B S Allan – 2010 109,399 - - 1,493 9,846 120,738 -
– 2009 83,000 - - 10,877 7,470 101,347 -
R A Ghatalia2 – 2010 - - - - - - -
M M Hudson3 – 2010 91,743 - - - 8,257 100,000 -
Total – 2010 514,770 - - 1,493 46,330 562,593
Total – 2009 249,000 - - 11,693 22,410 283,103 1 Appointed as Non-Executive Director on 3 September 2009 and Non-Executive Chairman on 3 June 2010. 2 Appointed as Non-Executive Director on 1 September 2009. He has elected not to receive any Directors fees as the
representative Director of Warburg Pincus, a major shareholder. 3 Appointed as Non-Executive Director on 14 September 2009. 4 Share based payment expense relates to options issued under the former Long Term Incentive Plan. Non-Executive Directors
do not participate in the new Long Term Incentive Plan adopted by the Board during the financial year.
C. Executive Director and Senior Executive Remuneration Policy and Structure
The Group’s remuneration strategy is designed to attract, retain and motivate employees.
The Board ensures that Executive remuneration satisfies the following key criteria for good remuneration governance practices:
• aligned to the Group’s business strategy;
• competitiveness and reasonableness - as benchmarked against the external market;
• performance linked - to individual and financial performance; and
• aligned to shareholder value - through measuring Total Shareholder Return (TSR).
During the year, the Human Resources Committee sought independent advice in setting the structure and levels of Executive remuneration. The Board, upon the recommendation of the Human Resources Committee, has developed and adopted a structure driven by these key criteria which consists of:
• base pay (total fixed remuneration (TFR)); and
• incentive or “at-risk” components. These take the form of:
o annual incentives that represent between 10% and 75% of TFR; and
o long-term incentives that represent between 20% and 75% of TFR; and
o a one-off Executive engagement award issued in June 2010 (refer below for further details).
The proportion of remuneration that is at-risk (being the annual incentive and long-term incentive elements) increases for more senior positions to ensure that a significant part of an Executive’s reward is dependent on achieving business objectives and generating shareholder returns.
A detailed description of each of these elements is provided below.
For
per
sona
l use
onl
y

28
Directors’ Report (continued)
Total Fixed Remuneration (TFR)
Executives are offered a competitive base salary as part of TFR, which also includes statutory superannuation contributions, and other packaged allowances. The amount of TFR for each Executive Director and Senior Executive is approved annually by the Board, based on the recommendation of the Human Resources Committee, with consideration given to business and individual performance as well as market relativity. There are no guaranteed base pay increases included in any Senior Executive contracts. For the 2010 financial year, there were no salary increases for Executives, with the exception of two Senior Executives who were promoted to new positions. Annual incentive plan
During the 2010 financial year the Board adopted a revised annual incentive plan, which is being implemented in two stages, as detailed below:
2009/2010: Actual incentive payments for the year ended 30 June 2010 were determined by achievement of clearly defined group Earnings Per Share (EPS) and divisional Earnings Before Interest and Tax (EBIT) financial targets only. The incentive is payable by a mix of cash and Performance Rights which entitle the employee to one share in the Company for each right granted after a period of two years from the grant date and subject to forfeiture if the employee resigns before the end of that period.
2010/2011: For the 2011 financial year, actual incentive payments will be determined as outlined above, but with the inclusion of a predetermined scorecard of individual measures and performance standards.
These performance measures were chosen primarily to align participant reward outcomes with the accomplishment of annual business plans and targets that drive divisional and Group performance.
Executives have the ability to earn up to 200% of their annual incentive where:
• 120% of the relevant financial targets are achieved; and
• the highest level of individual measures and performance standards are met.
Annual incentive payments are determined after the preparation of the financial statements each year (in respect of the financial measures) and after a review of performance against individual measures. Payments of annual incentives are generally made in October each year.
For the 2009 and 2010 financial years, no annual incentive bonuses were payable to Senior Executives as the fixed Group and divisional financial targets were not met. However, the Board has discretion to award bonuses based on circumstances and other criteria. These have not yet been considered for the 2010 financial year.
Long-Term Incentive Plan
A new Long-Term Incentive Plan (LTIP) was adopted by the Board during the 2010 financial year.
The LTIP was designed to reward Executives for delivering long-term shareholder return. It is intended that the plan be put to the 2010 annual general meeting for shareholder approval.
Under the LTIP, participants are issued performance rights which will entitle them to one ordinary share in the Group for each right granted at the end of a three year period if certain performance standards are met. Offers are made annually at the discretion of the Board.
The LTIP performance standards are measured as follows:
• The Company achieving a total shareholder return (TSR) ranking of equal to or greater than the 50th percentile of the TSR of the S&P/ASX 200 Industrial Sector Index (excluding companies involved in resources or mining); and
• If the TSR ranking is achieved and the Group achieves certain earnings per share (EPS) growth targets, the following percentages of performance rights vest:
o50% vesting on achievement of 15% annualised EPS growth;
o75% on achievement of 20% annualised EPS growth; and
o100% vest on achievement of 25% annualised EPS growth.
For
per
sona
l use
onl
y

Transpacific Annual Report 2010 29
Relative TSR performance provides an objective measure for rewarding Executives based on the extent to which shareholder returns are generated, relative to the performance of companies of a similar size. EPS is also used as it aligns directly with the increasing value of the business.
2,613,063 performance rights were granted under the LTIP on 1 June 2010, which vest upon release of results for the year ending 30 June 2012, subject to achievement of the performance standards outlined above. Fifty per cent of the ordinary shares allocated upon vesting of performance rights will be restricted shares, meaning that where the participant does not hold shares in the Company to the value of at least 12 months TFR at the vesting date, they will not be allowed to sell these restricted shares until they hold 12 months TFR in the Company’s shares. The Board has the right to waive any such restriction.
Where a participant ceases employment prior to the vesting of their award, the performance rights are forfeited unless the Board applies its discretion in appropriate circumstances.
The Board has discretion to determine the extent of vesting in the event of a change of control.
There were no options issued under the former long-term incentive plan of the Group (Transpacific Executive Share Option plan) during the 2010 financial year, however options remain on issue from prior years. Options granted under this scheme vest in equal tranches over two or three years. Seventy five per cent of the options vest if TSR totals at least 15% per annum on a cumulative basis and 25% vest if the volume weighted average price of the Company’s shares has outperformed the S&P/ASX 200 (less financials) by 5% on a cumulative basis since the date of issue of options. The options granted under this plan to date were issued for no consideration. No options have vested during the period as the performance criteria were not satisfied.
Executive Engagement Award
On 1 June 2010, the Board issued 9,945,265 performance rights to certain Executives under a one-off Executive Engagement Award (EEA).
The purpose of this Award was to:
• provide one-off incentives to retain certain eligible Executives and senior managers;
• foster a responsible balance between short-term and long-term corporate results and long term shareholder value creation; and
• build and maintain a strong spirit of performance and entrepreneurship.
The vesting of the performance rights issued under this Award is conditional upon the participant being employed at vesting date (30 June 2015), and will vest at various percentages based on the Company’s ordinary share price at that date as follows:
20 day VWAP
PERCENTAGE OF PERFORMANCE RIGHTS
VESTING
Less than $3.00 0%
$3.00 50%
$4.50 100%
$6.00 200%
$9.00 or more 300%
The award is subject to the same employment and change of control clauses as the LTIP.
For
per
sona
l use
onl
y

30
Directors’ Report (continued)
Securities Trading Policy
The Company prohibits Executives from entering into any hedging arrangements or acquiring financial products (such as equity swaps, caps and collars or other hedging products) over unvested options or performance rights which have the effect of reducing or limiting exposure to risks associated with the market value of the Company’s securities.
No Directors or Senior Executives may directly or indirectly enter into any margin loan facility against the Company’s securities unless the prior written consent of the Chairperson of the Board is obtained.
The Group’s Performance
The following table summarises the Group’s performance over the five year period from 1 July 2005 to 30 June 2010:
2006 2007 2008 2009 2010
EPS 23.6c 41.1c 61.8c (77.9)c 6.7c1
Dividends per share 9.3c 11.7c 18.1c - -
Share price at 30 June 2010 $6.63 $13.36 $6.00 $1.80 $1.00 1 In August 2009, the Company completed a recapitalisation, issuing 649,657,609 fully paid ordinary shares.
Based on the Group’s performance, no annual incentives were paid to Senior Executives in respect of the 2009 and 2010 financial years. No options issued under the former long-term incentive plan vested during the 2010 financial year.
D. Key Executive Contract Terms
The remuneration and other terms of employment for Executive Directors and Senior Executives are covered in formal employment contracts. A summary of the key terms of employment contracts for nominated Executives is outlined below.
TFR consists of cash salary, statutory superannuation contributions and packaged benefits such as motor vehicle allowances. There is no fixed term for key Executive contracts. Participation in the annual incentive plan and LTIP is at the Board’s discretion.
Performance appraisals are undertaken annually.
The Company may terminate service agreements immediately for cause, in which case the Executive is not entitled to any payment in lieu of notice or compensation.
For
per
sona
l use
onl
y

Transpacific Annual Report 2010 31
A summary of the key contract terms are below
RESIGNATION TERMINATION BY TPI
(WITHOUT CAUSE) REDUNDANCY
T E Peabody 6 months’ notice 6 months’ notice Two weeks for every year
of service
T J Coonan,
H W Grundell,
N M Badyk,
A G Roderick
12 months’ notice 12 months’ notice Payment equal to 12
months’ TFR
P A Glavac,
S T Barnard,
K L Smith
6 months’ notice 6 months’ notice
6 months’ notice plus a severance payment of 2 weeks for every year of
service. Payment capped at 12 months’ TFR.
T Nickels
3 months’ notice 1 months’ notice
6 months’ notice plus a severance payment of 4
weeks for the first year of service and 2 weeks for
every year of service thereafter, capped at 26
weeks.
E. Remuneration of Executive Directors and Key Management Personnel
Details of the remuneration of the Executive Directors and the key management personnel (as defined in AASB 124 Related Party Disclosures) of the Company and Group are set out in the following tables. These tables reflect the base fixed components and the “at-risk” performance-related components discussed above. The options and performance rights have been costed in accordance with methodology set out in F below.
A listing of all employees who were KMP during the 2010 and 2009 years is set out below
NAME TITLE WHILST KMP PERIOD KMP (IF LESS THAN
FULL YEAR)
T E Peabody Executive Chairman T J Coonan Executive Director and Chief Executive Officer
H W Grundell Executive General Manager, Commercial Vehicles and Manufacturing
N M Badyk Chief Operating Officer, Transpacific Cleanaway A G Roderick Chief Operating Officer, Transpacific Industrials S T Barnard General Manager, Corporate Services P A Glavac Managing Director, Commercial Vehicles
T Nickels Managing Director, New Zealand From 1 July 2009 K L Smith Company Secretary From 1 July 2009 G R W Battershill Chief Financial Officer Until 5 March 2010
G S Campbell Managing Director, Solid Waste Australia and New Zealand Until 13 November 2009
B D Stam General Manager, Corporate Services Until 13 November 2008 T A A Woods Managing Director, Mergers and Acquisitions Until 30 June 2009
For
per
sona
l use
onl
y

32
Directors’ Report (continued)
REMUNERATION OF THE KEY MANAGEMENT PERSONNEL OF THE GROUP
SHORT-TERM
SHARE-BASED PAYMENTS
POST EMPLOY-MENT
SALARY AND FEES
$
STI CASH
BONUS $
NON-MONETARY
BENEFITS $
OPTIONS AND
RIGHTS $
SUPER-ANNUATION
BENEFITS $
TERM-INATION
PAY $
TOTAL $
% OF REMUN-ERATION
PERFORMANCE RELATED 8
EXECUTIVE DIRECTOR
T J Coonan – 2010 874,017 - 4,136 94,595 76,502 - 1,049,250 -
– 2009 874,017 - 106,511 234,767 76,502 - 1,291,797 -
FORMER EXECUTIVE DIRECTORS
T E Peabody1 700,014 – 2010 - 8,340 - 63,001 1,222,184 1,993,539 -
– 2009 750,014 - 15,851 - 67,501 - 833,366 -
H W Grundell2 599,012 – 2009 - 26,1217 67,757 51,751 - 744,641 -
KEY MANAGEMENT PERSONNEL
H W Grundell – 2010 599,011 - 2,652 43,027 51,751 - 696,441 -
N M Badyk – 2010 479,341 - 98 22,002 40,981 - 542,422 -
– 2009 399,000 - 10,0377 67,757 33,750 - 510,544 -
A G Roderick – 2010 482,342 - 647 33,309 41,251 - 557,549 -
– 2009 399,008 - 588 126,777 33,751 - 560,124 -
S T Barnard – 2010 303,011 - 2,240 32,944 25,200 - 363,395 -
– 2009 285,877 - 20,691 63,836 23,929 - 394,333 -
P A Glavac – 2010 399,007 - 2,130 15,730 33,751 - 450,618 -
– 2009 399,008 - 11,2937 67,757 33,751 - 511,809 -
T Nickels – 2010 329,376 - 31,138 11,430 6,588 - 378,532 -
K L Smith – 2010 245,004 - 5,157 10,468 20,250 - 280,879 -
FORMER KEY MANAGEMENT PERSONNEL
G R W Battershill3 231,486 - 2010 - - - 19,544 29,422 280,452 -
– 2009 323,006 - 5,810 117,329 27,270 - 473,415 -
G S Campbell 4 165,879 – 2010 - 488 - 12,578 343,625 522,570 -
– 2009 603,344 - 5,810 257,106 51,751 - 918,011 -
B D Stam5 - – 2010 - - - - - - -
– 2009 148,234 - 12,752 13,030 10,432 - 184,448 -
T A A Woods6 - – 2010 - - - - - - -
– 2009 339,006 22,935 29,9927 67,757 28,351 - 488,041 -
Total – 2010 4,808,488 - 57,026 263,505 391,397 1,595,231 7,115,647
Total – 2009 5,119,526 22,935 245,456 1,083,873 438,739 - 6,910,529
1 T E Peabody ceased employment on 30 June 2010. Pursuant to his contract of employment dated 19 March 2005, Mr Peabody received a redundancy payment of $724,950, a payment in lieu of accrued long service leave of $359,172 and a payment in lieu of accrued annual leave of $138,082. Mr Peabody’s redundancy payment was less that the average of his annual base salary over the previous three years. 2 H W Grundell resigned as an Executive Director on 3 September 2009, but continued as key management personnel. 3 G R W Battershill resigned as Chief Financial Officer on 5 March 2010. Termination post-employment benefits consist of leave accrual payments. 4 G S Campbell resigned as Managing Director, Solid Waste Australia and New Zealand on 13 November 2009. Termination post-employment benefits consist of 26 weeks’ severance pay in accordance with his contract, and leave accrual payments. 5 B D Stam resigned as General Manager Corporate Services on 13 November 2008. 6 T A A Woods was not a KMP for the 2010 financial year, therefore 2009 remuneration details are shown for comparative purposes only. The STI cash bonus shown for 2009 was in respect of the 2008 financial year. 7 Non-monetary benefits in 2009 include a remuneration benefit paid in relation to loans provided during the year as detailed in Note 35 of the financial statements. No loans were provided during 2010. 8 There was no remuneration paid or payable relating to current year performance.
For
per
sona
l use
onl
y

Transpacific Annual Report 2010 33
F. Share Based Remuneration
Details of the aggregate LTIP and EEA share opportunities in the Company that were granted as compensation to each key management personnel during the reporting period and details on share opportunities that were vested during the reporting period are as follows
NUMBER OF SHARE OPPORTUNITIES GRANTED
DURING THE YEAR
NUMBER OF SHARE OPPORTUNITIES VESTED DURING
THE YEAR
NUMBER OF SHARE OPPORTUNITIES
LAPSED/CANCELLED DURING THE YEAR
20101 20092 2010 2009 2010 2009
DIRECTORS
T J Coonan 1,324,080 - - 216,665 200,000 -
B S Allan - - - 16,666 - -
G D Mulligan - - - 16,666 - -
B R Brown - - - 16,666 - -
KEY MANAGEMENT PERSONNEL
H W Grundell 785,109 - - 166,667 - -
N M Badyk 653,604 - - 166,667 100,000 -
A G Roderick 653,604 - - 133,333 - -
S T Barnard 301,740 - - - - -
P A Glavac 401,532 - - 166,668 100,000 -
T Nickels 456,455 - - - - -
K L Smith 246,155 - - 50,000 - -
FORMER KEY MANAGEMENT PERSONNEL
G R W Battershill - 200,000 - - 200,000 -
G S Campbell - - - 133,333 650,000 -
1 Share opportunities granted during 2010 financial year are performance rights under the LTIP and EEA incentive schemes. 2 Share opportunities granted during 2009 year are share options issued under the former long-term incentive plan
The assessed fair value at grant date of share opportunities granted to individuals is allocated equally over the period from grant date to vesting date, and the amount is included in the remuneration tables above. Details of the vesting conditions are set out earlier in the report.
Subsequent to year end, performance rights have been issued to KMP.
No terms of equity-settled share-based payment transactions have been altered or modified by issuing entity during the reporting period.
For
per
sona
l use
onl
y

34
Directors’ Report (continued)
Details of ordinary shares in the Company provided as a result of the exercise of remuneration share opportunities to each Director and key management personnel are set out below
2010 2009
AMOUNT PAID PER SHARE
NUMBER OF SHARES
AMOUNT PAID PER SHARE
NUMBER OF SHARES
EXECUTIVE DIRECTORS
T J Coonan - - $2.40 183,335
NON-EXECUTIVE DIRECTORS
B R Brown - - $2.40 50,000
G D Mulligan - - $2.40 50,000
KEY MANAGEMENT PERSONNEL
H W Grundell - - $2.40 166,667
P A Glavac - - $2.40 166,666
N M Badyk - - $2.40 166,667
FORMER KEY MANAGEMENT PERSONNEL
T A A Woods - - $2.40 166,667
No amounts are unpaid on any shares issued on the exercise of share opportunities.
Details of the vesting profile of the options and performance rights granted as remuneration to each Director of the Company and each of the key management personnel of the Group are set out below. No options or performance rights will vest if performance conditions detailed earlier are not satisfied, hence the minimum value of the option or performance rights to vest is nil. The maximum value of those yet to vest has been determined as the fair value amount of the options and performance rights at grant date that is yet to be expensed.
VALUE OF SHARE
OPPORTUNITIES AS PROPORTION
OF REMUN-ERATION
FINANCIAL YEAR
GRANTED NUMBER
% VESTED
AT 30 JUNE 2010
% LAPSED / CANCELLED
IN 2010
FINANCIAL YEARS IN
WHICH SHARE
OPPOR-TUNITIES
VEST
MINIMUM TOTAL
VALUE YET TO VEST
$
MAXIMUM TOTAL
VALUE YET TO VEST
$
OPTIONS ISSUED UNDER FORMER LONG-TERM INCENTIVE PLAN
EXECUTIVE DIRECTORS
T J Coonan 2007 200,000 - 100% B - -
2008 200,000 - - C - 6,414
2008 100,000 67% - A - -
NON-EXECUTIVE DIRECTORS
B S Allan 2007 50,000 33% - A - -
KEY MANAGEMENT PERSONNEL
H W Grundell 2007 100,000 - - B - 1,603
N M Badyk 2007 100,000 - 100% B - -
A G Roderick 2006 150,000 33% - A - -
2006 150,000 33% - A - -
2007 100,000 - - B - -
2007 100,000 - - C - -
S T Barnard 2008 30,000 33% - A - -
2008 20,000 - - B - -
2008 100,000 - - C - 3,207
For
per
sona
l use
onl
y

Transpacific Annual Report 2010 35
VALUE OF SHARE
OPPORTUNITIES AS PROPORTION
OF REMUN-ERATION
FINANCIAL YEAR
GRANTED NUMBER
% VESTED
AT 30 JUNE 2010
% LAPSED / CANCELLED
IN 2010
FINANCIAL YEARS IN
WHICH SHARE
OPPOR-TUNITIES
VEST
MINIMUM TOTAL
VALUE YET TO VEST
$
MAXIMUM TOTAL
VALUE YET TO VEST
$
KEY MANAGEMENT PERSONNEL
P A Glavac 2007 100,000 - 100% B - -
T Nickels 2008 150,000 - - D - -
2009 50,000 - - D - -
K L Smith 2008 75,000 - - D - -
FORMER KEY MANAGEMENT PERSONNEL
G S Campbell 2006 150,000 33% 67% A - -
2007 100,000 - 100% B - -
2007 100,000 - 100% C - -
2008 100,000 - 100% B - -
2008 150,000 - 100% C - -
G R W Battershill 2009 200,000 - 100% D - -
T A A Woods 2007 100,000 - - C - -
PERFORMANCE RIGHTS ISSUED UNDER LONG-TERM INCENTIVE PLAN
EXECUTIVE DIRECTORS
T J Coonan 59% 2010 531,996 - - E - 473,476
2010 792,083 - - F - 1,061,391
KEY MANAGEMENT PERSONNEL
H W Grundell 58% 2010 242,817 - - E - 216,107
2010 542,292 - - F - 726,671
N M Badyk 59% 2010 202,146 - - E - 179,910
2010 451,458 - - F - 604,954
A G Roderick 58% 2010 202,146 - - E - 179,910
2010 451,458 - - F - 604,954
S T Barnard 50% 2010 84,940 - - E - 75,597
2010 216,800 - - F - 290,512
P A Glavac 52% 2010 113,032 - - E - 100,598
2010 288,500 - - F - 386,590
T Nickels 61% 2010 123,121 - - E - 109,578
2010 355,000 - - F - 475,700
K L Smith 52% 2010 69,282 - - E - 61,661
2010 176,833 - - F - 236,956
A – Options vest in equal tranches over three years commencing financial year beginning 1 July 2007.
B – Options vest in equal tranches over two years commencing financial year beginning 1 July 2009.
C – Options vest in equal tranches over three years commencing financial year beginning 1 July 2008.
D – Options vest in equal tranches over three years commencing financial year beginning 1 July 2009.
E – Performance rights under LTIP vest 14 days after the date on which the financial results for the year ending 30 June 2012 are released to the ASX.
F – Performance rights vest under the EEA on 30 June 2015.
END OF REMUNERATION REPORT
For
per
sona
l use
onl
y

36
Directors’ Report (continued)
Shares under Option
In the financial year ended 30 June 2010 and up to the date of this report, no options were granted over unissued shares. The Company has adopted a new LTIP and no longer intends to use options as part of its remuneration strategy.
At the date of this report unissued ordinary shares of the Company under option are
DATE OPTIONS GRANTED EXPIRY DATE EXERCISE PRICE
NUMBER UNDER
OPTION
OPTIONS 12 March 2007 31 July 2011 $9.98 420,000 3 May 2007 31 July 2011 $12.51 50,000 16 May 2007 31 July 2011 $13.06 610,000
22 October 2007 31 July 2011 $11.15 145,000 11 February 2008 31 July 2011 $7.96 856,500 6 November 2008 31 July 2012 $3.55 485,000
2,566,500 These options do not entitle the holder to participate in any share issue of the Company or any other entity.
Details of performance rights granted under the revised LTIP in the 2010 financial year are set out in a previous section of the Remuneration Report.
Shares Issued on the Exercise of Options
During or since the end of the financial year to the date of this report, the Company did not issue any ordinary shares as a result of the exercise of options.
Directors’ and Officers’ Insurance
During the financial year, the Company paid insurance premiums to insure the Directors and officers of the Company.
The liabilities insured are legal costs that may be incurred in defending civil or criminal proceedings that may be brought against the officers in their capacity as officers of Entities in the Group, and any other payments arising from liabilities incurred by the officers in connection with such proceedings. This does not include such liabilities that arise from conduct involving a wilful breach of duty by the officers or the improper use by the officers of their position or of information to gain advantage for themselves or someone else or to cause detriment to the Company. It is not possible to apportion the premium between amounts relating to the insurance against legal costs and those relating to other liabilities. Disclosure of the premium paid is not permitted under the terms of the insurance contract.
Non-audit Services
The Company may decide to employ the auditor on assignments additional to their statutory audit duties where the auditor’s expertise and experience with the Company and/or the Group are important. During financial years 2010 and 2009 non-audit services included taxation compliance services and advice and due diligence services.
The Board of Directors has considered the position and is satisfied that the provision of the non-audit services is compatible with, and did not compromise, the auditor independence requirements of the Corporations Act 2001 for the following reasons:
• all non-audit services were subject to the corporate governance procedures adopted by the Company to ensure they do not impact the integrity and objectivity of the auditor; and
• the non-audit services provided do not undermine the general principles relating to auditor independence as set out in APES 110 Code of Ethics for Professional Accountants, as they did not involve reviewing or auditing the auditor’s own work, acting in a management or decision-making capacity for the Company, acting as an advocate for the Company or jointly sharing risks and rewards.
For
per
sona
l use
onl
y

Transpacific Annual Report 2010 37
Details of the amounts paid or payable to the auditor, and its related practices for audit and non-audit services’ is set out below.
CONSOLIDATED
2010 2009
1. Audit services:
Ernst & Young1 1,086,000 - Bentleys Brisbane Partnership1 97,875 891,407
Overseas auditor’s associated with Bentleys Brisbane Partnership - 225,000
Total audit services 1,183,875 1,116,407 2. Non-audit services: Due diligence services:
Ernst & Young 612,335 -
Bentleys Brisbane Partnership and Bentleys (Qld) Pty Ltd - 23,379
Other: Bentleys Brisbane Partnership and Bentleys (Qld) Pty Ltd 5,363 40,465
617,698 63,844 Taxation services: Ernst & Young 13,200 - Bentleys (Qld) Pty Ltd 25,680 251,498
Overseas auditor’s associated with Bentleys 10,800 8,921
49,680 260,419 Total non-audit services 667,378 324,263
1 Ernst & Young were appointed auditor’s at the annual general meeting of shareholders held on 4 November 2009, replacing Bentleys Brisbane Partnership.
A copy of the auditor’s independence declaration as required under section 307C of the Corporations Act 2001 is set out on page 38.
Rounding of Amounts
The Company is of a kind referred to in ASIC Class Order 98/100 issued by the Australian Securities and Investment Commission, relating to the “rounding off” of amounts in the Directors’ Report. Amounts in the Directors’ Report have been rounded off in accordance with that Class Order to the nearest thousand dollars or, in certain cases, to the nearest dollar.
This report is made in accordance with a resolution of the Directors.
G T Tilbrook
Chairman
Brisbane, 23 September 2010
For
per
sona
l use
onl
y

38
Auditor’s Independence Declaration’
For
per
sona
l use
onl
y
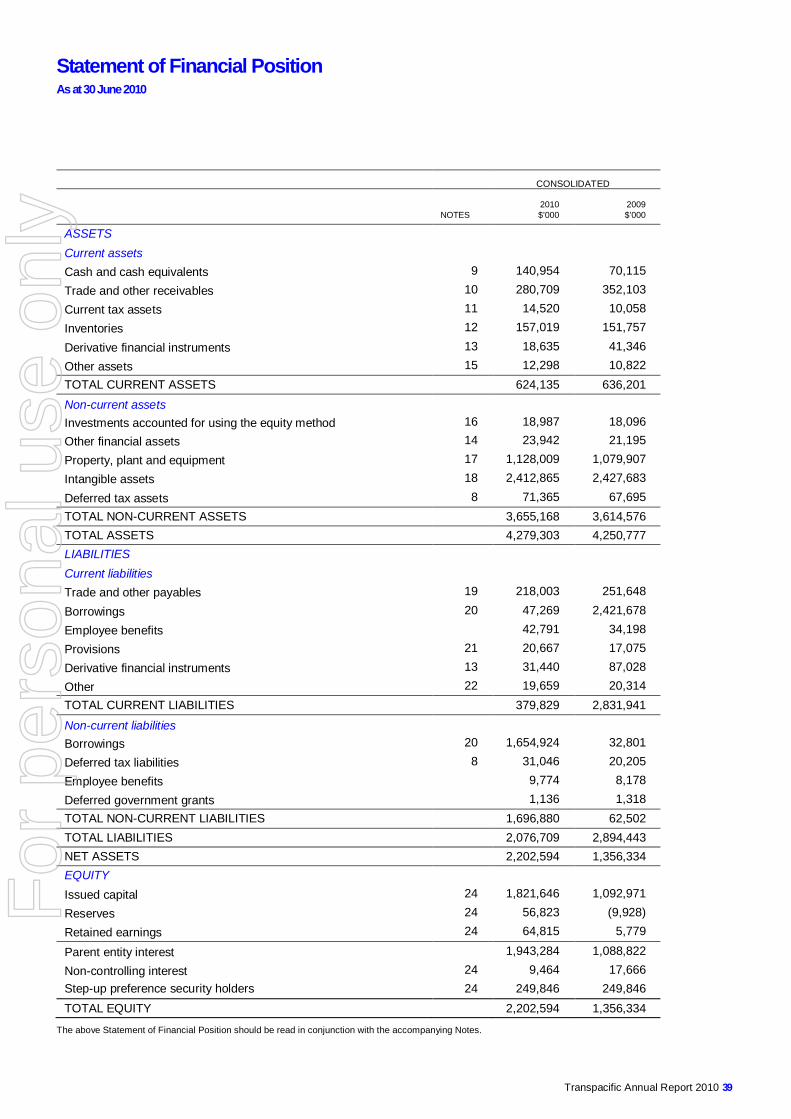
Transpacific Annual Report 2010 39
Statement of Financial Position As at 30 June 2010
CONSOLIDATED
NOTES 2010 $’000
2009 $’000
ASSETS Current assets Cash and cash equivalents 9 140,954 70,115 Trade and other receivables 10 280,709 352,103 Current tax assets 11 14,520 10,058 Inventories 12 157,019 151,757
Derivative financial instruments 13 18,635 41,346 Other assets 15 12,298 10,822 TOTAL CURRENT ASSETS 624,135 636,201 Non-current assets Investments accounted for using the equity method 16 18,987 18,096 Other financial assets 14 23,942 21,195 Property, plant and equipment 17 1,128,009 1,079,907 Intangible assets 18 2,412,865 2,427,683
Deferred tax assets 8 71,365 67,695 TOTAL NON-CURRENT ASSETS 3,655,168 3,614,576 TOTAL ASSETS 4,279,303 4,250,777 LIABILITIES Current liabilities Trade and other payables 19 218,003 251,648
Borrowings 20 47,269 2,421,678 Employee benefits 42,791 34,198 Provisions 21 20,667 17,075 Derivative financial instruments 13 31,440 87,028 Other 22 19,659 20,314 TOTAL CURRENT LIABILITIES 379,829 2,831,941
Non-current liabilities Borrowings 20 1,654,924 32,801 Deferred tax liabilities 8 31,046 20,205 Employee benefits 9,774 8,178 Deferred government grants 1,136 1,318 TOTAL NON-CURRENT LIABILITIES 1,696,880 62,502 TOTAL LIABILITIES 2,076,709 2,894,443 NET ASSETS 2,202,594 1,356,334 EQUITY Issued capital 24 1,821,646 1,092,971 Reserves 24 56,823 (9,928) Retained earnings 24 64,815 5,779
Parent entity interest 1,943,284 1,088,822 Non-controlling interest 24 9,464 17,666 Step-up preference security holders 24 249,846 249,846 TOTAL EQUITY 2,202,594 1,356,334
The above Statement of Financial Position should be read in conjunction with the accompanying Notes.
For
per
sona
l use
onl
y

40
Statement of Comprehensive Income For the Financial Year Ended 30 June 2010
CONSOLIDATED
NOTES
2010 $’000
2009 $’000
CONTINUING OPERATIONS Revenue 4 2,073,996 2,202,243 Cost of sales (726,684) (851,070)
Gross profit 1,347,312 1,351,173 Other income 5 2,474 12,977 Employee expenses (567,221) (570,270) Depreciation and amortisation expenses (168,571) (143,827)
Finance costs 6 (175,957) (225,299) Repairs and maintenance (98,796) (90,740) Fuel purchases (63,881) (68,746) Leasing charges (53,685) (51,356) Freight costs (25,602) (24,000) Other expenses (117,105) (147,638)
Results from operating activities 78,968 42,274
Share of net profits of associates accounted for using the equity method 26C 1,373 2,516
Impairment of available-for-sale financial assets 7 - (52,505)
Impairment of intangible assets 7 - (153,682)
Change in fair value of derivative financial instruments 7 21,724 (76,378)
Change in fair value of warrants 7 (10,029) -
Profit/(loss) before income tax 92,036 (237,775)
Income tax benefit/(expense) 8 (19,300) 21,668
Profit/(loss) from continuing operations after income tax 72,736 (216,107)
Attributable to: Ordinary equity holders of the parent 59,036 (237,406) Non-controlling interest 1,575 2,249 Step-up preference security holders 12,125 19,050
Profit/(loss) from continuing operations after income tax 72,736 (216,107)
The above Statement of Comprehensive Income should be read in conjunction with the accompanying Notes.
For
per
sona
l use
onl
y

Transpacific Annual Report 2010 41
CONSOLIDATED
NOTES 2010 $’000
2009 $’000
Profit/(loss) for the period 72,736 (216,107)
Other comprehensive income
Cash flow hedges Net gain/(loss) taken to equity (net of tax) 24 1,126 (207)
Translation of foreign operations Exchange differences taken to equity 24 1,692 11,314 Revaluation of assets Revaluation of available-for-sale assets 24 2,747 3,704
Net income recognised directly in equity 5,565 14,811
Total comprehensive income/(loss) for the period 78,301 (201,296)
Attributable to:
Ordinary equity holders of the parent 64,601 (222,595)
Non-controlling interest 1,575 2,249
Step-up preference security holders 12,125 19,050
Total comprehensive income/(loss) for the period 78,301 (201,296)
Earnings per share for profit attributable to the ordinary equity holders of the Company:
Basic earnings per share 34 6.7 (77.9)
Diluted earnings per share 34 6.6 (77.9)
The above Statement of Comprehensive Income should be read in conjunction with the accompanying Notes.
For
per
sona
l use
onl
y

42
Statement of Changes in Equity For the Year Ended 30 June 2010
ORDINARY SHARES
CONVERTIBLE NOTE
ASSET REVALUATION
RESERVE
WARRANT RESERVE
EMPLOYEE EQUITY
BENEFITS RESERVE
CASH FLOW HEDGE
RESERVE
FOREIGN CURRENCY
TRANSLATION RESERVE
RETAINED EARNINGS
OWNERS OF THE PARENT
NON – CONTROLLING
INTEREST
STEP-UP PREFERENCE SECURITIES
TOTAL
$’000 $’000 $’000 $’000 $’000 $’000 $’000 $’000 $’000 $’000 $’000 $’000
At 30 June 2009 1,041,383 51,588 36,752 - 590 (2,120) (45,150) 5,779 1,088,822 17,666 249,846 1,356,334
Profit for period 59,036 59,036 1,575 12,125 72,736
Other comprehensive income 2,747 1,126 1,692 5,565 5,565
Total comprehensive income for the year - - 2,747 - - 1,126 1,692 59,036 64,601 1,575 12,125 78,301
Transfer of warrants to equity settlements 60,892 60,892 60,892
Issue of Ordinary Shares 750,217 750,217 750,217
Share-based payment 294 294 294
Distribution to Step-up Preference Securities - (12,125) (12,125)
Dividend paid - (1,156) (1,156)
Reduction in non-controlling interest - (8,621) (8,621)
Transaction costs (21,542) (21,542) (21,542)
Balance at 30 June 2010 1,770,058 51,588 39,499 60,892 884 (994) (43,458) 64,815 1,943,284 9,464 249,846 2,202,594
At 30 June 2008 919,450 51,951 33,048 - 6,371 7,038 (56,464) 272,806 1,234,200 23,545 249,846 1,507,591
Profit/(Loss) for period (237,406) (237,406) 2,249 19,050 (216,107)
Other comprehensive income 3,704 (207) 11,314 14,811 14,811
Total comprehensive income for the year - 3,704 - - (207) 11,314 (237,406) (222,595) 2,249 19,050 (201,296)
Transfer to issued capital 8,400 (8,400) - -
Exercise of executive share options 13,803 13,803 13,803
Exercise of share options 13,529 13,529 13,529
Part settlement of business combinations 30,802 30,802 30,802
Dividend Reinvestment Plan and Underwrite 49,440 49,440 49,440
Part settlement of convertible notes 6,601 ,601 6,601
Transaction costs (642) (642) (642)
Buy back equity component of convertible note (363) (363) (363)
Share-based payment 2,619 2,619 2,619
Transfer to net profit (8,951) (8,951) (8,951)
Dividend Paid (29,621) (29,621) (29,621)
Distribution to Step-up Preference Securities - (19,050) (19,050)
Reduction in non-controlling interest - (8,128) (8,128)
Balance at 30 June 2009 1,041,383 51,588 36,752 - 590 (2,120) (45,150) 5,779 1,088,822 17,666 249,846 1,356,334
For
per
sona
l use
onl
y

Transpacific Annual Report 2010 43
Statement of Cash Flows For the Year Ended 30 June 2010
CONSOLIDATED
NOTES 2010 $’000
2009 $’000
CASH FLOWS FROM OPERATING ACTIVITIES Receipts from customers (incl. of GST) 2,317,993 2,421,979
Payments to suppliers/employees (incl. of GST) (1,859,138) (2,015,011)
Other revenue 8,391 15,378 Interest received 2,576 3,212 Interest paid (158,227) (189,016)
Income taxes paid (21,757) (34,911)
NET CASH FROM/(USED IN) OPERATING ACTIVITIES 27 289,838 201,631
CASH FLOWS FROM INVESTING ACTIVITIES Payments for purchase of equity and other investments - (97)
Payments for purchase of businesses (6,901) (55,868)
Payments for property, plant and equipment (134,416) (162,480) Proceeds from sale of business 2,000 2,014
Proceeds from disposal of property, plant and equipment 11,883 4,198
NET CASH (USED IN) INVESTING ACTIVITIES (127,434) (212,233)
CASH FLOWS FROM FINANCING ACTIVITIES Proceeds from issue of equity 801,080 69,901
Payment of dividend to minority shareholders (1,156) (1,691) Dividend received from associates 2,345 1,420 Payment of step-up securities distribution (12,125) (19,050) Ordinary equity dividends paid - (29,621) Dividend reinvestment plan and underwrite - 6,871 Net movement in trade and vendor finance (65,830) 43,016
Payment of equity raising costs (23,272) (642) Payment of debt raising costs (25,440) (7,357) Repayment of bank loans (711,562) (76,950) Buy back of convertibles notes - (18,325) Proceeds from bank loans 2,371 78,458 Repayment of lease liabilities (27,439) (23,017)
Repayment of loans by/(to) related parties (1,874) (780) Repayment of hedges (29,169) - NET CASH (USED IN)/FROM FINANCING ACTIVITIES (92,071) 22,233
NET INCREASE IN CASH HELD 70,333 11,631 Cash at the beginning of the financial year 70,115 58,126
Net foreign exchange differences 506 358 CASH AT THE END OF THE FINANCIAL YEAR 9 140,954 70,115
The above Statement of Cash Flows should be read in conjunction with the accompanying Notes.
For
per
sona
l use
onl
y

44
Notes to the Financial Statements For the Financial Year Ended 30 June 2010
1. Reporting Entity Transpacific Industries Group Ltd (the “Company”) is a listed public company, incorporated in Australia and operating in Australia, New Zealand and South East Asia. The consolidated financial statements of the Company as at and for the financial year ended 30 June 2010 comprise the Company and its subsidiaries (together referred to as the “Group”) and the Group’s interest in associates and jointly controlled entities.
2. Basis of Preparation
The financial report is a general purpose financial report which has been prepared in accordance with the Australian Accounting Standards (AAS) (including Australian Interpretations) adopted by the Australian Accounting Standards Board (AASB), the Corporations Act 2001, and complies with other requirements of the law.
The consolidated financial report of the Group complies with International Financial Reporting Standards (IFRSs) and interpretations adopted by the International Accounting Standards Board (IASB).
The financial report was authorised for issue by the Directors on 23 September 2010.
The financial report has been prepared on the basis of historical cost, except for the revaluation of certain non-current assets (non-landfill land and buildings and listed company investments) and financial instruments. Cost is based on the fair values of the consideration given in exchange for assets. All amounts are presented in Australian dollars, unless otherwise noted, which is the Group’s functional currency.
The Company is of a kind referred to in ASIC Class Order 98/100 dated 10 July 1998 and, in accordance with that Class Order amounts in the financial report have been rounded off to the nearest thousand dollars, unless otherwise stated.
The preparation of financial statements in accordance with International Financial Reporting Standards requires management to make judgements, estimates and assumptions that affect the application of accounting policies and reported amounts of assets, liabilities, income and expenses. The estimates and associated assumptions are based on historical experience and various other factors that are believed to be reasonable under the circumstances, the results of which form the basis of making the judgements about carrying values of assets and liabilities that are not readily apparent from other sources. Actual results may differ from these estimates. These accounting policies have been consistently applied by each entity in the Group.
The estimates and underlying assumptions are reviewed on an ongoing basis. Revisions to accounting estimates are recognised in the period in which the estimate is revised and in any future periods affected.
3. Significant Accounting Policies
In the current year, the Group has adopted all of the new and revised Standards and Interpretations issued by the AASB that are relevant to its operations and effective for the current annual reporting period. Details of the impact of the adoption of these new accounting standards are set out in the individual accounting policy notes set out below.
Australian Accounting Standards and Interpretations that have recently been issued or amended but are not yet effective have not been adopted by the Group for the annual reporting period ended 30 June 2010. The impact of these not yet effective Standards and Interpretations has not yet been determined by management.
For
per
sona
l use
onl
y

Transpacific Annual Report 2010 45
3. Significant Accounting Policies (continued)
The following significant accounting policies have been adopted in the preparation and presentation of the financial report.
(A) BASIS OF CONSOLIDATION
(i) Subsidiaries The consolidated financial statements incorporate the assets and liabilities of all subsidiaries of Transpacific Industries Group Ltd (“Company” or “parent entity”) as at 30 June 2010 and the results of all subsidiaries for the year then ended. Transpacific Industries Group Ltd and its subsidiaries together are referred to in this financial report as the Group.
Subsidiaries are all those entities over which the Group has the power to govern the financial and operating policies, so as to obtain the benefits from their activities. In assessing control, potential voting rights that are presently exercisable or convertible are taken into account. Subsidiaries are fully consolidated from the date on which control is transferred to the Group. They are deconsolidated from the date that control ceases. The financial statements of the subsidiaries are prepared for the same reporting period as the parent company, using consistent accounting policies.
Intercompany transactions, balances, income and expenses and profit and losses resulting from intragroup transactions have been eliminated in full.
The acquisition of subsidiaries is accounted for using the acquisition method of accounting. The acquisition method of accounting involves recognising at acquisition date, separately from goodwill, the identifiable assets acquired, the liabilities assumed and any non-controlling interest in the acquiree. The identifiable assets acquired and the liabilities assumed are measured at their acquisition date fair values. The difference between these items and the fair value of the consideration is goodwill or a discount on acquisition.
A change in the ownership interest of a subsidiary that does not result in a loss of control is accounted for as an equity transaction.
Non-controlling interests (formerly known as minority interests) are allocated their share of net profit after tax in the statement of comprehensive income and are presented within equity in the consolidated statement of financial position separately from the equity of the owners of the parent. Losses are attributed to the non-controlling interest even if that results in a deficit balance.
If the Group loses control over a subsidiary it:
- derecognises the assets (including goodwill) and liabilities of the subsidiary;
- derecognises the carrying amount of any non-controlling interest;
- derecognises the cumulative translation differences, recorded in equity;
- recognises the fair value of the consideration received;
- recognises the fair value of any investment retained;
- recognises any surplus or deficit in profit or loss; and
- reclassifies the parent’s share of components previously recognised in other comprehensive income to profit or loss.
For
per
sona
l use
onl
y

46
Notes to the Financial Statements For the Financial Year Ended 30 June 2010 (continued)
3. Significant Accounting Policies (continued)
(A) BASIS OF CONSOLIDATION (CONTINUED)
(i) Subsidiaries (continued) In comparison to the above mentioned requirements which were applied on a prospective basis from 1 July 2009, the following differences applied:
- Non-controlling interests represented the portion of profit or loss and net assets of a subsidiary that were not wholly-owned by the Group and were presented separately in the consolidated statement of comprehensive income and within equity in the consolidated statement of financial position separately from parent shareholders’ equity. Acquisitions of non-controlling interest were accounted for using the parent entity extension method, whereby the difference between the consideration and the book value of the share of the net assets acquired was recognised in goodwill.
- Losses incurred by the Group were attributed to the non-controlling interest until the balance was reduced to nil. Any further excess losses were attributed to the parent, unless the non-controlling interest had a binding obligation to cover these.
- Upon loss of control, the Group accounted for the investment retained at its proportionate share of net asset value at the date control was lost.
(ii) Associates Associates are all entities over which the Group has significant influence, but not control, over the financial and operating policies. Investments in associates are accounted for in the consolidated financial statements using the equity method of accounting, after initially being recognised at cost.
Under the equity method, investments in associates are carried in the consolidated statement of financial position at cost plus post-acquisition changes in the Group’s share of net assets of the associates. Goodwill relating to an associate is included in the carrying amount of the investment and is not amortised. After application of the equity method, the Group determines whether it is necessary to recognise any impairment loss with respect to the Group’s net investment in associates. Goodwill included in the carrying amount of the investment in associate is not tested separately, rather the entire carrying amount of the investment is tested for impairment as a single asset. If any impairment is recognised, the amount is not allocated to the goodwill of the associate.
The Group’s share of its associates’ post-acquisition profits or losses is recognised in the statement of comprehensive income, and its share of post-acquisition movements in reserves is recognised in reserves. The cumulative post-acquisition movements are adjusted against the carrying amount of the investment. Dividends receivable from associates are recognised in the parent entity’s statement of comprehensive income as a component of other income.
Where the Group’s share of losses in an associate equals or exceeds its interest in the associate, including any other unsecured long-term receivables, the Group does not recognise further losses, unless it has incurred obligations or made payments on behalf of the associate.
Unrealised gains on transactions with associates are eliminated to the extent of the Group’s interest in the associates. Unrealised losses are also eliminated unless the transaction provides evidence of an impairment of the asset transferred. Accounting policies have been changed where necessary to ensure consistency with the policies adopted by the Group.
(B) BUSINESS COMBINATIONS Business combinations are accounted for using the acquisition method. The consideration transferred in a business combination shall be measured at fair value, which shall be calculated as the sum of the acquisition date fair values of the assets transferred by the acquirer, the liabilities incurred by the acquirer to former owners of the acquiree and the equity issued by the acquirer, and the amount of any non-controlling interest in the acquiree. For each business combination, the acquirer measures the non-controlling interest in the acquiree either at fair value or at the proportionate share of the acquiree’s identifiable net assets. Acquisition related costs are expensed as incurred.
For
per
sona
l use
onl
y

Transpacific Annual Report 2010 47
3. Significant Accounting Policies (continued)
(B) BUSINESS COMBINATIONS (CONTINUED) When the Group acquires a business, it assesses the financial assets and liabilities assumed for appropriate classification and designation in accordance with the contractual terms, economic conditions, the Group’s operating or accounting policies and other pertinent conditions as at the acquisition date. This includes the separation of embedded derivatives in host contracts by the acquiree.
If the business combination is achieved in stages, the acquisition date fair value of the acquirer’s previously held equity interest in the acquiree is remeasured at fair value as at the acquisition date through profit or loss.
Any contingent consideration to be transferred by the acquirer will be recognised at fair value at the acquisition date. Subsequent changes to the fair value of the contingent consideration which is deemed to be an asset or liability will be recognised in accordance with AASB 139 either in profit or loss or in other comprehensive income. If the contingent consideration is classified as equity, it shall not be remeasured.
Prior to 1 July 2009, the Group used the purchase method of accounting for business combinations. Transaction costs directly attributable to the acquisition formed part of the acquisition costs. The non-controlling interest was measured at the proportionate share of the acquiree’s identifiable net assets.
Business combinations achieved in stages were accounted for in separate steps. Any additional interest in the acquiree acquired did not affect previously recognised goodwill. The goodwill amounts calculated at each step acquisition were accumulated.
When the Group acquired a business, embedded derivatives separated from the host contract by the acquiree were not reassessed on acquisition unless the business combination resulted in a change in the terms of the contract that significantly modified the cash flows that otherwise would have been required under the contract.
Contingent consideration was recognised if, and only if, the Group had a present obligation, the economic outflow was more likely than not and a reliable estimate was determinable. Subsequent adjustments to the contingent consideration were adjusted against goodwill.
(C) INCOME TAX The income tax expense or revenue for the period is the tax payable on the current period’s taxable income based on the national income tax rate for each jurisdiction adjusted by changes in deferred tax assets and liabilities attributable to temporary differences and to used tax losses.
Deferred income tax is provided in full, using the liability method, on temporary differences arising between the tax bases of assets and liabilities and their carrying amounts in the consolidated financial statements. However, the deferred income tax is not accounted for if it arises from initial recognition of an asset or liability in a transaction other than a business combination that at the time of the transaction affects neither accounting nor taxable profit or loss. Deferred income tax is determined using tax rates (and laws) that have been enacted or substantially enacted by the reporting date and are expected to apply when the related deferred income asset is realised or the deferred income tax liability is settled.
Deferred tax assets are recognised for deductible temporary differences and unused tax losses only if it is probable that future taxable amounts will be available to utilise those temporary differences and losses.
Deferred tax liabilities and assets are not recognised for temporary differences between the carrying amount and tax bases of investments in controlled entities where the parent entity is able to control the timing of the reversal of the temporary differences and it is probable that the differences will not reverse in the foreseeable future.
Deferred tax assets and liabilities are offset where there is a legally enforceable right to offset current tax assets and liabilities and they relate to income taxes levied by the same taxation authority on the same taxable entity, or on different tax entities, but they intend to settle current tax liabilities and assets on a new basis or their tax assets and liabilities will be realised simultaneously.
Current and deferred tax balances attributable to amounts recognised directly in equity are also recognised directly in equity.
For
per
sona
l use
onl
y

48
Notes to the Financial Statements For the Financial Year Ended 30 June 2010 (continued)
3. Significant Accounting Policies (continued)
(C) INCOME TAX (CONTINUED) Tax consolidation legislation
The Company and all its wholly-owned Australian resident entities are part of a tax-consolidated group under Australian taxation law. Transpacific Industries Group Ltd is the head entity in the tax-consolidated group. The tax-consolidated group has entered into a tax sharing and a tax funding agreement.
(D) FOREIGN CURRENCY
(i) Foreign currency transactions and balances Foreign currency transactions are translated at the foreign exchange rate ruling at the date of the transaction. Monetary assets and liabilities denominated in foreign currencies at the reporting date are translated into Australian dollars at the foreign exchange rate ruling at that date. Foreign exchange differences arising on translation are recognised in the statement of comprehensive income and are reported on a net basis. Non-monetary assets and liabilities that are measured in terms of historical cost in a foreign currency are translated using the exchange rate at the date of the transaction. Non-monetary assets and liabilities denominated in foreign currencies that are stated at fair value are translated to Australian dollars at foreign exchange rates ruling at the dates the fair value was determined.
(ii) Financial statements of foreign operations The assets and liabilities of foreign operations, including goodwill and fair value adjustments arising on consolidation, are translated to Australian dollars at foreign exchange rates ruling at the reporting date. The revenues and expenses of foreign operations, excluding foreign operations in hyper-inflationary economies, are translated to Australian dollars at rates approximating to the foreign exchange rates ruling at the dates of the transactions. The revenues and expenses of foreign operations in hyper-inflationary economies are translated to Australian dollars at the foreign exchange rates ruling at the reporting date. Foreign exchange differences arising on re-translation are recognised directly in a separate component of equity. Foreign exchange gains and losses arising from a monetary item receivable from or payable to a foreign operation, the settlement of which is neither planned nor likely in the foreseeable future, are considered to form part of a net investment in a foreign operation and are recognised directly in equity.
(iii) Net investment in foreign operations On consolidation, exchange differences arising from the translation of any net investment in foreign entities, and of borrowings and other financial instruments designated as hedges of such investments, are taken to shareholders’ equity. When a foreign operation is sold or any borrowings forming part of the net investment are repaid, a proportionate share of such exchange differences are recognised in the statement of comprehensive income, as part of the gain or loss on sale where applicable.
Goodwill and fair value adjustments arising on the acquisition of a foreign entity are treated as assets and liabilities of the foreign entities and translated at the closing rate.
(E) DERIVATIVE FINANCIAL INSTRUMENTS The Group enters into a variety of derivative financial instruments to manage its exposure to foreign exchange and interest rate risk, including forward foreign exchange contracts and interest rate swaps. Derivatives are initially recognised at fair value on the date a derivative contract is entered into and are subsequently remeasured to their fair value at each reporting date. The gain or loss on remeasurement to fair value is recognised immediately in profit or loss. However, where the derivatives qualify for hedge accounting, recognition of any resultant gain or loss depends on the nature of the item being hedged. The fair value of interest rate swaps is the estimated amount that the Group would receive or pay to terminate the swap at the balance date, taking into account current interest rates and the current creditworthiness of the swap counterparties. The fair value of forward foreign exchange contracts is their quoted market price at the reporting date, being the present value of the quoted forward price. On entering into a hedging relationship, the Group designates certain derivatives as either hedges of the fair value of recognised assets or liabilities or firm commitments (fair value hedges), hedges of highly probable forecast transactions (cash flow hedges), or hedges of net investments in foreign operations.
For
per
sona
l use
onl
y

Transpacific Annual Report 2010 49
3. Significant Accounting Policies (continued)
(E) DERIVATIVE FINANCIAL INSTRUMENTS (CONTINUED)
(i) Fair value hedge Changes in the fair value of derivatives that are designated and qualify as fair value hedges are recorded in profit or loss immediately, together with any changes in the fair value of the hedged asset or liability that is attributable to the hedged risk. If the hedge no longer meets the criteria for hedge accounting, the adjustment to the carrying amount of a hedge item for which the effective interest method is used is amortised to profit or loss over the period to maturity using a recalculated effective interest rate.
(ii) Cash flow hedge The effective portion of changes in the fair value of derivatives that are designated and qualify as cash flow hedges is recognised in equity in the hedging reserve. The gain or loss relating to the ineffective portion is recognised immediately in profit or loss. Amounts accumulated in equity are recycled in profit or loss in the periods when the hedged item affects profit or loss. However, when the forecast transaction that is hedged results in the recognition of a non-financial asset or liability, the gains and losses previously deferred in equity are transferred from equity and included in the initial measurement of the cost of the asset or liability.
When the hedging instrument expires or is sold, or terminated, or when a hedge no longer qualifies for hedge accounting, any cumulative gain or loss existing in equity at that time remains in equity and is recognised when the forecast transaction is ultimately recognised in profit or loss. When a forecast transaction is no longer expected to occur, the cumulative gain or loss that was reported in equity is recognised immediately in profit or loss.
(iii) Net investment hedge Hedges of net investments in foreign operations are accounted for similarly to cash flow hedges. Any gain or loss on the hedging instrument relating to the effective portion of the hedge is recognised in the foreign currency translation reserve, the gain or loss relating to the ineffective portion is recognised immediately in profit or loss. Gains and losses deferred in the foreign currency translation reserve are recognised immediately in profit or loss when the foreign operation is disposed of.
(iv) Compound financial instruments The component parts of compound instruments are classified separately as financial liabilities and equity in accordance with the substance of the contractual arrangement. At the date of issue, the fair value of the liability component is estimated using the prevailing market interest rate for a similar non-convertible instrument. This amount is recorded as a liability on an amortised cost basis until extinguished on conversion or upon the instruments reaching maturity. The equity component initially brought to account is determined by deducting the amount of the liability component from the fair value of the compound instrument as a whole. This is recognised and included in equity, net of income tax effects and is not subsequently remeasured.
(v) Derivatives that do not qualify for hedge accounting Certain derivative instruments do not qualify for hedge accounting. Changes in the fair value of any derivative instrument that does not qualify for hedge accounting are recognised immediately in profit or loss. F
or p
erso
nal u
se o
nly

50
Notes to the Financial Statements For the Financial Year Ended 30 June 2010 (continued)
3. Significant Accounting Policies (continued)
(F) REVENUE Amounts disclosed as revenue are net of returns, trade allowances and duties and taxes paid. Revenue from the sale of goods is recognised when the significant risks and rewards of ownership of the goods have passed to the buyer and can be measured reliably. Risks and rewards are considered passed to the buyer at the time of delivery of goods to customers. Revenue from the rendering of services is recognised upon delivery of services to the customer. Revenue is recognised for the major business activities as follows:
(i) Liquid waste and biosolids Revenue from the collection and treatment of liquid waste is recognised after the waste has been collected and treated.
(ii) Energy Revenue is recognised on the sale of oil and by-products to customers on shipment or passing of control of the goods.
(iii) Industrial solutions Contract revenue is measured by reference to labour hours incurred to date and actual costs incurred. Other revenue is recognised upon the delivery of goods or services to customers.
(iv) Commercial vehicles Revenue from the sale of goods is recognised when the significant risks and rewards of ownership of the goods have passed to the buyer and can be measured reliably. Risks and rewards are considered passed to the buyer at the time of delivery of goods to customers.
(v) Solid waste Revenue is recognised when the service has been provided to customers.
(vi) Manufacturing Revenue from the sale of goods is recognised when the significant risks and rewards of ownership of the goods have passed to the buyer and can be measured reliably. Risks and rewards are considered passed to the buyer at the time of delivery of goods to customers.
(vii) Interest Interest revenue is recognised on an accruals basis, taking into account the interest rates applicable to the financial assets.
(viii) Dividends
Dividend revenue is recognised when the right to receive a dividend has been established. Dividends received from associates are accounted for in accordance with the equity method of accounting.
(ix) Government grants Grants from the government are recognised at their fair value when there is a reasonable assurance that the grant will be received and the Group will comply with all attached conditions. Grants relating to costs are deferred and recognised in the statement of comprehensive income over the period necessary to match them with the costs that they are intended to compensate. Grants relating to the purchase of property, plant and equipment are included in liabilities as deferred income and are credited to the statement of comprehensive income on a straight-line basis over the expected lives of the related assets.
(x) Other revenue Other revenue is recognised when the right to receive the revenue has been established.
(G) TRADE AND OTHER RECEIVABLES All trade debtors are recognised and carried at original invoice amount as they are due for settlement generally no more than 30 days from the date of invoice. Some divisions may give extended terms. Collectability of trade debtors is reviewed on an ongoing basis. Debts which are known to be uncollectable are written off when identified. A provision for impairment is raised when collection of an amount is no longer probable (shown in Note 33(G)).
For
per
sona
l use
onl
y

Transpacific Annual Report 2010 51
3. Significant Accounting Policies (continued)
(H) INVENTORIES Inventories are valued at the lower of cost and net realisable value. The cost of inventories is based on the method most appropriate to each particular class of inventory and includes expenditure incurred in acquiring the inventories, production or conversion costs and other costs incurred in bringing them to their existing location and condition. In the case of manufactured inventories and work in progress, cost includes an appropriate share of production overheads based on normal operating capacity. The cost of inventory may also include transfers from equity of any gain or loss on qualifying cash flow hedges of foreign currency purchases of inventory. Commercial vehicles are valued at actual cost, vehicle parts are valued at weighted average cost and the remainder of inventory is valued at standard cost. Landfill land held for sale may also be included in inventory in line with the Group’s accounting policy for landfills Note 3(J)(iv).
(I) IMPAIRMENT OF ASSETS A financial asset is assessed at each reporting date to determine whether there is any objective evidence that it is impaired. Impairment losses on financial assets are directly written off to the statement of comprehensive income. Impairment of equity investments classified as available-for-sale is recognised where a significant or prolonged decline in the fair value of the investment occurs. This is determined by reference to current market bid prices. Impairment of loans and receivables is recognised when it is probable that the carrying amount will not be recovered in full due to significant financial difficulty or other loss event of the debtor. Goodwill and intangible assets that have an indefinite useful life are not subject to amortisation and are tested annually for impairment, or more frequently if events or changes in circumstances indicate that they might be impaired. Other assets are reviewed for impairment whenever events or changes in circumstances indicate that the carrying amount may not be recoverable. An impairment loss is recognised for the amount by which the asset’s carrying amount exceeds its recoverable amount. The recoverable amount is the higher of an asset’s fair value less costs to sell and value-in-use. For the purposes of assessing impairment, assets are grouped at the lowest levels for which there are separately identifiable cash inflows which are largely independent of the cash inflows from other assets or groups of assets (cash-generating units). The goodwill acquired in a business combination, for the purpose of impairment testing, is allocated to cash-generating units that are expected to benefit from the synergies of the combination. Non-financial assets other than goodwill that suffer an impairment loss are reviewed for reversal of the impairment loss at each subsequent reporting date.
(J) PROPERTY, PLANT AND EQUIPMENT Landfills, cell development and provision for remediation
(i) Landfills
The Group owns landfill assets. A landfill may be either developed by the Group or purchased by the Group. The cost of developing a landfill includes the cost of land, permitting and overall site and infrastructure development to bring the asset to its condition necessary for its intended use, that is, to receive and dispose of waste. If the landfill is purchased, then an additional intangible (landfill airspace) cost may be recognised. The value composition of a landfill changes over time. Initially a landfill’s value is more of an intangible asset including location, permitting and airspace which generates future earnings. Landfill airspace and licences are both considered to be integral components of a landfill asset and as such have been combined with effect from 1 July 2008. As airspace is consumed and landfilling continues to completion, the landfill’s value shifts to a tangible asset, being the value of the land. It is the Group’s policy at time of development or acquisition and reporting dates to:
(a) capitalise the cost of a developed landfill to landfills; (b) capitalise the cost of purchased landfills to intangibles (landfill airspace) and landfills based on a split
of the intangible and tangible value paid for the landfill; (c) assess impairment of each landfill asset or group of landfill assets which work together as a unit by
reference to both intangible and tangible values. If impaired an impairment loss is recorded; (d) measure the intangible value by reference to remaining available airspace and the future earnings it
will generate;
For
per
sona
l use
onl
y

52
Notes to the Financial Statements For the Financial Year Ended 30 June 2010 (continued)
3. Significant Accounting Policies (continued)
(J) PROPERTY, PLANT AND EQUIPMENT (CONTINUED) (e) measure the tangible land value by reference to fair value determined by Directors or an independent
valuation (carried out periodically every three years); and (f) transfer the consumption of landfill airspace to landfill land, over the life of the landfill in conjunction
with the measurement of intangible value in point (d) above. The portion of landfill airspace transferred from intangible assets to tangible assets in a reporting period is calculated as the tonnes of airspace consumed in the reporting period divided into the tonnes of airspace available at the beginning of the reporting period.
Discounted cash flows are used to test impairment (refer Note 3(I)). Landfill assets are carried at Directors’ valuation in the accounts which is based on cost increased for the amortisation of any landfill airspace. (ii) Cell development A landfill will normally be divided into parts, with each part (a cell) being developed one at a time to receive waste. When a cell is nearly full, a new cell is developed in readiness to receive waste from the time the former cell closes. The closed cell is then capped and may return a revenue stream, such as from the sale of landfill gas, to the Group for years to come. The cost of cell development includes earthworks, gas capture infrastructure and cell lining to bring the asset to its condition necessary for its intended use, that is, to receive and dispose of waste and generate revenue streams. Cell development costs also include the cost of capping on closure of the cell. Expenditure on cell development may be incurred in one reporting period but the airspace in the cell may last for more than that reporting period. In recognition of the above, it is the Group’s policy at time of cell development and reporting dates to:
(a) capitalise the cost of cell development in landfill assets; (b) amortise the cost of cell development over the useful life of the cell; and (c) recognise income streams in the reporting period earned.
The amortisation for a reporting period is calculated by the tonnes of airspace consumed during the reporting period divided into the total airspace available at the beginning of the reporting period. Future landfill site restoration and aftercare costs capitalised are depreciated at rates that match the pattern of benefits expected to be derived from use of the respective sites.
(iii) Landfill closure and provision for remediation
A landfill is deemed full when its permitted airspace is consumed and it cannot legally accept any more waste. Alternatively, a landfill may be deemed full earlier should other factors exist, for example, if it is not economically viable to continue accepting waste. At that point:
(a) the value of the landfill has fully shifted to tangible land asset and there is no intangible asset remaining; and
(b) the cost of cell development is fully amortised to nil.
Generally, a landfill must be maintained and left in a condition specified by the Environmental Protection Authority or government authorities. Therefore remediation occurs on an ongoing basis, at the time the landfill closes and also post-closure. Certain landfills will also have revenue streams from, for example, the supply of landfill gas into electricity grids for many years.
In recognition of the above, it is the Group’s policy at time of development and reporting dates to:
(a) in the case of developing a landfill, provide for the expected remediation at time of development;
(b) in the case of purchasing a landfill, account for the acquisition in accordance with “AASB 3 Business Combinations” at the time of acquisition;
(c) request environmental scientists to calculate the expected cost of remediation for each landfill asset or group of landfill assets working together; and
(d) assess the adequacy of the provision for remediation against (c) at each reporting date and either confirm its adequacy or increase or decrease the provision to the landfill asset or profit and loss account as required and account for the cost of remediation against the provision.
For
per
sona
l use
onl
y

Transpacific Annual Report 2010 53
3. Significant Accounting Policies (continued)
(J) PROPERTY, PLANT AND EQUIPMENT (CONTINUED)
Future landfill site restoration and aftercare costs provided for are initially capitalised in the statement of financial position. Any change in the provision for future landfill site restoration and aftercare costs arising from a change in estimate of those costs is also recognised in non-current assets in the statement of financial position.
The provision is stated at the present value of the future cash outflows expected to be incurred, which increases each period due to the passage of time. The annual change in the net present value of the provision due to the passage of time is recognised in the statement of comprehensive income as a time value adjustment.
(iv) Landfill sales
A landfill may be disposed of as an operating landfill or it may be retained until post-closure and then sold.
In accordance with the above, it is the Group’s policy at time of sale and reporting periods to:
(a) if the landfill is sold as an operating landfill, recognise the profit on sale of an asset; or
(b) if the completed landfill is intended to be sold in the future, transfer the landfill balance to inventory or non-current assets held for sale as applicable.
Other property, plant and equipment
Land and buildings are shown at fair value, based on periodic, but at least triennial, valuations by external independent valuers, less subsequent depreciation for buildings. The fair values are recognised in the financial statements of the Group, and are reviewed at the end of each reporting period to ensure that the carrying value of land and buildings is not materially different from their fair values.
Any revaluation increase arising on the revaluation of land and buildings is credited to the asset revaluation reserve, except to the extent that it reverses a revaluation decrease for the same asset previously recognised as an expense in profit or loss, in which case the increase is credited to the statement of comprehensive income to the extent of the decrease previously charged. A decrease in carrying amount arising on the revaluation of land and buildings is charged as an expense in profit or loss to the extent that it exceeds the balance, if any, held in the asset revaluation reserve relating to a previous revaluation of that asset.
Depreciation on revalued buildings is charged to profit or loss. On the subsequent sale or retirement of a revalued property, the attributable revaluation surplus remaining in the asset revaluation reserve, net of any related deferred taxes, is transferred directly to retained earnings.
Plant and equipment, and equipment under finance lease are stated at cost less accumulated depreciation and impairment. Cost includes expenditure that is directly attributable in bringing the asset to the location and condition necessary for its intended use. In the event that settlement of all or part of the purchase consideration is deferred, cost is determined by discounting the amounts payable in the future to their present value as at the date of acquisition. Cost also may include transfers from equity of any gain or loss on qualifying cash flow hedges of foreign currency purchases of property, plant and equipment. Purchased software that is integral to the functionality of the related equipment is capitalised as part of that equipment. Borrowing costs related to the acquisition or construction of qualifying assets are also capitalised as part of that asset.
Gains and losses on disposal of an item of other property, plant and equipment are determined by comparing the proceeds from disposal with the carrying amount of the other property, plant and equipment and are recognised net within “other income” in profit or loss. When revalued assets are sold, the amounts included in the revaluation reserve are transferred to retained earnings.
Depreciation is provided on other property, plant and equipment, including freehold buildings but excluding land. Depreciation of all other assets is calculated on a straight-line basis so as to write off the net cost or other revalued amount of each asset over its expected useful life to the Group. Leasehold improvements are depreciated over the period of the lease or estimated useful lives, whichever is the shorter, using the straight-line method.
For
per
sona
l use
onl
y

54
Notes to the Financial Statements For the Financial Year Ended 30 June 2010 (continued)
3. Significant Accounting Policies (continued)
(J) PROPERTY, PLANT AND EQUIPMENT (CONTINUED) Estimates of remaining useful lives are made on a regular basis for all assets, with annual reassessments for major items. The expected useful lives are as follows: Buildings and site improvements 15 to 40 years Plant and equipment 2.5 to 20 years
Leasehold improvements 5 to 10 years
(K) LEASES Leases are classified as finance leases whenever the terms of the lease transfer substantially all the risks and rewards of ownership to the lessee. All other leases are classified as operating leases.
(i) Finance leases Assets held under finance leases are initially recognised at their fair value or, if lower, at amounts equal to the present value of the minimum lease payments, each determined at the inception of the lease. The corresponding liability to the lessor is included in the statement of financial position as a finance lease obligation.
Lease payments are apportioned between finance charges and reduction of the lease obligation so as to achieve a constant rate of interest on the remaining balance of the liability. Finance charges are charged directly against income, unless they are directly attributable to qualifying assets, in which case they are capitalised in accordance with the Group’s general policy on finance costs. Refer to Note 3(O).
Finance leases are depreciated over the shorter of the estimated useful life of the asset or the lease term.
(ii) Operating leases Operating lease payments are recognised as an expense on a straight-line basis over the lease term, except where another systematic basis is more representative of the time pattern in which economic benefits from the leased asset are consumed.
(L) INTANGIBLES
(i) Goodwill Goodwill represents the excess of the cost of an acquisition over the fair value of the Group’s share of the net identifiable assets of the acquired business, subsidiary or associate at the date of acquisition. Goodwill on the acquisition of businesses or subsidiaries is included in intangible assets. Goodwill on acquisition of associates is included in investments in associates. Goodwill is not amortised. Instead goodwill is tested for impairment annually, or more frequently if events or changes in circumstances indicate that it might be impaired, and is carried at cost less accumulated impairment losses. Gains and losses on the disposal of an entity include the carrying amount of goodwill relating to the entity sold.
Goodwill is allocated to cash-generating units for the purpose of impairment testing.
(ii) Research and development Expenditure on research activities, undertaken with the prospect of gaining new technical knowledge and understanding, is recognised in the statement of comprehensive income as an expense as incurred.
Expenditure on development activities, whereby research findings are applied to a plan or design for the production of new or substantially improved products and processes, is capitalised if the product or process is technically and commercially feasible and the Group has sufficient resources to complete development. The expenditure capitalised includes the costs of materials, direct labour and overhead costs that are directly attributable to preparing the asset for its intended use. Borrowing costs related to the development of qualifying assets are also capitalised. Other development expenditure is recognised in the statement of comprehensive income as an expense as incurred. Capitalised development expenditure is stated at cost less accumulated amortisation and impairment losses (see Note 3(I)).
(iii) Landfill airspace Landfill airspace and its amortisation is addressed in Note 3(J).
For
per
sona
l use
onl
y

Transpacific Annual Report 2010 55
3. Significant Accounting Policies (continued)
(L) INTANGIBLES (CONTINUED)
(iv) Other intangible assets Other intangible assets include customer contracts recognised on business combinations and licences. Other intangible assets that are acquired by the Group are stated at cost less accumulated amortisation (see below) and impairment losses (see Note 3(I)).
(v) Amortisation (other than amortisation of landfill airspace) Amortisation is charged to net income on a straight-line basis over the estimated useful lives of intangible assets unless such lives are indefinite (e.g. brand names). Goodwill and intangible assets with an indefinite useful life are systematically tested for impairment at each reporting date. Other intangible assets are amortised from the date they are available for use. The estimated useful lives are as follows:
Licences 5 to 10 years
Other 3 to 20 years
(M) TRADE AND OTHER PAYABLES Trade and other payables are stated at their amortised cost.
Trade payables are non-interest bearing and are normally settled on 30 day terms.
(N) BORROWINGS Borrowings are initially recognised at fair value of the consideration received net of issue costs incurred. Subsequent to initial recognition, interest-bearing borrowings are stated at amortised cost with any difference between costs and redemption value being recognised in the statement of comprehensive income over the period of the borrowings on an effective interest basis.
Borrowings are derecognised when the obligation specified in the contract is discharged, cancelled or expired. The difference between the carrying amount of a financial liability that has been extinguished or transferred to another party and the consideration paid, including any non-cash assets transferred or liabilities assumed, is recognised in other income or other expenses.
(O) FINANCE COSTS Finance costs are recognised as expenses in the period in which they are incurred. Finance costs include:
• interest on bank overdrafts and short-term and long-term borrowings, including amounts paid or received on interest rate swaps;
• amortisation of discounts or premiums relating to borrowings;
• amortisation of ancillary costs incurred in connection with the arrangement of borrowings; and
• finance lease charges.
There have been no qualifying assets and related debt to which borrowing costs could have been applied, and as a result no borrowing costs have been capitalised to qualifying assets.
(P) REPAIRS AND MAINTENANCE Plant and equipment of the Group is required to be overhauled on a regular basis. This is managed as part of an ongoing major cyclical maintenance program. The costs of this maintenance are charged as expenses as incurred, except where they relate to the replacement of a component of an asset, in which case the costs are capitalised and depreciated in accordance with Note 3(J). Other routine operating maintenance, repair and minor renewal costs are also charged as expenses as incurred.
(Q) EMPLOYEE BENEFITS
(i) Wages and salaries, annual leave and sick leave Liabilities for wages and salaries, including non-monetary benefits, annual leave and vesting sick leave expected to be settled within 12 months of the reporting date are recognised in other creditors and provision for employee benefits in respect of employees' services up to the reporting date and are measured at the amounts expected to be paid when the liabilities are settled.
For
per
sona
l use
onl
y

56
Notes to the Financial Statements For the Financial Year Ended 30 June 2010 (continued)
3. Significant Accounting Policies (continued)
(Q) EMPLOYEE BENEFITS (CONTINUED)
(ii) Long service leave The liability for long service leave expected to be settled within 12 months of the reporting date is recognised in the provision for employee benefits and is measured in accordance with (i) above. The liability for long service leave expected to be settled more than 12 months from the reporting date is recognised in the provision for employee benefits and measured as the present value of expected future payments to be made in respect of services provided by employees up to the reporting date. Consideration is given to expected future wage and salary levels, experience of employee departures and periods of service. Expected future payments are discounted using market yields at the reporting date on national government bonds with terms to maturity and currency that match, as closely as possible, the estimated future cash outflows.
(iii) Short-term incentive compensation (IC)/bonus plans A liability for employee benefits in the form of IC is recognised when the Human Resources Committee determines that IC criteria has been achieved and an amount is payable in accordance with the terms of the IC plan.
Liabilities for IC are expected to be settled within 12 months and are measured at the amounts expected to be paid when they are settled.
(iv) Employee benefit on-costs Employee benefit on-costs, including payroll tax, are recognised and included in employee benefit liabilities and costs when the employee benefits to which they relate are recognised as liabilities.
(v) Share-based payment transactions Share-based payments are provided to Directors and employees via the Transpacific Industries Group Executive Share Option Plan, Long Term Incentive Plan and an Executive Engagement Award.
Share-based compensation payments are measured at fair value at the date of grant and expensed to employee benefit expense with a corresponding increase in equity over the period during which the employees become unconditionally entitled to the options or performance rights. Fair value is measured by an external valuer using a binomial model that takes into account the exercise price, the term of the option or performance right, the impact of dilution, the share price at grant date and expected price volatility of the underlying share, the expected dividend yield and the risk free interest rate for the term of the option or performance right.
(R) PROVISIONS A provision is recognised in the statement of financial position when the Group has a present legal or constructive obligation as a result of a past event, it is probable that an outflow of economic benefits will be required to settle the obligation, and a reliable estimate can be made of the amount of the obligation. If the effect of the time value of money is material, provisions are determined by discounting the expected future cash flows at a pre-tax rate that reflects current market assessments of the time value of money and, where appropriate, the risks specific to the liability.
Warranties A provision for warranties is recognised when the underlying products are sold. The provision is based on historical warranty data and a weighting of all possible outcomes against their probabilities.
(S) CASH AND CASH EQUIVALENTS Cash and cash equivalents comprise cash balances, short-term bills and call deposits. Bank overdrafts that are repayable on demand and form an integral part of the Group’s cash management position are included as a component of cash and cash equivalents for the purpose of the statement of cash flows.
For
per
sona
l use
onl
y

Transpacific Annual Report 2010 57
3. Significant Accounting Policies (continued)
(T) INVESTMENTS AND OTHER FINANCIAL ASSETS Financial assets are recognised when the Group becomes a party to the contractual provisions of the instrument at trade date.
Financial assets are initially measured at fair value plus transaction costs where the instrument is not classified at fair value through profit and loss. Transaction costs related to financial assets classified as fair value through profit and loss are expensed immediately.
The Group’s non-derivative financial assets are currently measured after initial recognition as loans and receivables or available-for-sale financial assets. The Group has no non-derivative financial assets classified as fair value through the profit and loss or held-to-maturity under accounting standard AASB 139. Subsequent measurement of loans and receivables is disclosed in Note 3(G).
Available-for-sale financial assets are measured at fair value with any changes in the fair value recognised directly in equity until the investment is derecognised or until the investment is determined to be impaired, at which time the cumulative gain or loss previously reported in equity is recognised in profit or loss. The Group’s investments in equity securities, other than controlled entities and associates, are classified as available-for-sale. Fair value is determined by reference to official bid prices quoted on the relevant securities exchange, or where not listed and fair value cannot be reliably ascertained, at cost.
Controlled entities and associates are accounted for in the consolidated financial statements as set out in Note 3(A).
Financial assets are derecognised when the rights to receive cash flows from the financial assets have expired or have been transferred and the Group has transferred substantially all the risks and rewards of ownership.
(U) ISSUED CAPITAL Issued and paid up capital is recognised at the fair value of the consideration received by the Company. Any transaction costs incurred by the Company arising on the issue of capital are recognised directly in equity as a reduction of the share proceeds received.
(V) STEP-UP PREFERENCE SHARES The units are classified as equity according to AASB 132 Financial Instruments: Presentation due to the redemption and settlement features resulting in a fixed amount of equity instruments. AASB 132 states that if a contract is for the exchange of a fixed amount of cash for a fixed number of shares the contract is considered to represent a residual interest and be classified as equity. The redemption of the shares is at the discretion of the Group rather than the unit holder, therefore the units are classified as equity.
(W) EARNINGS PER SHARE
(i) Basic earnings per share Basic earnings per share is determined by dividing net profit after income tax attributable to members of the Company, excluding any costs of servicing equity other than ordinary shares, by the weighted average number of ordinary shares outstanding during the financial year, adjusted for bonus elements in ordinary shares issued during the year.
(ii) Diluted earnings per share Diluted earnings per share adjusts the figures used in the determination of basic earnings per share to take into account the after income tax effect of interest and other financing costs associated with dilutive potential ordinary shares and the weighted average number of shares assumed to have been issued for no consideration in relation to dilutive potential ordinary shares.
For
per
sona
l use
onl
y

58
Notes to the Financial Statements For the Financial Year Ended 30 June 2010 (continued)
3. Significant Accounting Policies (continued)
(X) GOODS AND SERVICES TAX Revenue, expenses and assets are recognised net of the amount of goods and services tax (GST), except where the amount of GST incurred is not recoverable from the taxation authority. In these circumstances, the GST is recognised as part of the cost of acquisition of the asset or as part of the expense.
Receivables and payables are stated with the amount of GST included. The net amount of GST recoverable from, or payable to, the Australian Taxation Office (ATO) is included as a current asset or liability in the statement of financial position.
Cash flows are included in the statement of cash flows on a gross basis. The GST component of cash flows arising from investing and financing activities which are recoverable from, or payable to, the ATO are classified as operating cash flows.
(Y) CRITICAL ACCOUNTING ESTIMATES AND JUDGEMENTS
The Directors evaluate estimates and judgements incorporated into the financial report based on historical knowledge and best available current information. Significant key estimates in the financial report are:
(i) Impairment: details of the key estimates used in assessing value-in-use calculations and impairment generally are disclosed in Notes 17 and 18.
(ii) Closure and post closure provisions: the Group assesses provisions for closure and post-closure costs in respect of its landfill sites by reference to external and internal sources to determine the best estimate of costs required to remediate the landfill sites. Further details are disclosed in Note 3(J)(iii). It should be noted that given the deferral and uncertainty surrounding the pricing of carbon and the effect on methane emissions from landfill sites, these variables have not been included in the measurement of these provisions.
(iii) Land and property values: the Group assesses the fair value of all land and property assets held at fair value each reporting date. Fair value is established using recent market transactions between willing buyers and sellers in an arm’s length sale in the normal course of business. Movements in market prices and the level of transactions impact the ability to estimate fair value.
(iv) Accounting for landfills: details of the key estimates used in assessing landfill values are included in Notes 17 and 18.
(v) Workers compensation self-insurance provisions: independent actuarial valuations are used to estimate the provision required for workers compensation where the Group is self-insured.
(vi) Recovery of deferred tax assets: deferred tax assets are recognised for deductible temporary differences as management considers that it is probable that future taxable profits will be available to utilise those temporary differences. Significant management judgement is required to determine the amount of deferred tax assets that can be recognised, based upon the likely timing and the level of future profits over the next two years together with future tax planning strategies.
For
per
sona
l use
onl
y

Transpacific Annual Report 2010 59
3. Significant Accounting Policies (continued)
(Y) CRITICAL ACCOUNTING ESTIMATES AND JUDGEMENTS (CONTINUED) (vii) Taxation: the Group’s accounting policy for taxation requires management’s judgement as to the
types of arrangements considered to be a tax on income in contrast to an operating cost. Judgement is also required in assessing whether deferred tax assets and certain deferred tax liabilities are recognised in the statement of financial position. Deferred tax assets, including those arising from unrecouped tax losses, capital losses and temporary differences, are recognised only where it is considered more likely than not that they will be recovered, which is dependent on the generation of sufficient future taxable profits. Deferred tax liabilities arising from temporary differences in investments, caused principally by retained earnings held in foreign tax jurisdictions, are recognised unless repatriation of retained earnings can be controlled and are not expected to occur in the foreseeable future. Assumptions about the generation of future taxable profits and repatriation of retained earnings depend on management’s estimates of future cash flows. These depend on estimates of future production and sales volumes, operating costs, restoration costs, capital expenditure, dividends and other capital management transactions. Judgements are also required about the application of income tax legislation. These judgements and assumptions are subject to risk and uncertainty, hence there is a possibility that changes in circumstances will alter expectations, which may impact the amount of deferred tax assets and deferred tax liabilities recognised on the statement of financial position and the amount of other tax losses and temporary differences not yet recognised. In such circumstances, some or all of the carrying amounts of recognised deferred tax assets and liabilities may require adjustment, resulting in a corresponding credit or charge to the statement of comprehensive income.
For
per
sona
l use
onl
y
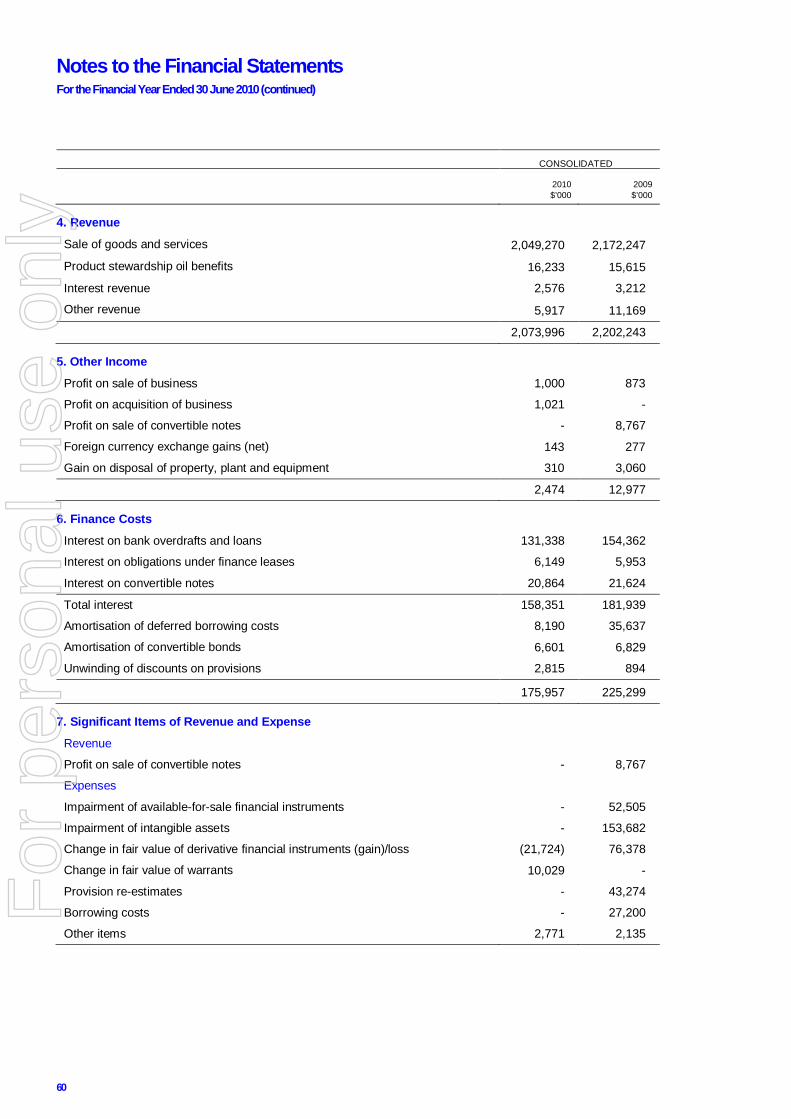
60
Notes to the Financial Statements For the Financial Year Ended 30 June 2010 (continued)
CONSOLIDATED
2010 $’000
2009 $’000
4. Revenue
Sale of goods and services 2,049,270 2,172,247
Product stewardship oil benefits 16,233 15,615
Interest revenue 2,576 3,212
Other revenue 5,917 11,169
2,073,996 2,202,243
5. Other Income
Profit on sale of business 1,000 873
Profit on acquisition of business 1,021 -
Profit on sale of convertible notes - 8,767
Foreign currency exchange gains (net) 143 277
Gain on disposal of property, plant and equipment 310 3,060
2,474 12,977
6. Finance Costs
Interest on bank overdrafts and loans 131,338 154,362
Interest on obligations under finance leases 6,149 5,953
Interest on convertible notes 20,864 21,624
Total interest 158,351 181,939
Amortisation of deferred borrowing costs 8,190 35,637
Amortisation of convertible bonds 6,601 6,829
Unwinding of discounts on provisions 2,815 894
175,957 225,299
7. Significant Items of Revenue and Expense
Revenue
Profit on sale of convertible notes - 8,767
Expenses
Impairment of available-for-sale financial instruments - 52,505
Impairment of intangible assets - 153,682
Change in fair value of derivative financial instruments (gain)/loss (21,724) 76,378
Change in fair value of warrants 10,029 -
Provision re-estimates - 43,274
Borrowing costs - 27,200
Other items 2,771 2,135
For
per
sona
l use
onl
y

Transpacific Annual Report 2010 61
CONSOLIDATED
NOTES 2010 $’000
2009 $’000
8. Income Tax (A) RECOGNISED IN THE STATEMENT OF COMPREHENSIVE INCOME
Current tax expense
Current year 6,341 16,293
Adjustments for prior years (9,337) (4,373)
(2,996) 11,920 Deferred tax expense
Origination and reversal of temporary differences 22,426 (33,285)
Benefit of tax losses recognised (130) (303)
22,296 (33,588) Total income tax expense/(benefit) in statement of comprehensive income 19,300 (21,668)
(B) NUMERICAL RECONCILIATION BETWEEN TAX EXPENSE AND PRE-TAX NET PROFIT
Profit/(loss) before tax 92,036 (237,775)
Income tax using the domestic corporation tax rate of 30% (2009: 30%) 27,611 (71,333)
Increase/(decrease) in income tax expense due to:
Rebateable dividends - - Share of associates’ net profits (412) (755)
Non-deductible expenses/non-assessable income (59) (13,984)
Impairment writedowns - 60,278 Effect of tax losses recognised (130) (303) Under/(over) provision in prior years (9,337) - Other 3,177 4,429
Change in overseas tax rate (1,550) - Differential tax rate on overseas income - -
Income tax expense/(benefit) 19,300 (21,668)
For
per
sona
l use
onl
y

62
Notes to the Financial Statements For the Financial Year Ended 30 June 2010 (continued)
CONSOLIDATED
NOTES 2010 $’000
2009 $’000
8. Income Tax (continued)
Deferred income tax in the statement of financial position as at 30 June 2010 relates to the following:
Deferred tax assets Employee benefits 15,770 12,744 Provisions 34,234 37,978 Finance leases - 593 Tax losses 20,645 1,174 IPO costs 251 215
Other 465 14,991
71,365 67,695 Deferred tax liabilities Property, plant and equipment 5,867 (86) Finance leases 631 - Deferred income - (939)
Other 12,860 9,542 Revaluation of land and buildings to fair value 11,688 11,688
31,046 20,205
Deferred income tax expense in the statement of comprehensive income for the year ended 30 June 2010 relates to the following:
Deferred tax assets Employee post employment benefits (3,025) (534) Provisions 3,744 (4,826) Finance leases 38 165
Tax losses (130) (303) Deductible transaction costs (36) (153) Change in fair value of cash flow hedges 6,517 (22,914) Other 4,310 (714) Deferred tax liabilities Property, plant and equipment 5,953 (104)
Other 5,055 (4,205)
22,426 (33,588)
Deferred income tax on items charged directly to equity for the year totalled $483,000 (2009: ($89,000)), all of which relate to cash flow hedges.
The Group has recognised tax losses as a deferred tax asset in relation to the New Zealand tax jurisdiction. It is expected that sufficient profits will be generated in the future to utilise these carried forward tax losses.
For
per
sona
l use
onl
y
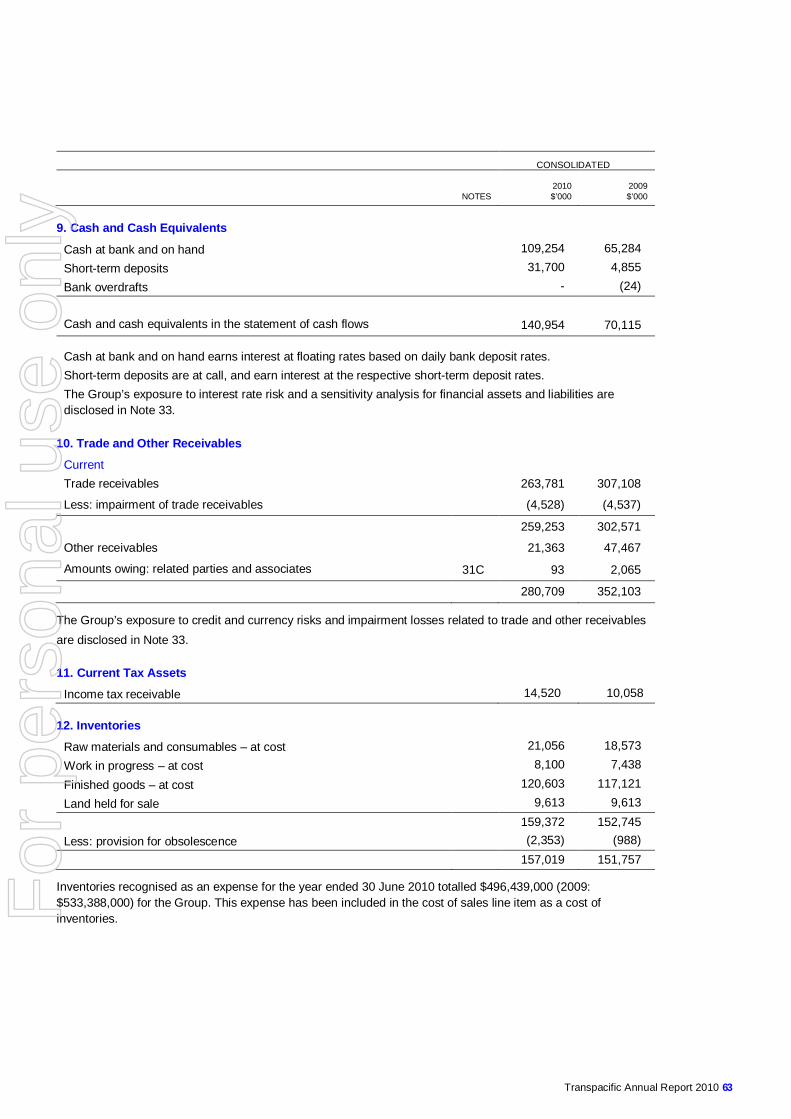
Transpacific Annual Report 2010 63
CONSOLIDATED
NOTES 2010 $’000
2009 $’000
9. Cash and Cash Equivalents
Cash at bank and on hand 109,254 65,284 Short-term deposits 31,700 4,855 Bank overdrafts - (24)
Cash and cash equivalents in the statement of cash flows 140,954 70,115
Cash at bank and on hand earns interest at floating rates based on daily bank deposit rates. Short-term deposits are at call, and earn interest at the respective short-term deposit rates. The Group’s exposure to interest rate risk and a sensitivity analysis for financial assets and liabilities are disclosed in Note 33.
10. Trade and Other Receivables
Current Trade receivables 263,781 307,108
Less: impairment of trade receivables (4,528) (4,537)
259,253 302,571
Other receivables 21,363 47,467
Amounts owing: related parties and associates 31C 93 2,065
280,709 352,103
The Group’s exposure to credit and currency risks and impairment losses related to trade and other receivables are disclosed in Note 33.
11. Current Tax Assets
Income tax receivable 14,520 10,058
12. Inventories
Raw materials and consumables – at cost 21,056 18,573 Work in progress – at cost 8,100 7,438
Finished goods – at cost 120,603 117,121 Land held for sale 9,613 9,613
159,372 152,745 Less: provision for obsolescence (2,353) (988)
157,019 151,757
Inventories recognised as an expense for the year ended 30 June 2010 totalled $496,439,000 (2009: $533,388,000) for the Group. This expense has been included in the cost of sales line item as a cost of inventories. F
or p
erso
nal u
se o
nly

64
Notes to the Financial Statements For the Financial Year Ended 30 June 2010 (continued)
CONSOLIDATED
NOTES 2010 $’000
2009 $’000
13. Derivative Financial Instruments
Current assets
Derivatives at fair value 18,635 41,346
18,635 41,346 Current liabilities Derivatives at fair value 31,440 87,028
31,440 87,028
14. Other Financial Assets
Non current Other investments in listed companies at fair value 23,942 21,195
23,942 21,195 Other investments are classified as available-for-sale assets under AASB 139.
The Group’s exposure to credit, currency and interest rate risks related to other investments is disclosed in Note 33.
15. Other Assets
Prepayments 5,927 5,015
Other current assets 6,371 5,807
12,298 10,822
16. Investments Accounted for Using the Equity Method
Investment in associates 26A 18,987 18,096
18,987 18,096
For
per
sona
l use
onl
y

Transpacific Annual Report 2010 65
CONSOLIDATED
NOTES 2010 $’000
2009 $’000
17. Property, Plant and Equipment
LAND
Land at fair value 191,569 180,731
Net book value 191,569 180,731 Movements Opening written down value 180,731 202,730 Additions through business combinations - 6,342
Additions 16,077 3,635 Disposals (2,753) (323) Transfer between categories (2,785) (32,076) Revaluation - - Effect of movements in foreign exchange 299 423
Closing written down value 191,569 180,731
LANDFILL, CELL DEVELOPMENT AND REMEDIATION
Landfill and cell development 316,574 268,244 Provision for remediation (93,446) (91,105) Provision for depreciation (62,864) (36,409)
Net book value 160,264 140,730 Movements Opening written down value 140,730 87,605
Additions 33,504 31,894 Increase in remediation provision through profit and loss - (14,130) Movement in remediation provision (2,341) 1,865 Transfer from landfill airspace 15,608 25,055 Correction to prior period transfer from landfill airspace - (12,326) Transfer between categories (1,541) 35,690
Depreciation (26,455) (16,132) Effect of movements in foreign exchange 759 1,209
Closing written down value 160,264 140,730
The provision for remediation has been estimated using current expected costs and techniques applicable to the disturbed area. These costs have been adjusted forward to the total expected costs at the time of works being required. These costs have then been discounted to estimate the required provision at a rate of 5.1%.
For
per
sona
l use
onl
y

66
Notes to the Financial Statements For the Financial Year Ended 30 June 2010 (continued)
CONSOLIDATED
NOTES 2010 $’000
2009 $’000
17. Property, Plant and Equipment (continued)
BUILDINGS
Buildings at fair value 95,319 81,798 Provision for depreciation (14,783) (10,795)
Net book value 80,536 71,003 Movements Opening written down value 71,003 68,098
Additions through business combinations - 2,537 Additions 5,791 12,881 Disposals (663) (346) Transfer between categories 8,454 (8,743) Depreciation (4,294) (3,438) Effect of movements in foreign exchange 245 14
Closing written down value 80,536 71,003
LEASEHOLD IMPROVEMENTS
Leasehold improvements 9,984 9,145
Provision for depreciation (1,851) (1,530)
Net book value 8,133 7,615 Movements Opening written down value 7,615 6,297 Additions through business combinations 92 - Additions 679 1,782
Disposals (95) (40) Transfer between categories 300 - Depreciation (494) (457) Effect of movements in foreign exchange 36 33
Closing written down value 8,133 7,615
For
per
sona
l use
onl
y

Transpacific Annual Report 2010 67
CONSOLIDATED
NOTES 2010 $’000
2009 $’000
17. Property, Plant and Equipment (continued)
PLANT AND EQUIPMENT
Plant and equipment 1,095,530 948,312 Provision for depreciation (472,656) (362,686)
Net book value 622,874 585,626 Movements Opening written down value 585,626 549,236
Additions through business combinations 4,939 11,542 Additions 127,732 157,238 Disposals (7,258) (25,487) Impairment of assets - (2,093) Transfer between categories 40,919 5,130 Depreciation (129,754) (111,853)
Effect of movements in foreign exchange 670 1,913
Closing written down value 622,874 585,626 CAPITAL WORK IN PROGRESS
Balance at beginning of year 94,202 51,268 Transfer (45,347) - Net movement 15,778 42,934
Balance at end of year 64,633 94,202
TOTAL PROPERTY, PLANT AND EQUIPMENT
Property, plant and equipment 1,773,609 1,582,432 Provision for remediation (93,446) (91,105) Provision for depreciation (552,154) (411,420)
Net book value 1,128,009 1,079,907 Movements Opening written down value 1,079,907 965,233 Additions through business combinations 5,031 20,421 Additions 181,442 195,165 Net movement in capital WIP 15,778 42,934
Disposals (10,769) (26,196) Impairment of assets - (2,093) Transfer from landfill airspace 15,608 12,729 Depreciation (160,997) (131,880) Effect of movements in foreign exchange 2,009 3,594
Closing written down value 1,128,009 1,079,907
For
per
sona
l use
onl
y

68
Notes to the Financial Statements For the Financial Year Ended 30 June 2010 (continued)
17. Property, Plant and Equipment (continued)
VALUATIONS
On 30 June 2010, an independent valuation was obtained to determine the fair value of non-landfill land and buildings which was determined by reference to an open market basis, being the amount for which the assets could be exchanged between a knowledgeable willing buyer and a knowledgeable willing seller in an arms length transaction at the valuation date. The revaluations of land and buildings were based on independent assessments by a member of the Australian Property Institute. The 2010 valuations did not result in any significant revaluation increments or decrements and therefore no adjustment has been made to the carrying values at 30 June 2010.
Any revaluation surplus (net of tax) is credited to the asset revaluation reserve included in the equity section of the statement of financial position. Any revaluation deficit directly offsetting a previous surplus in the same asset is directly offset against the surplus in the asset revaluation reserve, otherwise it is charged to profit or loss. Revaluation movements (if any) are discussed in Note 24(G).
If land and buildings were measured using the cost model, the carrying amounts would be as follows:
CONSOLIDATED
NOTES 2010 $’000
2009 $’000
LAND (EXCLUDING LANDFILL) Cost 116,324 105,785 BUILDINGS Cost 97,919 84,337 Accumulated depreciation (16,138) (11,844)
Net carrying amount 81,781 72,493
LEASED PLANT AND EQUIPMENT
The carrying amount of plant and equipment held under finance lease and hire purchase contracts at 30 June 2010 is $158,581,000 (2009: $133,269,000). Leased assets and assets under hire purchase contracts are pledged as security for the related finance lease and hire purchase liabilities.
18. Intangible Assets
CONSOLIDATED
NOTES 2010 $’000
2009 $’000
GOODWILL
Goodwill at cost 2,158,501 2,150,730
Net book value 2,158,501 2,150,730
Movements
Opening written down value 2,150,730 2,002,294
Correction of prior period landfill airspace classification1 - 119,226
Additions through business combinations 2,038 36,988
Impairment of goodwill - (18,199)
Effect of movements in foreign exchange 5,733 10,421
Closing written down value 2,158,501 2,150,730 1 Mathematical misallocation between landfill airspace and goodwill (both within intangibles) disclosed in the 2008 financial year, that required
correction.
For
per
sona
l use
onl
y

Transpacific Annual Report 2010 69
CONSOLIDATED
18. Intangible Assets (continued) 2010 $’000
2009 $’000
LANDFILL AIRSPACE Landfill airspace at cost 133,622 149,230 Net book value 133,622 149,230 Movements Opening written down value 149,230 331,767 Correction of prior period landfill airspace classification to goodwill1 - (119,226) Reclassification of landfill licences2 - 74,728 Impairment of intangible - (125,310) Transfer to landfill land and cell development costs (15,608) (25,055) Correction to prior period transfer to landfill and cell development costs - 12,326 Closing written down value 133,622 149,230 PATENTS AND LICENCES Patents and licences at cost 2,389 2,389 Provision for amortisation (2,389) (2,150) Net book value - 239 Movements Opening written down value 239 75,397 Reclassification of licences associated with airspace - (74,728) Amortisation (239) (430) Closing written down value - 239 OTHER INTANGIBLES Other intangibles at cost 129,953 129,361 Provision for amortisation (9,211) (1,877) Net book value 120,742 127,484 Movements Opening written down value 127,484 132,787 Additions 577 - Amortisation (7,335) (633) Impairment of intangibles - (4,684) Effect of movement in foreign exchange 16 14 Closing written down value 120,742 127,484 TOTAL INTANGIBLES Intangibles at cost 2,424,465 2,431,710 Provision for amortisation (11,600) (4,027) Net book value 2,412,865 2,427,683 Movements Opening written down value 2,427,683 2,542,245 Acquisitions through business combinations 2,038 36,988 Additions 577 - Transfer to landfill land and cell development costs (15,608) (12,729) Amortisation (7,574) (1,063) Impairment of intangibles - (148,193) Effect of movement in foreign exchange 5,749 10,435 Closing written down value 2,412,865 2,427,683
1 See footnote 1 on prior page.
2 Landfill airspace and licences are both considered to be integral components of a landfill asset and as such have been combined with effect from 1 July 2008.
For
per
sona
l use
onl
y

70
Notes to the Financial Statements For the Financial Year Ended 30 June 2010 (continued)
18. Intangible Assets (continued)
Other intangibles include customer contracts valued at $40,423,000 (2009: $42,883,000) and brand names valued at $78,600,000 (2009: $78,600,000).
During the financial year ended 30 June 2010, all intangible assets were tested for impairment as required by AASB 136 ‘Impairment of Assets’. No impairment (2009: loss $153.7 million) was charged for the 2010 financial year.
The Group has multiple cash-generating units that were tested for impairment. The cash-generating units (“CGU”) with significant goodwill, indefinite life intangibles attributable to them and the growth rates (excluding inflation) assumed for impairment purposes are:
2010 2009
FUTURE GROWTH
RATE GOODWILL $’000
INDEFINITE LIFE
INTANGIBLES $’000
GOODWILL $’000
INDEFINITE LIFE
INTANGIBLES $’000
CASH-GENERATING UNIT Transpacific Industries Group (NZ) Ltd 2.00% 692,457 - 714,703 - Victoria Landfill Division 3.25% 65,993 - 66,047 -
Transpacific Cleanaway Pty Ltd 3.25% 1,161,852 78,600 1,123,811 78,600
1,920,302 78,600 1,904,561 78,600 There are no other individual CGUs with significant goodwill and intangibles attributable to them.
The recoverable amounts of the cash-generating units have been based on value-in-use calculations. These calculations use cash flow projections based on actual operating results and financial budgets approved by management. Cash flows are extrapolated over five years using a growth rate of between 0% and 3.25% (depending on CGU) per annum plus inflation of 2.75% per annum. The terminal values used in the value-in-use calculations are based on the same growth assumptions used in the cash flow projections. A post-tax nominal discount rate of 9.0% (2009: 9.21%) has been used in discounting the projected cash flows. Growth and discount rate assumptions are deemed appropriate as there are no intentions to dispose of any businesses.
All CGUs (excluding Victorian Landfill) have sufficient headroom and as such management believes that any reasonably possible change in the key assumptions on which recoverable amounts are based would not cause the carrying amount to materially exceed its recoverable amount.
In the prior year the Victorian Landfill Division recorded an impairment to restate its intangibles to recoverable amount. The impairment calculations were based on estimates around the present value of landfill land together with the uncertainty of the ultimate sell date. This resulted in no impairment for the 2010 financial year, however the division continues to have a carrying value equivalent to its recoverable amount. Any negative change in the underlying assumptions in the future would result in an impairment of this division.
19. Trade and Other Payables
NOTES CONSOLIDATED
CURRENT 2010 $’000
2009 $’000
Trade payables 95,799 124,898
Other payables and accruals 117,838 123,801 Payables to related parties and associates 31C 16 270
Deferred settlements 4,350 2,679
218,003 251,648
The Group’s exposure to currency and liquidity risk related to trade and other payables is disclosed in Note 33.
For
per
sona
l use
onl
y

Transpacific Annual Report 2010 71
CONSOLIDATED
NOTES 2010 $’000
2009 $’000
20. Borrowings
CURRENT UNSECURED Bank loans 4,663 1,824,999
US Private Placement notes - 184,228
6.75% Subordinated Convertible notes* - 267,883
Loans to related parties and associates 31C 7,131 8,601 Other 446 614 12,240 2,286,325 SECURED
Obligations under finance leases and hire purchase liabilities 29B 35,029 135,353 47,269 2,421,678
NON-CURRENT
UNSECURED Bank loans 1,067,850 30,685
US Private Placement notes 174,605 -
6.75% Subordinated Convertible notes* 275,434 -
Other 1,192 2,116
1,519,081 32,801 SECURED
Obligations under finance leases and hire purchase liabilities 29B 135,843 -
1,654,924 32,801
All borrowings are net of prepaid borrowing costs.
Within unsecured borrowings, the bank loans, US Private Placement and Convertible notes are currently in the process of having security granted over assets of the Group members who are party to these financing facilities.
* CONVERTIBLE NOTES
Opening balance 273,067 299,569
Reduction in principal on buyback - (24,564)
Amortisation 6,601 6,829
Profit on repurchase - (8,767)
Closing balance 279,668 273,067
For
per
sona
l use
onl
y

72
Notes to the Financial Statements For the Financial Year Ended 30 June 2010 (continued)
CONSOLIDATED
2010 $’000
2009 $’000
20. Borrowings (continued)
FINANCING FACILITIES
On 5 August 2009, the Company raised $801 million through the settlement of a placement of shares, Institutional Entitlement Offer, Institutional Entitlement Bookbuild, pre-funded Retail Entitlement Offer (the Equity Raising) and the issue of warrants.
The Equity Raising proceeds were used to repay $704 million of syndicated bank debt.
The existing $2,095 million syndicated debt facility was amended and restated as a $1,435 million facility through the repayment of $704 million, and the terms of the syndicated debt were extended into new four and five year tranches, with no syndicated debt refinancing required until July 2013.
The Group’s finance facilities are summarised below:
FACILITY AMOUNT Syndicated Facility Agreement 1,434,562 2,095,160 US Private Placement notes* 175,106 184,869
6.75% Subordinated Convertible notes 309,100 309,100
1,918,768 2,589,129
* This is translated at the spot rate at 30 June. Details of hedging are set out below.
Interest rates are variable under the Syndicated Facility Agreement. The Company manages its exposure to floating rate debt by economically hedging a proportion of its exposure with interest rate swaps.
The maturity profile for the US Private Placement notes is as follows:
PRINCIPAL AMOUNT AUD FIXED AMOUNT MATURITY DATE
USD87,000,000 AUD97,752,808 17 December 2012 CAD15,000,000 AUD17,510,580 17 December 2012 USD48,000,000 AUD53,932,584 17 December 2017
The US Private Placement and US denominated debt under the Syndicated Facility Agreement has been swapped to A$ fixed rate debt to mitigate the foreign currency risk exposure arising for these borrowings. The USPP lenders have the right to put the debt as at September 2012.
In December 2007, the Company issued subordinated convertible notes due 7 December 2014. The notes carry a coupon of 6.75% per annum and will, unless previously converted, be redeemed at their principal amount on maturity. The conversion price of the notes has been set at A$14.8648 per ordinary share, subject to adjustment in accordance with the conditions. The convertible noteholders have the right to request redemption in December 2012.
The Group and the Company can also borrow outside of the facilities detailed above.
DEBT FACILITIES Total facilities available 1,918,768 2,589,129
Facilities utilised at balance date (1,833,750) (2,544,252)
Facilities not utilised at balance date 85,018 44,877
Facilities used at balance date include $134.8 million (2009: $136.2 million) in guarantees and letters of credit which are not included in the statement of financial position. Refer Note 29.
For
per
sona
l use
onl
y

Transpacific Annual Report 2010 73
CONSOLIDATED
NOTES 2010 $’000
2009 $’000
21. Provisions
CURRENT
Provision for warranty Balance at beginning of year 5,382 5,657 Provisions acquired through business combinations 1,286 - Provisions made during the year 3,654 2,968 Provisions used during the year (3,985) (3,243)
Provisions reversed during the year (1,015) -
Balance at end of year 5,322 5,382 Provision – other Balance at beginning of year 11,693 2,135 Provisions made during the year 18,685 16,590 Provisions used during the year (14,142) (10,980)
Provisions reversed during the year (891) 3,948
Balance at end of year 15,345 11,693 Total current provisions Balance at beginning of year 17,075 7,792 Provisions acquired through business combinations 1,286 - Provisions made during the year 22,339 19,558
Provisions used during the year (18,127) (14,223) Provisions reversed during the year (1,906) 3,948
Balance at end of year 20,667 17,075 WARRANTIES
The provision for warranties relates mainly to the commercial vehicle division warranties for vehicles. The provision is based on estimates made from historical warranty data associated with similar services.
OTHER PROVISIONS
Included in other provisions is an amount of $4.2 million (2009: $2.6 million) in relation to workers compensation self-insurance of the Group in Australia under the Comcare scheme. The workers compensation self-insurance provision is reassessed annually in consultation with actuarial advice.
22. Other Liabilities
CONSOLIDATED
NOTES 2010 $’000
2009 $’000
Deferred income 19,659 20,314 19,659 20,314 F
or p
erso
nal u
se o
nly

74
Notes to the Financial Statements For the Financial Year Ended 30 June 2010 (continued)
23. Share Based Payments
The Company operates an Executive Share Option Plan (“the Option Plan”) approved by shareholders of the Company in March 2005. Under the option plan the Board of Directors may issue options to Non-Executive Directors and Executives of the Company. The Board determines the price, number, exercise price, expiry date and relevant performance hurdles of options to be issued. There are no voting or dividend rights attached to the options.
Upon exercise of the options and payment of the exercise price, the Executives are allotted one fully paid ordinary share in the Company for each option held.
On termination of employment of a participant, generally the option lapses. In certain circumstances, the Board may elect to allow the terminating participant to retain their options.
No options were issued during the reporting period.
New incentive schemes were introduced to replace the Option Plan during the year.
The following option arrangements were in existence during the current and comparative reporting periods:
DATE GRANTED FIRST EXERCISE DATE ON OR AFTER EXPIRY DATE
EXERCISE PRICE
NUMBER UNDER OPTION
2010
NUMBER UNDER
OPTION 2009
OPTIONS (1) 3 May 2005 31 August 2006 31 July 2009 $2.40 - 70,000 (2) 8 November 2005 31 August 2006 31 July 2009 $4.26 - 100,000 (3) 17 February 2006 31 August 2007 31 July 2010 $5.40 333,334 333,334 (4) 24 April 2006 31 August 2007 31 July 2010 $8.53 450,000 708,334
(5) 13 September 2006 31 August 2007 31 July 2010 $7.25 386,667 720,001 (6) 20 September 2006 31 August 2007 31 July 2010 $7.28 175,000 283,333 (7) 23 October 2006 31 August 2007 31 July 2010 $8.20 40,000 40,000 (8) 10 November 2006 31 August 2008 31 July 2010 $8.09 50,000 50,000 (9) 14 December 2006 31 August 2008 31 July 2010 $8.81 53,334 53,334 (10) 12 March 2007 31 August 2008 31 July 2011 $9.98 695,000 1,295,000
(11) 12 March 2007 31 August 2008 31 July 2010 $9.98 900,000 1,200,000 (12) 3 May 2007 31 August 2008 31 July 2011 $12.51 50,000 175,000 (13) 16 May 2007 31 August 2008 31 July 2011 $13.06 885,000 1,150,000 (14) 22 October 2007 31 August 2008 31 July 2011 $11.15 145,000 145,000 (15) 11 February 2008 31 August 2009 31 July 2011 $7.96 911,500 1,005,000 (16) 23 September 2008 31 August 2009 31 July 2012 $6.13 200,000 400,000
(17) 6 November 2008 31 August 2009 31 July 2012 $3.55 830,000 1,150,000
Options issued under the Option Plan are exercisable in two or three equal tranches and will vest when the exercise conditions have been met up to the expiry date. Seventy five per cent of each tranche of options vest if total shareholder return (TPI share price increment over share price at grant date plus dividends paid) totals at least 15% per annum on a cumulative basis. Twenty five per cent of each tranche of options vest if the volume weighted average price of TPI shares has outperformed the S&P/ASX 200 (less financials) by 5% on a cumulative basis. The fair value of the options are estimated at the date of grant using the binominal model incorporating a Monte-Carlo simulation. The fair value of the options range from $0.02 cents to $2.23.
The majority of options expense in relation to these options are in prior periods based on the contractual life.
For
per
sona
l use
onl
y

Transpacific Annual Report 2010 75
23. Share Based Payments (continued)
On 1 June 2010 the Group issued performance rights attached to a long term incentive plan and an Executive Engagement Award. The Long Term Incentive Plan (“LTIP”) and the Executive Engagement Award (“EEA”) are exercisable in one tranche if certain performance standards are met.
The LTIP performance standards are measured by the Company achieving a total shareholder return (TSR) ranking of equal to or greater than the 50th percentile TSR of the S&P/ASX 200 Industrial Sector Index (excluding companies involved in resources or mining) and the Group achieves certain earnings per share growth targets.
The performance rights attached to the EEA will vest upon the condition that the participant is employed at vesting date and at various percentages based on the Company ordinary share price at that date.
DATE GRANTED FIRST EXERCISE DATE ON OR AFTER EXPIRY DATE
NUMBER GRANTED
2010
NUMBER GRANTED
2009
PERFORMANCE RIGHTS
(1) 1 June 2010 Release of results for year ending 30 June 2012
Six months following exercise date 2,613,063 -
(2) 1 June 2010 30 June 2015 Six months following
exercise date 9,945,265 -
The number and weighted average exercise prices of share options and performance rights are as follows:
WEIGHTED AVERAGE EXERCISE
PRICE 2010
NUMBER OF SHARE
OPPORTUNITIES 2010
WEIGHTED AVERAGE EXERCISE
PRICE 2009
NUMBER OF SHARE
OPPORTUNITIES 2009
Outstanding at the beginning of the period $8.96 8,878,336 $6.77 9,465,122 Granted during the period $1.47 12,558,328 $4.22 1,550,000 Exercised during the period (i) - - $2.40 (2,136,786) Cancelled/lapsed during the period (2,773,501) -
Outstanding at the end of the period (ii) 18,663,163 8,878,336 - Options 6,104,835 8,878,336 - Performance rights 12,558,328 -
Exercisable at the end of the period $8.81 3,918,836 $8.96 2,842,666
(i) Exercised during the financial year
No options were exercised during the period.
(ii) Balance at end of the financial year
The options outstanding at 30 June 2010 have an exercise price in the range of $3.55 to $13.06 (2009: $2.40 to $13.06) and a weighted average contractual life of 2.1 years (2009: 2.0 years). Total share-based payment expense included in the statement of comprehensive income is set out in Note 24(G).
The performance rights granted during the year were fair valued by an external party using a Monte-Carlo simulation. The following table sets out the assumptions made in determining the value of these options:
LTIP 2,613,063
01/06/10
EEA 9,945,265 01/06/10
Vesting period August 2010 June 2015
Measurement period (years) 2.1 5.08
Risk free interest rate (%) 4.92% 5.38%
Volatility (%) 68.34% 54.94%
Fair value $0.89 $1.34
For
per
sona
l use
onl
y

76
Notes to the Financial Statements For the Financial Year Ended 30 June 2010 (continued)
24. Equity
(A) ISSUED CAPITAL
CONSOLIDATED
2010 $’000
2009 $’000
Ordinary shares - issued and fully paid 1,770,058 1,041,383 Convertible notes equity component 51,588 51,588
1,821,646 1,092,971
(B) MOVEMENTS IN ORDINARY SHARES
2010 2009
NUMBER
OF SHARES $’000 NUMBER
OF SHARES $’000
Balance at the beginning of the year 310,981,126 1,041,383 287,219,707 919,450 Issued during the financial year: - shares issued for business acquisitions - - 4,651,690 30,802 - shares issued for equity raising 649,657,609 750,217 - - - dividend reinvestment plan and underwrite agreement - - 8,297,105 49,440
- convertible bond repurchase - - 1,725,838 6,601 - exercise of share options - - 6,950,000 22,203 - exercise of employee share options - - 2,136,786 13,529 - transaction costs - (21,542) - (642)
BALANCE AT THE END OF THE YEAR 960,638,735 1,770,058 310,981,126 1,041,383
Ordinary shares participate in dividends and the proceeds on winding up of the Company in proportion to the number of shares held. Ordinary shares entitle their holder to one vote, either in person or by proxy, at a meeting of the Company. Ordinary shares have no par value.
(C) MOVEMENTS IN STEP-UP PREFERENCE SECURITIES
2010 2009
NUMBER
OF UNITS $’000 NUMBER
OF UNITS $’000
Balance at the beginning of the year 2,500,000 249,846 2,500,000 249,846 Issued during the financial year: - transaction costs - - - -
BALANCE AT THE END OF THE YEAR 2,500,000 249,846 2,500,000 249,846
The Group issued Step-up Preference Securities (SPS) via a prospectus dated 4 July 2006.
The rights of SPS holders to payments rank ahead of ordinary shareholders and have no fixed repayment date.
Distributions on the SPS are discretionary, payable semi-annually, non-cumulative and payable on the 180 day bank bill swap reference rate plus a margin of 3.5% per annum. Distributions are expected to be fully franked.
For
per
sona
l use
onl
y
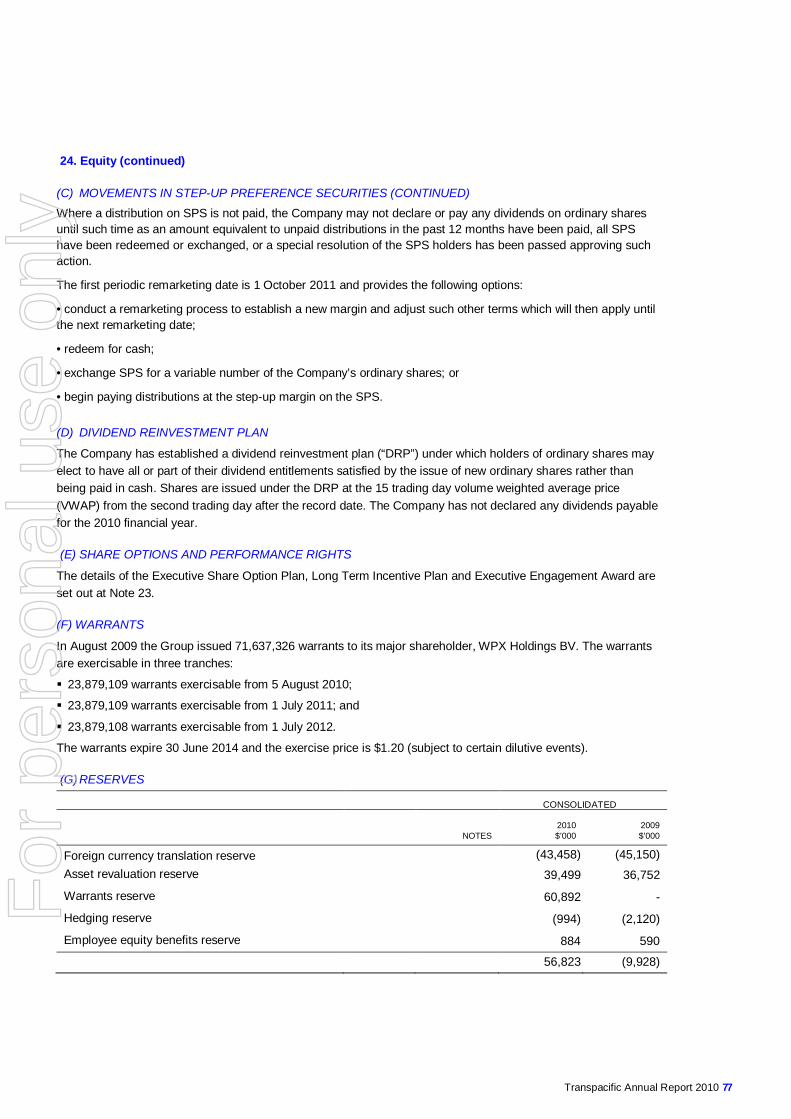
Transpacific Annual Report 2010 77
24. Equity (continued)
(C) MOVEMENTS IN STEP-UP PREFERENCE SECURITIES (CONTINUED)
Where a distribution on SPS is not paid, the Company may not declare or pay any dividends on ordinary shares until such time as an amount equivalent to unpaid distributions in the past 12 months have been paid, all SPS have been redeemed or exchanged, or a special resolution of the SPS holders has been passed approving such action.
The first periodic remarketing date is 1 October 2011 and provides the following options:
• conduct a remarketing process to establish a new margin and adjust such other terms which will then apply until the next remarketing date;
• redeem for cash;
• exchange SPS for a variable number of the Company’s ordinary shares; or
• begin paying distributions at the step-up margin on the SPS.
(D) DIVIDEND REINVESTMENT PLAN
The Company has established a dividend reinvestment plan (“DRP”) under which holders of ordinary shares may elect to have all or part of their dividend entitlements satisfied by the issue of new ordinary shares rather than being paid in cash. Shares are issued under the DRP at the 15 trading day volume weighted average price (VWAP) from the second trading day after the record date. The Company has not declared any dividends payable for the 2010 financial year.
(E) SHARE OPTIONS AND PERFORMANCE RIGHTS
The details of the Executive Share Option Plan, Long Term Incentive Plan and Executive Engagement Award are set out at Note 23.
(F) WARRANTS
In August 2009 the Group issued 71,637,326 warrants to its major shareholder, WPX Holdings BV. The warrants are exercisable in three tranches:
23,879,109 warrants exercisable from 5 August 2010;
23,879,109 warrants exercisable from 1 July 2011; and
23,879,108 warrants exercisable from 1 July 2012.
The warrants expire 30 June 2014 and the exercise price is $1.20 (subject to certain dilutive events).
(G) RESERVES
CONSOLIDATED
NOTES 2010 $’000
2009 $’000
Foreign currency translation reserve (43,458) (45,150) Asset revaluation reserve 39,499 36,752
Warrants reserve 60,892 -
Hedging reserve (994) (2,120)
Employee equity benefits reserve 884 590
56,823 (9,928)
For
per
sona
l use
onl
y

78
Notes to the Financial Statements For the Financial Year Ended 30 June 2010 (continued)
CONSOLIDATED
NOTES 2010 $’000
2009 $’000
24. Equity (continued)
(G) RESERVES (CONTINUED) Foreign Currency Translation Reserve
Nature and purpose of reserve
The foreign currency translation reserve is used to record differences arising from the translation of the financial statements of foreign subsidiaries. It is also used to record the net investment hedged in these securities.
Movements
Foreign currency translation reserve: Opening balance (45,150) (56,464)
Exchange differences taken to equity 1,692 11,314
CLOSING BALANCE (43,458) (45,150) Asset Revaluation Reserve
Nature and purpose of reserve
The asset revaluation reserve is used to record revaluations of non-current assets (including non landfill land and buildings and listed company investments).
Movements
Asset revaluation reserve: Opening balance 36,752 33,048
Revaluation of available-for-sale assets 2,747 3,704
CLOSING BALANCE 39,499 36,752 Warrants Reserve
Nature and purpose of reserve
The warrants reserve is used to record revaluations of warrants issued on recapitalisation.
Movements
Warrants reserve: Opening balance - -
Warrants issued 50,863 -
Revaluation* 10,029 -
CLOSING BALANCE 60,892 - * Revaluation was at the date that the cash settlement option of the warrants was removed.
For
per
sona
l use
onl
y

Transpacific Annual Report 2010 79
CONSOLIDATED
NOTES 2010 $’000
2009 $’000
24. Equity (continued)
(G) RESERVES (CONTINUED) Hedging Reserve
Nature and purpose of reserve
The hedging reserve comprises the effective portion of the cumulative net change in the fair value of cash flow
hedging instruments related to hedge transactions that have not yet occurred.
Movements
Hedging reserve: Opening balance (2,120) 7,038
Transfer to net profit - (8,951)
Net gain/(loss) taken to equity 1,126 (207)
CLOSING BALANCE (994) (2,120) Employee Equity Benefits Reserve
Nature and purpose of reserve
The employee equity benefits reserve is used to record the value of equity benefits provided to employees and
Directors as part of their remuneration. Refer to Note 23 for further details of these plans.
Movements
Employee equity benefits reserve: Opening balance 590 6,371
Share based payment expense 294 2,619 Transfer to issued capital - (8,400) CLOSING BALANCE 884 590
(H) DIVIDENDS AND DISTRIBUTIONS
2010 2009
AMOUNT PER
SHARE/UNIT TOTAL $’000 AMOUNT PER
SHARE/UNIT TOTAL $’000
Ordinary shares
Interim dividend: fully franked at 30% tax rate - - - -
Final dividend: fully franked at 30% tax rate - - 10.1c 29,621
TOTAL DIVIDENDS PAID - 29,621
Step-up Preference Securities
Distribution period ended 30 September: fully franked at 30% tax rate $2.31 5,775 $4.02 10,050
Distribution period ended 31 March: fully franked at 30% tax rate $2.54 6,350 $3.60 9,000
TOTAL DISTRIBUTION PAID 12,125 19,050
For
per
sona
l use
onl
y

80
Notes to the Financial Statements For the Financial Year Ended 30 June 2010 (continued)
24. Equity (continued)
(H)DIVIDENDS AND DISTRIBUTIONS (CONTINUED)
After the reporting date the following distribution was proposed by the Directors. The distribution has not been provided for. The declaration and subsequent payment of the distribution has no income tax consequences.
2010 2009
AMOUNT PER
SHARE/UNIT TOTAL $’000 AMOUNT PER
SHARE/UNIT TOTAL $’000
Proposed for :
Step-up preference securities
Distribution period ended 30 September: fully franked at 30% tax rate $2.87 7,175 $2.31 5,775
(I) FRANKING CREDIT BALANCE
CONSOLIDATED
2010 $’000
2009 $’000
30% franking credits available to shareholders of Transpacific Industries Group Ltd for subsequent financial years 62,797 43,226
The above available amounts are based on the balance of the franking account at year end, adjusted for:
(a) franking credits that will arise from the payment of current tax liabilities;
(b) franking debits that will arise from the payment of dividends recognised as a liability at the year end;
(c) franking credits that will arise from the receipt of dividends recognised as receivables by the tax consolidated group at the year end; and
(d) franking credits that the entity may be prevented from distributing in subsequent years.
(J) RETAINED EARNINGS
Retained profits at beginning of year 5,779 272,806
Net profit attributable to members of the parent entity 71,161 (218,356)
Dividends paid – ordinary shares - (29,621)
Distributions paid – Step-up Preference Securities (12,125) (19,050)
Retained profits at end of year 64,815 5,779
(K) NON-CONTROLLING INTEREST
Contributed equity 7,771 15,696
Retained profits 1,693 1,970
9,464 17,666
For
per
sona
l use
onl
y

Transpacific Annual Report 2010 81
25. Consolidated Entities
The consolidated financial statements incorporate the assets, liabilities and results of the following subsidiaries: INTEREST HELD BY GROUP
ENTITY COUNTRY OF INCORPORATION 2010
% 2009
%
Transpacific Industries Group Ltd – parent Australia
Transpacific Innovations Pty Ltd Australia 100 100
Transpacific Co Pty Ltd* Australia 100 100
Transpacific Resources Pty Ltd* Australia 100 100
Transpacific Industries Group Finance (NZ) Ltd New Zealand 100 100
Transpacific Industries Group (NZ) Ltd New Zealand 100 100
Western Star Trucks Australia Pty Ltd* Australia 100 100
Man Automotive Imports Pty Ltd* Australia 100 100
Man Imports Pty Ltd Australia 100 100
MAN Automotive Imports (NZ) Ltd New Zealand 100 100
Western Star Truck Centre Trust Australia 100 50
Transpacific Industries Pty Ltd* Australia 100 100
Australian Resource Recovery Pty Ltd Australia 100 100
Associated Oils Pty Ltd Australia 100 100
Environmental Recovery Services Pty Ltd* Australia 100 100
ERS Australia Pty Ltd* Australia 100 100
Transpacific Oil Pty Ltd Australia 100 100
Transpacific Energy Pty Ltd Australia 100 100
Kleenparts Pty Ltd Australia 100 100
ERS New Zealand Ltd New Zealand 100 100
Time (NZ) Ltd New Zealand 100 100
Transpacific Technical Services (NZ) Ltd New Zealand 100 100
Healthcare Waste Ltd New Zealand 100 100
ERS Singapore Pte Ltd Singapore 100 100
ERS Taiwan Ltd Taiwan 100 100
Transpacific Industrial Solutions (NZ) Ltd New Zealand 100 100
Transpacific Group (NZ) Ltd New Zealand 100 100
Australian Terminal Services Pty Ltd
Australia 100 100
ATS Developments Pty Ltd Australia 100 100
NQ Resource Recovery Pty Ltd* Australia 100 100
Nationwide Oil Pty Ltd* Australia 100 100
Oil & Fuel Salvaging (Qld) Pty Ltd Australia 100 100
Transpacific Refiners Pty Ltd (i) Australia 50 50
Transpacific Bituminous Products Pty Ltd Australia 100 100
Transpacific Industrial Solutions Pty Ltd * Australia 100 100
Transpacific Paramount Services Pty Ltd Australia 100 100
ACN 122 808 324 Pty Ltd Australia 100 100
Transpacific Holdings Limited Pty Ltd Australia 100 100
Transpacific Waste Management Pty Ltd* Australia 100 100
Rubus Holdings Pty Ltd* Australia 100 100
Rubus Intermediate Two Pty Ltd* Australia 100 100
Transpacific Cleanaway Holdings Pty Ltd* Australia 100 100
For
per
sona
l use
onl
y

82
Notes to the Financial Statements For the Financial Year Ended 30 June 2010 (continued)
25. Consolidated Entities (continued)
INTEREST HELD BY GROUP
ENTITY COUNTRY OF INCORPORATION 2010
% 2009
%
Rubus Intermediate One Pty Ltd* Australia 100 100
Transpacific Cleanaway Pty Ltd* Australia 100 100
Getabin Pty Ltd Australia 100 100
Transpacific Guilfoyle Pty Ltd Australia 100 100
Transpacific Ventures Pty Ltd Australia 100 100
Transpacific Baxter Pty Ltd* Australia 100 100
Baxter Business Pty Ltd* Australia 100 100
A J Baxter Pty Ltd
Australia 100 100
Baxter Recyclers Pty Ltd Australia 100 100
Max T Pty Ltd Australia 100 100
Clarinda Landfill Pty Ltd Australia 100 100
Ashrye Pty Ltd Australia 100 100
Waste Management Pacific Pty Ltd* Australia 100 100
Waste Management Pacific (SA) Pty Ltd Australia 100 100
Transwaste Technologies Pty Ltd * Australia 100 100
Transwaste Technologies (1) Pty Ltd Australia 100 100
Australian Pollution Engineering Pty Ltd Australia 100 100
Solidsep Pty Ltd Australia 100 100
Transpacific Superior Pak Pty Ltd * Australia 100 100
Superior Pak NZ New Zealand 100 -
Mann Waste Management Pty Ltd Australia 100 100
Transpacific All-Brite Ltd New Zealand 100 100
Transpacific Environmental Services Pty Ltd Australia 51 51
QORS Pty Ltd Australia 100 100
Olmway Pty Ltd (i) Australia 50 50
L V Rawlinson & Associates Pty Ltd Australia 100 100
Transpacific Biofuels Pty Ltd(i) Australia 50 50
Transpacific Manufacturing Systems P/L Australia 100 100
Canterbury Waste Services Ltd New Zealand 100 100
Transwaste Canterbury Pty Ltd New Zealand 50 50
Tiromoana Station Limited New Zealand 100 100
Enviroguard Pty Ltd * Australia 100 100
Transpacific Resource Recycling Pty Ltd Australia 100 75
Transpacific Recycling Pty Ltd Australia 100 100
Transpacific Hygiene Pty Ltd Australia 70 70
Transpacific SPS Trust Australia 100 100
(i) Wholly-owned subsidiaries of the Company have management control and the casting vote of Transpacific Refiners Pty Ltd, Olmway Pty Ltd,
and Transpacific Biofuels Pty Ltd and thus the Company has the capacity to dominate decision making in relation to the financial and operating
policies so as to enable those entities to operate as part of the Group in pursuing its objectives.
* These wholly owned subsidiaries have entered into a deed of cross guarantee with Transpacific Industries Group Ltd on 29 June 2007 pursuant
to ASIC Class Order 98/1418 and are relieved from the requirement to prepare and lodge an audited financial report.
For
per
sona
l use
onl
y

Transpacific Annual Report 2010 83
25. Consolidated Entities (continued)
The consolidated statement of comprehensive income and statement of financial position of the entities who are a party to the deed of cross guarantee are:
STATEMENT OF COMPREHENSIVE INCOME 2010 $’000
2009 $’000
Revenue from continuing activities 1,639,762 1,791,382 Other income 45,923 85,251
Cost of sales (629,017) (674,142) Employee expenses (435,925) (436,532) Depreciation and amortisation expenses (124,807) (112,189) Net finance costs (126,817) (152,932) Repairs and maintenance (76,494) (69,309) Fuel purchases (49,249) (55,163)
Leasing charges (23,390) (19,588) Freight costs (12,904) (12,882) Other expenses (144,199) (413,125) Mark to market 11,695 (86,130) Share of net profits of associates accounted for using the equity method (34) 684
Profit/(loss) before income tax 74,544 (154,675)
Income tax expense/(benefit) (33,918) 35,806
Profit/(loss) from continuing operations 40,626 (118,869)
Other Comprehensive Income
Cash flow hedges Net gain/(loss) taken to equity 1,332 (1,993)
Translation of foreign operations Exchange differences taken to equity - - Revaluations of assets Revaluation of available-for-sale assets - -
Net income/(loss) recognised directly in equity 1,332 (1,993)
Profit/(loss) from continuing operations 41,958 (120,862)
For
per
sona
l use
onl
y

84
Notes to the Financial Statements For the Financial Year Ended 30 June 2010 (continued)
25. Consolidated Entities (continued)
STATEMENT OF FINANCIAL POSITION 2010 $’000
2009 $’000
ASSETS Cash and cash equivalents 106,846 48,753 Trade and other receivables 601,844 334,083 Current tax assets 9,739 - Inventories 105,082 115,031 Other assets 14,142 13,566 TOTAL CURRENT ASSETS 837,653 511,433
Investments accounted for using the equity method 12,053 6,354
Investments 584,906 554,801 Property, plant and equipment 756,919 693,347 Intangible assets 1,547,726 1,604,659 Deferred tax assets 48,352 65,423 TOTAL NON-CURRENT ASSETS 2,949,956 2,924,584 TOTAL ASSETS 3,787,609 3,436,017 LIABILITIES Trade and other payables 203,202 228,865 Interest-bearing loans and borrowings 21,565 2,118,594 Income tax payable - 870 Employee entitlements 36,191 31,587
Provisions 27,482 25,917 Other 35,991 24,306 TOTAL CURRENT LIABILITIES 324,431 2,430,139 Interest-bearing loans and borrowings 1,629,646 - Deferred tax liabilities 3,989 11,191 Employee entitlements 9,058 7,600 TOTAL NON-CURRENT LIABILITIES 1,642,693 18,791 TOTAL LIABILITIES 1,967,124 2,448,930 NET ASSETS 1,820,485 987,087 EQUITY Issued capital 1,821,646 1,092,971 Reserves 89,944 26,852
Retained earnings (91,105) (132,736) TOTAL EQUITY 1,820,485 987,087
For
per
sona
l use
onl
y

Transpacific Annual Report 2010 85
26. Investments Accounted for Using the Equity Method
(A) DETAILS OF INTERESTS IN ASSOCIATES ARE AS FOLLOWS:
OWNERSHIP INTEREST
CARRYING VALUE OF INVESTMENT
ENTITY COUNTRY REPORTING
DATE 2010
% 2009
% 2010 $’000
2009 $’000
Truck and bus dealership:
Western Star Truck Centre Trust(1) Australia 30 June 100 50 N/A (1,886)
Liquid waste management:
Total Waste Management Pty Ltd Australia 31 December 50 50 5,203 5,257
Western Resource Recovery Pty Ltd Australia 31 December 50 50 6,210 5,173
Solid waste management:
Otago Southland Waste Services Ltd New
Zealand 30 June 50 50 675 808
Living Earth Ltd New
Zealand 30 June 50 50 1,887 2,106
Midwest Disposals Ltd New
Zealand 30 June 50 50 2,373 2,673
Pikes Point Transfer Station Ltd New
Zealand 30 June 50 50 943 993
Superior Pak Ltd(2) New
Zealand 30 June 100 50 N/A 1,143
Wellington Waste Disposal Pty Ltd Australia 30 June 50 50 - -
Wonthaggi Recyclers Pty Ltd Australia 30 June 50 50 1,695 1,829
Earthpower Technologies Sydney Pty Ltd Australia 30 June 50 50 (17) -
Oil Stream Partners Pty Ltd Australia 30 June - 50 - -
ERS Co Pty Ltd Australia 30 June 50 50 18 -
18,987 18,096
(1) Ownership interest increased to 100% on 1 July 2009. The entity is now consolidated rather than equity accounted for. (2) Ownership interest increased to 100% on 26 February 2010. The entity is now consolidated rather than equity accounted for.
The reporting dates for those entities noted as at 31 December is a result of that being the reporting date of the other 50% shareholder.
For
per
sona
l use
onl
y
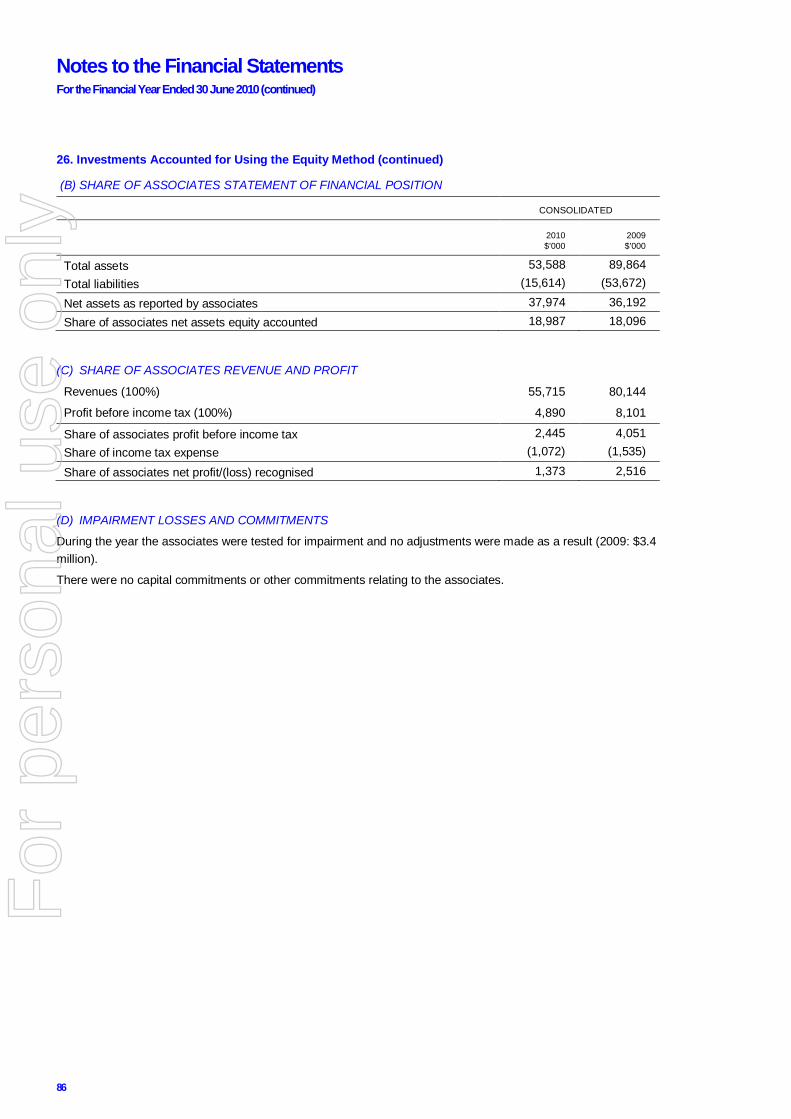
86
Notes to the Financial Statements For the Financial Year Ended 30 June 2010 (continued)
26. Investments Accounted for Using the Equity Method (continued)
(B) SHARE OF ASSOCIATES STATEMENT OF FINANCIAL POSITION
CONSOLIDATED
2010 $’000
2009 $’000
Total assets 53,588 89,864 Total liabilities (15,614) (53,672)
Net assets as reported by associates 37,974 36,192 Share of associates net assets equity accounted 18,987 18,096
(C) SHARE OF ASSOCIATES REVENUE AND PROFIT
Revenues (100%) 55,715 80,144
Profit before income tax (100%) 4,890 8,101
Share of associates profit before income tax 2,445 4,051 Share of income tax expense (1,072) (1,535)
Share of associates net profit/(loss) recognised 1,373 2,516
(D) IMPAIRMENT LOSSES AND COMMITMENTS
During the year the associates were tested for impairment and no adjustments were made as a result (2009: $3.4 million).
There were no capital commitments or other commitments relating to the associates.
For
per
sona
l use
onl
y

Transpacific Annual Report 2010 87
CONSOLIDATED
2010 $’000
2009 $’000
27. Reconciliation of Cash Flows from Operating Activities
Cash flows from operating activities
Profit/(loss) for the period 72,736 (216,107) ADJUSTMENTS FOR: Share options expensed 294 2,619 Other non-cash items 6,651 76,375 Impairment on available-for-sale financial assets - 52,505
Impairment on intangible assets - 153,682
Change in fair value of derivative financial instruments (15,207) 53,465
Change in fair value of warrants 10,029 - Gain on acquisition of business (1,021) - Gain on sale of business (1,000) (947)
Depreciation 162,829 140,213 Amortisation 5,742 3,614 Share of associates’ net profits (1,373) (2,516) Distribution received - 710
Net (gain)/loss on disposal of property, plant and equipment (310) (3,408)
Net cash flow from operating activities before changes in assets and liabilities 239,370 260,205 CHANGES IN ASSETS AND LIABILITIES ADJUSTED FOR EFFECTS
(Increase)/decrease in receivables 43,227 8,460
(Increase)/decrease in other assets 23,154 (382) (Increase)/decrease in inventories 23,924 15,408 Increase/(decrease) in payables (46,706) (47,484) Increase/(decrease) in income tax payable (9,249) (11,842) Increase/(decrease) in deferred taxes 11,756 (14,994) Increase/(decrease) in other liabilities (838) (4,333)
Increase/(decrease) in other provisions 5,200 (3,407)
NET CASH FROM/(USED IN) OPERATING ACTIVITIES 289,838 201,631
During the 2010 financial year the Group acquired plant and equipment with an aggregate fair value of $57,102,000 (2009: $70,433,000) by means of finance lease. These acquisitions are not reflected in the statement of cash flows.
During the year ended 30 June 2010 nil (2009: 6,378,000) ordinary shares were issued at no value (2009: $37,403,000) as part settlement for acquisitions. These share issues are not reflected in the statement of cash flows as they were not cash flows.
For
per
sona
l use
onl
y

88
Notes to the Financial Statements For the Financial Year Ended 30 June 2010 (continued)
28. Business Combinations
Throughout the year the Group has acquired a number of businesses which are individually immaterial.
The aggregated fair value of the identifiable assets and liabilities of these entities as at their dates of acquisition are:
CONSOLIDATED
RECOGNISED ON ACQUISITION
$’000
CARRYING VALUE
$’000
Cash and cash equivalents 1,276 1,276
Inventories 30,239 30,239 Other current assets 5,273 5,273 Property, plant and equipment 4,770 4,770 Investment in associates (165) (165)
41,393 41,393 Trade creditors (30,287) (30,287) Employee entitlements (1,972) (1,972) Other provisions (7,251) (7,251)
(39,510) (39,510) Fair value of net assets 1,883 1,883 Profit arising on acquisition (1,021) Non-controlling interest acquired 8,621
Goodwill arising on acquisition 2,038
11,521 Consideration:
Shares issued, at fair value - Acquisition price paid 11,521
Total consideration paid 11,521 The cash outflow on acquisition is as follows: Net cash acquired with the business 1,276 Purchase price and associated costs (11,521) Deferred settlement 4,600
(5,645)
Included in the goodwill recognised on all of the business combinations detailed above are certain intangible assets that cannot be individually separated and reliably measured from the acquirees due to their nature.
No ordinary shares were issued as part settlement of these business combinations and deferred settlements.
The Group has a history of extracting synergies from acquisitions, and as such it is impracticable to measure the contribution these business combinations would have made to profit of the Group had they been held for the full year. However, the contributions made from acquisition date to year end amounted to $2,819,000 EBITDA.
For
per
sona
l use
onl
y

Transpacific Annual Report 2010 89
CONSOLIDATED
NOTES 2010 $’000
2009 $’000
29. Commitments and Contingencies
(A) OPERATING LEASE COMMITMENTS
The Group leases property, plant and equipment under operating leases expiring over terms of up to ten years. Leases generally provide the Group with a right of renewal at which time all terms are renegotiated.
Non-cancellable operating lease rentals are payable as follows:
Within one year 37,402 26,433 Between one and five years 96,177 63,636 More than five years 48,215 42,611
181,794 132,680
(B) FINANCE LEASE AND HIRE PURCHASE COMMITMENTS
The Group leases plant and equipment under finance leases and hire purchase agreements expiring over terms of up to seven years. At the end of the lease term the Group generally has the option to purchase the equipment at a percentage of market value.
Commitments in relation to finance leases are payable as follows:
Within one year 47,458 163,888
Between one and five years 123,044 - More than five years 38,185 -
Minimum lease payments 208,687 163,888 Less: Future finance charges (37,815) (28,535) TOTAL LIABILITIES 170,872 135,353
Representing: Current 20 35,029 135,353 Non-current 20 135,843 - TOTAL LIABILITIES 170,872 135,353
All commitments were classified as payable within one year at 30 June 2009 due to a breach of the debt covenants which was not waived until after the 30 June 2009 balance date.
(C) CAPITAL EXPENDITURE AND OTHER COMMITMENTS
Commitments in relation to capital expenditure and purchase commitments entered into:
Within one year 68,343 57,151 Other - 3,257 COMMITMENTS NOT RECOGNISED IN THE FINANCIAL STATEMENTS 68,343 60,408
For
per
sona
l use
onl
y

90
Notes to the Financial Statements For the Financial Year Ended 30 June 2010 (continued)
CONSOLIDATED
NOTES 2010 $’000
2009 $’000
29. Commitments and Contingencies (continued)
(D) GUARANTEES
The Group is, in the normal course of business, required to provide guarantees and letters of credit on behalf of controlled entities and associates in respect of their contractual performance related obligations. These guarantees and indemnities only give rise to a liability where the entity concerned fails to perform its contractual obligations.
Letters of credit issued to suppliers 2,750 4,307
Bank guarantees outstanding at balance date in respect of financing facilities 12,075 12,717
Bank guarantees outstanding at balance date in respect of contractual performance 119,941 119,130
134,766 136,154
(E) CONTINGENT LIABILITIES
The Directors are of the opinion that there are no contingent liabilities relating to current or threatened litigation or other matters that require disclosure in the financial report.
30. Auditor’s Remuneration
CONSOLIDATED
2010
2009
1. Audit services:
Ernst & Young 1,086,000 -
Bentleys Brisbane Partnership 97,875 891,407
Overseas auditor’s associated with Bentleys - 225,000
Total audit services 1,183,875 1,116,407 2. Non-audit services: Due diligence services:
Ernst & Young 612,335 -
Bentleys Brisbane Partnership and Bentleys (Qld) Pty Ltd - 23,379
Other:
Bentleys Brisbane Partnership and Bentleys (Qld) Pty Ltd 5,363 40,465
617,698 63,844 Taxation services:
Ernst & Young 13,200 -
Bentleys (Qld) Pty Ltd 25,680 251,498 Overseas auditor’s associated with Bentleys 10,800 8,921
49,680 260,419
Total non-audit services 667,378 324,263
For
per
sona
l use
onl
y

Transpacific Annual Report 2010 91
31. Related Parties
(A) KEY MANAGEMENT PERSONNEL
Disclosures relating to key management personnel are set out in Note 35.
(B) WHOLLY-OWNED GROUP TRANSACTIONS
The wholly-owned Group consists of Transpacific Industries Group Ltd and its wholly-owned entities listed at Note 25.
Transactions between Transpacific Industries Group Ltd and other entities in the wholly-owned Group during the years ended 30 June 2010 and 30 June 2009 consisted of:
(a) loans advanced by Transpacific Industries Group Ltd and other wholly-owned entities;
(b) loans repaid to Transpacific Industries Group Ltd and other wholly-owned entities;
(c) the payment of interest on the above loans;
(d) the payment of dividends to Transpacific Industries Group Ltd and other wholly-owned entities;
(e) management fees charged to wholly-owned entities; and
(f) sales between wholly-owned entities.
The above transactions are all eliminated on consolidation.
(C) OTHER RELATED PARTIES
CONSOLIDATED
2010 $’000
2009 $’000
Aggregate amounts included in the determination of profit before tax that resulted from transactions with each class of other related parties:
Interest revenue Minority shareholders - -
Interest expense Director-related parties - - Minority shareholders 230 319
Aggregate amounts brought to account in relation to other transactions with each class of other related parties:
Loans advanced to/(from): Associates 261 755 Minority shareholders - -
Loan repayments (from): Associates - - Minority shareholders - - Loan repayments to:
Associates - 254 Minority shareholders 448 49
Write down of bad debt: Associates - 250
For
per
sona
l use
onl
y

92
Notes to the Financial Statements For the Financial Year Ended 30 June 2010 (continued)
31. Related Parties (continued)
(C) OTHER RELATED PARTIES (CONTINUED)
CONSOLIDATED
2010 $’000
2009 $’000
Aggregate amounts receivable from, and payable to, each class of other related parties at balance date:
Current receivables: Associates 93 2,065 Director-related entities - -
Minority shareholders - -
93 2,065 Current payables:
Associates 16 270 Director-related entities - - Minority shareholders - -
16 270 Current borrowings:
Associates 7,131 8,601
7,131 8,601
Transactions were made on normal commercial terms and conditions and at market rates, except that there are no fixed terms for the repayment of loans between the parties. Interest was charged at 9% (2009: 9%).
A number of key management persons, or their related parties, hold positions in other entities that result in them having control or significant influence over the financial or operating policies of those entities.
A number of these entities transacted with the Company or its subsidiaries in the reporting period. The terms and conditions of the transactions with management persons and their related parties were no more favourable than those available, or which might reasonably be expected to be available, on similar transactions to non-Director related entities on an arms length basis.
The Group expensed $356,744 (2009: $446,493) for the hire of aircraft from Brenzil Pty Ltd (an entity related to Mr Terry Peabody) which was used to fly the Group’s Executives in connection with the acquisition of businesses, bank negotiations and investor relations. No amounts (2009: $168,141) were capitalised to the cost of acquisitions. The Group performed a small amount of administrative work in relation to Brenzil Pty Ltd. No charter revenue or costs, other than when the Group hired the aircraft, were borne by the Group. The Group charged the related party $10,000 per annum for administration time. At 30 June 2010 the related party owed nil (2009: $93,893) to the Group and the Group owed the related party $52,287 (2009: nil).
The Group performed a small amount of administrative work for Craggy Range Australia Pty Ltd, an entity related to Mr Terry Peabody, throughout the year. At 30 June 2010 the related party owed nil (2009: $286,593) in respect of the business and its employees. The Group charged no margin on these costs.
The Group administered costs in relation to MV Whistler, an associate related to Mr Terry Peabody. At 30 June 2010, the related party owed $2,487 to the Group (2009: $70,016).
During the period ended 30 June 2010 the Group paid an amount of $52,478 (2009: $51,198) to an individual associated with the former Executive Chairman. These payments are in the process of being reviewed by the Group.
For
per
sona
l use
onl
y

Transpacific Annual Report 2010 93
31 Related Parties (continued)
(C) OTHER RELATED PARTIES (CONTINUED)
The Group trades on normal commercial terms and conditions on an arm’s-length basis with GPT Group Ltd, Queensland Rail group and Fletcher Buildings Limited. Mr Gene Tilbrook, the Non-Executive Chairman of the Group, is a Non-Executive Director of these companies.
The Group trades on normal commercial terms and conditions on an arm’s length basis with Campbell Brothers Ltd. Mr Bruce Brown, a Non-Executive Director of the Group, is a Non-Executive Director of this company.
The Group trades on normal commercial terms and conditions on an arm’s length basis with Centennial Coal Ltd. Mr Bruce Allan, a Non-Executive Director of the Group, is a Non-Executive Director of this company.
The Group trades on normal commercial terms and conditions on an arm’s length basis with Chalmers Ltd. Mr Graham Mulligan, a Non-Executive Director of the Group, is a Non-Executive Director of this company. The Group also trades on normal commercial terms and conditions on an arm’s length basis with Stockland Corporation Ltd with whom Mr Graham Mulligan was a consultant during the 2010 financial year.
32. Segment Information
Under AASB 8, a condition for identifying an operating segment is that it is a component of the entity whose results are regularly reviewed by each entity’s chief operating decision maker to make decisions about resources to be allocated to the segment and to assess its performance (“the management approach”). The chief operating decision maker for the Group during the reporting period was considered to be the Executive Chairman. Segment results, assets and liabilities include items directly attributable to a segment as well as those that can be allocated on a reasonable basis. Unallocated items comprise mainly options expense and profits on business combinations. Segment capital expenditure is the total cost incurred during the period to acquire segment assets that are expected to be used for more than one period.
BUSINESS SEGMENTS
The Group comprises the following main business segments:
Liquid waste management
Includes collection, transportation, treatment and sale or disposal of liquid waste
Energy
Includes collection, transportation, treatment and sale or disposal of waste mineral oil and cooking oil
Industrial solutions
Includes industrial cleaning, high pressure water blasting and manufacture and lease out of parts washers
Commercial vehicles Importation and distribution of commercial vehicles and parts Solid waste management Includes collection, transportation, recycling and disposal of solid waste Other
Includes the manufacturing and biosolids divisions. These have not been disclosed separately due to immateriality
The Group has the following allocation policies: • Sales between segments are on normal commercial terms. • Corporate charges are allocated where possible based on estimated usage of corporate resources. • Interest charges are allocated based on the use of debt facilities and loan balances. • Income tax is not allocated to segments.
For
per
sona
l use
onl
y

94
Notes to the Financial Statements For the Financial Year Ended 30 June 2010 (continued)
32. Segment Information (continued)
Items included in unallocated income and expenses in the following table relate to:
2010 $’000
2009 $’000
Interest charges not allocated out to divisions (41,789) (52,520) Borrowing costs relating to Group debt facilities - (27,200)
Change in fair value of hedges 11,695 (76,378) Other corporate costs not allocated (2,955) (4,990)
(33,049) (161,088) Segment assets and liabilities have not been disclosed as these are not provided to the chief operating decision maker. This information is provided at a Group level only.
2010
LIQUID WASTE MANAGEMENT
$’000 ENERGY
$’000
INDUSTRIAL SOLUTIONS
$’000
COMMERCIAL VEHICLES
$’000
SOLID WASTE
$’000 OTHER
$’000 CONSOLIDATED
$’000
Revenue
Sales – external 167,710
105,962 287,374 374,695 1,023,628 89,901 2,049,270
Inter-segment sales 40,576 43,420 10,093 7,754 52,002 59,419 213,264
TOTAL SALES
208,286 149,382 297,467 382,449 1,075,630 149,320 2,262,534
Other revenue 1,331 15,769 281 - 3,968 626 21,975
TOTAL SEGMENT REVENUE 209,617 165,151 297,748 382,449 1,079,598 149,946 2,284,509
Inter-segment elimination
(213,264)
Unallocated revenue 2,751
TOTAL CONSOLIDATED
2,073,996
Result
Segment result 14,931 27,217 7,237 21,059 54,973 (1,705) 123,712
Unallocated revenue less unallocated expenses
(33,049)
Share of profit of associates 983 - - - 390
- 1,373
PROFIT BEFORE INCOME TAX
92,036
Income tax benefit (19,300)
NET PROFIT 72,736
Depreciation and amortisation expense 9,873 7,175 27,638 1,472
113,643 3,219 163,020
Unallocated 5,551
Total depreciation and
amortisation
168,571
Impairment of assets - - - - - - -
Acquisition property, plant and equipment 10,753 6,318 14,080 1,808 123,860 40,999 197,818
For
per
sona
l use
onl
y

Transpacific Annual Report 2010 95
32. Segment Information (continued)
2009
LIQUID WASTE MANAGEMENT
$’000 ENERGY
$’000
INDUSTRIAL SOLUTIONS
$’000
COMMERCIAL VEHICLES
$’000
SOLID WASTE
$’000 OTHER
$’000 CONSOLIDATED
$’000
Revenue
Sales - external 183,328 113,015 295,225 455,060 1,038,062 87,557 2,172,247
Inter-segment sales 42,359 20,270 11,124 207 33,348 34,547 141,855
TOTAL SALES
225,687 133,285 306,349 455,267 1,071,410 122,104 2,314,102
Other revenue 4,777 16,638 181 - 5,748 1,521 28,865
TOTAL SEGMENT REVENUE 230,464 149,923 306,530 455,267 1,077,158 123,625 2,342,967
Inter-segment elimination
(141,855)
Unallocated revenue 1,131
TOTAL CONSOLIDATED
2,202,243
Result
Segment result 22,098 21,041 15,452 26,132 (165,071) 1,145 (79,203)
Unallocated revenue less unallocated expenses
(161,088)
Share of profit of associates 909 - - - 1,607
- 2,516
PROFIT BEFORE INCOME TAX
(237,775)
Income tax expense 21,668
NET PROFIT (216,107)
Depreciation and amortisation expense 12,493 6,720 24,857 1,169
95,573 2,710 143,522
Unallocated 305
Total depreciation and
amortisation
143,827
Impairment of assets 422 2,414 2,628 - 147,251 967 153,682
Acquisition property, plant and equipment 35,569 6,706 37,942 2,375 170,629 5,299 258,520
For
per
sona
l use
onl
y
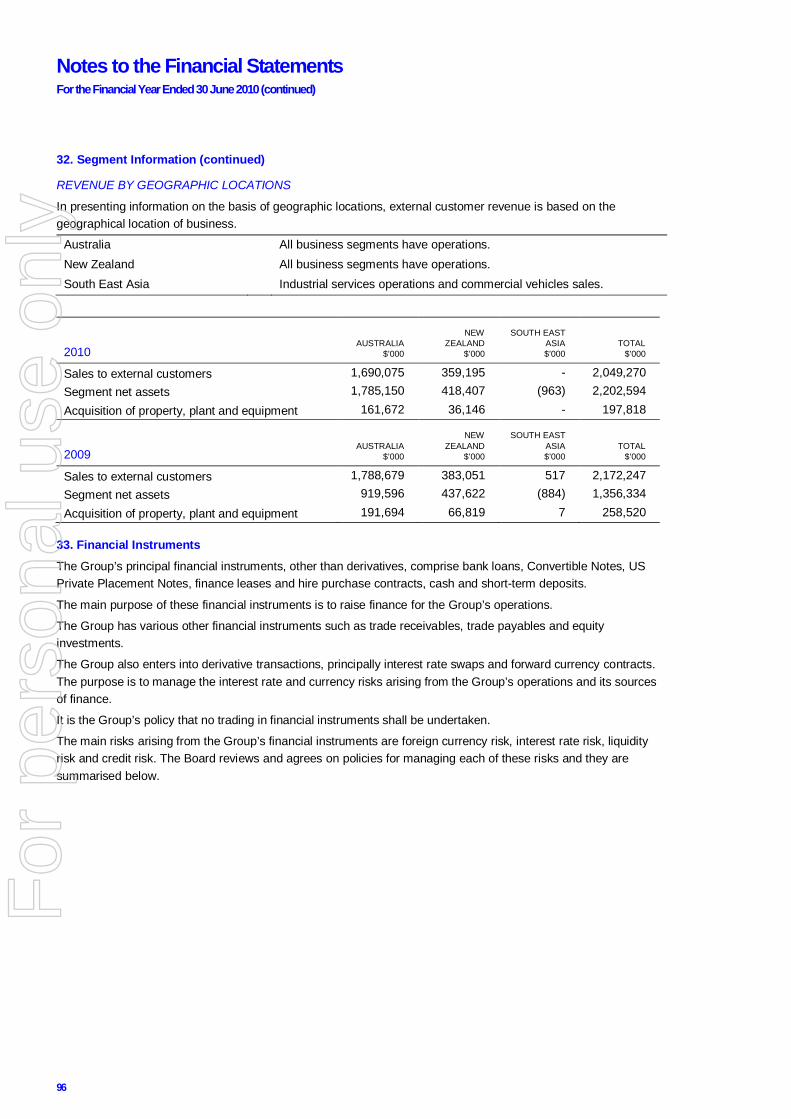
96
Notes to the Financial Statements For the Financial Year Ended 30 June 2010 (continued)
32. Segment Information (continued)
REVENUE BY GEOGRAPHIC LOCATIONS
In presenting information on the basis of geographic locations, external customer revenue is based on the geographical location of business.
Australia All business segments have operations. New Zealand All business segments have operations. South East Asia Industrial services operations and commercial vehicles sales.
2010 AUSTRALIA
$’000
NEW ZEALAND
$’000
SOUTH EAST ASIA $’000
TOTAL $’000
Sales to external customers 1,690,075 359,195 - 2,049,270 Segment net assets 1,785,150 418,407 (963) 2,202,594 Acquisition of property, plant and equipment 161,672 36,146 - 197,818
2009 AUSTRALIA
$’000
NEW ZEALAND
$’000
SOUTH EAST ASIA $’000
TOTAL $’000
Sales to external customers 1,788,679 383,051 517 2,172,247 Segment net assets 919,596 437,622 (884) 1,356,334 Acquisition of property, plant and equipment 191,694 66,819 7 258,520
33. Financial Instruments
The Group’s principal financial instruments, other than derivatives, comprise bank loans, Convertible Notes, US Private Placement Notes, finance leases and hire purchase contracts, cash and short-term deposits.
The main purpose of these financial instruments is to raise finance for the Group’s operations.
The Group has various other financial instruments such as trade receivables, trade payables and equity investments.
The Group also enters into derivative transactions, principally interest rate swaps and forward currency contracts. The purpose is to manage the interest rate and currency risks arising from the Group’s operations and its sources of finance.
It is the Group’s policy that no trading in financial instruments shall be undertaken.
The main risks arising from the Group’s financial instruments are foreign currency risk, interest rate risk, liquidity risk and credit risk. The Board reviews and agrees on policies for managing each of these risks and they are summarised below.
For
per
sona
l use
onl
y

Transpacific Annual Report 2010 97
33. Financial Instruments (continued)
(A) CURRENCY RISK
Hedging
The Commercial Vehicles division sells vehicles and parts purchased from the United States, United Kingdom and Germany. The Solid and Energy divisions sell commodities, predominantly cardboard, paper and oil, to Asia in US dollars. In order to protect against exchange rate movements, the Group enters into forward exchange contracts to purchase US dollars, British pounds, New Zealand dollars and euro.
The contracts are timed to mature when:
- major shipments are scheduled to arrive in Australia; and
- receipt of payment from customer is expected.
The Group classifies its forward exchange contracts as cash flow hedges and states them at fair value.
The Group’s exposure to foreign currency risk at balance date was as follows:
30 JUNE 2010
USD
$’000
GBP
$’000
NZD
$’000
EUR
$’000
Trade receivables 5,017 - 33 - Trade payables (12,485) - - (702)
Gross statement of financial position exposure (7,468) - 33 (702) Estimated forecast sales 27,496 - 12,292 - Estimated forecast purchases (152,065) (7,751) - (1,405)
Gross exposure (132,037) (7,751) 12,325 (2,107) Forward exchange contracts 22,028 3,596 - - Net exposure (110,009) (4,155) 12,325 (2,107)
30 JUNE 2009
USD $’000
EUR $’000
Trade receivables 1,923 5,988 Trade payables (14,965) (16,996)
Gross statement of financial position exposure (13,042) (11,008) Estimated forecast sales 34,130 - Estimated forecast purchases (152,335) (35,185)
Gross exposure (131,247) (46,193) Forward exchange contracts 12,992 8,734 Net exposure (118,255) (37,459)
The following significant exchange rates applied during the year:
AVERAGE RATE REPORTING DATE SPOT RATE
2010 2009 2010 2009
NZD 1.2552 1.2291 1.2308 1.2428 USD 0.8821 0.7477 0.8523 0.8114
EUR 0.6355 0.5420 0.6979 0.5751
For
per
sona
l use
onl
y

98
Notes to the Financial Statements For the Financial Year Ended 30 June 2010 (continued)
33. Financial Instruments (continued)
(A) CURRENCY RISK (CONTINUED)
The Group is exposed to foreign currency risk on translation of its foreign controlled subsidiaries. The principal exposure arising from this risk is fluctuations in the NZD.
The USPP and foreign denominated Tranche D debt currency risk has been mitigated by a foreign currency swap which has been in place since inception and converts to A$ fixed rate debt. At balance date the Group held the following facilities denominated in foreign currency:
USD
$’000 AUD
$’000
30 June 2010 US Private Placement 150,000 175,106 Tranche D 81,866 96,053
231,866 271,159
30 June 2009
US Private Placement 150,000 184,869
Tranche D 108,006 132,967
258,006 317,836
(B) PRICE RISK
Equity securities price risk arises from investments in equity securities. All investments are publicly traded on the ASX. The price risk for listed investments based on a 10% movement for the Group is as follows:
INCREASE TO EQUITY
$’000
DECREASE TO NPAT $’000
30 June 2010 Listed securities 2,339 -
30 June 2009 Listed securities 1,966 (1,966)
For
per
sona
l use
onl
y

Transpacific Annual Report 2010 99
33. Financial Instruments (continued)
(C) CREDIT RISK EXPOSURES
Management has a credit policy in place and exposure to credit risk is monitored on an ongoing basis. Credit evaluations are performed on all customers requiring credit over a certain amount. The Group does not require collateral in respect of financial assets. For certain export sales the Group requires the vendor to provide a letter of credit.
The Group minimises concentrations of credit risk by undertaking transactions with a large number of customers. Credit risk on interest rate and foreign exchange contracts is minimal as counterparties are large Australian and international banks with acceptable credit ratings determined by a recognised ratings agency.
The maximum exposure to credit risk is represented by the carrying amount of each financial asset, including derivative financial instruments, in the statement of financial position. The Group’s maximum exposure to credit risk at the reporting date was:
CARRYING AMOUNT
NOTE 2010 $’000
2009 $’000
Loans and receivables 10 280,709 352,103 Cash and cash equivalents (excluding bank overdrafts) 9 140,954 70,139
Other forward exchange contracts (derivatives) 13 18,635 41,346
440,298 463,588
The Group’s maximum exposure to credit risk for trade receivables at reporting date by geographic region was:
CARRYING AMOUNT
2010 $’000
2009 $’000
Australia 215,046 258,127 New Zealand 44,207 44,444
259,253 302,571
For
per
sona
l use
onl
y

100
Notes to the Financial Statements For the Financial Year Ended 30 June 2010 (continued)
33. Financial Instruments (continued)
(D) INTEREST RATE RISK EXPOSURES
Hedging
The Group’s exposure to interest rate risk is predominantly cash flow interest rate risk. The Group adopts a policy of ensuring at least 40% of its exposure to changes in interest rates on borrowings is on a fixed rate basis. Accordingly, the Group has entered into interest rate swap contracts under which it is obliged to receive interest at variable rates and to pay interest at fixed rates. The contracts are settled on a net basis and require settlement of net interest receivable or payable each 30 days or 90 days.
Swaps currently in place cover approximately 51% (2009: 41%) of term debt outstanding and expire October 2010, September 2011, March 2013, July 2013, February 2015 and July 2015. The fixed interest rates currently range between BBSY 5.03% and 7.25% (2009: 2.84% and 7.25%).
The Group classifies interest rate swaps as derivatives and states them at fair value.
At the reporting date the interest rate profile of the Group’s interest bearing financial instruments was:
CONSOLIDATED CARRYING
AMOUNT
2010 $’000
2009 $’000
Fixed rate instruments Financial assets
159,682 93,906 Financial liabilities
(668,084) (685,249)
(508,402) (591,343) Variable rate instruments
Financial liabilities (1,091,647) (1,845,543)
(1,600,049) (2,436,886)
Sensitivity analysis for variable rate instruments and derivatives
A change of 100 basis points in interest rates at the reporting date would have increased/(decreased) equity (excluding the movement in profit before tax) and profit or loss by the amounts shown below:
PROFIT BEFORE TAX EQUITY
100 BP INCREASE
$’000
100 BP DECREASE
$’000
100 BP INCREASE
$’000
100 BP DECREASE
$’000
30 June 2010 Variable rate instruments
(10,900) 10,900 - - Interest rate swap
(28,119) 29,589 - -
Cash flow sensitivity (net) (39,019) 40,489 - - 30 June 2009
Variable rate instruments
(18,455) 18,455 - - Interest rate swap
46,655 (50,951) - -
Cash flow sensitivity (net) 28,200 (32,496) - - F
or p
erso
nal u
se o
nly

Transpacific Annual Report 2010 101
33. Financial Instruments (continued)
Effective interest rates and repricing analysis
In respect of income-earning financial assets and interest-bearing financial liabilities of the Group, the following table indicates their effective interest rates at reporting date and the periods in which they reprice. No other financial assets or liabilities are exposed to any interest rate risk.
GROUP
EFFECTIVE INTEREST
RATE (%) TOTAL
3 – 4
YEARS $’000
>4 YEARS
$’000
1 YEAR OR LESS
$’000
1 – 2 YEARS
$’000
2 – 3 YEARS
$’000
2010 FINANCIAL ASSETS
Cash and deposits 4.56 140,954 140,954 - - - -
Loans to related parties 9.00 93 93 - - - -
TOTAL FINANCIAL ASSETS 141,047 141,047 - - - -
FINANCIAL LIABILITIES
US Private Placement 10.84 175,106 - - - - 175,106
Convertible notes 6.75 279,668 - - - - 279,668
Unsecured bank loans 7.93 1,093,070
- - 1,093,070 - -
Lease liabilities 8.28 170,872 38,858 35,024 38,319 27,405 31,266
Payable to related parties 9.00 7,131 7,131 - - - -
Interest rate swaps 6.84 31,440 31,440 - - - -
Other 6.00 2,444 2,444 - - - -
TOTAL FINANCIAL LIABILITIES 1,759,731 79,873 35,024 1,131,389 27,405 486,040
2009 FINANCIAL ASSETS
Cash and deposits 2.73 70,115 70,115 - - - -
Loans to related parties 9.00 2,065 2,065 - - - -
TOTAL FINANCIAL ASSETS 72,180 72,180 - - - -
FINANCIAL LIABILITIES
US Private Placement 8.84 184,869 - - - - 184,869
Convertible notes 6.75 273,067 - - - - 273,067
Unsecured bank loans 5.02 1,849,859 1,849,859 - - - -
Lease liabilities 7.70 135,353 29,121 27,763 24,875 28,230 25,364
Payable to related parties 9.00 8,601 8,601 - - - -
Interest rate swaps 6.35 76,378 76,378 - - - -
Other 6.00 2,730 614 2,116 - - -
TOTAL FINANCIAL LIABILITIES 2,530,857 1,964,573 29,879 24,875 28,230 483,300
For
per
sona
l use
onl
y

102
Notes to the Financial Statements For the Financial Year Ended 30 June 2010 (continued)
33. Financial Instruments (continued)
(E) LIQUIDITY RISK
The following table discloses the contractual maturities of financial liabilities, including estimated interest payment and excluding the impact of netting agreements:
CONSOLIDATED
CARRYING AMOUNT
$’000
CONTRACT-UAL CASH
FLOWS $’000
MORE THAN
5 YEARS $’000
LESS THAN 1 YEAR $’000
1 – 2 YEARS $’000
2 – 5 YEARS $’000
2010
Non-derivative financial liabilities
US Private Placement 175,106 (243,365) (18,321) (18,321) (138,468) (68,255)
Convertible notes 279,668 (402,989) (20,864) (20,864) (361,261) -
Loans from associates 7,131 (7,773) (7,773) - - -
Finance lease liabilities 170,873 (208,686) (47,458) (42,775) (99,362) (19,091)
Unsecured bank loans 1,093,070 (1,287,201 (89,217) (62,114) (1,135,870) -
Trade and other payables* 218,003 (218,003) (218,003) - - -
Derivative financial liabilities
Interest rate swaps 31,440 (31,440) (31,440) - - -
Foreign currency swaps - - - - - -
1,975,291 (2,399,457) (433,076) (144,074) (1,734,961) (87,346)
2009
Non-derivative financial liabilities
US Private Placement 184,869 (185,401) (185,401) - - -
Convertible notes 273,067 (274,574) (274,574) - - -
Loans from associates 8,601 (9,203) (9,203) - - -
Finance lease liabilities 135,353 (135,353) (135,353) - - -
Unsecured bank loans 1,849,859 (1,868,728) (1,835,444) (33,284) - -
Trade and other payables* 251,648 (251,648) (251,648) - - -
Bank overdraft 24 (24) (24) - - -
Derivative financial liabilities
Interest rate swaps 76,378 (76,378) (76,378) - - -
Foreign currency swaps 10,650 (10,650) (10,650) - - -
2,790,449 (2,811,959) (2,778,675) (33,284) - -
* Excludes derivatives shown separately.
All non-derivative financial liabilities, excluding bank overdraft, are carried at amortised cost. The Group manages liquidity risk by monitoring forecast cash flows on a weekly basis and ensuring that adequate unutilised borrowing facilities are maintained.
For
per
sona
l use
onl
y

Transpacific Annual Report 2010 103
33. Financial Instruments (continued)
(F) CAPITAL MANAGEMENT
The capital structure of the Group comprises debt, which includes the borrowings disclosed in Note 20, cash and cash equivalents and equity attributable to equity holders of the parent, such equity comprising issued capital, reserves and retained earnings as disclosed in the statement of financial position. The Company undertook a major review of its capital structure during 2009 which was finalised in August 2009. The Company is subject to externally imposed capital requirements, including restrictions on the payment of dividends on ordinary shares, and redeeming, repurchasing, retiring or repaying in cash any of the convertible notes, the USPP notes, the Transpacific Step-up Preference Securities or any other hybrid equity instrument issued by it prior to its stated maturity or expiry date (other than in circumstances where it is obliged to do so). The restrictions on dividends are consistent with the Company’s intention to adopt a dividend policy which is focused on cash flow management having regard to various factors including prevailing economic conditions, capital expenditure requirements and opportunities, acquisition opportunities and debt management. The Group has complied with all external requirements for capital management.
(G) IMPAIRMENT LOSSES
The ageing of the Group’s trade receivables at the reporting date was:
GROSS 2010 $’000
IMPAIRMENT 2010 $’000
GROSS 2009 $’000
IMPAIRMENT 2009 $’000
Not past due 132,165 - 155,879 - Past due 0-30 days
90,205 - 72,988 - Past due 31-120 days
36,478 1,838 48,440 - Past due 121 days to one year
4,850 2,607 25,381 2,327 More than one year
83 83 4,420 2,210
263,781 4,528 307,108 4,537
The movement in the allowance for impairment in respect of trade receivables during the year was as follows:
2010 $’000
2009 $’000
Balance at 1 July 4,537 2,899 Impairment loss/(reversed) recognised
(9) 1,638
Balance 30 June 4,528 4,537 The impairment loss at 30 June 2010 of $83,000 > one year relates to several minor customers.
Based on historic default rates, the Group believes that no impairment allowance is necessary in respect of trade receivables not past due or past due by up to 30 days. No single customer’s annual revenue is greater than 2% of the Group’s total revenue. Trade and other debtors that are neither past due or impaired are considered to be of a high credit quality.
(H) FAIR VALUES
The Group uses various methods in estimating the fair value of a financial instrument. The methods comprise:
Level 1 – the fair value is calculated using quoted prices in active markets.
Level 2 – the fair value is estimated using inputs other than quoted prices included in Level 1 that are observable for the asset or liability, either directly (as prices) or indirectly (derived from prices).
Level 3 – the fair value is estimated using inputs for the asset or liability that are not based on observable market data.
For
per
sona
l use
onl
y

104
Notes to the Financial Statements For the Financial Year Ended 30 June 2010 (continued)
33. Financial Instruments (continued)
(H) FAIR VALUES (CONTINUED)
Quoted market price represents the fair value determined based on quoted prices on active markets as at the reporting date without any deduction for transaction costs. The fair value of the listed equity investments are based on quoted market prices.
For financial instruments not quoted in active markets, the Group uses valuation techniques such as present value techniques, comparison to similar instruments for which market observable prices exist and other relevant models used by market participants. These valuation techniques use both observable and unobservable market inputs.
The fair value of unlisted debt and equity securities, as well as other investments that do not have an active market, are based on valuation techniques using market data that is not observable.
Other than as disclosed on the following pages there are no differences between the carrying value and the fair value of financial assets and liabilities.
The fair value of the financial instruments as well as the methods used to estimate the fair value are summarised in the table below.
CONSOLIDATED
2010
QUOTED MARKET
PRICE (LEVEL 1)
VALUATION TECHNIQUE –
MARKET OBSERVABLE
INPUTS (LEVEL 2)
VALUATION TECHNIQUE – NON MARKET OBSERVABLE
INPUTS (LEVEL 3) TOTAL
Financial assets Derivative financial instruments: Currency rate swaps - 18,635 - 18,635
Available-for-sale investments: Listed investments 23,942 - - 23,942 Financial liabilities Derivative financial instruments: Interest rate swaps - 31,440 - 31,440
2009
Financial assets Derivative financial instruments: Currency rate swaps - 41,346 - 41,346
Available-for-sale investments:
Listed investments 21,195 - - 21,195 Financial liabilities Derivative financial instruments: Interest rate swaps - 76,378 - 76,378
Currency rate swaps - 10,650 - 10,650
Transfer between categories
There were no transfers between Level 1 and Level 2 during the year.
For
per
sona
l use
onl
y
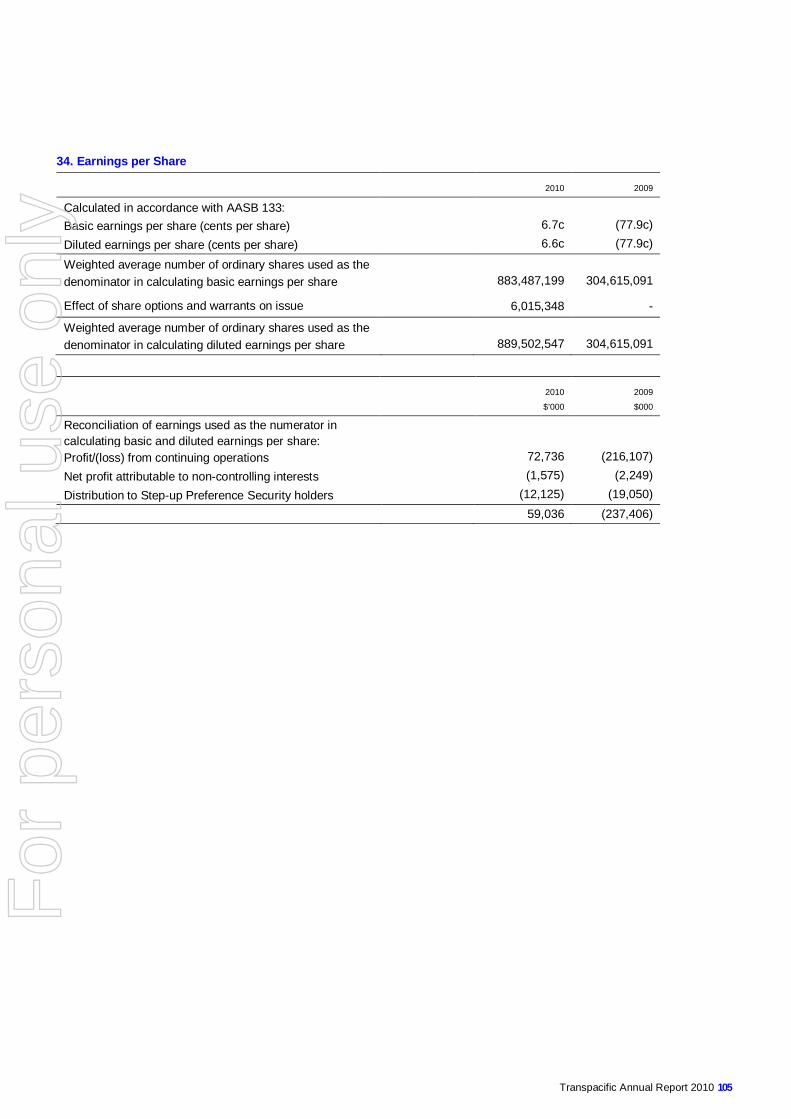
Transpacific Annual Report 2010 105
34. Earnings per Share
2010 2009
Calculated in accordance with AASB 133: Basic earnings per share (cents per share) 6.7c (77.9c) Diluted earnings per share (cents per share) 6.6c (77.9c)
Weighted average number of ordinary shares used as the denominator in calculating basic earnings per share 883,487,199 304,615,091
Effect of share options and warrants on issue
6,015,348 -
Weighted average number of ordinary shares used as the denominator in calculating diluted earnings per share 889,502,547 304,615,091
2010
$’000
2009
$000
Reconciliation of earnings used as the numerator in calculating basic and diluted earnings per share:
Profit/(loss) from continuing operations 72,736 (216,107) Net profit attributable to non-controlling interests (1,575) (2,249) Distribution to Step-up Preference Security holders (12,125) (19,050)
59,036 (237,406)
For
per
sona
l use
onl
y

106
Notes to the Financial Statements For the Financial Year Ended 30 June 2010 (continued)
35. Key Management Personnel Disclosures
(A) DETAILS OF SPECIFIED DIRECTORS AND SPECIFIED EXECUTIVES
The following were key management personnel of the Group at any time during the reporting period and unless otherwise indicated were key management personnel for the entire period:
(i) Executive Directors T E Peabody – Executive Chairman, resigned as Chairman 3 June 2010 and Director 30 June 2010 T J Coonan – Executive Director and Chief Executive Officer Transpacific Industries Group Ltd H W Grundell – Executive General Manager, New Zealand, Commercial Vehicles and Manufacturing, resigned as a Director 3 September 2009 (ii) Non-Executive Directors G T Tilbrook, appointed 3 September 2009 B R Brown G D Mulligan B S Allan R A Ghatalia, appointed 1 September 2009 M M Hudson, appointed 14 September 2009 (iii) Key Executives N M Badyk – Chief Operating Officer, Transpacific Cleanaway A G Roderick – Chief Operating Officer, Transpacific Industrials
S T Barnard – General Manager, Corporate Services
P A Glavac – Managing Director, Commercial Vehicles and Manufacturing T Nickels – Managing Director, New Zealand K L Smith – Company Secretary G Battershill – Chief Financial Officer, resigned 5 March 2010 G S Campbell – Managing Director, Solid Waste Australia and New Zealand, resigned 13 November 2009
(B) KEY MANAGEMENT PERSONNEL COMPENSATION
The key management personnel compensation included in employee expenses are as follows:
CONSOLIDATED
2010 $’000
2009 $’000
Short-term employee benefits 5,380 5,636
Post-employment benefits 2,032 461
Equity compensation benefits 265 1,095
7,677 7,192 The disclosures relating to remuneration of specified Directors and Executives is set out in the Remuneration Report section of the Directors' Report on pages 25 to 35.
For
per
sona
l use
onl
y

Transpacific Annual Report 2010 107
35. Key Management Personnel Disclosures (continued)
(C) OPTIONS AND PERFORMANCE RIGHTS OVER EQUITY INSTRUMENTS GRANTED
The movement during the reporting period in the number of opportunities over ordinary shares in the Company held, directly, indirectly or beneficially, by each key management person, including their related parties, is as follows. No options are vested but not exercisable at the end of the year.
2010
NAME
BALANCE AT THE START OF
THE YEAR
GRANTED DURING THE
YEAR AS REMUNERATION
EXERCISED DURING THE
YEAR
OTHER CHANGES
DURING THE YEAR
BALANCE AT THE END OF
THE YEAR
VESTED AND EXERCISABLE
AT THE END OF THE YEAR
Executive Directors: T J Coonan 433,334 1,324,080 - (200,000) 1,557,414 - Non-Executive Directors: G T Tilbrook - - - - - - B R Brown - - - - - - G D Mulligan - - - - - - B S Allan 50,000 - - - 50,000 - R A Ghatalia - - - - - - M M Hudson - - - - - - Key Executives: H W Grundell 100,000 785,109 - - 885,109 - N M Badyk 100,000 653,604 - (100,000) 653,604 - A G Roderick 500,000 653,604 - - 1,153,604 - S T Barnard 150,000 301,740 - - 451,740 - P A Glavac 100,000 401,532 - (100,000) 401,532 - T Nickels 200,000 456,455 - - 656,455 - K L Smith 75,000 246,155 - - 321,155 - G R W Battershill 200,000 - - (200,000) - - G S Campbell 700,000 - - (700,000) - - 2009
NAME
BALANCE AT THE START OF
THE YEAR
GRANTED DURING THE
YEAR AS REMUNERATION
EXERCISED DURING THE
YEAR
OTHER CHANGES
DURING THE YEAR
BALANCE AT THE END OF
THE YEAR
VESTED AND EXERCISABLE
AT THE END OF THE YEAR
Executive Directors: T E Peabody 6,950,000 - (6,950,000) - - - T J Coonan 616,669 - (183,335) - 433,334 - H W Grundell 266,667 - (166,667) - 100,000 - Non-Executive Directors: B R Brown 50,000 - (50,000) - - - G D Mulligan 50,000 - (50,000) - - - B S Allan 50,000 - - - 50,000 33,333 Key Executives: G R W Battershill - 200,000 - - 200,000 - S T Barnard 150,000 - - - 150,000 9,999 P A Glavac 266,668 - (166,668) - 100,000 - T A A Woods 266,667 - (166,667) - 100,000 - N M Badyk 266,667 - (166,667) - 100,000 - G S Campbell 700,000 - - - 700,000 266,666 A G Roderick 500,000 - - - 500,000 266,666
For
per
sona
l use
onl
y

108
Notes to the Financial Statements For the Financial Year Ended 30 June 2010 (continued)
35. Key Management Personnel Disclosures (continued)
(D) SHARE HOLDINGS
The movement during the reporting period in the number of ordinary shares in the Company held, directly or indirectly or beneficially, by each key management person, including their related parties, is as follows.
2010
NAME
BALANCE AT THE START OF THE
YEAR
RECEIVED DURING THE
YEAR ON THE EXERCISE OF
OPTIONS
OTHER CHANGES
DURING THE YEAR
BALANCE AT THE END OF THE
YEAR
Executive Directors: T E Peabody (including related parties) 118,158,430 - 58,129,450 176,287,880 T J Coonan 1,275,384 - (1,275,384) - Non-Executive Directors: G T Tilbrook - - 30,000 30,000 B R Brown 150,000 - 50,000 200,000
G D Mulligan 82,810 - - 82,810 B S Allan 9,261 - 16,392 25,653 M M Hudson - - 7,000 7,000 Key Executives: H W Grundell 625,714 - (625,714) - N M Badyk 186,517 - - 186,517
S T Barnard 20,500 - - 20,500 P A Glavac 455,749 - (227,875) 227,874 K L Smith 150,000 - (73,535) 76,465
2009
NAME
BALANCE AT THE START OF THE
YEAR
RECEIVED DURING THE
YEAR ON THE EXERCISE OF
OPTIONS
OTHER CHANGES
DURING THE YEAR
BALANCE AT THE END OF THE
YEAR
Executive Directors: T E Peabody (including related parties) 110,473,201 6,950,000 735,229 118,158,430
H W Grundell 459,047 166,667 - 625,714 T J Coonan 1,092,049 183,335 - 1,275,384 Non-Executive Directors: B R Brown 100,000 50,000 - 150,000 G D Mulligan 32,222 50,000 588 82,810 B S Allan 5,000 - 4,261 9,261
Key Executives: S T Barnard 20,500 - - 20,500 P A Glavac 289,081 166,666 2 455,749 T A A Woods 427,362 166,667 (24,156) 569,873 N M Badyk 334,260 166,667 (314,410) 186,517
(E) CHANGES IN KEY MANAGEMENT PERSONNEL IN THE PERIOD AFTER THE REPORTING DATE AND PRIOR TO THE DATE WHEN THE FINANCIAL REPORT IS AUTHORISED FOR ISSUE
On 1 September 2010 Mr Kevin Campbell joined the Group as Chief Financial Officer.
For
per
sona
l use
onl
y

Transpacific Annual Report 2010 109
35. Key Management Personnel Disclosures (continued)
(F) LOANS TO DIRECTORS AND EXECUTIVES
Details of aggregates of loans to key management personnel are as follows:
BALANCE AT THE START OF
THE YEAR $000
INTEREST CHARGED
$000
INTEREST INCLUDED AS
REMUNERATION* $000
WRITTEN OFF $000
BALANCE AT THE END OF
THE YEAR $000
NUMBER IN GROUP
2010 - - - - - - 2009 93 306 148 - - 5 * Remuneration benefit calculated as the difference between interest actually paid and the amount of interest that would have been charged on an arm’s length basis.
There are no key management personnel with loans above $100,000 during the 2010 financial year.
Details of key management personnel with loans above $100,000 in the 2009 financial year are as follows:
2009
BALANCE AT THE START OF
THE YEAR $000
INTEREST CHARGED
$000
INTEREST INCLUDED AS
REMUNERATION*$000
WRITTEN OFF $000
BALANCE AT THE END OF
THE YEAR $000
LOANS HIGHEST BALANCE
DURING THE PERIOD
$000
Directors: T J Coonan 93 197 93 - - 4,927 H W Grundell - 38 19 - - 1,250
Executives: P A Glavac - 18 9 - - 680 N M Badyk - 8 4 - - 345 T A Woods - 45 23 - - 1,450 * Remuneration benefit calculated as the difference between interest actually paid and the amount of interest that would have been charged on an arm’s length basis.
Loans to Directors and Executives were charged interest at a rate of 30 day BBSY plus 1.5%.
The loans were repayable upon demand. All principal and interest amounts outstanding were repaid during the 2009 year.
36. Subsequent Events
There were no significant events subsequent to year end.
37. Parent Entity Disclosure
2010 $’000
2009 $’000
Current assets 60,923 39,643 Total assets 3,575,383 3,325,100 Current liabilities 161,346 2,227,704 Total liabilities 1,686,807 2,228,285
Issued capital 1,819,917 1,092,971 Retained earnings 7,859 3,254 Reserves 60,800 590
Total shareholder equity 1,888,576 1,096,815
Profit or loss of the parent entity 3,984 69,238
Total comprehensive income of the parent entity 3,984 69,238
The parent entity does not have any guarantees, contingent liabilities or contractual commitments for 2010 or 2009.
For
per
sona
l use
onl
y

110
Directors’ Declaration
In the Directors’ opinion:
(a) the financial statements, additional disclosures included in the Directors report designated as audited and notes set out on pages 44 to 109 are in accordance with the Corporations Act 2001, including:
(i) giving a true and fair view of the consolidated entity’s financial position as at 30 June 2010 and of its performance for the financial year ended on that date; and
(ii) complying with Australian Accounting Standards (including the Australian Accounting Interpretations), and the Corporations Regulations 2001.
(b) the financial statements and notes also comply with International Financial Reporting Standards as disclosed in Note 2; and
(c) there are reasonable grounds to believe that the company will be able to pay its debts as and when they become due and payable.
(d) this declaration has been made after receiving the declarations required to be made to the Directors in accordance with section s295A of the Corporations Act 2001 for the financial year ended 30 June 2010; and
(e) as at the date of this declaration, there are reasonable grounds to believe that the members of the closed group identified in Note 25 will be able to meet any obligation or liabilities to which they are or may become subject to, by virtue of the deed of cross guarantee.
This declaration is made in accordance with a resolution of the Directors.
G T Tilbrook B R Brown Non-Executive Chairman Deputy Chairman
Brisbane, 23 September 2010
For
per
sona
l use
onl
y
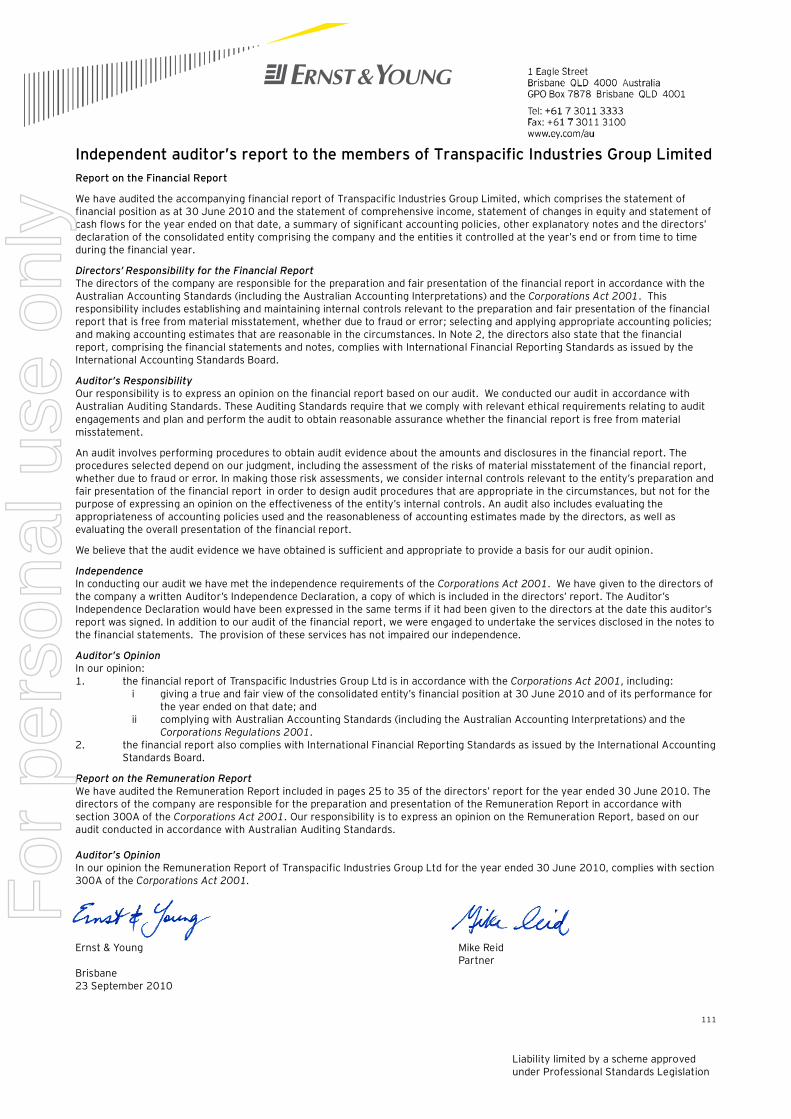
111
Liability limited by a scheme approved under Professional Standards Legislation
Independent auditor’s report to the members of Transpacific Industries Group Limited Report on the Financial Report
We have audited the accompanying financial report of Transpacific Industries Group Limited, which comprises the statement of financial position as at 30 June 2010 and the statement of comprehensive income, statement of changes in equity and statement of cash flows for the year ended on that date, a summary of significant accounting policies, other explanatory notes and the directors’ declaration of the consolidated entity comprising the company and the entities it controlled at the year’s end or from time to time during the financial year.
Directors’ Responsibility for the Financial Report The directors of the company are responsible for the preparation and fair presentation of the financial report in accordance with the Australian Accounting Standards (including the Australian Accounting Interpretations) and the Corporations Act 2001. This responsibility includes establishing and maintaining internal controls relevant to the preparation and fair presentation of the financial report that is free from material misstatement, whether due to fraud or error; selecting and applying appropriate accounting policies; and making accounting estimates that are reasonable in the circumstances. In Note 2, the directors also state that the financial report, comprising the financial statements and notes, complies with International Financial Reporting Standards as issued by the International Accounting Standards Board.
Auditor’s Responsibility Our responsibility is to express an opinion on the financial report based on our audit. We conducted our audit in accordance with Australian Auditing Standards. These Auditing Standards require that we comply with relevant ethical requirements relating to audit engagements and plan and perform the audit to obtain reasonable assurance whether the financial report is free from material misstatement.
An audit involves performing procedures to obtain audit evidence about the amounts and disclosures in the financial report. The procedures selected depend on our judgment, including the assessment of the risks of material misstatement of the financial report, whether due to fraud or error. In making those risk assessments, we consider internal controls relevant to the entity’s preparation and fair presentation of the financial report in order to design audit procedures that are appropriate in the circumstances, but not for the purpose of expressing an opinion on the effectiveness of the entity’s internal controls. An audit also includes evaluating the appropriateness of accounting policies used and the reasonableness of accounting estimates made by the directors, as well as evaluating the overall presentation of the financial report.
We believe that the audit evidence we have obtained is sufficient and appropriate to provide a basis for our audit opinion.
Independence In conducting our audit we have met the independence requirements of the Corporations Act 2001. We have given to the directors of the company a written Auditor’s Independence Declaration, a copy of which is included in the directors’ report. The Auditor’s Independence Declaration would have been expressed in the same terms if it had been given to the directors at the date this auditor’s report was signed. In addition to our audit of the financial report, we were engaged to undertake the services disclosed in the notes to the financial statements. The provision of these services has not impaired our independence.
Auditor’s Opinion In our opinion: 1. the financial report of Transpacific Industries Group Ltd is in accordance with the Corporations Act 2001, including:
i giving a true and fair view of the consolidated entity’s financial position at 30 June 2010 and of its performance for the year ended on that date; and
ii complying with Australian Accounting Standards (including the Australian Accounting Interpretations) and the Corporations Regulations 2001.
2. the financial report also complies with International Financial Reporting Standards as issued by the International Accounting Standards Board.
Report on the Remuneration Report We have audited the Remuneration Report included in pages 25 to 35 of the directors’ report for the year ended 30 June 2010. The directors of the company are responsible for the preparation and presentation of the Remuneration Report in accordance with section 300A of the Corporations Act 2001. Our responsibility is to express an opinion on the Remuneration Report, based on our audit conducted in accordance with Australian Auditing Standards. Auditor’s Opinion In our opinion the Remuneration Report of Transpacific Industries Group Ltd for the year ended 30 June 2010, complies with section 300A of the Corporations Act 2001.
Ernst & Young Mike Reid
Partner Brisbane 23 September 2010
For
per
sona
l use
onl
y

112
Corporate Information
Transpacific Industries Group Ltd
ABN 74 101 155 220
Directors
Gene Tilbrook (Non-Executive Chairman)
Trevor Coonan (Chief Executive Officer and Executive Director)
Bruce Brown (Deputy Chairman and Non-Executive Director)
Graham Mulligan (Non-Executive Director)
Bruce Allan (Non-Executive Director)
Rajiv Ghatalia (Non-Executive Director)
Martin Hudson (Non-Executive Director)
Company Secretary
Kellie Smith
Registered Office
Level 1,
159 Coronation Drive
Milton QLD 4064
For
per
sona
l use
onl
y


