Page 1
Master’s Thesis
BUILDING PERFORMANCE EVALUATION: AN ORGANIZATION FOR DOCUMENTATION
by
Johannes Almå s
A Thesis
Submitted to the Faculty
of the
WORCESTER POLYTECHNIC INSTITUTE
in partial fulfillment of the requirements for the
Degree of Master of Science
in Fire Protection Engineering
by
______________________August 2002
APPROVED:
Professor Robert Fitzgerald, Major Advisor
Professor Jonathan Barnett, Reader
Professor David A. Lucht, Head of Department
Page 2
ii
ABSTRACT
An organization of a variety of useful references and tools for evaluating typical situations that have to be
addressed in a performance based fire safety design are structured in this project. The chapters in this paper are
arranged the same way as the situations may appear in fire scenarios. Each chapter discusses relevant issues for
regulatory required sub evaluations in fire safety engineering. In this paper the sub evaluations are named; Fire
spread within the origin, Barriers and fire spread beyond the origin, Fire detection and initial action, Automatic
sprinkler systems, Smoke movement, control and toxicity, Structural frame, Fire brigade intervention and Life
safety. The paper addresses standards and publications to evaluate fire safety in buildings. The tools and
references presented are an assortment from a variety of methods and correlations that have been developed
through the years in order to achieve knowledge of the dynamics of the fire and how to control its severity. The
topics for the sub evaluations are codes and standards, design fire development, fire protection efficiencies in
fires, reliability issues, building and construction characteristics, occupant characteristics, evaluation tools and
evaluation software.
Page 3
iii
ACKNOWLEDGEMENT
Thanks to Professor Fitzgerald for his involvement in my work. During his lecture in 1999, he was the first to
introduce me to a new concept of building performance in case of fires. His classes challenged me to extend my
knowledge of fire dynamics and I started searching after methods and tools to better understand the dynamics of
fires.
Thanks to Norconsult AS for partly funding the education.
Thanks to my wife, Marianne, who patiently waited for me during my residence in USA, and for her support and
help to complete the education.
Page 4
iv
TABLE OF CONTENTS
Abstract ............................................................................................................................................................ ii
Acknowledgement ...........................................................................................................................................iii
Table of contents ............................................................................................................................................. iv
List of tables ................................................................................................................................................... vii
List of figures................................................................................................................................................... ix
1 Introduction.............................................................................................................................................. 1
1.1 References .......................................................................................................................................... 4
2 Fire spread within the room of origin...................................................................................................... 5
2.1 Objectives........................................................................................................................................... 5
2.2 Application of codes and standards..................................................................................................... 6
2.3 Identification of room fire loads.......................................................................................................... 8
2.4 Identification of fuel surfaces .............................................................................................................. 9
2.5 Estimation fire growth ...................................................................................................................... 12
2.6 Realms of fire growth........................................................................................................................ 12
2.7 Fire growth rate ............................................................................................................................... 14
2.8 Summary........................................................................................................................................... 16
2.9 References ........................................................................................................................................ 16
3 Barriers and fire spread beyond the origin............................................................................................ 21
3.1 Objectives......................................................................................................................................... 21
3.2 Application of codes and standards................................................................................................... 22
3.3 Design Fire....................................................................................................................................... 24
3.4 Barrier properties............................................................................................................................. 26
3.5 Fire testing vs. real fires ................................................................................................................... 28
3.6 Barrier reliability statistics ............................................................................................................... 29
3.7 Barrier resistance Evaluation tools................................................................................................... 30
Page 5
v
3.8 Large and small barrier failures ....................................................................................................... 31
3.9 Summary........................................................................................................................................... 32
3.10 References ........................................................................................................................................ 33
4 Fire detection and initial action.............................................................................................................. 37
4.1 Objectives......................................................................................................................................... 37
4.2 Application of codes and standards................................................................................................... 38
4.3 Design fire for detection evaluation .................................................................................................. 39
4.4 Human detection and notification ..................................................................................................... 41
4.5 Instrument detection - Hand calculation............................................................................................ 44
4.6 Instrument detection - Software program .......................................................................................... 47
4.7 Smoke detector modeling .................................................................................................................. 49
4.8 Detector reliability............................................................................................................................ 50
4.9 Response time................................................................................................................................... 54
4.10 Summary........................................................................................................................................... 56
4.11 References ........................................................................................................................................ 56
5 Automatic sprinkler systems.................................................................................................................. 61
5.1 Objectives......................................................................................................................................... 61
5.2 Application of codes and standards................................................................................................... 63
5.3 Design fire for sprinkler evaluation................................................................................................... 65
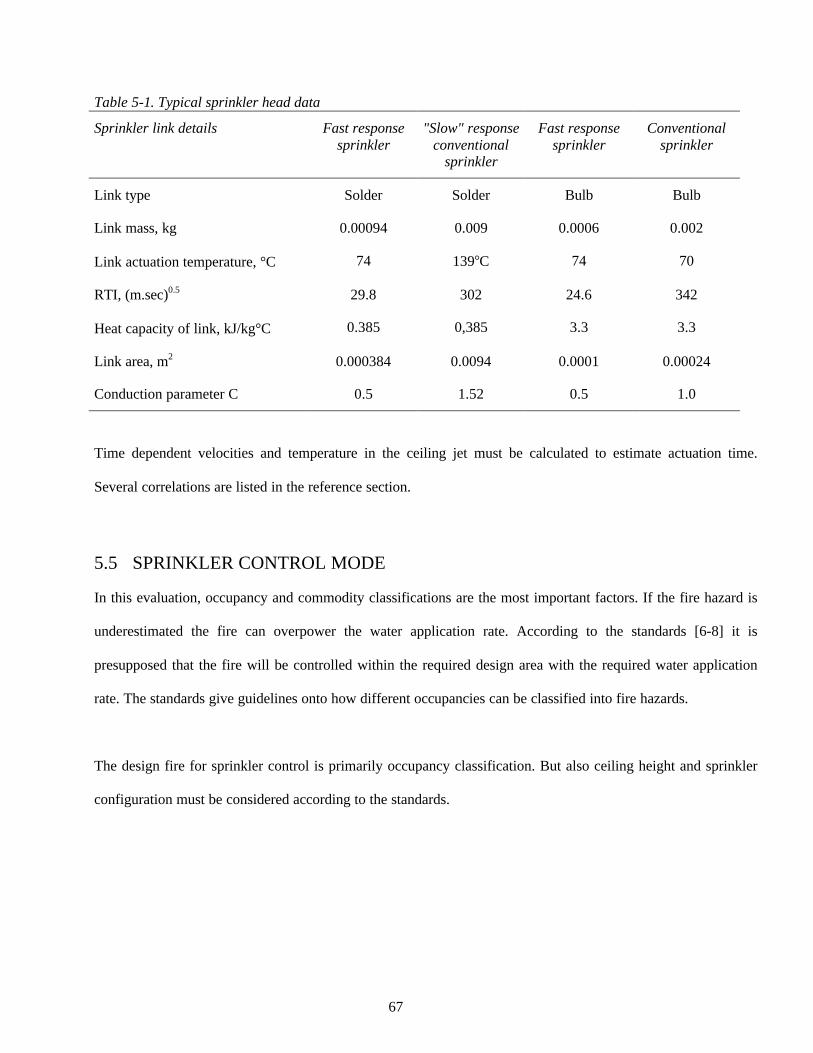
5.4 Sprinkler actuation ........................................................................................................................... 65
5.5 sprinkler control mode...................................................................................................................... 67
5.6 Sprinkler suppression theory............................................................................................................. 68
5.7 Automatic sprinkler reliability .......................................................................................................... 73
5.8 Computer programs for automatic sprinkler modeling ...................................................................... 78
5.9 Summary........................................................................................................................................... 78
5.10 References ........................................................................................................................................ 79
6 Smoke movement, control and toxicity .................................................................................................. 85
6.1 Objectives......................................................................................................................................... 85
6.2 Application of codes and standards................................................................................................... 85
6.3 Design fire for smoke movement........................................................................................................ 86
6.4 Situations to evaluate smoke movement and control .......................................................................... 89
6.5 Smoke movement evaluation tools ..................................................................................................... 91
6.6 Mechanical and natural Smoke control systems ................................................................................ 94
Page 6
vi
6.7 Smoke toxicity and visibility aspects................................................................................................ 100
6.8 Software for modeling smoke movement and smoke control............................................................. 104
6.9 Summary......................................................................................................................................... 105
6.10 References ...................................................................................................................................... 106
7 Structural frame................................................................................................................................... 113
7.1 Objectives....................................................................................................................................... 113
7.2 codes, standards and publications for evaluating fire resistance...................................................... 114
7.3 Design fire...................................................................................................................................... 116
7.4 Construction material properties .................................................................................................... 117
7.5 Computer modeling of structural fire resistance for concrete members............................................ 121
7.6 References ...................................................................................................................................... 122
8 Fire Brigade intervention ..................................................................................................................... 125
8.1 Objectives....................................................................................................................................... 125
8.2 The building code ........................................................................................................................... 126
8.3 Fire services ................................................................................................................................... 126
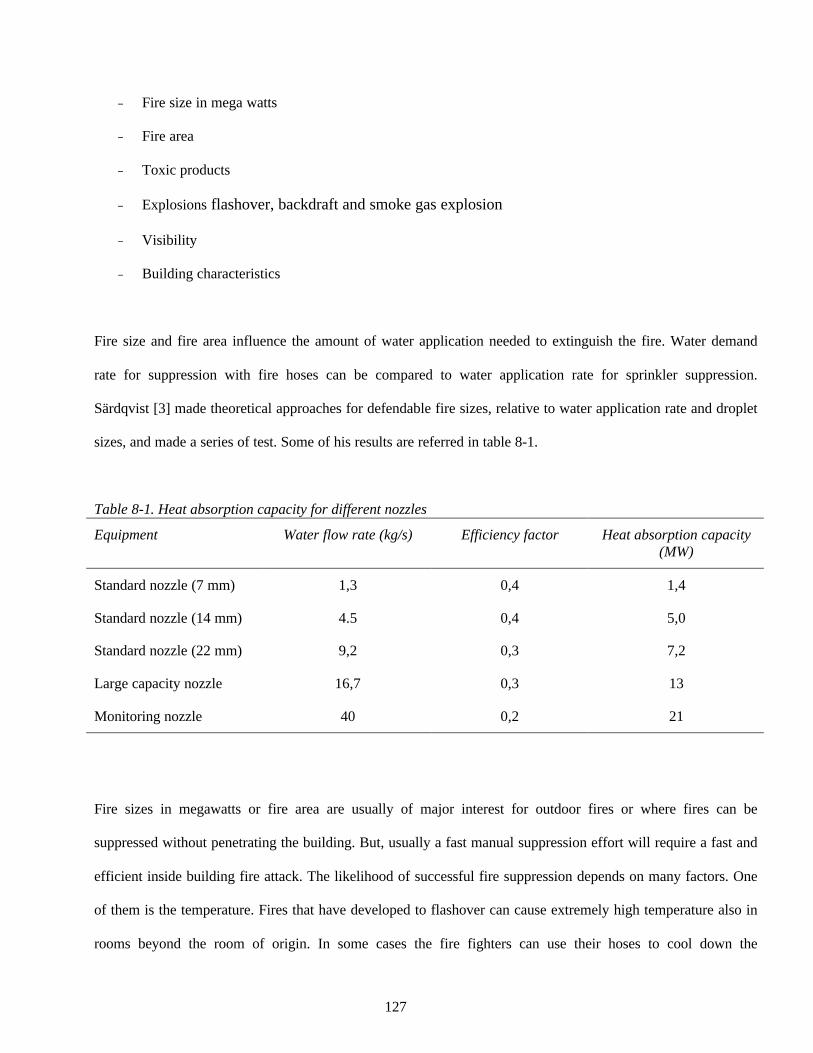
8.4 Critical fire and building characteristics for manual suppression.................................................... 126
8.5 Fire brigade Timeline prediction .................................................................................................... 129
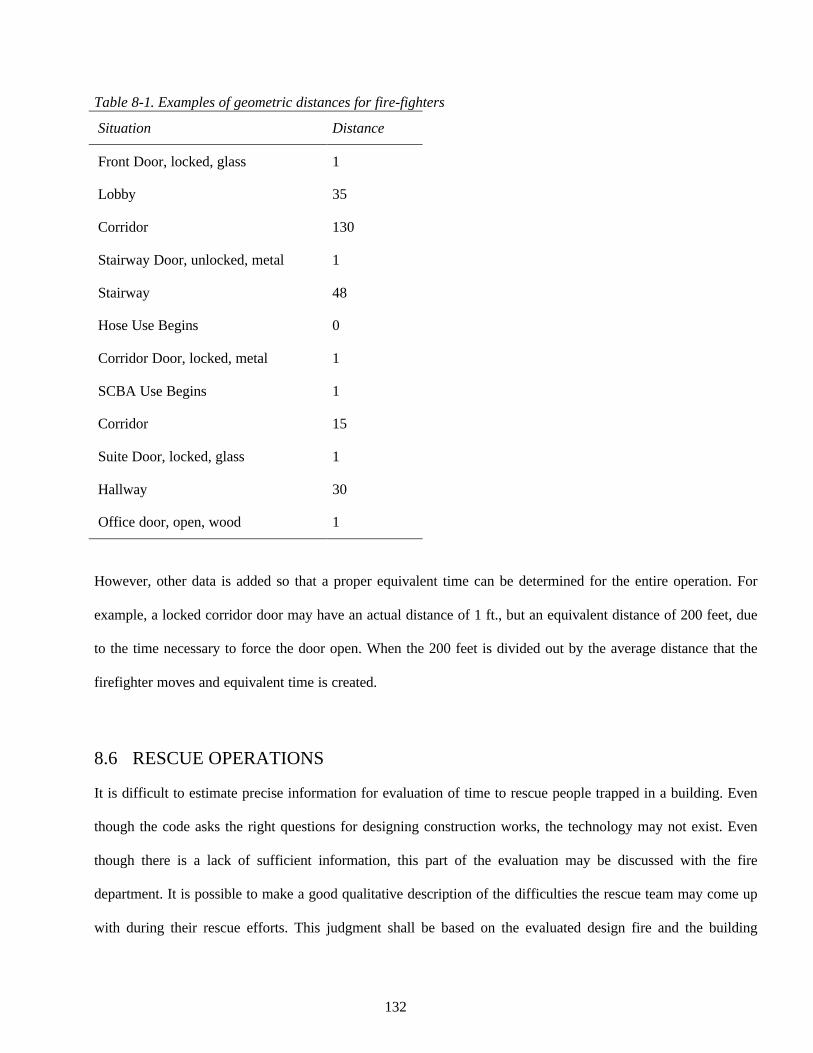
8.6 Rescue operations........................................................................................................................... 132
8.7 Summary......................................................................................................................................... 134
8.8 References ...................................................................................................................................... 134
9 Life Safety............................................................................................................................................. 136
9.1 Documentation of the Code requirements for safe egress ................................................................ 136
9.2 Available safe egress time............................................................................................................... 138
9.3 Required egress time....................................................................................................................... 139
9.4 Summary......................................................................................................................................... 142
9.5 References ...................................................................................................................................... 142
CONCLUSION ............................................................................................................................................ 145
Page 7
vii
LIST OF TABLES
Table 2-1. Standard test methods .................................................................................................................. 10
Table 2-2. Classification of building products............................................................................................... 11
Table 2-3. Fire growth phases........................................................................................................................ 13
Table 2-4. Bukowski recommendations for fire intensity coefficient [5]: ..................................................... 15
Table 3-1. Calculated applied energy onto test assembly during the ISO-834 fire test................................ 29
Table 3-2. Published Estimates for passive protection systems operational reliability................................ 29
Table 3-3. Fire door closure data (FMEA Surveys 1984 - 1988)................................................................... 30
Table 3-4. Causes of fire door closure (from FMEA survey) ........................................................................ 30
Table 4-1. Detectable fire signatures ............................................................................................................. 40
Table 4-2. Summary of first second and third actions of the occupants [32] ............................................... 43
Table 4-4. Operational reliability estimate for smoke detectors [26]............................................................ 52
Table 4-5. Decision and response time for FiRECAM .................................................................................. 55
Table 4-6. Estimated time to recognize and understand the alarm signal.................................................... 55
Table 5-1. Typical sprinkler head data.......................................................................................................... 67
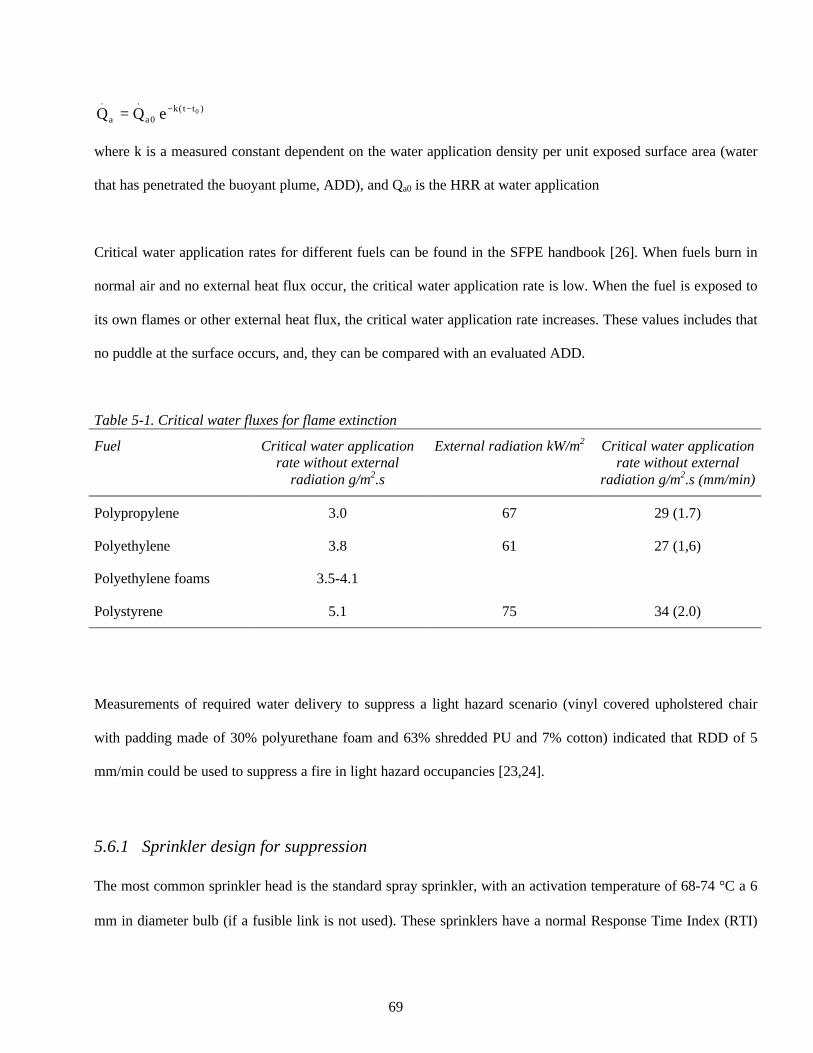
Table 5-2. Critical water fluxes for flame extinction..................................................................................... 69
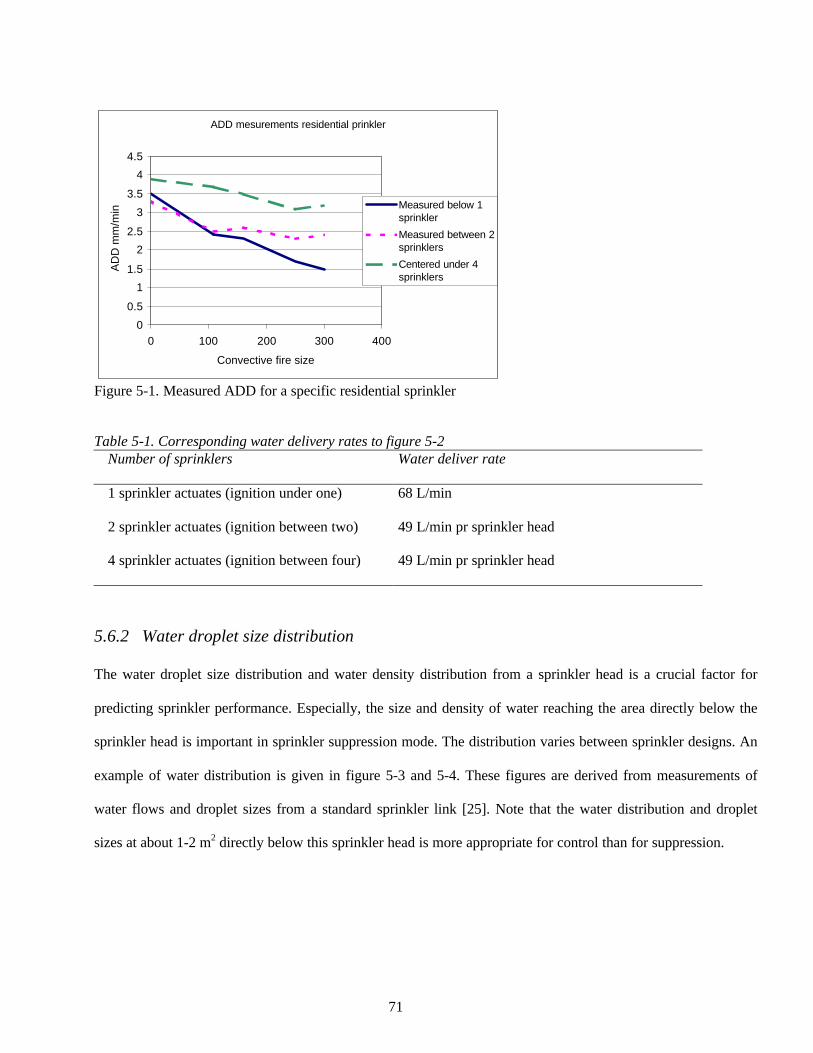
Table 5-3. Corresponding water delivery rates to figure 5-2 ........................................................................ 71
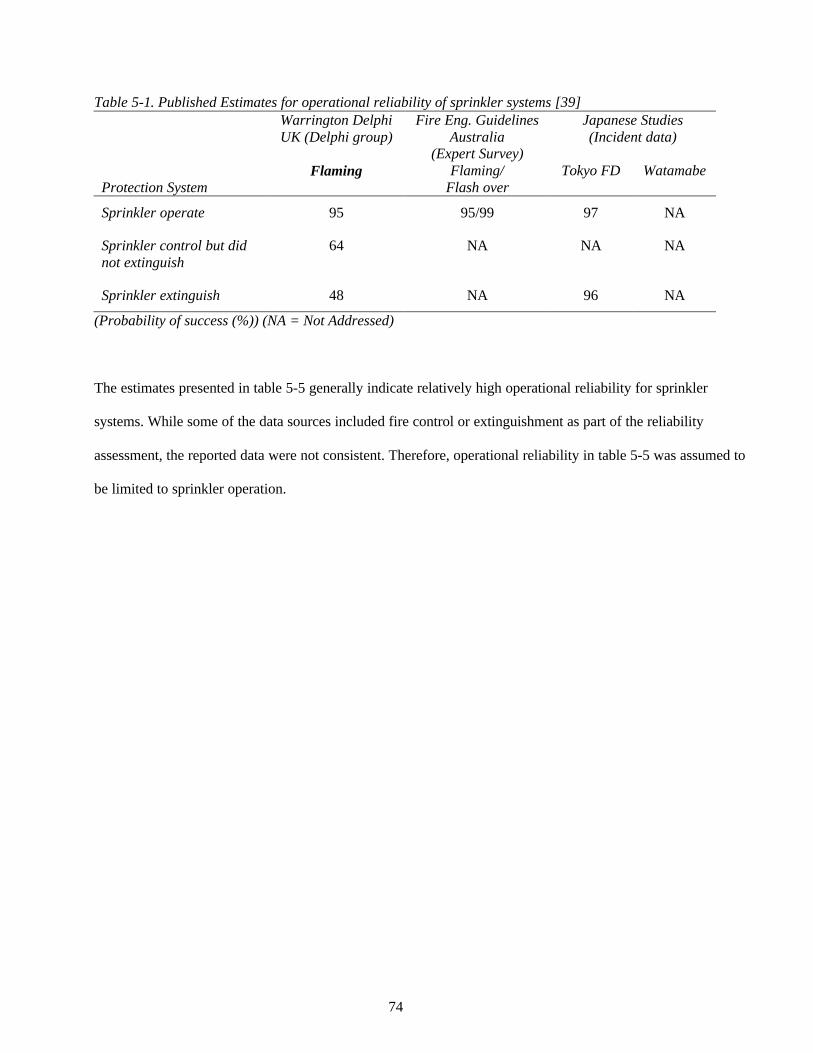
Table 5-4. Published Estimates for operational reliability of sprinkler systems [39]................................... 74
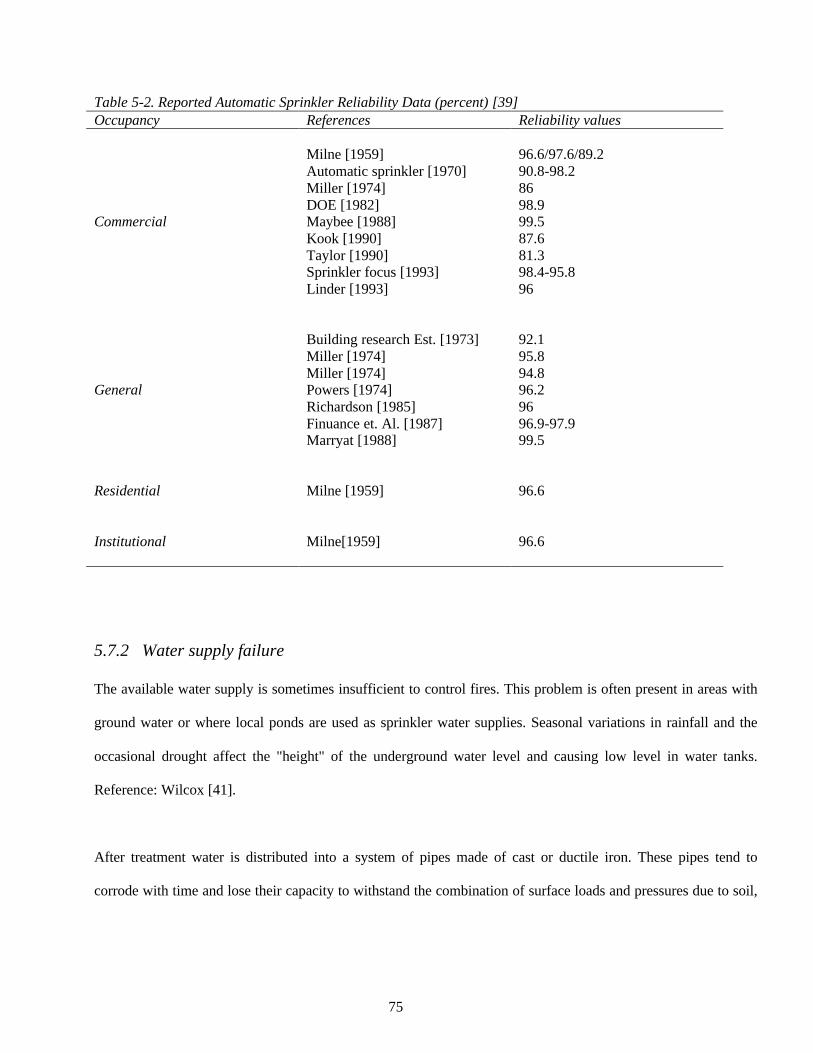
Table 5-5. Reported Automatic Sprinkler Reliability Data (percent) [39] ................................................... 75
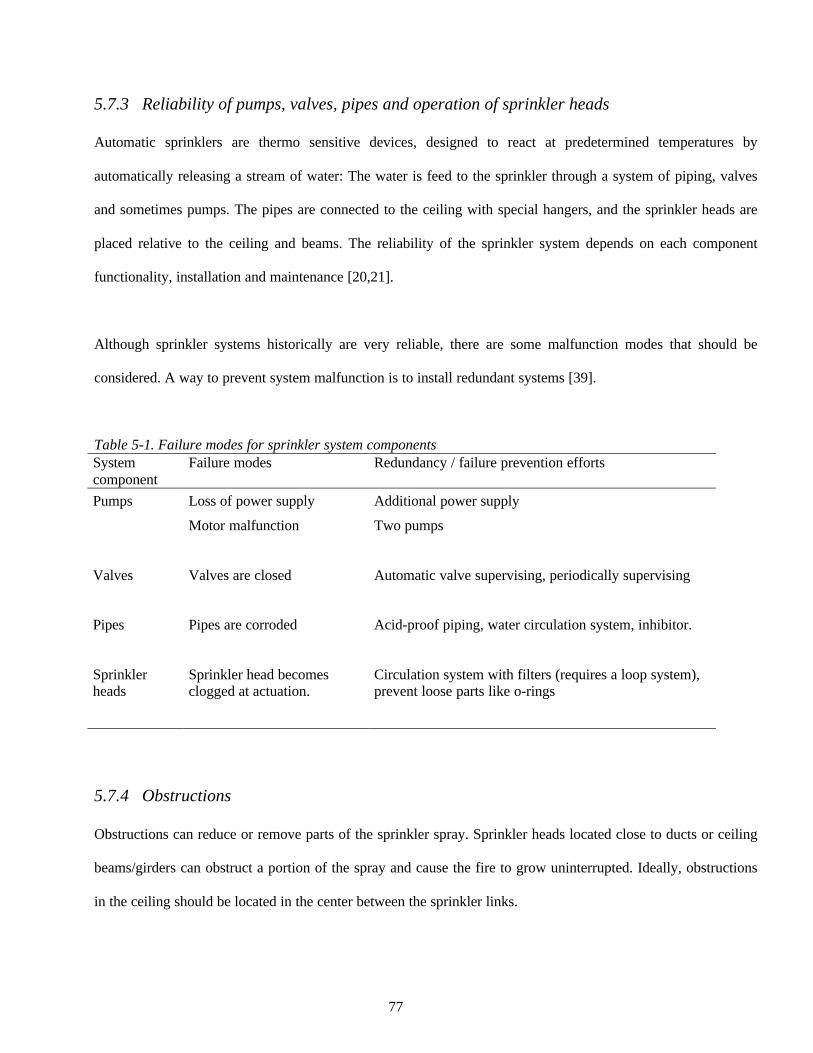
Table 5-6. Failure modes for sprinkler system components ......................................................................... 77
Table 6-1. Recommend fire areas designing atria smoke ventilation [7]. ..................................................... 88
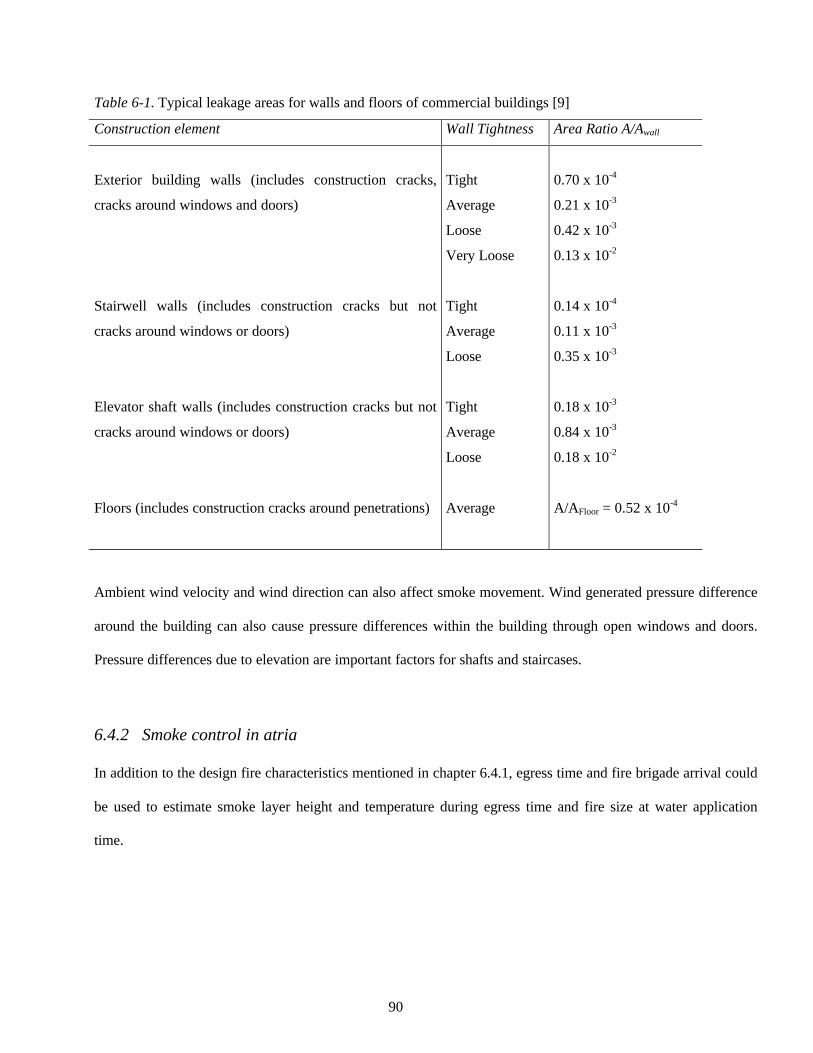
Table 6-2. Typical leakage areas for walls and floors of commercial buildings [9]...................................... 90
Table 6-3. Deterministic acceptance criterion for smoke toxicity [59] ....................................................... 101
Page 8
viii
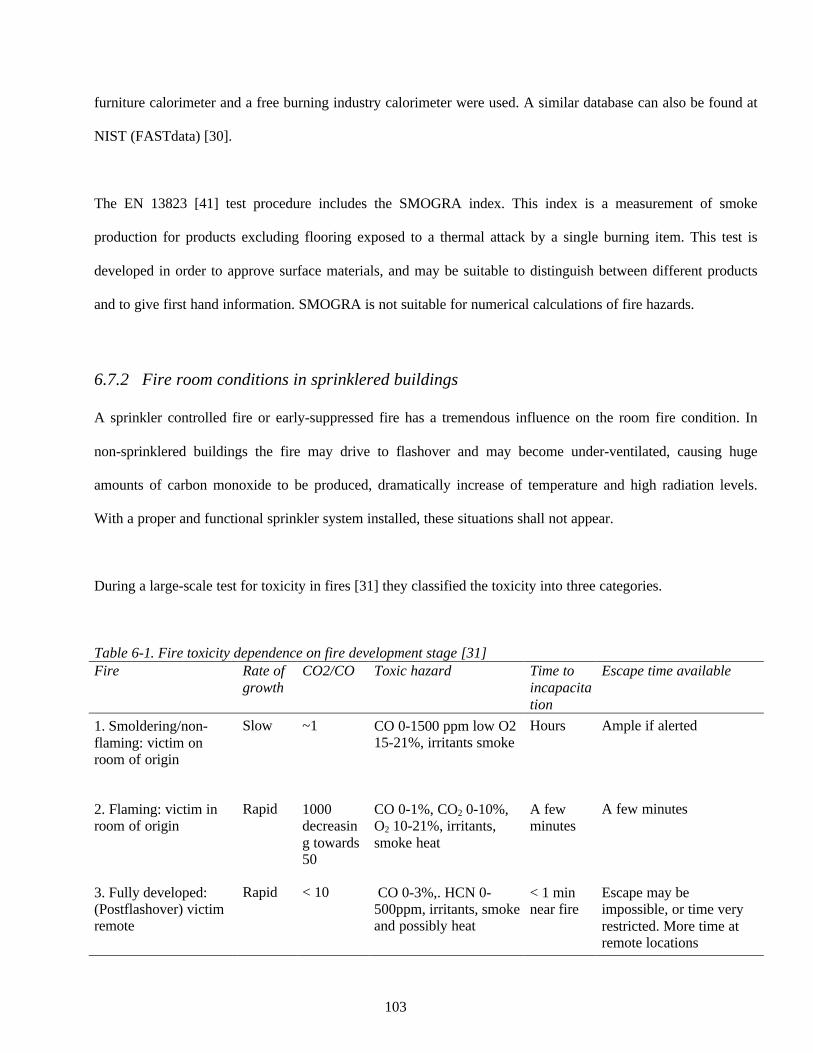
Table 6-4. Fire toxicity dependence on fire development stage [31] ........................................................... 103
Table 7-1. References for evaluating fire resistance of structures .............................................................. 116
Table 8-1. Heat absorption capacity for different nozzles .......................................................................... 127
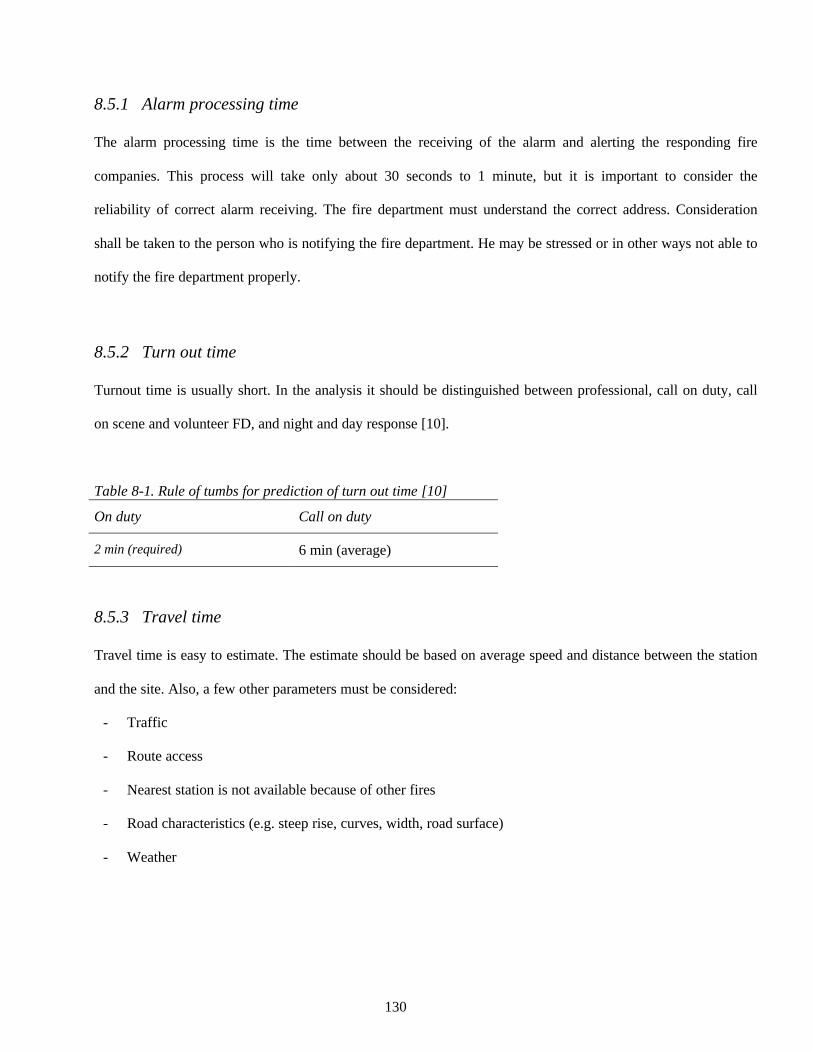
Table 8-2. Rule of tumbs for prediction of turn out time [10]..................................................................... 130
Table 8-3. Examples of geometric distances for fire-fighters...................................................................... 132
Page 9
ix
LIST OF FIGURES
Figure 5-1. Objectives of sprinkler evaluation .............................................................................................. 62
Figure 5-2. Measured ADD for a specific residential sprinkler .................................................................... 71
Figure 5-3. Measured droplet size and water flow at different distances from center under a standard
pendent sprinkler head........................................................................................................................... 72
Figure 5-4. Measured water flow distribution from a standard pendent sprinkler head. ........................... 72
Page 10
1
1 INTRODUCTION
Building fires and human behavior in fire scenarios are complicated and difficult to predict. However, prediction
of fire performance and risk characteristics is necessary when performance based codes are used to design fire
safety in buildings. The traditional methods to design fire safety are described by the prescriptive codes. These
codes have continuously evolved from older codes where the methods described have provided satisfied
firesafety. When buildings are to be designed according to a performance based code, focus must be re-directed
from the prescriptive methods to building performance in fires. In performance based design the focus is on the
building's potential for fire development and smoke spread, the performance of fire detection systems and
suppression systems, performance of structural frames, building performance for fire brigade intervention, and
human actions. These factors either influence on time available for egress or time necessary for egress.
An enormous amount of deterministic information on fire defenses and behavior is available. Tests have been
performed on building materials to address their properties in fires and tabulated data can be found, tests have
been performed on animals to derive toxic thresholds, and surveys and interviews have been performed to
understand human behavior in building fires. The development in computer programs have supplied the fire
protection engineers with better tools to achieve more credible information about fire scenarios.
Prescriptive codes are applied to a building, the firesafety level may be overrated or in some cases insufficient.
Building designs shall at least have a minimum level of firesafety, which can be developed from the
understanding of building performance and occupant behavior in fires. A minimum or sufficient level of fire
safety may be a vague way of expressing safety. Here, the prescriptive codes can be useful for comparision.
Page 11
2
A continuous development in fire protection engineering is in progress. The perspective has been moved from
detailed regulations and approval to private engineering firms with liability at law. The qualifications in fire
protection consultancy are increasing, and fire protection engineers need interdisciplinary qualifications in
building projects generally, and qualifications in fire protection design specifically. The consultants are required
to use suitable and applied method of analysis and calculation to give satisfaction documentation of the fire
safety design.
The Norwegian performance based code (TEK) [1] is discussed throughout this paper. The fire protection
section of the code starts with the statement that compliance to fire safety requirements as specified in TEK shall
be documented either by executing the construction works in conformity with pre-accepted design criteria and
solutions, or by analyses and/or calculations which proves a satisfactory safety against fire. This paper addresses
the issue of documenting fire safety by analysis and calculation, with references to appropriate documents.
The requirements in TEK [1] and the pre-accepted methods to satisfy the requirements written in REN [2] are
discussed in order to organize their means of fire protection. So that the traditional means of fire protection can
better be understood and evaluated comparative to an alternate fire protection design. The analysis and/or
calculation in the evaluations shall simulate the fire development and present the necessary margins of safety for
the most unfavorable conditions which may occur in the use of the construction works. The essential and
difficult part of a fire safety evaluation is to establish an appropriate design fire. Information to develop a design
fire for each particular sub evaluation can be deduced in standards and publications. When the design fire has
been established a general understanding of the specific factors affecting constructions, systems and humans in
fires needs to be documented. The construction and systems efficiency and reliability in resisting, suppressing
and controlling, the fire can be evaluated qualitatively. As the technology in fire protection develops better
quantitative measures can also be performed. Today, tests to measure flame spread on surfaces are conducted at
national building and fire laboratories in industrial countries, and they conduct tests to measure structural and
barrier resistance to fire. Numerical methods to evaluate construction behavior in fires have been standardized.
Page 12
3
Smoke production and movement can be evaluated with simple tools and complex field models. The model's
accuracy depends more on the design fire characteristics than the model itself. Numerical methods to evaluate
smoke detectors and sprinkler activations are based on physical phenomena in nature, and good predictive
methods are available. Better technology to predict sprinkler suppression will probably be available in a few
years, but rough predictions can be performed with the tools available. Research has also led to better
understanding of human behavior in fires, so that the results of numerical simulation of egress can be adjusted.
A performance based design appears to rely on three sources of information; objectives; a design guide and
reference material. The objective may be written in a performance-based code, a design guide may be NS3901
that describes the methodology for a performance based design, and, the reference material may be one or more
publication that addresses a specific aspect of fire safety. The goal of this paper is to identify some of the
references that can be used to characterize building performance and human behavior in fires, but also a general
description of the code objectives and design methodology is presented.
Publications and literature are usually based on experience, test, interviews, statistics or others methods to
achieve knowledge about reality. This information may be based on reality so that it can be used to understand
the performance of buildings, systems and humans in fires. The goal of this document is to identify a format that
enables references for performance evaluations to be retrieved efficiently. The references are listed
systematically so that the reader can more easily find appropriate information for evaluation. The listed
references are discussed or referred to in the text section. Some references are listed under several sections
because they include information about several aspects of the evaluation.
Page 13
4
1.1 REFERENCES
1. National Office of Building Technology and Administration (Norway): TEK-97, Regulations concerning
requirements for construction works and products for construction works, 22 January 1997 No. 33 Technical
Regulations under the Planning and Building Act 1997.
2. National Office of Building Technology and Administration (Norway): REN, Guidance to Regulations
concerning requirements for construction works and products for construction works, 2nd edition, April 1997.
Page 14
5
2 FIRE SPREAD WITHIN THE ROOM OF ORIGIN
Fires usually start with an ignition initiated by an arc, hot plate, cigarette ember or by an intentional act. From a
tiny ignition source, the fire may be able to grow continuously to full room involvement (FRI). The availability
of nearby kindling fuels combined with items of sufficient fire load are necessary factors to make the fire grow.
Fire can spread from item to item by radiation from flames or by radiation from the developing hot smoke layer.
The identification of fuel arrangements, fuel surfaces and the room geometry can make a fire protection engineer
(FPE) able to evaluate the likelihood of fire growth and FRI.
This chapter will introduce methods, and selected references, the fuels and their arrangement, room container,
and ventilation affect fire behavior. Different configurations pose different potential hazard conditions and times
to FRI. Fire dynamic fundamentals are the basis by which room classifications may be determined. Strategies to
perform a performance evaluation of fire spread within the room of origin can be established. It is important to
note that in evaluating fire growth potential it is assumed that no automatic or manual suppression of any type
operates.
2.1 OBJECTIVES
The objective of an evaluation is to be able to classify room contents as to the relative hazard and time to FRI. In
order to do this evaluation it will first be necessary to gather information about the room geometry, ventilation
conditions and heat isolation, then the room content, fuel arrangements, fuel loads, surfaces and ignition
properties should be identified. With this information a room fire hazard classification can be done. Normally,
this is a simple judgment between a large room fire scenario and a small room fire scenario. Thereafter, software
or hand calculation tools together with knowledge of the fuel surfaces can be used to evaluate the likelihood of
fire spread from established burning, to the enclosure point, ceiling point and finally FRI.
Page 15
6
2.2 APPLICATION OF CODES AND STANDARDS
The Norwegian performance based code [35] emphasis that "materials and surfaces that do not contribute to
unacceptable development of fire shall be used". This means that unacceptable development of fire shall be seen
in relation to evacuation and Fire Department manual suppression efforts. Further on "consideration should be
given to time to flashover, heat release, smoke production and development of toxic gases". In order to predict
the fire characteristic the surface materials should be classified according to national or international fire tests or
at least compared to similar classified products.
Nationally pre accepted solutions (REN) [36] to the codes have been developed through decades. That is, the pre
accepted solutions were the codes just a few years ago. Experience from fires has taught the governments what
kind of surfaces shall be used in the egress paths, in nursing homes, hospitals, offices, homes etc. So far, it is
more common to classify materials as incombustible, difficult to ignite and weakly heat producing (In1/Ut1),
normal ignition and normal heat producing (In2/Ut2), and no requirements. Based on the risk for humans and
properties, the human characteristics and building characteristic the governments recommends tall buildings to
be built with exterior incombustible surfaces and nursing homes and hospitals should have incombustible interior
surfaces. The recommendations are simply based on the fire department's reduced ability to extinguish or control
fires in tall buildings, and that older and sick people need more time to evacuate a building.
These requirements for internal and external surfaces given in REN are just a small part of the total concept for
fire safety in a prescriptive designed building. Usually the requirements will lead to a good fire safety concept. In
other cases, the requirements cannot stand alone, but are used together with other fire protection systems,
building layout, geometry and room contents. This evaluation is only for the potential of fire growth -
unrestricted by other automatic systems.
When not using the requirements in the REN, the fire safety shall be documented and proven by analysis. The
Norwegian Standardization Counsil (NSF) has developed the standard (NS3901) [37] which describes how an
Page 16
7
analysis shall be performed. The standard distinguishes among three methods to evaluate fire safety in buildings:
against probabilistic, deterministic and comparative -acceptance criteria [38]. A probabilistic acceptance
criterion might be described as the probability of more than two rooms are involved in a fire or more than five
people are killed. A deterministic criterion might say no one shall be lost during evacuation (because the
concentration of toxic gases is below the accepted criteria). A comparative criterion is a measurement against the
prescriptive codes.
A probabilistic evaluation is perhaps the most uncertain analysis, because events are based on randomness and,
therefore are difficult to measure. In fire protection, evaluation tools to evaluate the probability of the number of
people killed in a future fire are difficult or almost impossible. On the other hand, statistical probabilities of fire
spread through doors, cracks and openings should be relatively easy to achieve. Historical data can be used as a
basis to evaluate fire loads, and the knowledge about future furnishings can be used to evaluate the likelihood of
fire spread. Although the future arrangements of fuels and their characteristics are seldom known in detail, the
room content classification must be generally described. Words like widely scattering, dens, 10 or 100 kg pr
fuel package, easy ignitability, difficult to ignite can be used together with quantitatively data as less than a foot,
several meters, ignites at less than 20 kW/m2 etc.
A deterministic analysis is more similar to "will happen" or "will not happen". This analysis must presuppose
that a standard fire development can occur and that there are enough fuel and air to drive the fire to FRI. Time to
FRI or HRR at FRI are deterministic evaluations. Information needed to do a time to FRI evaluation includes the
combustion and fire spread properties of both fixtures and fittings. For most buildings a standard fire
development can be mathematically described with a time dependent exponential function for heat release rates
(HRR). Only a simple constant needs to be identified.
A comparative analysis should not be used to evaluate fire spread within the room of origin alone, but a
comparison can be performed after other sub evaluations have been performed. For example, if sprinklers or
Page 17
8
smoke ventilation are options for fire safety, the time to FRI or probability of FRI may be better when designing
to a performance based code then the prescriptive code.
NS3901 [37] allows the analysis to be either qualitative or quantitative, or a combination. The most important
consideration is that the FPE is satisfied with his judgment. An experienced engineer may be able to describe the
results without doing correlation or software simulations. Others need to do simulations or tests to gain
information about quantities in fire dynamics.
2.3 IDENTIFICATION OF ROOM FIRE LOADS
The room size has a significant influence on fire behavior. Fires in small rooms can develop to FRI in a short
period of time. Larger rooms need more energy to be heated up to that point. Mainly, there are two different
types of room fire scenarios:
- A small room fire scenario shall be identified by the likelihood of a large energy source relatively to the
room. Relative to the fire, the room can be characterized as small because one fire source may be
sufficient to generate a hot smoke layer and drive the fire to FRI. Fires in small rooms tend to develop
similar to a predictable curve. When FRI occurs, the rate of heat release increases dramatically because
the other room surfaces ignite almost simultaneously. The fire will then stabilize due to the availability
of air.
- A large room fire scenario shall be identified by the likelihood of a small energy source relatively to the
room. In a large room, one fire is rarely sufficient to cause FRI. However, if other fuel items are close
enough, the fire will tend to spread from item to item.
The classification of rooms in fire protection evaluation is dependent on the arrangements of fuels, estimated fire
sizes and amount of energy in the fuel packages. By doing this analysis, it could be found that a warehouse of
1000 m2 and 10 meters in height shall be considered and analyzed as a "small room", because the warehouse
Page 18
9
contains large amounts of combustibles. Another geometrical small room could be analyzed as a "large room"
fire scenario because it only will contain small and few combustible items (e.g. corridors or staircases).
Identification of HRR at flashover may be evaluated with hand calculation tools or with software. The hand
calculation tools can give important first order information [21,22]. If better approximations are needed the zone
model CFAST, may be used [1]. The state of the art software simulation technique is the computer fluid dynamic
(CFD) models. Fire Dynamic Simulator [2] may be used to find necessary HRR to cause FRI. The latter
evaluation will be time consuming and normally not necessary to distinguish between "small" or "large room"
fire scenarios.
The evaluated HRR needed to cause FRI shall be measured against the maximum HRR for typical room
furniture and fixtures. Measured HRR for common materials may be found in books and papers [9,10,14]. HRR
from fire in wall linings may be calculated. The HHR per unit surface area can be known by estimating flame
emissivity and irradiation, heat of gasification and heat of combustion [33].
A listing of furniture and fixtures with information of weight, heat of combustion and fuel load should be made.
The summarized fire load can be compared to statistical data for fire loads [7,8].
2.4 IDENTIFICATION OF FUEL SURFACES
After the room is classified as "small" or "large", the next step is to evaluate the fuel surfaces and their fire
properties. After a judgment of the likelihood of FRI has been made, the time relationships are then determined.
In order to evaluate time to enclosure point, ceiling point and FRI, more detailed information about the fuel
surfaces is needed. First hand information like conductivity (k), density (ρ), specific heat (cp) and ignition
temperatures can be found in tables [34]. Materials with low values of kρcp and low ignition temperature may
cause a fire to spread faster.
Page 19
10
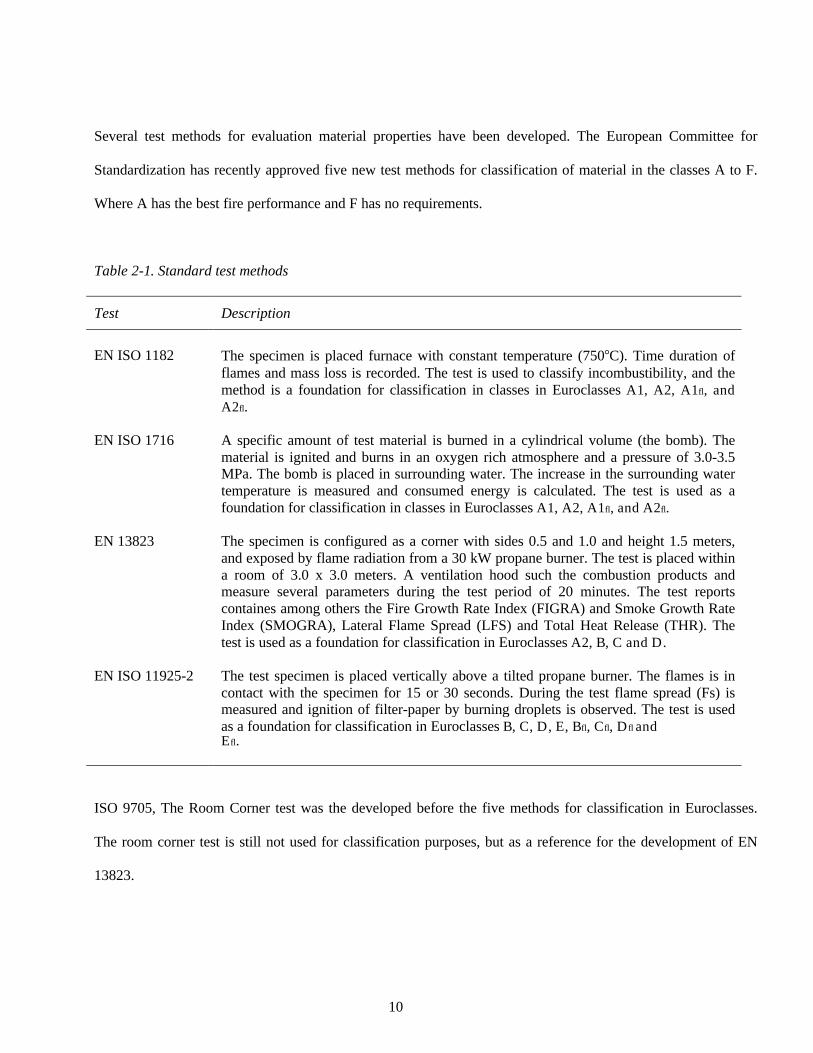
Several test methods for evaluation material properties have been developed. The European Committee for
Standardization has recently approved five new test methods for classification of material in the classes A to F.
Where A has the best fire performance and F has no requirements.
Table 2-1. Standard test methods
Test Description
EN ISO 1182 The specimen is placed furnace with constant temperature (7508C). Time duration offlames and mass loss is recorded. The test is used to classify incombustibility, and themethod is a foundation for classification in classes in Euroclasses A1, A2, A1fl, andA2fl.
EN ISO 1716 A specific amount of test material is burned in a cylindrical volume (the bomb). Thematerial is ignited and burns in an oxygen rich atmosphere and a pressure of 3.0-3.5MPa. The bomb is placed in surrounding water. The increase in the surrounding watertemperature is measured and consumed energy is calculated. The test is used as afoundation for classification in classes in Euroclasses A1, A2, A1fl, and A2fl.
EN 13823 The specimen is configured as a corner with sides 0.5 and 1.0 and height 1.5 meters,and exposed by flame radiation from a 30 kW propane burner. The test is placed withina room of 3.0 x 3.0 meters. A ventilation hood such the combustion products andmeasure several parameters during the test period of 20 minutes. The test reportscontaines among others the Fire Growth Rate Index (FIGRA) and Smoke Growth RateIndex (SMOGRA), Lateral Flame Spread (LFS) and Total Heat Release (THR). Thetest is used as a foundation for classification in Euroclasses A2, B, C and D.
EN ISO 11925-2 The test specimen is placed vertically above a tilted propane burner. The flames is incontact with the specimen for 15 or 30 seconds. During the test flame spread (Fs) ismeasured and ignition of filter-paper by burning droplets is observed. The test is usedas a foundation for classification in Euroclasses B, C, D, E, Bfl, Cfl, Dfl andEfl.
ISO 9705, The Room Corner test was the developed before the five methods for classification in Euroclasses.
The room corner test is still not used for classification purposes, but as a reference for the development of EN
13823.
Page 20
11
Measurements from the oxygen consumption calorimeter can be used to predict time to flashover in the room
corner test. Time to ignition and total heat release in the bench scale test together with surface material density is
measured. Measured or calculated time to flashover can be used in building fire performance evaluation.
Methods for doing calculation are described in [21].
Table 2-2. Classification of building productsProducts Time to flashover ISO 9705 Norwegian
classificationEuroclass
Stone, concrete > 20 min In1 A1
Gypsum board > 20 min In1 A2
Fireproof wood > 20 min In1 B
Wallpaper on gypsum board > 10 min In2 C
Wood > 2 min In2 D
Light weighted fibre board > 2 min - E
Some plastics > 2 min - F
(Source: BEnytt nr. 3 / November 1998)
The cone calorimeter was invented by NIST in 1982 [42]. Since then, methods to predict full scale HRR from
bench scale test have been developed. This can be done by measuring average HRR during 180 seconds after
ignition with 35 kW/m2 exposure [21,40]. With this method, the HRR at full scale testing can be predicted.
The LIFT apparatus was developed by to predict flamespread, and methods to evaluate the results are developed
by Quintiere and Harkleroad [11]. The test specimen is placed vertically and exposed by a tilted flame panel.
Time to ignition and lateral flame spread is recorded. The test results can be used to calculate fire spread rate by
hand calculation method [12,16] or software simulations with Fire dynamic simulator [2].
Page 21
12
A large database containing test data from numerous different materials have been established at NIST [32]. The
database contains ignition data and HRR data, as well as mass loss rate, CO, CO2, soot and smoke extinction.
These tests are performed both as full scale and bench scale.
2.5 ESTIMATION FIRE GROWTH
Evaluation of the likelihood of fire spread is difficult and includes much uncertainty because the fundamental
input for the evaluation is crucial. A good description of room content, surfaces, flamespread properties and fuel
load in relation to the room geometry could end up in a clarifying conclusion.
In "large room" fire scenarios the likelihood of flame spread by ignition of other fuel items can be evaluated by
hand correlation. The maximum fire size can be found [9,10,14] and then emissivity, configuration factor and
irradiation from the flames to another object can be found [31]. The probability estimate could be based on
maximum distance for ignition compared to expected distances between the items [41]. Software programs such
as CFAST and FPETOOL do also provide simple tools for evaluating safe separation distance from a prescribed
fire size [1,4].
FDS Version 2 can also be used to evaluate the likelihood of flame spread [2]. The program routines for
calculating irradiance will normally lead to an over prediction. And, the program is not fully able to simulate
melting and charring. Although, the program can use all the other parameters it is not fully able to predict reality.
2.6 REALMS OF FIRE GROWTH
The realms of fire growth can be divided into four stages. The main reason is that the fire makes different threats
to humans and property during its development from established burning to FRI. Each of the realms has
characteristic properties.
Page 22
13
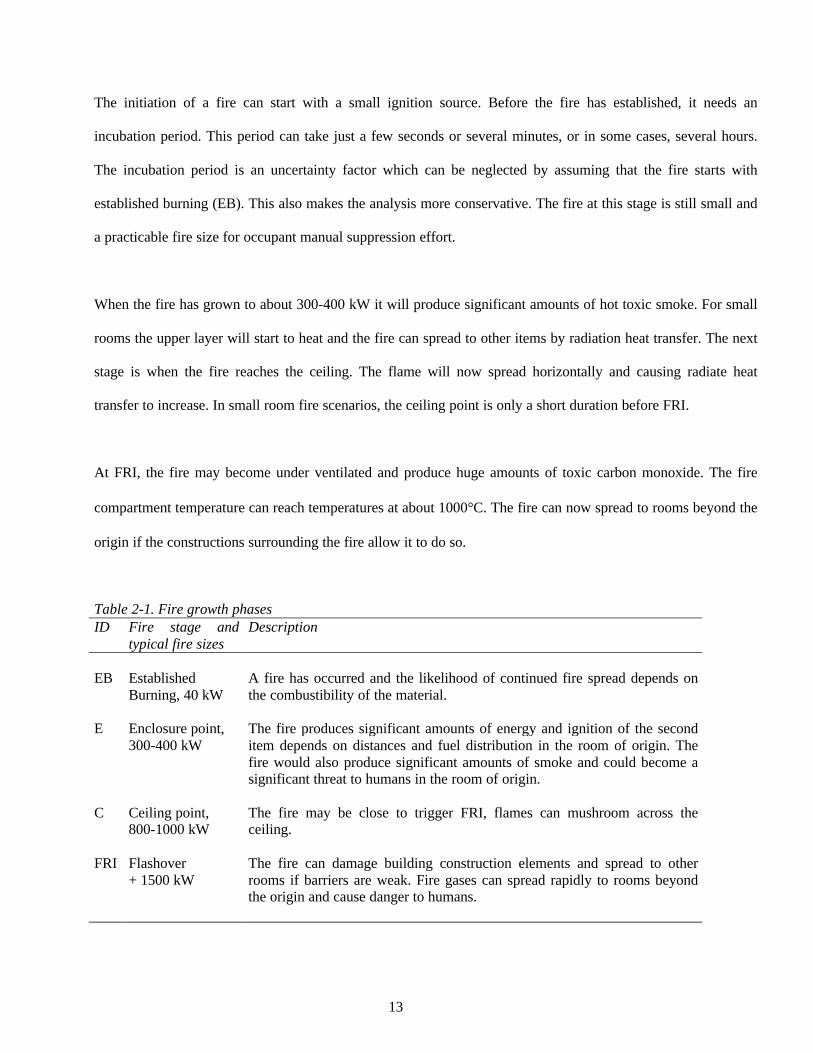
The initiation of a fire can start with a small ignition source. Before the fire has established, it needs an
incubation period. This period can take just a few seconds or several minutes, or in some cases, several hours.
The incubation period is an uncertainty factor which can be neglected by assuming that the fire starts with
established burning (EB). This also makes the analysis more conservative. The fire at this stage is still small and
a practicable fire size for occupant manual suppression effort.
When the fire has grown to about 300-400 kW it will produce significant amounts of hot toxic smoke. For small
rooms the upper layer will start to heat and the fire can spread to other items by radiation heat transfer. The next
stage is when the fire reaches the ceiling. The flame will now spread horizontally and causing radiate heat
transfer to increase. In small room fire scenarios, the ceiling point is only a short duration before FRI.
At FRI, the fire may become under ventilated and produce huge amounts of toxic carbon monoxide. The fire
compartment temperature can reach temperatures at about 1000°C. The fire can now spread to rooms beyond the
origin if the constructions surrounding the fire allow it to do so.
Table 2-1. Fire growth phasesID Fire stage and
typical fire sizesDescription
EB EstablishedBurning, 40 kW
A fire has occurred and the likelihood of continued fire spread depends onthe combustibility of the material.
E Enclosure point,300-400 kW
The fire produces significant amounts of energy and ignition of the seconditem depends on distances and fuel distribution in the room of origin. Thefire would also produce significant amounts of smoke and could become asignificant threat to humans in the room of origin.
C Ceiling point,800-1000 kW
The fire may be close to trigger FRI, flames can mushroom across theceiling.
FRI Flashover+ 1500 kW
The fire can damage building construction elements and spread to otherrooms if barriers are weak. Fire gases can spread rapidly to rooms beyondthe origin and cause danger to humans.
Page 23
14
2.7 FIRE GROWTH RATE
A standard t2-fire growth can be chosen in most cases. The t2-fire is valid during the room growth period of the
fire if the fire spreads above a horizontal surface. In cases where fire spreads upward (e.g. in stacks or on walls),
the fire may be a t3-fire in the early stages because of the three dimensional situation.
For a t2-fire, some comparative values can be found in the appendices in NFPA 72 [6]. But in each scenario, the
engineer must decide whether the fire grows slow, medium, fast or ultra fast. Geometry and wind must also be
included. These factors can have a significant influence on the rate of fire growth [8].
The primary importance of the appropriate selection of the design fire’s growth is in obtaining a realistic
prediction of detector and sprinkler activation, time to start of evacuation, and time to initial exposure of
occupants. Thus, this is important to an egress analysis, which makes up the majority of alternative design
analyses. In addition, since the effectiveness of fire brigade intervention is dependent on the fire size at initial
water application, the t2-fire classification enables a fire to be estimated more rationally.
Q = α t2.
where,
Q is the Heat Release Rate
α is the fire growth coefficient in kW/s2
t is time in seconds
These specific sets of fire growth curves have been incorporated into several design methods such as for the
design of fire detection systems in NFPA 72, National Fire Alarm Code. They are also referenced as appropriate
design fires for performing alternative design analyses in Australia and Japan, and in product fire risk analysis
Page 24
15
methods published in USA [15]. In the Australian methodology, the selection of growth curve is related only to
the fuel load (mass of combustible material per unit floor area). This may not be the only approach since growth
rate is also related to the form, arrangement, and type of material and not simply its quantity. Consider 10 kg of
wood, arranged in a solid cube, sticks arranged in a crib, and as a layer of sawdust. These three arrangements
would have significantly different growth rates while representing identical fuel loads.
Time dependency on fire growth is a function of fuel surfaces, fuel arrangements and fuel geometries. Fire
spread on vertical and horizontal surfaces can be evaluated with the results from LIFT measurements [11,12].
The calculation procedures are rather complex and almost dedicated to computer models. The fire Dynamic
Simulator version 2 [2] includes a numerical solution to the flame-spread model presented by Gamal et. al [16].
Other flame-spread models are described in [12,17,18,19,20].
Usually, the fire growth is described as a t-squared standard fire. This is a simplification that makes fires
reasonably easy to predict. By selecting an appropriate value for the fire growth rate constant a quick first order
approximation about time to flashover can be predicted. Information to obtain the fire growth coefficient α, can
be found in [5,6]. Correlations for minimum HRR for flashover [9,11,12] can be evaluated against the t-squared
fire in order to predict likelihood of flashover.
Table 2-1. Bukowski recommendations for fire intensity coefficient [5]:Fire curve Characteristics of fuels Fire intensity
coefficient α,(Q=αt2).
Slow Fires involving thick solid objects (solid wood table, bedroom dresser orcabinet)
0,00293 kW/s2
Medium Fuels of lower densities (upholstered furniture and mattresses) 0,01172 kW/s2
Fast Fires involving thin, combustible items (paper, card boxes, draperies) 0,0469 kW/s2
Ultra fast Some flammable liquids and some older types of upholstered furniture andmattresses or other highly volatile fuels
0,1876 kW/s2
Page 25
16
2.8 SUMMARY
The probability of an established fire to grow to flashover depends on the availability of fuels in the fire room.
The codes have requirements for surface materials, but no requirements for other fuels stored in a compartment.
The evaluation of fire spread within the room of origin is an evaluation of fire sizes relatively to the room size or
initial fire relatively to distances to other fuel items. The fuels can be characterized with their ignitability and
heat load, measured in standard tests for surface material fire rating. Prescribed fires can be used in computer
models to evaluate the probability of flashover or evaluate minimum safe separation distance.
A room fire can be divided into realms, where each realm has specific consequences for the environment and
occupants. The fire growth rate is usually described as a t-square fire, and the growth rate are evaluated from the
characteristics of the surface materials predicted to be used in the specific type of occupancy.
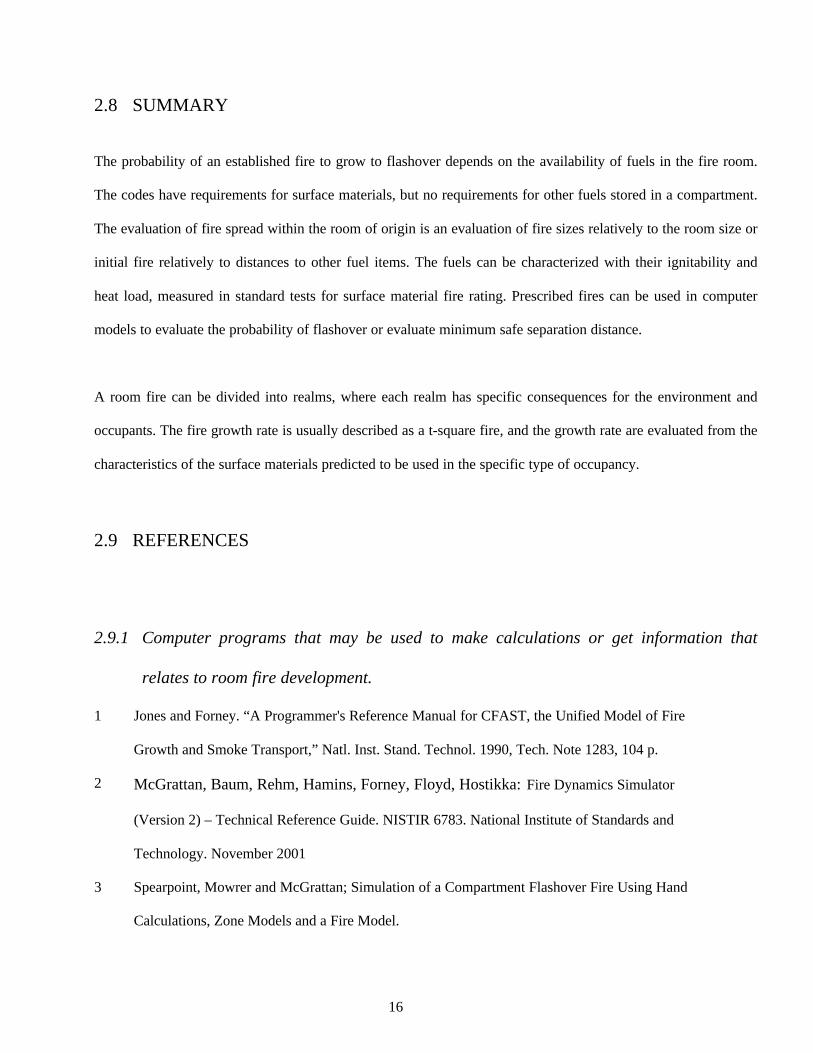
2.9 REFERENCES
2.9.1 Computer programs that may be used to make calculations or get information that
relates to room fire development.
1 Jones and Forney. “A Programmer's Reference Manual for CFAST, the Unified Model of Fire
Growth and Smoke Transport,” Natl. Inst. Stand. Technol. 1990, Tech. Note 1283, 104 p.
2 McGrattan, Baum, Rehm, Hamins, Forney, Floyd, Hostikka: Fire Dynamics Simulator
(Version 2) – Technical Reference Guide. NISTIR 6783. National Institute of Standards and
Technology. November 2001
3 Spearpoint, Mowrer and McGrattan; Simulation of a Compartment Flashover Fire Using Hand
Calculations, Zone Models and a Fire Model.
Page 26
17
4 Deal; Technical Reference guide for FPETOOL version 3.2. NIST, NISTIR 5486, 1994:123pp.
2.9.2 Fire growth rate and fire loads
5 Bukowski; Predicting the fire performance of buildings: Establishing appropriate calculation
methods for regulatory applications.
6 National Fire Protection Association; NFPA 72, National fire alarm code, 1996 edition.
7 Fire Safety Jounal vol 10, no 2, pp 101-118, (1986)
8 Norges Byggforsknings Institutt; NBI.520.333, Brannbelastning i bygninger - Beregninger og
statistiske verdier.
2.9.3 Fire sizes
9 National Fire Protection Association; NFPA 204M, Smoke and heat venting, 1991 edition.
10 National Office of Building Technology and Administration (Norway); Notification HO-
3/2000, Rø ykventilasjon, December 2000.
14 Babrauskas; Will the second item ignite, Fire Safety Journal, 4 (1981/81) 281-292.
32 National Institute of Fire and Technology; FASTdata, NIST Standard Reference Database
Number 75, January 1999 Release.
2.9.4 Flame spread on surfaces.
11 Quintiere and Harkleroad; New Concepts for measuring flame spread properties, Fire Safety
Science and Engineering.
12 Quintiere; Surface Flame Spread, Society of Fire Protection Engineers, The SFPE Handbook,
2nd edition, chapter 2-14.
13 Babrauskas; Fire performance of upholstered furniture and mattresses. NFPA Handbook
Page 27
18
chapter 4-17.
14 Babrauskas; Will the second item ignite, Fire Safety Journal, 4 (1981/81) 281-292.
15 Bukowski, R.W., A Review of International Fire Risk Prediction Methods, Interflam’93. Fire
Safety. 6th International Fire Conference March 30-April 1, 1993, Oxford England,
Interscience Communications, Ltd., London, England, C.A. Franks, editor, 437-466 pp., 1993.
16 Gamal, Ahmed, Mark, Dietenberg, Walter, Jones; Calculating flame spread on vertically and
horizontal surfaces, NIST April 1994.
17 Cleary, Quintiere; A framework for utilizing fire property tests, Fire Safety Science–Proc 3rd
Int Symp, New York, NY: Elsevier, 1991:647–56.
18 Mitler; Predicting the spread rates of fires on vertical surfaces, 23rd Symp (Int) on Combustion,
Pittsburgh, PA: Combustion Institute, 1990:1715–21.
19 Brehob; Upward flame spread on vertical walls with external radiation. Ph.D. Thesis, Penn
State Univ., Mechanical Eng’g Dept., 1994.
20 Kulkarni A, Kim C, Kuo C. Turbulent upward flame spread for burning vertical walls made of
finite thickness. Nat’l Inst. Stds. Technol. NIST-GCR-91-597, May, 1991.
2.9.5 Room flashover correlation.
21 National Fire Protection Association; NFPA 555, Evaluating potential for room flashover, 1996
edition.
22 Society of Fire Protection Engineers; The SFPE Handbook, 2nd edition, chapter 3-6.
23 Peacock, RD, Breese JN, Computer fire modeling for the prediction of flashover. National
Bureau of Standards (US), NBSIR, 1984.
24 Babrauskas V, Full-scale burning behavior of upholstered chairs. National Bureau of Standards
(US), TN 1103, 1979
25 Thomas PH. Testing products and materials for their contribution to flashover in rooms. Fire
Page 28
19
Master 1981;5’103-111
26 Babrauskas V. Estimating room flashover potential. Fire Technology 1980;16(2):94-103.
27 Hägglund B. Estimating flashover potential in residential rooms (FOA Rapport C 2--369-A3)
28 Deal and Beyler; Correlating preflashover room fire temperatures. Journal of Fire Protection
Engineer 1990, Vol 2 no 2 pp 33-48.
29 Foote, Pagni and Alvares; Temperature correlations for forced-ventilation compartment fires.
Proceedings of 1st International Symposium Association for Fire Safety Science.
30 Peacock, Reneke, Bukowski, Babrauskas: Defining flashover for fire hazard calculations. Fire
Safety Journal 32 (1999) 331-345.
2.9.6 Heat transfer
31 Tien, Lee, Stetton; Radiation Heat Transfer, Society of Fire Protection Engineers, The SFPE
Handbook, 2nd edition, chapter 1-4
2.9.7 Material properties needed for calculations.
32 National Institute of Fire and Technology; FASTdata, NIST Standard Reference Database
Number 75, January 1999 Release.
33 Drysdale; An introduction to fire dynamics, John Wiley and sons, January 1992. Chapter 5-2.
34 Society of Fire Protection Engineers; The SFPE Handbook, 2nd edition, Table B-7.
2.9.8 General useful information that doesn’t fit easily into the above categories.
35 National Office of Building Technology and Administration (Norway): TEK-97, Regulations
concerning requirements for construction works and products for construction works, 22
January 1997 No. 33 Technical Regulations under the Planning and Building Act 1997.
Page 29
20
36 National Office of Building Technology and Administration (Norway): REN, Guidance to
Regulations concerning requirements for construction works and products for construction
works, 2nd edition, April 1997.
37 National Building Standardization Council (Norway): NS3901, Risk analysis of fire in
buildings and civil engineering works, May 1998
38 National Building Standardization Council: Guidance to NS3901, Guidance to risk analysis of
fire in buildings, October
39 National Building Standardization Council: Guidance to NS3901, Guidance to risk analysis of
fire in road tunnels, May 1998.
40 American Society for Testing and Materials; ASTM E Standard test method for determining
the heat release rate of upholstered furniture and mattresses using a bench scale oxygen
consumption calorimeter.
41 Ramachandran; Stochastic Models of Fire Growth, Society of Fire Protection Engineers, The
SFPE Handbook, 2nd edition, chapter 3-15.
42 Babrauskas; Ten Years of Heat Release Research With the Cone Calorimeter, National Institute
of Fire and Technolgy, Gaithersburg, 1993.
Page 30
21
3 BARRIERS AND FIRE SPREAD BEYOND THE ORIGIN
Historically, barriers have been the major fire spread limitation method used. Building officials in large cities
required construction works to be separated by firewalls in order to save surrounding buildings. During the last
century, the use of barriers in fire limitation has been more comprehensive. Barriers are now used to limit the
fire within the building and to protect the egress paths.
Barrier effectiveness and reliability can be estimated by evaluating the heat application rate onto the barrier
relatively to the barrier resistance and the influence of the holes we use in the barriers. Doors, ducts and other
technical installations are necessary to make the building useable, but these installations may also be the cause of
barrier failure if the door are left open or the penetrations are left unstopped.
3.1 OBJECTIVES
The effectiveness of barriers influences fire spread, property protection, life safety and successful fire fighting
intervention operation. Effective barriers have an important role in the safety of non-sprinklered buildings.
As mentioned above, fire rated barriers are the traditional mean of fire protection, and still the codes have
requirements that address the aspect of barrier performance.
Barrier evaluation is an integrated part of fire performance analysis. The type of barrier failure has an important
influence on the speed and certainty of fire propagation in the adjacent room. For example a hot spot failure will
cause a small ignition and relatively normal fire growth in the adjacent room. On the other hand, a large opening,
such as a collapse or open door, will allow a massive inflow of fire gases into the next room. This will result in a
rapid, relatively certain full room involvement (FRI).
Page 31
22
The purpose of evaluating barriers is to estimate time and energy necessary for a small barrier failure and
ignition on the unexposed side of the construction. And further on, the estimation of time to a large breakdown
of the barrier so that a large volume of fire gases can pass through the barrier. These two situations are named a
T-bar-failure (a small hot spot) and a D-bar-failure (a large breakdown of the barrier).
There are three main aspects in barrier evaluation:
- The barriers capability to absorb heat and still be able to prevent too much heat from penetrating the
wall.
- The barriers capability to absorb heat and still be able to maintain its integrity.
- The heat energy and time of application against the barrier
Sprinkler and fire brigade intervention are not included in the barrier analysis.
3.2 APPLICATION OF CODES AND STANDARDS
The building code (TEK) requires that [40] Construction works shall be divided into fire sections and fire
compartments, in order to reduce or prevent spread of fire and smoke inside, unless such spread is
prevented by other means. This means that barriers are an option to prevent fire spread. Other systems like
automatic sprinklers could be used to obtain the same safety level.
Fire sections and fire compartments are two different types of barriers and should, therefore, be evaluated
differently. Firewalls and sections shall work together with fire-fighting efforts and make a highly reliable
barrier throughout the fire endurance. Establishment of fire partitions shall divide the building so that
different threats to life and health to persons and different probabilities of fire to develop shall be separated.
Fire compartment shall also be of such lay out and interior design that escape and fire fighting may be
Page 32
23
accomplished in a rapid and efficient way.
The prescriptive code recommend [41] to use fire partition with classification EI-30 or EI-60 and firewalls
classified as REIM-90, REIM-120 or REIM-240. Fire partitions are basically meant to be a mean of egress. The
fire partitions are designed to prevent too much heat from penetrating the construction (denoted as I for
isolation), and to maintain its integrity (denoted E). Firewalls are designed to withstand complete fire endurance
and are denoted by REIM. The R means frame temperature resistance and M means frame mechanical
resistance. With the R and M classifications the frame shall be able to withstand a standard fire endurance test.
The three different types of acceptance criteria mentioned in NS3901 [42,43] are evaluated differently. A
comparative analysis should not be evaluated only from this barrier analysis, but from the final safety level from
both barrier and fire protection systems with regard to egress and fire department manual suppression. A
probabilistic analysis is an evaluation of the probability of barrier failure during the time necessary to evacuate
the building. And the deterministic analysis concerns about the consequences of failure. For example, evaluation
of the concentration of toxic gases in the egress path.
The easiest and perhaps the best acceptance criteria is a measurement against the prescriptive code. This is a
comparative acceptance criterion. A comparative evaluation of barriers cannot be done from only this sub-
analysis, because the comparative measurement factor is safe egress and efficient fire fighting. The barrier
analysis is then a sub-analysis that have to be used together with analyzes of fire detection, sprinkler
suppression, fire department suppression and egress. The comparative analysis is therefore only presented in the
chapters describing the evaluation of fire department suppression and egress.
The prescriptive code only requires fire partitions as a mean of safe egress and fire department manual
suppression. The area of one fire partition can therefore be large. In fire performance evaluation, the overall
layout of the building and its barriers, fire classified or not, can be evaluated.
Page 33
24
3.3 DESIGN FIRE
There are two types of fires to be considered in a design fire evaluation for barrier performance. The first design
fire is the standard ISO fire. During the standard fire endurance the temperature rise is programmed and may not
be relevant to a natural, post-flashover fire.
Barrier performance depends upon the construction, the heat application rate and the fire duration. A design fire
for barrier resistant evaluation is mainly based on the temperature course in natural fires. The room fire
temperature after flashover depends both on the fuel characteristics and the buildings characteristics. The
building or fire compartment are usually characterized with size and geometry of the compartment, vent areas
and compartment insulation. The fire is usually characterized with a growing or constant fire in kilowatts or the
compartment fuel load. Fuel loads can be found in Fire Safety Journal [31] or NBI-papers [32].
In 1928 Ingeberg [1] conducted a series of tests to measure the severity of compartment fires. He developed
curves that show the relations between ventilation openings and fuel load.
The intensity and duration of fire in buildings can vary widely, and several studies have been carried out to
investigate the determining factors. It is possible to estimate the temperature course of fire in enclosures under
various conditions, provided that the values of the parameters are known. Several of these parameters, however,
such as the amount of combustible materials, are unpredictable as they may change with time and often vary
from compartment to compartment in a building. It is possible, however, to indicate for any enclosure a time
temperature curve that, with reasonable likelihood, will not be exceeded during the lifetime of the building.
These curves are useful as a basis for design of fire partitions and firewalls.
Page 34
25
3.3.1 Hand calculation methods
Quantitative methods to evaluate the hazard of compartment fires can be found in the Mowrer reference [2],
Walton & Thomas reference [3] and Lie [9]. The method developed by Law [3] does only take into account the
compartment geometry, characterized by its surface area and ventilation openings. In this correlation the fire size
is implicit described by the ventilation openings. The method of Babrauskas [4,5] estimates the upper layer
temperature based on several factors accounting for different physical phenomena, and the Swedish method [6]
is based on the conventional mass and energy balance equations.
A more complex hand calculations method have been derived by Kawagoe & Sekine [7] This correlation for
room fire temperature is based on test with wood fires. And, perhaps the state of the art correlation for fire-room
temperature is described in the Eurocodes. This method is valid for fire compartments up to 100 m2 of floor area,
without any openings in the roof and for maximum compartment height of 4 meter [8]. This correlation is more
conservative than the Kawagoe and Sekine method
3.3.2 Zone models
The input to the zone models are mainly the building or room geometry and the heat release rates, continuously
growing fires or steady state. CFAST [11], HARVARD 6 code [12] and CCFM [13] can be programmed with
vent openings and surronding surfaces properties. These factors makes the fire size limited due to the availability
of air, and the heat loss due to mass flowing out of the compartment and heat transferred to the boundaries are
estimated automatically. Simpler programs like ASET [14] cannot calculated heat loss and a user defined
constant fraction of the heat generated are lost to the boundaries.
The useful output for barrier performance evaluation is the upper layer temperature
Page 35
26
3.3.3 Field models
Field models are complex to program because of the requirements of detailed information about the fire source,
boundary conditions, building geometry and ambient conditions. Most field models include an algorithm to
calculate heat transfer into surrounding surfaces. The model Fire Dynamic Simulator [15] uses the program
Smokeview [15] to view boundary conditions. Some useful output can be surface temperature or radiant heat
transfer to the surfaces.
3.4 BARRIER PROPERTIES
The material of the barrier is of great importance for fire resistance. Barriers made of non fire classified
materials can maintain its integrity for a longer period of time, or it can break down after only a relatively
modest temperature rise. Fitzgerald [22] describes the material properties in fires comprehensively.
3.4.1 Concrete
In a fire lasting for 1 to 2 hr, concrete will be generally only moderately damaged. In long lasting fires, such as
those, which may occur in large warehouses and department stores, severe damage to concrete may occur.
The significant difference between conventional reinforced concrete and prestressed concrete in fires is the
performance of the high-tensile-steel wire or rods used for pre- or post stressing. Under fire conditions, the
stressed steel units are liable to rapid loss of strength at temperatures in excess of 400°C.
3.4.2 Brick
During production, clay bricks are exposed to temperatures in excess of 1100°C, hence their strength is retained
in actual fires. Reinforcing steel embedded in the center of a clay brick wall would normally be protected by a
minimum of 75 to 100 mm of brick and not be affected.
Page 36
27
3.4.3 Wood
Wood is the oldest and most widely used building material. Its behavior in fire conditions varies considerably,
depending upon the species of wood and the design configuration, i.e. solid sawn lumber, glue laminates,
plywood, wood chipboard etc. The effect of fire on glue laminates may be considered approximately the same as
that on solid sawn lumber. Generally, phenol-resorcinol and melanin are used as adhesives in glued laminate.
3.4.4 Gypsum
Gypsum products, such as plaster and plaster boards, are excellent fire protection material. The gypsum has high
proportion of chemically combined water. Evaporation of this water requires large amounts of energy. This
makes gypsum a cost effective, excellent, fire resistant building material and therefore very common in
commercial buildings.
3.4.5 Glass
Glass is utilized in three common ways in building construction. The most obvious is glazing for windows and
doors. In this capacity the glass has little resistance to fire. It quickly cracks due to temperature differences
between the surfaces. Double-glazing does not provide much improvement. Wire-reinforced glass is an
improvement, as it provides somewhat greater integrity if it is properly installed.
Tempered glass may resist elevated temperature at a longer period, but neither is this glazing recommended for
fire protection. Tempered glass is common in atria to protect against elevated upper layer temperature.
Temperature limits for glasses are [23]:
Single glass 40°C temperature difference between the surfaces.
Double glazing 80-100°C temperature difference between the surfaces.
Page 37
28
Tempered glass 200°C temperature difference between the surfaces.
3.4.6 Barrier combined with sprinklers
Water film's ability to protect exterior glazing has been tested with satisfaction results. The tests indicated that
tempered or heat-strengthened glass protected by a dedicated automatic sprinkler system would remain intact for
more than one hour [45]. NFPA 80A [46] also describes different methods to combined exterior sprinklers with
glazing in firewalls.
3.5 FIRE TESTING VS. REAL FIRES
Fire approved barriers have to be tested according to national or international standards. The Norwegian standard
is NS-ISO 834 (US standard is ASTM E-119). This standard describes a logarithmic time - temperature curve in
which the test assemblies are to be tested against. The temperature within the furnace is regulated with
temperature sensors and shall therefore not be compared to real compartment fire temperatures. On the other
hand, test procedures can be used to gain insight into how much energy a barrier can absorb. The time
classifications shall therefore be recalculated to accumulated applied energy and compared to the energy
consumption rate in a real fire. By doing these correlations it can be possible to estimate time to failure, which
later on can be a useful number in the safe egress evaluation.
These correlations can simply be performed in an Excel spreadsheet with numerical solutions of standard heat
transfer equations (convective heat transfer and radiation). For more information see [16,17,18,19]. Estimates of
applied energy during fire testing are referred in table 3-1.
Page 38
29
Table 3-1. Calculated applied energy onto test assembly during the ISO-834 fire test
Fire rating 30 min 60 min 90 min 120 min
Applied energy according to ISO 834 120 MJ/m2 330 MJ/m2 610 MJ/m2 930 MJ/m2
3.6 BARRIER RELIABILITY STATISTICS
The reliabilities of barriers are important issues in both comparative and probabilistic analysis. Masonry
constructions are historically more reliable than gypsum constructions, and doors with closers are more reliable
than doors without. Historical data shall not be used to judge the reliability of separating constructions, because
the future may not be comparable to history. This may be due to mechanical systems, materials and human
behavior that may change over time. Nevertheless, statistical data can be used to calibrate and compare. The data
in tables 3-2 to 3-4 are collected from [33,34].
Table 3-1. Published Estimates for passive protection systems operational reliabilityWarrington DelphiUK (Delphi group)
Fire Eng. GuidelinesAustralia
(Expert Survey)
Japanese Studies(Incident data)
Protection System Tokyo FD WatamabeMasonry construction 81%
29% probability anopening will be fixed
95% if no opening90 if opening with auto
closer
NA NA
Gypsum partitions 69%29% probability of
opening will be fixed
95% if no opening90 if opening with auto
closer
NA NA
(Probability of success (%)) (NA = Not Addressed)
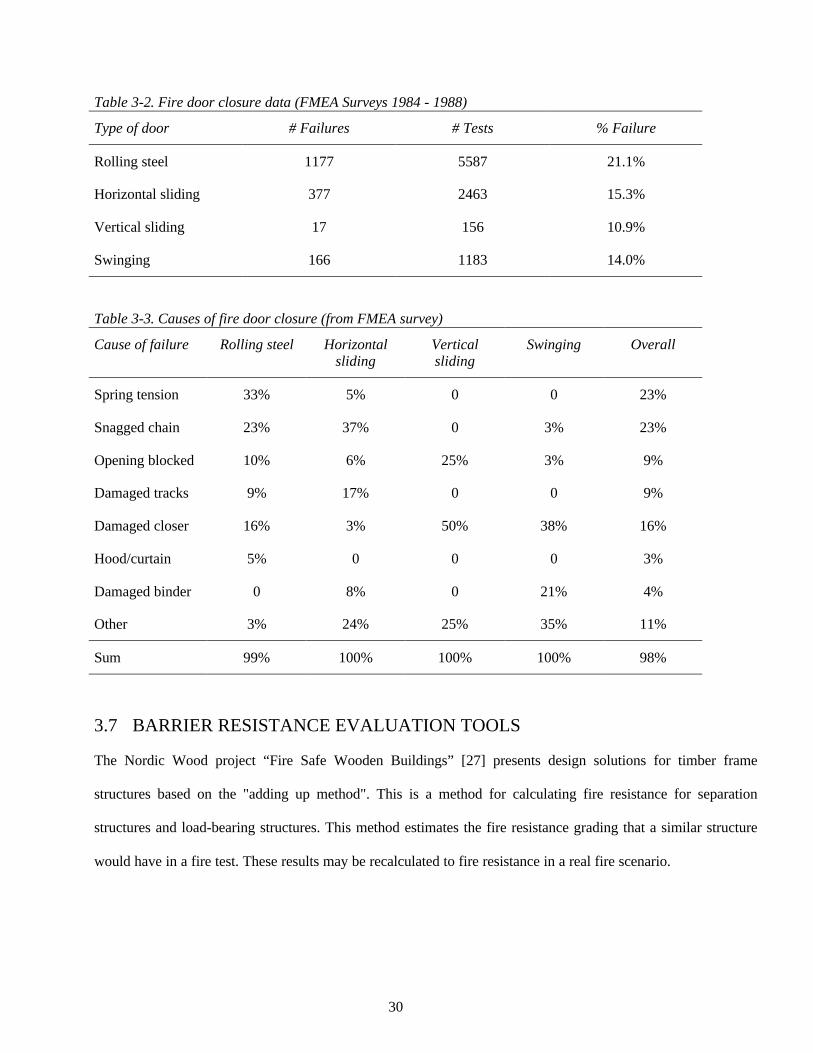
Fire doors will not necessarily close properly when a fusible link or detector is actuated. Their propensity to
hang up has been determined through an extensive series of automatic closure tests conducted annually or
semiannually by the Factory Mutual Engineering Association (FMEA) [33]. They estimated the probabilities of
failure and causes of failure. These tests were conducted in 1984 to 1988 and improvements of door hangers
have been done since then.
Page 39
30
Table 3-2. Fire door closure data (FMEA Surveys 1984 - 1988)
Type of door # Failures # Tests % Failure
Rolling steel 1177 5587 21.1%
Horizontal sliding 377 2463 15.3%
Vertical sliding 17 156 10.9%
Swinging 166 1183 14.0%
Table 3-3. Causes of fire door closure (from FMEA survey)
Cause of failure Rolling steel Horizontalsliding
Verticalsliding
Swinging Overall
Spring tension 33% 5% 0 0 23%
Snagged chain 23% 37% 0 3% 23%
Opening blocked 10% 6% 25% 3% 9%
Damaged tracks 9% 17% 0 0 9%
Damaged closer 16% 3% 50% 38% 16%
Hood/curtain 5% 0 0 0 3%
Damaged binder 0 8% 0 21% 4%
Other 3% 24% 25% 35% 11%
Sum 99% 100% 100% 100% 98%
3.7 BARRIER RESISTANCE EVALUATION TOOLS
The Nordic Wood project “Fire Safe Wooden Buildings” [27] presents design solutions for timber frame
structures based on the "adding up method". This is a method for calculating fire resistance for separation
structures and load-bearing structures. This method estimates the fire resistance grading that a similar structure
would have in a fire test. These results may be recalculated to fire resistance in a real fire scenario.
Page 40
31
The basic principal for the addition method is the relation between the layers base value and theirs position
relative to the fire strain. The following parameters must be determined:
- Wallboard thickness, density and type.
- Isolation thickness, density and type.
- Material combination; influence of isolation, air gaps and material location in the wall.
Although, the Nordic Wood project only include wood and gypsum, The NFPA handbook [22] describes several
other constructions that can be compared to classified constructions. Also the Eurocodes includes calculation
methods to do estimate of fire test performance for different structures [25,26].
3.8 LARGE AND SMALL BARRIER FAILURES
During a fully developed fire, barriers will burn if they are combustible, incombustible barriers will deteriorate
due to the heat applied to the construction. Over time, the fire will be able to make a tiny hole or a complete
breakdown. Both can happen, but failure due to large amounts of energy application is usually not the cause of
fire spread. Fires can spread through small openings, created when the electrician installed the computer cable
network or when the plumber installed the HVAC system. Due to these small openings, the fire can penetrate
into other rooms, by small flames igniting nearby fuels or by heat conducted by the air canal. These installations
are required to be properly secured against fire spread where the walls are meant to assure safe egress or to
separate different fire risks (fire partitions). In other walls these weaknesses should be expected to exist. Small
barrier failures can ignite fuels in the room beyond and initiate a fire development similar to the one in the room
of origin.
The other common barrier failure is that the door is open, or that the door is made of simple glass. A door open
will cause massive flow of energy flowing into other rooms. The amount energy flowing into other rooms can
Page 41
32
cause a second flashover even though the second room is clean for combustibles. The HRR penetrating into the
room beyond calculated. This situation can be similar to a window plume [44].
When the type of barrier failure is stipulated fire growth in the room beyond can be evaluated with greater
confidence. Knowledge of the fire in the room of origin (chapter 2) provides a basis for estimating the behavior
when the room becomes a subsequent room for fire propagation.
3.9 SUMMARY
Fire rated interior barriers are one of the traditional methods to design safe egress paths, and exterior barriers
have been used for centuries to prevent fire spread in some cities. The code acceptance criteria for barriers are
denoted by E, I, R and M, meaning integrity, insulation, thermal resistance and mechanical resistance
respectively. Barrier performance depends upon the construction, the heat application rate and the fire duration.
Evaluation of temperatures in natural building fires is the main characterization of the design fire. There are
several methods available, both as hand calculation and computer program.
Different barrier materials behave different in fires. Their fire endurance rating may be transferable to natural
fires by estimation of accumulated heat application. On the other hand, natural fires may develop substantially
higher temperatures than a standard fire test furnace. Elevated temperatures can cause the barrier material to
behave different and causing failure in a shorter period of time than predicted. Knowledge of the barrier material
is important in this evaluation.
Based on statistics, the probability of unstopped penetrations or other fixed openings tends to be higher in
gypsum barriers than in masonry barriers. The size of the opening, made by the fire or fixed before the fire
event, influence on the fire development in the next room.
Page 42
33
3.10 REFERENCES
3.10.1 Hand calculation method for post-flashover temperatures estimation
1 Ingeberg; Tests of the severity of building fires. NFPA Quaterly, Vol 22 No 1, pp 43-61 (1928)
2 Mowrer; Methods of quantitative fire hazard analysis, EPI TR-100443, Electric Power Research Institute
(1992)
3 Walton & Thomas; Estimating temperatures in fires, The SFPE handbook chapter 3-6
4 Babrauskas & Williamson; Post flashover compartment fires - Basis of a theoretical model. Fire and
Materials Vol 2, no 2 pp 39-53 (1978)
5 Babrauskas & Williamson; Post flashover compartment fires - Application of a theoretical model. Fire
and Materials Vol 3, no 1 pp 1-7 (1979).]
6 Magnusson & Thelandersson; Temperature-time curves of complete process of fire development -
Theoretical study of wood fuel fires in enclosed spaces. Acta Polytechnica Scandinavia, Civil
engineering and building construction series no 65, Stockholm (1970)
7 Kawagoe & Sekine; Estimation of fire temperature-time curve in rooms. Tokyo: Building Research
Institute (1963).].
8 European Committee for Standardization, Eurocode 1-2.2, Basis of design and actions on structures,
Action on structures exposed to fire.
9 Lie: Fire Temperature time relations, SFPE Handbook 1-3.
10 Harmathy; A new look at compartment fires, Part I. Fire technology vol 8, no3, pp 196-217 (1972).
3.10.2 Computer programs for post-flashover temperature estimation
11 Jones and Forney; “A Programmer's Reference Manual for CFAST, the Unified Model of Fire Growth
and Smoke Transport,” Natl. Inst. Stand. Technol. 1990, Tech. Note 1283, 104 p.
Page 43
34
12 Gahm, J. B., “Computer Fire Code VI, Volume I,” Nat. Bur. Stand. (U.S.) 1983, NBS GCR 83-451, 116
p.
13 Forney and Cooper; The Consolidated Compartment Fire Model (CCFM) Computer Application
CCFM.VENTS - Part II: Software Reference Guide, Nat. Inst. Stand. Technol., NISTIR 90-4343 (1990).
14 Cooper; “A Mathematical Model for Estimating Available Safe Egress Time in Fires,” Fire and
Materials. 1982, 6(4), 135-144.
15 McGrattan, Baum, Rehm, Hamins, Forney, Floyd, Hostikka: Fire Dynamics Simulator (Version 2)
– Technical Reference Guide. NISTIR 6783. National Institute of Standards and Technology. November
2001
3.10.3 Fire endurance testing vs. real time endurance evaluation
16 Drysdale; An introduction to fire dynamics, John Wiley and sons, January 1992. Chapter 2.
17 Tien, Lee, Stretton, Radiation heat transfer, SFPE handbook 1-4.
18 Atreya, Convective heat transfer, SFPE handbook 1-3.
19 Rocket, Milke, Conduction of heat in solids, SFPE handbook 1-2.
3.10.4 Fire endurance calculation
20 Lie: Fire Temperature time relations, SFPE Handbook 1-3.
21 European Committee for Standardization, Eurocode 1-2.2, Basis of design and actions on
structures, Action on structures exposed to fire.
22 Fitzgerald: Structural Integrity during fire, NFPA Handbook 7-8.
23 National Office of Building Technology and Administration (Norway); Notification HO-3/2000,
Rø ykventilasjon, December 2000.
24 Fire Safe Wooden Buildings, Nordic Wood, Trätek (Sweedish)
Page 44
35
25 Eurocode 5-2.1 Design of timber structures, Structural fire design.
26 Eurocode 2-2.1 Design of concrete structures, Structural fire design.
3.10.5 Barrier properties and design of structures
27 Fire Safe Wooden Buildings, Nordic Wood, Trätek (Sweedish)
28 Eurocode 5-2.1 Design of timber structures, Structural fire design.
29 Eurocode 2-2.1 Design of concrete structures, Structural fire design.
30 Gyproc Hå ndbok del A
3.10.6 Fire load evaluation
31 Fire Safety Journal vol 10, no 2, pp 101 - 118 (1986).
32 Norwegian Building Research Institute; Brannbelastning i bygninger Beregninger og statiske
verdier, Byggdetaljer 520.333, (1999).
3.10.7 Probability evaluation information
33 Bukowski, Budnick and Schemel; Estimates of the Operational Reliability of Fire Protection
Systems.
34 Factory Mutual Training Resource senter: Fire Doors, Closing the safety gap, 1986 and 1988.
3.10.8 Sensitivity and vulnerability
35 NFPA 69, Explosion prevention systems.
36 Eurocode 1-2.7, Basis of design and actions on structures, Accidental actions.
37 Zalosh, Explosion Protection, SFPE handbook 3-16
38 Stevenson, Evaluating Structural damage, NFPA handbook 7-11.
Page 45
36
39 National Fire Protection Association; NFPA 80, Fire Doors and Fire Windows, 1996 edition.
3.10.9 Other information that doesn't fit into the categories above
40 National Office of Building Technology and Administration (Norway): TEK-97, Regulations
concerning requirements for construction works and products for construction works, 22 January
1997 No. 33 Technical Regulations under the Planning and Building Act 1997.
41 National Office of Building Technology and Administration (Norway): REN, Guidance to
Regulations concerning requirements for construction works and products for construction works,
2nd edition, April 1997.
42 National Building Standardization Council (Norway): NS3901, Risk analysis of fire in buildings
and civil engineering works, May 1998
43 National Building Standardization Council: Guidance to NS3901, Guidance to risk analysis of fire
in buildings, October
44 National Fire Protection Association; NFPA 92B, Smoke management in malls, atria and large
areas, 1995 edition.
3.10.10 Barrier performance in combination with sprinklers
45 Kim, Taber, Laughed; Sprinkler Protection of Exterior Glazing, National Research Council, Canada, Fire
Technology Vol 34, No 2, 1998.
46 National Fire Protection Association; NFPA 80A, Protection of Buildings from Exterior Fire Exposures,
1996 edition.
Page 46
37
4 FIRE DETECTION AND INITIAL ACTION
In our modern society, fire protection is generally associated with detection and fire alarm systems. If a fire
detection system were installed in the building, most people would say that the building is fire proofed. One of
the reasons may be that a fire detection system is both visible and audible, and it encourages the occupants to
take action. But also, the smoke detector is well known as a fire protection system because it gives early
warnings of a fire.
Early detection and alerting can help the occupants take action and evacuate the building before critical fire
situations occur. Fire and smoke detection systems is therefore a vital part of the fire safety concepts for many
buildings. Generally, smoke detection systems are required in buildings that may be occupied by many people,
sick people or sleeping people. On addition, early warning enables fire brigades (FB) to be notified earlier, thus
encountering a smaller fire upon arrival.
4.1 OBJECTIVES
Detector reliability depends on several factors relating to the fire, the building geometry and the systems within
the building. The objectives of a detection and initial action evaluation are to identify and evaluate the
parameters concerning detection reliability and detector actuation time. First of all, the design fire characteristics
for human or instrument detection, should be analyzed. The variety of different detectors are large, and different
manufacturers produce different automatic functions to increase reliability, decrease the number of false alarms
and decrease detection times. The most important factor is the likelihood that smoke will actually reach the
detector, or that the detector (human or instrument) can sense the fire.
Page 47
38
Detection is the first event, before a series of other actions can occur. The principal actions can be the
notification of the FB and the alerting of building occupants. Before leaving this topic, an evaluation is made of
time delays between detection and notification of the FB and time delays between detection and occupant
alerting.
In most fires the FB is notified manually. Someone must make the call. The last objective is then to identify a
minimum and maximum notification time relative to the FB intervention.
4.2 APPLICATION OF CODES AND STANDARDS
The National Technical Regulations (TEK) [35] requires that smoke detectors shall be installed in homes and
smoke detection systems to be installed in hospitals, hotels and assembly areas. The general requirement for all
buildings is that available egress time shall be longer than necessary egress time including a safety factor, and
installed automatic detection systems may be a factor to obtain safe egress. REN [36] recommends fire detection
systems also be installed in kindergartens and schools. Building owners must install partial smoke detection
systems with automatic FB notification if their building base area is between 1200 and 1800 m2. This
recommendation is based on the decrease in anticipated loss because of early and reliable notification of the FD.
In order to do a performance-based evaluation of building fire safety, the evaluation of detection, occupant alert
and FB notification is not enough. Detection and occupant alert is only the first, but very important factor of a
safe egress evaluation and fire department manual suppression. The acceptance criteria for fire safety cannot be
completely evaluated from only this sub-analysis.
A statistical evaluation of fire detection would measure the reliability of fire detection systems based on
historical data or tests performed by the manufacturer. The weakness with historical data is that they may not
reflect the actual building or system characteristics being evaluated. For example; how the building HVAC
Page 48
39
system or barriers between the fire and detector would influence on the likelihood of the occurrence of fire
detection. A comprehensive evaluation of probabilities is difficult, and a good portion of engineering skills and
insight into technical systems and human minds is necessary to obtain reliable estimates.
The deterministic analysis is an evaluation of the fire size and characteristics necessary for detection. Initially,
the reliability is not of interest. The analysis is more like; detection will occur if …. Or will not occur if … Of
course, the probabilistic and deterministic evaluation may be combined. The fire safety evaluation can be a
comparative analysis against the pre-accepted fire design methods. The management of the acceptance criteria
for safe egress and fire department manual suppression is more extensively discussed in respective chapters.
Specific information about the design of smoke detection systems can be found in national and international
literature [8,9,10].
4.3 DESIGN FIRE FOR DETECTION EVALUATION
The design fire can be characterized by fire and smoke and fire properties and fire growth rate relative to the
room geometry and ambient conditions. The first part of the evaluation of the design fire is to describe the
properties of the fire and its products of combustion.
As soon as a fire starts it produces a variety of combustion products. The fire develops a signature that is special
for different types of fires. The idea of detection is to recognize this signature. Table 4-1 describes some of the
signatures from fires.
Page 49
40
Table 4-1. Detectable fire signatures
Fire properties Signature
Flame Electromagnetic radiation, ultraviolet, visible, infrared
Heat Elevated temperatures of air atmosphere above fire
Smoke Particles suspended in air atmosphere (liquid and solid particles generatedby incomplete combustion)
Fire gases Gaseous combustion product CO, CO2, possibly HCl
Other e.g. hot embers, water vapor, (per NFPA 72) ionized molecules
The first row in table 4-1 is a description of the visible flames. A flaming fire produces radiation. For many
combustibles, the irradiative portion of combustion is about 30%. In order to detect flames the detector must be
able to “see” the fire. Location of detector and distance between fire and detector would influence on detection
times. The size of the fire viewed by a flame detector is proportional to the square of the distance.
The term heat is produced by a flaming fire and depends on the convective fraction of total HRR [1].
Gases and smoke are produced in all fires. The material composition of the burning fuel tells much about how
the smoke would appear. Materials containing halogens (e.g. cables) could produce chloride gas and
hydrochloric acid. Well-ventilated fires would produce large amounts of carbon dioxide, and as the fire grows
and becomes under-ventilated, the percentage of carbon dioxide will increase substantially.
Smoke is defined as the smoke aerosol or condensed phase component of the products of combustion (POC) [2].
The American Society for Testing and Materials also includes the evolved gases as well. Smoke aerosols vary
widely in appearance and structure, from light colored smoldering combustion to black soot from carbonaceous
flaming combustion. The average size of the smoke particle and specific optical density are factors that influence
the time to detector actuation [2].
Page 50
41
Fire growth may be the most important factor for time to detection. For residential occupancies and fuel surfaces
with approximately 2 dimensional geometry, the fire growth rate can be expressed with a t-square fire, and
described as an ultra fast, fast, medium or slow growth rate. It should also be noted that t-squared curves
represent fire growth starting with a reasonably large, flaming ignition source. With small sources there is an
incubation period before established flaming, which can influence the response of smoke detectors and result in
an underestimate of time to detection. This can be simulated by adding a slow, linear growth period until the rate
of heat release reaches 25 kW. For more information about heat release rates in the early period, see chapter 2.
Time to smoke detection depends on design fire characteristics such as rate of fire growth rate, convective
fraction of HRR, particle sizes, plume buoyancy, ceiling jet velocity and temperature, ventilation conditions and
room geometry. The room geometry and ventilation conditions are important in order to predict that POC's
actually reach the detector. Barriers that could obstruct the smoke from reaching the detector could be beams,
doors, sloped ceilings etc. Ventilation could also prevent smoke from reaching the detector. Ventilation
conditions that cause smoke to move faster at the detector location would also be an important factor for
choosing adequate detector type. Ionization detectors tend to be more sensitive to high velocities and small
particles, while photo electric detectors tends to be more sensitive to lower velocities and larger smoke particles.
Particle size is also a function of velocity because the rate of smoke particle coagulation varies with the velocity.
4.4 HUMAN DETECTION AND NOTIFICATION
Human detection is simply a function of human presence and the ability to smell, watch or feel the products of
combustion (POC). Humans can sense smoke earlier than an instrumental detector if the detecting human is
present in the vicinity of the fire. The reliability of human detection can be evaluated by a characterization of the
occupancy. A fire in a train or in an underground station would probably be detected by humans in the vicinity
of the fire, and as the fire grows more humans would be aware of the danger. A fire in a warehouse or in an
Page 51
42
educational institute would probably not be detected at night. Generally, humans cannot detect fires in technical
rooms or other rooms that are not designed for occupancy.
The weakness of human detection is alerting. Relatives or other humans that have been connected and developed
human bonds or human acquaintance would probably try to alert each other in a case of fire. Humans living in
urban block apartments may not know their neighbors, and therefore it may not be a natural act to alert them.
However, personal notification in residential occupancies is the most frequently reported means of initial
perception of fire [32]. Only 7% were aware of the fire due to fire alarm, all the others became aware due to
flames, smoke or noise. A research of the fire incident in the south tower of World Trade Center in 1993
documented that the personnel were primarily alerted due to either single or a combination of several cues, like
explosion, loss or flickering of lights or telephones, smoke or dust, sirens and alarms, information from others,
and people movement. A study involving college students reported that the presence of other people inhibited
the individuals from taking action [32,33]. When one student was alone in the room the presence of artificial
smoke were reported by 75% of the students within 6 minutes. When two passive non-committal persons joined
the student only 10% reported the smoke. When the experimental groups were of three naive students, one
person in 38% of the groups reported smoke.
Human fire department notification could also be evaluated by judgmental estimates. The judgments could be
based on human a characterization or evaluation of the safety organization, if it exists. Clues could be age, sex,
number of affected humans, and their attitude to safety, safety instruction and safety training. A U.S. study found
that notifying the fire department was the third out of twenty-nine most frequent actions after precipitation of a
fire. The most frequent was notifying others [32].
Page 52
43
Table 4-1. Summary of first second and third actions of the occupants [32]
Actions 1st action (percent) 2nd action (percent) 3rd action (persent)
Notified others 15.0 9.6 5.8
Searched for fire 10.1 2.4 0.8
Called fire department 9.0 14.6 12.7
Got dressed 8.1 1.8 0.3
Left building 7.6 20.9 35.9
Got family 4.6 5.7 11.5
23 other actions 45.6 45 33
Human notifications have a major dependence on building location, occupancy and incident time of day.
Occupants may choose to extinguish the fire, they can be stressed or they have to evacuate first. Nevertheless,
mobile phones are common and it can be expected that someone choose to notify the fire department only
minutes after they have detected the fire, if they choose to do it at all.
4.4.1 Notification systems
Time dependent probability of notification must be evaluated specific for each particular situation. Fitzgerald
[40] described the advantages and disadvantages of these systems. It is only the auxiliary fire alarm system,
central station and remote station that have a high reliability and rapid notification.
A proprietary supervising station is located within the building. When the fire-alarm has actuated, an attendant
must choose whether to notify the fire department immediately or investigate the detected area.
A central station is normally remote from the protected building and is operated by a person or a company whose
business is to furnish a variety of services related to fire protection systems.
Page 53
44
A remote station is almost the same as a central station, but the remote station is not required to be approved by
the local AHJ. Both systems have a set of procedures, and they will take immediate action and retransmit a fire
alarm signal to the fire department. Some of the disadvantages are that the attendance may want to contact the
building owner before re-transmitting the signal or the attendance may be poor trained.
In hospitals and nursing homes, the code officials usually require an auxiliary fire alarm system to be installed.
This system enables a fire alarm actuation to be directly transmitted to the local fire department center. This
system is the fastest and most reliable types of fire brigade notification.
4.5 INSTRUMENT DETECTION - HAND CALCULATION
In rooms with normal ceiling height and no special conditions that could prevent the smoke from reaching the
detector, the time to detection can be set to an expected time, such as 30 seconds. Or, the fire is detected at a fire
size of 20 kW. In most situations a simple judgment should be sufficient. In other situations, e.g. high ceilings
height or special fire scenarios like combustible liquids, a more comprehensive evaluation may be needed. Fire
size at detection is the more functional evaluation for buildings.
Time to detection for a smoke detector depends on geometry; smoke properties, detector and HRR. For large
rooms and small fires the initial transport delay would increase detection times substantially. Before
conventional smoke detectors actuate the smoke must penetrate into the detector chamber. A length, L,
characterizes this time. The difference in concentration inside and outside the detector is given with the equation.
Ci = C0 (1 - e-vt/L)
C0 is the smoke concentration outside a spot detector.
Ci is the smoke concentration inside the detection chamber.
Page 54
45
v s the plume velocity at the spot.
t is time to actuation
L is the characteristic length.
L = 5.3 +- 2,7 for photoelectric detectors and .
L = 3.2 for ionization detectors.
Time to detection can be derived from the equation above.
−
−
=0
i
C
C1ln
v
Lt
Minimum and maximum smoke concentration for detector actuation (Underwriters Laboratory) is presented in
table 4-3.
Table 4-1. Smoke obscuration limits for listed detectors (UL).
Page 55
46
The easiest way to calculate detection time is to use simple correlations for ceiling jet temperature. There are
several correlations that can be used. The Alpert correlation is described in the SFPE handbook [3]. By assuming
that the detector would actuate at a temperature rise of 5-10°C for smoke detectors, a very rough estimate for
detection time can be performed.
It is possible to estimate time to detection within the room of origin by using the properties of smoke and non-
dimensionalizing the variables. The non-dimensional variables have been defined by Heskestad and Delichatsios
and are described in [3]. To incorporate the properties of smoke a new formula must be derived and solved by
using the 4th order Runge-Kutta method to solve the differential equation.
inC2/3)*f
t*2
(t2
ã2)*f
t*2
(t1
ã*dt
inCd−−−=
Where;
( )( )( )( )( )LUt
HCCLUt
chch
ceilconvchemactspchch
//
))1(/(ÄT//2/1
1
ch2/3
1
22
21
ββγ
χχρββγ
=
−∆Υ= ∞
and
3/42
63,01 )/(210.0126.0 ,)/(68.0 HrHr +== − ββ [27]
where, r is the horizontal distance between the fire source and the detector and H is the ceiling height. The
equations for tch, Uch and ∆Tch can be found in the SFPE handbook [3].
Page 56
47
This method solved with Runge-Kutta accounts for several important parameters that is not included in other
detector actuation models. This method solves the concentration of smoke inside the detector chamber.
Parameters like smoke yield and detector sensitivity is important input to the calculation. By solving the
equations in an Excel spreadsheet the user can evaluate smoke transport time, temperature, ceiling jet velocity
and heat release rate at the time the smoke concentration inside the detector chamber is sufficient to cause
actuation.
4.6 INSTRUMENT DETECTION - SOFTWARE PROGRAM
Several simple software programs can model time to detection. The advantage of these programs is that they can
give good indications on detector activation time. They do not include all the properties of the smoke, only the
temperature of the ceiling jet is included. But, considering the uncertainty factors about the design fire, these fast
and relatively reliable methods are normally good enough. These programs can be downloaded from the
websites of National Institute of Standards and Technology [15].
It is important to understand the physics of the computer models and the assumptions built into each code.
FPETOOL, written by Nelson [16,17] and DETACT-QS, written by Evans and Stroup [18,19], are each based
on experimental correlations developed by Alpert for steady-state fires [14]. These correlations give the
maximum temperature and maximum velocity as a function of the heat release rate of the fire, the radial distance
to the fire, and the height of the ceiling above the fire. These correlations assume a smooth, unconfined ceiling.
They also assume that steady state correlation can be applied to a growing fire over small time intervals. In both
programs, the transport time of the smoke and hot gases from the fire to the thermal detector is neglected. Also
in both programs the detector is subjected to the maximum temperature and velocity of the ceiling jet.
FPETOOL accounts for the impact of the hot gases entrained into the ceiling jet on the temperature and velocity
of the jet as it passes through the hot smoke layer; DETACT-QS des not.
Page 57
48
LAVENT, written by Davis and Cooper [20], is similar to FPETOOL and DETACT-QS in that it assumes steady
state correlations can be applied to a growing fire over small time intervals; and it also neglects the transport
time of the smoke and hot gases from fire to thermal detector. LAVENT does account for the impact of the hot
upper layer on the ceiling jet. LAVENT also accounts for position of thermal detector below the ceiling in the
ceiling jet.
The zone model JET [21,22] evolved from the zone model LAVENT and therefore contains many of the features
found in LAVENT. The major differences between JET and LAVENT include the ceiling jet temperature and
velocity algoritms, the thermal activation algorithm, and the use of variable radiative fraction as a function of
fire size and type.
CFAST [23] is also a member of a class of models referred to as zone or finite element models. The major
difference in CFAST relative to other zone models is that it can simulate multiple fires and multiple rooms. Like
the other models, each room is divided into two volumes (zones), in which the temperature and smoke and gas
concentrations are assumed to be exactly the same at every point. CFAST can simulate smoke spread through
openings so that estimates of detectors located in a corridor can be obtained even though the design fire is in
another room.
Computerized Fluid Dynamics models (CFD), also named Field models solves the Navier-Stokes equations for
energy and mass conservation. The program decides the room(s) into thousands of small numerical grids. CFD
models can be used to evaluate smoke detector actuations, and may be the preferred tool for detector evaluation
in buildings with complex geometry or complex ventilation conditions. Fire Dynamic Simulator [24] includes
subroutines for smoke concentration. FDS can create gas species that closely resembles air in its molecular
weight. By creating this species and giving it an appropriate yield, the model can accurately track spread and
concentration of this “smoke” throughout the domain. For more information see the D'Souza et. al. reference
Page 58
49
[40]. FDS can also be used to evaluate smoke detection times with heat detectors. A heat detector can simulate a
smoke detector by using a low actuation temperature and a low RTI value. By using thermal detectors, FDS can
be programmed to trigger special events like removal of blocks (i.e. windows) or opening of vents (i.e. smoke
and heat ventilation) when detectors actuates.
4.7 SMOKE DETECTOR MODELING
The following sub-chapters are based on the paper Fire Detection Modeling – The Research-Application Gap [23].
4.7.1 Light obscuration smoke detectors
For projected beam type detectors, fire or smoke models that calculate the optical density per unit length, Du, in
a space or the total optical density in the path of the detector, optical density, D, may be used to determine when
the detector would respond. Manufacturer specifications will typically indicate at what levels of total obscuration
or total optical density the detectors respond. Projected beam smoke detectors generally have adjustable response
thresholds. Reference for properties of smoke [2]
4.7.2 Light scattering (photoelectric) smoke detectors
Information about smoke properties related to light scattering is presently limited to a few types of fuels and is
not readily available to practicing fire protection engineers. In addition, the data may not be in a useable format.
For instance, the data must match the wavelength of the light source used in the detector being modeled.
Scattering data at other wavelengths introduces errors and uncertainties.
A scattering type detector will respond at different optical densities for different types of smoke. For example, a scattering
type smoke detector that responds at an optical density of .029 m-1 (2.0%/ft obscuration) to smoke produced by a
smoldering gray cotton lamp wick may not respond until an optical density of 0.15 m-1 is reached for smoke from a kerosene
fire.
Page 59
50
4.7.3 Ionization smoke detectors
The signal produced by the chamber of an ionization detector has been shown to be proportional to the product
of the number of particles and their diameter. Given the quantity and size distribution of smoke particles and the
chamber constant (from the manufacturer), it is possible to model the ionization smoke detector. Unfortunately,
there are no fire models that provide the required detector model input. In addition, manufacturer specifications
do not presently include chamber constants.
4.8 DETECTOR RELIABILITY
The reliability of detection and depends on numerous of components that have to function in order to succeed.
The fire alarm systems have to be designed according to the fire scenarios, it must be tested and maintained, and
quality of the systems tends to vary with the occupancies it is meant to protect. The NFPA Handbook includes
several chapters on the topics of fire alarm systems [12].
4.8.1 Statistics
Detector reliability can be defined in several ways. The most useful definition of detector reliability is the
probability that the detector will actuate when the fire signature reaches its sensing chamber. This can be
statistically based from a sample of detectors at the time of manufactures. However, the fire protection literature
commonly defines reliability that a detector will operate as expected. This definition combines both the inherent
detector operation (operational reliability) with the design expectations (performance reliability). One must be
careful to understand the basis for reliability estimates when applying them to buildings.
Fire alarm performance is defined as the ability of the system to accomplish the task for which it was designed
and installed. The operational reliability of a system depend on the reliability of individual components and their
failure rates, the interdependencies of the individual components that compose the system, and the maintenance
and testing of components and system once installed to verify operability. All of these factors are of concern in
Page 60
51
estimating operational reliability [18]. The reliability presented in table 4-4 is operational reliability. The
reliability estimates in table 4-3 includes both performance and operational reliability, but the usefulness of these
estimates may be limited because possibility of inaccurate methods used to derive the estimates.
Table 4-3. Published estimates for fire reliability of smoke detection systems [26](Probability of success (%)) (NA = Not Addressed)
Warrington DelphiUK (Delphi group)
Fire Eng. GuidelinesAustralia(Expert Survey)
Japanese Studies(Incident data)
Protection System
Smold-ering
Flaming Smold-ering
Flaming/Flash over
TokyoFD
Watamabe
Heat detector 0 89 0 90/95 94 89
Home smoke detector 76 79 65 75/74 NA NA
System smoke detector 86 90 70 80/85 94 89
Beam smoke detector 86 88 70 80/85 94 89
Aspirated smoke detector 86 NA 90 95/95 NA NA
A summary of operational reliability estimates for selected occupancy groups were calculated and are shown in
the next table. The estimates, including the mean reliability and 95% confidence limits [26].
Page 61
52
Table 4-1. Operational reliability estimate for smoke detectors [26]Occupancy Property use Mean
Reliability(%) n=10
95% upperConfidenceinterval
95% LowerConfidenceinterval
Apartments 69.3 69.9 68.7
Hotels/Motels 77.8 79.3 76.4
Residential
Dormitories 86.3 88.4 84.3
Public assembly 67.9 69.8 65.9
Stores & offices 71.7 73.5 69.9
Storage 68.2 70.0 66.3
Commercial
Industry & Manufacturing 80.2 81.3 79.1
Care of aged 84.9 86.6 83.3
Care of young 84.0 86.3 81.6
Educational 76.9 79.6 74.1
Hospitals & Clinics 83.3 85.4 81.2
Prisons & Jails 84.2 85.9 82.5
Institutional
Care of Mentally Handicapped 87.5 90.3 84.8
4.8.2 Judgmental evaluations
Smoke detection and alarm system can be evaluated based on knowledge about the fire detection system, the fire
and the building geometry. Generally, the probability of fire detection can be evaluated by analyzing whether
enough products of combustion will reach the detector to cause actuation for the most sensitive setting for this
type of detector, and will the detector actuate with the amount of products of combustion that is expected for the
specified fire size. The first factor is an evaluation of the design fire and smoke transport to the detector, and the
second is an evaluation of the detector sensitivity and the components reliability. This evaluation can be divided
into steps or processes that functionally occurs. The major parts that would be evaluated include the following
[30]:
Page 62
53
1. Collect the information that seems appropriate for the performance evaluation. Sketch layouts where
appropriate.
2. Develop a strategy for evaluation.
3. Describe the design fire and the time relationship for products of combustion release that is associated
with the component performance. The definition of the design fire is one of the most important parts of
performance evaluation.
4. Identify the functional and operational behavior of the component being evaluated as well as the
relationship of the component to the design fire characteristics.
5. Estimate the component performance.
4.8.3 Residential Smoke Detector
Hall noted the following information in the September/October 1994 NFPA Journal [27].
Twenty percent of U.S. residences have non-operational smoke detectors such that there is no automatic
detection capability at all in the residence. Eleven percent have no batteries in the detectors. Another five percent
have dead batteries, and the batteries were disconnected in another three percent of the residences. Thus 95% of
the non-operational detector households are caused by neglect or deliberate removal /disconnection of batteries.
AC (hard-wired) powered detectors are much less likely to experience power supply problems.
The inherent greater reliability of hard-wired detectors simulated the current NFPA 101 Life Safety Code
requirement for hard-wired detectors in new residential construction. Most of battery problems result from
deliberate deactivation due to frustration with false alarms. Design changes that could reduce the frequency of
false alarms and thereby reduce the occurrence of deliberate battery deactivation could be:
- Use of photoelectric light scattering detectors because there are less sensitive to the smaller particles
associated with cooking smoke and with condensed moisture.
Page 63
54
- Uses of aerodynamically designed entrances to the sensing chamber such that smaller particles would flow
around the chamber while larger particles would flow directly into the chamber.
- Using a higher strength (larger ion generation rate) source that is less prone disruption, i.e. activation, by
small particles. One drawback of the higher strength (alpha particle) source is the higher radiation level in
the vicinity of the detector. Another approach would be to use a higher electrode bias voltage to reduce
disruption/activation by smaller particles. These effects, which are described in NBS Technical Note 973,
may in some cases also decrease overall sensitivity, which is not the most desirable way to reduce false
alarm.
- Incorporating silencers that shut off the alarm either while pressing a button or for a short period following
button contact closure, such that there would be less need to remove/deactivate batteries upon false alarm.
4.9 RESPONSE TIME
A mathematical method to evaluate response time does not exist. The evaluations have to be based on experience
and knowledge about humans. The literature presents response times from 1-2 minutes to over 10 minutes. The
building layout, the arrangement and marking of egress paths, and the human characterization are important
factors. Important human characterization factors are; number of humans, what they do, familiarity in the
building, awake or asleep, health etc.
In buildings occupied by a modest number of humans, were the egress paths are short and well arranged, and the
fire is notified by audible alarm bells, the response time is generally the largest time delay. Researchers on this
topic have concluded that the response time depends on the systems that make the alert. The response times is
found to be shortest when humans can see or smell the fire or notified by others, the second best clue is a direct
message over a loudspeaker system, the third is a pre-programmed message and the fourth is the ordinary alarm
bell.
Page 64
55
A Canadian study about fire risk in offices and residential buildings resulted in a method to evaluate the risk for
personal injuries, FiRECAM. A sub model in FiRECAM [34] is to evaluate the decision and response time.
Table 4-1. Decision and response time for FiRECAM
Information method Decision and response time (seconds)
Heat, smoke or flames 50
Warned by the arrival of FD 50
Warned by other persons 100
Warned by oral message over loudspeakers 100
Warned by a central alarm system 250
Warned by a local smoke alarm/detector 250
The British standard DD 240, BSI (1997) for response time is also referred in the guidance to Norwegian
standard, NS 3901 [3]. This standard distinguishes between different alarm systems, and in addition four
different occupant categories make a matrix that can be a good base for further evaluation.
Table 4-2. Estimated time to recognize and understand the alarm signalTime to recognize and understand
Warning systemOccupancy
Oral message Pre-programmedmessage
Siren or alarmbell
Offices, industry and schools < 1 3 > 4
Stores, exhibition locals, museums andassembly areas
< 2 3 > 6
Hotels < 2 4 > 6
Hospitals and Health care facilities < 3 5 > 8
Page 65
56
4.10 SUMMARY
The design fire for detector actuation is the fire size and fire growth potential, the products of combustion
relatively to the building geometry. In buildings fires can be detected by instruments or by humans. Human
detection depends on the fact that someone has to be there to smell or see the fire. Instrument detection time can
be estimated with hand calculation tools or computer programs. The reliability of actuation is a matter of the fire
characterization, smoke transport between the fire and detector, and the detector component characterization
relative to the fire characterization. The methods used to alert the occupants influence on response times.
4.11 REFERENCES
4.11.1 Design fire information
1 Archibald Tewarson; Generation of heat and compounds in fires, The SFPE handbook of fire protection
engineering, chapter 3-4.
2 Mulholland; Smoke production and properties, The SFPE handbook of fire protection engineering,
chapter 2-15.
3 Evans; Ceiling jet flows, The SFPE handbook of fire protection engineering, chapter 2-4
4 Selection and specification of the ‘Design fire’ for performance based Fire Protection Design,
Proceedings SFPE Engineering Seminar Nov. 15, 1993
5 Delichatsios; Air Entrainment Into Boyant Jet Flames and Pool Fires, The SFPE handbook of fire
protection engineering, chapter 2-3.
6 Babrauskas; Burning Rates, The SFPE handbook of fire protection engineering, chapter 3-1.
7 Cooper; Compartment Fire-generated Environment and Smoke filling, The SFPE handbook of fire
protection engineering, chapter 3-10.
Page 66
57
4.11.2 Smoke detection systems and design
8 National Office of Building Technology and Administration (Norway): Brannalarm - Temaveiledning,
Melding HO-2/98.
9 Norwegian Insurance Association, FG; Regler for automatisk brannalarm (1986).
10 National Fire Protection Association; NFPA 72, National fire alarm code, 1996 edition.
11 National Fire Protection Association; NFPA 101, Life Safety Code.
12 Several editors; Detection and alarm, The NFPA handbook, section 5.
13 Schifililit, Meacham and Custer; Design of Detection Systems, The SFPE handbook of fire protection
engineering, chapter 4-1.
4.11.3 Smoke detection actuation times - hand calculation and theory
2 Mulholland; Smoke production and properties, The SFPE handbook of fire protection engineering,
chapter 2-15.
3 Evans; Ceiling jet flows, The SFPE handbook of fire protection engineering, chapter 2-4
14 Alpert; Calculation of Response time of ceiling mounted fire detectors, Fire Technology, Volume 8 no 3
(1972).
27 Hall, NFPA Journal, September/October 1994
4.11.4 Computer programs for smoke detection evaluation
15 National Institute of Standards and Technology, Building and Fire Research Laboratory,
http://www.bfrl.nist.gov/
16 Nelson; FPETOOL: Fire protection engineering tools for hazard estimation, NISTIR 43870, National
Institute of Standards and Technology, Gaithersburg, MD (1990).
17 Nelson; FPETOOL Users guide, NISTIR 4439, National Institute of Standards and Technology,
Page 67
58
Gaithersburg, MD (1990).
18 Evans & Stroup; Methods to calculate the response time of heat and smoke detectors installed below
large unobstructed ceilings, NBSIR 85-3167, National Institute of Standards and Technology,
Gaithersburg, MD (1985).
19 Stroup, Evans and Martin; Evaluating Thermal Fire Detection Systems, NBS SP 712, National Institute
of Standards and Technology, Gaithersburg, MD (1986).
14 Alpert; Calculation of Response time of ceiling mounted fire detectors, Fire Technology, Volume 8 no 3
(1972).
20 Davis and Cooper; User Guide for the computer code Lavent, NISTIR 89-4122, National Institute of
Standards and Technology, Gaithersburg, MD (1989).
21 Davis, Notarianni and Tapper; An Algorithm for Calculating the Plume Centerline Temperature and
Ceiling Jet Temperature in the Presence of a Hot Upper Layer, NISTIR 6178, National Institute of
Standards and Technology, Gaithersburg, MD.
22 Davis; Zone Fire Model JET: A Model for the Prediction of Detector Activation and Gas Temperature in
the Presence of a Smoke Layer. (3390 K) NISTIR 6324; 55 p., National Institute of Standards and
Technology, Gaithersburg, MD (1999).
23 Jones and Forney; “A Programmer's Reference Manual for CFAST, the Unified Model of Fire Growth
and Smoke Transport,” Natl. Inst. Stand. Technol. 1990, Tech. Note 1283, 104 p.
24 McGrattan, Baum, Rehm, Hamins, Forney, Floyd, Hostikka: Fire Dynamics Simulator (Version 2)
– Technical Reference Guide. NISTIR 6783. National Institute of Standards and Technology. November
2001
40 D'Souza, Sutula, Olenick, Zhang and Roby; Use of the Fire Dynamics Simulator to Predict Smoke
Detector Activation, Proceedings of the Technical Meeting of the Eastern States Section of the
Combustion Institute, December 2001.
Page 68
59
4.11.5 Detector reliability
25 Schifiliti; Fire Detection Modeling – The Research-Application Gap, National Institute of Standards and
Technology (2001)
26 Bukowski, Budnick and Schemel; Estimates of the Operational Reliability of Fire Protection Systems.
28 The Directorate for Fire and Electrical Safety (DBE): http://www.dbe.no/Internett.asp
29 Hall, Fire Safety Journal, 15 (1989) 471-475
30 Fitzgerald; The anatomy of building firesafety - Volume 1 - A way of thinking, or a macro view of
building performance evaluation, Draft 5, Worcester Polytechnic Institute (2001)
4.11.6 Human behavior
31 Wood; The behavior of peoples in fires, Fire Research Station, England (1972).
32 Bryan; Human Behavior and Fire, NFPA handbook chapter 8-1.
33 Latane and Darley; Group Inhibition of Bystander Intervention in Emergency, Journal of Personality and
Social Psycology, Vol 10, No 3, 1968, pp 215-221.
34 Proulx and Hadjisophocleous; Modeling Occupant Response and Evacuation in Apartment and Office
Buildings. Proc. 2nd Pasific Rim SFPE Conf. Maui (1998).
4.11.7 Other information that doesn’t fit into the categories above
35 National Office of Building Technology and Administration (Norway): TEK-97, Regulations concerning
requirements for construction works and products for construction works, 22 January 1997 No. 33
Technical Regulations under the Planning and Building Act 1997.
36 National Office of Building Technology and Administration (Norway): REN, Guidance to Regulations
concerning requirements for construction works and products for construction works, 2nd edition, April
1997.
37 National Building Standardization Council (Norway): NS3901, Risk analysis of fire in buildings and civil
Page 69
60
engineering works, May 1998
38 National Building Standardization Council: Guidance to NS3901, Guidance to risk analysis of fire in
buildings, October
39 National Building Standardization Council: Guidance to NS3901, Guidance to risk analysis of fire in
road tunnels, May 1998.
40 Fitzgerald; The anatomy of building firesafety - Volume 2 - The Framework, Draft 4, Worcester
Polytechnic Institute (1999)
Page 70
61
5 AUTOMATIC SPRINKLER SYSTEMS
An automatic sprinkler system is a unique active fire protection system for developing performance based fire
protection designs. A properly designed sprinkler system improves life safety and property protection to a
magnitude far better than similar buildings without sprinkler systems. In fire protection engineering only two
types of buildings exist: Sprinklered and non-sprinklered. By using the knowledge of sprinklers reliability and
effectiveness, the design of building layouts, egress paths, structural frames, fire partitions, arrangement for fire
brigade intervention may be performed differently than in buildings without sprinkler installed.
This chapter introduces methods and references that may be used to evaluate the reliability and effectiveness of
automatic sprinkler systems. Also methods to evaluate fire size at sprinkler actuation and the relations between
fire size and water application are presented. A few software programs are discussed, and a discussion of how a
reliable sprinkler system could affect the fire environment in buildings.
5.1 OBJECTIVES
The objectives of automatic sprinkler suppression evaluations are to estimate the system reliability, its
effectiveness in fire suppression or fire control. These factors influence the fire environment and its influence on
building performance. Figure 5-1 indicates the parts of a sprinkler system evaluation. Based on [1].
Page 71
62
Valves-Numbers-Supervision
Type of sprinklers-Wet/Dry
Maintenance
ReliabilityInitial water flows
from sprinkler
Fire-HRR-Size-Growth rate
Fire control orextinguishment
evaluation /design
Fireperformance
Building-Room geometry-Barrier effectiveness-Obstructions-Unprotected spaces
Water-Quantity-Pressure-Pumps-Feeds
Sprinkler-Sensitivity-Droplet sizes-Water distribution-Coverage-Condition
OperationalEffectiveness
Enough water flowsfrom the sprinkler(s)in order to control or
extinguish the fire
Figure 5-1. Objectives of sprinkler evaluation
Figure 5-1 shows that there are two main aspects of a fire sprinkler evaluation, operational reliability issues and
operational effectiveness. Reliability is related to the fact that water actually flows through the valves, piping and
sprinklers when the sprinkler link is heated to sufficient temperature. Operational effectiveness to suppress or
control a fire depends among others, on the fire size at actuation, the building geometry, water quantities and
sprinkler sensitivity and discharge characteristics.
Page 72
63
5.2 APPLICATION OF CODES AND STANDARDS
The Technical Regulation (TEK) [52] includes several statements about sprinkler systems with barely
mentioning the word sprinklers. The main reason is that there are also other fire protection systems that can be
used. This code allows sprinklers to compensate for fire partitions if it is possible to document sufficient
reliability and effectiveness of the sprinkler system: The division shall be such that areas of different threats to
the life and health of persons and/or different possibilities of fire to develop, are separated into different fire
compartments, unless same level of safety are obtained by other means. The code does not directly allow
sprinklers to compensate for building frame with weaker fire resistance. The code requires that: In calculations
of stability and load-bearing capacity the total (accidental) load to be expected in the construction works shall
be considered. The Eurocodes [57] recommended the total accidental load to be reduced by a factor of 0.6 when
a sprinkler system is installed according to the national standard. But this factor was not included in the revised
Norwegian load standard. A more useful statement in the code is: Where such measures are not sufficient
(automatic fire and smoke detection), the available time for escape shall be increased by means of active
measures, such as automatic fire-fighting installations, smoke control systems etc. Meaning that, for example, an
automatic sprinkler suppression system, alone or together with other systems, in some situations can compensate
for an unusual layout of egress paths.
The guidelines to the Technical Regulation (REN) [53] recommend automatic sprinkler system to be installed
when the area of the fire section exceeds 1200 m2. In buildings with an automatic fire alarm system installed,
this area increases to 1800 m2. The recommendation is based only on property protection and the society’s
acceptance to property loss in fires. REN also follows up the statements in TEK by saying that sprinkler systems
may be necessary in some buildings.
The deterministic acceptance criteria in NS3901 [54] can be relatively easy to document when sprinkler systems
are installed. Quantitative numbers of the concentrations of carbon monoxide, oxygen, upper layer temperature
and radiation can be calculated or found in reference material. The view length may be more difficult to
Page 73
64
estimate, but a good approximation can be made if one can be satisfied with the evaluation of sprinkler
effectiveness and reliability.
The deterministic evaluation of the sprinkler system may be compared with a deterministic evaluation of fire
doors and fire partitions in order to make a judgment of safe egress. Such a comparative analysis may be
presented in an event tree [58], a decision tree [56] or as a curve [1]. NS 3901 states that risk analysis can be
done by probabilistic-, deterministic- or comparative analysis. The comparisons can use appropriate information
for any of these sources.
There are several standards that give guidelines on how to design a sprinkler system sufficient to control fires in
different fire hazards. So far the sprinkler systems have generally been designed to control a fire with standard
sprinkler sprays [15,16,17]. During the last decade new sprinkler technology has been developed, but only one
sprinkler type is a complete fire suppression sprinkler. This is the Early Suppression Fast Response (ESFR)
[16,17] sprinkler head, which is designed to suppress high challenge fires in warehouses. An intermediate system
is the residential sprinkler. These sprinklers have the fast response technology and they have been tested for fire
suppression. The residential sprinklers may be good fire suppression systems, but the standards for designing
residential sprinklers [18,19] does not require sufficient water application rate and duration to ensure fire
suppression. On the other hand, one of standard's requirements for residential sprinklers is to delay flashover to
over 10 minutes. Today, manufacturers do not know about water distribution pattern and water drop size
distribution that appears below the sprinkler link. These factors are necessary to predict sprinkler suppression.
Because of the scarcity of this knowledge, sprinkler systems are usually designed to control fires. When
designing a sprinkler control system, the technology of sprinkler suppression system must not be mixed in.
Sprinkler control is designed to control fires by preventing fire spread beyond a design area.
Page 74
65
5.3 DESIGN FIRE FOR SPRINKLER EVALUATION
Sprinkler design standards relate potential fires with occupancy classifications. These classifications [15,16] are
described Light Hazard; Ordinary Hazard; Extra Hazard and Special Hazards. In essence, these classifications
are associated with water delivery and its supply. One might view these classifications as "design fires".
However, they are not design fires from an evaluation or performance viewpoint.
A design fire for a sprinkler system involves three concepts [1]:
1. A relationship between the time of fire growth and the rate of heat release rate
2. A relationship between heat release rate and floor area of fire involvement
3. A relationship between the fire plume momentum and the floor area of fire involvement
When one wants to evaluate the fire size at the time of first sprinkler actuation, the fire growth rate provides a
basis for the estimate. As one considers the speed of fire spread and the ability of the sprinklers to control or
extinguish the design fire, the heat release rates and floor areas becomes important in making the estimations for
water distribution and quantity.
The design fire is the same whether one evaluates the system for fire control or fire extinguishment. The rules for
early suppression fast response (ESFR) are different from those for traditional fire control. In addition, water
mist is sometimes considered a suppression system. While the design fire remains a single description that
considers the type of fire growth expected for the room configuration, the sprinkler performance is dependent
upon the sprinkler design, the water density, distribution, and continuity, and the presence of obstructions.
5.4 SPRINKLER ACTUATION
In the suppression mode the actuation time and convective heat release rates at actuation are another important
factors to achieve suppression. Sprinkler actuation can be predicted numerically by using formulas for ceiling jet
Page 75
66
velocities and temperatures and a heat balance equation for the sprinkler link [3,30] (the radiation part of the
equation can be excluded).
Sprinkler link temperature:
Lcond
L
rLgL TRTI
C
mc
Q
RTI
)TT(U
dt
dT∆−+
∆−∆=
where,
m = sprinkler link mass (kg)
cL = sprinkler link specific heat (kJ/kg.K)
∆TL = Change in link temperature (K or C)
∆Tg = Change in gas temperature at the link (K or C)
Qr = Radiation (kW/m2)
RTI = Response Time Index (m½s½)
The values for link mass, conduction parameters, specific heat capacity etc. of fast response links are not always
know. For convenience some useful link data are presented in table 5-1.
Page 76
67
Table 5-1. Typical sprinkler head data
Sprinkler link details Fast responsesprinkler
"Slow" responseconventional
sprinkler
Fast responsesprinkler
Conventionalsprinkler
Link type Solder Solder Bulb Bulb
Link mass, kg 0.00094 0.009 0.0006 0.002
Link actuation temperature, °C 74 1398C 74 70
RTI, (m.sec)0.5 29.8 302 24.6 342
Heat capacity of link, kJ/kg°C 0.385 0,385 3.3 3.3
Link area, m2 0.000384 0.0094 0.0001 0.00024
Conduction parameter C 0.5 1.52 0.5 1.0
Time dependent velocities and temperature in the ceiling jet must be calculated to estimate actuation time.
Several correlations are listed in the reference section.
5.5 SPRINKLER CONTROL MODE
In this evaluation, occupancy and commodity classifications are the most important factors. If the fire hazard is
underestimated the fire can overpower the water application rate. According to the standards [6-8] it is
presupposed that the fire will be controlled within the required design area with the required water application
rate. The standards give guidelines onto how different occupancies can be classified into fire hazards.
The design fire for sprinkler control is primarily occupancy classification. But also ceiling height and sprinkler
configuration must be considered according to the standards.
Page 77
68
5.6 SPRINKLER SUPPRESSION THEORY
The standard that describe sprinkler suppression with ESFR is NFPA 13 [15], NFPA 231C [17] and the CEA
standard [16]. The ESFR sprinklers have a special design; they can deliver large quantities of water at high
pressure, with high water density and force, directly below the sprinkler head.
In 1984, Factory Mutual Research Corporation (FMRC) initiated the ESFR research program. A significant
development that resulted from the ESFR program was the establishment of a systematic approach to sprinkler
performance evaluations using relationships between quantifiable sprinkler discharge characteristics and the fire
challenge. This approach compares the amount of water required for fire suppression with the amount of water
actually delivered to the burning surface. These terms are called the Required Delivered Density (RDD) and
Actual Delivered Density (ADD). For a given heat release rate early suppression can be predicted if ADD is
higher than RDD.
RDD is measured with a horizontal and circular array of collectors on top of the fuel array. RDD is the water
densities found to be necessary to suppress the fire. ADD is measured after the droplets have fallen through a
heptane fire plume. ADD is therefore dependent on the sprinkler head’s ability to penetrate the fire plume at the
fire size being evaluated.
The sprinkler suppression mode must be designed with the criteria: The sprinkler link must fuse early and
quickly suppress the fire and prevent actuation of more than those sprinkler links that the system is designed to
operate within.
A rough prediction of sprinkler suppression rate can be predicted if the fuel characteristic is known. Yu, Lee and
Kung at FMRC [25] have correlated the fire response of delivered water density in rack-storage. They found that
the fire intensity after water application could be expressed as:
Page 78
69
)tt(k0a
.
a
.0eQQ −−=
where k is a measured constant dependent on the water application density per unit exposed surface area (water
that has penetrated the buoyant plume, ADD), and Qa0 is the HRR at water application
Critical water application rates for different fuels can be found in the SFPE handbook [26]. When fuels burn in
normal air and no external heat flux occur, the critical water application rate is low. When the fuel is exposed to
its own flames or other external heat flux, the critical water application rate increases. These values includes that
no puddle at the surface occurs, and, they can be compared with an evaluated ADD.
Table 5-1. Critical water fluxes for flame extinction
Fuel Critical water applicationrate without external
radiation g/m2.s
External radiation kW/m2 Critical water applicationrate without external
radiation g/m2.s (mm/min)
Polypropylene 3.0 67 29 (1.7)
Polyethylene 3.8 61 27 (1,6)
Polyethylene foams 3.5-4.1
Polystyrene 5.1 75 34 (2.0)
Measurements of required water delivery to suppress a light hazard scenario (vinyl covered upholstered chair
with padding made of 30% polyurethane foam and 63% shredded PU and 7% cotton) indicated that RDD of 5
mm/min could be used to suppress a fire in light hazard occupancies [23,24].
5.6.1 Sprinkler design for suppression
The most common sprinkler head is the standard spray sprinkler, with an activation temperature of 68-74 °C a 6
mm in diameter bulb (if a fusible link is not used). These sprinklers have a normal Response Time Index (RTI)
Page 79
70
and a water density distribution that are not appropriate for early suppression, but they are appropriate for a
sprinkler control design. A standard sprinkler with a smaller activation bulb (3 mm) or fusible link and a RTI
below 50 (ms)½ is called a fast response sprinkler. The water distribution pattern is similar to the standard spray.
Even though these sprinklers activate early they are normally not designed to deliver proper amount of water for
suppression directly below the sprinkler head. The distribution pattern is not uniform. A standard response
sprinkler link is appropriate for sprinkler control, but a fast response sprinkler in a sprinkler control mode can
cause further sprinklers to open than assumed in the sprinkler design area, causing the water application rate per
sprinkler to drop. Fast response must therefore be selected with care.
Residential sprinklers also have low RTI values and are designed to enhance the probability of
suppression/control with smaller water densities in order to make the system achievable for housekeepers. But,
on the other hand, residential sprinklers are designed to control or extinguish a fire within the periphery of on
sprinkler head. The water distribution pattern is more uniform. The water demand delivered from residential
sprinkler systems is less than usually required for commercial sprinkler suppression. The requirement, according
to NFPA 13R and –D, is to delay flashover in 10 minutes. With higher water densities than required, residential
sprinklers may be the most efficient suppression sprinklers in light and ordinary hazards [27].
Besides the sprinkler spray distribution and water flow, the next important factor is water droplet size. Larger
drops have larger momentum and more efficient in penetrating the fire plume. The droplet size is an inverse
function of water pressure and a proportional function to sprinkler orifice (the K-factor) [30].
The last and decisive factor is the fire vs. sprinkler configuration. Fires between four sprinklers would be
exposed to higher water flux and the water would penetrate into the plume with an angular attack. The ADD will
decrease, as the fire becomes vertically closer to the sprinkler link. The figure 5-2 shows the test results from a
residential sprinkler with the minimum of required water delivery rates [23].
Page 80
71
Figure 5-1. Measured ADD for a specific residential sprinkler
Table 5-1. Corresponding water delivery rates to figure 5-2Number of sprinklers Water deliver rate
1 sprinkler actuates (ignition under one) 68 L/min
2 sprinkler actuates (ignition between two) 49 L/min pr sprinkler head
4 sprinkler actuates (ignition between four) 49 L/min pr sprinkler head
5.6.2 Water droplet size distribution
The water droplet size distribution and water density distribution from a sprinkler head is a crucial factor for
predicting sprinkler performance. Especially, the size and density of water reaching the area directly below the
sprinkler head is important in sprinkler suppression mode. The distribution varies between sprinkler designs. An
example of water distribution is given in figure 5-3 and 5-4. These figures are derived from measurements of
water flows and droplet sizes from a standard sprinkler link [25]. Note that the water distribution and droplet
sizes at about 1-2 m2 directly below this sprinkler head is more appropriate for control than for suppression.
ADD mesurements residential prinkler
0
0.5
1
1.5
2
2.5
3
3.5
4
4.5
0 100 200 300 400
Convective fire size
AD
D m
m/m
in Measured below 1sprinkler
Measured between 2sprinklers
Centered under 4sprinklers
Page 81
72
Water flow distribution
0
500000
1000000
1500000
2000000
2500000
0 0,5 1 1,5 2 2,5 3 3,5
Distance from center [meter]
Mea
sure
d w
ater
flu
x du
ring
a ti
me
peri
ode
Figure 5-1. Measured droplet size and water flow at different distances from center under a standard pendentsprinkler head.
Figure 5-2. Measured water flow distribution from a standard pendent sprinkler head.
Measured water flows at 0 degrees and different distances from center
0
20000
40000
60000
80000
100000
120000
0 100 200 300 400 500 600 700 800 900 1000
Droplet diameter [microns]
Mea
sure
d w
ater
flu
x du
ring
a ti
me
peri
ode
0
0,8
1,6
2,4
Distance from senter [meter]
Page 82
73
5.7 AUTOMATIC SPRINKLER RELIABILITY
5.7.1 Statistics
Statistics may be used to describe certain data of a sprinkler system. However, statistics alone shouldn't be used
for an evaluation of a protection system.
Reliability is normally defined as an estimate of the probability that a system or component will function as
designed over a designated time period. As mentioned in chapter 4, there are two components to overall
reliability. Operational reliability is a measure of the probability that a system or component will operate as
intended when called upon. It is directly affected by the types and frequency of testing and maintenance
performed on the system. Performance reliability (i.e., capability) is a measure of the adequacy of the system,
once it has operated, to successfully perform its intended function. For a sprinkler system, operational reliability
accounts for the “readiness” of the system to apply water under a fire scenario, while performance reliability
addresses the “capability” of the sprinkler to perform satisfactorily under specific fire exposures. The operational
reliability of a sprinkler component system can be high. Based on different statistical sources the reliability of
sprinklers varied from 86% to 99% [39].
Table 5-4 [39] provides a summary of the reliability estimates provided in four studies. Significant differences
exist in the individual reliability estimates depending on the parameters used to develop these estimates.
Depending on the required accuracy in predicting future operational performance of fire protection systems,
dependence on the range of estimates from these studies could significantly alter the results. In addition, the
uncertainty associated with a single estimate of reliability or the existence of potentially important biases in the
methods used to derive these estimates may limit their direct usefulness in addressing either operational or
performance reliability [39].
Page 83
74
Table 5-1. Published Estimates for operational reliability of sprinkler systems [39]Warrington DelphiUK (Delphi group)
Fire Eng. GuidelinesAustralia
(Expert Survey)
Japanese Studies(Incident data)
Protection SystemFlaming Flaming/
Flash overTokyo FD Watamabe
Sprinkler operate 95 95/99 97 NA
Sprinkler control but didnot extinguish
64 NA NA NA
Sprinkler extinguish 48 NA 96 NA
(Probability of success (%)) (NA = Not Addressed)
The estimates presented in table 5-5 generally indicate relatively high operational reliability for sprinkler
systems. While some of the data sources included fire control or extinguishment as part of the reliability
assessment, the reported data were not consistent. Therefore, operational reliability in table 5-5 was assumed to
be limited to sprinkler operation.
Page 84
75
Table 5-2. Reported Automatic Sprinkler Reliability Data (percent) [39]Occupancy References Reliability values
Milne [1959] 96.6/97.6/89.2Automatic sprinkler [1970] 90.8-98.2Miller [1974] 86DOE [1982] 98.9Maybee [1988] 99.5Kook [1990] 87.6Taylor [1990] 81.3Sprinkler focus [1993] 98.4-95.8
Commercial
Linder [1993] 96
Building research Est. [1973] 92.1Miller [1974] 95.8Miller [1974] 94.8Powers [1974] 96.2Richardson [1985] 96Finuance et. Al. [1987] 96.9-97.9
General
Marryat [1988] 99.5
Residential Milne [1959] 96.6
Institutional Milne[1959] 96.6
5.7.2 Water supply failure
The available water supply is sometimes insufficient to control fires. This problem is often present in areas with
ground water or where local ponds are used as sprinkler water supplies. Seasonal variations in rainfall and the
occasional drought affect the "height" of the underground water level and causing low level in water tanks.
Reference: Wilcox [41].
After treatment water is distributed into a system of pipes made of cast or ductile iron. These pipes tend to
corrode with time and lose their capacity to withstand the combination of surface loads and pressures due to soil,
Page 85
76
frost heave and water. Newer pipes are often made of PVC and the problem is reduced significantly. Schultz
[42].
Walski and Pellicia [40] performed a study of water main breakages and provided a compilation of the
frequencies, fbl, of water main breaks in various municipalities. The corresponding water main probability of
outage is given by:
fbl tLfp ××=
where:
p is the probability of water main being unavailable
fbl is the frequency of main breaks and leaks per mile-yr or pr km-yr.
L is the length (mile or km) of main from water source to plant connection
tr is the average time to repair break/leak (yr)
The repair times are given by the formula:
( )yrDt
hrDt
r
r
285.04
285.0
)(104.7
5.6
××=
×=−
where:
D is the water main diameter in inches
In some areas, earthquakes, floods and forest fires can occur. Floods can affect the water supply system and
destroy pumps. Ice formations can make pipes freeze, put pumps and storage tanks out of service etc. Forest fires
can involve and destroy water storage tanks, pumping stations, and water treatment facilities thereby cutting of
the water supply.
Page 86
77
5.7.3 Reliability of pumps, valves, pipes and operation of sprinkler heads
Automatic sprinklers are thermo sensitive devices, designed to react at predetermined temperatures by
automatically releasing a stream of water: The water is feed to the sprinkler through a system of piping, valves
and sometimes pumps. The pipes are connected to the ceiling with special hangers, and the sprinkler heads are
placed relative to the ceiling and beams. The reliability of the sprinkler system depends on each component
functionality, installation and maintenance [20,21].
Although sprinkler systems historically are very reliable, there are some malfunction modes that should be
considered. A way to prevent system malfunction is to install redundant systems [39].
Table 5-1. Failure modes for sprinkler system componentsSystemcomponent
Failure modes Redundancy / failure prevention efforts
Pumps Loss of power supply
Motor malfunction
Additional power supply
Two pumps
Valves Valves are closed Automatic valve supervising, periodically supervising
Pipes Pipes are corroded Acid-proof piping, water circulation system, inhibitor.
Sprinklerheads
Sprinkler head becomesclogged at actuation.
Circulation system with filters (requires a loop system),prevent loose parts like o-rings
5.7.4 Obstructions
Obstructions can reduce or remove parts of the sprinkler spray. Sprinkler heads located close to ducts or ceiling
beams/girders can obstruct a portion of the spray and cause the fire to grow uninterrupted. Ideally, obstructions
in the ceiling should be located in the center between the sprinkler links.
Page 87
78
5.8 COMPUTER PROGRAMS FOR AUTOMATIC SPRINKLER MODELING
In the suppression mode the time to actuation is a critical factor and this part of the evaluation is essential. There
are many ways to predict actuation times; some of them are listed in the reference section [43-54]. Other
software like CFAST and FastLite can also be used to predict sprinkler actuation times [50].
The CFD code Fire Dynamic Simulator [51] calculates both actuation and suppression. FDS can be programmed
to include median droplet size, water flux and water distribution pattern. This program is exceptional if sufficient
information about sprinkler links water spray distribution pattern is available.
Sprinkler actuation is modeled similar to heat detectors. More information about the computer tools for modeling
heat detection is presented in chapter 4.
5.9 SUMMARY
Sprinkler system installation may be a useful to document sufficient fire safety with regard to several aspects of
building firesafety. The code require a sprinkler system to be installed according to the standards [] occupancy
classification. A sprinkler performance evaluations starts with an evaluation of a design fire, and then evaluation
of operational reliability and operational effectiveness. Evaluations of a sprinkler control systems and sprinkler
suppression systems shall be distinguished. Computer programs can be used to evaluate sprinkler actuation, and
some field models can be used to simulate sprinkler suppression.
Page 88
79
5.10 REFERENCES
5.10.1 General design fire information
1 Fitzgerald; The anatomy of building firesafety - Volume 1 - A way of thinking, or a macro view of
building performance evaluation, Draft 5, Worcester Polytechnic Institute (2001)
2 Selection and specification of the ‘Design fire’ for performance based Fire Protection Design,
Proceedings SFPE Engineering Seminar Nov. 15, 1993
5.10.2 Sprinkler related fire dynamics and sprinkler actuation
3 Heskestad and Bill; Quantification of Thermal Responsiveness of Automatic Sprinklers Including
Conduction Effects, Fire Safety Journal 14:113-125, 1988.
4 Alpert; Turbulent Ceiling-Jet Induced by Large Scale Fires, Comb. Sci. Tech., 11 (1975) 197-213.
5 Heskestad and Delichatsios; NBS-GCR-77-86 and NBS-CGR-77-95, National Bureau of Standards,
1977.
6 Motevalli and Marks; Characterizing the Unconfined Ceiling Jet under Steady State Conditions: A
Reassessment, in Fire Safety Science -- Proceedings of the 3rd International Symposium, Elsevier
Applied Science, London, UK (1991) 301-312.
7 Kung, Spaulding, You; Response of Sprinkler Links to Rack Storage Fires, Factory Mutual Research
Corporation, 1986.
8 Evans; Ceiling Jet Flows, The SFPE Handbook 2nd edition chapter 2-4.
9 Davis, Notarianni and Tapper; An Algorithm for Calculating the Plume Centerline Temperature and
Ceiling Jet Temperature in the Presence of a Hot Upper Layer, NISTIR 6178, National Institute of
Standards and Technology, Gaithersburg, MD.
Page 89
80
10 Archibald Tewarson; Generation of heat and compounds in fires, The SFPE handbook of fire protection
engineering, chapter 3-4.
11 Evans; Ceiling jet flows, The SFPE handbook of fire protection engineering, chapter 2-4
12 Delichatsios; Air Entrainment Into Boyant Jet Flames and Pool Fires, The SFPE handbook of fire
protection engineering, chapter 2-3.
13 Babrauskas; Burning Rates, The SFPE handbook of fire protection engineering, chapter 3-1.
14 Cooper; Compartment Fire-generated Environment and Smoke filling, The SFPE handbook of fire
protection engineering, chapter 3-10.
5.10.3 Sprinkler system and sprinkler design
15 National Fire Protection Association; NFPA 13, Installation of Sprinkler Systems, 1996 edition.
16 The European Insurance Company (CEA); Sprinkler System, CEA 4001:2001-04, Planning and
Installation.
17 National Fire Protection Association; NFPA 231C, Rack Storage of Materials, 1995 edition.
18 National Fire Protection Association; NFPA 13D, Sprinkler Systems in one- and two Family Dwellings
and Manufactured Homes, 1996 edition.
19 National Fire Protection Association; NFPA 13R, Sprinkler Systems in Residential Occuoancies up to
and Including Four Stories in Height, 1996 edition.
20 Puchovsky; Automatic Sprinkler Systems - Handbook, National Fire Protection Association, 1996.
21 Solomon; Automatic Sprinkler Systems, NFPA Handbook 18th edition.
5.10.4 Sprinkler performance and sprinkler efficiency
22 Bill, Kung, Vincent, Brown and Spaulding; Predicting The Suppression Capability of Quick Response
Sprinklers in a Light Hazard Scenario Part 1: Fire Growth and Required Delivered Density (RDD)
Page 90
81
Measurements, FMRC, Journal of Fire Protection Engineering 3(3), 1991 pp 81-93.
23 Bill, Kung, Brown and Spaulding; Predicting The Suppression Capability of Quick Response Sprinklers
in a Light Hazard Scenario Part 2: Fire Actual Delivered Density (ADD) Measurements and Full-scale
Fire Tests, FMRC, Journal of Fire Protection Engineering 3(3), 1991 pp 81-93.
24 Putori, Belsinger and Twilley; Determination of Water Spray Drop Size and Speed from a Standard
Orifice, Pendent Spray Sprinkler, National Institute of Standards and Technology, September 21, 1995
(revised May 27, 1999).
25 Yu, Lee, Kung; Parametric Study With a Computational Model Simulating Interaction Between Fire
Plume and Sprinkler Spray «Suppression of Rack Storage Fires by Water», Factory Mutual Research
Corporation, Fire Safety Science, Fourth International Symposium 1994, pp901-912.
26 Tewarson; Generation of Heat and Compounds in Fires, Table 3-4.27 and 3-4.28
27 Cote and Fleming; Fast Response Sprinkler Technology, NFPA Handbook 6-13 18th edition.
28 Vincent, Stavrianidis and Kung; Use of Quick Response Sprinklers for Industrial Fire Protection
Applications; FMRC, J. of Fire Protection Engineering 2(4), 1990 pp 99-110.
29 Chan; Measurements of Water Density and Drop Size Distribution of Selected ESFR Sprinklers, ,
FMRC, J. of Fire Protection Engineering 6(2), 1994 pp 79-87.
30 Grattan and Forney; Numerical Simulation of Sprinkler Performance, National Institute of Standards and
Technology, 1999.
5.10.5 Sprinkler reliability
31 Modarres; Reliability and risk analysis, University of Maryland, Marcel Dekker Inc. New York (1993)
32 Hughes Associates, Inc. “Pilot Study: Automatic Sprinkler System Reliability Analysis,” Hughes
Associates, Inc., Baltimore, MD, September 30, 1998.
33 Miller, M.J. “Reliability of Fire Protection Systems,” Loss Prevention ACEP Technical Manual, 8, 1974.
34 Linder, K.W. “Field Probability of Fire Detection Systems,” Balanced Design Concepts Workshop,
Page 91
82
NISTIR 5264, R.W. Bukowski (Ed.), Building and Fire Research Laboratory, National Institute of
Standards and Technology, September 1993
35 Marryat, H.W. Fire: A Century of Automatic Sprinkler Protection in Australia and New Zealand 1886-
1986, Australian Fire Protection Association, Melbourne, Australia, 1988.
36 Powers, R.W. “Sprinkler Experience in High-Rise Buildings (1969-1979),” SFPE Technology Report 79-
1, Society of Fire Protection Engineers, Boston, MA, 1979.
37 Richardson, J.K. “The Reliability of Automatic Sprinkler Systems,” Canadian Building Digest, Vol. 238,
July 1985.
38 Finucane, M, and Pickney, D. “Reliability of Fire Protection and Detection Systems,” United Kingdom
Atomic Energy Authority, University of Edinburgh, Scotland.
39 Bukowski, Budnick and Schemel; Estimates of the Operational Reliability of Fire Protection Systems.
40 Walski and Pellicia; Economic Analysis of Water Main Breaks, Journal of American Water Works
Association, 1982.
41 Wilcox; Water Storage Facility and Suction Supplies, The NFPA Handbook 18th edition chapter 6-2.
42 Schultz; Water Distribution Systems, The NFPA Handbook 18th edition chapter 6-3.
5.10.6 Computer programs for sprinkler evaluation
43 National Institute of Standards and Technology, Building and Fire Research Laboratory,
http://www.bfrl.nist.gov/
44 Nelson; FPETOOL: Fire protection engineering tools for hazard estimation, NISTIR 43870, National
Institute of Standards and Technology, Gaithersburg, MD (1990).
45 Nelson; FPETOOL Users guide, NISTIR 4439, National Institute of Standards and Technology,
Gaithersburg, MD (1990).
46 Stroup, Evans and Martin; Evaluating Thermal Fire Detection Systems, NBS SP 712, National Institute
of Standards and Technology, Gaithersburg, MD (1986).
Page 92
83
47 Alpert; Calculation of Response time of ceiling mounted fire detectors, Fire Technology, Volume 8 no 3
(1972).
48 Davis and Cooper; User Guide for the computer code Lavent, NISTIR 89-4122, National Institute of
Standards and Technology, Gaithersburg, MD (1989).
49 Davis; Zone Fire Model JET: A Model for the Prediction of Detector Activation and Gas Temperature in
the Presence of a Smoke Layer. (3390 K) NISTIR 6324; 55 p., National Institute of Standards and
Technology, Gaithersburg, MD (1999).
50 Jones and Forney; “A Programmer's Reference Manual for CFAST, the Unified Model of Fire Growth
and Smoke Transport,” Natl. Inst. Stand. Technol. 1990, Tech. Note 1283, 104 p.
51 McGrattan, Baum, Rehm, Hamins, Forney, Floyd, Hostikka: Fire Dynamics Simulator (Version 2)
– Technical Reference Guide. NISTIR 6783. National Institute of Standards and Technology. November
2001
5.10.7 g. References that don't fit into the above categories
52 National Office of Building Technology and Administration (Norway): TEK-97, Regulations concerning
requirements for construction works and products for construction works, 22 January 1997 No. 33
Technical Regulations under the Planning and Building Act 1997.
53 National Office of Building Technology and Administration (Norway): REN, Guidance to Regulations
concerning requirements for construction works and products for construction works, 2nd edition, April
1997.
54 National Building Standardization Council (Norway): NS3901, Risk analysis of fire in buildings and civil
engineering works, May 1998
55 National Building Standardization Council: Guidance to NS3901, Guidance to risk analysis of fire in
buildings, October
56 Clemen; Making Hard Decisions - An Introduction to Decision Analysis,
Page 93
84
57 Eurocode 1 - Basis of design and actions on structures - Part 2-2: Actions on Structures Exposed to Fire
58 39. Aven; På litelighets og Risikoanalyse, Universitetsforlaget, 1991.
Page 94
85
6 SMOKE MOVEMENT, CONTROL AND TOXICITY
Smoke and fire gases, are air borne products of combustion (POC). The amount and spread of POC’s have
critical influence on life safety and fire brigade intervention. The POC’s contains toxic gases, particles, water
and air. Both, toxicity and visibility increases with fire size, and, in some fires, the volume of smoke produced
can fill the involved building. In large fires, an enormous smoke plume is generated.
This chapter identifies references for evaluating smoke movement in buildings, smoke control systems and
toxicity aspects of smoke. Several computer programs for smoke movement and control are also identified.
6.1 OBJECTIVES
Evaluation of smoke production, movement and control are the main factors for the identification of tenable
conditions for safe egress. Smoke evaluation involves a wide range of uncertainty because of the variety of
different fuel properties and conditions that can affect smoke spread. Smoke control systems usually assume a
two-zone smoke layer environment. Smoke can move through open doors, cracks or holes and penetrate into the
egress paths, and causing untenable conditions. The reliability issues of doors are important to do a comparative
analysis.
6.2 APPLICATION OF CODES AND STANDARDS
The Technical Regulation [56] does not include any requirement of smoke control systems. But, smoke control
systems or other active fire protection systems shall be used where egress paths can't be designed with adequate
physical and passive safety systems. Where fire compartments are not designed with such layout and interior
design that escape and fire fighting can be accomplished in a rapid and efficient way.
Page 95
86
Smoke control in atria is a common fire design used to compensate for a higher likelihood of fire and smoke
spread. This is due to the atria's ability to collect heat and smoke and, without smoke control, causing rapid fire
and smoke spread to several floors and fire partitions.
NFPA 92A [1], NFPA 92B [2], and NFPA 204M [3] and HO-3/2000 [4] cover smoke control systems in egress
paths, atria, malls and large spaces. The standards include tools to classify fire hazards and smoke production, as
well as methods to design smoke control systems. These standards are discussed in this chapter.
6.3 DESIGN FIRE FOR SMOKE MOVEMENT
6.3.1 Design fire for smoke movement, general aspects
As a fire burns, it [21]:
1. Generates heat.
2. Changes major portions of the burning material or fuel from its chemical composition to one or more
complex compounds, such as carbon dioxide, carbon monoxide, water, and/or other compounds.
3. Often, due to less than 100% combustion efficiency, transports a portion of the fuel as soot or other material
that may or may not have undergone a chemical change.
A major portion of the heat generated as fuel burns, remains in the mass of products liberated by the fire. This
mass expands, is lighter than the surrounding air and rises as a plume. The rising plume is turbulent, and because
of this entrains large quantities of air from the surrounding atmosphere into the rising gases. This entrainment:
• Increases the total mass and volume of the plume.
• Cools the plume by mixing the entrained air with the rising hot gases.
• Dilutes the concentration of fire products in the plume
Page 96
87
For the purpose of describing smoke movement in buildings, the treatment of smoke movement is divided into
two general areas; the hot smoke zone and the cold smoke zone. The hot smoke zone includes those areas in a
building where the temperature of the smoke is high enough, so that the natural buoyancy of the body of smoke
tends to lift the smoke towards the ceiling while clean, or at least less polluted, air is drawn in through the lower
portion of the space. Normally, this condition exists in the room of origin. Depending upon the level of energy
produced by the fire and the size of connecting openings, such as open doors, hot smoke zones can readily exist
in adjacent rooms or corridors. The cold smoke zone includes those areas in a building where mixing and other
forms of heat transfer have reduced the driving force of the fire to the point at which buoyant lift in the smoke
body is a minor factor. In these areas, the movement of smoke is primarily controlled by other forces, such as
wind and stack effects, ventilation, air conditioning, or other air movement systems. In these areas, the
movement of smoke is essentially the same as the movement of any other pollutant.
The design fire for smoke production is related to a description of a time dependent fire growth. The smoke
quantity is then related to this fire. The design fire for smoke properties and toxicity becomes more complex if
measures for all toxic gases are included. But, according to NS3901 [58] measures of the most common gases
like carbon monoxide, carbon dioxide and oxygen is sufficient in most buildings. A design fire characterized by
fire size, ventilation conditions, ceiling height and room size, can be used to identify the smoke and gas
production of a fire. By adding estimates of particle sizes from the burning fuels [20] it would also be possible to
evaluate smoke visibility.
Since smoke production is dependent on both fire size and factors affecting air entrainment, the room geometry
is important. The fire plume rises upwards with continuously increasing plume diameter. Ceiling height and the
fire area at the bottom of the plume affects air entrainment and volume of smoke produced. Geometries where
the hot fire gases can be transported horizontally beneath a ceiling before it rises into a larger space can be
evaluated as a balcony spill plume. The volume of smoke entering the larger volume depends on balcony width,
Page 97
88
ceiling height above the balcony and the balcony height. In buildings where smoke can penetrate through a
window or door opening before it enters the larger space, a window plume evaluation may be appropriate [2].
6.3.2 Design fire size
Fire sizes are usually described in kilowatts or fire area. Fire growth may be described as a t-square fire. The fire
size is usually estimated from necessary egress time, fire department arrival, characterization of commodities or
limited fire size due to partitions and/or sprinkler. Building design with a sprinkler control system can be
designed with a smoke control system designed according to an expected sprinkler controlled fire size. The fire
protection society in the UK has developed and accepted design fires for atrium vent areas based on statistics [7].
Table 6-1. Recommend fire areas designing atria smoke ventilation [7].
Occupancy / hazard Area Deign fire
Sprinklered retail premises 10 m2 5 MW
Sprinklered offices 16 m2 1 MW
Sprinklered offices 47 m2 6 MW
Unsprinklered hotel rooms Largest bedroom 1 MW
For either a continuously growing design fire or a limited design fire where the vent areas or the exhaust fans are
not able to exhaust the smoke generated, the descending smoke layer must be compared to the time necessary to
evacuate and rescue people inside the building.
Page 98
89
6.4 SITUATIONS TO EVALUATE SMOKE MOVEMENT AND CONTROL
6.4.1 Smoke movement beyond the room of origin
Fire and smoke spread to rooms beyond the origin are important aspects in life safety evaluation. Smoke spread
into corridors and staircases is usually prevented with passive barriers composed of walls and doors. Due to the
temperature generated pressure difference smoke tend to penetrate through cracks or openings in the barriers.
Winds can also contribute to smoke spread.
The governing factor for smoke spread is temperature generated pressure differences. A fully involved fire room
can cause temperatures up to, and in some cases, beyond 1000°C. The room temperature depends on wall
insulation, room size and vents. There are several correlations that can be used [8]. Air is sucked into the fire
compartment below the neutral plane and smoke is exhausted above this plane. At the neutral plane, the pressure
is the same as the ambient. The neutral plane in the fire compartment is relative to the ambient conditions and
may not be relative to the neutral plane within the building. The building’s neutral plane may lie below or above
the fire compartment. Where the neutral plane in the building is above the fire compartment, smoke can be
assumed to penetrate through air gaps around doors and construction crack also near the floor. [2,5,9]
Air gaps between door leafs and frames varies. Old doors may have large gaps while new fire rated doors may
have smaller gaps. Fire rated and tight doors can be almost 100% smoke tight. References for cracks in walls
[13,15]. Reference for airgaps around doors [4].
Page 99
90
Table 6-1. Typical leakage areas for walls and floors of commercial buildings [9]
Construction element Wall Tightness Area Ratio A/Awall
Exterior building walls (includes construction cracks,
cracks around windows and doors)
Tight
Average
Loose
Very Loose
0.70 x 10⁻⁴
0.21 x 10⁻³
0.42 x 10⁻³
0.13 x 10⁻²
Stairwell walls (includes construction cracks but not
cracks around windows or doors)
Tight
Average
Loose
0.14 x 10⁻⁴
0.11 x 10⁻³
0.35 x 10⁻³
Elevator shaft walls (includes construction cracks but not
cracks around windows or doors)
Tight
Average
Loose
0.18 x 10⁻³
0.84 x 10⁻³
0.18 x 10⁻²
Floors (includes construction cracks around penetrations) Average A/AFloor = 0.52 x 10⁻⁴
Ambient wind velocity and wind direction can also affect smoke movement. Wind generated pressure difference
around the building can also cause pressure differences within the building through open windows and doors.
Pressure differences due to elevation are important factors for shafts and staircases.
6.4.2 Smoke control in atria
In addition to the design fire characteristics mentioned in chapter 6.4.1, egress time and fire brigade arrival could
be used to estimate smoke layer height and temperature during egress time and fire size at water application
time.
Page 100
91
6.4.3 Smoke control in road tunnels and subways
The materials which burn in tunnel and underground station fires come from the vehicles involved. They include
elements of the vehicles such as seats, tires, plastic materials and the finishing, or even the body itself, the fuel
from the vehicle tanks, which can amount to hundreds of liters for trucks as well as the cargo, principally for
goods vehicles. The fuel load may vary from 3 GJ for a small private car and up to 1500 GJ for a petrol tanker.
The most common method of smoke control in tunnels is tunnel jet fans to establish a one way smoke movement
(longitudinal smoke control). There are also three other methods for mechanical ventilation: Fully transverse,
semi transverse and partial transverse. All of these methods use ducts to exhaust and/or supply the tunnel with
smoke/air. The design fire is the same for all methods and a proper choice of heat release rate, together with the
cross section area, tunnel height, tunnel slope and external wind are required to design a sufficient ventilation
system.
References for smoke control in tunnels can be found in PIARK [6], and the guidance to risk analysis of road
tunnels [60].
6.5 SMOKE MOVEMENT EVALUATION TOOLS
Smoke movement is caused by pressure differences due to elevated temperatures, stack effects, and wind. All
fires produce smoke, and the fire generates a hot smoke zone that can penetrate into other rooms or egress
routes. The basic information about smoke movement dynamics can be found in the Drysdale, Klote/Nelson and
Cooper references [21,22,23].
Page 101
92
6.5.1 Smoke production in the room of origin
Smoke production within the room of origin is essential for evaluation of egress from or through a fire partition.
Common situations may include egress from large assembly areas or egress through atria. Smoke production
depends on the convective portion of heat release rate at the time being evaluated and the smoke transport length
up to the ceiling. During transport, air is entrained and the amount of smoke increases. Common tools for this
evaluation are presented in NFPA 92B [2].
6.5.2 Smoke spread through orifices/cracks/large openings
Barriers rated or not will, with varying effectiveness prevent smoke from moving from one room to another.
This method is required for most buildings designed after prescriptive codes. The amount of smoke spread
depends on room fire temperature, which can be estimated by hand calculation tools, the crack sizes and the
normal planes in fire room and building. The amount of smoke penetrating the cracks can be calculated with the
orifice equation [7].
ρ∆
=P2
CAV
Where,
V Volumetric flow rate through opening (m3/s)
C Dimensionless flow coefficient (for cracks 0.6-0.7)
A Flow leakage area, m2
∆P Pressure difference across path
ρ Density gas in path
Page 102
93
The effectiveness of barriers to prevent smoke spread depends on the sizes of the holes and cracks. An open door
will cause enormous volumes of smoke penetrating into the corridor or into the staircase. It is therefore
appropriate to evaluate smoke movement both with doors opened and with doors closed, and to compare the
results with smoke movement in a sprinkler controlled fire.
6.5.3 External wind effects on smoke spread
Wind action is another feature in the movement of smoke. Tall and short buildings behave somewhat differently
in this regard. These pressures are caused by the movement of mass of air around and over the structure. The
velocity of these movements is the primary cause of the pressures on the building.
The effect of wind pressures and suctions modifies the natural air movement within a building. For example, the
negative pressure on the roof of a tall building can have an aspirating effect on a vertical shaft with openings at
the roof level. Horizontal pressures and suctions cause natural planes in buildings to move. Positive wind
pressure would tend to raise the natural plane, while negative pressure will lower it. The effects of wind are a
function of shape and size of the building and of surrounding objects. The exterior pressures on a building due to
wind are related to the wind velocity by the expression [7].
( )210w0wind UC
2
1P ρ=
Where,
Pwind Pressure in Pascal
Uw10 Wind velocity at 10 meter above ground level, m/s.
C Wind pressure coefficient
Page 103
94
The wind pressure coefficient, C, varies between -1 and 1, depending on the wind direction angle. At the most
exposed point on the windward side CF can be as high as 1, but on average a value of 0.7 can be used. On the
leeward side a value of -0.5 can be used. A flat roof has a typical value of -0.8 but can be as high as -2 [5,7,10].
Flow of gases from fire compartment to other parts of the building and to the opposite exterior wall or roof can
be calculated by assuming open windows in addition to the leakage areas. The orifice equation can be used.
6.6 MECHANICAL AND NATURAL SMOKE CONTROL SYSTEMS
Smoke control systems are designed to exhaust smoke or prevent smoke infiltration. The overall principles are
natural ventilation systems, mechanical exhaust systems and mechanical pressurization systems. These systems
are commonly used to increase available safe egress time or to protect areas of refugees (AOF). General
information about smoke control systems can be found in the SFPE Handbook and Fire Protection Handbook
[9,15].
Smoke production rate depends on both the ceiling (atria roof) height and the fire size. The design fire could
grow continuously or it could be limited by a suppression system or by insignificant availability of fuels. From
an initial analysis viewpoint, smoke contamination is based on a fire that continues to burn. From this result, the
effectiveness of smoke control measures can be recognized.
6.6.1 Ceiling vents
The mass flow through the openings in the roof would depend on the hot smoke layer temperature and depth.
Necessary roof ventilation area is (NFPA 204M) [3]:
Av = 0.012 Q3/5 (H-d)/d1/2
Page 104
95
where:
Av Ventilation area in m2
Q Heat release rate in kW
H Ceiling height in meter
d Depth of smoke layer in meter
Ceiling vents are commonly used methods for smoke control in atria and malls. The system includes vents for air
supply to the lower smoke free zone and veiling vents to exhaust the smoke and fire gases. Smoke control
systems in atria are used to obtain safe egress through the atria and to prevent flashover. Atria can be design as a
fire partition or not depending on the building size or whether the building is sprinklered or not [2,4,11].
6.6.2 Smoke ventilation shafts
Shafts can be used for smoke ventilation of rooms. The advantage of shafts is that pressure differences between
the ceiling and smoke layer increases due to elevation, and the suction effect becomes larger than with ordinary
ceiling vents. In addition, the amount of smoke production halts when smoke rises through the shaft. The
disadvantages are that the suction effect can plug a hole in the smoke layer and cause fresh air to be sucked up
into the shaft. Also long narrow shafts can resist the smoke flow [4].
6.6.3 Mechanical exhaust systems
Mechanical extractors are generally used where adverse pressure due to wind could seriously reduce the
efficiency of a natural convection venting system. The extractors can keep the fire room almost clean for smoke
or it can postpone smoke layer descending time and furthermore increase available evacuation/rescue time.
The volume of smoke exhausted should be equal to or larger than smoke generated by the design fire. Or, the
capacity should be enough to increase available evacuation/rescue time according to egress evaluation. The main
Page 105
96
problem with exhaust systems is a phenomenon called “Plugholing”. Plugholing is caused by the velocity of the
flow into a vent. The flow will cause a small reduction in pressure at the base of the layer of hot gases, and there
is a critical rate of extract through a vent above which air from beneath the layer of hot gases is drawn into the
vent. The onset of this phenomenon depends on a Freude number, Fc [7].
6.6.4 Pressurization systems
Systems using pressurization produced by mechanical fans are referred in NFPA 92A [1] and HO-3/2000 [4]. A
pressure difference across a barrier can prevent smoke from penetrating through gaps around doors. The high-
pressure side of the door can be either an area of refuge (AOR) or an egress route. The low-pressure side is
exposed to smoke from a fire. Airflow through the gaps around the doors and through construction cracks
prevents smoke infiltration to the high-pressure side.
6.6.5 HVAC systems for smoke ventilation (dilution)
Dilution can be used to maintain an acceptable smoke concentration in a compartment subject to smoke
infiltration from an adjacent space. This can be effective if the rate of smoke leakage is small compared to either
the total volume of the safeguarded space or the rate of purging air supplied to and removed from the space.
Dilution can also be beneficial to the fire department for removing smoke after a fire has been extinguished.
The efficiency of smoke dilution should not be over-valued. There is no theoretical or experimental evidence
that using a building’s heating, ventilation, and air conditioning system for smoke dilution will result in any
significant improvement in tenable conditions within the fire space. Thus, smoke-purging systems intended to
improve hazard conditions within a fire space or in spaces connected to room of origin by large openings shall
not be used [7].
Page 106
97
A simple analysis for smoke dilution after the fire is extinguished is presented. This correlation assumes a
uniform distribution of smoke in the compartment [12,21].
=
=
C
C
at
C
C
ta
0
0
ln1
ln1
where
C0 Initial concentration of containment.
C Concentration of containment at time t.
a Dilution rate of air changes per minute.
t Time after smoke stops entering space or time after smoke production has stopped.
6.6.6 Upstream smoke propagation
Systems to prevent upstream smoke propagation are longitudinal tunnel ventilation and pressurized staircases.
Buoyant gravity flow causes the leading edge of a hot smoke layer to propagate away from the fire source in a
corridor. Thomas (1970) [16] performed wind tunnel tests to measure the critical air velocity required to prevent
upstream smoke propagation. Thomas expression for critical air velocity is:
3/13/1
00
303.0
=
=
W
Q
WTC
gQU
Pcritical ρ
where,
Q Fire size in kW
W Width of corridor
Page 107
98
Other commonly used correlations which have been extracted from experimental results, are Hinkley (1970)
[17], Heselden (1978) [18] and Danziger et.al. (1982) [19].
The above correlation concentrate on the environment close to the fire, not incorporating buoyancy forces,
external wind and natural draft which occurs in tunnels. In general, to be able to control the direction of smoke
gases from fire in a tunnel, the ventilation system shall be designed to overcome the pressure rise from the fire
itself, buoyancy forces set up by the smoke gases, external wind and natural draft set up by temperature
differences between inside and outside the tunnel. A set of simple correlations for calculating critical ventilation
conditions for fires up to 20MW in inclined tunnels, has been developed by Opstad and Aune (1997) [13].
Tunnel ventilation is a complex system and must be designed with caution. Elevated temperatures decrease the
gas density and the effect of the tunnel jet fans. Fans that are located to close to the fire can cause turbulence and
initiate smoke to mix with the lower layer, or even blow air jet directly into the fire. The design and location of
activated fans are important. PIARK [6] includes design methods and strategies for the design of tunnel
ventilation systems.
Longitudinal ventilation can have a significant influence on fire growth and fire size. Carvel, Beard and Jowitt
(2001) [14] did a Bayesian probabilistic approach and found that an expert panel underestimated the influence of
air velocity onto fires.
6.6.7 Smoke control interaction with sprinkler spray
The use of heat and smoke vents in sprinklered buildings is a controversial subject. The interactive use of
automatic sprinkler and fire vents has been debated for decades, but there are still no practical solutions or
recommendations available. In order to improve the knowledge about the effects of combining these systems SP
Page 108
99
Fire Technology performed numerous tests and a literature survey to place together test results and test critics
during the latter decades [26]
Potential benefits of vents in sprinklered buildings are qualitatively the same as those in unsprinklered buildings;
namely, they can delay loss of visibility and maintain a longer period with tenable conditions for evacuation and
easier conditions for manual fire fighting. Potential drawbacks in sprinklered buildings are:
- Ventilation can increase the burning rate by providing unlimited supply of oxygen
- Sprinkler spray can cool of the hot layer and decrease its buoyancy
- Air movement can draw smoke into an egress segment in the path of the smoke exhaust
A fire test for industrial applications involving sprinklers and vents were conducted in Gent, Belgium (1990)
[27]. The tests were conducted with steady state and growing hexane pool fires. The fire size at sprinkler
actuation was as large as about 10 MW. The tests indicated that the vents caused a minor delay in sprinkler
actuation but the vents caused a significant reduction in the numbers of sprinklers opened. The roof vents also
allowed a clear area beneath the smoke layer, overcoming the tendency of the sprinkler spray to drive the smoke
layer downward.
The hexane test indicated that the sprinkler spray couldn’t suppress the fire. The velocity and temperature of the
upstream plume were high enough to overcome the water spray cooling. In a sprinkler suppression mode the
smoke will tend to move downwards and cause smoke logging as the fire size decreases. That means that smoke
logging occur when water application rate is large according to the fire size [28].
Page 109
100
6.6.8 Smoke control systems in areas of refuge
One proposed solution for providing safety for persons with mobility limitations is the concept of area of refuge
(AOR) where these people can "safely wait" until they can be assisted in leaving the building. This reference
presents information about the design of smoke control systems to prevent smoke infiltration into an AOR.
Pressure differences produced when windows break, both with and without wind, can be significant, and the
design of a smoke control system for an AOR needs to address these pressure differences. The reference
identifies the need for wind data specifically for the design of smoke control systems. The pressure fluctuations
due to opening and closing building doors during fire situations can also be significant, and the design of a
smoke control system for an AOR needs to address these fluctuations. An example of analysis incorporating the
pressure effects of broken windows, wind, and open doors illustrates the feasibility of designing smoke control
systems for areas of refuge [10]
6.6.9 Smoke control reliability
Smoke control reliability depends on the system that is used to obtain control. Passive barriers depend on the
probability of cracks, gaps or open doors, and wind direction. Electrical powered systems depend on the power
source and the reliability of electrical motors and other components that activates the system, and in addition the
cooperating doors and barriers are important for successful smoke control. Exhaust vents can be activated by a
signal from the fire alarm system or by fusible links. For all of them except those with fusible links, testing,
maintenance and control are important to maintain reliability.
6.7 SMOKE TOXICITY AND VISIBILITY ASPECTS
According to NS 3901 [3] the deterministic acceptance criterions for smoke tenability in buildings are given in
the standard's table 1. These tenability criterions are developed from several laboratory tests and sufficient for
most fire hazards. In special cases, where the fuel includes chemicals or additives that develops other toxic
gases, the effect of other toxic gases must also be evaluated [59].
Page 110
101
Table 6-1. Deterministic acceptance criterion for smoke toxicity [59]Radiant flux
Exposure < 6 secondsAccumulated radiant heat flux
10 kW/m2
60 kJ/m2 + the energy from 1 kW/m2
Gass temperature 60 8C
Fraction of gasesCOCO2
O2
Max 2000 ppmMax 5%Min 15%
Visibility at 2 meters elevationIn fire partitionIn egress path
Min 3 meterMin 10 meter
6.7.1 Test methods for measuring smoke production and toxicity
There are essentially two ways in which toxic hazards in fire can be assessed [24]:
1. From large-scale fire tests that include the measurements of the concentration/time profiles of the major
toxic gases, and existing knowledge of the toxic effects of these gases.
2. From battery or small-scale tests and mathematical models.
Of these, full-scale simulation and large-scale tests are most valuable because they enable the first two major
parameters (fire growth and products yield) to be measured directly. For the third parameter (toxicity), an
algorithm for calculating times to incapacitation and death for humans is presented in ISO 9122-5 [34].
Smoke production and toxicity in world scale tends to be costly and difficult. For regulatory hazard ranking, it is
more common to use battery or small-scale methods. Small-scale methods suffer from the difficulty that they are
several steps removed from a full-scale test. Typically the variable selected is the toxic potency denoted as LC50,
which is a measure of amount of the toxic products in a chamber that causes 50% probability of lethality. ISO
13344 [35] was the first normative international standard to address the issue of fire toxicity. This standard did
Page 111
102
not provide any information on suitable computation techniques for assessing the toxic fire hazards in real fire
situations.
ISO 13344 introduced the Fractional Effective Dose (FED). FED is an arithmetic, linear equation where the
toxic effects of various gases are assumed to be linear. The expression for the most common fire gases is:
20010003000380015050002NONOHBrHClHCNCO
FED +++++=
Where the gas concentrations is denoted in ppm. Note that the value for CO in this equation is 5000 ppm, while
the acceptance criterion is 2000 ppm. This is due to the higher concentration that is needed for the probability of
50% lethality. When FED is 1, the summarized toxicity is assumed to correspond to LC50.
The fraction of lethal gases (LC50 and FED) in full scale fire hazards is difficult to measure in bench scale and
comparison against full scale LC50 have indicated that the bench scale values were not sufficiently accurate [25].
Smoke specific optical density may also be measured in small scale tests using chambers [37,38] or Oxygen
Consumption Calirometer [36].
Full scale tests are standardized in the ISO 9705 room. Full scale test fires behave more similar to building fires
and the test results give better approximations. The ISO room is used to test wall coverings [39] and pipe
insulation [40]. The gases can be measured and the test reports usually includes values of CO and CO2
production vs. time. This information can be used to calculate the fraction of these toxic gases in the fire plume
and smoke layer. Särdquist [41] has collected information to an extensive database with test results for building
materials. This reference does also present conversion factors for smoke potential and specific extinction
coefficient, as well as CO conversion. Some of the tests were performed in the ISO room, but also a free burning
Page 112
103
furniture calorimeter and a free burning industry calorimeter were used. A similar database can also be found at
NIST (FASTdata) [30].
The EN 13823 [41] test procedure includes the SMOGRA index. This index is a measurement of smoke
production for products excluding flooring exposed to a thermal attack by a single burning item. This test is
developed in order to approve surface materials, and may be suitable to distinguish between different products
and to give first hand information. SMOGRA is not suitable for numerical calculations of fire hazards.
6.7.2 Fire room conditions in sprinklered buildings
A sprinkler controlled fire or early-suppressed fire has a tremendous influence on the room fire condition. In
non-sprinklered buildings the fire may drive to flashover and may become under-ventilated, causing huge
amounts of carbon monoxide to be produced, dramatically increase of temperature and high radiation levels.
With a proper and functional sprinkler system installed, these situations shall not appear.
During a large-scale test for toxicity in fires [31] they classified the toxicity into three categories.
Table 6-1. Fire toxicity dependence on fire development stage [31]Fire Rate of
growthCO2/CO Toxic hazard Time to
incapacitation
Escape time available
1. Smoldering/non-flaming: victim onroom of origin
Slow ~1 CO 0-1500 ppm low O215-21%, irritants smoke
Hours Ample if alerted
2. Flaming: victim inroom of origin
Rapid 1000decreasing towards50
CO 0-1%, CO2 0-10%,O2 10-21%, irritants,smoke heat
A fewminutes
A few minutes
3. Fully developed:(Postflashover) victimremote
Rapid < 10 CO 0-3%,. HCN 0-500ppm, irritants, smokeand possibly heat
< 1 minnear fire
Escape may beimpossible, or time veryrestricted. More time atremote locations
Page 113
104
In sprinklered buildings, the fire should stop early in category 2 (Flaming). Resulting in a far more tenable
environment for successful egress. Both American and Japanese tests with measurements of toxic gases in
residences and hospitals protected with fast response or residential sprinklers have concluded that the
environmental conditions may be relatively good [32,33].
6.7.3 Visibility estimates
According to NS 3901 [4] estimates of visibility can replace the gas toxicity assessments. Visibility in fire
hazards can be estimated from HRR, specific smoke extinction and air entrainment into the fire plume.
Mulholland [20] describes methods to evaluate smoke optical density and visibility. Correlation for air
entrainment can be found in NFPA 92B [2].
6.8 SOFTWARE FOR MODELING SMOKE MOVEMENT AND SMOKECONTROL
6.8.1 Zone models
The most common fire model, known as a zone model, generally uses two control volumes to describe a room,
an upper layer and a lower layer. In the room with the fire, additional control volumes for the fire plume or the
ceiling jet may be included to improve the accuracy of the prediction. Simple “room filling” models such as the
Available Safe Egress Time (ASET) model [43] run quickly on almost any computer, and provide good
estimates of a few parameters of interest for a fire in a single compartment. A special purpose model can provide
a single function. For example, COMPF2 [44] calculates post-flashover room temperatures and LAVENT [45]
includes the interaction of ceiling jets with fusible links in a room containing ceiling vents and draft curtains.
Very detailed models like the HARVARD 5 code [46] or FIRST [47] predict the burning behavior of multiple
items in a room, along with the time-dependent conditions therein.
Page 114
105
In addition to the single-room models mentioned above, there are a smaller number of multi-room models
which have been developed. These include the BRI transport model [48], the HARVARD 6 code [49], FAST
[42,50,51], CCFM [52] and the CFAST model [53].
6.8.2 Multizone modeling (Network model
A Multizone model uses one element per room and is used to predict conditions in spaces far removed from the
fire room, where temperatures are near ambient and layering does not occur. Multizone modeling refers to
analysis techniques that use a simplified, zonal representation of a building to study building airflows, pressure
differences, and contaminant transport. Each zone is assumed to have uniform temperature, pressure, and
contaminant concentrations. Zones typically represent individual rooms but can be entire levels depending on the
building layout and the goals of the modeling. Zones are connected through flow paths represented
mathematically by pressure-flow relationships. This reference describes CONTAMW, a multizone modeling tool
[54].
6.8.3 Field models (CFD)
The field model goes to the extreme, dividing the room into thousands or even hundreds of thousands of grid
points. Such models can predict the variation in conditions within the layers, but typically require far longer run
times than zone models. Thus, they are used when highly detailed calculations are essential. CFD models can
simulate smoke penetration through openings; exhaust vents and extractors, and pressurization systems. The
CFD model Fire Dynamic Simulator can also simulate sprinkler and smoke ventilation interaction [55].
6.9 SUMMARY
The design fire for smoke movement and smoke control evaluation is characterized with a time dependent fire
size. The smoke quantity is related to the fire size. Smoke production within the room of origin and smoke
Page 115
106
movement beyond the origin are important life safety evaluations. Smoke control systems are commonly used in
large spaces, atria, staircases and tunnels. The systems can be based on buoyancy forces and venting through
ceiling vents or shafts. Mechanical systems can be used to exhaust smoke from the fire room or pressurize other
rooms to prevent smoke spread. In sprinklered fire scenarios, the amount of smoke produced and the smoke
toxicity is only a fraction of the amount and concentrations to be found in unsprinklered fire scenarios. Sprinkler
spray and smoke ventilation may interact on each other in several ways. Sprinkler and smoke interaction and
smoke movement can be simulated with field models. Smoke filling rate and smoke spread can be evaluated
with zone models, and multizone models can be used to evaluate smoke conditions in spaces far beyond the fire
source.
6.10 REFERENCES
6.10.1 Design fire information
1 NFPA 92A: Recommended Practice for Smoke-Control Systems, National Fire Protection Association
(1996)
2 NFPA 92B: Guide for Smoke Management Systems in Malls, Atria and Large Spaces National Fire
Protection Association (1995)
3 NFPA 204M: Guide for Smoke and Heat Venting, National Fire Protection Association (1991)
4 HO-3/2000: Rø ykventilasjon, National Office of Building Technology and Administration (Norway)
(2000)
5 Meland, Skå ret and Jensen, Rø ykkontroll - Personsikkerhet ved brann i bygninger, SINTEF.
6 PIARK Committee on Road Tunnels; Fire and Smoke Control in Road Tunnels (1999).
Page 116
107
6.10.2 Smoke control system performance evaluation
1 NFPA 92A: Recommended Practice for Smoke-Control Systems, National Fire Protection Association
(1996)
2 NFPA 92B: Guide for Smoke Management Systems in Malls, Atria and Large Spaces National Fire
Protection Association (1995)
3 NFPA 204M: Guide for Smoke and Heat Venting, , National Fire Protection Association (1991)
4 HO-3/2000: Rø ykventilasjon, National Office of Building Technology and Administration (Norway)
(2000)
5 Meland, Skå ret and Jensen, Rø ykkontroll - Personsikkerhet ved brann i bygninger, SINTEF.
6 PIARK Committee on Road Tunnels; Fire and Smoke Control in Road Tunnels (1999).
7 Hinkley; Smoke and Heat Venting, The SFPE Handbook chapter 3-9.
8 Walton and Thomas; Estimating Temperatures in Compartment Fires, The SFPE Handbook chapter 3-6.
9 Klote; Smoke Control, The SFPE Handbook chapter 4-12.
10 Klote; Design of Smoke Control Systems for Areas of Refuge, National Institute of Standards and
Technology (1993).
11 Milke; Smoke Management in Covered Malls and Atria, The SFPE Handbook chapter 4-13
12 Klote; Moving Systems and Fire Protection, National Institute of Standards and Technology (1993)
13 Opstad and Aune; Fire Emergency Ventilation Capacity for Road Tunnels with Considerable Slope,
SINTEF Energy (1997).
14 28. Carvel, Beard and Jowitt; The Influence of Longitudinal Ventilation Systems on Fires in Tunnels
(2001).
15 Heskestad; Venting Practices, NFPA Handbook chapter 7-7.
16 Thomas; Movement of Smoke in Horizontal Corridors Against an Air Flow, The Institute of Fire
Engineers Quarterly, 45 (1970)
17 Hinkley; The Flow of Hot Gases Along an Enclosed Shopping Mall: A Tentative Theory, Fire Research
Page 117
108
Note No 807, Fire Research Station.
18 Heselden; Studies of Fire and Smoke Behaviour Relevant to Tunnels, Building Research Establishment
Current Paper CP66/78 (1978)
19 Danziger and Kennedy; Longitudinal Ventilation Analysis for the Glenwood Canyon Tunnels, 4th
Symposium on the Aerodynamics and Ventilation of Vehicle Tunnels (1982)
6.10.3 General smoke movement and toxicity theory
15 Heskestad; Venting Practices, NFPA Handbook chapter 7-7.
16 Thomas; Movement of Smoke in Horizontal Corridors Against an Air Flow, The Institute of Fire
Engineers Quarterly, 45 (1970)
17 Hinkley; The Flow of Hot Gases Along an Enclosed Shopping Mall: A Tentative Theory, Fire Research
Note No 807, Fire Research Station.
18 Heselden; Studies of Fire and Smoke Behaviour Relevant to Tunnels, Building Research Establishment
Current Paper CP66/78 (1978)
19 Danziger and Kennedy; Longitudinal Ventilation Analysis for the Glenwood Canyon Tunnels, 4th
Symposium on the Aerodynamics and Ventilation of Vehicle Tunnels (1982)
20 Mulholland; Smoke Production and Properties, The SFPE Handbook chapter 2-15.
21 Klote and Nelson; Smoke Movement in Buildings, Fire Protection Handbook 18th edition, section 7,
chapter 6
22 Drysdale; An Introduction to Fire Dynamics, chapter 11 The Production and Movement of Smoke
23 Cooper; Compartment Fire Generated Environment and Smoke Filling, The SFPE Handbook chapter 3-
10
24 Purser; Toxicity Assessment of Combustion Products, The SFPE Handbook chapter 2-8
25 Babrauskas; Fire safety Improvements in the Combustion Toxicity Area: Is there a role for LC50 tests?
pp 213-224 in Flame Retardants, Interscience Communications, London (1998)
Page 118
109
26 Ingason and Arvidson; Samtidig Användning av Sprinkler och brandgassventilation, SP Sveriges
Provnings och Forskningsinstitute (2001)
6.10.4 Tests, reports or databases concerning smoke movement or toxicity
26 Ingason and Arvidson; Samtidig Användning av Sprinkler och brandgassventilation, SP Sveriges
Provnings och Forskningsinstitute (2001)
27 The Gent Fire Test, Colt Int. Ltd (1990).
28 Ingason; Samverkan mellan Sprinkler och Brandventilation, Sveriges Provnings- och Forskingsinstitut
(2001).
29 Särdqvist; Initial Fires, Lund University, Sweden (1993)
30 National Institute of Fire and Technology; FASTdata, NIST Standard Reference Database Number 75,
January 1999 Release
31 Purser; Toxicity Assessment of Combustion Products, The SFPE Handbook 2nd edition.
32 Notarianni; Measurements of Room Conditions and Response of Sprinklers and Smoke Detectors During
A Simulated Two Bed Hospital Room Fire, National Institute of Standards and Technology, July 1993.
33 Sekizawa, Takemoto, Kozeki, Yanai, Suzuki; Experimental Study of Fire Hazard of Residential Fires
before and After Sprinkler Activation, Fire Research Institute - Fire Defense Agency, Tokyo Japan 1997
(English translation by Beal, NIST).
6.10.5 Test methods for smoke toxicity
34 ISO 9122-5, Toxicity Testing of Fire Effluents, International Organization for Standardization, Geneva
35 ISO 13344: Determination of Lethal Toxic Potency of Fire Effluents, International Organization for
Standardization, Geneva
36 ASTME 1354 - 9: Standard Test Methods for Heat and Visible Smoke Release Rates for Materials and
Page 119
110
Products Using and Oxygen Consumption Calorimeter.
37 NT FIRE 012
38 ASTM E662, Standard Test Methods for Specific Optical Density of Smoke Generated by Solid
Materials (1993)
39 ISO 9705:1993 (E) Fire tests – Full-scale room test for surface products, International Organization for
Standardization, Geneva
40 Pipe Insulation: Fire Spread and Smoke production - Full Scale test NT FIRE 036 Nordtest, Espoo (1988)
41 EN 13823 (SBI):1999 E Reaction to fire tests for building products – Building products excluding
floorings – exposed to thermal attack by a single burning item (SBI).
6.10.6 Computer programs
42 Jones, W. W. and Peacock, R. D., Refinement and Experimental Verification of a Model for Fire Growth
and Smoke Transport, Proceedings of the 2nd International Symposium on Fire Safety Science, Tokyo
(1989)
43 Cooper, L.Y., “A Mathematical Model for Estimating Available Safe Egress Time in Fires,” Fire and
Materials. 1982, 6(4), 135-144.
44 Babrauskas, V., “COMPF2-A Program for Calculating Post-Flashover Fire Temperatures,” Natl.Bur.
Stand. (U.S.) 1979, Tech. Note 991, 76 p.
45 Davis, W. D. and Cooper, L. Y., “Computer Model for Estimating the Response of Sprinkler Links to
Compartment Fires With Draft Curtains and Fusible Link-Actuated Ceiling Vents,” Fire Technology
1991, 27 (2), 113-127.
46 Mitler, H.E. and Emmons, H.W., “Documentation for CFCV, the Fifth Harvard Computer Fire Code,”
Nat. Bur. Stand. (U.S.) 1981, NBSGCR 81-344, 187 p.
47 Mitler, H. E. and Rockett, J., “A User's Guide for FIRST, a Comprehensive Single Room Fire Model,”
Natl. Bur. Stand. (U. S.) 1987, NBSIR 87-3595.
Page 120
111
48 Tanaka, T., “A Model of Multiroom Fire Spread,” Nat. Bur. Stand. (U.S.) 1983, NBSIR 83-2718, 175 p
49 Gahm, J. B., “Computer Fire Code VI, Volume I,” Nat. Bur. Stand. (U.S.) 1983, NBS GCR 83-451, 116
p.
50 Jones, W. W., A Multicompartment Model for the Spread of Fire, Smoke and Toxic Gases, Fire Safety
Journal 9, 55 (1985)
51 Jones, W. W. and Peacock, R. D., “Technical Reference Guide for FAST Version 18” Natl. Inst. Stand.
Techol. Tech. Note 1262 (1989).
52 Forney, G. P. and Cooper, L. Y., The Consolidated Compartment Fire Model (CCFM) Computer
Application CCFM.VENTS - Part II: Software Reference Guide, Nat. Inst. Stand. Technol., NISTIR 90-
4343 (1990).
53 Jones, W. W. and Forney, G. P. “A Programmer's Reference Manual for CFAST, the Unified Model of
Fire Growth and Smoke Transport,” Natl. Inst. Stand. Technol. 1990, Tech. Note 1283, 104 p.
54 Dols; Tool for Modeling Airflow and Contaminant Transport,
55 McGrattan, Baum, Rehm, Hamins, Forney, Floyd, Hostikka: Fire Dynamics Simulator (Version 2)
– Technical Reference Guide. NISTIR 6783. National Institute of Standards and Technology. November
2001
6.10.7 Other references that don't fit into the above categories
56 National Office of Building Technology and Administration (Norway): TEK-97, Regulations concerning
requirements for construction works and products for construction works, 22 January 1997 No. 33
Technical Regulations under the Planning and Building Act 1997.
57 National Office of Building Technology and Administration (Norway): REN, Guidance to Regulations
concerning requirements for construction works and products for construction works, 2nd edition, April
1997.
58 National Building Standardization Council (Norway): NS3901, Risk analysis of fire in buildings and civil
Page 121
112
engineering works (1998).
59 National Building Standardization Council: Guidance to NS3901, Guidance to risk analysis of fire in
buildings (1998).
60 National Building Standardization Council: Guidance to NS3901, Guidance to risk analysis of road
tunnels.
Page 122
113
7 STRUCTURAL FRAME
The framework is designed to bear its own weight, wind and snow loads, and live loads. In fire scenarios, the
framework shall be designed to resist the environment caused by fire loads. This chapter introduces the design
fire for structural analysis and references for evaluating the performance of structural frames made of wood,
steel or concrete.
7.1 OBJECTIVES
The objectives of a structural frame evaluation are to predict the performance of the construction material during
a fire scenario. Buildings always have a certain degree of fire resistance, even though the building constructions
may never have been classified. Newer buildings designed in accordance with modern building codes are
classified into fire classes and thereby the frames are designed with the code specified fire rating. Evaluation of
building construction works involves an evaluation of a design fire, identification of the building construction
properties in fire scenarios, and evaluation of construction resistance in a predicted fire scenario.
According to the code requirements [1], the goal of an evaluation can be three fold. The requirements depend on
the fire classes and hazard classes. One of these requirements must be satisfied for every load bearing systems in
a building:
1. Stability and load bearing for egress
2. Stability and load bearing for egress and rescue operations
3. Stability and load bearing through a complete fire development
Both egress and rescue operations are time dependent. Performance based code requirements does implicits
require a translation of standard fire exposure into a fire scenario, and, where the structures are required to resist
Page 123
114
a complete fire scenario, the structural resistance can be evaluated from a design fire, often described using
statistical fire load.
7.2 CODES, STANDARDS AND PUBLICATIONS FOR EVALUATING FIRERESISTANCE
Code requirements (TEK) [1] for construction works depend on the fire class and the hazard classification the
building has been placed into. Construction works in fire classes 1 and 2 shall maintain the stability and load-
bearing capacity for at least the time required to escape and rescue persons being in and on the construction
works. For construction works in fire class 1 intended for activity in hazard classes 1 and 2 (usually garage and
office buildings) there is no requirement for stability and load-bearing capacity except for the provisions
ensuring personal safety during the time of escape. For larger buildings, where the consequences of fires are
serious or very serious, the bearing system shall be made so as to let the construction works maintain stability
and load-bearing capacity through a complete fire development. But, load bearing systems for one story only (or
the roof) shall maintain their stability and load-bearing capacity during the time necessary for escape and rescue
of persons in and on the construction works [1].
A performance based evaluation according to NS 3901 [2] can be performed by using the design fire temperature
development in Eurocode 1 [4]. This is an evaluation based on fire load and ventilation openings. The
temperature course in this evaluation may be different from the time-temperature of a standard fire test, but it is
possible to recalculate and compare the two different temperature courses, so that the amount of energy over
time can be adjusted. Standard heat transfer equations can be used [5,6], but caution shall be taken to probable
changes in material properties at elevated temperatures.
Fire loads shall be based on statistics. The loads can also be found in the Eurocode 1 standard or international
publications [7] NBI- product sheet [8].
Page 124
115
The fire rating of structures can be found in Norwegian standards[12,18] or the Eurocodes [9,10,11]. The
reduced utility factor is due to the fact that design load is different in case of fire than in other situations. For
example wind is excluded and snow has only a factor of 0.8 [NS 3478], and the live load has a safety factor of
1.0. Design criteria for fire ratings and methods to calculate fire ratings are presented in both Eurocodes and
Norwegian standard. And in addition several international publications for analyzing the fire rating of structures
are available. These references are presented in table 7-1.
The fire rating of reinforced concrete beams and girders is usually dependent on the web dimension and
reinforcement covering. The tabular design criteria for achieving different fire ratings for concrete structures
according to Eurocode 2 [9], presupposes a 70% degree of utility. Older structures may not be valid for the
tabulated design criteria in these standards. In the case of older structures, the fire resistance may be evaluated
with the Fleishmann reference [13].
The Eurocode 3 [10] reference includes methods for calculating fire resistance for unprotected and protected
steel. The calculation methods are numerically based on standard fire temperature exposure. Milke [15]
discusses several other methods for protection and mathematical methods for prediction of fire rating.
Wood loses fire resistance as the wood decomposes and chars. One part is the calculation charring velocity. The
second part is the calculation of remaining required cross sectional area required to bear the structural- and live
load. Methods for calculating load bearing capacity can be found in NS 3470 [18]. The load bearing capacity for
vertical wood structures are dependent on the cross sectional area and length. For horizontal wood structures, the
wood members strength is related to the cross sectional area times the height of the member. According to
Eurocode 5 [11] a 60% degree of utility can be assumed.
Page 125
116
Table 7-1. References for evaluating fire resistance of structures
Construction Eurocode Norwegian standard Publications and literature
Reinforced concrete 9 12 13,14
Steel 10 14,15
Wood 11 18 14,16,17
7.3 DESIGN FIRE
In general, the design fire for structural frames are characterized by time and temperature. These factors are then
dependent on several other factors such as room size, ventilation, fire load, and thermal properties of the
bounding surfaces. The time requirement can be a matter of necessary time to egress described in chapter 9 or
time for rescue operations evaluated in chapter 8. Or, the time may be a matter of the fire endurance described by
the total heat load, combined with the ventilation openings.
Except for extremely large spaces or special constructions like indoor football halls and tunnels, the temperature
course is usually characterized with a uniform temperature distribution after flashover. The factors for describing
this temperature are ventilation openings, heat load, compartment geometry and wall insulation. The temperature
course can be developed based on equations in Eurocode 1 [4].
In structures where the heat load is localized, the temperature is dependent on the fire size and the flame length
relative to the construction geometry, ventilation and insulation. This design fire may be evaluated from the fire-
spread evaluation (chapter 1).
Page 126
117
7.4 CONSTRUCTION MATERIAL PROPERTIES
7.4.1 Concrete
Concrete is able to resist heavy loads when the load only causes compression of the member, but it has to be
reinforced to resist tensile strength. Therefore, steel reinforcement is placed into the members and slabs to
achieve sufficient strength. High performance concrete (HPC) can be produced for special purposes by adding
special additives and water reducing mixtures. HPC can have a compressive strength over 100 MPa. According
to NS 3473 concrete is classified by its compressive strength. Usually conventional concrete C35 (compressive
cube strength of 35 MPa) is used in buildings and C45 where higher performance is required.
Concrete construction systems appear in different configurations depending on the desired performance. A
standard office building may be designed with flat slabs supported on steel beams and columns. Large
warehouses may need to be designed with a heavy live load on longer spans, and ribbed slabs may be preferred.
Concrete systems may be pre fabricated, pre-stressed or poured in place. The slabs may be continuously or
simply supported, one-way or two ways. Their properties in fire actions can vary substantially.
The mechanical properties of concrete in general are adversely affected by thermal exposure. The main failure
mode is that heat diffuses into the concrete and causes a temperature rise of the reinforcement. When the steel
temperature reaches temperature around 550-6008C it looses its tensile strength and causes failures. The
exposures are largest for systems with the reinforcement located near the edges. Columns and ribbed slabs are
therefore more vulnerable to fires than flat poured in place walls and decks.
Thermal expansion of concrete is similar to that of steel for temperatures up to about 5408C. Thermal expansion
of a concrete floor slab heated form below can cause large thermal thrust forces to be exerted on surrounding
structures and the lateral movement may cause structural collapse. If no expansion is allowed, the thermal trust
Page 127
118
force would be very high, which could cause compression failure of the concrete. The thermal expansion
depends on the types of aggregate used in the concrete. Sanded expanded shale aggregate expands less than
siliceous aggregate concrete. At 6008C the concrete may expand up to 1%. Most fire tests of floor slabs are
conducted with the specimen mounted within a restraining frame, which restricts the thermal expansion. The
amount of restraining force provide by the frame varies from laboratory to laboratory [19].
Concrete does also lose compressive strength due to elevated temperatures. Though, this is strongly dependent
on the aggregate. Carbonated concrete maintains its strength almost unaffected up to 6508C, but siliceous
aggregate concrete has lost about 50% of its strength at the same temperature [19].
Another failure mode is explosive spalling. Explosive spalling is basically due to the evaporated forces of water
and thermal stresses within the material. A test conducted at NIST [20] proved that explosive spalling is
primarily caused by internal pore pressure due to evaporated water. Thermal stresses might have a secondary
role in this failure. The pore pressure is relative to the permeability within the concrete. The permeability is
again a function of the cement to water ratio. This indicates that high performance concrete is more subjected to
spalling than conventional concrete.
Eurocode 2 [9] gives instructions in a schematic way of how to estimate the risk of spalling based on the web
dimension and the compression stress. This may be an oversimplification. In a research performed by Bengtsson
[21], two simply supported concrete beams with haunched I-sections were evaluated when exposed to fire in
full-scale furnace tests. That paper indicates that the factors that increase the risk of explosive spalling are:
- High moisture content in the concrete
- Compressive stress due to external load or pre-stressing
- Fast temperature rise
- Significant dissymmetric temperature distribution
- Cross sections with slim section parts
Page 128
119
- High reinforcement densities
- Little permeability
7.4.2 Steel
Steel is the major constructional material in industrial buildings. It's strength, ductility, consistency and
availability makes it unique for structural framework. However, it is significantly weakened at fire temperatures.
Unprotected steel usually can only achieve a fire rating of 10-20 minutes, depending on the ratio of exposed
surfaces relative to the steel volume to absorb the heat. Steel columns immersed in flames can fail after only a
few minutes with intensive fire exposure.
The critical temperature of steel members depends on the degree of utility. The critical temperature can be found
in tables [10], and it is usually around 5508C. At this temperature the steel has lost about 60% of its yield
strength [15]. It is therefore necessary to protect the steel with insulation.
As with concrete members, thermal expansion of steel can also cause structural collapse due to trust forces onto
surrounding structures. At 5408C steel expands about 0.8% [24]. A span over 30 meters can expand about 25 cm
before it looses its strength.
Steel columns that are not provided with the desired level of fire protection, may, theoretically be protected with
water spray. Water spray will develop a thin film surrounding the column/beam and prevent heat to conduct into
the material [26]. The required water flux is:
))100(( 0
//////
TcL
qqm
pvW
rcW −+
+=
ρ
Page 129
120
Where,
mw is the required water spray density per unit exposed steel surface area (m3/m2.s)
qc is the convective heat flux to steel surface (kW/m2)
qr is the radiant heat flux to steel surface (kW/m2)
Lv is the heat of vaporization of water (kJ/kg)
T0 is the initial temperature of water prior to heating (8C)
This theory is based on the critical assumptions that the water spray can be applied in a manner that will allow it
to absorb the entire heat flux at the surface. This is extremely difficult, if not impossible, because:
- Gas or wind velocities dues to the buoyancy of the fire may prevent the spray from reaching the surface.
- The water may rebound or drip of rather than cover the steel with a film.
7.4.3 Wood
When wood is exposed to high temperatures it decomposes and chars. The rate of decomposition depends on the
chemical composition of natural polymers, density and moisture content. Inorganic impurities like salt will also
have a significant influence on the burning behavior. As wood burns it develops a protective char layer that
prevents heat flux from penetrating into the unburned solid. But, the decomposition rate will increase with higher
exposures, which is the case in standard fire testing. In the standards the charring rate is assumed to be a
constant depending only on the density of the timber. It ranges from 0.5 mm/min for solid or glued hardwood
with a characteristic density above 450 kg/m3 and 0.8 mm/min for wood with a characteristic density below 290
kg/m3 [11,12].
Timber structures with insufficient density can be protected with gypsum, mineral insulation, asphalt boards,
plywood or hardboard to achieve the required fire resistance rating [11,16,17].
Page 130
121
7.5 COMPUTER MODELING OF STRUCTURAL FIRE RESISTANCE FORCONCRETE MEMBERS
The most important problem with regards to the use of a theoretical approach is that it requires access to a good
database on material properties under elevated temperatures. A knowledge of the thermal and mechanical
properties as a function of temperature is critical to the accuracy of the calculation model.
Computer programs have been developed for the purpose of numerical simulation of temperature gradients in
structural members. For example, FIRES-T3 and TASEF-2 are two computer programs for calculating heat
transfer from fires to structures [22,23]. Both rely on the finite element technique, one in two dimensions
(TASEF-2), the other in three dimensions (FIRES-T3). An even simpler model is HSLAB. This model uses
numerical methods to analyze linear heat transfer into material with up to ten different layers [24]
Utilizing the information produced by the heat transmission analysis and that contained in available databases on
material properties, a designer can assemble a picture of the strength and deformation characteristics of a
structural member at any given stage of the heat exposure. The stress, stability and deformation analyses
normally require, as a first step, the use of a finite element program to define the continuum in terms of smaller,
interdependent elements (particularly if the geometry of the structural member is not symmetrical) and account
for the non-uniform temperature distribution within the member. For each element, the incremental strain or
deformation caused by the increase in temperature is calculated, and a new stress level is obtained with the help
of the stress-strain relationship applicable for the temperature in question. Finally, the usual structural mechanics
theory can be used to calculate the residual load, shear or moment capacity of the member and compare it with
the anticipated applied load (shear forces or moments) to determine whether or not failure is imminent [25]
Page 131
122
7.6 REFERENCES
7.6.1 General codes and standards references
1 National Office of Building Technology and Administration (Norway): TEK-97, Regulations concerning
requirements for construction works and products for construction works, 22 January 1997 No. 33
Technical Regulations under the Planning and Building Act 1997.
2 National Office of Building Technology and Administration (Norway): REN, Guidance to Regulations
concerning requirements for construction works and products for construction works, 2nd edition, April
1997.
3 National Building Standardization Council (Norway): NS3901, Risk analysis of fire in buildings and civil
engineering works (1998).
7.6.2 Fire loads, fire development references and heat transfer - publications and standards
4 Eurocode 1 - Basis of design and actions on structures - Part 2-2: Actions on Structures Exposed to Fire
5 Atreya, Convective heat transfer, SFPE handbook 1-3.
6 Tien, Lee, Stetton; Radiation Heat Transfer, Society of Fire Protection Engineers, The SFPE Handbook,
2nd edition, chapter 1-4.
7 Fire Safety Journal vol 10 no 2. pp 101-118 (1986).
8 NBI.520.333 Brannbelastning i bygninger - beregninger og statiske verdier.
7.6.3 Methods to determine the fire resistance of building constructions
9 Eurocode 2: Design of Concrete Structures - Part 1-2: General rules - Structural fire design, European
Committee for Standardization, Brussels.
Page 132
123
10 Eurocode 3: Design of composite steel and concrete structures Structures - Part 1-2: General rules -
Structural fire design, European Committee for Standardization, Brussels.
11 Eurocode 5: Design of Timber Structures - Part 1-2: General rules - Structural fire design, European
Committee for Standardization, Brussels.
12 NS 3473: Prosjektering av betongkonstruksjoner - Beregnings og konstruksjonsregler, Norges
Standardiseringsforbund (1998).
13 Fleishmann; Analytical Methods for Determining Fire Resistance of Concrete Members, SFPE Handbook
chapter 4-10
14 NBI.520.323 [Brannmotstand for bjelker og sø yler]
15 Milke; Analytical Methods for Determining Fire Resistance of Steel Members, SFPE Handbook chapter
4-9.
16 Brandsäkra trähus, Nordic Wood, Trätek.
17 White; Analytical Methods for Determining Fire Resistance of Wood Members, SFPE handbook chapter
4-11.
18 NS 3470: Prosjektering av trekonstruksjoner - Beregnings og konstruksjonsregler - Del 1: Almenne
Regler.
7.6.4 Concrete properties in fires
19 Fleishmann; Analytical Methods for Determining Fire Resistance of Concrete Members, SFPE Handbook
chapter 4-10
20 Phan, Lawson and Davis: Effects of elevated temperature exposure on heating characteristics, spalling,
and residual properties of high performance concrete, National Institute of Standards and Technology,
Gaithersburg, USA (2001).
2. Bengtsson; Brandpå verkade betongbalkar med slanka tvärsnitt, Sveriges Provnings- och
Forskningsinstitutt, SP rapport 1997:35.
Page 133
124
7.6.5 Computer programs for fire resistance modeling
22 Iding, R., B. Bresler and Z. Nizamuddin, 1977. FIRES-T3 - A computer program for the fire response of
structures - thermal, University of California, Berkeley, Report No. UCB FRG 77-15.
23 Wickstrom, U., 1979. TASEF-2, A computer program for temperature analysis of structures exposed to
fire, Lund Institute of Technology, Sweden, Report No. 79-2
24 Eker and Vlachos; HSLAB, Lund (1991)
25 Gosselin; Structural Fire Protection - Predictive Methods, National Research Council Canada (1987)
7.6.6 Steel protected by sprinklers
26 Lev and Strachan; A Study of Cooling Water Requirements for the Protection of Metal Surfaces Against
Thermal Radiation, Fire Technology, pp 213 - 229, August 1989.
Page 134
125
8 FIRE BRIGADE INTERVENTION
The roles of today's public fire department are at least twofold. The departments are divided into two major
services; fire prevention and fire emergency action. The first category includes fire prevention education,
existing building inspections, building plans review and technical assistance to the municipal building
authorities. While this category is new and developing, the other category, fire emergency action, is old and
traditional. However, new techniques for manual fire suppression are continuously developing, and fire fighter's
knowledge about fire dynamics is increasing. Although, the traditional fire brigade is well established and
acknowledged in most communities, their capabilities are usually over estimated. The probability of successful
fire suppression depends much more on the building design and building accessibility than for example the travel
time. This chapter points out the major factors that should be considered in evaluating fire brigade efforts at the
fire site.
Detection and initial action is the first stage of this evaluation, and is referred to in chapter 5.
8.1 OBJECTIVES
Evaluation of fire brigade suppression can be divided into several steps from fire detection to suppression or
controlled burn out, whenever the uncontrolled fire becomes controlled. Fire suppression depends on whether the
on ground-operating commander decides to initiate an offensive or defensive tactic to respectively attack or
control the fire. The commander's decision will depend on factors such as fire size, his crew, the equipment and
the number of fire fighters to operate the equipments and the vehicles.
Page 135
126
8.2 THE BUILDING CODE
The Norwegian code [1] includes a short paragraph about arrangements for fire brigade intervention. The code
states that: "All construction works shall be so located and designed that personnel for fire rescue and extinction,
with the appropriate equipment, have a feasible access to and inside the construction works for rescue and fire
fighting operations". The prescriptive solution to the code requirements includes requirements for the access
road, grounds designed for operating the ladder vehicle.
The other statement in the code is that: "Construction works shall be so arranged that a fire can easily be located
and fought". This statement is followed up with REN's [2] requirements to availability to attics, shafts and
cavities. And, implicit a requirement of functional fire partitions needed to limit the fire size.
8.3 FIRE SERVICES
Most fire and rescue activities are organized around a system of decentralized fire stations so that personnel and
equipment can respond quickly and effectively to emergency incidents. This organization may be staffed by
professional, part-time or volunteer personnel and may reflect a variety of characteristics derived from local
traditions, needs and structure. The Paulsgrove [10] reference provides an overview of the elements involved in
the organization, administration, management and operation of a fire department.
8.4 CRITICAL FIRE AND BUILDING CHARACTERISTICS FOR MANUALSUPPRESSION
A fire can be measured in number of rooms involved, fire volume or heat release rate. A critical fire is a
measurement of the severity of the fire that would cause the incident commander to choose a defensive tactic
instead of an offensive tactic. This is an extremely important decision, because it is a choice that influence on
life safety to the fire fighters. A deliberated portion of risk aversion in his judgment should be included. The
evaluated critical fire should therefore be conservative. The fire can be characterized by:
Page 136
127
- Fire size in mega watts
- Fire area
- Toxic products
- Explosions flashover, backdraft and smoke gas explosion
- Visibility
- Building characteristics
Fire size and fire area influence the amount of water application needed to extinguish the fire. Water demand
rate for suppression with fire hoses can be compared to water application rate for sprinkler suppression.
Särdqvist [3] made theoretical approaches for defendable fire sizes, relative to water application rate and droplet
sizes, and made a series of test. Some of his results are referred in table 8-1.
Table 8-1. Heat absorption capacity for different nozzles
Equipment Water flow rate (kg/s) Efficiency factor Heat absorption capacity(MW)
Standard nozzle (7 mm) 1,3 0,4 1,4
Standard nozzle (14 mm) 4.5 0,4 5,0
Standard nozzle (22 mm) 9,2 0,3 7,2
Large capacity nozzle 16,7 0,3 13
Monitoring nozzle 40 0,2 21
Fire sizes in megawatts or fire area are usually of major interest for outdoor fires or where fires can be
suppressed without penetrating the building. But, usually a fast manual suppression effort will require a fast and
efficient inside building fire attack. The likelihood of successful fire suppression depends on many factors. One
of them is the temperature. Fires that have developed to flashover can cause extremely high temperature also in
rooms beyond the room of origin. In some cases the fire fighters can use their hoses to cool down the
Page 137
128
surroundings as they are moving towards the fire origin. In larger spaces where a hot smoke layer have been
created, the fire fighters may not be able to cool down the temperature before the fire is extinguished. Room fire
temperature is referred in chapter 2 and a critical temperature for fire fighting can be evaluated against
performance requirements for fire fighters clothing. According to NFPA 1971 [4] the clothes shall resist
temperatures at 2608C for protective garment, textiles and hardware and a radiated heat of 10 kW/m2 for helmets.
Heating can also cause other incidents in the fire room. Pressurized gas, combustible or not can explode due to
increase in pressure. These incidents may be a significant problem where bottles are not stored properly in
appropriate rooms and/or equipped with safety overpressure relief valves.
Explosions can also take place without pressurized gas. Underventilated fires can produce unburned gases, and
over time the concentration of unburned gases accumulates in the room of origin or in other rooms. When the
fire fighters open the door, fresh air will mix with the gases and a partly premixed combustion occurs. This
phenomena is called backdraft [5].
In special situations it may be possible for the fire gases to mix well with air before the ignition takes place. This
can happen in spaces not far from the fire compartment and consequently an enormous pressure may be built up
if the gases are ignited [5].
Industrial buildings or warehouses may contain pesticides, flammable liquids, flammable gases, explosives,
oxidizers, nuclear materials etc. The fire behavior in buildings containing such hazardous materials can cause
enourmous problems for fire fighting efforts. Hazardous materials shall be classified and special response
strategy, tactics and protective equipment shall be preplanned. Wright describes how to manage the response to
hazardous material incidents [6].
Page 138
129
Evaluation of building construction is discussed in chapter 7. Fire resistance and construction classification
influence on the safety for fire fighters inside the building. Brannigan presents the highlights of the problems that
building presents to suppression forces [7].
8.5 FIRE BRIGADE TIMELINE PREDICTION
One major goal of fire brigade suppression evaluation is to predict and construct a timeline. The first and often
critical factor, is early detection. A fire that is not detected will not be notified to the fire department. Buildings
without a fire alarm system will only occasionally be notified before the flames are visible from the outside.
These fires are already fully developed within the fire origin and fire spread is more dependent on the barriers
than the fire brigade.
A timeline can be a tabular description of time dependent events during the fire. The following subchapters
include information and references to construct a fire brigade intervention timeline. The first part of the timeline
is detection and fire brigade notification. This part is described in chapter 4. For more information about timeline
construction, the reader is encouraged to read the Fitzgerald reference [8],
Time to fire brigade arrival may be important or it may not be important at all. Särdqvist [9] performed a study
of fires in non-residential fires London in the period 1994-1997. Among several other conclusions he stated that:
- No support was obtained for the hypothesis that the time from ignition to when the fire brigade
intervened is correlated with the fire area.
- At half of the fires, the final area of fire spread was equal to the area at discovery, and at three-quarters
of the fires, the final area of fire was equal to the area when the fire brigade arrived.
Page 139
130
8.5.1 Alarm processing time
The alarm processing time is the time between the receiving of the alarm and alerting the responding fire
companies. This process will take only about 30 seconds to 1 minute, but it is important to consider the
reliability of correct alarm receiving. The fire department must understand the correct address. Consideration
shall be taken to the person who is notifying the fire department. He may be stressed or in other ways not able to
notify the fire department properly.
8.5.2 Turn out time
Turnout time is usually short. In the analysis it should be distinguished between professional, call on duty, call
on scene and volunteer FD, and night and day response [10].
Table 8-1. Rule of tumbs for prediction of turn out time [10]
On duty Call on duty
2 min (required) 6 min (average)
8.5.3 Travel time
Travel time is easy to estimate. The estimate should be based on average speed and distance between the station
and the site. Also, a few other parameters must be considered:
- Traffic
- Route access
- Nearest station is not available because of other fires
- Road characteristics (e.g. steep rise, curves, width, road surface)
- Weather
Page 140
131
8.5.4 Fire ground operations
At every fire and rescue operation there must be an incident commander who commands the operation and
decides what personnel and other resources to use during the operation. Fire ground operation is a management
issue. The officer in command is responsible for all the operations taking place. He has to make rapid decisions
and chose an appropriate strategy for controlling or fighting the fire. The commander may not be an educated
fire protection engineer, but his decision can be based on years of experience and training. Before deciding the
fire attack strategy he must achieve information about the building construction and plan layout, the fire
characteristics, occupants, water supply and available resources for fire fighting. For more information about
incident management, fire fighting tactics, commander responsibility and safety the reader may read specific
parts of the Pulsgrove reference [10].
All fire departments shall include a safety program. In the U.S. this program are outlined in NFPA 1500 [11].
8.5.5 Set up time
The set up time is the time needed to park the engine, connect to the water supply and general preparation time
for fire attack. The first two parameters depend on the site layout and distance to water supply. Urban fire
brigades do not have to connect to water main before they attack the fire. The driver can do that while the
firefighters penetrate the building. The main part of this analysis would be the evaluation of time to penetrate the
building, localize the fire and time to water application.
A method to evaluate firefighter penetration time is developed by Callery [15]. This method does not just make
use of geometric distances, but uses equivalent distances, based on the obstacles encountered. An example with
raw distance data is shown below.
Page 141
132
Table 8-1. Examples of geometric distances for fire-fighters
Situation Distance
Front Door, locked, glass 1
Lobby 35
Corridor 130
Stairway Door, unlocked, metal 1
Stairway 48
Hose Use Begins 0
Corridor Door, locked, metal 1
SCBA Use Begins 1
Corridor 15
Suite Door, locked, glass 1
Hallway 30
Office door, open, wood 1
However, other data is added so that a proper equivalent time can be determined for the entire operation. For
example, a locked corridor door may have an actual distance of 1 ft., but an equivalent distance of 200 feet, due
to the time necessary to force the door open. When the 200 feet is divided out by the average distance that the
firefighter moves and equivalent time is created.
8.6 RESCUE OPERATIONS
It is difficult to estimate precise information for evaluation of time to rescue people trapped in a building. Even
though the code asks the right questions for designing construction works, the technology may not exist. Even
though there is a lack of sufficient information, this part of the evaluation may be discussed with the fire
department. It is possible to make a good qualitative description of the difficulties the rescue team may come up
with during their rescue efforts. This judgment shall be based on the evaluated design fire and the building
Page 142
133
characteristics. Some useful factors may be building complexity, building fire hazard classification including the
number of people that usually occupies the building, and their familiarity in the building, the fire hazard
described with fire, smoke and heat development, and smoke and heat movement through open doors or barrier
failures. With a good prediction of a fire scenario, the fire brigade suppression and rescue tactics, and an
agreement with an experienced fire officer, this can provide a good evaluation of a rescue operation.
Sandberg and Sandberg measured the rescue time based on test in kindergarten buildings. They found that the
total time needed to rescue three children was 30 minutes. On average four minutes was used to dress up one
child, but with a little training the time was reduced to 40 seconds [12].
The time consuming factors in this rescue operation test were [12]:
1. Search and find trapped occupants. Usually the trapped occupants are children or elderly or other
persons that may be disabled and not available to evacuate by them self.
2. Put breathing apparatus and protective clothing on the victim.
3. Movement to safe area.
4. Undress protective clothing.
Rescuing with the ladder vehicle as a secondary egress route in old buildings is an accepted mean of egress in
Oslo [13] and other cities where the fire brigade has sufficient personnel and resources. Windows or balconies
are accepted as a means of egress up to 12 meters above terrain.
For general information about rescue operations the reader is referred to the Naum reference [14].
Page 143
134
8.7 SUMMARY
The building code have design requirements for buildings. The building shall be designed so that the fire brigade
have a feasible access to and inside the building. Fire brigade efficiency can be weighted against the fire scenario
in a building. The extinction capability of fire hoses can be evaluated against an evaluated fire size. A small fire
can be suppressed with an offensive fire attach inside the building. In larger fire the incident commander may
chose a passive strategy, and try to control the fire outside the building. A timeline for fire development can be
evaluated against a timeline for fire brigade operations, such as arrival time, set up time and water application
time.
8.8 REFERENCES
8.8.1 Codes and standards
1 National Office of Building Technology and Administration (Norway): TEK-97, Regulations concerning
requirements for construction works and products for construction works, 22 January 1997 No. 33
Technical Regulations under the Planning and Building Act 1997.
2 National Office of Building Technology and Administration (Norway): REN, Guidance to Regulations
concerning requirements for construction works and products for construction works, 2nd edition, April
1997.
4 NFPA 1971; Protective ensemble for structural fire fighting (1997).
11 NFPA 1500: Standard on Fire Department Occupational Safety and Health Program, National Fire
Protection Association (1997).
13 Veiledning for tiltakshaver/sø ker - Innredning av Leiligheter på Loft og Kjeller i Murbygninger, Blankett
72-0566, Oslo Kommune (99).
Page 144
135
8.8.2 Design fire information
3 Särdqvist; An Engineering Approach to Fire Fighting Techniques, Lund 1996.
5 Bengtsson; Flashover, Backdraft and Smoke Gas Explosion from a Fire Service Perspective, Lund
Tekniska Hø gskole, Lund 1999.
8 Fitzgerald: The Anatomy of Building Firesafety, Volume 2 Draft 4, Worchester Polytechnic Institute
(1999).
8.8.3 Fire brigade operation
6 Wright; Managing the Response to Hazardous Material Incidence, NFPA Handbook chapter 10-9.
8 Fitzgerald: The Anatomy of Building Firesafety, Volume 2 Draft 4, Worchester Polytechnic Institute
(1999).
10 Paulsgrove; Fire Department Administration and Operation, NFPA Handbook chapter 10-1.
12 Sandberg och Sandberg; Skydds Sökning och Evakuering, Statens Rädningsverk (1988).
14 Naum: Rescue Operations, NFPA Handbook Chapter 10-10
15 WPU thesis written by Callery
8.8.4 Fire brigade suppression capability
4 NFPA 1971; Protective ensemble for structural fire fighting (1997).
7 Brannigan: Building Construction Concerns of Fire Departments, NFPA Handbook chapter 10-11.
8 Fitzgerald: The Anatomy of Building Firesafety, Volume 2 Draft 4, Worchester Polytechnic Institute
(1999).
9 Särdqvist; Real Fire Data - Fires in non-residential premises in London 1994-1997, Lunds Tekniska
Högskola, Lunds Universitet, Lund 1998.
Page 145
136
9 LIFE SAFETY
Life safety is a primary concern in fire protection. All building codes are primarily concerned about the safety
for the occupants. The building frames, the linings, fire partitions, fire protection installations and the egress
paths shall all be designed in a way that encourages safe egress
9.1 DOCUMENTATION OF THE CODE REQUIREMENTS FOR SAFE EGRESS
The general code requirement for safe egress is that "construction works shall be designed and executed for rapid
and safe escape". And "the time available for escape shall exceed the time necessary for escape from the
construction works. Allowance shall be made for a satisfactory safety margin". This requirement is further
specified with tenability during time needed for egress.
The traditional method to provide safe egress is to use fire rated constructions to separate the fire hazards from
the egress paths. In Norway, the separation constructions are rated for 30 or 60 minutes according to the standard
fire test. Doors are usually rated for only 30 minutes. According to the Technical regulations (TEK) [1] fire
protection systems like automatic fire alarm systems and guidance systems are only required in risk class 5 and 6
occupancies (assembly areas, hotels, hospitals). Sprinkler systems and smoke control systems are not required by
the code, but in some cases recommended in the prescriptive code (REN) [2]. Sprinkler systems are, in special
cases, required as a means of personal safety. For example, sprinklers in roofed areas in connections with atria
and large spaces, or in buildings with openings over several floors and a total area exceeding 800 m2. Automatic
fire alarm systems with detectors in the corridors are recommended in educational buildings with two or more
floors. The difference in detection with a detector in a corridor or a detector within the room of origin can be
significant.
Page 146
137
The code requires smoke detectors to be installed only in risk class 4 objects (residences). In complex blocs of
flats, neighbors cannot expect to be alarmed due to the first smoke detector activation, causing the fire rated
separation constructions to be extremely important to ensure safe egress because it can take a long time for all
the occupants are alerted and aware of the threatening fire.
Smoke control systems are recommended in REN for buildings with more than 8 floors or risk class 4 objects
with only one egress path. The intent of both sprinkler systems and smoke control systems is to increase
available safe egress time. In buildings where sprinklers or smoke control systems are recommended, there may
not be any regulatory requirements or recommendations for fire alarm systems.
Based on the risk class and number of floors, REN recommends pressurized stairs with locks (Tr3) or corridors
(Tr2) between the fire partitions and staircases. For buildings with eight floors or less, REN recommends Tr2
stairs in occupancies with sufficient number of people and where egress time are expected to be significant (risk
class 3, 5 and 6).
TEK requires that "fire compartments for a large number of persons shall have a sufficient number of exits, at
least two, to the escape route". On the other hand, REN recommends two egress paths for all risk classes.
In a performance based evaluation, the fire safety value of fire protection installations can be measured against
the level of safety achieved by designing after the prescriptive code. In every building with a touch of
complexity there are usually several ways of achieving a sufficient level of fire safety.
The documentation of the fire safety level shall be performed and written according to NS 3901 [3]. The three
different types of acceptance criterion are all useful for different fire protection designs. The former sections of
this chapter should indicate that a comparative judgment is probably the easiest and most economic way to
compose the required document. Combinations of the design of egress paths, number of egress routes,
Page 147
138
installation of fire protection systems and the evaluation of their influence on life safety, the likelihood of fire
spread, barrier effectiveness and reliability in keeping tenable conditions in the egress routes, and fire
department suppression and rescue operations can all be evaluated together and measured by an increase in safe
egress time or decrease in necessary egress time relative to the prescriptive fire protection design.
9.2 AVAILABLE SAFE EGRESS TIME
Available safe egress time is a matter of fire spread and time to untenable conditions in the egress paths. The
tenability criterion and deterministic measures are discussed in chapter 6, and the likelihood of fire and smoke
spread through open doors or barrier failures are discussed in the barrier chapter. With this information available
safe egress time can be evaluated.
The essential and major problem by evaluating safe egress time is the description of the design fire and the
building geometry. The rate of fire growth influence on the time to generation of a hot smoke layer, temperatures
and concentration of toxic gases. The building geometry influences on the volume that has to be filled with
smoke and the openings between the rooms influence on smoke movement. Doors are never a 100% reliable
obstruction. Therefore, it is necessary to evaluate the situation with doors open and doors closed. Available safe
egress time based on deterministic evaluation of tenability can vary from 2 minutes to 30 minutes, depending on
the doors. Deterministic acceptance criteria for evaluating tenability in egress paths are not available, but
comparative judgments can be performed.
Evaluating available safe egress time in the room of origin is easier. The likelihood of doors open or not can be
excluded. In this evaluation, only the design fire and room geometry is of interest. The fire growth rate can be
evaluated from prediction of fire load characteristics. The smoke and heat-filling rate can be evaluated with
equations programmed into a spreadsheet, or zone- or field models described in the smoke movement chapter.
Page 148
139
9.3 REQUIRED EGRESS TIME
The time needed to evacuate can be divided into thee steps, detection, reaction, and, the time needed to move to
a safe place. Detection and reaction was discussed on the Detection chapter. Movement is both an issue of
human characterization and numerical calculation of movement velocity through corridors, doors, stairs and
other bottlenecks. The human characterization is the essential factor; the movement part can be evaluated with
simple computer programs or only simple calculations.
9.3.1 Human characterization factors for movement
The Pauls [4] reference in the SFPE handbook does a general summary of several references that covers this
subject. The conclusions drawn about fire related human behavior is:
- Panic is very rare even in very serious fires.
- A central motivation and activity in fires is to seek information about the nature and seriousness of the
situation.
- Evacuation and response to fire generally is often a social response.
- The movement of people observed in normal building use and in many simulated emergency evacuations is
a good basis for predicting their movement in a fire emergency.
All of these factors are essential to evaluate human's motivation to evacuate in fires. The motivation to seek
information can be compared the ease of achieving this information in a building with a specific layout and
design. The social response issue may be present in an office building, and may not be present in a mall. And
probably the most important factor in evaluating the egress time is that people tend to evacuate in the same route
that they use every day. It may be unrealistic to assume an optimum distribution of people to all egress paths.
The latter factor has been underlined by McClinton [5]. He called it "Movement towards the familiar". Another
particular factor for movement is "Learned irrelevance". The significance of "Learned irrelevance" was
measured by interviews in retail stores by Shields and Boyce [6]. They found that 86% failed to notice
Page 149
140
emergency exit signs anywhere in the store, and 75% could not indicate the location of any emergency exit signs
even when prompted with a simple schematic of the store.
Handicapped people may have a variety of limitations that increase their risk in fires and make them unable to
evacuate. Their problems may be deafness, blindness, or mobility that may entail the need for a vehicle chair.
Intellectual problems such as mental retardation or dementedness, alone or in combination with other handicaps,
can also hinder them from evacuating a building. Handicapped people may also have a concern about their
personal risk, especially in high-rise buildings or in residences where rescue help is not continuously present.
Horizontal evacuation to an area of refugee (AOR) can be appropriate for some buildings, and, according to
REN, AOR is recommended for nursing homes and hospitals. The Levin and Nelson reference deals with the
issue of disabled persons and fire safety [7].
Boyce, Shields and Silcock [19,20,21,22] have produced four papers that collectively provide a substantial body
of knowledge of disabled people who frequent public-assembly buildings. This information can be used to derive
working estimates of the prevalence and nature of disability among building populations when characterizing
building occupancies.
9.3.2 Methods to evaluate the movement time
There are numerous methods to predict the movement time ranging from simple and fast calculations to complex
geographical software. The easiest first hand estimate of movement time, assuming an optimum density through
the doors, corridors and stairs, is to assume a flow rate of 1 person per second per meter egress path width [4].
An assembly area with 1000 persons evacuating through three doors with total 3-meter opening width will at an
optimum take about 300 seconds (5 minutes). Time to move to a safe place must be added to this estimate. The
speed can be assumed to be about 1 m/s, but the speed is reduced in stairs or corridors where the densities of
persons are increased.
Page 150
141
Movement equations programmed into a spreadsheet or preprogrammed software tools can perform a more
credible prediction, but there is a danger of getting sidetracked by their apparent sophistication. The models and
equations can take on a reality of their own and keep us from understanding the world as is it actually exists [4].
The models should therefore at least take into account the effect of flow times vs. effective width per person.
Some models also assume that all people start evacuating at the same time and that they wait at every choke
point. This may cause an unrealistic over prediction. Disabled persons can also block one of the egress paths for
a period. Spreadsheet models and graphs that can be used to estimate movement times are presented in [8,9].
EXIT89 [10] is one model that uses mathematics to describe in detail the process of movement and waiting. This
is an evacuation model designed to handle the evacuation of a large population of individuals from a high-rise
building. It has the ability to track the location of individuals as they move through the building so that the
output from this model can be used as input to a toxicity model that will accumulate occupant exposures to
combustion products. Models like CFAST [11] and FPETool [12] do also include simple modeling tools for
egress time.
Network models can usually import computer-aided graphics. These models are characterized by the description
of structures as lists of nodes and arcs. Nodes can be sources of people, destinations for people, or places where
people accumulate. Nodes are typically used to model rooms, hallways, stairways and exits. Nodes have
capacities, and sometimes additional information, depending on the model. Arcs connect nodes. Arcs have flow-
rates, and regulate the speed at which occupants may flow from one node in a structure to another. Network
models are, EVACNET+ [13], Simulex [14], STEP [15], PedGo [16] and EXODUS [17].
A summary of different computer models for evaluating egress times can be found in the Watts reference [18].
Page 151
142
9.4 SUMMARY
The traditional code required method to provide safe egress is to use fire rated constructions to separate fire
loads from egress paths. Performance based codes allows other methods to be used as long as available safe
egress time is longer than required egress time including a safety factor. Available safe egress time is usually a
matter of fire development and smoke spread, and, required egress time is a matter of human behavior in fires
and necessary time to move to a safe place. Movement time can be evaluated with computer programs.
9.5 REFERENCES
9.5.1 Building codes and standards
1. National Office of Building Technology and Administration (Norway): TEK-97, Regulations concerning
requirements for construction works and products for construction works, 22 January 1997 No. 33
Technical Regulations under the Planning and Building Act 1997.
2. National Office of Building Technology and Administration (Norway): REN, Guidance to Regulations
concerning requirements for construction works and products for construction works, 2nd edition, April
1997.
3. National Building Standardization Council (Norway): NS3901, Risk analysis of fire in buildings and civil
engineering works (1998).
9.5.2 General egress
4. Pauls; Movement of People, The SFPE handbook chapter 3-13
5. McClintock; A Behavioural Solution to Increasing the Efficiacy of Emergency Exits, University of Ulster
6. Shields and Boyce; In Unannounced Evacuations of Retail Stores, University of Ulster (2000)
7. Levin and Nelson; Firesafety and Disabled Persons, Fire Journal, Vol 75, No 5 pp 35-40 (1981)
Page 152
143
8. NBI.520.385: Beregning av Rø mningstid, Norges Byggforsknings Institutt (1997)
9. Bryan; Human Behavior and Fire, NFPA Handbook chapter 8-1
19 Boyce, Shields, and Silcock; Toward the Characterization of Building Occupancies for Fire Safety
Engineering: Prevalence, Type, and Mobility of Disabled People. Fire Technology Volume 35, no. 1 First
Quarter 1999
20 Boyce, Shields, and Silcock; Toward the Characterization of Building Occupancies for Fire Safety
Engineering: Capabilities of Disabled People Moving Horizontally and on an Incline. Fire Technology
Volume 35, no. 1 First Quarter 1999
21 Boyce, Shields, and Silcock; Toward the Characterization of Building Occupancies for Fire Safety
Engineering: Capability of Disabled People to Negotiate Doors. Fire Technology Volume 35, no. 1 First
Quarter 1999
22 Boyce, Shields, and Silcock; Toward the Characterization of Building Occupancies for Fire Safety
Engineering: Capability of People with Disabilities to Read and Locate Exit Signs. Fire Technology
Volume 35, no. 1 First Quarter 1999
9.5.3 Computer models
10. Fahy; EXIT89: An Evacuation Model for High-Rise Buildings. Model Description and Example
Applications, International Association for Fire Safety Science. Fire Safety Science. Proceedings. 4th
International Symposium. July 13-17, 1994, Ottawa, Ontario, Canada, Intl. Assoc. for Fire Safety
Science, Boston, MA, Kashiwagi, T., Editor, 657-668 pp, 1994
11. Jones and Forney. “A Programmer's Reference Manual for CFAST, the Unified Model of Fire Growth
and Smoke Transport,” Natl. Inst. Stand. Technol. 1990, Tech. Note 1283, 104 p.
12. Deal; Technical reference Guide for FPETool ver. 3.2, National Institute of Standards and Technology
(1995).
13. Kisko and Francis; EVACNET+: A computer program to determine optimal building evacuation plans,
Page 153
144
Fire Safety Journal, Vol. 9, 1985, pp 211-220
14. Thompson and Marchant; A Computer Model for the Evacuation of Large Building Populations. Fire
Safety Journal Vol. 24, No. 2 pp 131-148. 1995.
15. Mott MacDonald Inc, England.
16. König, Klüpfel, and Schreckenberg; A microscopic model for simulating mustering and evacuation
processes onboard passenger ships, Institute of Ship Technology, Gerhard-Mercator-University,
17. Owen, Galea and Lawrence; Advanced Occupant Behavioural Features of the building-EXODUS
Evacuation Model, University of Greenwich (1996).
18. Watts; Computer Models for Evacuation Analysis, Fire Safety Journal, 12(1987), pp. 237 -- 245
Page 154
145
CONCLUSION
This document provides references in an organized sequence. This was done to make literature and publications
more easily available to a fire protection engineer who evaluates fire safety in a performance based perspective.
The extent of available literature is large, and much of it is easily available through the Internet. There is an
increasing interest for the building and the fire protection systems performance in fire scenarios and lots of
literature addresses this topic. However, each particular publication may only cover a limited area of the
phenomena that may occur in a fire scenario. Even though the use of literature and international knowledge is
used to understand the building and its occupants it can still be possible to make mistakes. A performance based
design also require technical firesafety knowledge so that the relations between the different facts can be
established, whereas the literature may describe facts for a specific frame of a fire scenario analysis. This can be
compared with the skills necessary to pass a strenuous river by jumping from stone to stone. This requires
courage, strategy, certainty and balance.
The accuracy in simulation methods and models varies. For example, sprinklers suppression efficiency is
difficult to estimate because the sprinkler manufacturers don’t have appropriate data to characterize the sprinkler
spray. The speed of fire development in a room can be estimated with a relatively decent accuracy if the location
of the fire source and the room’s furniture and fixtures are known. Methods to estimate smoke production are
good and available, but evaluation of smoke movement in a building is difficult and the simulation results are
strongly dependent on the chosen assumptions. In general, the variety and dynamics in fire scenarios are
extensive. Therefore, the characterization of the building, its occupants and design fires is probably the most
difficult and the most important part of any firesafety evaluation.
Page 155
146
Several countries have chosen a performance-based code for the future. And, there is an increasing interest for
performance among the engineers. The profession can develop such that the fire protection engineers can
evaluate any building design with sufficient accuracy, and recommend a firesafety design that gives sufficient
level of firesafety without regard to how the building industry develop. Focus on performance instead of pre-
accepted design may be the only way the fire protection profession can survive and still be an interesting part of
any building engineering team. While the structural-, electrical- and the HVAC engineers, need to get updated in
new products, the focus of the fire protection engineers aims at the development of new theories, models and
tests in order to gain better knowledge to evaluate fire safety. An important competition advantage for fire
protection engineers is sufficient knowledge of the literature and its application, application of models, and
ability to communicate in such a way that the firesafety level is presented in an understandable perspective.