132
Sinarmas Land Limited Annual Report 2014 Building FOR A BETTER FUTURE

Sinarmas Land Limited Annual Report 2014
BuildingFOR A BETTER FUTURE

VISIONTo be the leading property
developer in South East
Asia, trusted by customers,
employees, society,
and other stakeholders
CORPORATE PROFILESinarmas Land Limited (“SML” and together with its subsidiaries, the “Group”) listed on the
Singapore Exchange and headquartered in Singapore, is engaged in the property business
through its operations in Indonesia, China, Malaysia, Singapore and United Kingdom.
In Indonesia, SML is the largest property developer in terms of strategic land bank
and market capitalization. SML operates chiefl y through two public listed Indonesian
subsidiaries, namely PT Bumi Serpong Damai Tbk (BSDE) and PT Duta Pertiwi Tbk (DUTI)
– with a combined market capitalization in excess of US$3.5 billion. Its Indonesia property
division is engaged in many sub-sectors of the property business, including township
development, residential, commercial, industrial and hospitality-related properties. SML has
long-term investments in commercial buildings, hotels and resorts, is involved in property
development and has a presence in Singapore, Malaysia, China and United Kingdom.
VALUESPositive Attitude,
Continuous Improvement,
Loyalty, Integrity, Innovation,
Commitment
01 Corporate Profi le
02 Financial Highlights
04 Milestones
04 Year in Brief
05 Awards & Accolades
06 Chairman and CEO Statement
10 Board of Directors
14 Corporate Governance Report
30 Corporate Structure
31 Corporate Directory
32 Diversifi cation • Diversifi kasi •
34 Strength • Kekuatan •
36 Expertise • Keahlian •
38 Financial Review
42 Operations Review
48 Network of Operations
50 Property Portfolio
58 Investor Relations
60 Corporate Social Responsibility
63 Human Capital
65 Financial Report
151 Shareholding Statistics
152 Warrantholding Statistics
153 Notice of Annual General Meeting
Proxy Form
Contents
THE BREEZEBSD City, Indonesia
Cover:SINAR MAS LAND PLAZABSD City, Indonesia

2014 TOTAL ASSETS BY CATEGORY
(%)
Property under Development 36.7
Cash and Cash Equivalents 18.4
Associated Companies and Joint Ventures
6.9
Property Held for Sale 17.8
Investment Properties 10.5
Other Current Assets and Receivables 5.6
Property Plant and Equipment 3.3
Long Term Receivables 0.8
Total 100
Financial Highlights
TOTAL
S$4,744.7 M
REVENUE
(S$ MILLION)
631.3 1,178.8 828.6
FY2012 FY2013(restated)
FY2014
EBITDA
(S$ MILLION)
274.8 638.1 451.7
FY2012 FY2013(restated)
FY2014
PROFIT ATTRIBUTABLE
TO OWNERS OF THE COMPANY
(S$ MILLION)
112.7 288.9 240.6
FY2012 FY2013(restated)
FY2014
EARNINGS PER SHARE (BASIC)
(CENTS)
3.70 9.50 7.91
FY2012 FY2013(restated)
FY2014
NET CASH GENERATED FROM
OPERATING ACTIVITIES
(S$ MILLION)
309.0 311.4 342.7
FY2012 FY2013(restated)
FY2014
TOTAL ASSETS
(S$ MILLION)
3,395.8 3,999.7 4,744.7
FY2012 FY2013(restated)
FY2014
CASH DIVIDEND
(CENTS)
0.38 0.50 0.50
FY2012 FY2013 FY2014
RETURN ON
SHAREHOLDERS’ EQUITY
(%)
7.5 20.3 14.0
FY2012 FY2013(restated)
FY2014
Sinarmas Land Limited Annual Report 20142 3Financial Highlights

Indonesia Contact Center AssociationSinar Mas Land, The Best Business Contribution (Silver)
Finance AsiaPT. BSD, Tbk., 5th Ranking of Best Investor Relations
Property & Bank Award 2014Sinar Mas Land, Property Developer with the Largest Customer Service Center
SWA PT. BSD. Tbk, 1st Ranking of INA The Best Public Companies Based on WAI
2014, Category Real Estate
Warta EkonomiSinar Mas Land, Special Recognition Sustainable Green Development Property Award
Properti Indonesia Award 2014BSD Green Offi ce Park, The Finest Concept Offi ce Building
Properti Indonesia Award 2014PT BSD, Tbk., The Best Performance, Category: In Growth of Profi t
Economic ReviewPT. BSD. Tbk, 1st Ranking of Public Listed Company in
Property & Real Estate Sector
BCI Asia Awards 2014Sinar Mas Land asTop 10 Developers
Indonesia Green Awards 2014BSD City, Category: Water Preservation Treatment
ASEAN Energy Awards 2014Sinar Mas Land Plaza, Best Practice Competition in Buildings, Category: Green Building
MNC Business Awards 2014PT. BSD.Tbk, The Best Listed Company Real Estate Sector
Cityscape Awards 2014 for Emerging MarketsSinar Mas Land Plaza, Category: Commercial Development
Southeast Asia Property Awards 2014Sinar Mas Land as Best Developer (Indonesia)
Forbes IndonesiaBest of The Best Awards 2014, PT. BSD. Tbk, 3rd Ranking of Best Performing Companies in Indonesia
Milestones
– BSDE – IDR250 billion Bond issue (2003)
– BSDE – IDR600 billion Bond issue (2006)
2008– BSDE
– IPO
– BSDE rights issue to acquire: DUTI, Sinar Mas Teladan, Sinar Mas Wisesa
– Sinarmas Land brand introduced
– AFP changed name to Sinarmas Land
– BSDE – IDR1 trillionbond issue
– PT Paraga Artamida acquires PT Plaza Indonesia Realty Tbk (from 17.6% to 26.0%)
– Acquisition of New Brook Buildings in London, United Kingdom, for £84.05 million
– BSDE acquires 8.23% of PT Plaza Indonesia Realty Tbk
– BSDE – IDR1.75 trillion bond issue
– Strategic alliance with AEON Mall, Hongkong Land and Kompas Gramedia Group
– Establishment of S$1 billion Multicurrency Medium Term Note Programme
– Internal restructuring of the Group’s shareholding interest in PT Plaza Indonesia Realty Tbk
– Increase effective stake in BSDE from 49.87% to 51.50%
– Acquisition of Warwick House in London, United Kingdom, for £57.28 million
– Disposal of New Brook Buildings in London, United Kingdom, for £113.40 million
– Sinarmas Land controls BSDE
– Asia Food & Properties (AFP) listing in Singapore (1997)
– ITC brand established (1990)
– DUTI – IPO (1994)
– DUTI – Convertible Bonds conversion (1995)
– DUTI established
– BSDE established (1984)
– BSDE commenced operations (1984-1989) of developing self-suffi cient city
2014201320122011201020082003-20071996-19971990-19951984-1989 20021972
Awards & Accolades2014
Year in Brief2014
2Q 2014
• BSDE conducted capital increase
without pre-emptive rights by
issuing 874,849,800 shares
representing 5% of its issued
and paid-up share capital
• BSDE acquired, and PT Paraga
Artamida (PAM) a subsidiary
of the Company, sold 25.99%
of an associated company,
PT Plaza Indonesia Realty Tbk
(PIR) for a total consideration
of IDR2 trillion (approximately
S$223 million). The Company’s
effective interest in PIR decreased
from 26.03% to 17.06%
• PAM and PT Ekacentra Usahamaju
each subscribed for 437,424,900
new shares of BSDE for a total
consideration of IDR1.6 trillion
(approximately S$175 million).
The Company’s effective interest
in BSDE and PIR increased from
49.87% to 51.50% and from
17.06% to 17.62% respectively
• Establishment of S$1 billion
Multicurrency Medium Term
Note Programme
• Disposal of entire shareholdings of
both Integrated Investments Ltd and
Solid Growth Investments Ltd for a
total consideration of S$5.5 million
3Q 2014
• Completion of acquisition of
Warwick House in London,
United Kingdom, for £57.28 million
4Q 2014
• Waiver of the existing mutual
undertakings between Sinarmas Land
Limited and Bund Center Investment
Ltd and substitution with a set of
new procedures at the Extraordinary
General Meeting
• Disposal of New Brook Buildings
in London, United Kingdom,
for £113.40 million
Sinarmas Land Limited Annual Report 20144 5

Chairman & CEO Statement
DEAR VALUED
SHAREHOLDERS,
On behalf of the Board of Directors,
we are pleased to report that Sinarmas
Land Limited (“SML”, “Sinarmas Land”
or “the Company”) and its subsidiaries
(collectively “the Group”) has delivered
a creditable set of results in the year
ended 31 December 2014, despite
11% depreciation in the Indonesian
Rupiah, coupled with weaker macro-
economic indicators and higher central
bank interest rates during the year.
The Group achieved S$428.2 million
in Profi t after Tax (PAT) and
S$240.6 million in Profi t after Tax
and Attributable to Owners (PATMI),
despite the absence of large land sales
in 2014. Our strategy to diversify into
the international property market has
enabled us to ride out the challenging
year as PAT margin improved to
51.7% compared with 45.9% in
the previous year.
2014 IN REVIEW
2014 was an eventful year for
Indonesia. The year ushered in a
new President for Indonesia with bold
plans for major infrastructure upgrades
and large-scale reforms of its fuel
“ Our strategy to diversify into the international property market has enabled us to ride out the challenging year as PAT margin improved to 51.7% compared with 45.9% in the previous year”
“ Th e Group achieved S$428.2 million in Profi t aft er Tax (PAT) and S$240.6 million in Profi t aft er Tax and Attributable to Owners (PATMI), despite the absence of large land sales in 2014”
Muktar
Widjaja
Executive
Director
and Chief
Executive
Offi cer
Franky
Oesman
Widjaja
Executive
Chairman
subsidies, while GDP growth slowed
from 5.58% to 5.02% due to weaker
commodity prices and slowdown
in exports.
2014 was also an eventful year
for Sinarmas Land. The Group’s
International Property Division realized
S$71.0 million gain on disposal of its
investment in United Kingdom after
making its maiden acquisition less than
2 years ago. Our Indonesia Property
Division commenced pre-sales for
Nava Park, an integrated premium
residential development, through our joint
venture with Hongkong Land. In the other
joint development with Kompas Gramedia
Group, Indonesia Convention Exhibition,
the largest convention and exhibition
center in Indonesia, was completed.
In 2014, upon adoption of FRS 110,
Consolidated Financial Statements,
the Group consolidated PT Puradelta
Lestari Tbk and its subsidiaries (“PDL
Group”) with effect from April 2013.
PDL Group’s main project is Kota
Deltamas (“Deltamas”), an industrial-
focused township development located
in Bekasi, West Java.
CREDITABLE PERFORMANCE
Revenue for 2014 declined 29.7% to
S$828.6 million, mainly attributable to the
absence of S$302.2 million sales of land
parcels in BSD City to its joint ventures
and associated company, offset by sale
of a land parcel of S$65.5 million in
Deltamas to an associated company.
Excluding sales of land parcels and
notwithstanding the depreciation of
Indonesian Rupiah, the Group’s revenue
decreased marginally from S$876.6
million to S$763.1 million due to lesser
completed residential units recognized
for both Indonesia and China
development projects.
The Group’s gross profi t was
lower at S$597.8 million in line
with revenue. However, gross profi t
margin increased from 65.9% in
2013 to 72.1% in 2014, due to higher
average selling prices. EBITDA and
PATMI were S$451.7 million and
S$240.6 million respectively. Net cash
generated from operating activities
increased from S$311.4 million to
S$342.7 million, continuing the strong
momentum on cash generation from
core operations.
Sinarmas Land Limited Annual Report 20146 7Chairman & CEO Statement

Chairman & CEO Statement
REVENUE (S$ MILLION)
FY 2014 828.6
FY 2013 1,178.8
FY 2012 631.3
FY 2011 534.4
EBITDA (S$ MILLION)
FY 2014 451.7
FY 2013 638.1
FY 2012 274.8
FY 2011 216.9
DIVERSIFICATION TO
INTERNATIONAL MARKETS
OUTSIDE INDONESIA
The Group made its fi rst foray into
London in 2013 to diversify its income
streams which are principally derived
from Indonesia. In September 2014,
the Group completed the acquisition
of another freehold investment
property known as the Warwick House
for £57.3 million (S$120.5 million),
the second acquisition in London,
as part of our diversifi cation strategy
into international markets outside
Indonesia. This property is located
in SOHO, London’s most vibrant
offi ce sub-market with signifi cant
frontages to two of SOHO’s best
known streets, Great Pulteney Street
and Lexington Street.
As a result of the gain on disposal
arising from the opportunistic
divestment of New Brook Buildings
located in West End London, the
International Property Division
contributed about 24% to the Group’s
PATMI. The Group continues to seek
new investment opportunities in good
quality income producing assets in
international gateway cities.
FRANKY OESMAN WIDJAJA
Executive Chairman
MUKTAR WIDJAJA
Executive Director and Chief Executive Offi cer
the newly completed Indonesia
Convention Exhibition and pursuing
new investments in international markets.
As the leading property developer in
Indonesia with one of the largest
developable land bank and a healthy
balance sheet, the Group remains in
good position to expand further.
ACKNOWLEDGEMENTS
On behalf of the Board of Directors, we
wish to express our heartfelt appreciation
to our shareholders, business partners,
customers and vendors for your
continued support. The Directors have
proposed a fi rst and fi nal cash dividend
of 0.50 Singapore cents per ordinary
share, subject to shareholders’ approval
at the forthcoming Annual General
Meeting and is expected to be paid out
on 15 June 2015. The proposed dividend
is the same as last year despite the dip in
net profi ts, as we continue to re-invest
our earnings for new acquisitions.
We thank our fellow Board members,
management and staff for their
dedication towards the Group’s long-
term goals of enhancing shareholders’
value and their contribution in helping
Sinarmas Land receive numerous
prestigious international awards for its
commitment to provide high quality
developments and building a better
future for the community.
INTERNAL RESTRUCTURING
In May 2014, the Group’s principal
subsidiary, PT Bumi Serpong Damai Tbk
(“BSDE”) acquired 25.99% of the
shareholding in an associated company
PT Plaza Indonesia Realty Tbk (“PIR”)
for a consideration of IDR2,030 billion
(S$223 million) from PT Paraga Artamida
(“PAM”), another subsidiary of the Group.
At the same time, BSDE conducted a
capital increase without pre-emptive
rights with PAM and its subsidiary,
PT Ekacentra Usahamaju, subscribing
to new shares representing 5%
of BSDE paid-up capital for
IDR1,592 billion (S$175 million).
The internal restructuring exercise allows
the Group to streamline its shareholding
structures and after the exercise, the
Group’s effective interest in BSDE
increased from 49.87% to 51.50% and
its effective interest in PIR decreased
from 26.03% to 17.62%.
LEVERAGING ON A STRONG
BALANCE SHEET
Notwithstanding the increase in
fi nance costs from S$22.0 million to
S$54.1 million, the Group remained
lowly geared. The Group’s total debt
to total equity stood at only 0.23 as of
31 December 2014, demonstrating its
capability to leverage up for business
acquisitions. The Group is also in a net
cash position of S$130.4 million. During
the year, the Company established
an S$1,000,000,000 multicurrency
medium term note programme for future
expansion and working capital needs.
The Group’s balance sheet
remained robust with cash and cash
equivalents of S$874.8 million and
total assets of S$4,744.7 million as
of 31 December 2014.
2015 OUTLOOK
2015 continues to be challenging and to
mitigate the macro-economic factors
which are expected to weigh on our
property sales in Indonesia, the Group
has already moved into product and
geographical diversifi cation, such as
building high-rise premium residential
developments in Jakarta, launching
1
London,
United
Kingdom.
1
PROFIT ATTRIBUTABLE TO
OWNERS OF THE COMPANY
(S$ MILLION)
FY 2014 240.6
FY 2013 288.9
FY 2012 112.7
FY 2011 88.818 March 2015
Sinarmas Land Limited Annual Report 20148 9Chairman & CEO Statement

Board of Directors
FRANKY OESMAN WIDJAJA
Executive Chairman
Mr. Franky Widjaja, aged 57 was appointed as Executive Chairman of Sinarmas Land Limited (“SML”) in December
2006 and he has been a Director of SML since 1997. He earned his Bachelor’s degree in Commerce from Aoyama
Gakuin University, Japan in 1979.
Mr. Franky Widjaja has extensive management and operational experience. Since 1982, he has been involved with
different businesses including pulp and paper, property, chemical, fi nancial services and agriculture.
Mr. Franky Widjaja is a member of SML’s Executive/Board Committee and Nominating Committee. He is
Vice President Commissioner of SML’s Indonesia Stock Exchange listed property subsidiaries, PT Bumi Serpong
Damai Tbk and PT Duta Pertiwi Tbk.
Mr. Franky Widjaja is Chairman and Chief Executive Offi cer of Golden Agri-Resources Ltd (“GAR”), President
Commissioner of its Indonesian subsidiary, PT Sinar Mas Agro Resources and Technology Tbk, which is listed
on the Indonesia Stock Exchange and Director of Bund Center Investment Ltd (“BCI”). He is a member of the
Boards of several subsidiaries of SML, GAR and BCI.
MUKTAR WIDJAJA
Executive Director and Chief Executive Offi cer
Mr. Muktar Widjaja, aged 60 was appointed as Chief Executive Offi cer of SML in December 2006. He has been a
Director of SML since 1997. His last re-election as a Director was in 2013. He obtained his Bachelor of Commerce
degree in 1976 from the University Concordia, Canada.
Since 1983, Mr. Muktar Widjaja has been actively involved in the management and operations of the property,
fi nancial services, agriculture, chemical and pulp and paper businesses. Mr. Muktar Widjaja is a member of SML’s
Executive/Board Committee and President Commissioner of PT Bumi Serpong Damai Tbk and PT Duta Pertiwi Tbk.
Mr. Muktar Widjaja is Director and President of GAR and Vice President Commissioner of PT Sinar Mas Agro
Resources and Technology Tbk. He is a member of the Boards of several subsidiaries of SML and GAR.
Mr. Muktar Widjaja was a Director of Bund Center Investment Ltd until May 2012.
1 FRANKY OESMAN WIDJAJA
Executive Chairman
2 MUKTAR WIDJAJA
Executive Director and
Chief Executive Offi cer
3 MARGARETHA NATALIA WIDJAJA
Executive Director
4 FERDINAND SADELI
Executive Director and
Chief Financial Offi cer
5 ROBIN NG CHENG JIET
Executive Director
6 FOO MENG KEE
Independent Director and
Chairman of Audit Committee
and Nominating Committee
7 KUNIHIKO NAITO
Independent Director
8 RODOLFO CASTILLO BALMATER
Independent Director and Chairman
of Remuneration Committee
1
3
7
5
2
4
8
6
MARGARETHA NATALIA WIDJAJA
Executive Director
Ms. Margaretha Widjaja, aged 33 was appointed as Director of SML in December 2010. Her last re-election as
a Director was in 2014. Ms. Margaretha Widjaja graduated from Seattle University, United States of America
in 1999 with a degree in Bachelor of Arts majoring in Finance, Marketing and Information Systems. She later
obtained a Master of Management Information Systems in 2001 from the same university.
Since 2008, Ms. Margaretha Widjaja was Vice-Chairman of the Indonesian Property Division of SML and
she was instrumental in leading the transition of the management organization structure and the re-branding
of “Sinarmas Land” in Indonesia. She supports the Chief Executive Offi cer in formulating the Group’s business
plans and strategies. She is also responsible for the Group’s Enterprise Risk Management activities and
corporate governance initiatives.
Prior to her current position, Ms. Margaretha Widjaja was Deputy CEO, Forestry Division of Sinar Mas Group from
2002 to 2008, where she led the teams responsible for Finance, Information Technology, Human Resources, Legal
and Business Control and was key to driving the strategies for the Division’s growth during her tenure. She had also
worked as an Investment Analyst with Merrill Lynch Bank in the United States between 2000 and 2002 and was
involved in the due diligence analysis and execution of various M&A transactions.
Ms. Margaretha Widjaja is a member of Executive/Board Committee of SML. She is also a member of the
Boards of several subsidiaries of SML and a Director of Finneland Properties Pte Ltd.
Sinarmas Land Limited Annual Report 201410 11Board of Directors

Board of Directors
ROBIN NG CHENG JIET
Executive Director
Mr. Ng, aged 40 joined SML as the Finance Director and was appointed as an Executive Director in April 2012.
His last re-election as a Director was in 2013. He graduated with a Bachelor of Accountancy (Honours) from
Nanyang Technological University, Singapore in 1998. Mr. Ng is a Chartered Accountant (Australia) since 2001
and a Chartered Accountant (Singapore) since 2002. He is currently a Fellow member of the Institute of Singapore
Chartered Accountants.
Mr. Ng has over 16 years of experience in operational fi nance and public accounting and was formerly the Chief
Financial Offi cer of Top Global Limited, a company listed on the Singapore Exchange Securities Trading Limited.
Prior to joining Top Global Limited, Mr. Ng was the Finance Director, Asia, of Methode Electronics Inc. from August
2009 to October 2010, and was with Lear Corporation where he held various positions, with his last position as the
Head of Finance, Japan, before leaving in August 2009. Previously, he was the Regional Internal Controls Manager
at Kraft Foods Asia Pacifi c Ltd. Mr. Ng was also with Ernst & Young Singapore and Australia (Sydney offi ce) for
more than seven years, serving as Audit Manager before he left.
Mr. Ng is a member of SML’s Executive/Board Committee. He is also a member of the Boards of several
subsidiaries of SML.
KUNIHIKO NAITO
Independent Director
Mr. Naito, aged 70, has been a member of SML’s Board of Directors since December 2007. His last
re-election as a Director was in 2013. Mr Naito graduated from Waseda University, Japan, in 1967 with
a Bachelor’s degree in Engineering.
Mr. Naito was with Nissho Iwai Corporation (now known as Sojitz Corporation) for 36 years, of which
14 years were with its North American operation in New York. He held various positions at Nissho Iwai
Corporation, including that of General Manager of Machinery Department in New York, Deputy General
Manager for the South East Asia region (based in Singapore), and Chief Representative for Nissho Iwai
Corporation Indonesia.
Mr. Naito was actively involved in food and industrial/residential property development projects worldwide.
Mr. Naito is the Representative Director of NSN Global Partners Ltd, Japan and NSN Global (S) Pte Ltd,
Singapore in the fi eld of industrial business consulting.
Mr. Naito is a member of SML’s Audit Committee and Remuneration Committee.
FOO MENG KEE
Independent Director and Chairman of Audit Committee
and Nominating Committee
Mr. Foo, aged 65 joined SML’s Board of Directors in 2001. His last re-election as a Director was in 2014. Mr. Foo’s
academic qualifi cations include a MBA from the University of Dubuque, USA; Graduate Diploma in Marketing
Management from the Singapore Institute of Management; and Bachelor of Commerce (Honours) from the Nanyang
University of Singapore. Mr. Foo was with Hitachi Zosen Singapore Limited (now known as Keppel Shipyard Limited)
from 1976 to 1998. When he was the Managing Director of Hitachi Zosen Singapore Limited, he led in the listing of
the company on the main board of the Singapore Stock Exchange. Currently, he is the principal owner of M K
Capital Pte Ltd and M K Marine Pte Ltd.
Mr. Foo has in the past served on the Committees of the Association of Singapore Marine Industries and the
Singapore Armed Forces Reservists’ Association.
Mr. Foo is Chairman of SML’s Audit Committee and Nominating Committee and a member of its Remuneration
Committee. He also sits on the Boards of Directors of several public listed companies namely, Lee Metal Group Ltd,
Jiutian Chemical Group Ltd, Courage Marine Group Limited and Titan Petrochemicals Group Limited.
RODOLFO CASTILLO BALMATER
Independent Director and Chairman of Remuneration Committee
Mr. Balmater, aged 66 joined SML’s Board of Directors in February 2006. His last re-election as a Director
was in 2014. He graduated from Araullo University, Philippines in 1969 with a degree in Bachelor of Science
in Commerce majoring in Accountancy (with honours), and completed a Master in Management from the
Asian Institute of Management (with distinction) in 1978.
Mr. Balmater worked with international accounting fi rms (SGV Philippines, Arthur Andersen and Ernst &
Young) from 1969 to 2006 in various capacities. Within this 37 years, he was involved in audit work, fi nancial
consulting activities, and business advisory service holding various job positions as Partner and/or Director.
Mr. Balmater is currently President Director of PT. Balmater Consulting Company which advises family
owned businesses and also provides training on corporate governance, fi nance, accounting, audit and risk
management. He is currently a member of each of the Audit Committees of PT Erajaya Swasembada Tbk,
PT Delta Djakarta Tbk and PT Molindo Raya Industrial.
Mr. Balmater is Chairman of SML’s Remuneration Committee and member of its Audit Committee and
Nominating Committee.
FERDINAND SADELI
Executive Director and Chief Financial Offi cer
Mr. Ferdinand Sadeli, aged 41, was appointed as Director and Chief Financial Offi cer in April 2012 after joining SML
as the Chief Investment Offi cer. His last re-election as a Director was in 2013. He graduated from Trisakti University,
Jakarta, Indonesia with a Bachelor of Economics majoring in Accounting in 1996 and the University of Melbourne,
Australia with a Master of Applied Finance in 1999. He is a Chartered Financial Analyst (CFA) charterholder, CPA
(Australia) holder and Financial Risk Manager (FRM) holder.
Mr. Sadeli has more than 19 years of combined working experience in several different roles (auditor, accountant,
business valuer, merger & acquisition consultant, CFO and banker) within multinational and public listed companies
in Indonesia, Singapore and Australia. Prior to joining SML, Mr. Sadeli was a Director of the Investment Bank
Division in PT Barclays Capital Securities Indonesia from October 2010 to January 2012. Mr. Sadeli joined PT
Bakrieland Development Tbk as a Finance Director in July 2007 before he left in October 2010. He previously
worked for 11 years in Ernst & Young, Jakarta and Sydney Offi ces with his last position as a Senior Manager.
Mr. Sadeli was the President of CPA Australia – Indonesia Offi ce from 2009 to 2012 and served as a member
of the International Board of CPA Australia from 2013 to 2014.
Mr. Sadeli is a member of SML’s Executive/Board Committee. He is also a member of the Boards of several
subsidiaries of SML.
Sinarmas Land Limited Annual Report 201412 13Board of Directors

Corporate Governance Report
Sinarmas Land Limited (the “Company” or “SML”) and its subsidiaries (“Group”) remains committed to observing high standards
of corporate governance, to promote corporate transparency and to enhance shareholder value. The Company has complied
substantively with the principles and guidelines set out in the Code of Corporate Governance 2012 (“2012 Code”) through effective
self-regulatory corporate practices.
This report sets out the Company’s corporate governance processes and activities with specifi c reference to the guidelines
of the 2012 Code, and provides explanation for deviations. For easy reference, the principles of the 2012 Code are set out
in italics in this report.
A. BOARD MATTERS
PRINCIPLE 1:
The Board’s Conduct of Affairs
Every company should be headed by an effective Board to lead and control the company. The Board is collectively responsible for
the long-term success of the company. The Board works with Management to achieve this objective and Management remains
accountable to the Board.
1.1 The Board’s Role
The primary function of the Board of Directors of the Company (“Board”) is to provide effective leadership and direction to
enhance the long-term value of the Group to its shareholders and other stakeholders. The Board has overall responsibility to fulfi l
its role which includes the following:-
(a) ensuring that the long-term interests of the shareholders are being served and safeguarding the Company’s assets;
(b) assessing major risk factors relating to the Company and its performance, and reviewing measures, including internal
controls, to address and mitigate such risks;
(c) reviewing and approving Management’s strategic and business plans, including developing a depth of knowledge of the
business being served, understanding and questioning the assumptions upon which plans are based, and reaching an
independent judgement as to the probability that the plans can be realised;
(d) monitoring the performance of Management against plans and goals;
(e) reviewing and approving signifi cant corporate actions and major transactions;
(f) assessing the effectiveness of the Board;
(g) ensuring ethical behaviour (including ethical standards) and compliance with laws and regulations, auditing and
accounting principles, and the Company’s own governing documents;
(h) identifying key stakeholder groups and recognise that their perceptions affect the Company’s reputation;
(i) considering sustainability issues, e.g. environmental and social factors, as part of its strategic formulation; and
(j) performing such other functions as are prescribed by law, or assigned to the Board in the Company’s
governing documents.
1.2 Independent Judgement
All Directors are expected to fulfi l their duty to objectively take decisions in the interests of the Company.
The Board currently consists of 8 members, as shown below together with their membership on the Board committees of the
Company (“Board Committee”):-
Name Board Appointment Board Committee Appointment
Franky Oesman Widjaja Executive, non-independent Director Member of NC and BC
Muktar Widjaja Executive, non-independent Director Member of BC
Margaretha Natalia Widjaja Executive, non-independent Director Member of BC
Ferdinand Sadeli Executive, non-independent Director Member of BC
Robin Ng Cheng Jiet Executive, non-independent Director Member of BC
Foo Meng Kee Non-executive, independent Director Chairman of AC and NC, Member of RC
Kunihiko Naito Non-executive, independent Director Member of AC and RC
Rodolfo Castillo Balmater Non-executive, independent Director Chairman of RC, Member of AC and NC
Abbreviation:-
NC: Nominating Committee
RC: Remuneration Committee
AC: Audit Committee
BC: Executive/Board Committee
There are 5 executive Directors and 3 non-executive and independent Directors. Independent Directors make up more than
one-third of the composition of the Board, thereby providing a strong and independent element on the Board. This is
fundamental to good corporate governance as it facilitates the exercise of independent and objective judgement on corporate
affairs. It also ensures discussion and review of key issues and strategies in a critical yet constructive manner.
1.3 Delegation by the Board
To assist the Board, the Board has delegated certain functions to the 4 Board Committees, namely, the AC, the NC, the RC
and the BC, at the same time recognizing that the ultimate responsibility on all matters rest with the Board. Each of these Board
Committees has its own written terms of reference. Please refer to pages 19 to 25 of this report for further information on these
Board Committees.
1.4 Key Features of Board Processes
To facilitate Directors’ attendance at meetings, the dates of Board, Board Committee meetings and annual general meeting
together with agenda items are scheduled up to one year in advance, with Directors meeting each quarter. In addition to the
regular scheduled meetings, ad-hoc meetings are held whenever circumstances require. Besides physical meetings, the Board
and Board Committees may also make decisions by way of circular resolutions under the Company’s Articles of Association and
their respective terms of reference.
Board meetings are conducted in Singapore or overseas where participation by Board members by means of teleconference
or similar communication equipment is permitted under the Company’s Articles of Association. In 2014, the Board and Board
Committees held a total of 15 meetings, with the year-end meeting focusing on annual budget and strategic issues. In addition
to the scheduled meetings, the non-executive independent Directors held 1 ad-hoc meeting during 2014.
In addition to the annual general meeting, the Board convened an extraordinary general meeting during 2014.
Sinarmas Land Limited Annual Report 201414 15Corporate Governance Report

Corporate Governance Report
1.5 Attendance at Board and Board Committee Meetings in 2014
Details on the number of Board and Board Committee meetings in 2014, and the attendance of Directors and Board Committee
members respectively at those meetings are disclosed below:-
No. of Meetings Attended by Members
Name Board MeetingsAudit Committee
Meetings
Nominating Committee Meetings
Remuneration Committee Meetings
Total Attendance at Meetings
EXECUTIVE DIRECTORS
Franky Oesman Widjaja 5 – 1 – 6/6
Muktar Widjaja 5 – – – 5/5
Margaretha Natalia Widjaja 5 – – – 5/5
Ferdinand Sadeli 5 – – – 5/5
Robin Ng Cheng Jiet 5 – – – 5/5
NON-EXECUTIVE INDEPENDENT DIRECTORS
Foo Meng Kee 5 6 1 3 15/15
Kunihiko Naito 5 6 – 3 14/14
Rodolfo Castillo Balmater 5 6 1 3 15/15
Number of Meetings Held 5 6 1 3 15
1.6 Matters Requiring Board Approval
Matters specifi cally requiring the Board’s approval are set out in the Company’s Internal Guidelines, which include the following
corporate events and actions:-
• approval of results announcements
• approval of the annual report and fi nancial statements
• dividend declaration/proposal
• convening of shareholders’ meetings
• shares issuance
• material acquisitions and disposals of assets
• annual budgets
• interested person transactions
• corporate governance
1.7 Board Orientation and Training for New Directors
Procedures are in place whereby newly appointed Directors are provided with a formal appointment letter setting out the terms of
appointment, duties and obligations. They are also given the relevant governing documents of the Company and contact particulars
of senior Management. Those who do not have prior experience as a director of a Singapore listed company are required to
undergo externally conducted training on their roles and responsibilities as a director of a listed company in Singapore.
Newly appointed non-executive Directors who are not familiar with the Group’s business, may, upon recommendation of
the Chairman or the NC, be provided with orientation through overseas trips to familiarise them with the Group’s operations.
Management will also brief new Directors on the Group’s business, as well as governance practices.
1.8 2014 Director Training Programme
The NC reviews and makes recommendations on Directors’ training which are arranged and funded by the Company. The
Company has an annual training budget to fund any Director’s participation/attendance at seminars and training programmes
that are relevant to his/her duties as a Director.
In conformity with the framework for Directors’ Training as approved by the Board, the 2014 Director Training Programme
provided a 3-step approach to training as follows, through:-
(1) Externally conducted courses on Board and audit/fi nancial reporting matters, and investor and media relations
(2) Quarterly management updates on operations, industry specifi c trends and development
(3) Quarterly continuing education on regulatory changes and updates, which includes briefi ngs to AC members on changes
to accounting standards and issues
Directors having attended external courses/seminars, in turn shared their experience and knowledge with fellow Directors.
During 2014, our non-executive independent Directors, accompanied by Management, familiarized themselves with the Group’s
operations in Batam, Indonesia.
PRINCIPLE 2:
Board Composition and Guidance
There should be a strong and independent element on the Board, which is able to exercise objective judgement on corporate affairs
independently, in particular, from Management and 10% shareholders. No individual or small group of individuals should be allowed
to dominate the Board’s decision making.
2.1 Board Size and Composition
Each year, the Board examines its size, composition, skills and core competencies of its members to ensure an appropriate
balance of skills and experience. The Board comprise Directors from different industries, with vast experience and knowledge
who, collectively as a group, provide the core competencies for the leadership of the Company.
Taking into account the scope and nature of operations of the Group, the Board considers that the current board size of
8 Directors is appropriate to facilitate effective decision making.
Please refer to pages 10 to 13 of this Annual Report for key information, including qualifi cations, on the Directors of
the Company.
2.2 Directors’ Independence Review
The NC/Board has considered that the following Directors are regarded as independent Directors of the Company:-
Mr. Foo Meng Kee
Mr. Kunihiko Naito
Mr. Rodolfo Castillo Balmater
The ensuing paragraphs set out the criteria for independence and processes to determine a Director’s independence.
The Board has adopted guidelines set out in the 2012 Code on relationships the existence of which, would deem a Director not
to be independent. A Director who has no relationship with the Company, its related corporations, offi cers or its shareholders
with shareholdings of 10% or more in the voting shares of the Company, that could interfere, or be reasonably perceived to
interfere, with the exercise of the Director’s independent business judgement in the best interests of the Company, is considered
to be independent.
The NC is tasked to determine on an annual basis and, as and when the circumstances require, whether or not a Director is
independent, bearing in mind the 2012 Code and any other salient factor which would render a Director to be deemed not
independent. In addition, consideration is given to Guideline 2.4 of the 2012 Code which requires that the independence of
any Director who has served on the Board beyond nine years, be subject to particularly rigorous review. For the purpose of
determining independence, each Director is required to complete a checklist, at the time of appointment and annually, based on
these guidelines.
Sinarmas Land Limited Annual Report 201416 17Corporate Governance Report

Corporate Governance Report
The Board recognizes that independent Directors may over time develop signifi cant insights in the Group’s business and
operations, and can continue to provide signifi cant and valuable contribution objectively to the Board as a whole. Where there
are such Directors serving as an independent Director for more than nine years, the Board will do a rigorous review of their
continuing contribution and independence. Mr. Foo Meng Kee and Mr. Rodolfo Castillo Balmater have served on the Board as
non-executive independent Directors for more than nine years.
During its review, the NC considered that Mr. Foo has continued to exhibit a strong spirit of professionalism and demonstrated
independent mindedness and conduct at Board and Board Committee meetings. He has been consistent in the diligent
discharge of his duties and exercise of sound independent business judgement and objectivity throughout which did not diminish
with time.
During its review, the NC considered that Mr. Balmater has demonstrated independent judgement and objective evaluation in the
discharge of his duties as a Director of the Company, which did not diminish with time.
After taking into account these factors, the NC’s views and having weighed the need for Board’s refreshment against tenure,
the Board has determined that Mr. Foo Meng Kee and Mr. Rodolfo Castillo Balmater continue to be regarded as independent
Directors of the Company, notwithstanding having served more than nine years.
Each independent Director has abstained from the NC/Board’s determination of his independence.
2.3 Non-executive Directors
Non-executive Directors are encouraged, in line with corporate governance practice, to constructively challenge and help
develop proposals on strategy; to review the performance of Management in meeting agreed goals and objectives; to monitor
the reporting of performance; and to meet regularly without the presence of Management.
The non-executive independent Directors, including the lead independent Director, meet at least annually without the presence
of other executive Directors and Management.
PRINCIPLE 3:
Chairman and Chief Executive Offi cer
There should be a clear division of responsibilities between the leadership of the Board and the executives responsible for managing
the company’s business. No one individual should represent a considerable concentration of power.
3.1 Chairman and CEO
Our Executive Chairman is Mr. Franky Oesman Widjaja, and our Chief Executive Offi cer (“CEO”) is Mr. Muktar Widjaja. Mr. Franky
Oesman Widjaja and Mr. Muktar Widjaja are brothers. We believe that the independent Directors have demonstrated a high
commitment in their roles as Directors and have ensured that there is a good balance of power and authority. In view that the
Executive Chairman and CEO are immediate family members, the AC chairman acts as the lead independent Director, who is
contactable by shareholders with concerns when contact through the normal channels has failed to resolve or is inappropriate.
The Executive Chairman presides over Board meetings and ensures proper procedure is adhered to in the decision-making
process. He is responsible for:-
(a) leading the Board to ensure its effectiveness on all aspects of its role;
(b) setting the agenda and ensuring that adequate time is available for discussion of all agenda items, in particular
strategic issues;
(c) ensuring that the Directors receive complete, adequate and timely information;
(d) ensuring effective communication with shareholders;
(e) encouraging constructive relations within the Board and between the Board and Management;
(f) facilitating the effective contribution of non-executive Directors in particular; and
(g) promoting high standards of corporate governance.
3.2 Executive/Board Committee Composition and Role
The Board has established the BC to supervise the management of the business and affairs of SML. The BC assists the Board in
the discharge of its duties by, inter alia, approving the opening, closing of banking accounts and acceptance of banking facilities
up to certain limits. The BC comprises the following 5 Directors:-
Group A
Franky Oesman Widjaja
Muktar Widjaja
Margaretha Natalia Widjaja
Group B
Ferdinand Sadeli
Robin Ng Cheng Jiet
Circular resolutions of the BC are effective if signed by any 2 Directors from Group A jointly with the 2 Directors from Group B.
PRINCIPLE 4:
Board Membership
There should be a formal and transparent process for the appointment and re-appointment of directors to the Board.
4.1 Nominating Committee Composition and Role
The NC comprises the following 3 Directors, 2 of whom, including the NC chairman, are non-executive and independent Directors:-
Foo Meng Kee (NC Chairman)
Rodolfo Castillo Balmater
Franky Oesman Widjaja
The NC’s roles and responsibilities are described in its terms of reference.
The NC is primarily responsible for:-
(a) identifying and nominating for the approval of the Board, all Board appointments including candidates to fi ll Board
vacancies as and when they arise;
(b) reviewing the independence element on the Board annually; and
(c) deciding how the Board’s performance may be evaluated.
The NC is also responsible for making recommendations to the Board:-
(a) as regards the re-appointment, re-election and re-nomination of any Director;
(b) concerning the Board having a strong and independent element;
(c) concerning the re-appointment of any Director having multiple board representations;
(d) concerning the Board’s performance criteria;
(e) regarding training and professional development programmes for Board members; and
(f) concerning any matters relating to the continuation in offi ce as a Director of any Director at any time.
Sinarmas Land Limited Annual Report 201418 19Corporate Governance Report

Corporate Governance Report
4.2 Process for Selection and Appointment, Re-appointment of Directors
All new Board appointments are considered, reviewed and recommended by the NC fi rst, before being brought up to the Board
for approval. Potential candidates to fi ll casual vacancies or as an additional director are sourced with recommendations from
Directors, Management or external consultants. The NC then evaluates the suitability of potential candidates for the position
taking into account, inter alia, his/her knowledge, skills, experience and ability to contribute to the Board’s effectiveness. Upon
the NC’s recommendation, the Board approves the new appointment. In the event that the membership of the NC falls below
the minimum number of 3 members, the NC shall be dissolved, and any new nominations are channeled directly to the Board for
approval after which the NC is reconstituted with the requisite number of members.
Pursuant to the Articles of Association, save for the position of Executive Chairman, all Directors are to submit themselves for
re-election at regular intervals. In particular, one-third of the Directors retire from offi ce by rotation at the annual general meeting
(“AGM”), and newly appointed Directors must submit themselves for re-election at the AGM immediately following his/her
appointment. Under the Companies Act, Cap. 50, the offi ce of a director of the Company shall become vacant at the conclusion
of the AGM commencing next after the director attains the age of 70 years, and he shall be subject to yearly re-appointment.
The Board is satisfi ed with the current practice.
In its deliberation on the re-election / re-appointment of retiring Directors, the NC takes into consideration the Director’s
contribution and performance during the year. Mr. Muktar Widjaja and Mr. Ferdinand Sadeli retire from offi ce by rotation at the
forthcoming AGM under Article 91 of the Articles of Association and, being eligible, have offered themselves for re-election.
The NC has recommended their re-election at the forthcoming AGM.
Mr. Kunihiko Naito retires at the forthcoming AGM under Section 153 of the Companies Act, Cap. 50 and, being eligible,
has offered himself for re-appointment. The NC has recommended the re-appointment of Mr. Kunihiko Naito at the
forthcoming AGM.
4.3 Directors’ Time Commitments and Multiple Directorships
The Board believes that each Director, when accepting new appointments or who already sit on multiple boards, has the
individual responsibility to ensure that he/she can allocate suffi cient time and attention to the affairs of each company.
The Board is of the view that setting a numerical limit on the number of listed company directorships a Director may hold is
arbitrary, given that time requirements for each person vary, and therefore prefers not to be prescriptive. As a safeguard, the
NC reviews each Director’s ability to devote suffi cient time and attention to the affairs of the Company during the NC’s annual
assessment process.
PRINCIPLE 5:
Board Performance
There should be a formal annual assessment of the effectiveness of the Board as a whole and its board committees and the
contribution by each director to the effectiveness of the Board.
5.1 Board Evaluation Process
The NC is tasked to carry out the processes as implemented by the Board for assessing the effectiveness of the Board as a
whole, and the contribution by each individual Director to the effectiveness of the Board on an annual basis.
The Company has in place a system to assess the effectiveness/performance of the Board and acts, where appropriate, on
feedback from Board members, on improvements.
During the annual evaluation process, each Director is required to complete the respective forms for self-assessment as well as
for assessment of the performance of the Board, based on pre-determined approved performance criteria.
The Board considers the current assessment of the Board and individual Director as being suffi cient for the Company, rather
than excessive if additional assessments of 4 Board Committees and Chairman are introduced.
PRINCIPLE 6:
Access to Information
In order to fulfi l their responsibilities, Directors should be provided with complete, adequate and timely information prior to Board
meetings and on an on-going basis so as to enable them to make informed decisions to discharge their duties and responsibilities.
6.1 Complete, Adequate and Timely Information
In order to ensure that the Board is able to fulfi l its responsibilities, Management provides the Board with complete and adequate
information in a timely manner. Such information extends to documents on matters to be brought up at Board meetings, which,
as a standard procedure, are circulated to Board members in advance for their review and consideration. Senior Management
and other professionals who can provide additional insights into the matters to be discussed at Board meetings, are also
invited to attend these meetings, where necessary. As Directors may have further queries on the information provided, they
have separate and independent access to the Company’s senior Management who accordingly addresses individual Director’s
request for additional information/documents.
Management provides the Board with fi nancial statements and management reports of the Group on a quarterly basis, and upon
request as and when required. Explanations are given by Management for material variance (if any) between the projections in
the budget and actual results.
6.2 Company Secretary
The Directors may separately and independently contact the company secretary who attends and prepares minutes for all Board
meetings. The company secretary’s role is defi ned which include responsibility for ensuring that board procedures are followed
and that applicable rules and regulations are complied with.
The appointment and the removal of the company secretary are matters requiring Board approval.
6.3 Independent Professional Advice
The process is in place whereby Directors, either individually or as a group, in the furtherance of their duties, require professional
advice, the company secretary can assist them in obtaining independent professional advice, at the Company’s expense.
B. REMUNERATION MATTERS
PRINCIPLE 7:
Procedures for Developing Remuneration Policies
There should be a formal and transparent procedure for developing policy on executive remuneration and for fi xing the remuneration
packages of individual directors. No director should be involved in deciding his own remuneration.
7.1 Remuneration Committee Composition and Role
The RC comprises the following 3 Directors, all of whom, including the RC chairman, are non-executive and independent Directors:-
Rodolfo Castillo Balmater (RC Chairman)
Foo Meng Kee
Kunihiko Naito
The RC has written terms of reference that describes its roles and responsibilities.
The duties of the RC include reviewing and recommending to the Board for approval, the following:-
(a) a general framework of remuneration for the Board and key management personnel;
(b) the specifi c remuneration packages for each Director and key management personnel; and
(c) the Company’s obligations arising in the event of termination of executive Directors and key management personnel’s
contracts of service, to ensure that such contracts of service contain fair and reasonable termination clauses which are not
overly generous.
Sinarmas Land Limited Annual Report 201420 21Corporate Governance Report

Corporate Governance Report
The RC may, during its annual review of remuneration of Directors and key management personnel, seek advice from external
remuneration consultants as and when it deems necessary.
None of the members of the RC is involved in deliberations in respect of any remuneration, compensation, incentives or any form
of benefi ts to be granted to him.
PRINCIPLE 8:
Level and Mix of Remuneration
The level and structure of remuneration should be aligned with the long-term interest and risk policies of the company, and should
be appropriate to attract, retain and motivate (a) the directors to provide good stewardship of the company, and (b) key management
personnel to successfully manage the company. However, companies should avoid paying more than is necessary for this purpose.
8.1 Remuneration of Executive Directors and Key Management Personnel
In designing the compensation structure, the Company seeks to ensure that the level and mix of remuneration is competitive,
relevant and appropriate.
The remuneration structure for executive Directors and key management personnel consists of (a) fi xed remuneration, (b) variable
bonus and/or (c) other benefi ts.
8.1.1 The use and application of clawback provisions in remuneration contracts of executive directors and key management personnel
is subject to further consideration by the Company.
8.2 Remuneration of Non-Executive Directors
Non-executive independent Directors receive Directors’ fees, which are subject to shareholders’ approval at AGMs.
PRINCIPLE 9:
Disclosure of Remuneration
Every company should provide clear disclosure of its remuneration policies, level and mix of remuneration, and the procedure for
setting remuneration, in the company’s Annual Report. It should provide disclosure in relation to its remuneration policies to enable
investors to understand the link between remuneration paid to directors and key management personnel, and performance.
9.1 Directors’ Remuneration
The Directors’ remuneration for the year ended 31 December 2014 in bands of S$250,000 is set out in the table below :-
Name of Directors Fixed Salary Bonus/ Benefi t Directors’ Fees Total
S$4,750,000 to S$5,000,000
Muktar Widjaja 13.9% 86.1% – 100%
S$2,500,000 to S$2,750,000
Franky Oesman Widjaja 5.3% 94.7% – 100%
S$1,750,000 to S$2,000,000
Margaretha Natalia Widjaja 13.6% 86.4% – 100%
S$250,000 to S$500,000
Ferdinand Sadeli 92.2% 7.8% – 100%
Robin Ng Cheng Jiet 73.0% 27.0% – 100%
Below S$250,000
Foo Meng Kee – – 100% 100%
Kunihiko Naito – – 100% 100%
Rodolfo Castillo Balmater – – 100% 100%
Variable bonus is based on performance in the same fi nancial year.
The Company believes that the current format of disclosure is suffi cient indication, for the time being, of each Director’s
remuneration package, given that remuneration continues to be a sensitive subject.
9.2 Remuneration of Top 5 Key Management Personnel
The top 5 key management personnel who are not directors of the Company (“KMP”) for the year ended 31 December 2014 and
their remuneration falling in bands of S$250,000 are as follows:-
Ridwan Darmali
Michael JP Widjaja
Lie Jani Harjanto
Teky Mailoa
Monik William
KMPs’ Remuneration Band Number of KMP
S$500,000 to S$750,000 1
S$250,000 to S$500,000 4
The total remuneration paid to the top 5 KMP for the year ended 31 December 2014 amounted to S$2,196,897.
The Company believes that it is not in the Group’s interest to disclose the remuneration of the KMPs to the full extent
recommended, due to continuing sensitivity and confi dentiality of executives’ remuneration and, moreover, such disclosure
may hamper its ability to retain the Group’s talent pool in a competitive environment.
9.3 Remuneration of Employees who are Immediate Family Members of a Director/CEO
The remuneration of employees who are immediate family members of a Director or the CEO, and whose remuneration exceeds
S$50,000 for the year ended 31 December 2014, being two, the immediate family members of the CEO and an executive
Director, are as follows:-
Remuneration Band Fixed Salary Bonus/ Benefi t Total
S$500,000 to S$750,000 94.9% 5.1% 100%
Below S$250,000 90.5% 9.5% 100%
Mr. Franky Oesman Widjaja and Mr. Muktar Widjaja are brothers, and Ms. Margaretha Natalia Widjaja is the daughter of
Mr. Muktar Widjaja and a niece of Mr. Franky Oesman Widjaja. Other than disclosed above, none of the Directors had immediate
family members who were employees and whose remuneration exceeded S$50,000 for the year ended 31 December 2014.
The Company believes that the current format is suffi cient indication, for the time being, of the relatives.
9.4 Long-term Incentive Scheme
Currently, the Company does not have any long-term incentive schemes, including share schemes.
Sinarmas Land Limited Annual Report 201422 23Corporate Governance Report

Corporate Governance Report
C. ACCOUNTABILITY AND AUDIT
PRINCIPLE 10:
Accountability
The Board should present a balanced and understandable assessment of the company’s performance, position and prospects.
10.1 Accountability
The Board reviews and approves the results announcements before its release. In presenting the annual and quarterly
fi nancial statements to shareholders, the Board aims to provide shareholders with a balanced and clear assessment of SML’s
performance, position and prospects.
For the fi nancial year under review, the CEO and the Chief Financial Offi cer (“CFO”) have provided assurance to the Board on the
integrity of the fi nancial statements of SML and its subsidiaries. For interim fi nancial statements, the Board provided a negative
assurance confi rmation to shareholders.
PRINCIPLE 13:
Internal Audit
The company should establish an effective internal audit function that is adequately resourced and independent of the activities
it audits.
13.1 Internal Audit
The Company has established an in-house internal audit function. The role of the internal auditors is to assist the AC to ensure
that the Company maintains a sound system of internal controls.
The Chief Internal Auditor (“CIA”) reports to the AC chairman. On administrative matters, the CIA reports to the Executive
Chairman. The CIA has met the standards set by nationally or internationally recognized professional bodies including the
Standards for the Professional Practice of Internal Auditing set by the Institute of Internal Auditors.
The AC approves the hiring and removal of the CIA and ensures that the internal audit function is adequately staffed and has
appropriate standing within the Company. It also ensures the adequacy and effectiveness of the internal audit function.
The annual internal audit plan is established in consultation with, but independent of, Management, and is reviewed and
approved by the AC. Every quarter, the AC and Management review and discuss internal audit fi ndings, recommendations and
status of remediation, at AC meetings.
The internal auditors have unfettered access to the Group’s documents, records, properties and personnel, including access to
the AC.
PRINCIPLE 12:
Audit Committee
The Board should establish an Audit Committee with written terms of reference which clearly set out its authority and duties.
12.1 Audit Committee Composition and Role
The AC comprises the following 3 Directors, all of whom, including the AC chairman, are non-executive independent Directors:-
Foo Meng Kee (AC Chairman)
Rodolfo Castillo Balmater
Kunihiko Naito
The Board considers that the members of the AC are appropriately qualifi ed to discharge the responsibilities of the AC.
The AC’s roles and responsibilities are described in its terms of reference.
The AC has the explicit authority to investigate any matter within its terms of reference. In addition, the AC has full access to
and co-operation of Management and full discretion to invite any Director or executive offi cer to attend its meetings. Reasonable
resources are made available to enable the AC to discharge its functions properly.
In addition to its statutory functions, the AC considers and reviews any other matters as may be agreed to by the AC and the
Board. In particular, the duties of the AC include:-
(a) Reviewing signifi cant fi nancial reporting issues and judgements so as to ensure the integrity of the fi nancial statements of
the Group and any formal announcements relating to the Group’s fi nancial performance.
(b) Reviewing and reporting to the Board at least annually the adequacy and effectiveness of the Group’s internal controls,
including fi nancial, operational, compliance and information technology controls (such review can be carried out internally
or with the assistance of any competent third parties).
(c) Reviewing the effectiveness of the Group’s internal audit function.
(d) Reviewing the scope and results of the external audit, and the independence and objectivity of the external auditors.
(e) Making recommendations to the Board on the proposals to the shareholders on appointment, re-appointment and
removal of the external auditors, and approving the remuneration and terms of engagement of the external auditors.
The AC reviews with Management, and where relevant, the auditors, the results announcements, annual reports and fi nancial
statements, interested person transactions and corporate governance, before submission to the Board for approval or adoption.
In performing its functions, the AC meets with the internal and external auditors, and reviews the audit plans and overall scope of
both internal and external audits, and the co-operation and assistance given by Management to the respective auditors. Where
necessary, the AC also meets separately with the internal and external auditors whereby any issues may be raised directly to the
AC, without the presence of Management. The internal and external auditors have unfettered access to the AC.
12.2 Auditor Independence
The AC reviews the independence of the external auditors. During the process, the AC also reviews all non-audit services
provided by the external auditors to satisfy itself that the nature and extent of such non-audit services would not affect their
independence. The AC confi rms that after reviewing all non-audit services, if any, by the external auditors during the fi nancial
year, they would not, in the AC’s opinion, affect the external auditors’ independence. The AC has recommended to the Board
that the external auditors be re-appointed for the ensuing year subject to shareholders’ approval at the forthcoming AGM.
In appointing the audit fi rms for the Group, the AC is satisfi ed that the Company has complied with Rules 712 and 715 of the
listing manual (“Listing Manual”) of the Singapore Exchange Securities Trading Limited (“SGX-ST”).
12.3 Whistle Blowing Procedures
The Board is committed to uphold the Company’s values and standards, and has put in place arrangements by which
employees may, in confi dence and without fear of retaliation, bring to the AC’s attention, concerns about possible improprieties
in matters of fi nancial reporting or other matters.
12.4 Annual Confi rmation on Procedures relating to Rights of First Refusal (“ROFR”)
In accordance with paragraph 4.2 of the circular dated 12 November 2014 (“Circular”) to shareholders of the Company, the
Audit Committee confi rms that no ROFR (details of which are set out in the Circular) has been granted to and/or exercised by
Bund Center Investment Ltd and the Company during the period from 28 November 2014 to 31 December 2014.
Sinarmas Land Limited Annual Report 201424 25Corporate Governance Report

Corporate Governance Report
PRINCIPLE 11:
Risk Management and Internal Controls
The Board is responsible for the governance of risk. The Board should ensure that Management maintains a sound system of risk
management and internal controls to safeguard shareholders’ interests and the company’s assets, and should determine the nature
and extent of the signifi cant risks which the Board is willing to take in achieving its strategic objectives.
11.1 Responsibilities for Risk Management and Internal Controls
The Board, with assistance from the AC, is responsible for the governance of risk by ensuring that Management maintains
a sound system of risk management and internal controls to safeguard shareholders’ interests and the Group’s assets, and
determines the nature and extent of the signifi cant risks which the Board is willing to take in achieving strategic objectives.
11.2 Enterprise Risk Management Processes
The Company has formally established an independent Enterprise Risk Management (“ERM”) function within the Group,
supported by risk champions across all divisions within the Group to assist in ERM implementation within their respective
divisions. The ERM framework implemented by the Group aligns with International Standard for Risk Management, which include
ISO 31000, COSO Enterprise Risk Management Framework and the 2012 Code.
The 3 key components of ERM framework is diagrammatically represented below:-
EnterpriseRisk Management
Framework
Risk Asse
ssm
ent
Ris
k G
ove
rnance
Risk Monitoringand Reporting
• Risk Governance, the backbone to a robust risk management framework, sets out the risk management strategy,
objectives, roles and responsibilities for implementing ERM. It also establishes and communicates clear roles and
responsibilities to support effective functioning of the ERM structure. The Group has also implemented specifi c key
performance indicator (KPI) to measure contribution of all relevant parties in ERM implementation.
• Risk Assessment, an objective evaluation of events that may prevent the Group from achieving its strategic objectives,
involves establishing the risk appetite/parameters, assigning resources and implementing risk management processes,
tools and systems to manage identifi ed risks within acceptable level. The ERM function facilitates assessment of key risks
and controls on a regular basis so as to defi ne the risk levels and necessary actions needed to manage such risks.
• Risk Monitoring and Reporting provides the platform for reporting risks, controls and early warning signals on a regular
basis, and to monitor the effectiveness of existing controls. The ERM function actively monitors the Group’s risk profi le,
effectiveness of key controls and outstanding action plans using the ERM reporting platform, and in certain situations,
proactively facilitates the development or implementation of mitigation measures (eg, when the impact of the risk is
considered high). With regards to early warning signals, the ERM function has identifi ed and monitors various internal and
external parameters as key risk indicators.
The ERM framework covers various risk categories as described below:-
• Financial risks: In relation to management of fi nancial risks which the Group is exposed to, including interest rate, foreign
currency, price and liquidity risks, our approach to these risks are as follows:-
– Interest rate risk: assess the Group’s exposure to interest-bearing fi nancial instrument and perform sensitivity
analysis
– Foreign currency risk: construct natural hedges where it matches revenue and expense in single currency
– Price risk: the Group monitors the market closely to ensure that risk exposure to volatility of investments is kept to
a minimum
– Liquidity risk: the Group maintains a level of cash and cash equivalents and funding facilities deemed adequate by
Management to fi nance its operations
• Operational risks: The Group manages operational risks related to key business activities (e.g. business development
process, land acquisition process, project development planning and construction process) and support activities
(e.g. human capital process, fi nance process, IT process). The risks relevant to these key processes are managed by
all respective risk owners following ERM framework and re-assessed annually.
• Compliance risks: The Group manages compliance requirements by establishing close relationships with relevant
regulators and associations to monitor the development of compliance requirements.
• Strategic risks: The Group manages strategic risk by providing regular market and competitor information to relevant
Group divisions so they can make necessary alignment to the respective business plan. Signifi cant changes in market or
regulatory conditions that may post material impact on the achievement of corporate strategy are tabled in management
forum to defi ne necessary actions.
The Board recognizes that risk is dynamic, thus ERM implementation requires continuous effort to improve its quality
and coverage.
11.3 Assurance from the CEO and CFO
The Board has received written assurance from the CEO and the CFO that the fi nancial records of the Group for the fi nancial
year ended 31 December 2014 have been properly maintained and the fi nancial statements give a true and fair view of the
Group’s operations and fi nances in accordance with the applicable fi nancial reporting framework and are free from material
misstatements, and the risk management and internal control systems of the Group are generally effective.
The CEO and CFO have in turn obtained similar assurance from the business heads in the Group.
11.4 Opinion on Adequacy and Effectiveness of Internal Control and Risk Management Systems
The AC is responsible for making the necessary recommendations to the Board such that the Board may make an opinion
regarding the adequacy and effectiveness of the risk management and internal control systems of the Group. In this regard, the
AC is assisted by external auditors, internal auditors and the ERM committee (“ERMC”).
The Board is satisfi ed that there is appropriate and adequate review by the AC of the adequacy of the Company’s internal
fi nancial controls, operational and compliance controls, and risk management policies and systems established by Management.
In its review, the AC had been assisted by both the external auditors and the internal auditors, and this review is conducted at
least once every year.
During the course of the audit, the external auditors carried out a review of the effectiveness of the Group’s material internal
controls, including fi nancial, operational, compliance and information technology controls to the extent of their scope as laid
out in their audit plan. Material non-compliance and internal control weaknesses noted during the audit are reported to the AC
together with the recommendations of the external auditors.
Sinarmas Land Limited Annual Report 201426 27Corporate Governance Report

Corporate Governance Report
In addition, based on the ERM framework established and maintained, the work performed by the ERMC and the internal
audit function as well as the assurance received from the CEO and CFO, the Board with the concurrence of the AC, is of the
opinion that the Group’s internal controls including fi nancial, operational, compliance and information technology controls,
and risks management systems, were adequate as at 31 December 2014 to meet the needs of the Group in its current
business environment.
The Board notes that the Company’s system of internal controls and risk management provide reasonable, but not absolute,
assurance that the Group will not be adversely affected by any event that can be reasonably foreseen. Furthermore, the Board
also acknowledge that no system of internal controls and risk management can provide absolute assurance in this regard, or
absolute assurance against the occurrence of material errors, poor judgement in decision-making, human error, losses, fraud or
other irregularities.
D. SHAREHOLDER RIGHTS AND RESPONSIBILITIES
PRINCIPLE 14:
Shareholder Rights
Companies should treat all shareholders fairly and equitably, and should recognize, protect and facilitate the exercise of
shareholders’ rights, and continually review and update such governance arrangements.
14.1 Shareholder Rights
The Company recognizes the importance of maintaining transparency and accountability to its shareholders. The Board ensures
that the Company’s shareholders are treated equitably and their rights are protected.
The Company is committed to providing shareholders with adequate, timely and suffi cient information pertaining to the Group’s
business which could have a material impact on the Company’s share price.
All shareholders of the Company receive the annual reports and notice of general meetings. The notice of general meetings is
also advertised in the newspapers.
PRINCIPLE 15:
Communication with Shareholders
Companies should actively engage their shareholders and put in place an investor relations policy to promote regular, effective and
fair communication with shareholders.
15.1 Communication with Shareholders
Since 2003, the Company’s results are announced on a quarterly basis. The Company does not practice selective disclosure of
material information. The Company conveys material information and its quarterly fi nancial results through announcements made
via SGXNET, and is required to comply with the Listing Manual on the continuous disclosure obligations. Results announcements
and annual reports are announced or issued within the specifi ed/stipulated period.
The Company supports the 2012 Code’s principle to actively engage shareholders through regular, effective and fair
communication. To signify the Company’s commitment, a dedicated investor relations (“IR”) team was established during 2014.
Working closely with Management, the IR team develops a comprehensive IR programme to further enhance the engagement
and communications on the Company’s strategic direction, performances and developments with shareholders and the
investment community.
To keep the market and investors apprised of its corporate development and fi nancial performance, during 2014, the Company
participated in several non-deal roadshows and investor conferences and held quarterly analyst briefi ngs, and the Management
has met with over 150 potential and existing institutional investors and fi nancial analysts at investor conferences and non-deal
roadshows in Singapore, Malaysia, Hong Kong, Tokyo and London.
The Company welcomes enquires and feedback from shareholders and the investment community. Enquiries can be addressed
to the IR team at [email protected].
More on IR can be found on pages 58 to 59 of this Annual Report.
15.2 Dividend Policy
Based on Management recommendations, the Directors determine on a quarterly basis the amount, if any, of dividends to be
declared taking into account all relevant factors. Any payouts will be clearly communicated to shareholders via announcements
posted on SGXNET.
PRINCIPLE 16:
Conduct of Shareholders’ Meetings
Companies should encourage greater shareholder participation at general meetings of shareholders, and allow shareholders the
opportunity to communicate their views on various matters affecting the company.
16.1 Conduct of Shareholder Meetings
During the AGMs which are held in Singapore, shareholders are given the opportunity to air their views and to engage the
Board and Management on the Group’s business activities and fi nancial performance. Directors are encouraged to attend
shareholders’ meetings. In particular, members of the NC, AC and RC and the external auditors are asked to be present to
address questions at such meetings.
The Articles of Association allow a member of the Company to appoint one or two proxies to attend and vote instead of the
member at general meetings, if he is unable to attend in person.
At members’ meetings, each distinct issue is proposed as a separate resolution. Absentia voting methods are currently
not permitted.
With effect from the 2013 AGM, for greater transparency in the voting process, the Company has employed electronic poll voting
for all resolutions put at the AGM. Votes cast for, or against, each resolution were instantly displayed on screen. The detailed
results showing the total number of votes cast for and against each resolution were also announced after the AGM via SGXNET.
DEALINGS IN SECURITIES
The Company complies with the SGX-ST best practices on dealings in securities, and has devised and adopted its own internal
compliance code to provide guidance with regard to dealings in the Company’s securities by the Company, its Directors
and offi cers.
Dealings in the Company’s securities are prohibited during the period commencing (i) two weeks before announcement of the
Company’s fi rst, second and third quarter results and (ii) one month before the announcement of the Company’s full year results,
and ending on the date of the announcement of the results. Such dealings in the Company as well as other listed companies’
securities are also prohibited whilst in possession of unpublished material price-sensitive information in relation to those securities.
Sinarmas Land Limited Annual Report 201428 29Corporate Governance Report

REGISTERED OFFICE
108 Pasir Panjang Road
#06-00 Golden Agri Plaza
Singapore 118535
Tel: (65) 6220 7720
Fax: (65) 6590 0887
SHARE REGISTRAR AND TRANSFER OFFICE
B.A.C.S. Private Limited
63 Cantonment Road
Singapore 089758
Tel: (65) 6593 4848
Fax: (65) 6593 4847
AUDITORS
Moore Stephens LLP
Public Accountants and Chartered Accountants
10 Anson Road
#29-15 International Plaza
Singapore 079903
Tel: (65) 6221 3771
Fax: (65) 6221 3815
Partner-in-charge: Christopher Bruce Johnson
(Appointed since the fi nancial year ended 31 December 2014)
DATE AND COUNTRY OF INCORPORATION
27 January 1994, Singapore
COMPANY REGISTRATION NO.
199400619R
SHARE LISTING
The Company’s shares are listed on the
Singapore Exchange Securities Trading Limited
DATE OF LISTING
18 July 1997
Corporate Structure Corporate Directory
Simplifi ed Corporate Structure as at 31 December 2014, with main subsidiaries, directly and indirectly held by Sinarmas Land Limited
* Listed on the SGX-ST
# Listed on the Indonesia Stock Exchange
BOARD OF DIRECTORS
Franky Oesman Widjaja (Executive Chairman)
Muktar Widjaja (Chief Executive Offi cer)
Margaretha Natalia Widjaja
Ferdinand Sadeli (Chief Financial Offi cer)
Robin Ng Cheng Jiet
Foo Meng Kee
Kunihiko Naito
Rodolfo Castillo Balmater
AUDIT COMMITTEE
Foo Meng Kee (Chairman)
Kunihiko Naito
Rodolfo Castillo Balmater
NOMINATING COMMITTEE
Foo Meng Kee (Chairman)
Rodolfo Castillo Balmater
Franky Oesman Widjaja
REMUNERATION COMMITTEE
Rodolfo Castillo Balmater (Chairman)
Foo Meng Kee
Kunihiko Naito
SECRETARY
Kimberley Lye Chor Mei
SINARMAS LAND LIMITED*
INDONESIA
PT AFP Dwilestari
PT Bumi Serpong Damai Tbk#
PT Duta Pertiwi Tbk#
PT Karawang Bukit Golf
PT Karawang Tatabina Industrial Estate
PT Paraga Artamida
PT Puradelta Lestari Tbk
PT Royal Oriental
PT Sinar Mas Teladan
PT Sinar Mas Wisesa
65.00%
51.50%
45.61%
98.12%
48.77%
84.37%
49.40%
55.64%
59.35%
66.29%
UNITED KINGDOM
SML BrookEngland (HK)Limited
SML Jersey Properties PTE Limited
SML Great Pte Limited
100.00%
100.00%
100.00%
CHINA
Shining Gold Real Estate (Chengdu) Co., Ltd
Shining Gold Real Estate (Shenyang) Co., Ltd
100.00%
100.00%
SINGAPORE/MALAYSIA
Anak Bukit Resorts Sdn Bhd
AFP Gardens (Tanjong Rhu) Pte Ltd
AFP Land Limited
Golden Bay Realty (Private) Limited
Palm Resort Berhad
100.00%
100.00%
100.00%
100.00%
99.22%
Sinarmas Land Limited Annual Report 201430 31Corporate Directory

Diversification
ININIINININI TETETETET RNRNRNRNNR ATATATATIOIOIOIONANANANAL L L LLSinSinSinSinSinSinarmarmarmarmarmarmasasasasasass LanLanLanLanLanLa d hd hd hd hd hhasaas as asaas grogrogrogrogrorogrownwnwnwnwnwwn
itsitstsitsitsits popopopopoportfrtfrtfrtfrtfrtfolioliolioliololio to to to to to to to to to ttapapapapapap intintintntntinto po po po po po pprimrimirimrimrimmrime e e e e eee
comcomcomcomcomcommermermermermerrciaciaciaciaciacial pl pl p p pl proproproporopropperterterterterteertiesiesiesesiesieseses
sitsitsitsitsitts uatuatuatuatuatuated ed ed ed ed ed ininininininn LonLonLonLonLonL dondondondondond nd totototototot mememememememeet et etetet ete
thethethethethethet unununununprepreprepreprepp cedcedcedcedcedceddcedententententententn edededededede demdemdemdemdemememandandandandandandd
forforfoforforfor ofofofofofofffi cfi cfi cfi cfi cficcee se se se se se spacpacpacpacpacpacpaces.es.es.ss
Leveraging on the Group’s strong fundamentals and prudent fi nancial management, Sinarmas Land has sought to
diversify into new growth areas and expanding
our international footprint and recurring income
through new acquisitions.
ININININIININNDODODODODOONENENENENENESISISISIA AAAAAAs As AsAs As AsAs IndIndIndIndIndIndI oneoneoneoneoonnon siasiasiasiasiaasias ececececonoonoonoonoooo my my my my
conconconcononconcontintintintintintintini uesuesuesuesuesueu totototooto bebebebebebe ththththhe be be be rigrigrigght ht ht spospospospopooot t tt t
ininin in in nin ASEASEASEASEASEASEASEAN,ANANAN,AN,ANAN, SiSiSiSiSiSinarnaranarrn masmasmas LaLaLand nd nd
is isis is isisis extextextextextexextendendendendendendingingingingnngn ititittitits fs fs fffootootootoo pripriprint nt nt to to to
highighighighighigh-rh-rh-rh-rrh-rh iseiseiseisiseises prprprprprprremiememiemiemem umumum resresresideideidentintint allal
devdevdevdevevdeve eloeloeloeloeloeloopmepmepmepmepmepmm ntntnt andandandaandan bububuildildildinginging
thethethethethetheh lalalaaargergergegrg st st st sttst conconconconvenvenventiotiotion an an an nd nd nd
exhexhexexhexhexhexhibiibibibiii tiotiotiotiotiotioi n cn cn cn entententerer er e in in in IndIndIndIndoneoneonesiasiaisia..
LONDON
United Kingdom

Strength
CICITYTY & TOWWNSNNSNSNSHIHIH PP4 i4 i4 intentegragragg t dtedted tttotownswnsshiphiphiphi
ddevdev leloeloelopmepmepmepmentsntsntsnts llolololocatcatcatcatedededed inininnin keykeykeykeykey ararararareaeaeaea ea
in in GreGreateater Jr Jakaakartarta, s, spanpanninning og overe
10,0 000000 hehectactaresres cocomprmprisiisingng of of oo
resrrr ideided ntintn al,al,l coocommemmeeeercircial,al reretaita l,
offioffioffifffififiofficececececc , i, indudnduuustrstrstrsts ialiala , hh, hospospospo itaitaalitlitlitty,y,y,
heahheaheahh althltlthththcarcarcacare ae aee nd nddnd eduedududuedued catcatcatca ionionooo al aal
estestestestestststablabblablablabla ishishishshsishs memenmeennemenm tts.ts.sts.tssss
Since our inception more than 43 years ago, Sinarmas Land has grown
strength to strength through quality development,
strategic land banking, innovative design and
synergistic partnerships to become Indonesia’s
leading real estate developer.
COCCCOCOC MMMMMMMMMERERERCCCICICIALALALALAL FroFroFroFrom im im intententernarnarnatioitiotio llnalnalnal tttrtrtradedadeadeadeade cececececentrntrntrntrntreseseseses
(“I( I(( I( I( TC”TCTCTC ) t) t) t) to no no no noo new ew ew eww retretreretailailaila mamamamallslls,,,
from ccity centrt te to new satts elllliteit
towtownsns andand cicic tietieees, s, SinSinarmrmas as LanLand d
contint ueu totooo o o bebebe at at aat thethethehetheth trrendendendendsetsettertererererer
forffor thththe ie ie ndundundud strstrstststrstrry.yyyyyy
INININIININI DUDDUDUDUDUSTTSTSTSTSTRIIRIRIRIR ALALALALAL KarKarKarKarKarKarawaawaawaawaawangngngngng IntIntIntIntInternernernernernatiatiatitiationaonaonanaonal Il Il Il Il Indundundundundustrstrstrstrstrialialialialial
CitCity,y,y,y,yy,y, thetheh bebbebeest st indindinddd ttustust iriarial el el estastastas tetetete in in in n
Indndoneonen siasiaa, wwwas asasasa thethe fi fififirstrstt inindusdusdu tritrit al alalaa
estestateate inin InI dond esisesia ta tta to bo bo bo bo be ggee ranannntedtedede
ISOSO 909001:01:2002000 c0 certer ifi ficatate,e
ISOSOISO 14141 001111:202004 foro QuQuQQualialiaa ty tyyy & &&&
EnvEnvEnvEnEn iroiroirir nmenmenmen ntantantantaal MMMl Manaanaananagemgemgementententn
SysSysSysSyssSysy temtemtemtemtetemeem inininin 202020202 020202020 andandandanda OHOHHOHOO SASSASSASSASSASSSAS
11801801808018002:002:02:020020 2220020020200220022000 7 c7 c7 c7 c7 c7 c7 ertertertertee ifi ifi ifi ifiififificatcatcatcacatatcatcacaate e e ffeeee ooor ororor rr HeaHeaeaHHe lthhlththtt
& S& S& S&& S& Safefff tytyty ty ManMManManManManManMananageageagegeagageaggeag menmemenmenmenmenmenmenmenmenmmenntt Stt St St St St SSt yyysystyystyy emsmsememe .BSD CITY
Indonesia

Expertise
INNTETEGRGRATA ED TOT WNWNW SHSHIPIntn egrrateat d td ownshih p was aa
crec ated overe yeyears of mem ticulous
plap nnin ng, exe tene sive ie infrn asta ruccture
devd elopmepment, emphaphasiss onn
sececurity, conven niencee ofo vaarious u
ameamenitieses, self-sus stat inablee,
sete tinng ag a new sstanandarda d of
mododernn lil vinving.
Capitalising on Sinarmas Land’s expertise and execution capabilities, Sinarmas Land has embarked on continuous
innovation, knowledge sharing and technology
advancement to achieve greater excellence.
EXE PERIENCEEED MANAGEMEMEEENNT TEAM Sinarmas Land’ss managn ement nt
team possesses decd cadea s of
extensive businness annd indud stry
experience, fully commmitteded
to deliver the bese t rt etuurns
for sts akeholders.SINAR MAS LAND PLAZA
– BSD CITY
Indonesia

Financial Review
The Group also holds long-term
investments in commercial properties,
hotels and resorts in Singapore, Malaysia
and United Kingdom and is involved in
mixed development projects in Chengdu
and Shenyang in China.
INDONESIA PROPERTY
DIVISION
Revenue from Indonesia Property
decreased 28.4% from S$1,084.2 million
to S$776.4 million, mainly due to the
absence of S$302.2 million sales of
land parcels in BSD City to its joint
ventures with Hongkong Land and
Kompas Gramedia Group, as well as its
associated company with AEON Mall in
2013, offset by sale of a land parcel of
S$65.5 million in Kota Deltamas. The
decrease was also attributable to lesser
completed residential units recognized.
approximately 72.6% and 68.0% of
Indonesia Property Division and the
Group’s total revenue. Approximately
S$38.5 million in revenue and S$7.1 million
in net profi t attributable to Owners of the
Company (“PATMI”) were reversed out
from BSDE in the consolidated results
of the Group, due to difference in
accounting treatment of revenue
recognition of high-rise apartment
sales in BSD City.
Revenue from rental income contributes
about 8.5% to the total revenue of
Indonesia Property Division in 2014.
The 11.0% increase year-on-year was
derived mainly from offi ce units leased
at Sinar Mas Land Plaza Jakarta, a
prestigious three-tower offi ce building
strategically located in CBD Jakarta,
which continued to enjoy high average
occupancy rates of 99% (2013: 99%).
In 2014, occupancy rates of other
offi ce buildings i.e. Wisma BII Surabaya,
Wisma BII Medan and Wisma BII Jakarta,
have largely improved with average
occupancy rates of 86% (2013: 75%),
90% (2013: 90%) and 100%
(2013: 100%).
1
Nava Park,
BSD City,
Indonesia.
Joint venture
development
with Hongkong
Land.
2
AEON Mall
BSD City,
Indonesia.
First AEON
Mall in
Indonesia.
However, sales of commercial shop-
houses and sales of land for commercial
and offi ce purposes in BSD City made
higher contribution in 2014.
The Group has two subsidiaries listed
on the Indonesia Stock Exchange,
namely PT Duta Pertiwi Tbk (“DUTI”)
and PT Bumi Serpong Damai Tbk
(“BSDE”). DUTI is a pioneer in the
development of superblock and
commercial space for small and
medium-sized businesses offering strata
title ownership as well as middle-income
housing with unique themes and
concepts, while BSDE owns and
develops BSD City, one of the largest
city and township developments in
Indonesia. In 2014, revenue derived
collectively from both DUTI and BSDE
has respectively accounted for
Th e Group is a leading and most diversifi ed property developer in Indonesia, engaged
in the investment and
development of townships,
residential, commercial and
industrial properties, as well as
ownership and management
of hotels and resorts.
Gross profi t from Indonesia Property
Division decreased 23.1% from
S$742.4 million to S$571.7 million in
line with the dip in revenue. However,
gross profi t margin has increased from
68.5% in 2013 to 73.6% in 2014,
mainly due to higher average selling
prices for residential projects in
BSD City. PATMI decreased 40.9% from
S$289.0 million to S$170.8 million as
a result of lower land sales and lesser
completed residential units. Finance
costs increased 200.7% due to the
inclusion of a write-back of option
reserve of S$13.6 million in 2013 upon
the renewal and redemption of certain
convertible bonds. Excluding this
write-back, the increase in fi nance costs
is in line with higher borrowings for
business expansion.
In 2014, under the adoption of FRS 110,
the Group has re-evaluated its involvement
with investees under the new control
defi nition. Based on its assessment,
the Group is required under FRS 110 to
consolidate PT Puradelta Lestari Tbk and
its subsidiary (“PDL Group”) with effect
from April 2013. As a result, PDL Group,
INDONESIAPROPERTY
REVENUE (S$ MILLION)
FY 2014 776.4
FY 2013 1,084.1
FY 2012 559.0
GROSS PROFIT (S$ MILLION)
FY 2014 571.7
FY 2013 742.4
FY 2012 345.7
1
2
Sinarmas Land Limited Annual Report 201438 39Financial Review

Financial Review
whose main project is Kota Deltamas, the
largest integrated township development
in Bekasi Regency to the east of CBD
Jakarta, contributed S$167.7 million
(2013 restated: S$193.8 million) to the
Indonesia Property Division in 2014.
INTERNATIONAL PROPERTY
DIVISION – CHINA
Revenue decreased by S$48.0 million
or 75.0% to S$16.0 million in 2014 due
to lesser number of completed units
delivered, hence lower sales recognized,
on completed residential units in
Shenyang. In 2014, revenue was
recognized for the delivery of 130
residential units, 9 retail units and
the clubhouse, as compared to 708
residential units and 15 retail units
delivered in 2013. The construction of
Phase 3, which comprises a 168-room
hotel, 19 retail units and 84 SOHO
apartment units, has been completed in
October 2014. Overall, the earlier phases
1 and 2 are approximately 93% sold.
Gross profi t decreased 73.5% from
S$16.6 million to S$4.4 million in line
with the drop in revenue. However, gross
profi t margin improved slightly from
25.9% to 27.5% due to higher average
selling prices in 2014. PATMI decreased
86.8% from S$10.6 million to S$1.4 million.
INTERNATIONAL PROPERTY
DIVISION – AFP LAND GROUP
Revenue from this division, mainly
contributed by the AFP Land group of
companies from assets in Singapore,
Malaysia and Batam, decreased about
1.3% from S$24.1 million to S$23.8
million. The Group has 21% strata
interest in Orchard Towers, Singapore,
owns land and operates Palm Resort
Golf & Country Club in Johor, Malaysia,
as well as owns land and operates Palm
Spring Golf Club in Batam. The lower
revenue was mainly attributable to lower
hotel revenue from Le Grandeur Johor
due to lower occupancy rate in 2014.
Gross profi t declined 4.5% from
S$13.2 million to S$12.6 million, in line
with the lower revenue. Gross profi t
margin also declined from 54.5% to
52.9% due to lower average green fees
per paying golf round at Palm Resort Golf
and Country Club. Net loss attributable
to Owners of the Company widened
18.8% from S$11.2 million to S$13.3
million in 2014, mainly due to higher
unrealised foreign exchange losses from
loans taken on by Palm Resort.
INTERNATIONAL PROPERTY – CHINA
REVENUE (S$ MILLION)
FY 2014 16.0
FY 2013 64.0
FY 2012 47.6
GROSS PROFIT (S$ MILLION)
FY 2014 4.4
FY 2013 16.6
FY 2012 10.8
INTERNATIONAL PROPERTY – AFP LAND GROUP
REVENUE (S$ MILLION)
FY 2014 23.8
FY 2013 24.1
FY 2012 24.7
GROSS PROFIT (S$ MILLION)
FY 2014 12.6
FY 2013 13.2
FY 2012 13.7
INTERNATIONAL PROPERTY – UNITED KINGDOM
REVENUE (S$ MILLION)
FY 2014 12.4
FY 2013* 6.5
GROSS PROFIT (S$ MILLION)
FY 2014 9.1
FY 2013* 4.9
INTERNATIONAL PROPERTY
DIVISION – UNITED KINGDOM
Revenue improved 90.8% from
S$6.5 million to S$12.4 million as
a result of recognition of 11 months
of leasing income from New Brook
Buildings (NBB) in West End London
as compared to about 7 months of
leasing income in the previous year
as NBB was acquired in June 2013
and disposed in December 2014,
as well as about 4 months of rental
contribution from Warwick House, a
freehold property located on Great
Pulteney Street (GPS) which was
acquired in September 2014.
Gross profi t improved 85.7% from
S$4.9 million to S$9.1 million while
PATMI reversed from a net loss of
S$0.7 million in 2013 to a net gain
of S$70.4 million in 2014, largely due
to the S$71.0 million gain recorded in
December 2014 on the opportunistic
divestment of NBB. The loss incurred
last year was due to acquisition costs
related to NBB.
1
(“Li Shui Jin Yang”)
in Shenyang,
China.
2
Warwick House
in London,
United Kingdom.
3
Palm Resort
in Johor,
Malaysia.
* 7-month period
1
2
3
Sinarmas Land Limited Annual Report 201440 41Financial Review

As the leading and successful City and Township Developer in Indonesia, the Group has performed well in 2014. In our strategic
portfolio, we continued to focus
on investment, development
and operations of townships,
residential, commercial, retail,
industrial, hospitality and leisure
properties in Indonesia as well
as other key markets in Pan Asia
and Europe.
2
Operations Review
OUR PORTFOLIO
IN INDONESIA
The Group has two subsidiaries listed on
the Indonesia Stock Exchange, namely
PT Duta Pertiwi Tbk (“DUTI”) and PT
Bumi Serpong Damai Tbk (“BSDE”).
DUTI is a pioneer in the development of
superblock and commercial space for
small and medium-sized businesses
offering strata title ownership as well as
middle-income housing with unique
themes and concepts. BSD City is
one of the largest city and township
developments in Indonesia and is
strategically located in the South-West
of Jakarta.
In this regard, the Group continues to
focus on development and delivery of our
key city and townships projects as well
as continuously exploring new land
banks in prime locations and cities to
The Avani Park (55 hectares), Greenwich
Park (48 hectares), Nava Park (68
hectares) and The Eminent (41 hectares).
Foresta, The Icon, De Park and The
Avani Park are residential projects with
target markets in the medium to high
segment. Edu Town is an area dedicated
for education center and there are two
universities within Edu Town, namely
Swiss German University and Prasetiya
Mulya. The Breeze is an integrated
lifestyle mall within BSD Green Offi ce
Park that serves the BSD community.
In 2014, key developments in BSD City
included the completion of the Indonesia
Convention Exhibition (ICE), a joint
venture between BSDE and Indonesia
Kompas Gramedia Group. Covering a
land area of 22 hectares, it serves as
the newest and largest destination for
meetings, incentives, conferences and
exhibition in Indonesia.
Kota Deltamas is a self-sustainable
mixed-use industrial township
development, serving industrial,
1
Kota Wisata
in Cibubur,
Indonesia.
2
Go! Wet Water
Theme Park
in Grand Wisata,
Indonesia.
southwest of Jakarta. BSD City started
its operations in 1989 and is one of the
most successful and ambitious urban
planning projects in Indonesia. Based
on its strategic Master Plan, BSD City
will be developed into three phases
with a total area of each phase
approximately 1,500 hectares,
2,000 hectares and 2,500 hectares
respectively. Phase 1 was started in
1989 while Phase 2 started since 2008,
currently in the stage of development
and expected to be completed
in year 2020. Phase 3 is estimated to
commence in 2020 and will be
completed by year 2035.
Currently, the developments under
Phase 2 are progressing well.
Development in Phase 2 is divided
into two stages, of which Stage 1
covers an area of 850 hectares.
Products launched in Stage 1 of
Phase 2 include Foresta (72 hectares),
The Icon (74 hectares), BSD Green
Offi ce Park (25 hectares), Edu Town
(50 hectares), De Park (66 hectares),
commercial, and residential customers
and sits on a total development rights
area of 3,000 hectares. It is a long term
partnership between the Group and
Sojitz Corporation.
Grand Wisata, strategically located
in Bekasi, Greater Jakarta, holds
development rights over 1,100 hectares
of land, has developed approximately
230 hectares of land and acquired
approximately 865 hectares of land as
at 31 December 2014. This project is
scheduled to be developed over 15 years
from its commencement in 2005 and has
10 phases, each being a district divided
into clusters. The project has facilities
such as direct toll road access, sports
club, commercial areas and recreation
centres. In 2014, Grand Wisata
completed a new facility – the water
park named Go! Wet.
Kota Wisata is an exclusive housing
project located in Cibubur with an area
of approximately 480 hectares. It is
conceptualized as an idyllic urban
grow our portfolio and market share.
Currently, we have more than 7,000
hectares of remaining land bank for
development and our properties are
located within the Jabodetabek (Jakarta,
Bogor, Depok, Tangerang, Bekasi)
area, Palembang, Medan, Semarang,
Manado, Surabaya, Balikpapan,
Samarinda and Makassar.
TOWNSHIPS
The Group has four integrated city and
townships in Indonesia, namely Bumi
Serpong Damai (BSD) City at Tangerang,
Kota Deltamas at Cikarang, Kota Wisata
at Cibubur and Grand Wisata at Bekasi.
Of signifi cance is BSD City. BSDE was
established in 1984 by a consortium of
shareholders to develop an integrated
township (BSD City) on approximately
6,000 hectares of land strategically
located at Tangerang, about 25 kilometers
1
2
Sinarmas Land Limited Annual Report 201442 43Operations Review

Operations Review
Loft 1 and 2, the limited launch of
Foresta Business Loft 3 (26 units with
4 different designs), was also well
received by investors. The project has a
unique modern contemporary style that
is dynamic and aesthetically stunning.
In Q4 2014 we have completed Courts
Asia “Big-Box” Megastore of 12,700
square metres in Bekasi, their fi rst
built-to-suit (BTS) project in Indonesia
and the Group is extending our strategic
partnership with Courts Asia for their
subsequent BTS expansion plans
across Indonesia.
HOSPITALITY & LEISURE
Situated in the heart of the CBD Jakarta,
the Grand Hyatt Hotel, a fi ve-star luxury
hotel that is owned by our associated
company, PT Plaza Indonesia Realty Tbk,
achieved an average occupancy rate of
69% (2013: 66%). In addition, the Group
also owns and operates the Le Grandeur
brand hotels in Indonesia that comprises
the Le Grandeur Mangga Dua in
Jakarta and Le Grandeur Balikpapan
in Balikpapan. In 2014, Le Grandeur
Mangga Dua and Le Grandeur
Balikpapan enjoyed average occupancy
rates of 58% (2013: 62%) and 61%
(2013: 62%) respectively.
Moving in tandem with the growth of
the hospitality sector in Indonesia, the
Group in its corporate restructuring
exercise in October 2014, established
a dedicated Hospitality and Resorts
division to synergistically focus and
excel in the ownership and management
of our hotels and resorts, both within
and outside Indonesia.
Palm Springs Golf and Beach Resort
is located at the North Eastern side
of Batam (in the Nongsa area) and
has a 27-hole golf course that sits
on a 274 hectares of land. It is easily
accessible from Singapore via a
35-minute ferry ride. In 2014, Palm
Springs achieved 37,170 golf
rounds which was a 22% increase
compared to 2013. Golfers from
Singapore still dominate the number
of rounds (19,166) and recorded an
increase of 24% when compared to
2013. A signifi cant rise in the number
of golf rounds was attributed to the
election of Palm Springs as the best
golf course in Batam by the Batam City
Government as well as the positive
rating by the Golf Digest Singapore
magazine in the September 2014
edition. In addition, we also have
Sedana Golf & Country Club which
is an 18-hole golf course located
47 km east of Jakarta along the
Jakarta-Cikampek toll road.
INDUSTRIAL
Sinarmas Land currently operates three
industrial estates namely Karawang
International Industrial City (KIIC)
in Karawang, West Java; Greenland
International Industrial City (GIIC) in
Cikarang, Bekasi West Java and the
BSD Technopark in Tangerang, Banten.
KIIC is a green and modern industrial
estate located in West Karawang,
South East of Jakarta. It is a joint
1
Wisma BCA
in BSD City,
Indonesia.
2
Le Grandeur
Mangga Dua
in Jakarta,
Indonesia.
3
Greenland
International
Industrial City
in Cikarang,
Indonesia.
getaway with an ideal blend of
metropolitan sophistication and sweeping
landscapes. The location is easily
accessible from the Cibubur toll road or
from Bekasi. The Group has developed
approximately 380 hectares of land.
RESIDENTIAL
On the residential front, Nava Park,
a joint venture between BSDE and
Hongkong Land launched its initial phase
of premium landed houses in October
2014 and the project was very well
received and successfully nearly sold
out within a few weeks.
Other than residential projects within
BSD City, the Indonesia Property division
is also developing other residential
projects namely, Kota Bunga, Taman
Banjar Wijaya, Taman Permata Buana,
Legenda Wisata, Bale Tirtawana, Wisata
Bukit Mas Surabaya, Balikpapan Baru
and Grand City Balikpapan.
In 2014, Sinarmas Land successfully
launched a new project, in Balikpapan
– Kalimantan, named Grand City
Balikpapan. This is a 183-hectare
themed development of a city enveloped
in nature and green environment.
To capture the fast growing opportunities
of key cities, the Group has acquired
additional new land in 2014 in Surabaya
(3 hectares) and Makassar (5.1 hectares)
for prime residential and mixed-use
developments respectively.
COMMERCIAL
Sinar Mas Land Plaza – Jakarta is a
prestigious three-tower offi ce building
strategically located within the Tharmin
CBD in Jakarta, continued to enjoy high
occupancy in 2014 given the tight supply
in the Grade A offi ce market.
The Group also owns other offi ce
buildings such as Wisma Eka Jiwa,
Wisma BII - Surabaya, Sinar Mas Land
Plaza – Medan, Wisma BCA – BSD City
and the Group’s headquarters, Sinar Mas
Land Plaza – BSD City.
Following the successful launch of
commercial buildings in Foresta Business
venture between Sinarmas Land
and ITOCHU Corporation Japan. It
encompasses an area of 1,200 hectares
and contains a variety of national and
multinational corporations such as
Toyota Motor Manufacturing, Indonesia,
HM Sampoerna, Yamaha Motor
Manufacturing, Indonesia, Astra
Daihatsu Motor, Panasonic
Semiconductor Indonesia and
Sharp Semiconductor Indonesia.
GIIC encompasses an area of 1,000
hectares, located in Kota Deltamas,
Cikarang, Bekasi. Managed by
Puradelta Lestari Group, the project
is fully supported by the Sojitz
Corporation Japan, in cooperation
with Sinarmas Land. GIIC was
designed to be an environmentally
friendly industrial estate and prides
itself on the many green industrial
aspects of the development. The
industrial estate includes the 200-hectare
China-Indonesia Economic & Trade
Cooperation Zone (KITIC) dedicated to
manufacturers and investors from China
for their Indonesian operations.
GIIC and KIIC sold approximately
105 hectares of land in 2014.
1
2
3
Sinarmas Land Limited Annual Report 201444 45Operations Review

OUR PORTFOLIO
IN CHINA
– LI SHUI JIN DU
Our Chengdu project,
“Li Shui Jin Du”, is located in Xindu,
a suburban town in Chengdu city,
Sichuan province. This high-rise
condominium project is sited on
4.8 hectares of land, consisting of
nine blocks of 1,205 residential
apartments with total built-up area
of 138,278 square metres, one block
of retail space with built-up area of
3,301 square metres; and 499 car park
lots. As of 31 Dec 2014, 100% of the
residential and retail components have
been fully sold, with 63.7% of car park
lots remaining in the inventory.
– LI SHUI JIN YANG
Our Shenyang project,
“Li Shui Jin Yang”, is located in
Tie Xi district, a suburban town in
Shenyang city in Liaoning province.
This project is situated in the Shenyang
Tie Xi Economic and Technological
Development Zone. With a site area
of approximately 9 hectares, this
high–rise condominium project consists
of 23 blocks of 2,450 residential
apartments with total area of 200,910
square metres, 79 retail units with total
area of 9,634 square metres and a
168-room hotel.
This project is developed in several
phases. Phase 1 comprising a
total 1,052 residential units and
37 retail units, was about 98%
(2013: 97%) sold as of 31 December
2014. Phase 2 comprising a total
of 1,398 residential units was
about 90% (2013: 81%) sold as
of 31 December 2014. Construction
for Phase 3, which comprises the
hotel and some retail and residential
units, has been completed by
December 2014 and sales for
Phase 3 commenced from 3rd quarter
of 2014 onwards, achieving an initial
take rate of 1.6%. As of 31 December
2014, the overall contracted sales for
Shenyang project is 86.9%.
OUR PORTFOLIO
IN SINGAPORE AND
MALAYSIA
The key properties in this portfolio
continue to perform well given the
challenging business environments
in these operating countries. Main
recurring income is derived from
Orchard Towers which achieved
93.9% occupancy as of
31 December 2014.
The Singapore offi ce market sector
ended 2014 on a positive note
with a 2.2% rise in rental growth
quarter-on-quarter for Premium Grade
and a 1.9% increase for Grade A and
B offi ce spaces. The priority is to
retain tenants and maintain high
occupancy rate.
Businesses in the resort, golf &
country club segment have been
affected by the Malaysian aviation
accidents in 2014. This has
resulted in an overall decline
in tourist numbers, especially
from China. Nonetheless,
Le Grandeur Johor achieved
59.4% occupancy compared
to 65.5% (2013) and Palm Resort
Golf and Country Club continues
to be the preferred destination
as it hosted The Kids Golf World
Championship for the second
consecutive year.
Operations Review
OUR PORTFOLIO
IN UNITED KINGDOM
Outside Indonesia and
complementing the existing
portfolio of commercial, residential,
hotels and resorts in Singapore,
Malaysia, China and United Kingdom,
we deepened our presence in
London by the acquisition of
a second commercial property,
Warwick House in September 2014.
This is a freehold prime commercial
offi ce with a net leasable area
of 47,044 square feet and fully
leased to a single tenant,
Creston PLC. This is in line
with the Group’s portfolio
of diversifi cation, rebalancing
and international growth strategy.
In December 2014, the Group
divested New Brook Buildings in
West End London which resulted
in S$71 million gain in disposal.
Net proceeds from the disposal
will be used as capital for future
acquisition, and/or development.
1
(“Li Shui
Jin Yang”)
in Shenyang,
China.
2
Warwick
House
in London,
United
Kingdom.
1
2
MOVING FORWARD
Going forward, the Group will
continue to deepen our presence
in key locations of China, United
Kingdom, Singapore and Malaysia,
with Indonesia remaining as our
base market. We will also continue
to seek opportunities to expand
our footprint to new markets in
Pan Asia and Europe as part of
our portfolio diversifi cation efforts.
Sinarmas Land Limited Annual Report 201446 47Operations Review

INDONESIA
MALAYSIA
SINGAPORE
CHINA
UNITED KINGDOM
Network of Operations
Asia
Europe
INDONESIA
Sumatra
Medan
Palembang
Kalimantan
Balikpapan
Samarinda
UNITED KINGDOM
London
Java
Jakarta
Bekasi
Bogor
Cibubur
Cikarang
Cipanas
Depok
Java
Karawang
Puncak
Sawangan
Semarang
Surabaya
Tangerang
Bali
Pecatu
Sulawesi
Makassar
Manado
Riau Islands
Batam
City & Township
Residential
Commercial
Industrial
Retail & Trade Centers
Hotels, Resort Parks & Golf Courses
MALAYSIA
Johor
Senai
SINGAPORE
Orchard
CHINA
Shenyang
Chengdu
Sinarmas Land Limited Annual Report 201448 49Network of Operations

BSD CITY
A township that includes residential, and commercial development, infrastructure, public utilities, facilities and amenities
COUNTRY
Indonesia
LOCATION
Serpong, Tangerang, West Java
SITE AREA (SQ.M.)
29,452,189
APPROXIMATE PERCENTAGE HELD (%)
51.5
EXPECTED COMPLETION DATE
2035
Major Properties Under Construction/Development
KOTA DELTAMAS
A mixed development project containing residential units, commercial centres, industrial estate, business park, schools, hospital and other public facilities
COUNTRY
Indonesia
LOCATION
Bekasi Regency, West Java
SITE AREA (SQ.M.)
18,449,229
APPROXIMATE PERCENTAGE HELD (%)
49.4
EXPECTED COMPLETION DATE
2030
Major Properties Under Construction/Development
GRAND WISATA
A grand township project in East Jakarta
COUNTRY
Indonesia
LOCATION
Bekasi, Greater Jakarta
SITE AREA (SQ.M.)
5,817,733
APPROXIMATE PERCENTAGE HELD (%)
24.4
EXPECTED COMPLETION DATE
2020
Major Properties Under Construction/Development
KOTA WISATA
An iconic township development in Cibubur
COUNTRY
Indonesia
LOCATION
Cibubur, Greater Jakarta
SITE AREA (SQ.M.)
1,306,810
APPROXIMATE PERCENTAGE HELD (%)
45.6
EXPECTED COMPLETION DATE
2021
Major Properties Under Construction/Development
Property Portfolio
Township1
Residential
BANJAR WIJAYA
A residential development
COUNTRY
Indonesia
LOCATION
JI. Cipondoh Raya, Tangerang, West Java
SITE AREA (SQ.M.)
257,701
APPROXIMATE PERCENTAGE HELD (%)
45.6
EXPECTED COMPLETION DATE
2016
Major Properties Under Construction/Development
KOTA BUNGA
A prime residential development
COUNTRY
Indonesia
LOCATION
JI. Hancet, Cipanas, West Java
SITE AREA (SQ.M.)
114,075
APPROXIMATE PERCENTAGE HELD (%)
45.6
EXPECTED COMPLETION DATE
2016
Major Properties Under Construction/Development
WISATA BUKIT MAS
A luxury European style development
COUNTRY
Indonesia
LOCATION
Jl. Menganti Lidah Wetan, Surabaya, East Java
SITE AREA (SQ.M.)
87,108
APPROXIMATE PERCENTAGE HELD (%)
55.5
EXPECTED COMPLETION DATE
2015
Major Properties Under Construction/Development
WISATA BUKIT MAS II
A luxury European style development
COUNTRY
Indonesia
LOCATION
Jl. Menganti Lidah Wetan, Surabaya, East Java
SITE AREA (SQ.M.)
91,986
APPROXIMATE PERCENTAGE HELD (%)
41.6
EXPECTED COMPLETION DATE
2015
Major Properties Under Construction/Development
1
BSD City.
A modern
intergrated
township
in Greater
Jakarta,
Indonesia.
TAMAN PERMATA BUANA
A classic residential development in West Jakarta
COUNTRY
Indonesia
LOCATION
JI. Kembangan, West Jakarta
SITE AREA (SQ.M.)
41,595
APPROXIMATE PERCENTAGE HELD (%)
36.5
EXPECTED COMPLETION DATE
2015
Major Properties Under Construction/Development
BALIKPAPAN BARU
A luxury development in Balikpapan’s most prestigious residential area
COUNTRY
Indonesia
LOCATION
Balikpapan, Kalimantan
SITE AREA (SQ.M.)
234,229
APPROXIMATE PERCENTAGE HELD (%)
66.3
EXPECTED COMPLETION DATE
2015
Major Properties Under Construction/Development
LEGENDA WISATA
A luxury residential project in Cibubur
COUNTRY
Indonesia
LOCATION
Cibubur, Greater Jakarta
SITE AREA (SQ.M.)
183,321
APPROXIMATE PERCENTAGE HELD (%)
45.6
EXPECTED COMPLETION DATE
2015
Major Properties Under Construction/Development
Sinarmas Land Limited Annual Report 201450 51Property Portfolio

Property Portfolio
SINAR MAS LAND PLAZA
(a) Tower I – a 12 storey offi ce block, a basement level and a 7-storey carpark building
COUNTRY
Indonesia
LOCATION
JI. M.H. Thamrin Kav. 51,Central Jakarta
TENURE
20-year lease till Jul 201920-year lease till Nov 202220-year lease till Jan 202520-year lease till Jul 2026
SITE AREA (SQ.M.)
624/1,628/ 309/ 330
APPROXIMATE NETLETTABLE AREA (SQ.M.)
10,230
Major Properties held by Subsidiaries and Associated Companies
SINAR MAS LAND PLAZA
(b) Tower II – a 39 storey offi ce building, 3 basement levels and penthouse
COUNTRY
Indonesia
LOCATION
JI. M.H. Thamrin Kav. 51,Central Jakarta
TENURE
20-year lease till Mar 2025
SITE AREA (SQ.M.)
13,302
APPROXIMATE NETLETTABLE AREA (SQ.M.)
61,333
Major Properties held by Subsidiaries and Associated Companies
SINAR MAS LAND PLAZA
(c) Tower III – a 12 storey offi ce building
COUNTRY
Indonesia
LOCATION
JI. M.H. Thamrin Kav. 51,Central Jakarta
TENURE
20-year lease till Mar 2025
SITE AREA (SQ.M.)
Combined with Tower II
APPROXIMATE NETLETTABLE AREA (SQ.M.)
13,244
Major Properties held by Subsidiaries and Associated Companies
SINAR MAS LAND PLAZA – MEDAN
A 10-storey offi ce block and 3 basement levels
COUNTRY
Indonesia
LOCATION
JI. Diponegoro, North Sumatra
TENURE
20-year lease till Jan 2026
SITE AREA (SQ.M.)
4,358
APPROXIMATE NETLETTABLE AREA (SQ.M.)
11,681
Major Properties held by Subsidiaries and Associated Companies
SINAR MAS LAND PLAZA – SURABAYAA 20-storey offi ce building, a basement level and a 11-storey carpark building
COUNTRY
Indonesia
LOCATION
JI. Pemuda, Surabaya
TENURE
20-year lease till Nov 2023
SITE AREA (SQ.M.)
4,104
APPROXIMATE NETLETTABLE AREA (SQ.M.)
23,281
Major Properties held by Subsidiaries and Associated Companies
ORCHARD TOWERS
SML owns approximately 21 percent of the total strata area in this complex
COUNTRY
Singapore
LOCATION
400 Orchard Road
TENURE
Freehold
SITE AREA (SQ.M.)
6,130
APPROXIMATE NETLETTABLE AREA (SQ.M.)
8,375
Major Properties held by Subsidiaries and Associated Companies
SEDANA
A residential and commercial development
COUNTRY
Indonesia
LOCATION
Karawang, East Jakarta
SITE AREA (SQ.M.)
750,000
APPROXIMATE PERCENTAGE HELD (%)
98.1
EXPECTED COMPLETION DATE
N.A.
Major Properties Under Construction/Development
WARWICK HOUSE
A quality offi ce building in SOHO, London
COUNTRY
United Kingdom
LOCATION
8 to 13 Great Pulteney Street and 13 to 23 (odd) Lexington Street, London
TENURE
Freehold
SITE AREA (SQ.M.)
1,100
APPROXIMATE NETLETTABLE AREA (SQ.M.)
4,371
Major Properties held by Subsidiaries and Associated Companies
Commercial
1
Sinar Mas
Land Plaza
Thamrin,
Jakarta,
Indonesia.
1
Sinarmas Land Limited Annual Report 201452 53Property Portfolio

Property Portfolio
Mixed-Use Development
LI SHUI JIN YANG
A residential/commercial project in Shenyang, China
COUNTRY
China
LOCATION
Tie Xi District, Shenyang City, Liaoning Province
SITE AREA (SQ.M.)
89,940
APPROXIMATE PERCENTAGE HELD (%)
100
EXPECTED COMPLETION DATE
2015
Major Properties Under Construction/Development
PT MUSTIKA CANDRAGUNA
COUNTRY
Indonesia
LOCATION
MT. Haryono, South Jakarta
SITE AREA (SQ.M.)
7,955
APPROXIMATE PERCENTAGE HELD (%)
46.6
Major Properties Held for Development/Sale
PT BUMI PARAMUDITA MAS
COUNTRY
Indonesia
LOCATION
Tanjung Sari, Surabaya
SITE AREA (SQ.M.)
16,769
APPROXIMATE PERCENTAGE HELD (%)
51.5
Major Properties Held for Development/Sale
ROXY II
A mixed-use development
COUNTRY
Indonesia
LOCATION
JI. K.H. Hasyim Ashari, Central Jakarta
SITE AREA (SQ.M.)
156,200
APPROXIMATE PERCENTAGE HELD (%)
45.6
Major Properties Held for Development/Sale
PALM RESORT BERHAD
A 330-room resort with 54-hole golf course and land for development
COUNTRY
Malaysia
LOCATION
Senai, Johor Bahru
SITE AREA (SQ.M.)
920,134
APPROXIMATE PERCENTAGE HELD (%)
99.2
Major Properties Held for Development/Sale
ANAK BUKIT RESORTS SDN BHD
A 330-rooms resort with54-hole golf course and land for development
COUNTRY
Malaysia
LOCATION
Senai, Johor Bahru
SITE AREA (SQ.M.)
376,360
APPROXIMATE PERCENTAGE HELD (%)
100
Major Properties Held for Development/Sale
LENTENG AGUNG
COUNTRY
Indonesia
LOCATION
Southern part of Jakarta
SITE AREA (SQ.M.)
54,187
APPROXIMATE PERCENTAGE HELD (%)
45.6
Major Properties Held for Development/Sale
PT KARYA DUTAMAS CEMERLANG
A mixed-use development in East Jakarta
COUNTRY
Indonesia
LOCATION
Karawang, West Java
SITE AREA (SQ.M.)
1,633,015
APPROXIMATE PERCENTAGE HELD (%)
84.4
Major Properties Held for Development/Sale
CIBUBUR
A mixed-use development in Cibubur
COUNTRY
Indonesia
LOCATION
Cibubur, Greater Jakarta
SITE AREA (SQ.M.)
1,593,782
APPROXIMATE PERCENTAGE HELD (%)
45.6
Major Properties Held for Development/Sale
GRAND CITY BALIKPAPAN
A mixed-use development in Balikpapan
COUNTRY
Indonesia
LOCATION
Balikpapan, East Kalimantan
SITE AREA (SQ.M.)
2,089,397
APPROXIMATE PERCENTAGE HELD (%)
66.3
Major Properties Held for Development/Sale
BENOWO
A prime mixed-use development
COUNTRY
Indonesia
LOCATION
Surabaya, East Java
SITE AREA (SQ.M.)
3,066,431
APPROXIMATE PERCENTAGE HELD (%)
45.6
Major Properties Held for Development/Sale
JATI ASIH
COUNTRY
Indonesia
LOCATION
Jati Asih, Pondok Gede, Greater Jakarta
SITE AREA (SQ.M.)
837,804
APPROXIMATE PERCENTAGE HELD (%)
45.6
Major Properties Held for Development/Sale
KUNINGAN
A mixed-use development in prime Jakarta CBD
COUNTRY
Indonesia
LOCATION
Kuningan, CBD Jakarta
SITE AREA (SQ.M.)
54,808
APPROXIMATE PERCENTAGE HELD (%)
51.5
Major Properties Held for Development/Sale
MAKASSAR
A development project in Makassar city
COUNTRY
Indonesia
LOCATION
Jl. Urip Sumohardjo
SITE AREA (SQ.M.)
51,000
APPROXIMATE PERCENTAGE HELD (%)
35
Major Properties Held for Development/Sale
RASUNA SAID
A development in prime Jakarta CBD
COUNTRY
Indonesia
LOCATION
Rasuna Said, CBD Jakarta
SITE AREA (SQ.M.)
11,000
APPROXIMATE PERCENTAGE HELD (%)
46.4
Major Properties Held for Development/Sale
SURABAYA
A mixed-use development in Surabaya
COUNTRY
Indonesia
LOCATION
Surabaya, East Java
SITE AREA (SQ.M.)
30,000
APPROXIMATE PERCENTAGE HELD (%)
51.5
Major Properties Held for Development/Sale
Sinarmas Land Limited Annual Report 201454 55Property Portfolio

Property Portfolio
Industrial Estate Hotel & Resort
1
Karawang
International
Industrial
City (KIIC),
Indonesia.
LE GRANDEUR MANGGA DUA HOTEL
A 4-star hotel
COUNTRY
Indonesia
LOCATION
JI. Mangga Dua Raya, Jakarta
TENURE
20-year lease till Jul 2028
SITE AREA (SQ.M.)
13,940
NO. OF ROOMS
346
Major Properties held by Subsidiaries and Associated Companies
LE GRANDEUR BALIKPAPAN HOTEL
A 4-star hotel
COUNTRY
Indonesia
LOCATION
JI. Jenderal Sudirman,Balikpapan, East Kalimantan
TENURE
20-year lease till Apr 2028
SITE AREA (SQ.M.)
19,100
NO. OF ROOMS
185
Major Properties held by Subsidiaries and Associated Companies
GRAND HYATT JAKARTA HOTEL ANDPLAZA INDONESIA SHOPPING CENTER
A 5-star hotel and integratedshopping complex
COUNTRY
Indonesia
LOCATION
JI. M.H. Thamrin, Jakarta
TENURE
20-year lease till Aug 2025
SITE AREA (SQ.M.)
48,908
NO. OF ROOMS
428
Major Properties held by Subsidiaries and Associated Companies
Owned by associated company,PT Plaza Indonesia Realty Tbk
LE GRANDEUR PALM RESORT JOHOR
A 4-star hotel
COUNTRY
Malaysia
LOCATION
Palm Resort at Senai, Johor Bahru
TENURE
Freehold
SITE AREA (SQ.M.)
56,656
NO. OF ROOMS
330
Major Properties held by Subsidiaries and Associated Companies
KIIC – PT MALIGI PERMATA INDUSTRIAL ESTATE
Industrial development
COUNTRY
Indonesia
LOCATION
Karawang, West Java
SITE AREA (SQ.M.)
107,550
APPROXIMATE PERCENTAGE HELD (%)
42.2
EXPECTED COMPLETION DATE
N.A.
Major Properties Under Construction/Development
KIIC – PT KARAWANG TATABINA INDUSTRIAL ESTATE
Industrial development
COUNTRY
Indonesia
LOCATION
Karawang, West Java
SITE AREA (SQ.M.)
435,060
APPROXIMATE PERCENTAGE HELD (%)
48.8
EXPECTED COMPLETION DATE
N.A.
Major Properties Under Construction/Development
PALM SPRING
27-hole golf and beach resort
COUNTRY
Indonesia
LOCATION
Nongsa, Batam
SITE AREA (SQ.M.)
2,740,000
APPROXIMATE PERCENTAGE HELD (%)
65
Major Properties Held for Development/Sale
SEDANA
18-hole golf course
COUNTRY
Indonesia
LOCATION
Karawang, East Jakarta
SITE AREA (SQ.M.)
750,000
APPROXIMATE PERCENTAGE HELD (%)
98.1
Major Properties Held for Development/Sale
PECATU
A prime development site for hotel and resort
COUNTRY
Indonesia
LOCATION
Bali
SITE AREA (SQ.M.)
803,540
APPROXIMATE PERCENTAGE HELD (%)
84.4
Major Properties Held for Development/Sale
PALM RESORT
54-hole golf course
COUNTRY
Malaysia
LOCATION
Senai, Johor Bahru
SITE AREA (SQ.M.)
1,836,481
APPROXIMATE PERCENTAGE HELD (%)
100
Major Properties Held for Development/Sale
1
Sinarmas Land Limited Annual Report 201456 57Property Portfolio

SINARMAS LAND SHARE PRICE PERFORMANCE AND TRADING VOLUME
(2 JANUARY 2014 TO 9 MARCH 2015)
80%
70%
60%
50%
40%
30%
20%
10%
0%
-10%
20,000
16,000
12,000
8,000
4,000
0
Investor Relations
Investor Relations
PROACTIVE
ENGAGEMENT
Sinarmas Land adopts a proactive
approach towards engagement
with stakeholders via numerous
communication avenues which
includes investor conferences,
one-on-one and group meetings,
local and overseas non-deal
roadshows (NDRs) and quarterly
analyst briefi ngs and project
site visits.
In 2014, the management met
with over 150 potential and existing
institutional investors and fi nancial
analysts at investor conferences and
NDRs held in Singapore, Malaysia,
Hong Kong, Tokyo and London.
These regular engagements between
the management and investment
community promotes better
understanding of the Group’s
strategic direction and latest
developments as well as market
outlook while receiving feedbacks
from investors.
Annual General Meetings (AGM) and
Extraordinary General Meetings (EGM)
serve as important platforms for
shareholders to interact with the
Board of Directors and senior
management. During the meeting,
Sinarmas Land is committed to providing transparent and accurate information to our shareholders and the investment community. Adhering to the 2012 Code
of Corporate Governance
(the “Code”) and adoption of
best-practices into its investor
relations (IR) programmes,
stakeholders are kept abreast
of the Group’s developments
through regular and eff ective
communications.
participants are provided with
opportunities to raise questions
to clarify any ongoing concerns
on the agenda items.
To signify the management’s
responsibility and commitment to
stakeholders’ communication, a
dedicated IR team was established
during the year. Acting as a liaison
point between the Group and the
stakeholders, the IR team communicates
to the shareholders and investment
community on a regular basis and attends
timely to their enquiries and feedbacks.
In addition, the IR team undertakes
the responsibility to actively promote
interest and raise awareness for the
Group through various communication
channels. Stakeholders are welcome to
address all enquires to the IR team at
CONSISTENT
DISCLOSURES
Sinarmas Land strives to ensure
consistency and accuracy in our
disclosures. Announcements, material
developments, quarterly and full year
fi nancial results, presentation slides
and press releases are released
via SGXNET with compliance to the
Listing Manual on the continuous
disclosure obligations.
1Q 2014
• FY 2013 results announcement
• Singapore Non-Deal Roadshow
2Q 2014
• 1Q 2014 results announcement
• Annual General Meeting
• RHB-OSK DMG Small Cap
Book Launch – Singapore
• Barclays Asia Financial
& Property Conference
– Hong Kong
• Singapore Non-Deal Roadshow
• Kuala Lumpur Non-Deal
Roadshow
Financial CalendarFY 2015/16 (tentative)
• FY 2014 Results Announcement
February 2015
• Annual General Meeting
April 2015
• 1Q 2015 Results Announcement
May 2015
• 2Q & 1H 2015 Results
Announcement
August 2015
• 3Q 2015 Results Announcement
November 2015
• FY 2015 Results Announcement
February 2016
3Q 2014
• 2Q 2014 results announcement
• Singapore Non-Deal Roadshow
• Hong Kong Non-Deal Roadshow
• London Non-Deal Roadshow
4Q 2014
• 3Q 2014 results announcement
• Extraordinary General Meeting
• Tokyo Non-Deal Roadshow
• Singapore Non-Deal Roadshow
• Daiwa Investment Conference
– Hong Kong
• UBS Global Real Estate CEO/CFO
Conference – London
• CLSA ASEAN Access Day
– Singapore & Hong Kong
Investors Relations Activities
SML Trading Volume (’000)
2 January, 2014 9 March, 2015 Share Price/Index Returns
Sinarmas Land $0.475 $0.840 76.84%
Straits Times Index 3,174.65 3,404.57 7.24%
FTSE ST Real Estate Holding & Development Index 715.38 814.28 13.82%
Jan2014
Feb2014
Mar2014
Apr2014
May2014
Jun2014
Jul2014
Aug2014
Sep2014
Oct2014
Nov2014
Dec2014
Jan2015
Feb2015
Mar2015
Source: Bloomberg
Sinarmas Land Limited Annual Report 201458 59

development within BSD City that
complies with international green
standards. This environment-friendly
area was designed to reduce the
number of population in Tangerang who
commute to Jakarta to earn their living
by providing a place to work right within
BSD City. Special features of the park
prevent land erosion, enhance absorption
of rainwater, and reduce air pollution.
The Green Offi ce Park manifests the
company’s commitment in its Corporate
Social Responsibility mission of
implementing a development with an
environmental cause.
In 2014, Sinarmas Land, for the second
time, won the ASEAN Energy Award
2014 for the Green Building category – a
clear recognition of the company’s green
initiatives not only in Indonesia but also in
the region. Previously, BSD Green Offi ce
Park was awarded Gold Winner in World
FIABCI Prix d’Excellence Award 2013 in
Taiwan under the Category Sustainable
Development. In 2012, our BSD Green
Offi ce Park also received the International
Property Awards Asia Pacifi c 2012 for
Offi ce Development.
ENVIRONMENTAL
CONSERVATION
Green environment has always been our
inspiration and commitment. We are
conscious that building and sustaining
exercise and an exhibition on recycling
and performing arts.
ENABLING COMMUNITIES
Our strategy is to mobilize stakeholders
such as local communities, government
institutions, and to deploy our fi nancial
resources. The leadership of Sinarmas
Land is a good example of active
participation and the implementation
of integrated community programs
in education, economy, health and
infrastructure with aim to help
community development in a healthy
and harmonious environment.
Poverty Alleviation
For 2014, we continued with our
cooperation with the Tzu Chi Foundation
is a cornerstone of our humanitarian
efforts for disadvantaged communities
living in sub-standard houses. One
of the programs with which we have
implemented is Bedah Rumah or House
Renovation Program in Lengkong Kyai
Village, Tangerang Regency.
The purpose of this program is to
support government programs to
alleviate poverty especially in the district
of Tangerang, by fulfi lling one of the basic
needs of a society that is a secure,
decent home to live.
BSD City Smart House
(Rumah Pintar)
Development started in 2013 and was
inaugurated by the First Lady Ani
Yudhoyono in May 2014, Rumah Pintar
is to empower children, mothers and
other community members, in order to
create educated and prosperous
communities throughout Indonesia.
The Smart House was built to increase
interest in reading, art and culture and
fosters creativity. It has become part of
home education as well as a community
empowerment tool
Each Rumah Pintar is designed as a
community learning centre focusing on
early childhood education, education of
women in empowerment activities and
nurturing of family health. It comes with a
library, a playroom and arts and culture
corner, and is equipped with computers
and multimedia stations.
Corporate Social Responsibility
Hence, it has the potential to
empower and improve the livelihood
of the community, particularly the
future generation.
For Sinarmas Land, community
acceptance and support is the key
foundation for our sustainable growth.
We have learned that developing good
relations with the community is signifi cant
both to our business and our aspirations
of contributing to Indonesia’s economic
and social development.
In essence, our Corporate Social
Responsibility comes in 4 main
thrusts: Green Developments,
Environmental Conservation,
Enabling Communities and, Safe
and Healthy Working Environment.
GREEN DEVELOPMENTS
Sinarmas Land is a corporate founding
member of the non-profi t organization
Green Building Council of Indonesia
since 2009. Our key role in the council
is to ensure that our property
development activities are sustainable
and environment friendly.
BSD Green Offi ce Park
The BSD Green Offi ce Park is a
25 hectare, offi ce-centric mixed-use
As a leader in the property industry, sustainability has always been an integral part of our strategic business
and we recognize our vital role in
the well-being of our employees and
communities where we operate. We
believe that the management and
the development of property project
is one of the most eff ective ways to
create jobs and alleviate poverty
in Indonesia.
2014
1
Sinar Mas Land
Plaza BSD City,
Indonesia.
2 3
Sinar Mas Land
Green Festival XI.
4
Sinar Mas Land
House Makeover.
5
Employees
Gathering Area.
green lifestyle within our projects, is part
of our dream building for a better future
for our children. This dream motivates
us in contributing and supporting
environmental conservation activities.
Green Festival
Since 2004, the Company has held
BSD City Green Festival annually in
June to campaign for the importance
of protecting and conserving the
environment among the local community.
The BSD City Green Festival is often
held together with the Environment
Campaign organized by Banten
Province Government, Tangerang
Regency Government and South
Tangerang City Government.
On 8 June 2014, Sinarmas Land held
the 11th annual Festival Hijau or Green
Festival. This year’s call for action is to
“Let’s Keep the World Clean and Green.”
The greening campaign carries on with
Sinarmas Land donating 1,000 trees –
250 fruit trees and 750 shade trees,
across the Banten Province.
Aside from planting trees, the Green
Festival also aims to promote and
educate society to adopt a green and
healthy lifestyle. This was done through
various activities such as environmental
painting competitions, blood donations
together with BSD Society, communal
1
2 4
3 5
SAFE AND HEALTHY
WORKING ENVIRONMENT
Fostering a safe and healthy working
environment has always been an
important focal point for Sinarmas Land.
The Company believes that creating a
conducive working environment through
close collaboration with our stakeholders
would assist us in achieving our goals.
Sinarmas Land has in place a
comprehensive set of policies for
employees training and education on
health and safety matters in workplace
areas. In addition, the Company strives
to fulfi ll the rights and obligations of
employees in accordance with the
applicable laws and regulations.
To promote individual well-being and
improvement toward work life balance,
the Company has developed facilities
such as library, prayer rooms and sports
recreation area, as well as organizing
social group events, sports and other
outdoor activities.
Sinarmas Land Limited Annual Report 201460 61Corporate Social Responsibility

Human CapitalCorporate Social Responsibility
Human Capital
People strategy is not only about
initiatives; at Sinarmas Land we believe
that people strategy is business strategy.
Faced with an increasingly diverse,
competitive and shrinking labor market,
Sinarmas Land prioritizes on the
following areas:
EMPLOYER BRANDING
With numerous awards and accolades
and constant media exposure in the
last few years, Sinarmas Land is in
good position to be the employer of
choice in Indonesia and its selected
locations. In order to enhance awareness
and attract potential candidates,
Sinarmas Land organized an Open
House in BSD which was attended
by students from reputable universities
from different cities. In this event,
scholars were taken to see
Sinarmas Land water management,
The Breeze mall, and other interesting
locations in BSD. This event was even
able to capture some attention over
social media’s Twitter. In the second
half of 2014, Sinarmas Land also posted
half page Job Advertisement in the
nation’s largest newpaper in order
to increase awareness and fulfi ll
manpower needs.
ENHANCEMENT OF EMPLOYEE
MANAGEMENT SYSTEMS
THROUGH SAP HCM
Keeping fi les organized, information
current and accurate as well as
accessed easily are key components
of a good employee management
system. This facilitates faster decision
making and improved productivity for
the entire organization. For 2014,
our employee database has been
enhanced and integrated with other
employee systems in SAP. Now
employees can easily apply for leave,
business trips, training, and other
needs at their fi ngertips. The system
also allows for manpower requests
to be submitted, tracked, and
approved online. More importantly,
Performance Management System
using SAP is now available to ensure
that employee performance is
monitored, reviewed and evaluated
at a timely manner. The implementation
PALM RESORT (MALAYSIA) also had its fair share
of giving back to the community. In December 2014, the
management committee of the hotel and club visited the
Handicapped and Mentally Disabled Children Association
facility in Johor Bahru and served a sumptuous luncheon
and interacted with the residents. A token amount was
also donated for the facility’s operations. The donation
was partly funded by Sinarmas Land and Palm Resort’s
“Have a Heart…Buy a Heart” Community programme.
“ Sinarmas Land launched Sinar Mas Land
Young Architect Competition to give
recognition and honor the young architects
of Indonesia who will be the future backbone
of the property development industry in the
country. Through this competition, Sinarmas
Land offers a rare opportunity to architecture
students and fresh graduates to develop
themselves and enhance their skills ad
competencies with Sinarmas Land.”
Ishak Chandra,
Managing Director Corporate Strategy
and Services Sinarmas Land
SINARMAS LAND
SCHOLARSHIP PROGRAM
Sinarmas Land awarded scholarships to
182 deserving students from 37 schools
amounting to Rp 317.4 million (S$33,350).
KEY HIGHLIGHTS OF CSR ACTIVITIES IN 2014
SINARMAS LAND CARES is a CSR program of Sinarmas Land
which helps students within the Banten Province. The Company
donated 100,000 notebooks to help in the education of the poor.
Human Capital plays an important role in addressing people strategy to support Sinarmas Land’s goals. Th e need for talent has
become signifi cantly more
crucial as Sinarmas Land’s
business continues to grow
bigger and aims for even
greater heights.
Sinarmas Land Limited Annual Report 201462 63

COMPANY VISIONTo be the leading property developer in South East Asia,
trusted by customers, employees, society, and other stakeholders.
Human Capital
of this integrated SAP HCM greatly
improves productivity and signifi cantly
reduces circulation time, paper usage
as well as potential document loss.
RETENTION OF TALENT
At Sinarmas Land, we believe that
retaining a positive and well-motivated
workforce is key to the organization’s
success. Our talent retention program
makes sure that key personnel stay
in the company maintaining their
high-performance and productivity.
With our Performance Talent
Management Database in SAP in place,
the Company can now easily review,
update personal data, track the
development as well as the movement
of the company’s key talents. More
importantly, management can prepare
for succession planning for critical
positions and take necessary actions
including customized development plan.
Other programs such as Continuation
of Assessment and 360 feedback down
to Supervisor Level are expected to
complete by next year. The Company
has also developed a Car Ownership
Program (COP) in order to increase
the company’s hiring competitiveness
while retaining its employees. The
program will take effect in 2015.
LEADERSHIP
CAPABILITY BUILDING
The Company is committed to
continuously build the next generation
of leaders. In order to achieve this,
a structured training and development
program from the lower level up to
senior management level has been
developed. SML Leadership journey
starts from Supervisor (SDP), Managers
(MDP), Senior Managers (Advance)
Program, up to the Executive level.
The Advance Development Program
has been completely developed and will
be executed in 2015. Other programs,
including technical and non-technical
Knowledge Sharing sessions have also
been organized for the employees.
First year Shared Values Campaign
as part of of a three-year program
was successfully completed in 2014.
Employees participated in surveys,
jingle competition, we-fi e competition,
and employee award based on each
value. The culminating event was held
during SML Olympic day where the
winners were announced and presented
with their awards. Besides the campaign,
new leaders at the Top Management
were also also assessed using shared
values as one of the criteria. We believe
that the Integrity, Positive Attitude,
Commitment, Continuous Improvement,
Innovative, and Loyalty must be shown
in our day-to–day behaviour.
REORGANIZATION
The ultimate objective of the Company
is to grow market share and at the same
time increase revenue. In 2014, the
Company made signifi cant changes in
organization structure in order to achieve
these objectives. Role Mandates, Job
Descriptions and KPIs have been
modifi ed and adapted based on the
new structure and this has been
effectively shared with employees
through Town Halls. The impact
of this change is expected to give
empowerment to the Strategic
Business Units in strategizing, making
decisions, and as a result accelerating
the achievement of objectives. Needless
to say, a company needs to keep
evolving in order to anticipate and
address constant market changes.
Lastly, the whole People Strategy
must be supported and carried by
all employees from top to bottom
as we believe that the success of
the business strategy is largely
dependent on the cohesiveness and
effectiveness of its People Strategy.
Positive Attitude
Integrity Commitment Cont. Improvement
Innovation Loyalty
MANDATORY
Executive Development
Program
Advance Development
Program
Managers Development
Program
Supervisory Development
Program
TECHNICAL
Construction Management
Urban Technical Planning
Property Management
Financial, HC,
Others
NON-
TECHNICAL
Leadership
Managerial
Personal
Others
SINAR MAS SHARED VALUES
LEADERSHIP EXCELLENCE
ORGANIZATIONAL EFFECTIVENESS
Sinarmas Land Limited Annual Report 201464

66 Report of the Directors
71 Statement by Directors
72 Independent Auditors’ Report
74 Consolidated Income Statement
75 Consolidated Statement of Comprehensive Income
76 Statements of Financial Position
78 Consolidated Statement of Changes in Equity
80 Consolidated Statement of Cash Flows
82 Notes to the Financial Statements
Financial Contents

The directors are pleased to present their report together with the audited financial statements of Sinarmas Land Limited (“SML” or the “Company”) and its subsidiaries (the “Group”) for the financial year ended 31 December 2014. 1 Directors
The directors of the Company in office at the date of this report are: Franky Oesman Widjaja Muktar Widjaja Margaretha Natalia Widjaja Ferdinand Sadeli Robin Ng Cheng Jiet Foo Meng Kee Kunihiko Naito Rodolfo Castillo Balmater
2 Arrangements to Enable Directors to Acquire Benefits by Means of the Acquisition of Shares and
Debentures
Neither at the end of nor at any time during the financial year did there subsist any arrangement whose object was to enable the directors to acquire benefits by means of the acquisition of shares in or debentures of the Company or any other body corporate.
3 Directors’ Interest in Shares and Debentures
The directors of the Company holding office at the end of the financial year had no interests in the share capital and debentures of the Company and related corporations as recorded in the Register of Directors’ Shareholdings kept by the Company under Section 164 of the Singapore Companies Act except as follows:
Shareholdings Shareholdings in which registered in the name directors are deemed of directors or their spouse to have an interest At the
beginning At the
beginning
of the year or date of
of the year or date of
Name of directors in appointment At the end appointment At the end which interests are held if later of the year if later of the year Related Corporations PT Bumi Serpong Damai Tbk Shares of RP100 each Franky Oesman Widjaja - - 70,333,840* 70,333,840* Muktar Widjaja - - 70,333,840* 70,333,840*
Sinarmas Land Limited Annual Report 201466
Report of the Directors31 December 2014

3 Directors’ Interest in Shares and Debentures (cont’d) Shareholdings Shareholdings in which registered in the name directors are deemed of directors or their spouse to have an interest At the
beginning At the
beginning
of the year or date of
of the year or date of
Name of directors in appointment At the end appointment At the end which interests are held if later of the year if later of the year Related Corporations PT Duta Pertiwi Tbk Shares of RP500 each Franky Oesman Widjaja - - 6,307,000* 6,307,000* Muktar Widjaja - - 6,307,000* 6,307,000* PT Paraga Artamida Shares of RP1,000 each Franky Oesman Widjaja - - 139,000,000* 139,000,000* Muktar Widjaja - - 139,000,000* 139,000,000* PT Bhineka Karya Pratama Shares of RP1,000 each Franky Oesman Widjaja - - 675,000* 675,000* Muktar Widjaja - - 675,000* 675,000* PT Simas Tunggal Centre Shares of RP1,000 each Franky Oesman Widjaja - - 1,000,000* 1,000,000* Muktar Widjaja - - 1,000,000* 1,000,000* PT Ekacentra Usahamaju Shares of RP1,000 each Franky Oesman Widjaja - - 1* 1* Muktar Widjaja - - 1* 1* PT Sinar Mas Teladan Shares of RP1,000 each Franky Oesman Widjaja - - 555,000* 555,000* Muktar Widjaja - - 555,000* 555,000* PT Sinar Mas Wisesa Shares of RP1,000 each Franky Oesman Widjaja - - 4,226* -* Muktar Widjaja - - 4,226* -* PT Masagi Propertindo Shares of RP1,000 each Franky Oesman Widjaja - - 277,000* 277,000* Muktar Widjaja - - 277,000* 277,000* PT Binamaju Grahamitra Shares of RP1,000,000 each Franky Oesman Widjaja - - 1* -* Muktar Widjaja - - 1* -* PT Binasarana Muliajaya Shares of RP1,000,000 each Franky Oesman Widjaja - - 10* 10* Muktar Widjaja - - 10* 10*
67Report of the Directors

3 Directors’ Interest in Shares and Debentures (cont’d) Shareholdings Shareholdings in which registered in the name directors are deemed of directors or their spouse to have an interest At the
beginning At the
beginning
of the year or date of
of the year or date of
Name of directors in appointment At the end appointment At the end which interests are held if later of the year if later of the year Related Corporations PT Inti Tekno Sukses Bersama Shares of RP1,000,000 each Franky Oesman Widjaja - - 1* 1* Muktar Widjaja - - 1* 1* PT Mustika Candraguna Shares of RP1,000,000 each Franky Oesman Widjaja - - 2,328* 2,328* Muktar Widjaja - - 2,328* 2,328*
* Held by corporations in which the director has an interest by virtue of Section 7 of the Singapore Companies Act.
There was no change in any of the above-mentioned interests between the end of the financial year and 21 January 2015.
4 Directors’ Receipt and Entitlement to Contractual Benefits
Since the beginning of the financial year, no director has received or become entitled to receive a benefit which is required to be disclosed under Section 201(8) of the Singapore Companies Act, by reason of a contract made by the Company or a related corporation with the director or with a firm of which he is a member, or with a company in which he has a substantial financial interest except that certain directors have received remuneration from related corporations in their capacity as directors and/or executives of those related corporations and except as disclosed in the notes to the financial statements. There were certain transactions (disclosed in the notes to the financial statements) with corporations in which certain directors have an interest.
5 Warrants and Share Options of the Company
On 19 November 2010, the Company issued 1,520,978,744 warrants pursuant to a bonus issue on the basis of one warrant for every two existing ordinary shares held in the capital of the Company. On 23 November 2010, the warrants were listed on Singapore Exchange Securities Trading Limited (“SGX-ST”). Each warrant carries the right to subscribe for one new ordinary share of the Company at the exercise price of $0.10 each. As at 31 December 2014, the number of outstanding warrants was 1,520,978,744 and may only be exercised on the fifth (5th) anniversary of the date of issuance (i.e. 18 November 2015) (“Exercise Date”). If the Exercise Date falls on a day on which the Register of Members and/or the Register of Warrantholders are closed or is not a business day, the Exercise Date shall be the next business day on which the Register of Members and the Register of Warrantholders are open. Warrants remaining unexercised after the Exercise Date shall lapse and cease to be valid. Assuming all the warrants are fully exercised, the number of new ordinary shares to be issued would be 1,520,978,744. No shares have been issued during the financial year by virtue of the exercise of an option to take up unissued shares of the Company.
Sinarmas Land Limited Annual Report 201468
Report of the Directors31 December 2014

6 Share Options of Subsidiaries
Details and terms of the options granted by the subsidiaries under certain Zero Percent Convertible Bonds are disclosed in Note 30 to the financial statements.
7 Interested Person Transactions Disclosure The aggregate value of all interested person transactions during the financial year ended 31 December 2014 is as follows:
Name of interested person
Aggregate value of all interested person transactions during the financial year under review (excluding transactions
less than S$100,000 and transactions conducted under
shareholders’ mandate* pursuant to Rule 920)
Aggregate value of all interested person transactions conducted under shareholders’ mandate* pursuant to Rule 920
(excluding transactions less than S$100,000)
S$ S$ Asia Integrated Agri Resources Limited 5,526,400 - Golden Agri International Pte Ltd 486,000 - PT Bank Sinarmas Tbk - 50,352,634 a PT Ivo Mas Tunggal - 544,694 PT Mustika Candraguna 424,798 - PT Sinar Mas Agro Resources and Technology Tbk
-
11,977,326
PT Sinarmas Sekuritas - 146,477 Total 6,437,198 63,021,131
Notes: a Principal amount of placements as at 31 December 2014 is approximately $13.2 million. * Renewed at the annual general meeting on 25 April 2014 pursuant to Rule 920 of the Listing Manual of the
SGX-ST. 8 Audit Committee
At the date of this report, the Audit Committee (“AC”) comprises the following 3 Directors, all of whom, including the AC chairman, are non-executive independent Directors: Foo Meng Kee (AC Chairman) Rodolfo Castillo Balmater Kunihiko Naito The AC has the explicit authority to investigate any matter within its terms of reference. In addition to its statutory functions, the AC considers and reviews any other matters as may be agreed to by the AC and the Board. In particular, the duties of the AC include: (a) Reviewing significant financial reporting issues and judgements so as to ensure the integrity of the
financial statements of the Group and any formal announcements relating to the Group’s financial performance.
(b) Reviewing and reporting to the Board at least annually the adequacy and effectiveness of the Group’s
internal controls, including financial, operational, compliance and information technology controls (such review can be carried out internally or with the assistance of any competent third parties).
Report of the Directors 69

8 Audit Committee (cont’d)
(c) Reviewing the effectiveness of the Group’s internal audit function. (d) Reviewing the scope and results of the external audit, and the independence and objectivity of the
external auditors. (e) Making recommendations to the Board on the proposals to the shareholders on appointment, re-
appointment and removal of the external auditors, and approving the remuneration and terms of engagement of the external auditors.
The AC reviews with Management, and where relevant, the auditors, the results announcements, annual reports and financial statements, interested person transactions and corporate governance, before submission to the Board for approval or adoption. In performing its functions, the AC meets with the internal and external auditors, and reviews the audit plans and overall scope of both internal and external audits, and the co-operation and assistance given by Management to the respective auditors. Where necessary, the AC also meets separately with the internal and external auditors whereby any issues may be raised directly to the AC, without the presence of Management. The AC has recommended to the Board that Moore Stephens LLP, Public Accountants and Chartered Accountants, be re-appointed for the ensuing year subject to shareholders’ approval at the forthcoming annual general meeting.
9 Independent Auditors
The independent auditors, Moore Stephens LLP, Public Accountants and Chartered Accountants, have expressed their willingness to accept re-appointment.
On behalf of the Board of Directors, MUKTAR WIDJAJA Director FERDINAND SADELI Director 18 March 2015
Sinarmas Land Limited Annual Report 201470
Report of the Directors31 December 2014

In the opinion of the directors, the accompanying statement of financial position of the Company and the consolidated financial statements of the Group set out on pages 74 to 150 are drawn up so as to give a true and fair view of the state of affairs of the Company and of the Group as at 31 December 2014 and of the results of the business, changes in equity and cash flows of the Group for the financial year then ended. At the date of this statement, there are reasonable grounds to believe that the Company will be able to pay its debts as and when they fall due. On behalf of the Board of Directors, MUKTAR WIDJAJA Director FERDINAND SADELI Director 18 March 2015
Statement by Directors 71
Statement by Directors31 December 2014

We have audited the accompanying financial statements of Sinarmas Land Limited (the “Company”) and its subsidiaries (the “Group”) as set out on pages 74 to 150, which comprise the statements of financial position of the Company and of the Group as at 31 December 2014, and the consolidated income statement, consolidated statement of comprehensive income, consolidated statement of changes in equity and consolidated statement of cash flows of the Group for the year then ended, and a summary of significant accounting policies and other explanatory information. Management’s Responsibility for the Financial Statements Management is responsible for the preparation of these financial statements that give a true and fair view in accordance with the provisions of the Singapore Companies Act, Chapter 50 (the “Act”) and Singapore Financial Reporting Standards, and for devising and maintaining a system of internal accounting controls sufficient to provide reasonable assurance that assets are safeguarded against loss from unauthorised use or disposition; and transactions are properly authorised and that they are recorded as necessary to permit the preparation of true and fair profit and loss accounts and balance sheets and to maintain accountability of assets. Auditors’ Responsibility Our responsibility is to express an opinion on these financial statements based on our audit. We conducted our audit in accordance with Singapore Standards on Auditing. Those Standards require that we comply with ethical requirements and plan and perform the audit to obtain reasonable assurance as to whether the financial statements are free from material misstatement.
An audit involves performing procedures to obtain evidence about the amounts and disclosures in the financial statements. The procedures selected depend on the auditor’s judgement, including the assessment of the risks of material misstatement of the financial statements, whether due to fraud or error. In making those risk assessments, the auditor considers internal controls relevant to the entity’s preparation of the financial statements that give a true and fair view in order to design audit procedures that are appropriate in the circumstances, but not for the purpose of expressing an opinion on the effectiveness of the entity’s internal controls. An audit also includes evaluating the appropriateness of accounting policies used and reasonableness of accounting estimates made by management, as well as evaluating the overall presentation of the financial statements.
We believe that the audit evidence we have obtained is sufficient and appropriate to provide a basis for our audit opinion. Opinion In our opinion, the statement of financial position of the Company and the consolidated financial statements of the Group are properly drawn up in accordance with the provisions of the Act and Singapore Financial Reporting Standards so as to give a true and fair view of the state of affairs of the Company and of the Group as at 31 December 2014, and the results, changes in equity and cash flows of the Group for the financial year ended on that date.
Sinarmas Land Limited Annual Report 201472
Independent Auditors’ ReportTo the Members of Sinarmas Land LimitedCompany Registration No. 199400619R(Incorporated in Singapore)

(cont’d) Report on other Legal and Regulatory Requirements In our opinion, the accounting and other records required by the Act to be kept by the Company and by those subsidiaries incorporated in Singapore of which we are the auditors have been properly kept in accordance with the provisions of the Act.
MOORE STEPHENS LLP Public Accountants and Chartered Accountants Singapore 18 March 2015
73Independent Auditors’ Report

(Restated) Note 2014 2013 S$’000 S$’000
Revenue 6 828,552 1,178,787 Cost of sales (230,760) (401,670) Gross profit 597,792 777,117 Operating expenses Selling expenses (52,871) (51,724) General and administrative expenses (152,461) (144,965) Total operating expenses (205,332) (196,689) Operating profit 392,460 580,428 Other income/(expenses) Finance income 7 39,168 31,607 Finance costs 8 (54,063) (22,035) Foreign exchange (loss)/gain, net (2,894) 44,601 Share of results of associated companies, net of tax 2,244 (2,887) Share of results of joint ventures, net of tax 10,142 (87,955) Other operating (expenses)/income 9 (640) 8,565 Other expenses, net (6,043) (28,104) Exceptional items Negative goodwill 40(a) 8,669 11,906 Gain on equity interest 40(a) 3,381 45,847 Gain on disposal of subsidiaries 40(b) 76,572 - Exceptional items, net 88,622 57,753 Profit before income tax 10 475,039 610,077 Income tax 11 (46,859) (69,323) Total profit for the year 428,180 540,754
Attributable to: Owners of the Company 240,592 288,867 Non-controlling interests 187,588 251,887 428,180 540,754
Earnings per share (cents) Basic 12 7.91 9.50
Diluted 12 5.59 6.76
The accompanying notes form an integral part of the financial statements.
Sinarmas Land Limited Annual Report 201474
Consolidated Income StatementFor the Year Ended 31 December 2014

(Restated) Note 2014 2013 S$’000 S$’000
Total profit for the year 428,180 540,754 Other comprehensive income/(loss): Item that will not be reclassified subsequently to profit or loss: Actuarial loss on post employment benefit (3,146) - Items that may be reclassified subsequently to profit or loss: Foreign currency translation differences 242,922 (655,662) Reclassification of foreign currency translation differences on
disposal of subsidiaries 40(b) (16,900) - Reclassification of foreign currency translation differences on loss
of significant influence 40(a) - (1,755) Changes in fair value of available-for-sale financial assets 176 (148) Share of other comprehensive income of associated companies 22 - Share of other comprehensive loss of joint ventures (11) - Equity portion of bonds - (14,934) Other comprehensive income/(loss), net of tax 223,063 (672,499) Total comprehensive income/(loss) for the year 651,243 (131,745)
Total comprehensive income/(loss) attributable to: Owners of the Company 344,656 (54,403) Non-controlling interests 306,587 (77,342) 651,243 (131,745)
The accompanying notes form an integral part of the financial statements.
75
Consolidated Statement of Comprehensive IncomeFor the Year Ended 31 December 2014
Consolidated Statement of Comprehensive Income

Group Company (Restated) Note 2014 2013 2014 2013 S$’000 S$’000 S$’000 S$’000
Assets Current Assets Cash and cash equivalents 14 874,787 816,221 45,677 11,338 Short-term investments 15 17,804 1,007 - - Trade receivables 16 13,560 12,219 - - Other current assets 17 233,778 240,067 247,224 546,737 Inventories, at cost 1,249 949 - - Properties held for sale 841,986 547,179 - -
1,983,164 1,617,642 292,901 558,075 Non-Current Assets Subsidiaries 18 - - 1,714,120 1,428,804 Associated companies 19 223,276 195,822 - - Joint ventures 20 103,888 65,512 - - Long-term investments 21 2,403 7,152 - - Properties under development for sale 22 1,738,500 1,446,235 - -
Investment properties 23 496,508 535,367 - - Property, plant and equipment 24 157,930 129,568 113 156 Long-term receivables 25 36,940 413 - - Deferred tax assets 26 336 162 - - Goodwill 27 1,784 1,784 - -
2,761,565 2,382,015 1,714,233 1,428,960 Total Assets 4,744,729 3,999,657 2,007,134 1,987,035
The accompanying notes form an integral part of the financial statements.
Sinarmas Land Limited Annual Report 201476
Statements of Financial PositionAs at 31 December 2014

Group Company (Restated) Note 2014 2013 2014 2013 S$’000 S$’000 S$’000 S$’000
Liabilities and Equity Current Liabilities Trade payables 28 23,964 18,815 - - Other payables and liabilities 29 612,259 504,897 71,332 49,040 Bonds payables 30 33,016 - - - Obligations under finance leases 31 1,909 32 21 32 Borrowings 32 157,325 135,697 - - Income taxes payable 1,388 5,894 - -
829,861 665,335 71,353 49,072 Non-Current Liabilities Bonds payables 30 309,524 308,788 - - Obligations under finance leases 31 3,628 44 14 44 Borrowings 32 239,025 194,290 - - Long-term liabilities 33 169,451 227,362 - - Deferred tax liabilities 26 12 12 - -
721,640 730,496 14 44 Total Liabilities 1,551,501 1,395,831 71,367 49,116
Equity attributable to Owners of the Company Issued capital 34 1,907,108 1,907,108 1,907,108 1,907,108 Foreign currency translation deficit (1,173,050) (1,278,594) - - Goodwill on consolidation (62,122) (62,122) - - Asset revaluation reserve 6,518 6,518 - - Other reserves (28,916) 8,730 - - Fair value reserve 58 (65) - - Retained earnings 1,065,105 839,723 28,659 30,811 1,714,701 1,421,298 1,935,767 1,937,919 Non-controlling interests 1,478,527 1,182,528 - - Total Equity 3,193,228 2,603,826 1,935,767 1,937,919 Total Liabilities and Equity 4,744,729 3,999,657 2,007,134 1,987,035
The accompanying notes form an integral part of the financial statements.
77Statements of Financial Position

Attributable to Owners of the Company
Issued capital
Foreign currency
translation deficit
Goodwill on consolidation
Asset revaluation
reserve
Other reserves
Fair value
reserve Retained earnings Total
Non-Controlling
Interests Total
Equity
Group S$’000 S$’000 S$’000 S$’000 S$’000 S$’000 S$’000 S$’000 S$’000 S$’000 Balance at 1.1.2014 as previously reported 1,907,108 (1,183,977) (62,122) 9,758 8,730 (65) 803,337 1,482,769 836,986 2,319,755 Effect of adoption of FRS 110 - (94,617) - (3,240) - - 36,386 (61,471) 345,542 284,071 Balance at 1.1.2014 as restated 1,907,108 (1,278,594) (62,122) 6,518 8,730 (65) 839,723 1,421,298 1,182,528 2,603,826 Profit for the year - - - - - - 240,592 240,592 187,588 428,180 Other comprehensive income/(loss) - 105,544 - - (1,603) 123 - 104,064 118,999 223,063 Total comprehensive income/(loss) for the year - 105,544 - - (1,603) 123 240,592 344,656 306,587 651,243 Dividends (Note 35) - - - - - - (15,210) (15,210) - (15,210) Dividends paid to non-controlling shareholders - - - - - - - - (21,225) (21,225) Disposal of subsidiaries (Note 40(b)) - - - - - - - - (685) (685) Acquisition of subsidiaries (Note 40(a)) - - - - - - - - 19,081 19,081 Capital subscribed by non-controlling shareholders - - - - - - - - 11,198 11,198 Capital returned to non-controlling shareholders - - - - - - - - (55,000) (55,000) Change in interest in subsidiaries (Note 40(c)) - - - - (36,043) - - (36,043) 36,043 - Balance at 31.12.2014 1,907,108 (1,173,050) (62,122) 6,518 (28,916) 58 1,065,105 1,714,701 1,478,527 3,193,228
The accompanying notes form an integral part of the financial statements.
Sinarmas Land Limited Annual Report 201478
Consolidated Statement of Changes in EquityFor the Year Ended 31 December 2014

Attributable to Owners of the Company
Issued capital
Foreign currency
translation deficit
Goodwill on consolidation
Option reserve
Asset revaluation
reserve
Other reserves
Fair value
reserve Retained earnings Total
Non-Controlling
Interests Total
Equity
Group S$’000 S$’000 S$’000 S$’000 S$’000 S$’000 S$’000 S$’000 S$’000 S$’000 S$’000 Balance at 1.1.2013 1,907,108 (950,323) (62,122) 14,934 9,758 13,203 - 562,415 1,494,973 823,568 2,318,541 Effect of adoption of FRS 110 (Note 40(a)(iii)) - - - - (3,240) - - - (3,240) 406,543 403,303 Profit for the year, restated - - - - - - - 288,867 288,867 251,887 540,754 Other comprehensive loss, restated - (328,271) - (14,934) - - (65) - (343,270) (329,229) (672,499) Total comprehensive (loss)/income for the year, restated - (328,271) - (14,934) - - (65) 288,867 (54,403) (77,342) (131,745) Dividends (Note 35) - - - - - - - (11,559) (11,559) - (11,559) Dividends paid to non-controlling shareholders - - - - - - - - - (27,703) (27,703) Acquisition of subsidiaries (Note 40(a)) - - - - - - - - - 46,477 46,477 Capital subscribed by non-controlling shareholders, net - - - - - - - - - 6,512 6,512 Change in interest in subsidiaries (Note 40(c)) - - - - - (4,473) - - (4,473) 4,473 - Balance at 31.12.2013 as restated 1,907,108 (1,278,594) (62,122) - 6,518 8,730 (65) 839,723 1,421,298 1,182,528 2,603,826
The accompanying notes form an integral part of the financial statements.
79Consolidated Statement of Changes in Equity

(Restated) Note 2014 2013 S$’000 S$’000
Cash flows from operating activities Profit before income tax 475,039 610,077 Adjustments for: Depreciation of investment properties 23 10,781 7,063 Depreciation of property, plant and equipment 24 9,972 10,400 Interest expense 8 54,063 22,035 Gain on disposal of property, plant and equipment 9 (120) (146) Gain on disposal of subsidiaries 40(b) (76,572) - Negative goodwill 40(a) (8,669) (11,906) Gain on equity interest 40(a) (3,381) (45,847) Share of results of associated companies, net of tax (2,244) 2,887 Share of results of joint ventures, net of tax (10,142) 87,955 Allowance for impairment loss on trade receivables 16 74 412 Changes in fair value of financial assets at fair value through
profit or loss 9 (482) 34 Unrealised foreign exchange gain, net (17,664) (25,808) Interest income 7 (39,168) (31,607) Long-term investment written off 10 1,219 - Property, plant and equipment written off 10 - 10 Operating cash flows before working capital changes 392,706 625,559 Changes in working capital: Trade receivables (4,612) (353) Other current assets and receivables 31,213 (100,642) Inventories (233) 130 Trade payables 5,149 (14,659) Other payables and liabilities (4,638) (139,875) Cash generated from operations 419,585 370,160 Interest paid (50,111) (31,141) Interest received 39,167 31,614 Tax paid (65,962) (59,246) Net cash generated from operating activities 342,679 311,387
The accompanying notes form an integral part of the financial statements.
Sinarmas Land Limited Annual Report 201480
Consolidated Statement of Cash FlowsFor the Year Ended 31 December 2014

(Restated) Note 2014 2013 S$’000 S$’000
Cash flows from investing activities Acquisition of subsidiaries, net of cash acquired 40(a) (26,596) (215,406) Cash flow effect arising from consolidation of PDL group 40(a)(iii) - 110,877 Acquisition of an associated company - (10,417) Acquisition of additional interest in associated companies (15,367) (66,788) Acquisition of a joint venture (16,830) - Additional investments in joint ventures (8,415) (137,787) Investments in available-for-sale financial assets, net (12,221) (890) Proceeds from capital reduction in associated companies - 1,320 Proceeds from capital reduction in joint ventures - 83 Proceeds from disposal of property, plant and equipment 174 304 Proceeds from disposal of subsidiaries, net 40(b) 233,724 - Acquisition of and capital expenditure on investment properties 23 (152,084) (132,963) Capital expenditure on property, plant and equipment (31,931) (11,013) Capital expenditure on properties under development and
held for sale (319,355) 40,666 Proceeds from repayment of long-term receivables - 53,526 Dividends from associated companies and joint ventures 9,830 17,686 Net cash used in investing activities (339,071) (350,802) Cash flows from financing activities Proceeds from borrowings, net 54,096 222,795 Proceeds from issuance of bonds, net - 169,300 Capital subscribed by non-controlling shareholders 11,198 7,536 Capital returned to non-controlling shareholders (55,000) (1,024) Increase in time deposits pledged (17,348) (53,034) Payment of dividends (36,435) (39,262) Payments of obligations under finance leases (41) (110) Net cash (used in)/generated from financing activities (43,530) 306,201 Net (decrease)/increase in cash and cash equivalents (39,922) 266,786 Cash and cash equivalents at the beginning of the year 761,658 652,079 Effect of exchange rate changes on cash and cash equivalents 81,140 (157,207) Cash and cash equivalents at the end of the year 14 802,876 761,658
The accompanying notes form an integral part of the financial statements.
81Consolidated Statement of Cash Flows

These notes form an integral part of and should be read in conjunction with the accompanying financial statements: 1 General
Sinarmas Land Limited (the “Company”) is incorporated and domiciled in Singapore and is listed on the Singapore Exchange Securities Trading Limited. The Company’s registered office and principal place of business is at 108 Pasir Panjang Road, #06-00 Golden Agri Plaza, Singapore 118535. The Company is principally an investment holding company. The Company and its subsidiaries (collectively, the “Group”) are involved in the property business, through its investments in Indonesia, China, Malaysia, Singapore and United Kingdom.
The subsidiaries, associated companies and joint ventures, including their principal activities, countries of incorporation, and the extent of the Company’s equity interests in those subsidiaries, associated companies and joint ventures are set out in Notes 42, 43 and 20 to the financial statements respectively. The statement of financial position of the Company and the consolidated financial statements of the Group as at and for the year ended 31 December 2014 were authorised for issue by the Board of Directors on 18 March 2015.
2 New and Revised Financial Reporting Standards (“FRSs”)
(a) Adoption of New and Revised FRSs
The Group has adopted the following new and revised FRSs that are relevant to its operations and effective for annual periods beginning on 1 January 2014. Except for the adoption of FRS 110, of which the effect is discussed below, the adoption of the new and revised FRSs has had no material financial impact on the financial statements of the Group and the Company. They did however give rise to additional disclosures including, in some cases, revision to accounting policies.
(i) FRS 110, Consolidated Financial Statements FRS 110 changes the definition of control and applies it to all investees to determine the scope of consolidation. The requirements under FRS 110 will apply to all types of potential subsidiary. It requires an investor to reassess the decision whether to consolidate an investee when events indicate that there may be a change to one of the three elements of control, i.e. power, variable returns and the ability to use power to affect returns. In accordance with FRS 110, the Group reassessed the control conclusion for its investees. Consequently, the Group has changed its control conclusion in respect of its investment in PT Puradelta Lestari Tbk (“PDL”) which was previously accounted for as an associated company using the equity method. Although the Group controls only 50% of PDL’s voting rights, management has determined that the Group has had control over PDL, on a de facto power basis, due to management restructuring amongst the shareholders of PDL whereby a revised investor agreement was entered into in April 2013 between the shareholders of PDL. Accordingly, the Group applied acquisition accounting to the investment in April 2013, and restated the relevant amounts as if the investee had been consolidated from that date.
Sinarmas Land Limited Annual Report 201482
Notes to the Financial Statements31 December 2014

2 New and Revised Financial Reporting Standards (“FRSs”) (cont’d)
(a) Adoption of New and Revised FRSs (cont’d) (i) FRS 110, Consolidated Financial Statements (cont’d)
Accordingly, the comparatives have been restated with the following impact: As previously
reported in 2013
Restated for
2013 S$’000 S$’000 Consolidated income statement Revenue 985,036 1,178,787 Cost of sales (293,322) (401,670) Operating profit 502,520 580,428 Other income/(expenses), net 9,843 (28,104) Profit before income tax 524,269 610,077 Income tax (59,255) (69,323) Total profit for the year 465,014 540,754
Profit attributable to: Owners of the Company 252,481 288,867 Non-controlling interests 212,533 251,887
As previously
reported 31/12/2013
Restated for 31/12/2013
S$’000 S$’000 Consolidated statement of financial position Associated companies 592,138 195,822 Properties under development for sale 859,365 1,446,235 Property, plant and equipment 124,327 129,568 Long-term receivables 73,732 413 Cash and cash equivalents 687,733 816,221 Other current assets 228,664 240,067 Properties held for sale 369,188 547,179 Total Assets 3,559,299 3,999,657
Other payables and liabilities 374,868 504,897 Income taxes payables 5,550 5,894 Long-term liabilities 201,448 227,362 Total Liabilities 1,239,544 1,395,831
Equity attributable to Owners of the Company 1,482,769 1,421,298 Non-controlling interests 836,986 1,182,528 Total Equity 2,319,755 2,603,826
(ii) FRS 28, Investments in Associates and Joint Ventures FRS 28 (Revised) changes in scope as a result of the issuance of FRS 111, Joint Arrangements. It continues to prescribe the mechanics of equity accounting.
83Notes to the Financial Statements

2 New and Revised Financial Reporting Standards (“FRSs”) (cont’d)
(a) Adoption of New and Revised FRSs (cont’d)
(iii) FRS 111, Joint Arrangements FRS 111 supersedes FRS 31, Interests in Joint Ventures. It eliminates the option of using proportionate consolidation for a jointly controlled entity. FRS 111 also eliminates the categories of “jointly controlled operations” and “jointly controlled assets” under FRS 31 which will now fall into the newly defined category “joint operations”. (iv) FRS 112, Disclosure of Interests in Other Entities FRS 112 combines the disclosure requirements for subsidiaries, joint arrangements, associates and structured entities within a comprehensive disclosure standard. It replaces the requirements previously included in FRS 27, Consolidated and Separate Financial Statements, FRS 28, Investments in Associates, and FRS 31, Interests in Joint Ventures.
(b) New and Amended FRSs issued but not yet effective As at the date of these financial statements, the Group has not adopted the following new and amended FRSs that have been issued but are not yet effective: Description
Effective for annual periods beginning on
or after FRS 109, Financial Instruments 1 January 2018
FRS 115, Revenue from Contracts with Customers 1 January 2017
Amendments to:
FRS 19, Defined Benefit Plans: Employee Contribution FRS16 and FRS 38, Clarification of Acceptable Methods of Depreciation
and Amortisation FRS 27, Equity Method in Separate Financial Statements FRS 110 and FRS 28, Sale or Contribution of Assets between an Investor
and its Associate or Joint Venture FRS 111, Accounting for Acquisitions of Interest in Joint Operations
1 July 2014
1 January 2016
1 January 2016 1 January 2016
1 January 2016
Improvements to FRSs (2014)
FRS 16, Property, Plant and Equipment FRS 24, Related Party Disclosures FRS 40, Investment Property FRS 103, Business Combinations FRS 108, Operating Segments FRS 113, Fair Value Measurement FRS 19, Employee Benefits FRS 105, Non-current Assets Held for Sale and Discontinued Operations FRS 107, Financial Instruments: Disclosures
1 July 2014 1 July 2014 1 July 2014 1 July 2014 1 July 2014 1 July 2014
1 January 2016 1 January 2016 1 January 2016
The directors of the Company expect that the adoption of the new and amended FRSs above except for FRS 109 and FRS 115 will have no material financial impact on the financial statements in the period of initial application. The Group is in the process of assessing the impact of FRS 109 and FRS 115 on the financial statements.
Sinarmas Land Limited Annual Report 201484
Notes to the Financial Statements31 December 2014

3 Summary of Significant Accounting Policies
(a) Basis of Preparation
The financial statements, which are expressed in Singapore dollar, are prepared in accordance with the historical cost convention, except as discussed in the accounting policies below. The consolidated financial statements of the Group and the statement of financial position of the Company have been prepared in accordance with the provisions of the Singapore Companies Act, Chapter 50 and FRSs. As part of the Restructuring Exercise in 1997 whereby the Company acquired from the Sinar Mas Group its subsidiaries and associated companies (“Restructuring Exercise 1997”), certain property, plant and equipment, investment properties and properties held for development and sale have been revalued by independent professional valuers as at 30 September 1996. Accordingly, the revalued amount is deemed to be the cost to the Group. The preparation of financial statements requires the use of accounting estimates and judgements that affect the application of accounting policies and the reported amounts of assets, liabilities, income and expenses as well as the disclosures of contingent assets and contingent liabilities. Although these estimates are based on management’s best knowledge of current events and actions, actual results may actually differ from these estimates. Critical accounting estimates and assumptions used that are significant to the financial statements, and areas involving a higher degree of judgement or complexity, are disclosed in Note 5 to the financial statements.
(b) Functional and Presentation Currency Items included in the financial statements of each entity in the Group are measured using the currency of the primary economic environment in which the entity operates (the “functional currency”). The consolidated financial statements are presented in Singapore dollar, which is the Company’s functional and presentation currency that reflects the primary economic environment in which the Company operates. All values are rounded to the nearest thousand ($’000) except when otherwise indicated.
(c) Foreign Currency Transactions and Translation Foreign currency transactions are translated into the respective functional currencies of the entities in the Group using the exchange rates prevailing at the dates of transactions. Foreign exchange gains and losses resulting from the settlement of such transactions and arising from the translation of foreign currency denominated monetary assets and liabilities at the exchange rates prevailing at the end of the reporting period are recognised in the income statement. Non-monetary items that are measured in terms of historical cost in foreign currency are translated using the exchange rates prevailing at the date of transactions. Non-monetary items that are measured at fair value in foreign currency are translated using the exchange rate at the date that the fair value was determined. Currency translation differences on financial assets at fair value through profit or loss are recognised as part of the fair value gain or loss in the income statement while the translation differences on available-for-sale financial assets are recognised in other comprehensive income.
85Notes to the Financial Statements

3 Summary of Significant Accounting Policies (cont’d)
(c) Foreign Currency Transactions and Translation (cont’d) In the preparation of the consolidated financial statements, the financial statements of those subsidiaries whose functional currency is not Singapore dollar (i.e. foreign entities) are translated into Singapore dollar, as follows: (i) assets and liabilities are translated at the closing rate at the end of the reporting period;
(ii) share capital and reserves are translated at historical exchange rates; and
(iii) revenue and expenses are translated at average exchange rates for the period which approximate the
exchange rates prevailing on the transactions dates (unless the average rate is not a reasonable approximation of the cumulative effect of rates prevailing on the transactions dates, in which case, revenue and expenses are translated using the exchange rate at the dates of the transactions).
Exchange differences arising from the above translations are recognised in other comprehensive income and these are accumulated in foreign currency translation reserve. On consolidation, exchange differences arising from the translation of net investments in foreign entities (including monetary items that in substance form part of the net investment in foreign entities) are recognised in other comprehensive income. On disposal, the accumulated translation differences are reclassified to the income statement as part of the gain or loss on disposal in the period in which the foreign entity is disposed of.
(d) Basis of Consolidation
The consolidated financial statements comprise the financial statements of the Company and its subsidiaries made up to 31 December, after elimination of material balances, transactions and any unrealised profit or loss on transactions between the Group entities. Subsidiaries are consolidated from the date on which control is transferred to the Group and cease to be consolidated from the date on which control ceases. The consolidated financial statements are prepared using uniform accounting policies for like transactions and other events in similar circumstances. The acquisition method of accounting is used to account for the acquisition of subsidiaries. The consideration transferred in a business combination is measured at fair value at the date of acquisition, which is the sum of the fair values of the assets transferred, the liabilities incurred by the acquirer to former owners of the acquiree, and the equity interests issued by the acquirer. Acquisition related costs are to be expensed through the income statement as incurred. Identifiable assets acquired and liabilities assumed in a business combination are measured at their fair values. Any non-controlling interest at the date of acquisition in the acquiree is measured at fair value or at the non-controlling interest’s proportionate share of the acquiree’s net identifiable assets.
Non-controlling interests in the net assets of consolidated subsidiaries are identified separately from the Group’s consolidated statement of comprehensive income, statement of financial position and consolidated statement of changes in equity. Non-controlling interests consist of the amount of those interests at the date of the original business combination and the non-controlling interests’ share of changes in equity since the date of the combination.
Changes in the Group’s interest in a subsidiary that do not result in loss of control are accounted for as transactions with equity owners of the Company. Any difference between the change in carrying amounts of the non-controlling interest and the value of consideration paid or received is recognised in other reserves, within equity attributable to the owners of the Company.
Sinarmas Land Limited Annual Report 201486
Notes to the Financial Statements31 December 2014

3 Summary of Significant Accounting Policies (cont’d)
(d) Basis of Consolidation (cont’d)
When the Group ceases to have control, any retained interest in the entity is re-measured to its fair value at the date when control is lost, with the change in carrying amount recognised in the income statement. The fair value is the initial carrying amount for the purpose of subsequently accounting for the retained interest as an associate, joint venture or financial asset. In addition, any amounts previously recognised in other comprehensive income in respect of that entity are accounted for as if the Group had directly disposed of the related assets or liabilities. This may mean that amounts previously recognised in other comprehensive income are reclassified to the income statement. (e) Subsidiaries Subsidiaries are entities over which any of the Group companies have control. The Group companies control an entity if and only if they have power over the entity and when they are exposed to, or have rights to variable returns from their involvement with the entity, and have the ability to use their power over the entity to affect those returns. The Group will re-assess whether or not it controls an investee if facts and circumstances indicate that there are changes to one or more of the three elements of control. Investment in subsidiaries in the financial statements of the Company are stated at cost, less any impairment losses. Intercompany loan to subsidiaries for which settlement is neither planned nor likely to occur in the foreseeable future and are in substance, a part of the Company’s net investment in those subsidiaries are stated at cost less any accumulated impairment loss. Such balances are eliminated in full in the consolidated financial statements. (f) Joint Ventures Joint ventures are entities over which the Group has contractual arrangements to jointly share the control over the economic activity of the entities with one or more parties and have rights to the net assets of the arrangements. Investments in joint ventures are initially recognised at cost. The cost of an acquisition is measured at the fair value of the assets given, equity instruments issued or liabilities incurred or assumed at the date of exchange, plus costs directly attributable to the acquisition. Goodwill on joint ventures represents the excess of the cost of acquisition of the joint venture over the Group’s share of the fair value of the identifiable net assets of the joint venture and is included in the carrying amount of the investments. In applying the equity method of accounting, the Group’s share of its joint ventures’ post-acquisition profit or losses are recognised in the income statement and its share of post-acquisition other comprehensive income is recognised in other comprehensive income. These post-acquisition movements and distributions received from the joint ventures are adjusted against the carrying amount of the investments. When the Group’s share of losses in an joint venture equals to or exceeds its interest in the joint venture, including any other unsecured non-current receivables, the Group does not recognise further losses, unless it has obligations to make or has made payments on behalf of the joint venture. Unrealised gains on transactions between the Group and its joint ventures are eliminated to the extent of the Group’s interest in the joint ventures. Unrealised losses are also eliminated unless transactions provide evidence of impairment of the assets transferred. The accounting policies of joint ventures have been changed where necessary to ensure consistency with the accounting policies adopted by the Group.
87Notes to the Financial Statements

3 Summary of Significant Accounting Policies (cont’d)
(g) Associated Companies Associated companies are entities in which the Group has significant influence but not control, which generally occurs when the Group holds, directly or indirectly, 20% or more of the voting power of the investee, or is in a position to exercise significant influence on the financial and operating policy decisions. Investments in associated companies are initially recognised at cost. The cost of an acquisition is measured at the fair value of the assets given, equity instruments issued or liabilities incurred or assumed at the date of exchange, plus costs directly attributable to the acquisition. Goodwill on associated companies represents the excess of the cost of acquisition of the associated company over the Group’s share of the fair value of the identifiable net assets of the associated company and is included in the carrying amount of the investments. In applying the equity method of accounting, the Group’s share of its associated companies’ post-acquisition profit or losses are recognised in the income statement and its share of post-acquisition other comprehensive income is recognised in other comprehensive income. These post-acquisition movements and distributions received from the associated companies are adjusted against the carrying amount of the investments. When the Group’s share of losses in an associated company equals to or exceeds its interest in the associated company, including any other unsecured non-current receivables, the Group does not recognise further losses, unless it has obligations to make or has made payments to behalf of the associated company. The accounting policies of associated companies have been changed where necessary to ensure consistency with the accounting policy adopted by the Group.
Unrealised gain on transactions between the Group and its associated companies are eliminated to the extent of the Group’s interest in the associated companies. Unrealised losses are also eliminated unless transactions provide evidence of impairment of the assets transferred. The accounting policies of associated companies have been changed where necessary to ensure consistency with the accounting policies adopted by the Group. Investments in associated companies are derecognised when the Group loses significant influence. Any retained equity interest in the entity is re-measured at its fair value. The difference between the carrying amount of the retained interest at the date when significant influence is lost and its fair value is recognised in the income statement. Gains and losses arising from partial disposals or dilutions in investments in associated companies in which significant influence is retained are recognised in the income statement.
(h) Deferred Charges
Deferred charges comprise certain expenditures, whose benefits extend over a period of more than one year, are initially recognised at cost are subsequently carried at cost less accumulated amortisation and any impairment loss. These costs are amortised to the income statement over the periods benefited using the straight-line method.
Sinarmas Land Limited Annual Report 201488
Notes to the Financial Statements31 December 2014

3 Summary of Significant Accounting Policies (cont’d)
(i) Goodwill
The excess of the aggregate of the consideration transferred, the amount of any non-controlling interest in the acquiree, and the fair value at the date of acquisition of any previous equity interest in the acquiree, over the fair value of the net identifiable assets acquired is initially recognised as “Goodwill” in the consolidated financial statements. Subsequently, goodwill is carried at cost less any accumulated impairment losses. Goodwill is tested for impairment annually or when circumstances change, indicating that goodwill might be impaired. If the Group’s interest in the net fair value of the identifiable assets and liabilities exceeds the consideration transferred and the non-controlling interest in the acquiree, the Group will reassess whether it has correctly identified all of the assets acquired and liabilities assumed, and any excess thereafter is recognised as an income immediately.
Goodwill on acquisition arising prior to 1 January 2001 has been charged in full to equity; such goodwill has not been retrospectively capitalised and amortised, as allowed under revised SAS 22, Business Combinations (revised 2003). Goodwill arising from business combinations occurring between 1 January 2001 and 1 July 2004 has been carried at net carrying value and subjected to an impairment test, while negative goodwill arising from business combinations occurring between 1 January 2001 and 1 July 2004 has been credited to retained earnings.
For the purposes of impairment testing, goodwill is allocated to each of the Group’s cash-generating units. If the recoverable amount of a cash-generating unit is estimated to be less than its carrying amount, the impairment loss is allocated first to reduce the carrying amount of any goodwill allocated to the unit and then to the other assets of the unit pro-rata on the basis of the carrying amount of each asset in the unit. An impairment loss recognised for goodwill is not reversed in a subsequent period.
(j) Investment Properties Investment properties are properties held either to earn rental income or for long-term capital appreciation or for currently indeterminate use. Investment properties are initially recognised at cost and subsequently carried at cost less accumulated depreciation and any impairment losses where the recoverable amount of the asset is estimated to be lower than its carrying amount. Depreciation is charged so as to write off the depreciable amount of assets, other than freehold land which is not depreciated, using the straight-line method to allocate the depreciable amounts over the estimated useful lives of 20 to 60 years.
The carrying amount includes the cost of replacing part of an existing investment property at the time that cost is incurred if the recognition criteria are met and excludes the costs of day-to-day servicing of an investment property. Investment properties are derecognised when either they have been disposed of or when the investment property is permanently withdrawn from use and no future economic benefit is expected from its disposal. Any gains or losses on the retirement or disposal of an investment property are recognised in the income statement in the year of retirement or disposal. The residual values and useful lives of investment properties are reviewed, and adjusted as appropriate, at the end of each reporting period.
89Notes to the Financial Statements

3 Summary of Significant Accounting Policies (cont’d)
(k) Property, Plant and Equipment
Property, plant and equipment are carried at cost, less accumulated depreciation and any impairment losses where the recoverable amount of the asset is estimated to be lower than its carrying amount. Depreciation is charged so as to write off the depreciable amount of assets, other than freehold land which is not depreciated, using the straight-line method, over the following estimated useful lives:
No. of years Freehold buildings - 20 to 50 Leasehold land, buildings and improvements - 5 to 50 Plant, machinery and equipment - 5 to 10 Motor vehicles, furniture and fixtures - 3 to 10
Assets held under finance leases are depreciated over their estimated useful lives on the same basis as owned assets or, where shorter, the term of the relevant leases. The residual values and estimated useful lives of property, plant and equipment are reviewed, and adjusted as appropriate, at the end of each reporting period.
Subsequent costs are included in the asset’s carrying amount only when it is probable that future economic benefits associated with the item will flow to the Group and the cost of the item can be measured reliably. The cost of maintenance and repairs is charged to the income statement as incurred; significant renewals and improvements are capitalised. When assets are retired or otherwise disposed of, their carrying amounts are derecognised and any resulting gains or losses are recognised in the income statement. The cost of construction in progress represents all costs (including borrowing costs on such borrowings) attributable to bringing the constructed asset to its working condition and getting it ready for its intended use. The accumulated costs will be reclassified to the appropriate asset class when the construction is completed. No depreciation charge is provided for construction in progress until the assets are transferred and used in operations.
(l) Cash and Cash Equivalents Cash and cash equivalents classified under current assets comprise cash on hand, cash in banks and time deposits which are short-term, highly liquid assets that are readily convertible into known amounts of cash and which are subject to an insignificant risk of changes in value. For the purpose of the consolidated statement of cash flows, cash and cash equivalents consist of cash and cash equivalents as defined above, net of time deposits pledged as security.
(m) Inventories
Inventories are measured at the lower of cost and net realisable value. Cost comprises all costs of purchase, cost of conversion and other costs incurred in bringing the inventories to their present location and condition. Net realisable value represents the estimated selling price less all estimated costs of completion and costs necessary to make the sale. Consumables are stated at cost using the FIFO (first-in first-out) method.
Sinarmas Land Limited Annual Report 201490
Notes to the Financial Statements31 December 2014

3 Summary of Significant Accounting Policies (cont’d)
(n) Properties under Development for Sale and Held for Sale Properties under development for sale consist of land and properties which are held with the intention of development and sale in the ordinary course of business. They are stated at cost less any impairment losses when the recoverable amount of the property is estimated to be lower than its carrying amount. Land held for development consists of land acquired which will be developed over more than one year. Upon commencement of development, the cost of land held for development will be transferred to properties under development. Each property under development is accounted for as a separate project. The cost of properties under development include land cost, direct development and construction costs, capitalised interest and other indirect costs incurred during the period of development. The cost is determined and/or allocated using the specific identification method. Allowances are recognised in the income statement for any foreseeable losses. Cost estimated and allocation are reviewed and adjusted as appropriate, at the end of each reporting period. On the completion of the development, the accumulated cost will be reclassified as properties held for sale under current assets whereas properties held for investment purposes will be reclassified as investment properties under non-current assets.
Properties held for sale are stated at the lower of cost and/or net realisable value. Net realisable value represents the estimated selling price less costs to be incurred in selling the property.
(o) Financial Assets
The Group classifies its non-derivative financial assets in the following categories: loans and receivables, fair value through profit or loss and available-for-sale. The classification depends on the purpose for which the financial assets are acquired. Management determines the classification of its financial assets at initial recognition. The Group initially recognises loans and receivables, advances and deposits on the date they are originated. All other financial assets are recognised initially on the trade date which is the date that the Group becomes a party to the contractual provisions of the instrument. Financial assets are derecognised when, and only when, the contractual rights to the cash flows from the financial assets have expired, or have been transferred and transferred substantially all the risks and rewards of ownership of the financial assets to another entity.
Loans and receivables are non-derivative financial assets with fixed or determinable payments that are not quoted in an active market. They arise when the Group provides money, goods or services directly to a debtor with no intention of trading the receivable. The Group’s loans and receivables comprise trade and other receivables and cash and cash equivalents. Loans and receivables are recognised initially at fair value which is normally the original invoiced amount plus, any directly attributable transaction costs, and subsequently carried at amortised cost using the effective interest method. Appropriate allowances for estimated irrecoverable amounts are recognised in the income statement when there is objective evidence that the asset is impaired. The allowance recognised is measured as the difference between the asset’s carrying amount and the present value of estimated future cash flows discounted at the effective interest rate computed at initial recognition. Gains and losses are recognised in the income statement when the loans and receivables are derecognised or impaired. Financial assets at fair value through profit or loss are financial assets held for trading. Financial assets at fair value through profit or loss are initially recognised at fair value with subsequent changes in fair value recognised in the income statement.
91Notes to the Financial Statements

3 Summary of Significant Accounting Policies (cont’d) (o) Financial Assets (cont’d) Available-for-sale financial assets are non-derivatives that are either designated in this category or not classified in any other category. Available-for-sale financial assets are recognised initially at fair value plus any directly attributable transaction costs, and subsequently carried at fair value with gains and losses being recognised in other comprehensive income until the investment is derecognised or until the investment is determined to be impaired at which time the previous gain or loss that has been recognised in other comprehensive income is reclassified from equity to the income statement. Available-for-sale financial assets that do not have a quoted market price in an active market and whose fair value cannot be reliably measured are measured at cost less any identified impairment losses at the end of each reporting period subsequent to initial recognition. Impairment losses recognised in the income statement for investments in equity instruments classified as available-for-sale are not subsequently reversed through the income statement.
(p) Impairment of Non-Financial Assets excluding Goodwill
At the end of each reporting period, the Group reviews the carrying amounts of its non-financial assets excluding goodwill to determine whether there is any indication that those assets have suffered an impairment loss or whether there is any indication that an impairment loss previously recognised for an asset in prior years may no longer exist or may have decreased. If any such indication exists, the recoverable amount of the asset is estimated in order to determine the extent of the impairment loss. An asset’s recoverable amount is calculated as the higher of the asset’s value in use and its fair value less cost of disposal. Where it is not possible to estimate the recoverable amount of an individual asset, the Group estimates the recoverable amount of the cash generating unit to which the asset belongs. If the recoverable amount of an asset (or cash-generating unit) is estimated to be less than its carrying amount, the carrying amount of the asset (or cash-generating unit) is reduced to its recoverable amount. Impairment losses are recognised as an expense immediately, unless the relevant asset is carried at a revalued amount, in which case the impairment loss is treated as a revaluation decrease.
Where an impairment loss subsequently reverses, the carrying amount of the asset (or cash-generating unit) is increased to the revised estimate of its recoverable amount, but only to the extent that it does not restate the asset to a carrying amount in excess of what would have been determined (net of any depreciation) had no impairment loss been recognised for the asset (or cash-generating unit) in prior years. A reversal of an impairment loss is recognised as income immediately, unless the relevant asset is carried at a revalued amount, in which case the reversal of the impairment loss is treated as a revaluation increase.
Sinarmas Land Limited Annual Report 201492
Notes to the Financial Statements31 December 2014

3 Summary of Significant Accounting Policies (cont’d)
(q) Financial Liabilities and Equity
Financial liabilities and equity instruments are classified according to the substance of the contractual arrangements entered into. Debt instruments issued which carry a right to convert to equity that is dependent on the outcome of uncertainties beyond the control of both the Group and the holder are classified as liabilities. Significant financial liabilities include finance lease obligations, interest-bearing borrowings, bonds payables and trade and other payables. The accounting policies adopted for finance lease obligations and convertible bonds are outlined in Note 3(r) and Note 3(s) respectively.
Interest-bearing borrowings and bonds payables are recorded at the proceeds received, net of direct issue costs. Direct issue costs are amortised over the period of the bonds. Finance charges, including premiums payable on settlement or redemption, are accounted for on an accrual basis and are added to the carrying amount of the instrument to the extent that they are not settled in the period in which they arise. Interest-bearing borrowings and bonds payables are subsequently measured at amortised cost using the effective interest method, with interest expense recognised on an effective yield basis. Financial liabilities are derecognised when, and only when, the obligations are discharged, cancelled or expired. The difference between the carrying amount of the financial liability derecognised and consideration paid and payable is recognised in the income statements.
Trade and other payables are carried at cost which is the fair value of the consideration to be paid in the future for goods and services received. Interest-bearing trade and other payables are recognised initially at cost less attributable transaction costs and subsequently stated at amortised cost using the effective interest method. Ordinary shares are classified as equity. Equity is recorded at the proceeds received, net of direct issue costs.
(r) Leases
(i) When the Group is the lessee
Lessee – Finance leases Leases where the Group assumes substantially all risks and rewards incidental to ownership of the leased assets are classified as finance leases. The leased assets and the corresponding lease liabilities (net of finance charges) under finance leases are recognised on the statement of financial position as property, plant and equipment and obligations under finance leases respectively, at the inception of the leases based on the lower of the fair value of the leased assets and the present value of the minimum lease payments. Each lease payment is apportioned between the finance expense and the reduction of the outstanding lease liability. The finance expense is recognised in the income statement on an effective yield basis. Lessee – Operating leases Leases where substantially all risks and rewards incidental to ownership are retained by the lessors are classified as operating leases. Payments made under operating leases (net of any incentives received from the lessors) are recognised in the income statement on a straight-line basis over the period of the lease. Contingent rents are recognised as an expense in the income statement when incurred.
93Notes to the Financial Statements

3 Summary of Significant Accounting Policies (cont’d)
(r) Leases (cont’d) (ii) When the Group is the lessor
Lessor – Finance leases Leases where the Group has transferred substantially all risks and rewards incidental to ownership of the leased assets to the lessees, are classified as finance leases. The leased asset is derecognised and the present value of the lease receivable (net of initial direct costs for negotiating and arranging the lease) is recognised on the statement of financial position. The difference between the gross receivable and the present value of the lease receivable is recognised as unearned finance income. Each lease payment received is applied against the gross investment in the finance lease receivable to reduce both the principal and the unearned finance income. The finance income is recognised in the income statement on an effective yield basis. Initial direct costs incurred by the Group in negotiating and arranging finance leases are added to finance lease receivables and recognised as an expense in the income statement over the lease term on the same basis as the lease income.
(s) Convertible Financial Instruments Convertible financial instruments are regarded as compound instruments, consisting of a liability component and an equity component. At the date of issue, the fair value of the liability component is estimated using the prevailing market interest rate for similar non-convertible debt. The difference between the proceeds of issue of the convertible financial instruments and the fair value assigned to the liability component, representing the embedded option to convert the liability into equity of the Group, is included in capital reserves (equity) if the option is converted into a fixed number of equity shares or as a financial liability if the option is converted into a variable number of equity shares based on an exercise price of a prescribed percentage of the net tangible assets at the exercise date. Correspondingly, a discount on the financial instruments is recorded and amortised over the period of the financial instruments. Gains and losses arising from changes in fair value of the embedded option (financial liability) are included in the income statement.
(t) Provisions Provisions are recognised when the Group has a legal or constructive obligation as a result of a past event and it is probable that it will result in an outflow of economic benefits that can be reasonably estimated.
(u) Borrowing Costs Interest expense and similar charges are expensed in the income statement in the period in which they are incurred, except to the extent they are capitalised as being directly attributable to the acquisition and construction of an asset which necessarily takes a substantial period of time to be prepared for its intended use or sale.
Sinarmas Land Limited Annual Report 201494
Notes to the Financial Statements31 December 2014

3 Summary of Significant Accounting Policies (cont’d)
(v) Income Tax Current income tax for current and prior years is recognised at the amount expected to be paid to or recovered from the tax authorities, using the tax rates and tax laws that have been enacted or substantially enacted by the end of each reporting period.
Deferred income tax is provided in full, using the liability method, on temporary differences arising between the tax bases of assets and liabilities and their carrying amounts in the financial statements. Deferred income tax is recognised in the income statement, except when it relates to items recognised in other comprehensive income or directly to equity, in which case the deferred income tax is also dealt with in other comprehensive income or directly in equity. Deferred tax assets and liabilities are offset when they relate to income taxes levied by the same tax authority. The amount of deferred income tax is based on the expected manner of realisation or settlement of the carrying amount of assets and liabilities, using tax rates enacted or substantively enacted at the end of each reporting period.
Deferred tax assets are recognised to the extent that it is probable that future taxable profits will be available against which the temporary differences can be utilised. Deferred income tax is provided on temporary differences arising on investments in subsidiaries and associated companies except where the timing of the reversal of the temporary difference can be controlled and it is probable that the temporary difference will not reverse in the foreseeable future.
(w) Dividend Distribution Dividend distribution to the Company’s shareholders is recognised as a liability in the Company’s financial statements in the period in which the dividends are approved for payment. (x) Post Employment Benefits Certain subsidiaries have unfunded defined benefit retirement plans covering substantially all of their eligible permanent employees in accordance with the Indonesian Labor Law No. 13/2003 dated 25 March 2003 (Law 13/2003). The obligation for Law 13/2003 has been accounted for using the projected unit credit method, with actuarial valuations being carried out at the end of each reporting period. Current service costs, interest costs and effects of curtailments and settlements (if any) are recognised directly in the current year’s income statement. Actuarial gains or losses is reflected immediately in the statement of financial position with a charge or credit recognised immediately in other comprehensive income in the period in which they occur and past service costs are recognised immediately in the income statements when incurred. The retirement plan obligations recognised in the statement of financial position represents the present value of the defined benefit obligation. Any asset resulting from this calculation is limited the present value of available refunds and reductions in the future contributions to the plan.
Fixed contributions paid to state-managed post employment benefits schemes, such as the Central Provident Fund, on a mandatory, contractual or voluntary basis are recognised as an expense in the income statement in the period in which services are rendered by employees. The Group has no further payment obligation once the contributions have been paid.
95Notes to the Financial Statements
3 Summary of Significant Accounting Policies (cont’d)
(y) Revenue Recognition
Revenue is recognised to the extent that it is probable that the economic benefits will flow to the Group and the revenue can be reliably measured. Revenue is recognised in the income statement as follows: (i) Revenue from the sale of development properties is recognised using the completed contract method
when the Group’s significant risks and rewards of ownership in the real estate have been transferred to the customers and the Group does not have a substantial continuing involvement with the properties. This generally coincides with the point in time when the development property is delivered to the customer. No revenue is recognised when there is uncertainty as to the collectability due or the possible return of units sold.
(ii) Revenue from rental of investment properties under operating leases is recognised on a straight-line
basis over the terms of the lease contracts. (iii) Hotel room revenue is recognised based on room occupancy while other hotel revenues are
recognised when the goods are delivered or the services are rendered to the customers. (iv) Interest income is accrued on a time-proportion basis, by reference to the principal outstanding and at
the effective interest rate applicable.
(v) Dividend income from investments is recognised on the date the dividends are declared payable by the investees.
(vi) Revenue arising from sales of goods is recognised when the products are delivered to the customers
and collectability of the related receivables is probable. (vii) Club membership revenue is recognised over the term of the membership period.
(z) Segment Reporting The chief operating decision maker has been identified as the Executive Committee of the Group, which consists of the Executive Chairman, the Chief Executive Officer and Executive Directors. This committee reviews the Group’s internal reporting in order to assess performance and allocate resources. Operating segments are reported in a manner consistent with the internal reporting. The Executive Committee assesses the performance of the operating segments based on a measure of adjusted earnings before income tax, non-controlling interests, interest on borrowings, foreign exchange gain/(loss), depreciation and amortisation expenses, exceptional items, share of results of associated companies and joint ventures (“EBITDA”). All inter segment sales and transfers are accounted for as if the sales or transfers were to a third party, i.e. at current market prices.
Sinarmas Land Limited Annual Report 201496
Notes to the Financial Statements31 December 2014

3 Summary of Significant Accounting Policies (cont’d)
(aa) Financial Guarantees
The Company has issued corporate guarantees to creditors for borrowings of its subsidiaries. These guarantees are financial guarantee contracts as they require the Company to reimburse the creditors if the borrowers fail to make principal or interest payments when due in accordance with the terms of their borrowings. Financial guarantee contracts are initially recognised at fair values plus transaction costs. Financial guarantee contracts are subsequently amortised to the income statement over the period of the subsidiaries’ borrowing, unless the Company has incurred an obligation to reimburse the creditors for an amount higher than the unamortised amount. In this case, the financial guarantee contracts shall be carried at the expected amount payable to the creditors.
4 Financial Risk Management
(a) Capital Risk Management The Group manages its capital to safeguard the Group’s ability to continue as a going concern in order to maximise return to shareholders and benefits for other stakeholders and to maintain an optimal capital structure to reduce the cost of capital. The Group’s overall strategy remains unchanged since 2013. The capital structure of the Group consists of total equity, comprising issued capital and other components within equity and net cash, which includes the cash and cash equivalents net of total borrowings. Total borrowings include bank borrowings, bonds payables and obligations under finance leases.
Neither the Group nor the Company is subject to any externally imposed capital requirements.
The net cash and total equity as at 31 December 2014 and 2013 are as follows:
(Restated) 2014 2013
S$’000 S$’000 Total cash and cash equivalents 874,787 816,221 Total borrowings (744,427) (638,851) Net cash 130,360 177,370
Total equity 3,193,228 2,603,826
The directors of the Company review the capital structure on a semi-annual basis. As a part of the review, the directors of the Company consider the cost of capital and the risks associated with each class of capital. Accordingly, the Group will balance its overall capital structure through the payment of dividends, new share issues and share buy-back as well as the issue of new debt or the redemption of existing debt.
97Notes to the Financial Statements

4 Financial Risk Management (cont’d)
(b) Financial Risk Management The Group’s activities expose it to a variety of financial risks: market risks (including interest rate risk, foreign currency risk and price risk), credit risk, liquidity risk and cash flow risk. The Group’s overall risk management strategy seeks to minimise adverse effects from the unpredictability of financial markets on the Group’s financial performance. The Group may use relevant financial instruments to manage certain risks. Such financial instruments are not held for trade or speculative purposes. (i) Interest Rate Risk
The Group is exposed to interest rate risk primarily on its existing interest-bearing financial instruments. Financial instruments issued at variable rates expose the Group to cash flow interest rate risk. Financial instruments issued at fixed rates expose the Group to fair value interest rate risk. The interest rate that the Group will be able to obtain on its financial instruments will depend on market conditions at that time, and may differ from the rates the Group has secured currently. At 31 December 2014, if interest rates on all net financial assets at variable rate had been 0.5% lower/higher with all other variables held constant, profit before income tax for the year and total equity would have been $2,247,000 (2013: $2,176,000) and $1,643,000 (2013: $1,485,000) lower/higher respectively, mainly as a result of lower/higher interest income on net financial assets at variable rate, net of applicable income taxes. This analysis is prepared assuming the amount of net financial assets outstanding at the end of the reporting period was outstanding for the whole year. The interest rates and repayment terms of interest-bearing financial instruments are disclosed in the respective notes to the financial statements. The interest rate profile of the Group’s financial instruments as at the end of the reporting period was as follows:
(Restated) 2014 2013 S$’000 S$’000
Financial assets Fixed rate 119,564 106,761 Variable rate 707,881 688,054 Non-interest bearing 127,981 49,893 955,426 844,708
Financial liabilities Fixed rate 491,447 425,370 Variable rate 258,528 252,888 Non-interest bearing 102,084 81,804 852,059 760,062
Sinarmas Land Limited Annual Report 201498
Notes to the Financial Statements31 December 2014

4 Financial Risk Management (cont’d)
(b) Financial Risk Management (cont’d) (ii) Foreign Currency Risk The Group operates in several countries. Entities within the Group may transact in currencies other than their respective functional currency (“foreign currency”) such as the United States Dollar (“USD”), the Indonesian Rupiah (“IDR”), the Japanese Yen (“JPY”), the Malaysian Ringgit (“RM”), the British Pound (“GBP”) and the Singapore Dollar (“SGD”) which is also the Company’s presentation currency. The Group faces foreign exchange risk as its borrowings and cost of certain key purchases are either denominated in foreign currencies or whose price is influenced by their benchmark price movements in foreign currencies (especially USD) as quoted on international markets. The Group does not have any formal hedging policy for its foreign exchange exposure and did not actively engage in activities to hedge its foreign currency exposures during the financial year. The Group seeks to manage the foreign currency risk by constructing natural hedges where it matches revenue and expenses in any single currency.
The Group is also exposed to currency translation risks arising from its net investments in foreign operations. These net investments are not hedged as currency positions as these foreign operations are considered long-term in nature.
The entities within the Group have different functional currencies depending on the currency of their primary economic environment. A 5% strengthening of the functional currency of these entities against the following currencies at the reporting date would increase/(decrease) the Group’s profit before income tax by the amount shown below. This analysis assumes that all other variables, in particular interest rates, remain constant:
Group (Restated) 2014 2013 S$’000 S$’000
SGD against functional currency of USD 17,869 28,237 USD against functional currencies of SGD, RM and IDR (12,162) (7,033) IDR against functional currencies of SGD and USD (8,378) (6,362) GBP against functional currencies of SGD and USD (5,313) (4,582) JPY against functional currencies of SGD and USD (1,660) (3,060)
99Notes to the Financial Statements

4 Financial Risk Management (cont’d)
(b) Financial Risk Management (cont’d) (iii) Price Risk Price risk is the risk that the value of the financial instrument will fluctuate as a result of changes in market prices. The Group is exposed to equity securities price risk arising from its investments held that are classified as available-for-sale and fair value through profit or loss. The Group monitors the market closely to ensure that the risk exposure to the volatility of the investments is kept to a minimum. As at the end of the reporting period, the Group has no significant exposure to price risk. (iv) Credit Risk Credit risk is the risk of financial loss to the Group if a customer or counter-party to a financial instrument fails to meet its contractual obligations, and arises principally from the Group’s receivables from customers and cash and cash equivalents. Trade debtors comprise mainly the Group’s customers who bought properties and tenants of investment properties. The tenants of investment properties and purchasers of development properties may default on their obligations to pay the amount owing to the Group. The Group manages credit risks by requiring the customers/tenants to furnish cash deposits, and/or bankers’ guarantees. The Group also performs regular credit evaluations of its customers’ financial conditions and only entered into contracts with customers with an appropriate credit history.
For sales of development properties, the Group generally has certain recourse, which include forfeiture of deposit and/or installments paid and re-sale of the re-possessed properties. Cash and cash equivalents mainly comprise deposits with banks and financial institutions which are regulated. Concentrations of credit risk exist when changes in economic, industry or geographical factors similarly affect counter-parties whose aggregate credit exposure is significant in relation to the Group’s total credit exposure. The Group has no significant concentration of credit risks with exposure spread over a large number of counter-parties and customers.
The maximum exposure to credit risk in the event that the counter parties fail to perform their obligations as at the end of the reporting period in relation to each class of recognised financial assets is the carrying amount of those assets as stated in the statement of financial position, except as follows: Company 2014 2013
S$’000 S$’000 Corporate guarantees provided to financial institutions on borrowings of subsidiaries: - Total facilities 173,852 230,786 - Total outstanding 171,792 193,721
Sinarmas Land Limited Annual Report 2014100
Notes to the Financial Statements31 December 2014

4 Financial Risk Management (cont’d)
(b) Financial Risk Management (cont’d) (v) Liquidity Risk
To manage liquidity risk, the Group and Company maintain a level of cash and cash equivalents and funding facilities deemed adequate by management to finance its operations. In assessing the adequacy of the facilities, management reviews its working capital requirements.
The table below analyses the maturity profile of the Group’s financial liabilities based on the contractual undiscounted cash flows.
Less than
1 year
1 to 5 years
Over 5 years
Total S$’000 S$’000 S$’000 S$’000
Group At 31 December 2014 Borrowings 234,593 572,334 73,536 880,463 Other financial liabilities 93,283 14,349 - 107,632 Total financial liabilities 327,876 586,683 73,536 988,095
At 31 December 2013 (Restated) Borrowings 176,420 566,429 45,671 788,520 Other financial liabilities 96,272 24,939 - 121,211 Total financial liabilities 272,692 591,368 45,671 909,731
The table below analyses the maturity profile of the Company’s financial guarantees provided to financial institutions on subsidiaries’ borrowings that shows the remaining contractual maturities:
Less than
1 year
1 to 5 years
Over 5 years
Total S$’000 S$’000 S$’000 S$’000
Company At 31 December 2014 Financial guarantee contracts - 96,000 75,792 171,792
At 31 December 2013 Financial guarantee contracts 13,857 92,000 87,864 193,721
101Notes to the Financial Statements

5 Critical Accounting Estimates, Assumptions and Judgements
The Group makes estimates and assumptions concerning the future. Estimates, assumptions and judgements are continually evaluated and are based on historical experience and other factors, including expectations of future events that are believed to be reasonable under the circumstances.
(a) Critical Accounting Estimates and Assumptions Income Taxes
The Group is subject to income taxes in numerous jurisdictions. Significant judgement is required in determining the capital allowances, deductibility of certain expenses and taxability of certain income during the estimation of the provision for income taxes. There are many transactions and calculations for which the ultimate tax determination is uncertain during the ordinary course of business. The Group recognises liabilities based on estimates of whether additional taxes will be due. Where the final tax outcome is different from the amounts that were initially recorded, such differences will impact the income tax expense and income tax payable in the period in which such determination is made. As at 31 December 2014, the Group’s income taxes payable and income tax expense amounted to $1,388,000 (2013: $5,894,000) and $46,859,000 (2013: $69,323,000) (Note 11) respectively.
(b) Critical Judgement in Applying Accounting Policies
Classification of Properties Held for Sale and Properties under Development for Sale The Group presents its properties held for sale and properties under development for sale as current and non-current, depending on when it expects to realise the development properties. The Group classifies its properties held for sale as current when it expects to realise the assets in its normal operating cycle and/or expects to realise the assets within 12 months after the reporting period. All other development properties are classified as non-current. The carrying amount of the Group’s development properties expected to be realised within the next 12 months and after 12 months as at 31 December 2014 was $841,986,000 (2013: $547,179,000) and $1,738,500,000 (2013: $1,446,235,000) respectively.
6 Revenue
Group (Restated) 2014 2013 S$’000 S$’000
Sale of development properties 685,766 1,043,130 Rental income 84,525 72,352 Hotel revenue 11,069 14,557 Golf and resort operations 22,632 23,115 Others 24,560 25,633 828,552 1,178,787
Sinarmas Land Limited Annual Report 2014102
Notes to the Financial Statements31 December 2014

7 Finance Income
Group (Restated) 2014 2013 S$’000 S$’000
Interest income from: Cash and cash equivalents 38,501 31,472 Finance lease 479 - Available-for-sale financial assets 188 135 39,168 31,607
8 Finance Costs
Group (Restated) Note 2014 2013 S$’000 S$’000
Interest expense on: Loan payable 291 118 Obligations under finance leases 246 24 Borrowings 23,813 9,367 Bonds payables - bond interest 26,893 22,743 - amortisation of discount on bonds 30 2,380 3,020 - amortisation of deferred bond charges 30 440 344 Write back of option reserve - (13,581) 54,063 22,035
9 Other Operating (Expense)/Income
Group (Restated) 2014 2013 S$’000 S$’000
Property and estate management (expenses)/income, net (646) 2,802 Cancellation fees 1,244 1,598 Management and lease co-ordination fees 1,056 1,937 Gain on disposal of property, plant and equipment 120 146
Changes in fair value of financial assets at fair value through profit
or loss 482 (34) Gain on sale of other material - 474 Others (2,896) 1,642 (640) 8,565
103Notes to the Financial Statements

10 Profit Before Income Tax
In addition to the charges and credits disclosed elsewhere in the notes to the financial statements, this balance includes the following charges:
Group (Restated) 2014 2013 S$’000 S$’000
Audit fees paid/payable to: Auditors of the Company 248 248 Auditors of the subsidiaries 468 328 Non-audit fees paid/payable to: Auditors of the Company 35 - Auditors of the subsidiaries - 46 Property, plant and equipment written off - 10 Long-term investment written off 1,219 - Cost of inventories recognised as an expense (included in cost of sales) 3,184 3,619
11 Income Tax Group (Restated) 2014 2013 S$’000 S$’000 Tax expense is made up of: Current income tax - current year 46,684 69,365 - under/(over)-provision in respect of prior years 332 (36) 47,016 69,329 Deferred income tax (157) (6) 46,859 69,323
Substantially all the Group’s operations are located in Indonesia. Accordingly, the Indonesia statutory tax rate of 25% (2013: 25%) is used in the reconciliation of the tax expense and the product of accounting profit multiplied by the applicable tax rate.
Sinarmas Land Limited Annual Report 2014104
Notes to the Financial Statements31 December 2014

11 Income Tax (cont’d)
The income tax expense on the results for the financial year varies from the amount of income tax determined by applying the Indonesian statutory rate of income tax to profit before income tax due to the following factors:
Group (Restated) 2014 2013 S$’000 S$’000
Profit before income tax 475,039 610,077 (Less)/Add: Share of results of associated companies, net of tax (2,244) 2,887 (Less)/Add: Share of results of joint ventures, net of tax (10,142) 87,955 462,653 700,919 Tax calculated at a tax rate of 25% 115,663 175,230 Non-deductible items 26,274 30,229 Non-taxable items (35,771) (22,293) Effect of different tax rate categories (67,258) (126,565) Utilisation of previously unrecognised deferred tax assets (980) (242) Unrecognised deferred tax assets 8,171 12,885 Under/(Over)-provision in prior years’ income tax 332 (36) Others 428 115 46,859 69,323
As at 31 December 2014, the amount of unutilised tax losses and capital allowances available for offsetting against future taxable profits are as follows:
Group 2014 2013 S$’000 S$’000
Unutilised tax losses 208,677 248,466 Unabsorbed capital allowances 65,230 75,256 273,907 323,722
The breakdown of unutilised tax losses and capital allowance is as follows:
Group 2014 2013 S$’000 S$’000
Expiry dates 31 December 2014 - 29,094 31 December 2015 11,735 27,706 31 December 2016 18,090 16,882 31 December 2017 3,826 16,474 31 December 2018 17,251 29,453 31 December 2019 36,064 - No expiry dates subject to terms and conditions 186,941 204,113 273,907 323,722
105Notes to the Financial Statements

11 Income Tax (cont’d)
The availability of the unrecognised tax losses and capital allowances for set-off against future taxable profits is subject to the tax regulations of the respective countries in which the Group companies are incorporated. In Indonesia, the unutilised tax losses are available for set off against taxable profit immediately within a period of 5 years after such tax losses were incurred. As at 31 December 2014, the deferred tax benefit arising from unutilised tax losses and unabsorbed capital allowances of $273,907,000 (2013: $323,722,000) has not been recognised in the financial statements. Deferred tax liabilities of $63,640,000 (2013: $46,573,000) have not been recognised for taxes that would be payable on the remittance to Singapore of unremitted retained earnings of $636,405,000 (2013: $465,732,000) of certain subsidiaries, associated companies and joint ventures as the timing of the reversal of the temporary differences arising from such amounts can be controlled and such temporary differences are not expected to reverse in the foreseeable future.
12 Earnings Per Share and Net Asset Value Per Share (a) Basic Earnings Per Share
Basic earnings per share is calculated by dividing the net profit attributable to owners of the Company by the weighted average number of ordinary shares in issue during the financial year.
Group (Restated) 2014 2013 Net profit attributable to owners of the Company (S$’000) 240,592 288,867 Weighted average number of ordinary shares (’000) 3,041,959 3,041,959 Basic earnings per share (cents per share) 7.91 9.50
(b) Diluted Earnings Per Share
Diluted earnings per share is calculated by dividing net profit attributable to the owners of the Company by the weighted average number of ordinary shares during the year after adjustment for the effect of all diluted potential ordinary shares.
Group (Restated) 2014 2013
Net profit attributable to owners of the Company (S$’000) 240,592 288,867 Weighted average number of ordinary shares (’000) 3,041,959 3,041,959 Adjustment for warrants (’000) 1,258,289 1,231,819 4,300,248 4,273,778 Diluted earnings per share (cents per share) 5.59 6.76
(c) Net Asset Value Per Share
As at 31 December 2014, the net asset value per ordinary share based on the total equity attributable to the owners of the Company and the existing issued share capital of 3,041,959,437 (2013: 3,041,959,437) ordinary shares is $0.56 (2013: $0.47).
Sinarmas Land Limited Annual Report 2014106
Notes to the Financial Statements31 December 2014

13 Staff Costs and Retirement Benefit Obligations
Group (Restated) 2014 2013 S$’000 S$’000
Staff costs: Wages and salary 51,568 48,419 Employer’s contribution to defined contribution plans 598 652 Retirement benefit expenses 2,856 5,024 55,022 54,095
Retirement Benefit Obligations Certain subsidiaries in Indonesia recorded liabilities for unfunded defined benefit retirement plans in order to meet the minimum benefits required to be paid to qualified employees as required under the Indonesian Labor Law 13/2003. The amount of such obligations was determined based on actuarial valuations prepared by independent actuaries, PT Padma Radya Aktuaria, PT Kis Aktuaria and PT Katsir Imam Sapto Sejahtera Aktuaria. The principal actuarial assumptions used by the actuaries were as follows:
Group 2014 2013 % %
Discount rate 8.0 – 8.5 7.5 – 9.0 Salary growth rate 7.0 – 10.0 7.0 – 10.0
The components of the retirement benefit expenses recognised in the Group’s income statement are as follows:
Group (Restated) 2014 2013 S$’000 S$’000
Current service costs 2,714 2,863 Past service costs (2,264) (242) Interest costs 2,406 2,403 Retirement benefit expenses recognised in the income statement 2,856 5,024
The components of the retirement benefit expenses recognised in other comprehensive income are as follows:
Group (Restated) 2014 2013 S$’000 S$’000
Actuarial loss arising from changes in financial assumptions 1,092 - Actuarial loss arising from experience adjustment 2,054 -
Net retirement benefit expenses recognised in other comprehensive
income 3,146 -
107Notes to the Financial Statements

13 Staff Costs and Retirement Benefit Obligations (cont’d)
Movements in the retirement benefits obligations are as follows: Group (Restated) 2014 2013 S$’000 S$’000
At the beginning of the year 22,455 24,857
Retirement benefit expenses for the year recognised in the income
statement 2,856 5,024
Retirement benefit expenses for the year recognised in other
comprehensive income 3,146 - Acquisition of a subsidiary 268 - Payments made during the year (840) (1,210) Currency realignment 2,338 (6,216) At the end of the year 30,223 22,455 Less: Current portion classified as current liabilities (Note 29) (663) (559) Non-current portion (Note 33) 29,560 21,896 14 Cash and Cash Equivalents
Group Company (Restated) 2014 2013 2014 2013 S$’000 S$’000 S$’000 S$’000
Cash on hand 634 673 2 1 Cash in banks 163,618 111,820 45,675 11,337 Time deposits 710,535 703,728 - -
Cash and cash equivalents in the
statements of financial position 874,787 816,221 45,677 11,338
Time deposits pledged as security for credit facilities granted to the subsidiaries (Note 32) (71,911) (54,563) - -
Cash and cash equivalents in the
statement of cash flows 802,876 761,658 45,677 11,338
Cash and cash equivalents include balances with a related party of $13,169,000 (2013: $5,757,000) (Note 37(a)). Cash and cash equivalents are denominated in the following currencies:
Group Company (Restated) 2014 2013 2014 2013 S$’000 S$’000 S$’000 S$’000
Indonesian Rupiah 304,631 502,330 - - United States Dollar 374,497 229,005 2,715 10,734 British Pound 128,179 8,067 42,516 2 Chinese Renminbi 42,520 40,992 - - Japanese Yen 20,163 31,962 - - Singapore Dollar 3,025 2,925 446 602 Malaysian Ringgit 1,769 940 - - Hong Kong Dollar 3 - - - 874,787 816,221 45,677 11,338
Sinarmas Land Limited Annual Report 2014108
Notes to the Financial Statements31 December 2014

14 Cash and Cash Equivalents (cont’d)
The above time deposits earn interest at the following rates per annum:
Group Company (Restated) 2014 2013 2014 2013 % % % %
Indonesian Rupiah 5.3 – 11.0 2.5 – 9.0 - - United States Dollar 0.2 – 3.5 0.2 – 3.9 - - Japanese Yen 1.8 1.8 - - British Pound 0.4 – 0.5 - - - Chinese Renminbi 4.9 - - - Singapore Dollar - 0.3 – 0.4 - - Malaysian Ringgit - 3.0 – 3.2 - -
15 Short-Term Investments
Group Company 2014 2013 2014 2013 S$’000 S$’000 S$’000 S$’000
Financial assets at fair value through profit or loss:
Mutual funds, denominated in Indonesian Rupiah 1,275 1,007 - -
Available-for-sale financial assets:
Quoted bonds in a related party, denominated in Indonesian Rupiah (Note 37(a)) 16,529 - - -
17,804 1,007 - -
109Notes to the Financial Statements

16 Trade Receivables
Group Company 2014 2013 2014 2013 S$’000 S$’000 S$’000 S$’000
Third parties 25,136 24,061 - - Related parties (Note 37(a)) 2,976 3,407 - - 28,112 27,468 - - Less: Allowance for impairment (14,552) (15,249) - - 13,560 12,219 - -
2014 2013
Gross Impairment
loss Gross Impairment
loss S$’000 S$’000 S$’000 S$’000
Group Not past due 4,645 - 4,003 - Past due 0 – 3 months 6,278 - 5,051 - Past due more than 3 months 17,189 14,552 18,414 15,249 28,112 14,552 27,468 15,249
Allowance for impairment was made on certain trade receivables that are past due for more than 3 months as the recovery is remote. Movements in the allowance for impairment loss during the financial year are as follows:
Group Company 2014 2013 2014 2013 S$’000 S$’000 S$’000 S$’000
At the beginning of the year 15,249 15,011 - -
Impairment loss included as general and administrative expenses during the year 74 412 - -
Written off against allowance (19) (11) - - Currency realignment (81) (163) - - Disposal of subsidiaries (671) - - - At the end of the year 14,552 15,249 - -
Trade receivables are denominated in the following currencies:
Group Company 2014 2013 2014 2013 S$’000 S$’000 S$’000 S$’000
Indonesian Rupiah 10,291 8,734 - - United States Dollar 2,074 2,209 - - Malaysian Ringgit 918 566 - - Singapore Dollar 157 437 - - Chinese Renminbi 120 118 - - British Pound - 155 - - 13,560 12,219 - -
Sinarmas Land Limited Annual Report 2014110
Notes to the Financial Statements31 December 2014

17 Other Current Assets Group Company (Restated) 2014 2013 2014 2013 S$’000 S$’000 S$’000 S$’000
Receivable from: Subsidiaries - - 247,070 546,448 Related parties (Note 37(a)) 46 51 - - Third parties 9,774 7,645 91 236
Finance lease receivable from a
third party (Note 25) 112 - - - 9,932 7,696 247,161 546,684 Prepayments 76,199 50,783 20 10 Purchase advances 146,295 180,297 - - Others, net 1,352 1,291 43 43 233,778 240,067 247,224 546,737
Other current assets are denominated in the following currencies:
Group Company (Restated) 2014 2013 2014 2013 S$’000 S$’000 S$’000 S$’000
Indonesian Rupiah 223,962 230,888 - - United States Dollar 3,716 3,550 10,824 107 Malaysian Ringgit 3,570 287 21 22 Singapore Dollar 1,354 1,539 166,264 454,655 Chinese Renminbi 1,145 3,702 - - British Pound 12 42 70,115 91,953 Others 19 59 - - 233,778 240,067 247,224 546,737
The unsecured amounts receivable from subsidiaries included $62,715,000 (2013: $312,187,000) which bear interest at rate ranging from 3% to 3.5% (2013: 3% to 3.4%) per annum and are repayable on demand. The amounts receivable from related parties are advances in nature which are unsecured, interest-free and repayable on demand.
The above receivables shown was net of allowance for impairment of $173,000 (2013: $173,000) as the recovery of certain receivables is remote.
111Notes to the Financial Statements

18 Subsidiaries
Company 2014 2013 S$’000 S$’000
Unquoted equity shares, at cost 1,269,610 1,286,322 Loans receivable 544,510 242,482 1,814,120 1,528,804 Less: Impairment loss (100,000) (100,000) 1,714,120 1,428,804
Particulars of the subsidiaries are disclosed in Note 42 to the financial statements. The Company recognised an accumulated loss of $100,000,000 to write down the carrying amount of one of the subsidiaries to its recoverable amount. The recoverable amount of the subsidiary is based on fair value less cost of disposal which is principally determined by the current market value of non-financial assets held by the subsidiary. Except for a loan of $181,186,000 (2013: $Nil) which bears interest at 3% (2013: Nil) per annum, the above loans receivable from subsidiaries are unsecured, interest-free and not expected to be repaid within the next 12 months.
19 Associated Companies
Group Company (Restated) 2014 2013 2014 2013 S$’000 S$’000 S$’000 S$’000
Quoted equity shares, at cost 199,176 199,176 - - Unquoted equity shares, at cost 65,660 50,737 - - 264,836 249,913 - - Currency realignment (125,288) (147,337) - - Capital reserve on acquisition 32,528 32,528 - - Share of post-acquisition reserves,
net of dividend received 51,200 60,718 - - 223,276 195,822 - - Fair value: Quoted equity shares 501,123 233,250 - -
Particulars of the associated companies are disclosed in Note 43 to the financial statements. Summarised aggregated financial information in respect of the Group’s associated companies, which is not adjusted for the percentage of ownership held by the Group, is set out below:
(Restated) 2014 2013 S$’000 S$’000
Total profit for the year 44,941 20,986 Other comprehensive income 49 - Total comprehensive income for the year 44,990 20,986
Sinarmas Land Limited Annual Report 2014112
Notes to the Financial Statements31 December 2014

20 Joint Ventures
Group Company 2014 2013 2014 2013 S$’000 S$’000 S$’000 S$’000
Unquoted equity shares, at cost 207,051 181,806 - - Share of post-acquisition reserves,
net of unrealised profit and dividend received (80,238) (86,629) - -
Currency realignment (22,925) (29,665) - - 103,888 65,512 - -
The details of the Group’s joint ventures are as follows:
Name of company and
The Group’s Effective percentage
of equity held country of incorporation Principal activities cost of investment by the Group 2014 2013 2014 2013 S$’000 S$’000 % %
Badan Kerja Sama, Pasar Pagi – ITC Mangga Dua
Manage and operate shopping centre
56 56 18.24 17.66
Indonesia
BKS Binamaju Multikarsa Indonesia
Housing development
147 147 41.62 41.34
PT Bumi Parama Wisesa Indonesia
Real estate development
127,755 119,340 26.27 25.43
PT Indonesia International Expo
Property development
62,263 62,263 25.24 24.43
Indonesia
PT Itomas Kembangan Perdana Indonesia
Property management
16,830 - 18.61 -
207,051 181,806
Summarised aggregated financial information in respect of the Group’s joint ventures, which is not adjusted for the percentage of ownership held by the Group, is set out below:
2014 2013 S$’000 S$’000
Total profit for the year 15,491 10,552 Other comprehensive loss (12) - Total comprehensive income for the year 15,479 10,552
113Notes to the Financial Statements

21 Long-Term Investments
Group Company 2014 2013 2014 2013 S$’000 S$’000 S$’000 S$’000
Available-for-sale financial assets: Unquoted investments 9 9 - - Unquoted equity shares 2,394 4,291 - -
Quoted bonds in a related party (Note 37(a)) - 2,852 - -
2,403 7,152 - -
The available-for-sale financial assets are denominated in the following currencies:
Group Company 2014 2013 2014 2013 S$’000 S$’000 S$’000 S$’000
Indonesian Rupiah 2,394 5,918 - - United States Dollar - 1,225 - - Singapore Dollar 9 9 - - 2,403 7,152 - -
22 Properties Under Development for Sale
Group Company (Restated) 2014 2013 2014 2013 S$’000 S$’000 S$’000 S$’000
Properties under development: Land cost 248,356 262,548 - - Development cost incurred to-date 445,870 382,589 - - 694,226 645,137 - - Land held for development 1,044,274 801,098 - - 1,738,500 1,446,235 - -
As at 31 December 2014, properties under development for sale of the Group amounting to $44,621,000 (2013: $21,399,000) have been pledged as security for bonds issued by a subsidiary and credit facilities granted by banks to the subsidiaries (Notes 30 and 32).
Sinarmas Land Limited Annual Report 2014114
Notes to the Financial Statements31 December 2014
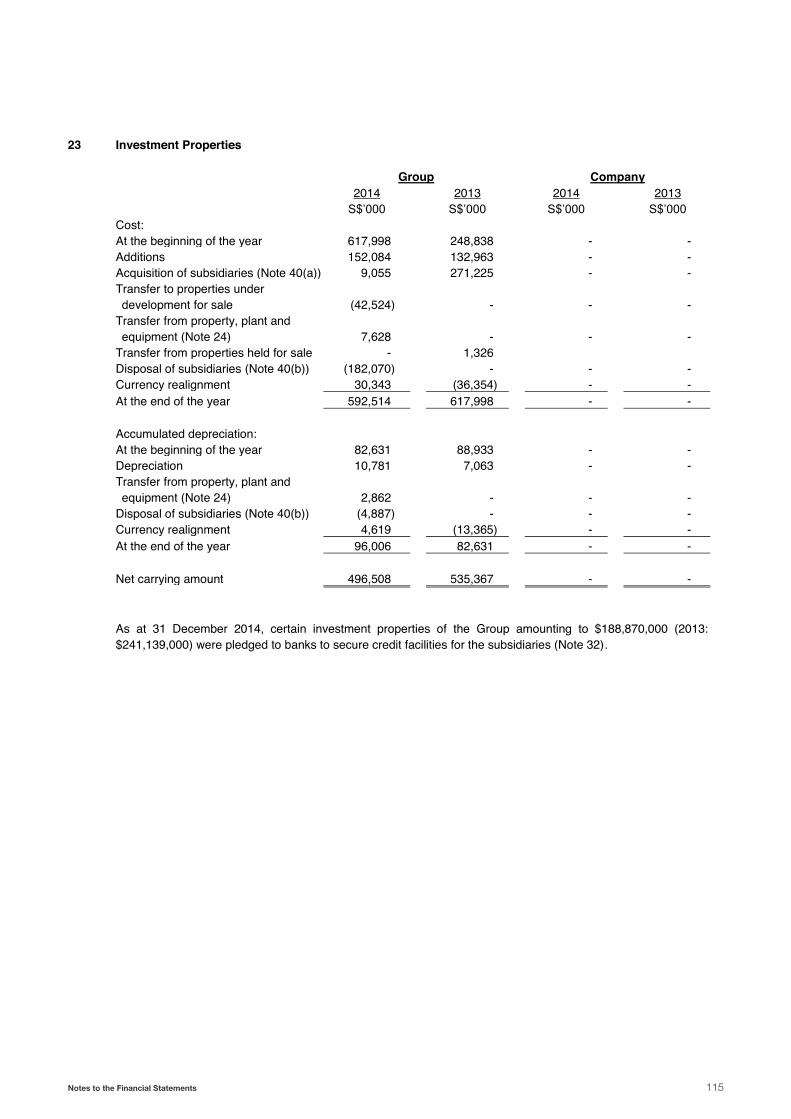
23 Investment Properties
Group Company 2014 2013 2014 2013 S$’000 S$’000 S$’000 S$’000
Cost: At the beginning of the year 617,998 248,838 - - Additions 152,084 132,963 - - Acquisition of subsidiaries (Note 40(a)) 9,055 271,225 - -
Transfer to properties under development for sale (42,524) - - -
Transfer from property, plant and equipment (Note 24) 7,628 - - -
Transfer from properties held for sale - 1,326 Disposal of subsidiaries (Note 40(b)) (182,070) - - - Currency realignment 30,343 (36,354) - - At the end of the year 592,514 617,998 - - Accumulated depreciation: At the beginning of the year 82,631 88,933 - - Depreciation 10,781 7,063 - -
Transfer from property, plant and equipment (Note 24) 2,862 - - -
Disposal of subsidiaries (Note 40(b)) (4,887) - - - Currency realignment 4,619 (13,365) - - At the end of the year 96,006 82,631 - - Net carrying amount 496,508 535,367 - -
As at 31 December 2014, certain investment properties of the Group amounting to $188,870,000 (2013: $241,139,000) were pledged to banks to secure credit facilities for the subsidiaries (Note 32).
115Notes to the Financial Statements

23 Investment Properties (cont’d)
Investment properties are held mainly for use by tenants under operating leases. The following amounts are recognised in the Group’s income statement:
Group 2014 2013 S$’000 S$’000
Rental income 74,792 55,846
Direct operating expenses arising from investment properties that generated rental income 16,841 18,444
Property tax and other operating expenses arising from investment properties that did not generate rental income 677 1,115
Group 2014 2013 S$’000 S$’000
Fair value of investment properties located in: Indonesia 672,623 511,102 Singapore 212,810 212,810 United Kingdom 117,825 176,554 China - 6,572 Fair value classified under Level 2 of Fair Value Hierarchy (Note 39) 1,003,258 907,038
As at 31 December 2014, the aggregate fair values of investment properties located in Indonesia was based on external valuation reports prepared by the independent appraiser, PT Heburinas Nusantara KJPP Rengganis, Hamid and Rekan in 2012 – 2014 based on market data approach and income approach. Under the market data approach, the valuation was arrived at by reference to market evidence of transaction prices for similar properties. The most significant input in this valuation approach is the selling price per unit of floor area. Under the income approach, the valuation was arrived at by reference to market rental rate for similar properties in the nearby vicinity. The fair values of investment properties located in Singapore and United Kingdom were based on external valuation reports prepared by the independent professional valuers, Colliers International Consultancy & Valuation (Singapore) Pte Ltd and Knight Frank LLP respectively in 2014 based on open market value approach whereby the basis of comparable transaction is from direct comparison with transaction prices of similar properties. As at 31 December 2013, the fair value of investment properties located in China was based on management’s value in use calculation using discounted cash flow method.
Sinarmas Land Limited Annual Report 2014116
Notes to the Financial Statements31 December 2014

24 Property, Plant and Equipment Plant, Motor Leasehold machinery vehicles, Freehold Freehold land and and furniture Construction Group land buildings buildings equipment and fixtures in progress Total
S$’000 S$’000 S$’000 S$’000 S$’000 S$’000 S$’000 Cost: At 1.1.2014 as restated 32,884 82,040 77,506 17,199 47,030 9,923
266,582
Additions 1,716 384 269 591 10,660 23,813 37,433 Disposals - (1) (532) - (533) Acquisition of subsidiaries
(Note 40(a)) - - - - 28 -
28 Disposal of subsidiaries
(Note 40(b)) - - (1,957) - - -
(1,957) Transfer to investment properties (Note 23) - - (7,628) - - -
(7,628) Written off - - - (170) (25) - (195) Currency realignment 445 5,411 3,739 1,087 3,372 931 14,985
At 31.12.2014 35,045 87,835 71,929 18,706 60,533 34,667 308,715 Accumulated depreciation: At 1.1.2014 as restated - 36,450 50,581 10,515 39,468 -
137,014
Depreciation - 3,702 2,100 964 3,206 - 9,972 Disposals - - - (1) (478) - (479) Disposal of subsidiaries
(Note 40(b)) - - (810) - - -
(810) Transfer to investment properties (Note 23) - - (2,862) - - -
(2,862) Written off - - - (170) (25) - (195) Currency realignment - 2,915 2,271 262 2,697 - 8,145
At 31.12.2014 - 43,067 51,280 11,570 44,868 - 150,785
Net book value: At 31.12.2014 35,045 44,768 20,649 7,136 15,665 34,667 157,930
As at 31 December 2014, certain property, plant and equipment of the Group amounting to $21,322,000 (2013: $61,780,000) has been pledged as security for credit facilities granted by banks to the subsidiaries (Note 32).
During the financial year 2014, the additions to property, plant and equipment included motor vehicles, furniture and fixtures of $5,502,000 (2013: $Nil) acquired under finance leases.
117Notes to the Financial Statements

24 Property, Plant and Equipment (cont’d) Plant, Motor Leasehold machinery vehicles, Freehold Freehold land and and furniture Construction Group land buildings buildings equipment and fixtures in progress Total
S$’000 S$’000 S$’000 S$’000 S$’000 S$’000 S$’000 Cost: At 1.1.2013 37,313 99,332 83,072 15,571 54,390 3,453 293,131 Effects of adoption of FRS110 - - - 2,525 477 1,884
4,886
Additions - 762 - 1,324 3,147 5,780 11,013 Disposals - - - (13) (1,260) - (1,273) Reclassification - - 94 (11) - (83) - Acquisition of subsidiaries
(Note 40(a)) - 12 - - 12 -
24 Written off - - - (90) (545) - (635) Currency realignment (4,429) (18,066) (5,660) (2,107) (9,191) (1,111) (40,564)
At 31.12.2013 as restated 32,884 82,040 77,506 17,199 47,030 9,923
266,582
Accumulated depreciation: At 1.1.2013 - 40,917 50,795 10,087 45,482 - 147,281 Depreciation - 4,126 1,910 991 3,373 - 10,400 Disposals - - - (13) (1,102) - (1,115) Written off - - - (80) (545) - (625) Currency realignment - (8,593) (2,124) (470) (7,740) - (18,927)
At 31.12.2013 as restated - 36,450 50,581 10,515 39,468 -
137,014
Net book value: At 31.12.2013 as restated 32,884 45,590 26,925 6,684 7,562 9,923
129,568
Sinarmas Land Limited Annual Report 2014118
Notes to the Financial Statements31 December 2014

24 Property, Plant and Equipment (cont’d)
Motor vehicles, Leasehold Plant and furniture Company improvements equipment and fixtures Total S$’000 S$’000 S$’000 S$’000
Cost: At the beginning and end of the year 144 469 1,230 1,843 Accumulated depreciation: At 1 January 2014 144 469 1,074 1,687 Depreciation - - 43 43 At 31 December 2014 144 469 1,117 1,730 Net book value: At 31 December 2014 - - 113 113 Cost: At 1 January 2013 144 469 1,297 1,910 Disposals - - (67) (67) At 31 December 2013 144 469 1,230 1,843 Accumulated depreciation: At 1 January 2013 144 468 1,086 1,698 Depreciation - 1 53 54 Disposals - - (65) (65) At 31 December 2013 144 469 1,074 1,687 Net book value: At 31 December 2013 - - 156 156
25 Long-Term Receivables
Group Company (Restated) 2014 2013 2014 2013 S$’000 S$’000 S$’000 S$’000
Loan receivable from a joint venture, denominated in Indonesian Rupiah 11,057 - - -
Finance lease denominated in
Indonesian Rupiah 25,883 - - - Others - 413 36,940 413 - -
The loan receivable from a joint venture is unsecured, interest-free and with a maturity date in 2019.
119Notes to the Financial Statements

25 Long-Term Receivables (cont’d) The Group leases a building to a third party under finance lease. Details of the finance lease are as follows:
Group 2014 2013 S$’000 S$’000 Gross receivables due: Within one year 2,548 - Between one year to five years 8,254 - More than five years 45,733 - 56,535 - Less: Unearned finance income (30,540) - Net investment in finance lease 25,995 -
Current portion, classified as other current assets (Note17) 112 - Non-current portion 25,883 - Net investment in finance lease 25,995 -
26 Deferred Income Tax Accelerated Retirement Others/ tax benefit Valuation depreciation obligations allowance Total Group S$’000 S$’000 S$’000 S$’000 Deferred tax assets/(liabilities) At 1 January 2014 (64) 226 (12) 150
(Charged)/Credited to income statement (2)
144 15
157
Currency realignment (6) 26 (3) 17 At 31 December 2014 (72) 396 - 324 At 1 January 2013 (54) 258 (11) 193
(Charged)/Credited to income statement (27)
33 -
6
Currency realignment 17 (65) (1) (49) At 31 December 2013 (64) 226 (12) 150
Deferred tax assets and liabilities are offset when there is a legally enforceable right to set off current tax assets against current tax liabilities and when the deferred tax assets and deferred tax liabilities relate to income taxes levied by the same tax authority on different entities which intend to settle on a net basis, or realise the assets and liabilities simultaneously in the future. The following amounts, determined after appropriate offsetting, are shown in the statement of financial position:
Group Company 2014 2013 2014 2013 S$’000 S$’000 S$’000 S$’000 Deferred tax assets 336 162 - - Deferred tax liabilities (12) (12) - - Net 324 150 - -
Realisation of deferred tax assets is dependent on the generation of sufficient taxable income prior to expiration of the tax losses carry-forward. Although realisation is not assured, the directors of the Company believe it is more likely than not that the deferred tax assets, net of the valuation allowance, will be realised. The amount of the deferred tax assets considered realisable could be reduced or increased if estimates of future taxable income during the carry-forward period are reduced or increased.
Sinarmas Land Limited Annual Report 2014120
Notes to the Financial Statements31 December 2014

27 Goodwill Group Company 2014 2013 2014 2013 S$’000 S$’000 S$’000 S$’000
At the beginning and end of the year
1,784
1,784
-
-
28 Trade Payables
Trade payables to third parties are denominated in the following currencies:
Group Company 2014 2013 2014 2013 S$’000 S$’000 S$’000 S$’000
Indonesian Rupiah 17,651 10,037 - - Chinese Renminbi 2,914 5,344 - - Singapore Dollar 1,921 1,973 - - Malaysian Ringgit 1,478 1,461 - - 23,964 18,815 - - 29 Other Payables and Liabilities
Group Company (Restated) 2014 2013 2014 2013 S$’000 S$’000 S$’000 S$’000
Payables to: Third parties 39,255 51,314 - - Related parties (Note 37(a)) 2,956 24 24 24 Subsidiaries - - 70,104 48,225 Derivative payables 12,119 13,863 - - Interest payable 5,871 4,156 376 - Other taxes payable 9,118 8,100 - - 69,319 77,457 70,504 48,249 Advances and deposits received on: Development properties 481,465 383,187 - - Rental 15,333 6,629 - -
Estimated liabilities for future improvements 18,802 17,933 - -
Provision for claims 2,055 2,055 - - Accruals 23,336 15,755 828 737 Retirement benefit obligations 663 559 - - Others 1,286 1,322 - 54 612,259 504,897 71,332 49,040
The non-trade payables to related parties and subsidiaries are unsecured and repayable on demand. The non-trade payables to third parties included $15,360,000 (2013: $34,229,000) which bear interest at rate of 1.93% (2013: 1.98%) per annum. The derivative payables relate to the fair value of the embedded option to convert the zero percent convertible bonds issued by certain subsidiaries into their equity (Note 30). Included in advances received and deposits on development properties as at 31 December 2013 was an advance from a related party of $4,458,000 (Note 37(a)).
121Notes to the Financial Statements

29 Other Payables and Liabilities (cont’d)
Estimated liabilities for future improvements represent the estimated cost which will be incurred by the Group in future periods for road paving, bridge, landscaping, electricity and water installation, land grading and other costs on the land sold. Movements in estimated liabilities for future improvements during the financial year are as follows:
Group Company 2014 2013 2014 2013 S$’000 S$’000 S$’000 S$’000
At the beginning of the year 17,933 15,738 - - Additional provision made - 6,228 - - Amount incurred (924) (400) - - Currency realignment 1,793 (3,633) - - At the end of the year 18,802 17,933 - -
Other payables are denominated in the following currencies: Group Company (Restated) 2014 2013 2014 2013 S$’000 S$’000 S$’000 S$’000 Indonesian Rupiah 575,576 446,012 - - Japanese Yen 15,360 34,229 - - Singapore Dollar 12,575 10,457 856 819 British Pound 3,326 5,733 - - Malaysian Ringgit 2,626 2,162 - - United States Dollar 1,897 1,243 53,594 31,718 Chinese Renminbi 891 5,050 14,173 13,906 Others 8 11 2,709 2,597 612,259 504,897 71,332 49,040
Sinarmas Land Limited Annual Report 2014122
Notes to the Financial Statements31 December 2014

30 Bonds Payables
Group Company 2014 2013 2014 2013 S$’000 S$’000 S$’000 S$’000
Interest-bearing Bonds: Secured: BSD I Bonds due 2015/2017/2019 (a) 110,000 100,000 - - BSD II Bonds due 2018 (a) 192,500 175,000 - - Unsecured: PAM Bonds due 2015 (b) 17,600 16,000 - - Zero Percent Convertible Bonds: PAM Bonds due 2018 (c) 24,607 22,370 - - Less: Unamortised discount (6,530) (7,632) - - 18,077 14,738 - - PAM Bonds due 2015 (d) 6,270 5,700 - - Less: Unamortised discount (186) (677) - - 6,084 5,023 - - 344,261 310,761 - - Less: Deferred bond charges (1,721) (1,973) - - 342,540 308,788 - -
Less: Current portion classified as
current liabilities (33,016) - - - Non-current portion 309,524 308,788 - -
Movements in unamortised discount on bonds are as follows: Group Company 2014 2013 2014 2013 S$’000 S$’000 S$’000 S$’000
At the beginning of the year 8,309 3,869 - - Additions - 8,480 - - Repayment - (3,345) - - Amortisation during the year (2,380) (3,020) - - Currency realignment 787 2,325 - - At the end of the year 6,716 8,309 - -
Movements in deferred bond charges are as follows:
Group Company 2014 2013 2014 2013 S$’000 S$’000 S$’000 S$’000
At the beginning of the year 1,973 1,268 - - Additions - 1,284 - - Amortisation during the year (440) (344) - - Currency realignment 188 (235) - - At the end of the year 1,721 1,973 - -
As at end of the financial year, there is no breach of bond covenants.
123Notes to the Financial Statements

30 Bonds Payables (cont’d) (a) In June 2012, PT Bumi Serpong Damai Tbk (“BSD”) has established a fixed rate IDR Bond Program (“Bond
Program”) up to IDR3 trillion. On 4 July 2012, BSD has issued the Phase 1 of the Bond Program amounting to IDR1 trillion (2014: equivalent to $110 million; 2013: equivalent to $100 million), which consist of 3-year A series bonds of IDR85 billion due in July 2015, 5-year B series bonds of IDR479 billion due in July 2017 and 7-year C series bonds of IDR436 billion due in July 2019 with fixed annual interest rate of 8%, 9.25% and 9.5% respectively, payable quarterly. All Phase 1 bonds were issued at face value and listed on the Indonesia Stock Exchange. In June 2013, BSD has issued the Phase 2 of the Bond Program amounting to IDR1.75 trillion (2014: equivalent to $192.5 million; 2013: equivalent to $175.0 million) due in June 2018 with fixed annual interest rate of 8.375%, payable quarterly. All Phase 2 bonds were issued at face value and listed on the Indonesia Stock Exchange.
The bonds were secured by certain properties under development for sale of the Group (Note 22).
(b) In June 2012, PT Paraga Artamida (“PAM”) issued unsecured bearer bonds due June 2015 amounting to
IDR270 billion. Interest on the bonds accrues at a fixed rate of 10% per annum and is payable on a quarterly basis. As at 31 December 2014 and 2013, the outstanding bearer bonds amounting to IDR160 billion (2014: equivalent to $17.6 million; 2013: equivalent to $16.0 million).
(c) In June 1998, PAM issued Zero Percent Convertible Bonds due 2003 amounting to US$138.5 million to its
shareholders or their assignees. In January 2002, the unredeemed bonds of US$137.6 million were converted into IDR1,431,441 million. The bonds were renewed for another 5 years on the maturity dates in June 2003, June 2008 and June 2013 respectively. The renewed bonds will mature in June 2018 and are convertible at the option of the bondholders from 54 months after the date of the renewal to 10 business days prior to the fifth anniversary of the date of the renewal into new ordinary shares of PAM at an exercise price based on 70% of the net tangible asset value of PAM at the exercise date. As at 31 December 2014 and 2013, the bonds held by other subsidiaries in the Group and related parties amounted to IDR1,207,737 million (2014: equivalent to $132.9 million; 2013: equivalent to $120.8 million) and IDR223,704 million (2014: equivalent to $24.6 million; 2013: equivalent to $22.4 million) respectively.
(d) In May 2005, PAM issued Zero Percent Convertible Bonds due May 2010 amounting to IDR57 billion (2014:
equivalent to $6.3 million; 2013: equivalent to $5.7 million) to a related party. The bonds were renewed for another 5 years from May 2010 to May 2015. The renewed bond is convertible at the option of the bondholders from 54 months after the date of the renewal to 10 business days prior to the fifth anniversary of the date of the renewal into new ordinary shares of PAM at an exercise price based on 70% of the net tangible asset value of PAM at the exercise date.
Sinarmas Land Limited Annual Report 2014124
Notes to the Financial Statements31 December 2014

31 Obligations Under Finance Leases
Minimum Present value of lease payments minimum lease payments 2014 2013 2014 2013 S$’000 S$’000 S$’000 S$’000
Group Amounts payable under finance leases: Within one year 2,112 52 1,909 32 Between one year to five years 3,790 44 3,628 44 5,902 96 5,537 76 Less: Future finance charges (365) (20) - - Present value of lease obligations 5,537 76 5,537 76 Less: Amount due for settlement within 12 months (1,909) (32) Amount due for settlement after 12 months 3,628 44 Net book value of assets under finance leases 6,334 - Interest rate per annum for finance leases 2.9% – 4.2% 2.5% – 3.5%
Minimum Present value of lease payments minimum lease payments 2014 2013 2014 2013 S$’000 S$’000 S$’000 S$’000
Company Amounts payable under finance leases: Within one year 27 52 21 32 Between one year to five years 18 44 14 44 45 96 35 76 Less: Future finance charges (10) (20) - - Present value of lease obligations 35 76 35 76 Less: Amount due for settlement within 12 months (21) (32) Amount due for settlement after 12 months 14 44 Net book value of assets under finance leases - - Interest rate per annum for finance leases 2.9% 2.5% – 3.5%
The obligations under finance leases of the Group and the Company are secured by the lessor’s charge over the leased assets. The obligations under finance leases are denominated in the following currencies:
Group Company 2014 2013 2014 2013 S$’000 S$’000 S$’000 S$’000 Indonesian Rupiah 5,478 - - - Singapore Dollar 35 76 35 76 Malaysia Ringgit 24 - - - 5,537 76 35 76
125Notes to the Financial Statements

32 Borrowings
Group Company 2014 2013 2014 2013 S$’000 S$’000 S$’000 S$’000
Secured bank borrowings denominated in: Indonesian Rupiah 167,531 136,267 - - Singapore Dollar 96,000 92,000 - - British Pound 75,792 87,863 - - United States Dollar 57,027 - - - Malaysian Ringgit - 13,857 - - 396,350 329,987 - -
Less: Current portion classified as
current liabilities (157,325) (135,697) - - Non-current portion 239,025 194,290 - -
The interest rates per annum for the above borrowings are as follows:
Group Company 2014 2013 2014 2013 % % % %
Indonesia Rupiah 8.5 – 11.5 8.5 – 10.0 - - Singapore Dollar 2.0 – 2.2 2.1 – 2.3 - - British Pound 2.9 3.2 - - United States Dollar 1.5 - - - Malaysian Ringgit - 7.9 - -
The scheduled maturities of the Group’s borrowings are as follows:
As at 31 December 2014 Year Original Loan Currency
Singapore Dollar
Equivalent Borrowings repayable in: IDR’000 GBP’000 S$’000 USD’000 $’000 2015 1,420,000,000 547 - - 157,325 2016 - 547 - - 1,125 2017 - 547 - - 1,125 2018 103,011,000 547 92,000 - 104,457 2019 - 547 4,000 43,169 62,152 Thereafter - 34,111 - - 70,166 Total 1,523,011,000 36,846 96,000 43,169 396,350 Current portion (1,420,000,000) (547) - - (157,325) Non-current portion 103,011,000 36,299 96,000 43,169 239,025
As at 31 December 2013 Year Original Loan Currency
Singapore Dollar
Equivalent Borrowings repayable in: IDR’000 GBP’000 S$’000 RM’000 $’000 2014 1,330,000,000 1,290 - - 135,697 2015 - 1,160 - - 2,426 2016 - 1,160 62,000 35,900 78,283 2017 - 1,160 - - 2,426 2018 32,668,511 37,250 30,000 - 111,155 Total 1,362,668,511 42,020 92,000 35,900 329,987 Current portion (1,330,000,000) (1,290) - - (135,697) Non-current portion 32,668,511 40,730 92,000 35,900 194,290
Sinarmas Land Limited Annual Report 2014126
Notes to the Financial Statements31 December 2014

32 Borrowings (cont’d)
Certain of the Group’s time deposits, properties under development for sale, investment properties and property, plant and equipment have been pledged to banks to obtain the above secured borrowings (Notes 14, 22, 23 and 24). The bank loan agreements generally include covenants that require the maintenance of certain financial ratios, limit or require written notification of the amount of additional borrowings that may be incurred, and limit the transfer or disposal of pledged assets and acting as guarantor to other parties. Any non-compliance with these covenants will result in these loans becoming repayable immediately upon service of a notice of default by the lenders. In addition, the bank loan agreements contain cross default clauses whereby non-compliance with covenants for other financial indebtedness would result in acceleration of repayment of the outstanding loan balances. As at end of the financial year, there is no breach of loan covenants.
33 Long-Term Liabilities Group Company (Restated) 2014 2013 2014 2013 S$’000 S$’000 S$’000 S$’000
Loan payable to third parties 14,349 24,939 - -
Advances and deposits received on development properties 121,450 166,881 - -
Retirement benefit obligations 29,560 21,896 - - Security deposits 3,996 13,529 - - Others 96 117 - - 169,451 227,362 - -
The unsecured loan payable to third parties which bear interest at rate of 1.93% (2013: 1.98%) per annum and with a maturity in 2016. Long-term liabilities are denominated in the following currencies:
Group Company (Restated) 2014 2013 2014 2013 S$’000 S$’000 S$’000 S$’000
Indonesian Rupiah 154,767 195,294 - - Japanese Yen 14,349 24,939 - - United States Dollar 202 6,946 - - Singapore Dollar 133 183 - - 169,451 227,362 - -
127Notes to the Financial Statements

34 Issued Capital
Group and Company 2014 2013 S$’000 S$’000
Balance at the beginning and end of the year 3,041,959,437 ordinary shares 1,907,108 1,907,108
All issued ordinary shares are fully paid. There is no par value for these ordinary shares. The holders of ordinary shares are entitled to receive dividends as declared from time to time and are entitled to one vote per share at shareholders meetings. All shares rank equally with regards to the Company’s residual assets.
On 19 November 2010, the Company issued 1,520,978,744 warrants pursuant to a bonus issue on the basis of one warrant for every two existing ordinary shares held in the capital of the Company. Each warrant carries the right to subscribe for one new ordinary share of the Company at the exercise price of $0.10 each and may only be exercised on the fifth (5th) anniversary of the date of issuance (i.e. 18 November 2015). As at 31 December 2014 and 2013, the number of outstanding warrants was 1,520,978,744. Assuming all the warrants are fully exercised, the number of new ordinary shares to be issued would be 1,520,978,744.
35 Dividends
Group and Company 2014 2013 S$’000 S$’000
Final dividends paid in respect of the previous year of $0.005
(2013: $0.0038) per share 15,210 11,559
At the annual general meeting to be held on 24 April 2015, a first and final tax-exempted (one-tier) dividend of $0.005 per share, amounting to $15,209,797.19 will be recommended. These financial statements do not reflect this dividend, which will be accounted for in shareholders’ equity as an appropriation of retained earnings for the financial year ending 31 December 2015.
36 Holding Company
The directors of the Company regard Flambo International Limited, a company incorporated in the British Virgin Islands as the ultimate holding company. The controlling shareholders of the Company comprise certain members of the Widjaja family.
37 Related Party Transactions
(a) A related party is a person or entity that is related to the reporting entity. A person is considered to be related if that person has the ability to control or jointly control the reporting entity, exercise significant influence over the reporting entity in making financial and operating decisions, or is a member of the key management personnel of the reporting entity or its parent. An entity is related to the reporting entity if they are members of the same group, an associate or a joint venture. An entity is also considered to be related if it is controlled or jointly controlled by the same person who has significant influence over the reporting entity or is a member of the key management personnel of the reporting entity.
Sinarmas Land Limited Annual Report 2014128
Notes to the Financial Statements31 December 2014

37 Related Party Transactions (cont’d)
(b) In addition to the related party information disclosed elsewhere in the financial statements, significant transactions with related parties, on terms agreed between parties, were as follows:
Group Company (Restated) 2014 2013 2014 2013 S$’000 S$’000 S$’000 S$’000
i) Interest expense to: Related party - 57 - - Subsidiary - - 368 359 ii) Interest income from: Subsidiaries - - 7,975 8,933 Related parties 666 960 - -
iii) Dividend income from:
Subsidiaries - - 14,299 7,256 Associated companies 6,090 6,713 - - Joint ventures 3,740 10,973 - - iv) Sales of goods and services
Management fee from subsidiaries - - 3,182 2,134
Technical fees from associated companies 165 1,066 - -
Sales of land parcels to: Associated companies 66,705 58,188 - -
Joint ventures - 244,031 - -
Rental income from related parties 36,611 20,605 11 17
v) Purchase of goods and
services
Insurance premium to a related party 1,927 1,206 - -
Rental expense to: Subsidiaries - - 167 141 Related parties 243 243 243 243
vi) Proceeds from disposal of subsidiaries to a related party 5,539 - - -
(c) The remuneration of key management personnel who are also directors are as follows:
Group (Restated) 2014 2013 S$’000 S$’000
Directors’ remuneration: Directors of the Company 10,711 12,551 Other key management personnel 2,197 2,761
Included in the above remuneration are post employment benefits of $39,989 (2013: $41,669).
129Notes to the Financial Statements

38 Commitments
(a) Operating lease commitments - Group as lessee At the end of the reporting period, the commitments in respect of non-cancellable operating leases for the rental of office premises and properties are as follows:
Group Company 2014 2013 2014 2013 S$’000 S$’000 S$’000 S$’000
Future minimum lease payments payable: Within one year 365 746 307 294 Between one year to five years 66 380 4 251 Minimum lease payments paid under operating leases 939 805 414 388
The leases have varying terms, escalation clauses and renewal rights. (b) Operating lease commitments - Group as lessor At the end of the reporting period, committed rental income in respect of operating leases for the rental of properties are as follows:
Group Company 2014 2013 2014 2013 S$’000 S$’000 S$’000 S$’000
Future minimum lease receivable: Within one year 36,008 32,735 - - Between one year to five years 52,638 62,622 - - After five years - 71,822 - -
The leases have varying terms, escalation clauses and renewal rights.
(c) Expenditure commitments Estimated expenditure committed but not provided for in the financial statements are as follows:
Group Company (Restated) 2014 2013 2014 2013 S$’000 S$’000 S$’000 S$’000
Property development 126,675 128,494 - - Capital expenditure 8,736 15,772 - -
Sinarmas Land Limited Annual Report 2014130
Notes to the Financial Statements31 December 2014

39 Financial Instruments
Fair Value of Financial Instruments
The carrying amounts of financial assets and liabilities with a maturity of less than one year, which include cash and cash equivalents, short-term investments, trade and other receivables, trade and other payables, short-term bond payables and short-term borrowings are assumed to approximate their fair values due to their short-term maturities.
The fair values of long-term receivables and long-term borrowings (which include obligation under finance leases, bonds payables and bank borrowings) are calculated based on discounted expected future principal and interest cash flows. The discount rates used are based on market rates for similar instruments at the end of the reporting period. As at 31 December 2014 and 2013, the carrying amounts of the long-term receivables and long-term borrowings approximate their fair values.
Fair Value Hierarchy The table below presents financial assets carried at fair value and classified by level of the following fair value measurement hierarchy: (a) Level 1: quoted prices (unadjusted) in active markets for identical assets or liabilities; (b) Level 2: inputs other than quoted prices included within Level 1 that are observable for the asset or liability,
either directly (that is as prices) or indirectly (i.e. derived from prices); and (c) Level 3: inputs for the asset or liability that are not based on observable market data (unobservable inputs).
Level 1 Level 2 Level 3 Total At 31 December 2014 S$’000 S$’000 S$’000 S$’000 Financial assets at fair value through profit or loss 1,275 - - 1,275
Available-for-sale financial assets 16,529 - 2,403 18,932 Total 17,804 - 2,403 20,207
At 31 December 2013 Financial assets at fair value through profit or loss 1,007 - - 1,007
Available-for-sale financial assets 2,852 - 4,300 7,152 Total 3,859 - 4,300 8,159
Movements in available-for-sale financial assets in Level 3 are as follows:
2014 2013 S$’000 S$’000 At the beginning of the year 4,300 4,022 Written off during the year (1,219) - (Disposal)/Investments made during the year (979) 890
Foreign exchange gain/(loss) recognised in other comprehensive
income 301 (612) At the end of the year 2,403 4,300
131Notes to the Financial Statements

40 Business Combinations (a) Acquisition of subsidiaries
During the financial year 2014, there were the following acquisitions of subsidiaries:
(i) On 27 February 2014, the Group through its subsidiary, acquired additional 4.97% equity interest in its associated company, PT Phinisindo Zamrud Nusantara (“PZN”), for a total consideration of IDR88 million (equivalent to $10,000). Subsequently on 25 June 2014, the Group further acquired an additional 22.51% equity interest in PZN for a total consideration of IDR5 billion (equivalent to $550,000) resulting in the Group controls 77.48% voting rights in PZN and it became a subsidiary of the Group.
The fair value of the identifiable assets and liabilities acquired amounted to $20,153,000 after taking into
account the fair value adjustments of $12,131,000 based on an independent valuation report. From 25 June 2014 to 31 December 2014, it contributed revenue of $1,415,000 and profit of $1,624,000 to the
Group’s results. If the acquisition had occurred on 1 January 2014, management estimated that the Group’s revenue and profit before income tax for the year would have been $830,044,000 and $476,580,000 respectively.
The identifiable assets acquired and liabilities assumed at the acquisition date were as follows:
Net assets acquired: Previous
carrying amount Fair value
adjustments
Fair value recognised
on acquisition S$’000 S$’000 S$’000 Cash and cash equivalents 3,441 - 3,441 Trade receivables 175 - 175 Other current assets 107 - 107 Inventories 67 - 67 Properties held for sale 5,688 3,810 9,498 Property, plant and equipment 28 - 28 Investment properties 734 8,321 9,055 Other payables (1,521) - (1,521) Income taxes payables (63) - (63) Long-term liabilities (634) - (634) Total identifiable net assets 8,022 12,131 20,153 Less: Transfer from investment in an associated company (4,409) Less: Non-controlling interests’ proportionate share of net assets (4,538) Less: Gain on equity interest (3,381) Less: Negative goodwill (7,275) Total purchase consideration 550 Less: Cash and cash equivalents acquired (3,441) Net cash inflow on acquisition of a subsidiary (2,891)
Sinarmas Land Limited Annual Report 2014132
Notes to the Financial Statements31 December 2014

40 Business Combinations (cont’d) (a) Acquisition of subsidiaries (cont’d) (ii) On 28 October 2014, the Group through its subsidiary, acquired a 68% equity interest in PT Phinisi Multi
Properti (“PMP”) for a total consideration of IDR268.3 billion (equivalent to $29,511,000).
The fair value of the identifiable assets and liabilities acquired amounted to $45,448,000 after taking into account the fair value adjustments of $20,074,000 based on an independent valuation report. From 28 October 2014 to 31 December 2014, it contributed a loss of $21,000 to the Group’s results. If the acquisition had occurred on 1 January 2014, management estimated that there would have been no significant changes to the Group’s revenue and profit before income tax. The identifiable assets acquired and liabilities assumed at the acquisition date were as follows:
Net assets acquired: Previous
carrying amount Fair value
adjustments
Fair value recognised
on acquisition S$’000 S$’000 S$’000 Cash and cash equivalents 24 - 24 Properties under development for sale 25,354 20,074 45,428 Other payables (4) - (4) Total identifiable net assets 25,374 20,074 45,448 Less: Non-controlling interests’ proportionate share of net assets (14,543) Less: Negative goodwill (1,394) Total purchase consideration 29,511 Less: Cash and cash equivalents acquired (24) Net cash outflow on acquisition of a subsidiary 29,487 During the financial year 2013, there were the following acquisitions of subsidiaries: (iii) In accordance with the requirements of FRS110, Consolidated Financial Statements, the Group changed its
control conclusion in respect of its investment in PDL, which was previously accounted for as associated company using the equity method, with effect from April 2013 (Note 2(a)(i)). The identifiable assets acquired and liabilities assumed were as follows:
Previous
carrying amount Fair value
adjustments
Fair value recognised on consolidation
S$’000 S$’000 S$’000 Cash and cash equivalents 110,877 - 110,877 Other current assets 18,404 - 18,404 Properties held for sale 296,852 - 296,852 Properties under development for sale 544,414 205,093 749,507 Property, plant and equipment 4,886 - 4,886 Other payables (192,873) - (192,873) Long-term payables (183,132) - (183,132) Capital reserve 3,240 - 3,240 Foreign currency reserve (1,755) - (1,755) Total identifiable net assets 600,913 205,093 806,006 Less: Transfer from investment in associated company (353,616) Less: Non-controlling interests’ proportionate share of net assets (406,543) Less: Gain on equity interest (45,847) Total purchase consideration - Less: Cash and cash equivalents acquired (110,877) Cash flow effect arising from consolidation of PDL group (110,877)
133Notes to the Financial Statements

40 Business Combinations (cont’d) (a) Acquisition of subsidiaries (cont’d) (iv) On 5 April 2013, the Group through its subsidiary, acquired a 55% equity interest in PT Kusumasentral Kencana
(“KSK”) for a total consideration of IDR228.3 billion (equivalent to $29,681,000). Following this acquisition, the Group’s effective equity interest in KSK was 46.40%.
The fair value of the identifiable assets and liabilities acquired amounted to $53,966,000 after taking into account the fair value adjustments of $39,691,000. From 5 April 2013 to 31 December 2013, it contributed a loss of $477,000 to the Group’s results. If the acquisition had occurred on 1 January 2013, management estimated there would have been no significant changes to the Group’s revenue and profit before income tax. The identifiable assets acquired and liabilities assumed at the acquisition date were as follows:
Net assets acquired: Previous
carrying amount Fair value
adjustments
Fair value recognised
on acquisition S$’000 S$’000 S$’000 Cash and cash equivalents 2,442 - 2,442 Investment properties 11,839 39,691 51,530 Other payables (6) - (6) Total identifiable net assets 14,275 39,691 53,966 Less: Non-controlling interests’ proportionate share of net assets (24,285) Total purchase consideration 29,681 Less: Cash and cash equivalents acquired (2,442) Net cash outflow on acquisition of a subsidiary 27,239
(v) On 12 June 2013, the Group through its wholly-owned subsidiaries, acquired 100% of the units issued in
Holbrook House Unit Trust for a total consideration of GBP84,046,910 (equivalent to $161,686,000). Holbrook House Unit Trust is the beneficial owner of New Brook Buildings, an office building consisting of a 12-storey tower connected to a 9-storey wing, with a net lettable area of approximately 99,911 square feet in London, United Kingdom, with the CLOF (Holbrook House) Jersey Nominee A Limited and CLOF (Holbrook House) Jersey Nominee B Limited being the legal owners of this property.
The fair value of the identifiable assets and liabilities acquired amounted to $161,686,000. From 12 June 2013 to 31 December 2013, it contributed revenue of $6,477,000 and loss of $1,189,000 to the Group’s results. If the acquisition had occurred on 1 January 2013, management estimated the Group’s revenue and profit before income tax for the year would have been $1,184,013,000 and $610,406,000 respectively. The identifiable assets acquired and liabilities assumed at the acquisition date were as follows:
Net assets acquired: Previous
carrying amount Fair value
adjustments
Fair value recognised
on acquisition S$’000 S$’000 S$’000 Other current assets 33 - 33 Investment properties 162,622 - 162,622 Other payables (969) - (969) Total identifiable net assets 161,686 - 161,686 Cash consideration 161,686
Sinarmas Land Limited Annual Report 2014134
Notes to the Financial Statements31 December 2014

40 Business Combinations (cont’d) (a) Acquisition of subsidiaries (cont’d) (vi) On 23 September 2013, the Group through its subsidiary, acquired a 64.25% equity interest in PT Wijaya
Pratama Raya (“WPR”) for a total consideration of IDR268 billion (equivalent to $29,480,000). Following this acquisition, the Group’s effective equity interest in WPR was 28.37%. The fair value of the identifiable assets and liabilities acquired amounted to $63,578,000 after taking into account the fair value adjustments of $40,348,000. From 23 September 2013 to 31 December 2013, WPR contributed revenue of $2,427,000 and profit of $522,000 to the Group’s results. If the acquisition had occurred on 1 January 2013, management estimated the Group’s revenue and profit before income tax for the year would have been $1,180,163,000 and $610,808,000 respectively. The identifiable assets acquired and liabilities assumed at the acquisition date were as follows:
Net assets acquired: Previous
carrying amount Fair value
adjustments
Fair value recognised
on acquisition S$’000 S$’000 S$’000 Cash and cash equivalents 2,999 - 2,999 Trade receivables 952 - 952 Other current assets 185 - 185 Long-term investment 3,390 - 3,390 Inventories 5 - 5 Property, plant and equipment 24 - 24 Investment properties 18,237 38,836 57,073 Other payables (508) - (508) Income taxes payables (118) - (118) Long-term payables (1,936) - (1,936) Foreign currency reserve - 1,512 1,512 Total identifiable net assets 23,230 40,348 63,578 Less: Non-controlling interests’ proportionate shares of net assets (22,192) Less: Negative goodwill (11,906) Total purchase consideration 29,480 Less: Cash and cash equivalents acquired (2,999) Net cash outflow on acquisition of subsidiaries 26,481
(b) Disposal of subsidiaries
(i) In April 2014, the Group disposed its entire shareholding in Integrated Investments Ltd (“Integrated”) and Solid
Growth Investments Ltd (“Solid”) for a total consideration of USD4,400,000 (equivalent to $5,539,000). Following the disposal, Integrated Investments Ltd and Solid Growth Investments Ltd, together with their respective subsidiaries, Zhuhai Huafeng Film Co., Ltd and Zhuhai Huafeng Printing Co., Ltd, ceased to be subsidiaries of the Group.
(ii) In December 2014, the Group disposed its entire issued units in Holbrook House Unit Trust and its entire shareholding in CLOF (Holbrook House) Jersey Nominee A Limited and CLOF (Holbrook House) Jersey Nominee B Limited, being the beneficial owner and legal owners of New Brook Buildings respectively, for a total net consideration of GBP112,323,000 (equivalent to $231,498,000).
135Notes to the Financial Statements

40 Business Combinations (cont’d) (b) Disposal of subsidiaries (cont’d)
The following table summarises the carrying amount of major classes of identifiable assets and liabilities disposed during the financial year 2014:
Integrated and Solid CLOF
Total
S$’000 S$’000 S$’000 Cash and cash equivalents 405 2,908 3,313 Trade receivables - 3,372 3,372 Other current assets 129 159 288 Property, plant and equipment 1,147 - 1,147 Investment properties 4,558 172,625 177,183 Other payables (15) (7,238) (7,253) Net carrying amount of assets disposed 6,224 171,826 178,050 Less: Non-controlling interests (685) - (685) Net assets disposed 5,539 171,826 177,365 Net foreign currency reserve realised upon disposal (5,554) (11,346) (16,900) Gain on disposal of subsidiaries 5,554 71,018 76,572 Net proceeds from disposal 5,539 231,498 237,037 Less: Cash of disposed subsidiaries (405) (2,908) (3,313) Net cash inflow on disposal 5,134 228,590 233,724
(c) Acquisition or disposal of non-controlling interests
(i) On 12 March 2014 and 21 November 2014, the Group through its subsidiary, injected additional capital of
IDR2.2 billion (equivalent to $242,000) and IDR2.8 billion (equivalent to $308,000) respectively into PT Mustika Candraguna (“MCG”). Following these capital injections, the Group’s effective interest in MCG increased from 34.90% to 46.58%. The Group recognised an increase in other reserves and a decrease in non-controlling interests of $1,236,000.
(ii) On 14 April 2014, PT Sinar Mas Wisesa, transferred its 99.99% equity interest in PT Karya Dutamas Cemerlang (“KDC”) to PT Ekacentra Usahamaju for a total consideration of IDR131.2 billion (equivalent to $14,434,000). As a result of this transfer, the Group’s effective interest in KDC increased from 65.39% to 84.36%. The Group recognised a decrease in other reserves and an increase in non-controlling interests of $306,000.
(iii) On 28 April 2014, the Group through its subsidiaries, subscribed for additional 874,849,800 new shares in BSD for a total cash consideration of IDR1.6 trillion (equivalent to $175,145,000). Following this transaction, the Group’s effective interest in BSD increased from 49.87% to 51.50%. The Group recognised a decrease in other reserves and an increase in non-controlling interests of $37,070,000.
(iv) On 29 December 2014, the Group through its subsidiary, acquired additional 800,000 shares in WPR for a total
consideration of IDR1.5 billion (equivalent to $161,000), resulting in an increase in its effective equity interest in WPR from 29.30% to 29.57%. The Group recognised an increase in other reserves and a decrease in non-controlling interests of $97,000.
(v) On 20 February 2013, AFP Land (Malaysia) Sdn Bhd (“AFPLM”) became a wholly-owned subsidiary of the
Group following a transfer of the remaining 49% equity interest in AFPLM comprising 490,000 shares of RM1 each at par value. Following this transaction, and the allotment and issue to the Group of 49,192,581 additional shares of RM1 each credited as fully paid in Palm Resort Berhad (“PRB”) by the capitalisation of shareholders’ advances, the Group’s effective equity interest in PRB has increased from 40.15% to 99.22%. The Group recognised a decrease in other reserves and an increase in non-controlling interests of $8,288,000.
Sinarmas Land Limited Annual Report 2014136
Notes to the Financial Statements31 December 2014

40 Business Combinations (cont’d) (c) Acquisition or disposal of non-controlling interests (cont’d) (vi) On 8 April 2013, PT Binamaju Grahamitra transferred its 3% equity interest in PT Binamaju Mitra Sejati (“BMS”)
to PT Sinarwisata Permai for a total consideration of IDR1.1 billion. As a result of this transfer, the Group’s effective interest in BMS decreased from 56.33% to 55.12%. The Group recognised a decrease in other reserves and an increase in non-controlling interests of $170,000.
(vii) On 27 August 2013, the Group through its subsidiary, injected additional capital of IDR800 billion (equivalent to
$88,000,000) into PT Sinar Mas Teladan (“SMT”). Following this capital injection, the Group’s effective interest in SMT decreased from 61.83% to 58.17%. The Group recognised an increase in other reserves and a decrease in non-controlling interests of $3,985,000.
41 Segments Information
The Group’s reportable segments are strategic business units that offer different products and services. They are managed separately because each business requires different marketing strategies. Set out below are the Group’s reportable segment: Indonesia Property - investment and development of commercial, industrial and residential properties and
ownership and management of hotels and resorts in Indonesia.
International Property - investment and development of commercial and residential properties and ownership and management of hotels and resorts in Malaysia, select mixed development in China and ownership and leasing of investment property in United Kingdom and Singapore.
Group Indonesia Property
International Property
Others/ Eliminations Total
S$’000 S$’000 S$’000 S$’000 2014 Total revenue 776,402 52,317 - 828,719 Inter-segment revenue - (167) - (167) Revenue from external customers 776,402 52,150 - 828,552
EBITDA 445,806 13,564 (7,629) 451,741 Other Information Capital expenditures on investment properties and
property, plant and equipment 64,701 124,816 - 189,517 Depreciation and amortisation expenses 15,361 5,349 43 20,753 Interest income 38,069 1,713 (614) 39,168 Interest expenses 45,723 15,360 (7,020) 54,063 Exceptional gain, net 12,050 71,018 5,554 88,622 Gain on disposal of property, plant and equipment 111 9 - 120 Share of results of associated companies, net of tax 2,244 - - 2,244 Share of results of joint ventures, net of tax 10,142 - - 10,142
137Notes to the Financial Statements

41 Segments Information (cont’d)
Group Indonesia Property
International Property
Others/ Eliminations Total
S$’000 S$’000 S$’000 S$’000 2014 Assets Segment assets 4,755,517 * 485,201 1,445,143 6,685,861
Liabilities Segment liabilities 2,219,080 426,641 888,074 3,533,795 2013 (Restated) Total revenue 1,084,138 94,790 - 1,178,928 Inter-segment revenue - (141) - (141) Revenue from external customers 1,084,138 94,649 - 1,178,787
EBITDA 622,263 20,248 (4,448) 638,063 Other Information Capital expenditures on investment properties and
property, plant and equipment 142,347 1,629 - 143,976 Depreciation and amortisation expenses 12,653 4,756 54 17,463 Interest income 31,245 428 (66) 31,607 Interest expenses 15,220 10,955 (4,140) 22,035 Exceptional gain, net 57,753 - - 57,753 Gain/(Loss) on disposal of property, plant and
equipment 189 (42) (1) 146 Share of results of associated companies, net of tax (2,887) - - (2,887) Share of results of joint ventures, net of tax (87,955) - - (87,955)
Assets Segment assets 3,881,782 * 466,892 1,325,092 5,673,766
Liabilities Segment liabilities 1,873,055 454,853 776,368 3,104,276
* Segment assets in Indonesia Property include investments in associated companies and joint ventures of $223,276,000 and $103,888,000 (2013: $195,822,000 and $65,512,000) respectively. A reconciliation of total EBITDA to total profit before income tax is as follows:
(Restated) 2014 2013 S$’000 S$’000 EBITDA for reportable segments 459,370 642,511 Other EBITDA (7,629) (4,448) Depreciation and amortisation (20,753) (17,463) Foreign exchange (loss)/gain, net (2,894) 44,601 Interest expenses (54,063) (22,035) Exceptional items, net 88,622 57,753 Share of results of associated companies, net of tax 2,244 (2,887)
Share of results of joint ventures, net of tax 10,142 (87,955) Profit before income tax 475,039 610,077
Sinarmas Land Limited Annual Report 2014138
Notes to the Financial Statements31 December 2014

41 Segments Information (cont’d)
A reconciliation of total assets for reportable segments to total assets is as follows: (Restated) 2014 2013 S$’000 S$’000 Total assets for reportable segments 5,240,718 4,348,674 Other assets 1,445,143 1,325,092 Elimination of inter-segment receivables (1,941,132) (1,674,109) Total assets 4,744,729 3,999,657
A reconciliation of total liabilities for reportable segments to total liabilities is as follows:
(Restated) 2014 2013 S$’000 S$’000
Total liabilities for reportable segments 2,645,721 2,327,908 Other liabilities 888,074 776,368 Elimination of inter-segment payables (1,982,294) (1,708,445) Total liabilities 1,551,501 1,395,831
The Group’s property business is located in Indonesia, China, Malaysia, Singapore and United Kingdom. The following table provides an analysis of the Group’s revenue from business by geographical market, irrespective of the origin of the goods/services.
(Restated) 2014 2013 S$’000 S$’000 Indonesia 780,519 1,087,636 China 15,948 64,015 Malaysia 15,237 16,192 United Kingdom 12,385 6,477 Singapore 4,463 4,467 Consolidated revenue 828,552 1,178,787
The following tables present analysis of the carrying amount of non-current non-financial assets and capital expenditures on investment properties and property, plant and equipment, analysed by the geographical area in which the assets are located:
(Restated) 2014 2013 S$’000 S$’000
Indonesia 2,143,335 1,794,158 United Kingdom 122,605 176,020 Singapore 61,088 64,283 Malaysia 54,122 54,596 China 13,572 23,897 Total non-current non-financial assets 2,394,722 2,112,954 United Kingdom 123,710 - Indonesia 65,248 142,434 Malaysia 553 1,535 China 6 7 Total capital expenditures 189,517 143,976
139Notes to the Financial Statements

42 Subsidiaries
The details of the subsidiaries are as follows:
Name of company and country of incorporation Principal activities
The Company Cost of investment
Effective percentage of equity held by the Group
2014 2013 2014 2013 S$’000 S$’000 % % AFP International Finance
Ltd (1) Mauritius
Provision of management and consultancy services
-* -* 100.00 100.00
AFP International Finance
(2) Ltd (1) Mauritius
Financing activities -* -* 100.00 100.00
AFP International Finance
(3) Ltd (2) British Virgin Islands
Investment holding 14 14 100.00 100.00
Asia Management Services
Ltd (1) Mauritius
Provision of management and consultancy services
-* -* 100.00 100.00
Alluvium Finance B.V. (2)
The Netherlands Dormant 37 37 100.00 100.00
Ever Forward Asia Limited
(1) Hong Kong
Dormant -* -* 100.00 100.00
Golden Ray Development
Pte. Ltd. Singapore
Real estate development -* -* 100.00 100.00
SML Brook England (HK)
Limited (5f) Hong Kong
Investment holding -* -* 100.00 100.00
SML Jersey Properties Pte
Limited (1) Jersey
Investment holding -* -* 100.00 100.00
SML Jersey Brook Pte
Limited (1) Jersey
Investment holding -* -* 100.00 100.00
SML Brook Partners Pte
Limited (1) Jersey
Investment holding -* -* 100.00 100.00
CLOF (Holbrook House)
Jersey Nominee A Limited (2), (Note 40(b)(ii)) Jersey
Nominee company - -* - 100.00
CLOF (Holbrook House)
Jersey Nominee B Limited (2), (Note 40(b)(ii)) Jersey
Nominee company - -* - 100.00
Sinarmas Land Limited Annual Report 2014140
Notes to the Financial Statements31 December 2014

42 Subsidiaries (cont’d)
Name of company and country of incorporation Principal activities
The Company Cost of investment
Effective percentage of equity held by the Group
2014 2013 2014 2013 S$’000 S$’000 % % SML Great Pte Limited
(1),(7) Jersey
Property investment and development
-* - 100.00 -
Indonesia Property Division ACF Finance Ltd (2)
British Virgin Islands Treasury management - - 100.00 100.00
ACF Solutions Holding Ltd
(1) Mauritius
Investment holding - - 100.00 100.00
AFP International Capital
Pte. Ltd. Singapore
Investment holding -* -* 100.00 100.00
Jermina Limited (5e)
Hong Kong Investment holding - - 100.00 100.00
Linsville Limited (2)
Cayman Islands Investment holding - - 100.00 100.00
PT Anekagriya Buminusa (1)
Indonesia Real estate development - - 45.61 6 44.16 6
PT Aneka Karya Amarta (1)
Indonesia Investment holding - - 84.37 84.37
PT Bhineka Karya Pratama
(1) Indonesia
Investment holding - - 72.12 72.12
PT Binamaju Grahamitra (1)
Indonesia Real estate development - - 84.37 84.35
PT Binamaju Mitra Sejati (1)
Indonesia Real estate development - - 55.50 55.12
PT Binasarana Muliajaya (4)
Indonesia Provision of management and consultancy services
- - 72.71 99.97
PT Bumi Indah Asri (1),(7)
Indonesia Real estate development - - 51.50 -
PT Bumi Karawang Damai
(1) Indonesia
Real estate development - - 52.81 50.49
PT Bumi Megah Graha Asri
(1) Indonesia
Real estate and property development
- - 46.40 6 46.40 6
PT Bumi Paramudita Mas (1)
Indonesia Real estate development - - 51.50 49.87 6
141Notes to the Financial Statements

42 Subsidiaries (cont’d)
Name of company and country of incorporation Principal activities
The Company Cost of investment
Effective percentage of equity held by the Group
2014 2013 2014 2013 S$’000 S$’000 % % PT Bumi Serpong Damai
Tbk (1),(Note 40(c)(iii)) Indonesia
Investment holding, construction and development of houses and buildings
- - 51.50 49.87 6
PT Bumi Samarinda Damai
(1) Indonesia
Real estate development - - 43.09 6 42.50 6
PT Bumi Wisesa Jaya (1)
Indonesia Real estate development - - 51.50 49.87 6
PT Duta Cakra Pesona
(1),(7) Indonesia Real estate development - - 51.50 -
PT Duta Dharma Sinarmas
(1) Indonesia
Real estate development - - 26.27 6 25.43 6
PT Duta Mitra Mas (1)
Indonesia Real estate development - - 51.50 49.87 6
PT Duta Pertiwi Tbk (1)
Indonesia Property development, general trading and investment holding
- - 45.61 6 44.16 6
PT Duta Semesta Mas (1)
Indonesia Property development - - 45.61 6 44.16 6
PT Duta Usaha Sentosa (1)
Indonesia Real estate development - - 84.37 84.37
PT Duta Virtual Dotkom (4)
Indonesia E-commerce - - 45.00 6 43.57 6
PT Ekacentra Usahamaju (1)
Indonesia Investment holding - - 84.36 84.36
PT Garwita Sentra Utama (1)
Indonesia Real estate development - - 51.50 49.87 6
PT Grahadipta Wisesa (1)
Indonesia Real estate development - - 66.29 65.39
PT Indowisata Makmur (1)
Indonesia Property development - - 84.39 84.42
PT Inter Sarana Prabawa (1)
Indonesia Real estate development - - 84.37 84.37
PT Inti Tekno Sukses
Bersama (4) Indonesia
Educational and property development
- - 72.71 99.97
PT Kanaka Grahaasri (1)
Indonesia Real estate development - - 45.61 6 44.16 6
Sinarmas Land Limited Annual Report 2014142
Notes to the Financial Statements31 December 2014

42 Subsidiaries (cont’d)
Name of company and country of incorporation Principal activities
The Company Cost of investment
Effective percentage of equity held by the Group
2014 2013 2014 2013 S$’000 S$’000 % % PT Karawang Bukit Golf (1)
Indonesia Residential estate and country club and golf club development
47,995 47,995 98.12 98.12
PT Karawang Tatabina
Industrial Estate (1) Indonesia
Industrial estate development
41,708 41,708 48.77 6 48.77 6
PT Kembangan Permai
Development (1) Indonesia
Real estate development - - 36.49 6 35.33 6
PT Karya Dutamas
Cemerlang (1), (Note 40(c)(ii)) Indonesia
Industrial estate development
- - 84.36 65.39
PT Kurnia Subur Permai (1)
Indonesia Real estate development - - 45.61 6 44.16 6
PT Kusumasentral Kencana
(1) Indonesia Property development - - 46.40 6 46.40 6
PT Masagi Propertindo (1)
Indonesia Property development - - 84.14 84.14
PT Mekanusa Cipta (1)
Indonesia Real estate development - - 45.61 6 44.16 6
PT Metropolitan Transcities
Indonesia (1) Indonesia
Investment holding - - 84.37
84.37
PT Misaya Properindo (1)
Indonesia Real estate development - - 45.61 6 44.16 6
PT Mitrakarya Multiguna (1)
Indonesia Real estate development - - 45.61 6 44.16 6
PT Mustika Candraguna
(1),(Note 40(c)(i)) Indonesia
Property development - - 46.58 6 34.90 6
PT Mustika Karya Sejati (1)
Indonesia Real estate development - - 45.61 6 44.16 6
PT Pangeran Plaza Utama (1)
Indonesia Real estate development - - 45.61 6 44.16 6
PT Paraga Artamida (1)
Indonesia Investment holding and provision of consultancy services
720,727 720,727 84.37 84.37
PT Pastika Candra Pertiwi
(1) Indonesia
Real estate development - - 51.50 49.87 6
143Notes to the Financial Statements

42 Subsidiaries (cont’d)
Name of company and country of incorporation Principal activities
The Company Cost of investment
Effective percentage of equity held by the Group
2014 2013 2014 2013 S$’000 S$’000 % % PT Pembangunan Deltamas
(1),(Note 40(a)(iii)) Indonesia
Property and real estate development
- - 49.40 6 49.40 6
PT Perwita Margasakti (1)
Indonesia Property development - - 45.61 6 44.16 6
PT Phinisi Multi Properti
(1),(Note 40(a)(ii)) Indonesia
Real estate development - - 35.02 6 -
PT Phinisindo Zamrud
Nusantara (1),(Note 40(a)(i)) Indonesia
Property development - - 35.34 6 22.08 6
PT Praba Selaras Pratama
(1) Indonesia
Real estate development and investment holding
- - 51.50 49.87 6
PT Prestasi Mahkota Utama
(1) Indonesia
Real estate development - - 45.61 6 44.16 6
PT Puradelta Lestari Tbk
(1),(Note 40(a)(iii)) Indonesia
Property and real estate development
- - 49.40 6 49.40 6
PT Prima Sehati (1)
Indonesia Real estate development - - 45.61 6 44.16 6
PT Putra Alvita Pratama (1)
Indonesia Real estate development - - 24.41 6 23.63 6
PT Putra Prabukarya (1)
Indonesia Real estate development - - 45.61 6 44.16 6
PT Putra Tirta Wisata (1)
Indonesia Property management - - 24.41 6 23.64 6
PT Royal Oriental (1)
Indonesia Property development - - 55.64 54.57
PT Saranapapan Ekasejati (1)
Indonesia Real estate development - - 45.61 6 44.16 6
PT Sentra Selaras Lestari (1)
Indonesia Real estate development - - 51.50 49.87 6
PT Sentra Selaras Phinisi
(1),(7) Indonesia
Real estate development - - 51.50 -
PT Sentra Talenta Utama (1)
Indonesia Real estate development and investment holding
- - 51.50 49.87 6
Sinarmas Land Limited Annual Report 2014144
Notes to the Financial Statements31 December 2014

42 Subsidiaries (cont’d)
Name of company and country of incorporation Principal activities
The Company Cost of investment
Effective percentage of equity held by the Group
2014 2013 2014 2013 S$’000 S$’000 % % PT Simas Tunggal Centre (1)
Indonesia Investment holding - - 81.84 81.84
PT Sinar Mas Teladan (1)
Indonesia Property development - - 59.35 58.17
PT Sinar Mas Wisesa (1)
Indonesia Real estate development - - 66.29 65.39
PT Sinar Pertiwi Megah (1)
Indonesia Real estate development - - 51.50 49.87 6
PT Sinar Usaha Mahitala (1)
Indonesia Real estate development and investment holding
- - 51.50 49.87 6
PT Sinar Usaha Marga (1)
Indonesia Real estate development - - 73.52 72.98
PT Sinarwijaya Ekapratista
(1) Indonesia
Real estate development - - 45.61 6 44.16 6
PT Sinarwisata Lestari (1)
Indonesia Hotel - - 45.61 6 44.16 6
PT Sinarwisata Permai (1)
Indonesia Hotel - - 45.61 6 44.16 6
PT Sumber Arusmulia (5d)
Indonesia Investment holding - - 53.13 53.13
PT Surya Inter Wisesa (1)
Indonesia Real estate development - - 51.50 49.87 6
PT Transbsd Balaraja (1)
Indonesia Development and operation of toll roads
- - 38.63 6 37.40 6
PT Wijaya Pratama Raya
(1), (Note 40(c)(iv)) Indonesia
Property development - - 29.57 6 28.37 6
Sinarmas Land (HK) Limited
(5f) Hong Kong
Investment holding -* -* 100.00 100.00
Sinarmas Sentul Land
Limited (5f) Hong Kong
Trading, management service and investment holding
-* -* 100.00 100.00
Sittingham Assets Limited (2)
British Virgin Islands Investment holding 1,460 1,460 100.00 100.00
China Property Division AFP China Ltd (1)
Mauritius Investment holding -* -* 100.00 100.00
145Notes to the Financial Statements

42 Subsidiaries (cont’d)
Name of company and country of incorporation Principal activities
The Company Cost of investment
Effective percentage of equity held by the Group
2014 2013 2014 2013 S$’000 S$’000 % % AFP (Shanghai) Co., Ltd (5c)
People’s Republic of China Provision of management services
918 918 100.00 100.00
Integrated Investments Ltd
(1),(Note 40(b)(i)) Mauritius
Investment holding - 8,168 - 100.00
Shining Gold Real Estate
(Chengdu) Co., Ltd (5c) People’s Republic of China
Property investment and development
- - 100.00 100.00
Shining Gold Real Estate
(Shenyang) Co., Ltd (5c) People’s Republic of China
Property investment and development
- - 100.00 100.00
Solid Growth Investments
Ltd (1),(Note 40(b)(i)) Mauritius
Investment holding - 8,544 - 100.00
Zhuhai Huafeng Film Co.,
Ltd (5c),(Note 40(b)(i)) People’s Republic of China
Dormant - - - 85.00
Zhuhai Huafeng
Management and Consultancy Co., Ltd. (formerly known as Zhuhai Huafeng Packaging Co., Ltd) (5c) People’s Republic of China
Investment holding - - 100.00 100.00
Zhuhai Huafeng Printing Co.,
Ltd (5c),(Note 40(b)(i)) People’s Republic of China
Dormant - - - 85.00
AFP Land Division: AFP Gardens (Tanjong Rhu)
Pte Ltd Singapore
Property investment and development
- - 100.00 100.00
AFP Hillview Pte Ltd
Singapore Property development - - 100.00 100.00
AFP Land (Malaysia) Sdn
Bhd (1) Malaysia
Investment holding - - 100.00 100.00
AFP Land Limited
Singapore Investment holding and provision of management services
456,751 456,751 100.00 100.00
AFP Resort Development
Pte Ltd Singapore
Resort property development and investment holding
- - 100.00 100.00
Sinarmas Land Limited Annual Report 2014146
Notes to the Financial Statements31 December 2014
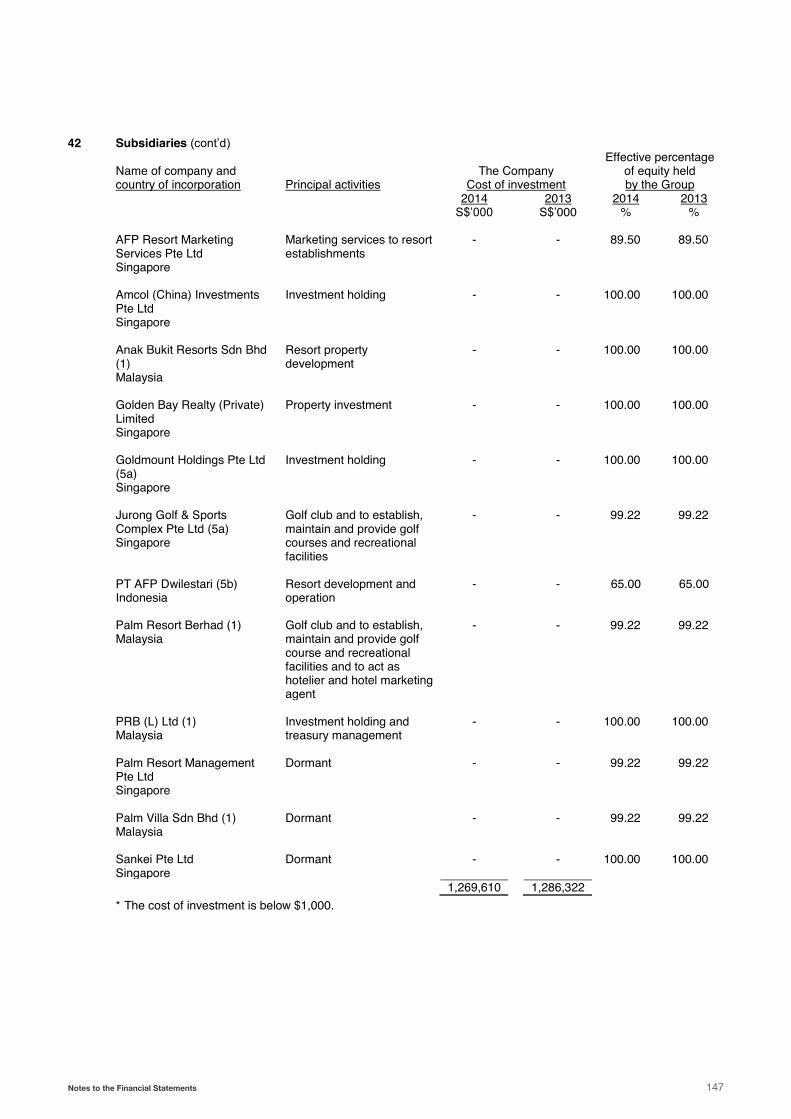
42 Subsidiaries (cont’d)
Name of company and country of incorporation Principal activities
The Company Cost of investment
Effective percentage of equity held by the Group
2014 2013 2014 2013 S$’000 S$’000 % % AFP Resort Marketing
Services Pte Ltd Singapore
Marketing services to resort establishments
- - 89.50 89.50
Amcol (China) Investments
Pte Ltd Singapore
Investment holding - - 100.00 100.00
Anak Bukit Resorts Sdn Bhd
(1) Malaysia
Resort property development
- - 100.00 100.00
Golden Bay Realty (Private)
Limited Singapore
Property investment - - 100.00 100.00
Goldmount Holdings Pte Ltd
(5a) Singapore
Investment holding - - 100.00 100.00
Jurong Golf & Sports
Complex Pte Ltd (5a) Singapore
Golf club and to establish, maintain and provide golf courses and recreational facilities
- - 99.22 99.22
PT AFP Dwilestari (5b)
Indonesia Resort development and operation
- - 65.00 65.00
Palm Resort Berhad (1)
Malaysia Golf club and to establish, maintain and provide golf course and recreational facilities and to act as hotelier and hotel marketing agent
- - 99.22 99.22
PRB (L) Ltd (1)
Malaysia Investment holding and treasury management
- - 100.00 100.00
Palm Resort Management
Pte Ltd Singapore
Dormant - - 99.22 99.22
Palm Villa Sdn Bhd (1)
Malaysia Dormant - - 99.22 99.22
Sankei Pte Ltd
Singapore Dormant - - 100.00 100.00
1,269,610 1,286,322
* The cost of investment is below $1,000.
147Notes to the Financial Statements

42 Subsidiaries (cont’d) Notes: The above subsidiaries are audited by Moore Stephens LLP, Singapore except for subsidiaries that are indicated below: (1) Audited by member firms of Moore Stephens International Limited of which Moore Stephens LLP,
Singapore is a member.
(2) No statutory audit is required by law in its country of incorporation.
(3) No statutory audit is required as the subsidiary was or is in the process of liquidation.
(4) No statutory audit is required as the subsidiary is newly incorporated/inactive. (5) Audited by other firms of accountants as follows:
(a) CA Practice PAC (b) BDO Tanubrata Sutanto Fahmi & Rekan. (c) Zhonghua Certified Public Accountants LLP. (d) Audited by member firms of Moore Stephens International Limited of which Moore Stephens
LLP, Singapore is a member, except for the financial year 2013 which was audited by Hendrawinata Eddy & Siddharta.
(e) Leung Siu Wo & Co. (f) TCL & Company, Certified Public Accountants (Practising).
(6) These subsidiaries are held by non-wholly owned intermediate holding companies. The intermediate
holding companies have the power to control over of these companies. (7) During the financial year 2014, the following subsidiaries have been incorporated:
Subsidiaries Initial issued and paid up capital SML Great Pte Limited 2 ordinary shares for GBP2 PT Bumi Indah Asri PT Duta Cakra Pesona PT Sentra Selaras Phinisi
12,500 shares of IDR1,000 each 12,500 shares of IDR1,000 each
275,000 shares of IDR1 million each
(8) As at 31 December 2014, the accumulated non-controlling interests is $1,478,527,000 (2013: $1,182,528,000), of which $986,653,000 (2013: $784,752,000) is for 15.63% non-controlling interests in PT Paraga Artamida and its subsidiaries (“Paraga Group”) and $429,525,000 (2013: $345,542,000) is for 50.60% non-controlling interests in PT Puradelta Lestari Tbk and its subsidiary (“PDL Group”) respectively. The non-controlling interests in respect of other subsidiaries are individually not material.
Sinarmas Land Limited Annual Report 2014148
Notes to the Financial Statements31 December 2014

42 Subsidiaries (cont’d)
(8) The following table summarises the financial information relating to Paraga Group and PDL Group which has non-controlling interests (“NCI”) that are material to the Group:
Paraga Group PDL Group 2014 2013 2014 2013 S$’000 S$’000 S$’000 S$’000
Non-current assets 1,799,001 1,439,729 578,408 592,111 Current assets 1,431,357 1,097,135 406,953 317,934 Non-current liabilities (739,400) (742,706) (36,405) (96,656) Current liabilities (772,039) (442,124) (100,022) (130,423) Revenue 565,203 833,900 169,358 193,751 Profit for the year 160,148 208,601 95,830 78,926
Total comprehensive income/(loss) for the year 185,589 35,094 165,880 (119,322)
Profit allocated to NCI 107,705 152,383 48,490 39,354 Dividends paid to NCI 12,034 19,449 - -
Cash inflows from operating activities 53,051 53,258 85,310 107,712
Cash (outflows)/inflows from investing activities (42,400) (270,417) (7,349) 2,127
Cash (outflows)/inflows from financing activities, before dividends to NCI (70,783) 297,910 (67,215) (111,135)
Net (decrease)/increase in cash and cash equivalents (60,132) 80,751 10,746 (1,296)
149Notes to the Financial Statements

43 Associated Companies Name of company and country of incorporation Principal activities
The Group Cost of investment
Effective percentage of equity held by the Group
(Restated) 2014 2013 2014 2013 S$’000 S$’000 % % PT AMSL Delta Mas (“ADM”) (2) Indonesia
Property development 25,774 10,417 17.00 4 16.46 4
PT AMSL Indonesia (“AMSL”) (2) Indonesia
Property development 24,723 24,723 17.00 4 16.46 4
PT Citraagung Tirtajatim (1) Indonesia
Property development 2,146 2,146 18.24 4 17.66 4
PT Duta Karya Propertindo (3) Indonesia
Property management 47 47 22.81 22.08
PT Harapan Anang Bakri & Sons (1) Indonesia
Industrial estate development
879 879 37.12 37.12
PT Maligi Permata Industrial Estate (1) Indonesia
Industrial estate development
4,809 4,809 42.19 42.19
PT Matra Olahcipta (1) Indonesia
Property development 3,080 3,080 22.81 22.08
PT Phinisindo Zamrud Nusantara (1),(Note 40(a)(i)) Indonesia
Property development - 434 - 22.08
PT Plaza Indonesia Realty Tbk (“PIR”) (2),(5) Indonesia
Property development and hotel owner
199,176 199,176 17.62 4 26.03
PT Serasi Niaga Sakti (1) Indonesia
Real estate development 4,202 4,202 42.19 42.19
264,836 249,913
Notes: (1) Audited by member firms of Moore Stephens International Limited of which Moore Stephens LLP,
Singapore is a member. (2) Audited by other firms of accountants, Osman Bing Satrio & Eny. (3) No statutory audit is required as the company is inactive/newly incorporated. (4) These companies are held by non-wholly owned intermediate holding companies. The intermediate
holding companies are able to exercise significant influence on its financial and operating policies. (5) In April 2014, BSD has acquired from PAM an aggregate of 922,760,000 shares, representing 25.99%
of the shareholding in PIR, for a total consideration of IDR2 trillion (equivalent to $223,308,000) resulting in a decrease in the Group’s effective interest in PIR from 26.03% to 17.06%. Subsequently, following the additional share subscription in BSD (Note 40(c)(iii)) , the Group’s effective equity interest in PIR increased from 17.06% to 17.62%.
Sinarmas Land Limited Annual Report 2014150
Notes to the Financial Statements31 December 2014

ISSUED AND FULLY PAID-UP CAPITAL : S$1,907,108,100.14NO. OF SHARES ISSUED : 3,041,959,437 SHARESCLASS OF SHARES : ORDINARY SHARES VOTING RIGHTS : ONE VOTE PER SHARE
Size of Shareholdings No. of Shareholders % No. of Shares %
1 - 99 117 1.41 4,291 0.00100 - 1,000 933 11.22 662,895 0.021,001 - 10,000 5,491 66.03 25,147,710 0.8310,001 - 1,000,000 1,748 21.02 83,453,597 2.741,000,001 & ABOVE 27 0.32 2,932,690,944 96.41Total 8,316 100.00 3,041,959,437 100.00
TWENTY LARGEST SHAREHOLDERS
Name of Shareholders No. of Shares %
FLAMBO INTERNATIONAL LIMITED 1,675,129,854 55.07DBS NOMINEES PTE LTD 370,758,882 12.19RAFFLES NOMINEES (PTE) LTD 268,968,391 8.84GOLDEN MOMENT LIMITED 169,000,000 5.56UOB KAY HIAN PTE LTD 120,355,278 3.96CIMB SECURITIES (S’PORE) PTE LTD 112,174,592 3.69MORGAN STANLEY ASIA (S) SECURITIES PTE LTD 101,190,500 3.33CITIBANK NOMINEES S’PORE PTE LTD 44,799,238 1.47BANK OF S’PORE NOMINEES PTE LTD 16,623,888 0.55OCBC SECURITIES PRIVATE LTD 9,581,553 0.31UNITED OVERSEAS BANK NOMINEES PTE LTD 7,209,084 0.24WISNU KUSMIN OR DIANAWATI TJENDERA 5,000,000 0.16HSBC (SINGAPORE) NOMINEES PTE LTD 4,466,437 0.15COSMIC INSURANCE CORPORATION LIMITED - SIF 3,131,000 0.10CHEE SWEE HENG 3,000,000 0.10DBS VICKERS SECURITIES (S) PTE LTD 2,929,639 0.10OCBC NOMINEES SINGAPORE PTE LTD 2,482,215 0.08TAN KAH BOH ROBERT @ TAN KAH BOO 2,200,000 0.07HONG LEONG FINANCE NOMINEES PTE LTD 2,045,666 0.07TAN BOON HUAT 2,026,000 0.07Total 2,923,072,217 96.11
SUBSTANTIAL SHAREHOLDERS No. of Shares in which they have an Interest
NameDirect
InterestPercentage
(%)Deemed Interest
Percentage(%)
Total Percentage (Direct and
Deemed Interest)(%)
GOLDEN MOMENT LIMITED (“Golden Moment”)
169,000,000 5.55 – – 5.55
FLAMBO INTERNATIONAL LIMITED1
(“Flambo”)1,825,129,854 60.00 169,000,000 5.55 65.55
THE WIDJAJA FAMILY MASTER TRUST(2)2
(“WFMT(2)”)– – 1,994,129,854 65.55 65.55
Notes:1 The deemed interest of Flambo arises from its interest in 169,000,000 shares held by its wholly-owned subsidiary, Golden Moment in the Company.2 The deemed interest of WFMT(2) arises from its interest in 1,825,129,854 shares held by Flambo and 169,000,000 shares held by Golden Moment in
the Company.
Based on the information available to the Company as at 9 March 2015, approximately 34% of the issued ordinary shares of the Company is held by the public and therefore, Rule 723 of the Listing Manual issued by the Singapore Exchange Securities Trading Limited is complied with.
151
Shareholding StatisticsAs at 9 March 2015
Shareholding Statistics

NO. OF WARRANTS ISSUED : 1,520,978,744
EXPIRY DATE OF WARRANTS : 18 November 2015 (“Exercise Date”), provided that if such day falls on a date on which the Register of Members and/or the Register of Warrantholders are closed or is not a business day, then the Exercise Date shall be the next business day on which the Register of Members and the Register of Warrantholders are open.
Each Warrant entitles the holder to subscribe for one (1) new ordinary share (“New Share”) at an exercise price of S$0.10 for each New Share on the Exercise Date.
Size of Warrantholdings No. of Warrantholders % No. of Warrants %
1 - 99 124 1.87 3,961 0.00100 - 1,000 2,181 32.81 1,383,740 0.091,001 - 10,000 3,700 55.66 13,150,869 0.8710,001 - 1,000,000 617 9.28 34,724,604 2.281,000,001 & ABOVE 25 0.38 1,471,715,570 96.76Total 6,647 100.00 1,520,978,744 100.00
TWENTY LARGEST WARRANTHOLDERS
Name of Warrantholders No. of Warrants %
FLAMBO INTERNATIONAL LIMITED 849,771,000 55.87DBS NOMINEES PTE LTD 182,422,159 11.99RAFFLES NOMINEES (PTE) LTD 135,462,068 8.91GOLDEN MOMENT LIMITED 72,293,927 4.75UOB KAY HIAN PTE LTD 60.657,138 3.99CIMB SECURITIES (S’PORE) PTE LTD 57,496,067 3.78MORGAN STANLEY ASIA (S) SECURITIES PTE LTD 49,252,500 3.24OCBC SECURITIES PRIVATE LTD 12,794,531 0.84LIEW CHEE KONG 7,664,000 0.50BANK OF S’PORE NOMINEES PTE LTD 6,789,444 0.45TAN NG KUANG 6,385,000 0.42CITIBANK NOMINEES S’PORE PTE LTD 6,229,047 0.41UNITED OVERSEAS BANK NOMINEES PTE LTD 2,989,331 0.20PHILLIP SECURITIES PTE LTD 2,981,587 0.20TAN JOON YANG 2,550,000 0.17WISNU KUSMIN OR DIANAWATI TJENDERA 2,500,000 0.16HSBC (SINGAPORE) NOMINEES PTE LTD 2,302,135 0.15BNP PARIBAS NOMINEES S’PORE PTE LTD 1,985,333 0.13DBS VICKERS SECURITIES (S) PTE LTD 1,842,653 0.12COSMIC INSURANCE CORPORATION LIMITED – SIF 1,565,500 0.10Total 1,465,933,420 96.38
Sinarmas Land Limited Annual Report 2014152
Warrantholding StatisticsAs at 9 March 2015

SINARMAS LAND LIMITED(Incorporated in the Republic of Singapore)
Company Registration No. 199400619R
NOTICE IS HEREBY GIVEN that an Annual General Meeting of Sinarmas Land Limited (the “Company” or “SML”) will be held on Friday, 24 April 2015 at 9.00 a.m. at PARKROYAL on Beach Road, Grand Ballroom, Level 1, 7500 Beach Road, Singapore 199591 to transact the following business:
AS ORDINARY BUSINESS
1. To receive and adopt the Audited Financial Statements for the year ended 31 December 2014 together with the
Directors’ and Auditors’ Reports thereon. (Resolution 1)
2. To declare a fi rst and fi nal tax-exempted (one-tier) dividend of S$0.005 per ordinary share for the year ended
31 December 2014. (Resolution 2)
3. To approve the Directors’ Fees of S$299,500 for the year ended 31 December 2014. (FY2013: S$286,000) (Resolution 3)
4. To re-elect the following Directors retiring by rotation pursuant to Article 91 of the Articles of Association of the Company:
(a) Mr. Muktar Widjaja {please see note 1} (Resolution 4)
(b) Mr. Ferdinand Sadeli {please see note 1} (Resolution 5)
5. To re-appoint Mr Kunihiko Naito as a Director of the Company pursuant to Section 153(6) of the Companies Act, Cap 50.
{please see note 2} (Resolution 6)
6. To re-appoint Moore Stephens LLP as Auditors of the Company and to authorise the Directors to fi x their remuneration.
(Resolution 7)
AS SPECIAL BUSINESS
7. To consider and, if thought fi t, to pass with or without any amendments, the following resolutions as Ordinary Resolutions:
Renewal of the Share Issue Mandate
7A. “That pursuant to Section 161 of the Companies Act, Cap 50 and the Listing Rules of the Singapore Exchange
Securities Trading Limited, authority be and is hereby given to the Directors of the Company to issue shares and
convertible securities in the Company (whether by way of rights, bonus or otherwise) at any time and upon such
terms and conditions and for such purposes as the Directors may, in their absolute discretion, deem fi t, provided
that the aggregate number of shares and convertible securities to be issued pursuant to this Resolution does not
exceed fi fty percent (50%) of the total number of issued shares excluding treasury shares of the Company at the date
of this Resolution, of which the aggregate number of shares and convertible securities to be issued other than on a
pro-rata basis to shareholders of the Company does not exceed twenty percent (20%) of the total number of issued
shares excluding treasury shares of the Company at the date of this Resolution, and, unless revoked or varied by
the Company in general meeting, such authority shall continue in force until the next Annual General Meeting of the
Company.” {please see note 3} (Resolution 8)
153Notice of Annual General Meeting
Notice of Annual General Meeting
Renewal of the Share Purchase Mandate
7B. “(a) That for the purposes of Sections 76C and 76E of the Companies Act, Cap 50 (the “Act”), the exercise by the
Directors of the Company of all the powers of the Company to purchase or otherwise acquire ordinary shares
(“Shares”) in the issued share capital of the Company not exceeding in aggregate the Prescribed Limit (as
hereafter defi ned), at such price or prices as may be determined by the Directors from time to time up to the
Maximum Price (as hereafter defi ned), whether by way of:
(i) market purchases (each a “Market Purchase”) on the Singapore Exchange Securities Trading Limited
(“SGX-ST”); and/or
(ii) off-market purchases (each an “Off-Market Purchase”) effected in accordance with any equal access
schemes as may be determined or formulated by the Directors as they consider fi t, which schemes shall
satisfy all the conditions prescribed by the Act,
and otherwise in accordance with all other laws, regulations and rules of the SGX-ST as may for the time
being be applicable, be and is hereby authorised and approved generally and unconditionally (the “Share
Purchase Mandate”);
(b) That unless varied or revoked by the Company in general meeting, the authority conferred on the Directors of
the Company pursuant to the Share Purchase Mandate may be exercised by the Directors at any time and from
time to time during the period commencing from the passing of this Resolution and expiring on the earlier of:
(i) the date on which the next Annual General Meeting of the Company is held or is required by law to be held;
or
(ii) the date on which purchases or acquisitions of Shares pursuant to the Share Purchase Mandate are
carried out to the full extent mandated; or
(iii) the date on which the authority in the Share Purchase Mandate is varied or revoked;
(c) That in this Resolution:
“Prescribed Limit” means ten percent (10%) of the total number of issued shares excluding treasury shares of
the Company as at the date of the passing of this Resolution; and
“Maximum Price” in relation to a Share to be purchased, means an amount (excluding brokerage, stamp
duties, applicable goods and services tax and other related expenses) not exceeding:
(i) in the case of a Market Purchase: 105% of the Average Closing Price
(ii) in the case of an Off-Market Purchase: 120% of the Highest Last Dealt Price
Sinarmas Land Limited Annual Report 2014154
Notice of Annual General Meeting

where:
“Average Closing Price” means the average of the closing market prices of a Share over the last fi ve (5) market
days, on which transactions in the Shares were recorded, preceding the day of the Market Purchase and
deemed to be adjusted for any corporate action that occurs after the relevant 5-day period;
“Highest Last Dealt Price” means the highest price transacted for a Share as recorded on the market day on
which there were trades in the Shares immediately preceding the day of the making of the offer pursuant to the
Off-Market Purchase; and
“day of the making of the offer” means the day on which the Company announces its intention to make an
offer for the purchase of Shares from Shareholders stating the purchase price (which shall not be more than the
Maximum Price calculated on the foregoing basis) for each Share and the relevant terms of the equal access
scheme for effecting the Off-Market Purchase; and
(d) That the Directors of the Company be and are hereby authorised to complete and do all such acts and things
(including executing such documents as may be required) as they may consider expedient or necessary to give
effect to the transactions contemplated by this Resolution.” {please see note 4} (Resolution 9)
Renewal of the Interested Person Transactions Mandate
7C. “(a) That pursuant to Chapter 9 of the Listing Manual of the Singapore Exchange Securities Trading Limited,
approval be and is hereby given to the Company, its subsidiaries and associated companies that are not
listed on the Singapore Exchange Securities Trading Limited or an approved exchange, provided that the Company
and its subsidiaries (the “Group”), or the Group and its interested person(s), has control over the associated
companies, or any of them to enter into any of the transactions falling within the types of Interested Person
Transactions, particulars of which are set out in the Appendix 2 to this Notice of Annual General Meeting {please
see note 5}, with any party who is of the class of Interested Persons described in the said Appendix 2, provided
that such transactions are carried out in the ordinary course of business and in accordance with the guidelines of
the Company for Interested Person Transactions as set out in the said Appendix 2 (the “IPT Mandate”);
(b) That the IPT Mandate shall, unless revoked or varied by the Company in general meeting, continue in force until
the next Annual General Meeting of the Company; and
(c) That the Directors of the Company be and are hereby authorised to complete and do all such acts and things (including
executing all such documents as may be required) as they may consider expedient or necessary or in the interests of
the Company to give effect to the IPT Mandate and/or this Resolution.” {please see note 6} (Resolution 10)
By Order of the Board
Ferdinand SadeliDirector2 April 2015Singapore
155Notice of Annual General Meeting
Notes:
i. With the exception of The Central Provident Fund Board (who may appoint more than two proxies), a member entitled to attend and vote at the Annual General Meeting is entitled to appoint no more than two proxies to attend and vote in his stead. A proxy need not be a member of the Company. Proxies must be lodged at the Registered Offi ce of the Company at 108 Pasir Panjang Road, #06-00 Golden Agri Plaza, Singapore 118535 not later than 48 hours before the Annual General Meeting.
ii. CPF Holders of SML shares who wish to receive a printed copy of the Annual Report 2014 may write in to request for a copy from the Company at 108 Pasir Panjang Road, #06-00 Golden Agri Plaza, Singapore 118535.
Additional information relating to the Notice of Annual General Meeting:
1. Please refer to the sections on Board of Directors and Corporate Governance Report in the Annual Report 2014 for further information on Mr. Muktar Widjaja and Mr. Ferdinand Sadeli.
2. Mr. Kunihiko Naito, if re-appointed, will remain as a member of the Audit Committee. Mr. Naito is considered to be independent. Please refer to the sections on Board of Directors and Corporate Governance Report in the Annual Report 2014 for further information on Mr. Naito.
3. The Ordinary Resolution 8 proposed in item 7A above, if passed, is to empower the Directors from the date of the above Annual General Meeting until the date of the next Annual General Meeting, to issue shares and convertible securities in the capital of the Company not exceeding fi fty percent (50%) of the total number of issued shares excluding treasury shares of the Company at the time this Resolution is passed. For issue of shares and convertible securities other than on a pro-rata basis to shareholders, the aggregate number of shares and convertible securities to be issued shall not exceed twenty percent (20%) of the total number of issued shares excluding treasury shares of the Company.
The percentage of the total number of issued shares excluding treasury shares shall be based on the total number of issued shares excluding treasury shares of the Company after adjusting for (a) new shares arising from the conversion or exercise of convertible securities or any employee share options on issue at the time this Resolution is passed and (b) any subsequent bonus issue, consolidation or subdivision of shares.
4. The Ordinary Resolution 9 proposed in item 7B above, if passed, is to renew for another year, up to the next Annual General Meeting of the Company, the mandate for share purchase as described in the Appendix 1 to this Notice of Annual General Meeting, which will, unless previously revoked or varied by the Company at a general meeting, expire at the next Annual General Meeting.
5. The mandate for transactions with Interested Persons as described in the Appendix 2 (the “Appendix 2”) to this Notice of Annual General Meeting includes the placement of deposits by the Company with fi nancial institutions in which Interested Persons have an interest.
6. The Ordinary Resolution 10 proposed in item 7C above, if passed, is to renew for another year, up to the next Annual General Meeting of the Company, the mandate for transactions with Interested Persons as described in the Appendix 2, which will, unless previously revoked or varied by the Company at a general meeting, expire at the next Annual General Meeting.
Sinarmas Land Limited Annual Report 2014156
Notice of Annual General Meeting

This page has been intentionally left blank.

This page has been intentionally left blank.

Important:1. For investors who have used their CPF monies to buy
shares of Sinarmas Land Limited, the Annual Report is forwarded to them at the request of their CPF Approved Nominees and is sent solely FOR INFORMATION ONLY.
2. This Proxy Form is not valid for use by CPF investors andshall be ineffective for all intents and purposes if used orpurported to be used by them.
PROXY FORMANNUAL GENERAL MEETING
SINARMAS LAND LIMITED(Incorporated in the Republic of Singapore)Company Registration No. 199400619R
I/We, (Name)
(NRIC/Passport/Company Registration Number)
of (Address)
being a member/members of Sinarmas Land Limited (the “Company”) hereby appoint:
Name AddressNRIC /
Passport NumberProportion of Shareholdings
No. of Shares %
and/or (delete as appropriate):
or failing him/her, the Chairman of the Annual General Meeting of the Company (the “AGM”) as my/our proxy/proxies to attend and vote for me/us on my/our behalf at the AGM to be held on Friday, 24 April 2015 at 9.00 a.m. at PARKROYAL on Beach Road, Grand Ballroom, Level 1, 7500 Beach Road, Singapore 199591 and at any adjournment thereof. I/We direct my/our proxy/proxies to vote for or against the resolution as set out in the Notice of AGM as indicated hereunder. If no specifi c direction as to voting is given, the proxy/proxies may vote or abstain from voting at his/their discretion, as he/they may on any other matter arising at the AGM.
Note: The Chairman of the AGM will be exercising his right under Article 61(a) of the Articles of Association of the Company to demand a poll in respect of each of the resolutions to be put to the vote of members at the AGM and at any adjournment thereof. Accordingly, each resolution at the AGM will be voted on by way of poll.
No. Resolutions *No. of Votes“For”
*No. of Votes“Against”
ORDINARY BUSINESS1 Adoption of Reports and Audited Financial Statements2 Declaration of First and Final Dividend3 Approval of Directors’ Fees for the year ended 31 December 20144 Re-election of Mr Muktar Widjaja5 Re-election of Mr Ferdinand Sadeli6 Re-appointment of Mr Kunihiko Naito7 Re-appointment of Auditors
SPECIAL BUSINESS8 Renewal of the Share Issue Mandate9 Renewal of the Share Purchase Mandate10 Renewal of the Interested Person Transactions Mandate
* If you wish to exercise all your votes “For” or “Against” the relevant resolution, please indicate with an “X” within the relevant box provided. Alternatively, if you wish to exercise your votes for both “For” and “Against” the relevant resolution, please indicate the number of votes as appropriate in the boxes provided.
Dated this day of 2015Total Number of Shares Held
Signature(s) or Common Seal of Member(s)
IMPORTANT: PLEASE READ NOTES ON THE REVERSE

Affi xStampHere
Fold along this line
Fold along this line. Glue and seal fi rmly.Fo
ld a
long
this
line
. Glu
e an
d se
al fi
rmly.
Fold along this line. Glue and seal fi rm
ly.
Fold along this line
ANNUAL GENERAL MEETINGPROXY FORM
The Company SecretarySINARMAS LAND LIMITED
108 Pasir Panjang Road#06-00 Golden Agri Plaza
Singapore 118535
Notes
1. Please insert the total number of shares held by you. If you have shares entered against your name in the Depository Register (as defi ned in Section 130A of the Companies Act, Cap 50), you should insert that number. If you have shares registered in your name in the Register of Members of the Company, you should insert that number. If you have shares entered against your name in the Depository Register and shares registered in your name in the Register of Members, you should insert the aggregate number. If no number is inserted, this form of proxy will be deemed to relate to all the shares held by you.
2. A member entitled to attend and vote at a meeting of the Company is entitled to appoint not more than two proxies to attend and vote on his behalf. A proxy need not be a member of the Company.
3. The instrument appointing a proxy or proxies must be deposited at the Company’s registered offi ce at 108 Pasir Panjang Road, #06-00 Golden Agri Plaza, Singapore 118535 not less than 48 hours before the time set for the AGM.
4. Where a member appoints more than one proxy, the appointments shall be invalid unless he specifi es the proportion of his holding to be represented by each proxy.
5. The instrument appointing a proxy or proxies must be under the hand of the appointor or of his attorney duly authorised in writing. Where the instrument appointing a proxy or proxies is executed by a corporation, it must be executed under its common seal or under the hand of its offi cer or attorney duly authorised.
6. Where an instrument appointing a proxy is signed on behalf of the appointor by an attorney, the power of attorney (or other authority) or a duly certifi ed copy thereof must (failing previous registration with the Company) be lodged with the instrument of proxy, failing which the instrument may be treated as invalid.
7. A corporation which is a member may authorise by resolution of its directors or other governing body such person as it thinks fi t to act as its representative at the AGM, in accordance with Section 179 of the Companies Act, Cap 50.
8. The Company shall be entitled to reject an instrument of proxy which is incomplete, improperly completed, illegible or where the true intentions of the appointor are not ascertainable from the instructions of the appointor specifi ed on the instrument of proxy. In addition, in the case of shares entered in the Depository Register, the Company may reject an instrument of proxy if the member, being the appointor, is not shown to have shares entered against his name in the Depository Register as at 48 hours before the time appointed for holding the AGM, as certifi ed by The Central Depository (Pte) Limited to the Company.


SINARMAS LAND LIMITEDCompany Registration No. 199400619R
108 Pasir Panjang Road,
#06-00 Golden Agri Plaza,
Singapore 118535
Tel : (65) 6220 7720
Fax : (65) 6590 0887
www.sinarmasland.com
Sinar Mas Land @sinarmas_Land S


