28
Building Stylish Power View Reports Riccardo Muti Microsoft Corporation DBI302 Building Stylish & Effective Power View Reports
| Date post: | 22-Dec-2015 |
| Category: |
Documents |
| Upload: | edith-stephens |
| View: | 214 times |
| Download: | 0 times |

Building Stylish Power View Reports
Riccardo Muti
Microsoft Corporation
DBI302
Building Stylish & Effective Power View Reports

Objectives
Introduction to Power ViewPower View Feature Deep DiveDemo, Demo, DemoRevealing the magic
Tips and Tricks to Get the Most Out of Power View
Part 1
Breakthrough Insights with Power View

POWER VIEW
Highly visual design experience
Rich metadata-driven interactivity
Presentation-ready at all times
END USER ALERTING
Defined from within operational or
ad-hoc reports
Intuitive Alert rules
Alerts self-managed through SharePoint
ENABLED AS SHAREPOINT SHARED SERVICE
Built-in scale-out for RS Service Apps
SharePoint Cross-farm reporting
Integrated backup & recovery, ULS logging, PowerShell etc.
SSRS INVESTMENTS IN SQL SERVER 2012
Managed Self Service BI – Corporate BI

WHAT IS POWER VIEW?
Easily change data and layout with quick clicks
Collaborate with full interactivity
Share dynamic reports quickly and easily
From Authoring to Presentation in Clicks
Cross Browser & Platform Managed & Discoverable

SQL SERVER 2012 POWER VIEW
Interactive, web-based authoring and sharing of informationFamiliar Microsoft Office design patternsPowerful and flexible data layout with banding, callout and small multiples visualizations

SQL SERVER 2012 POWER VIEW
Fully integrated with PowerPivot and the BI Semantic ModelDrive greater insight through smart and powerful queryingZero configuration highlighting and filteringAnimated trending and comparisons

SQL SERVER 2012 POWER VIEW
Interactive Presentation turns pervasive information into persuasive informationDeliver and collaborate through SharePointFull screen presentation mode for interactive boardroom session

DESIGNED FOR NEW WAVE OF INFORMATION WORKERS
VISUAL EMBELLISHMENTS SUPPORT & ENRICH DATA STORY TELLING
1-way to do things
2 clicks to Return on Investment (ROI)
All tasks done in context
Everything happens on the canvas, with the data
Less is more
Choose the right default, by default
Easy for the user, hard on us
Highly performing and efficient
Power View UI Design Principles
Easily change data and
layout with quick clicks
Collaborate with full
interactivity
Share dynamic reports
quickly and easily

MANY POWER VIEW 2012 FEATURES
Model Explorer and Field list for model navigation and data region structure
Motion charts
Interactivity: highlight, cross filter, play axis, popup,
transition animations, bubble trails…
View and data region level filtering with
slicers and filter paneExport to
PowerPoint
Multiple views in a single report
Canvas, ribbon, application infrastructure
Table & Matrixincluding subtotals,
totals, blockingTab Strip and Cover Flow Tiles for data navigation
Data region conversions
SharePoint integration (launch from doc lib,
manage, preview, Power Pivot gallery)
Common chart types, chart titles, legend, axes,
configure chart, chart series
Small multiples layout
Presentation mode with interactivity
Filter pane supports lists, measure slider, calendar, and
advanced mode
Sorting
Graceful recovery from model changes
Drag and Drop to Canvas
Measures as Non Measures
Non Measures as Measures
Textboxes with rich text formatting
Show All
Embedded image support
Automatic Grouping improvements

demo
Power View


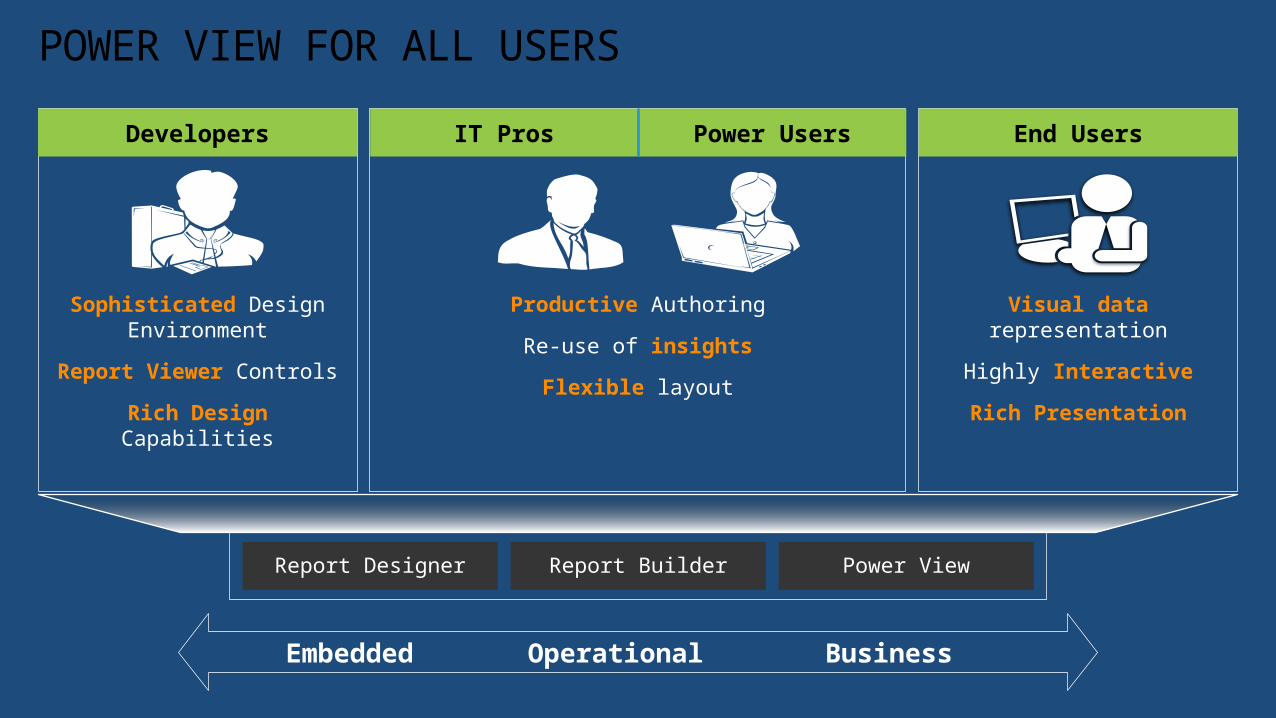
Sophisticated Design Environment
Report Viewer Controls
Rich Design Capabilities
Productive Authoring
Re-use of insights
Flexible layout
Visual data representation
Highly Interactive
Rich Presentation
POWER VIEW FOR ALL USERS
Embedded Operational Business
Report Designer Report Builder Power View
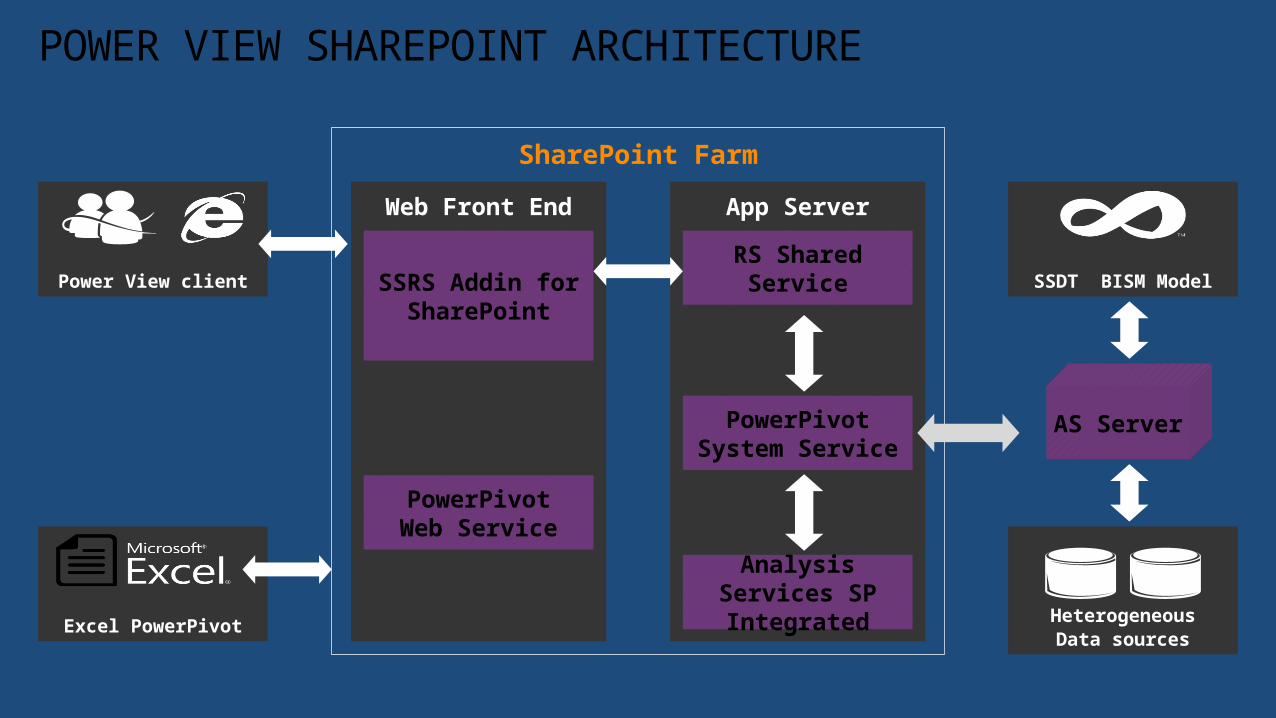
POWER VIEW SHAREPOINT ARCHITECTURE
SharePoint Farm
Web Front End App Server
HeterogeneousData sources
SSDT BISM ModelPower View client
Excel PowerPivot
Part 2
Revealing the Magic

Power Pivot and the BI Semantic Model
Image URLsDefault Field ListSort ByNumber FormattingRelationships

The Value of DAX
Count & Distinct Count
Sum Min & Max Average
Included in Power View by Default
Addition and Subtraction
Ratios
Time Intelligence Rank Inventory
Calculations
Standard Deviation &
Variance
Text Functions
Define Your Own
Context
Power View with DAX
Power View with DAX

demo
DAX and the BI Semantic Model (BISM)

Key Takeaways
Power View is a new Reporting Services offeringPower View is an interactive, ad hoc, query and visualization experience.Power View enables you to go from static to interactive presentationsTo help your users get the most out of Power View you need:
an understanding of Power Pivot, BI Semantic Model settings, andDAX
Power View is fun because it’s smart, simple and flexible.
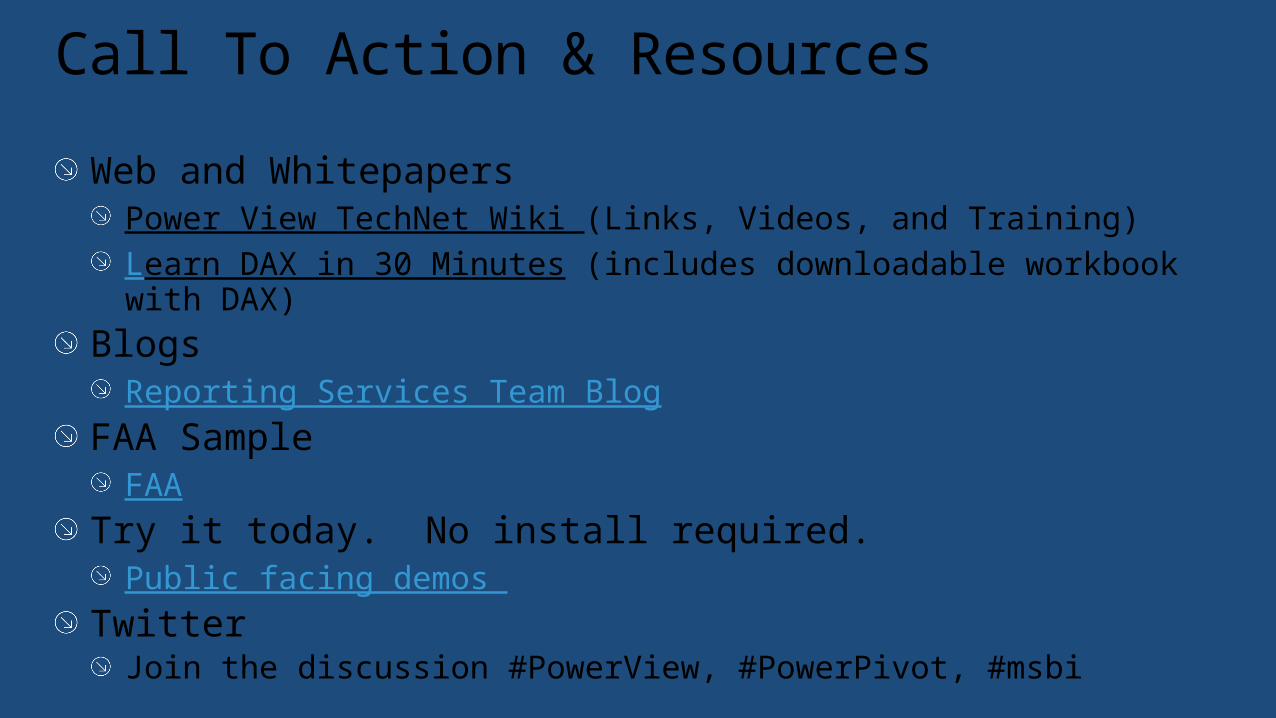
Call To Action & Resources
Web and WhitepapersPower View TechNet Wiki (Links, Videos, and Training)Learn DAX in 30 Minutes (includes downloadable workbook with DAX)
BlogsReporting Services Team Blog
FAA SampleFAA
Try it today. No install required.Public facing demos
TwitterJoin the discussion #PowerView, #PowerPivot, #msbi

Sean Boon
blogs.msdn.com/seanboon
@seanboon

Track Resources
@sqlserver@TechEd_europe
#msTechEd
mvaMicrosoft Virtual Academy
SQL Server 2012 Eval Copy
Get Certified!
Hands-On Labs

Resources
Connect. Share. Discuss.
http://europe.msteched.com
Learning
Microsoft Certification & Training Resources
www.microsoft.com/learning
TechNet
Resources for IT Professionals
http://microsoft.com/technet
Resources for Developers
http://microsoft.com/msdn

Evaluations
http://europe.msteched.com/sessions
Submit your evals online

© 2012 Microsoft Corporation. All rights reserved. Microsoft, Windows, Windows Vista and other product names are or may be registered trademarks and/or trademarks in the U.S. and/or other countries.The information herein is for informational purposes only and represents the current view of Microsoft Corporation as of the date of this presentation. Because Microsoft must respond to changing market conditions, it should not be interpreted to
be a commitment on the part of Microsoft, and Microsoft cannot guarantee the accuracy of any information provided after the date of this presentation. MICROSOFT MAKES NO WARRANTIES, EXPRESS, IMPLIED OR STATUTORY, AS TO THE INFORMATION IN THIS
PRESENTATION.