23
Building the future Stine Bosse – CEO UBS - Stockholm 2 September 2010 Presentation can be downloaded at Tryg.com

Building the future
Stine Bosse – CEO UBS - Stockholm
2 September 2010
Presentation can bedownloaded at Tryg.com
2
Disclaimer
Certain statements in this presentation are based on the beliefs of our management as well as assumptions made by
and information currently available to the management. Forward-looking statements (other than statements of
historical fact) regarding our future results of operations, financial condition, cash flows, business strategy, plans and
future objectives can generally be identified by terminology such as “targets”, “believes”, “expects”, “aims”, “intends”,
“plans”, “seeks”, “will”, “may”, ”anticipates”, “continues” or similar expressions.
A number of different factors may cause the actual performance to deviate significantly from the forward-looking
statements in this presentation including but not limited to general economic developments, changes in the
competitive environment, developments in the financial markets, extraordinary events such as natural disasters or
terrorist attacks, changes in legislation or case law and reinsurance.
We urge you to read our annual report available on tryg.com for a discussion of some of the factors that could affect
our future performance and the industry in which we operate.
Should one or more of these risks or uncertainties materialise or should any underlying assumptions prove to be
incorrect, our actual financial condition or results of operations could materially differ from that described herein as
anticipated, believed, estimated or expected.
We are not under any duty to update any of the forward-looking statements or to conform such statements to actual
results, except as may be required by law.
3
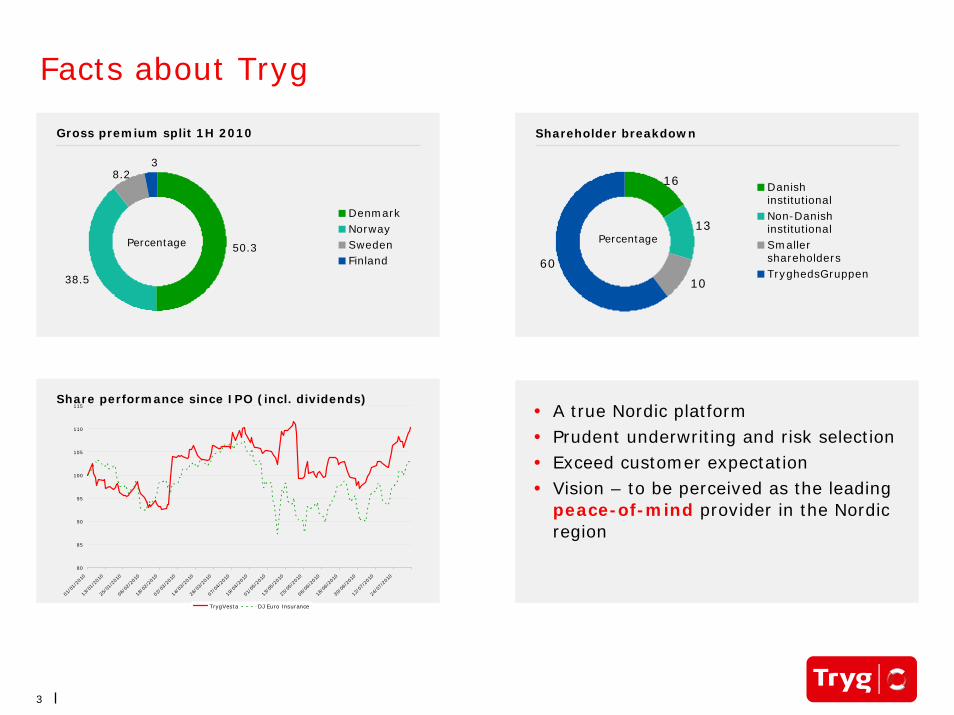
Share performance since IPO (incl. dividends)
Shareholder breakdown
Facts about Tryg
• A true Nordic platform • Prudent underwriting and risk selection • Exceed customer expectation • Vision – to be perceived as the leading
peace-of-mind provider in the Nordic region
Gross premium split 1H 2010
38.2
38.5
50.3
DenmarkNorwaySwedenFinland
Percentage
16
13
10
60
Danishinstitutional Non-DanishinstitutionalSmallershareholdersTryghedsGruppen
Percentage
80
85
90
95
100
105
110
115
01/0
1/20
1013
/01/
2010
25/0
1/20
1006
/02/
2010
18/0
2/20
1002
/03/
2010
14/0
3/20
1026
/03/
2010
07/0
4/20
1019
/04/
2010
01/0
5/20
1013
/05/
2010
25/0
5/20
1006
/06/
2010
18/0
6/20
1030
/06/
2010
12/0
7/20
1024
/07/
2010
TrygVesta DJ Euro Insurance

4
Competitive position
19.6
26.8
5
10.513.8
20.8
3.5
TrygAlm. BrandIfOtherAlkaCodanTopdanmark 14.2
10
29.1
18.2
28.5 TrygGjensidigeSparebank1OtherIf
17.5
29.4
14.216.92.6
19.4
ModernaFolksamLänsforsäkringarOtherIfCodan
25.3
2.323.4
18.6
10.6
19.8
TrygTapiolaFenniaOtherIfPohjola
Norway
NOK 39.2bn/EUR 4.6bn
Finland
EUR 3.4bn
Percentage
Percentage
Denmark
DKK 43.9bn/EUR 5.9bn
Percentage
Sweden
SEK 57.3bn/EUR 5.6bn
Percentage
5
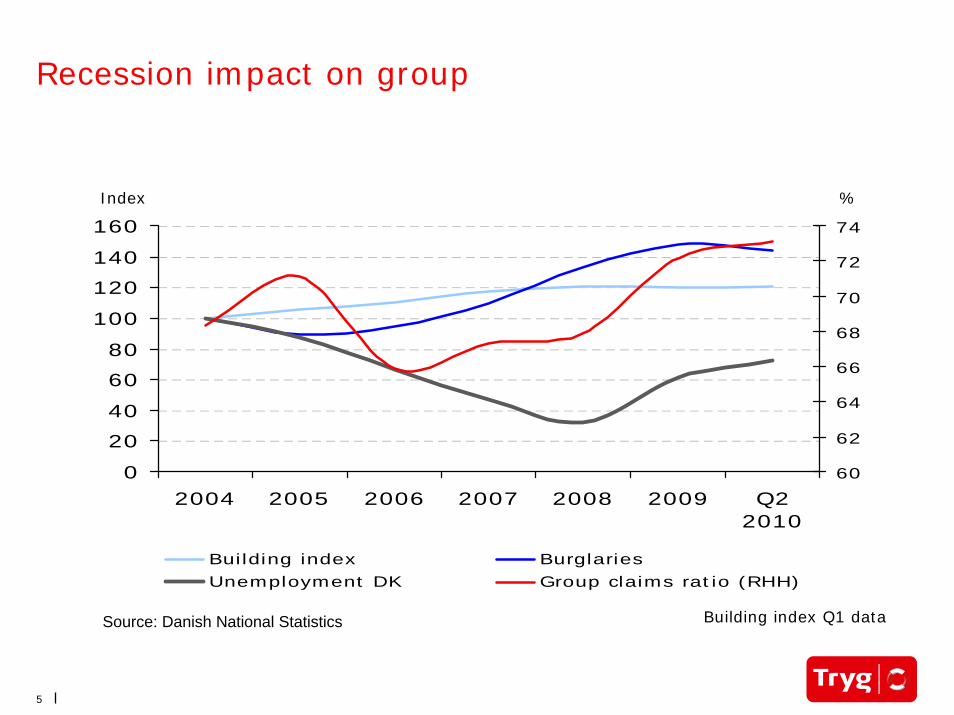
Recession impact on group
0
20
40
60
80
100
120
140
160
2004 2005 2006 2007 2008 2009 Q22010
60
62
64
66
68
70
72
74
Building index Burglaries Unemployment DK Group claims ratio (RHH)
Index %
Building index Q1 dataSource: Danish National Statistics
6
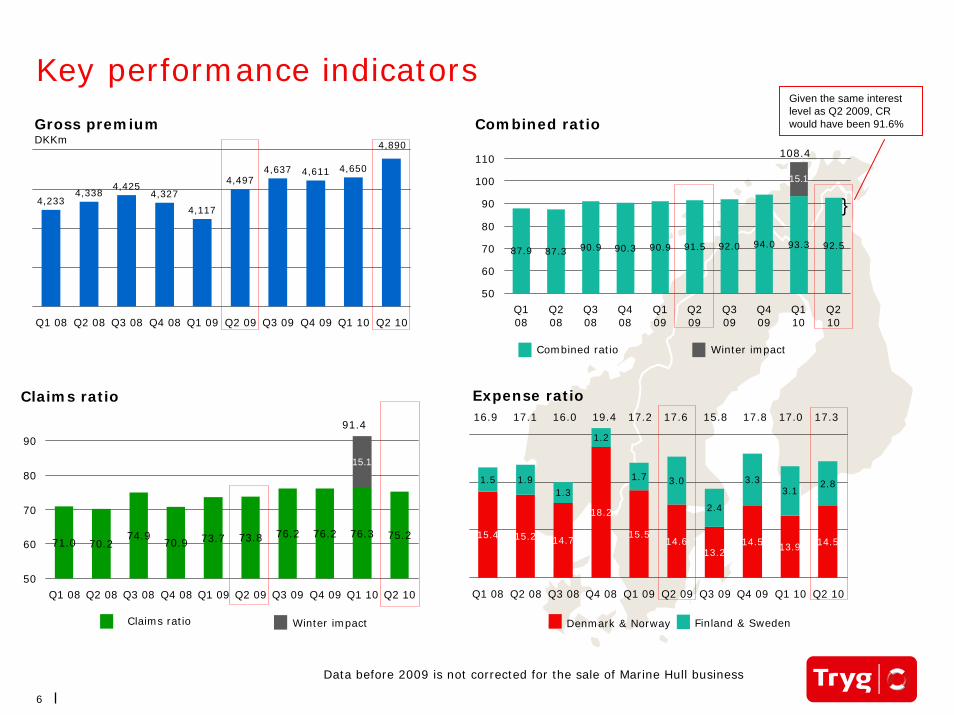
Claims ratio
71.0 70.274.9
70.9 73.7 73.8 76.2 76.2 76.3 75.2
15.1
50
60
70
80
90
Q1 08 Q2 08 Q3 08 Q4 08 Q1 09 Q2 09 Q3 09 Q4 09 Q1 10 Q2 10
Combined ratio
87.9 87.3 90.9 90.3 90.9 91.5 92.0 94.0 93.3 92.5
15.1
50
60
70
80
90
100
110
Q108
Q208
Q308
Q408
Q109
Q209
Q309
Q409
Q110
Q210
Key performance indicators
Gross premiumDKKm
4,2334,338
4,4254,327
4,117
4,4974,637 4,611 4,650
4,890
Q1 08 Q2 08 Q3 08 Q4 08 Q1 09 Q2 09 Q3 09 Q4 09 Q1 10 Q2 10
Expense ratio
15.2 14.7
18.2
15.514.6
13.214.5 13.9 14.5
15.4
1.5 1.91.3
1.2
3.0
2.4
3.3 2.81.7
3.1
Q1 08 Q2 08 Q3 08 Q4 08 Q1 09 Q2 09 Q3 09 Q4 09 Q1 10 Q2 10
16.9 17.1 16.0 19.4 17.2 17.6 15.8 17.8 17.0 17.3
Denmark & Norway Finland & Sweden
108.4
Winter impactCombined ratio
91.4
Winter impactClaims ratio
Data before 2009 is not corrected for the sale of Marine Hull business
}
Given the same interestlevel as Q2 2009, CR would have been 91.6%
7
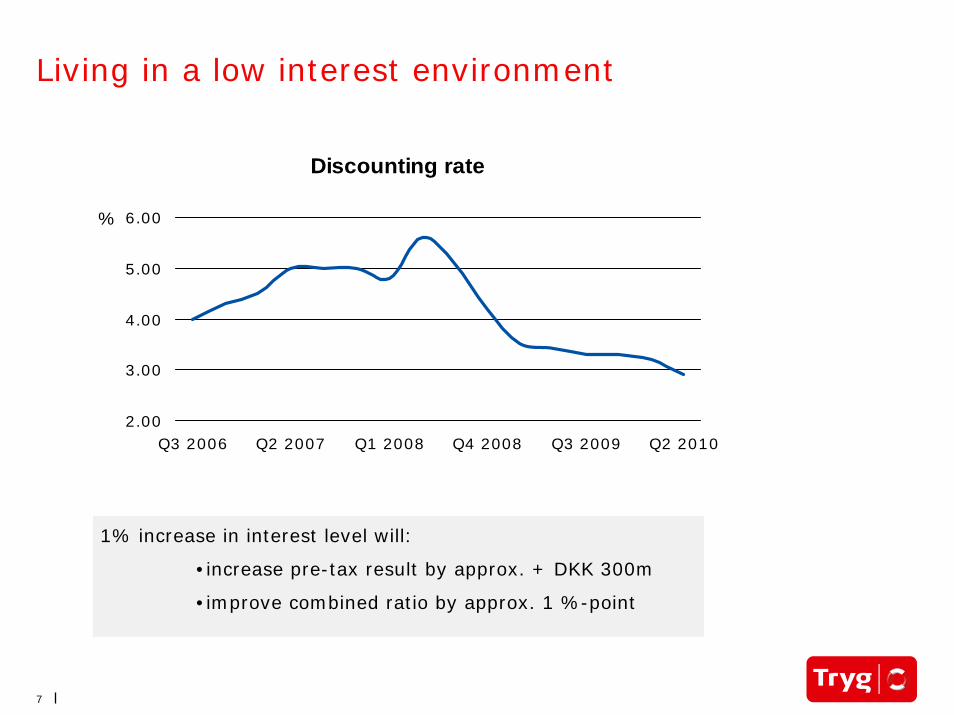
Living in a low interest environment
Discounting rate
2.00
3.00
4.00
5.00
6.00
Q3 2006 Q2 2007 Q1 2008 Q4 2008 Q3 2009 Q2 2010
%
1% increase in interest level will:
•increase pre-tax result by approx. + DKK 300m
•improve combined ratio by approx. 1 %-point

8
50
60
70
80
90
Q106
Q206
Q306
Q406
Q107
Q207
Q307
Q407
Q108
Q208
Q308
Q408
Q109
Q209
Q309
Q409
Q110
Q210
Gross claims ratio Underlying claims ratio
Claims development
Q2 2009
Q2 2010
72.7 73.1
-4.8
-0.1
3.6
2.8
74.7
-5.0
-1.4
4.0
3.7
74.0
H1 2009
H1 2010
Gross claims ratio
71.2 80.8
Large claims -3.1 -3.9
Weather claims -0.8 -8.0
Run-off 4.3 3.9
Interest rate 4.0 3.4
Underlying claims ratio
75.6 76.1
*Data before 2009 is not corrected for the sale of Marine Hull business.
*

9
2002 2003 2004 2005 2006 2007 2008 2009
-1,000
-500
0
500
1,000
1,500
2,000
2,500
3,000
3,500
4,000
2002 2003 2004 2005 2006 2007 2008 2009
Investment (Gross)
Insurance result
Net result before tax
Strong insurance operations are keyCrisis
Management
Cost
EfficiencyOptimising
Innovation
Growth
Innovation
Growth
Customer
add-onsPrice
increasesPrice
increases

10
Repricing and timing
Average prices in Denmark
3,000
3,500
4,000
4,500
5,000
Q1 05
Q2 05
Q3 05
Q4 05
Q1 06
Q2 06
Q3 06
Q4 06
Q1 07
Q2 07
Q3 07
Q4 07
Q1 08
Q2 08
Q3 08
Q4 08
Q1 09
Q2 09
Q3 09
Q4 09
Q1 10
Q2 10
Average prices in Norway
3,000
3,500
4,000
4,500
5,000
Q1 05
Q2 05
Q3 05
Q4 05
Q1 06
Q2 06
Q3 06
Q4 06
Q1 07
Q2 07
Q3 07
Q4 07
Q1 08
Q2 08
Q3 08
Q4 08
Q1 09
Q2 09
Q3 09
Q4 09
Q1 10
Q2 10
Annual impact from price increases
2010 2011 2012
Before DKK ~900m DKK ~700m DKK ~300m
Next wave DKK ~300m DKK ~300m

11
Building margin
Combined ratio
80
85
90
95
100
105
110
2000 2001 2002 2003 2004 2004* 2005 2006 2007 2008 2009 Q12010
Q22010
2011 2012
• 2002-2004 substantial premium increases of DKK 2.1bn implemented. Reduced combined ratio from 107 to 94
• 2009-2012 premium increases of ~ DKK 2.5bn will improve combined ratio in the coming years
Extraordinary
winterPrice increases
Price increases
*IFRS from 2004. Previous years are Danish GAAP
Data before 2009 is not corrected for the sale of Marine Hull business

12
-134 -141-165,00
-200
-150
-100
-50
0
50
100
150
2007 2008 2009 E2010 E-2011 E-2012
Profitability focus in Sweden and Finland
Changed focus is expected to improve result by DKK 250m from 2007–E 2012
Corresponding to +10% of 2008 technical result of TrygVesta Group
ROE is expected to be positively impacted by approx. 3%
CR approaching 95
DKKmGross premiumsDKKm Result
1.553
634
358
-
500
1.000
1.500
2.000
2.500
3.000
3.500
2007 2008 2009 E2010 E-2011 E-2012
0%
20%
40%
60%
80%
100%
120%
140%
160%
2007 2008 2009 E2010 E-2011 E-2012
Claims ratio Ceeded business Expense ratio

13
Unemployment rate
Opportunities in our new markets
38% 39% 35%48%
19% 18% 23%16%
22% 22% 13%16%
21% 22% 29% 20%
0%
25%
50%
75%
100%
Inhabitants Households Summer houses Cars
Sweden Norway Denmark Finland
The market place
0.0%
2.0%
4.0%
6.0%
8.0%
10.0%
12.0%
2007 2008 2009 2010E 2011E
Denmark Norway Sweden Finland Euro-area
14
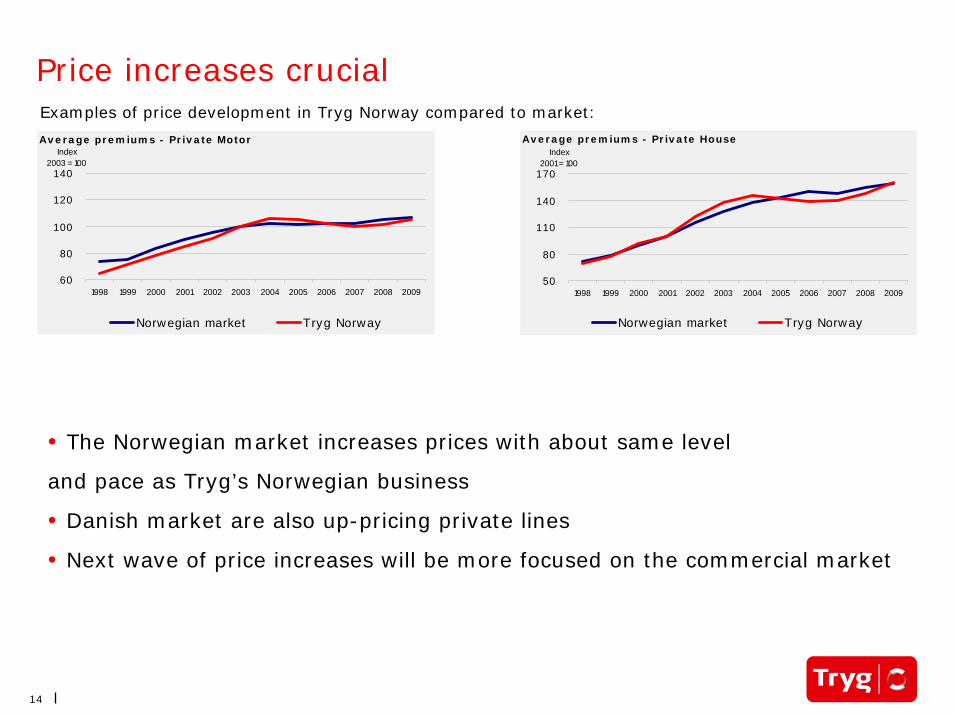
Price increases crucial
Average premiums - Private Motor
60
80
100
120
140
1998 1999 2000 2001 2002 2003 2004 2005 2006 2007 2008 2009
Norwegian market Tryg Norway
Index2003 = 100
• The Norwegian market increases prices with about same level
and pace as Tryg’s Norwegian business
• Danish market are also up-pricing private lines
• Next wave of price increases will be more focused on the commercial market
Average premiums - Private House
50
80
110
140
170
1998 1999 2000 2001 2002 2003 2004 2005 2006 2007 2008 2009
Norwegian market Tryg Norway
Index2001 = 100
Examples of price development in Tryg Norway compared to market:

15
Premium increase in Commercial
• Successful re-pricing of agricultureof 15% fulfilled during 2009-2010
• Premium increases in Commercial Property insurances of 10-15% accelerated to start October 2010
• Re-pricing of Commercial will continue until profitability is re-established
• Focus on cost reduction in distribution, claims procurement and training of sales force
Cost ratio in business linesQ2 2010
15.5
25.7
13.9
Private Commercial Corporate
16
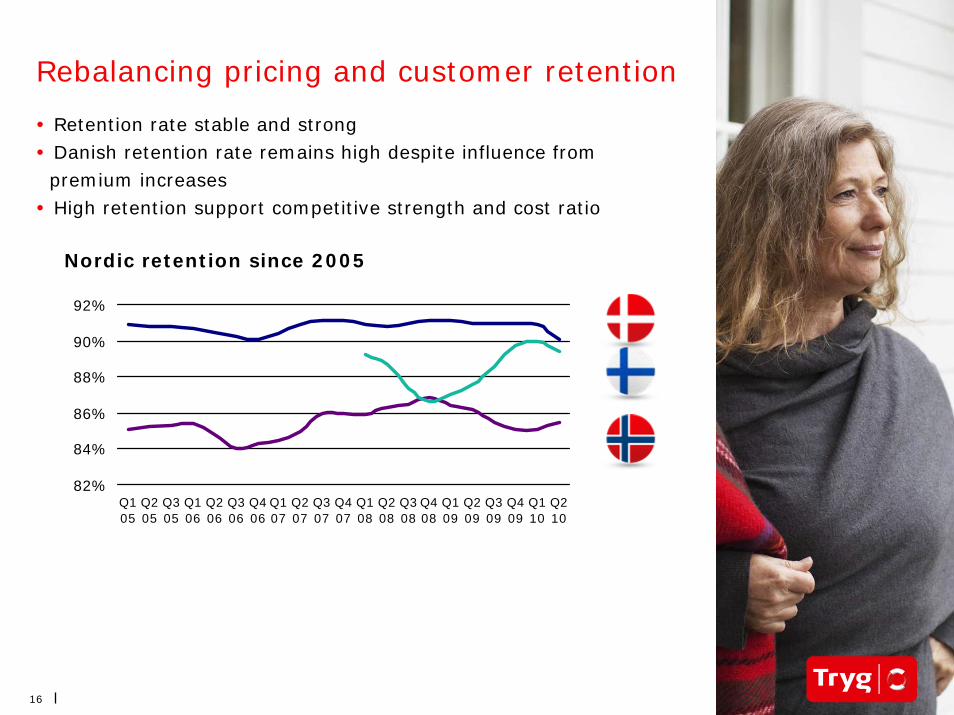
Rebalancing pricing and customer retention
• Retention rate stable and strong• Danish retention rate remains high despite influence from
premium increases• High retention support competitive strength and cost ratio
Nordic retention since 2005
82%
84%
86%
88%
90%
92%
Q105
Q205
Q305
Q106
Q206
Q306
Q406
Q107
Q207
Q307
Q407
Q108
Q208
Q308
Q408
Q109
Q209
Q309
Q409
Q110
Q210

17
Expense ratio
Breakdown of Group expense ratio
16.6 16.0 15.4 15.814.2
14.9 14.3
0.40.8
1.31.5
2.72.5
2.9
2005 2006 2007 2008 2009 1H 09 1H 10
17.0 16.8 16.7 17.3 16.9 17.4 17.2
Denmark & Norway Finland & Sweden
Continued focus on expenses drives expense ratio downwards by
• streamlining the distribution platform
• digital and paperless process handling
• in-house rotation reduces need for external hiring
• investments in branding and processes by new IT systems
Number of employees reduced by 127 or 3% in DK/NO since Q2 2009
Expense ratio
16.616.2
15.5
16.4
15.915.616.0
50
60.464.5
45.8
26.130.1
34.6
2005 2006 2007 2008 2009 1H 09 1H 10
Denmark & Norway Finland & Sweden
Data before 2009 is not corrected for the sale of Marine Hull business.
18
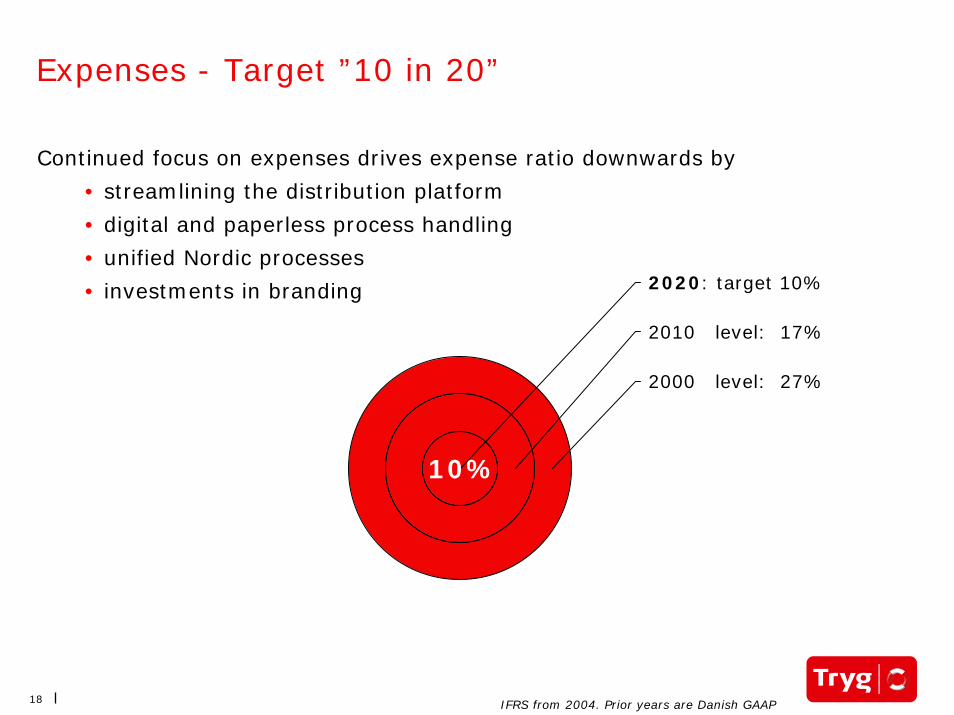
Expenses - Target ”10 in 20”
Continued focus on expenses drives expense ratio downwards by
• streamlining the distribution platform
• digital and paperless process handling
• unified Nordic processes
• investments in branding
2000 level: 27%
2010 level: 17%
2020: target 10%
10%
IFRS from 2004. Prior years are Danish GAAP

19
New proces revolution….
From the customers’ point of view From the employees’ point of view
SM
S
My-page

20
Outlook and capitalisation
20 2. september 2010

21
Outlook 2010
Assumptions: Run-off expected at DKK 0, large claims at DKK 500-600m and weather claims at DKK 200-300
DKKm Actual 2009
Outlook 2010 February
Outlook 2010 May
Outlook 2010 August
Discouting rate 3.6% 3.2% 2.9%
Premium growth in local currency (%) 4.7 3-4 3-4 3-4
Technical result 1,200-1,600 300-700 400-800
Investment result, net 200-300 300-400 100-200
Pre-tax profit 1,400-1,800 600-1,000 600-1,000
Effective tax rate approx. 25% approx. 25% Approx. 27%
Combined ratio before run-off
Before winter
95.9 93-95 97-99
94-96
96-98
93-95
Return assumption p.a. in investment portfolio
Equity 7.0%Bonds 2.3%Real estate 6.0%

22
Capitalisation
6,000
7,000
8,000
9,000
10,000
11,000
12,000
2006
Q1 0
7Q2
07
Q3 0
7
2007
bef
ore
payo
ut
2007
afte
r pay
out
Q1 0
8Q2
08
Q3 0
8
2008
bef
ore
payo
ut
2008
afte
r pay
out
Q1 0
9Q2
09
Q3 0
9
2009
bef
ore
payo
ut
2009
afte
r pay
out
Q1 2
010
(*)
Q1 2
010
Q2 2
010
(*)
Q2 2
010
Capital requirement Buffer (5%) Surplus capital
DKKm
(*) Includes share buy back program based on 2009 earnings, which began on 16 April 2010.
23
Questions?
23 2. september 2010
Lars MøllerInvestor Relations Manager
+45 22 66 66 [email protected]
Ole SøebergInvestor Relations director
+45 40 30 00 [email protected]
Investor relations contacts


