CONTENTS: CONTENTS: CONTENTS: CONTENTS: - STATISTICAL REVIEW - STATISTICAL REVIEW - STATISTICAL REVIEW - STATISTICAL REVIEW - EXPLANATORY NOTES TO THE TABLES - EXPLANATORY NOTES TO THE TABLES - EXPLANATORY NOTES TO THE TABLES - EXPLANATORY NOTES TO THE TABLES - MANAGEMENT OF THE NATIONAL - MANAGEMENT OF THE NATIONAL - MANAGEMENT OF THE NATIONAL - MANAGEMENT OF THE NATIONAL BANK OF YUGOSLAVIA BANK OF YUGOSLAVIA BANK OF YUGOSLAVIA BANK OF YUGOSLAVIA * EDITOR EDITOR EDITOR EDITOR Jovan Jovan Jovan Jovan Petrovi} Petrovi} Petrovi} Petrovi} * EDITORIAL BOARD EDITORIAL BOARD EDITORIAL BOARD EDITORIAL BOARD Du{an Du{an Du{an Du{an Veli~kovi} Veli~kovi} Veli~kovi} Veli~kovi} Olga Olga Olga Olga Ga Ga Ga Ga}e{a }e{a }e{a }e{a Mira Mira Mira Mira Eri} Eri} Eri} Eri} Milica Milica Milica Milica Stojni} Stojni} Stojni} Stojni} Predrag Predrag Predrag Predrag Tomkovi} Tomkovi} Tomkovi} Tomkovi} * TECHNICAL EDITOR TECHNICAL EDITOR TECHNICAL EDITOR TECHNICAL EDITOR Gordana Gordana Gordana Gordana Ljeskovac Ljeskovac Ljeskovac Ljeskovac * * * * COMPUTER PROCESSING COMPUTER PROCESSING COMPUTER PROCESSING COMPUTER PROCESSING OF TABLES AND GRAPHS OF TABLES AND GRAPHS OF TABLES AND GRAPHS OF TABLES AND GRAPHS Smiljana Smiljana Smiljana Smiljana Bogosavljevi} Bogosavljevi} Bogosavljevi} Bogosavljevi} * * * * Issued by the National Bank Issued by the National Bank Issued by the National Bank Issued by the National Bank of Yugoslavia - Belgrade, of Yugoslavia - Belgrade, of Yugoslavia - Belgrade, of Yugoslavia - Belgrade, Bulevar Bulevar Bulevar Bulevar revolucije 15 revolucije 15 revolucije 15 revolucije 15 Telephone: 3248-841 Telephone: 3248-841 Telephone: 3248-841 Telephone: 3248-841 ISSN ISSN ISSN ISSN YU 0350- 4484 YU 0350- 4484 YU 0350- 4484 YU 0350- 4484 NATIONAL BANK NATIONAL BANK NATIONAL BANK NATIONAL BANK OF YUGOSLAVIA OF YUGOSLAVIA OF YUGOSLAVIA OF YUGOSLAVIA QUARTERLY QUARTERLY QUARTERLY QUARTERLY BULLETIN BULLETIN BULLETIN BULLETIN VOL. VOL. VOL. VOL. XXI - No. 3 XXI - No. 3 XXI - No. 3 XXI - No. 3 • SEPTEMBER 2000 SEPTEMBER 2000 SEPTEMBER 2000 SEPTEMBER 2000
Transcript
CONTENTS:CONTENTS:CONTENTS:CONTENTS:- STATISTICAL REVIEW- STATISTICAL REVIEW- STATISTICAL REVIEW- STATISTICAL REVIEW- EXPLANATORY NOTES TO THE TABLES- EXPLANATORY NOTES TO THE TABLES- EXPLANATORY NOTES TO THE TABLES- EXPLANATORY NOTES TO THE TABLES- MANAGEMENT OF THE NATIONAL- MANAGEMENT OF THE NATIONAL- MANAGEMENT OF THE NATIONAL- MANAGEMENT OF THE NATIONAL BANK OF YUGOSLAVIA BANK OF YUGOSLAVIA BANK OF YUGOSLAVIA BANK OF YUGOSLAVIA
****
EDITOREDITOREDITOREDITORJovan Jovan Jovan Jovan Petrovi}Petrovi}Petrovi}Petrovi}
****
EDITORIAL BOARDEDITORIAL BOARDEDITORIAL BOARDEDITORIAL BOARDDu{an Du{an Du{an Du{an Veli~kovi}Veli~kovi}Veli~kovi}Veli~kovi}Olga Olga Olga Olga GaGaGaGa}e{a}e{a}e{a}e{aMira Mira Mira Mira Eri}Eri}Eri}Eri}Milica Milica Milica Milica Stojni}Stojni}Stojni}Stojni}Predrag Predrag Predrag Predrag Tomkovi}Tomkovi}Tomkovi}Tomkovi}
COMPUTER PROCESSINGCOMPUTER PROCESSINGCOMPUTER PROCESSINGCOMPUTER PROCESSINGOF TABLES AND GRAPHSOF TABLES AND GRAPHSOF TABLES AND GRAPHSOF TABLES AND GRAPHSSmiljana Smiljana Smiljana Smiljana Bogosavljevi}Bogosavljevi}Bogosavljevi}Bogosavljevi}
* * * *
Issued by the National BankIssued by the National BankIssued by the National BankIssued by the National Bankof Yugoslavia - Belgrade,of Yugoslavia - Belgrade,of Yugoslavia - Belgrade,of Yugoslavia - Belgrade,Bulevar Bulevar Bulevar Bulevar revolucije 15revolucije 15revolucije 15revolucije 15Telephone: 3248-841Telephone: 3248-841Telephone: 3248-841Telephone: 3248-841
1) The July 1992 denomination was made by dropping one zero.2) In billions of dinars.3) The October 1993 denomination was made by dropping six zeros.4) In terms of new dinars.5) The index numbers above 100 and below 100 imply appreciation and depreciation, respectively. 6) With effect from November 26, 1995, the dinar devalued in terms of the Deutschemark by 69.7%.7) With effect from April 1, 1998, the dinar devaluation vis-a-vis the Deutschemark amounted to 45%.
55
Year Month Average End of month1996 January 3.44 3.50
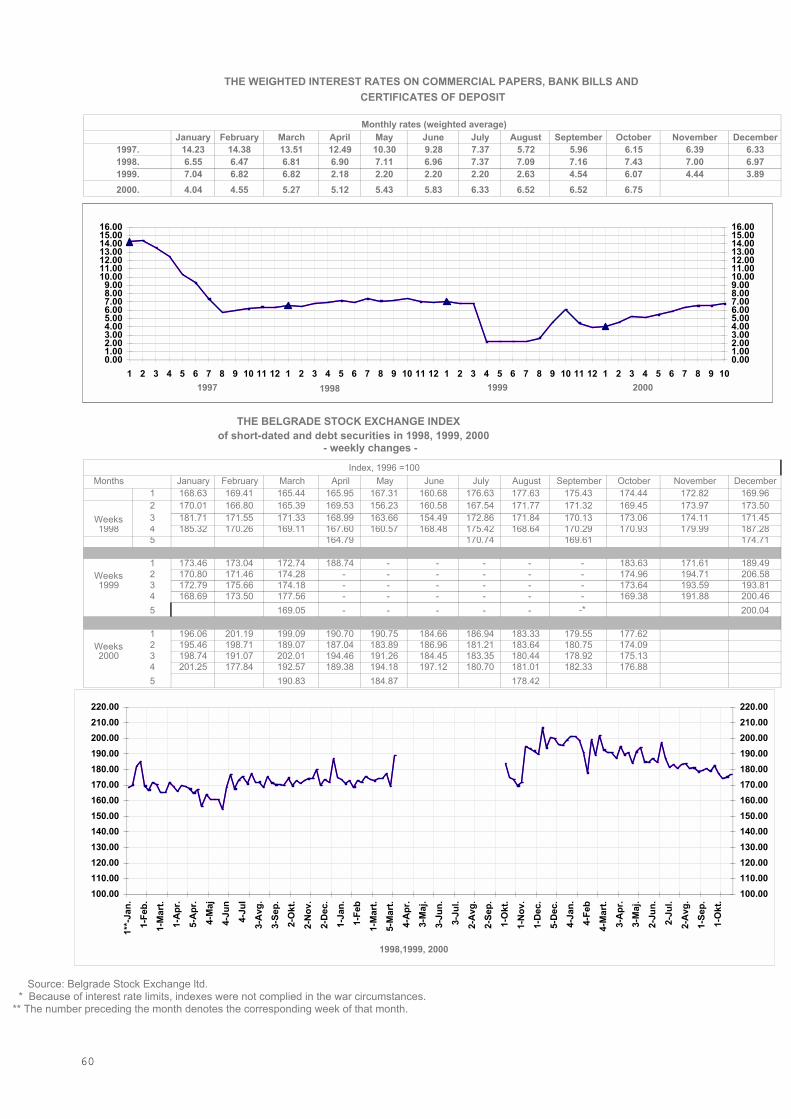
Source: Belgrade Stock Exchange ltd. * Because of interest rate limits, indexes were not complied in the war circumstances.** The number preceding the month denotes the corresponding week of that month.
THE WEIGHTED INTEREST RATES ON COMMERCIAL PAPERS, BANK BILLS AND CERTIFICATES OF DEPOSIT
The balance sheet figures are classified according to the types of claims and liabilities,monetary characteristics, maturities, the type of (domestic or foreign) currency, and the territorialdistribution. Short-term claims and liabilities are with maturities of less than one year, whereas long-termclaims and liabilities are with maturities of over one year.
The foreign currency-denominated claims and liabilities are stated at the appropriatemiddle closing exchange rate. Banks are grouped according to their seats of business, irrespective of theterritorial distribution of their business units.
The tables following the balance sheets of financial organizations give an additionalclassification of figures by institutional sectors, where the corresponding figures are available. Theinstitutional sectors are considered to be the groups of economic agents with similar economic structures,activities and decision-making motives. These are the following sectors: economic organizations,government, financial organizations, non-economic organizations, individuals (households) and non-residents.
Time series cover the end-of-year positions for the 1989-98 period. Monthly data areincluded from August 1994 onwards.
It is to be noted that the economic data of time series, which are provided as differentnominal sums, are not comparable.
The new chart of accounts for banks and other financial organizations took effect fromDecember 1998. Therefore, the time series for the previous period were revised in order to get comparabledata.
IFOs imply international financial organizations.
Tables 1 and 1A: BALANCE SHEET OF ALL BANKS AND OTHERTables 1 and 1A: BALANCE SHEET OF ALL BANKS AND OTHERTables 1 and 1A: BALANCE SHEET OF ALL BANKS AND OTHERTables 1 and 1A: BALANCE SHEET OF ALL BANKS AND OTHER
Gold and foreign exchange (col. 3) comprises gold, foreign currencies and cheques,regular and special foreign exchange checking accounts, as well as short-term deposits in foreign banks.
External claims in foreign currency (col. 4) includes foreign exchange accounts inbilateral currencies and other short-term external claims in foreign currency.
Foreign currency claims at home (col. 5) includes claims arising from short-term creditsat home, claims for interest and charges, and other claims in foreign currency.
Credits to customers (col. 6) includes short-term credits to customers, short-term creditoutstandings and value adjustments of credits, as well as credits for offsetting the debit balances in giroaccounts of customers.
Investment in securities (col. 7) includes commercial papers, bills of exchange eligiblefor rediscount, other discounted bills of exchange, registered bonds and bank bills, and other securitieswith maturities of less than one year.
64
Claims for interest and charges (col. 8) comprises bank claims for interest and charges indinars.
Other claims (col. 9) includes various claims in course of settlement, accrued income andexpenses, and exchange rate differentials, funds in suspense accounts and other claims.
External claims in foreign currency (col. 11) includes external claims arising from long-term credits, investment in securities and other long-term external claims in foreign currency.
Foreign currency claims at home (col. 12) comprises claims arising from long-termcredits to domestic customers, as well as other long-term claims in foreign currency.
Credits to customers (col. 13) comprises long-term credits to customers earmarked forinvestment, fixed and working assets, house-building and infrastructure, and other long-term credits.
Investment in securities (col. 14) includes all claims arising from long-dated securities ofall institutional sectors.
Other bank investments (col. 15) includes equity capital and redemption of securitiesowned.
Quota payments to international financial organizations (col. 16) includes totalborrowings from the National Bank of Yugoslavia by the government for the membership fees ininternational financial organizations.
Fixed assets and other investment (col. 17) includes fixed capital investment in banks,natural resources, buildings, stocks and other operating and non-operating assets.
External liabilities in foreign currencies (col. 3) includes regular checking accounts inbilateral currencies, liabilities for external debts, non-resident short-term time deposits and other short-termexternal liabilities in foreign currencies.
Foreign currency-denominated liabilities to domestic customers (col. 4) comprisesdemand deposits, short-term time deposits (foreign exchange accounts) and other short-term liabilities inforeign currencies.
Currency in circulation (col. 5) includes bank notes and coins held by the public and cashbalances of enterprises.
Deposit money (col. 6) includes balances on legal entity accounts from which payments
are directly and promptly made (giro accounts, checking accounts and other balances earmarked for
payments).
Other demand deposits (col. 7) comprises money at call which may not be directly used
for current payments, but which is readily convertible into money.
Time deposits (col. 8) includes deposits made for up to one year, not including deposits
held by international financial organizations.
Liabilities for security issues (col. 9 ) includes short-term liabilities of banks and other
financial organizations for securities.
Float (col. 10) comprises cheques and other items in process of collection and various
types of money of account between banks, payments and clearing houses, etc.
65
Net income (col. 11) comprises operating income, finance receivables, excess and other
revenues net of tangible and intangible costs, cost of finance, as well as of other expenses and losses.
Other liabilities (col. 12) comprises liabilities for interest and charges, various liabilities
in course of settlement, deferred income and expenses, and exchange rate differentials as well as other
External liabilities in foreign currencies (col. 14) includes external liabilities for long-
term foreign currency credits and long-term foreign currency time deposits of non-residents with Yugoslav
banks.
Foreign currency-denominated liabilities to domestic customers (col. 15) comprises long-
term foreign currency deposits of households.
Time deposits (col. 16) includes deposits at banks made for over one year.
Other liabilities (col. 17) includes long-term provisions for maintenance and bad and
doubtful debts, as well as other long-term liabilities.
Fixed capital (col. 19) comprises fixed capital, capital stocks of residents and non-
residents, undistributed profits from previous years and other reserves.
Other (col. 20) includes all other types of non-operating assets.
Tables 2 and 2A: BALANCE SHEET OF ALL BANKSTables 2 and 2A: BALANCE SHEET OF ALL BANKSTables 2 and 2A: BALANCE SHEET OF ALL BANKSTables 2 and 2A: BALANCE SHEET OF ALL BANKS
This is the consolidated balance sheet of the NBY and banks, including the Postal Savings
Bank. It brings together the operations between the NBY and commercial banks, as well as the operating
accounts of inter-bank transactions, but not the operations with other financial organizations. It covers all
monetary institutions and therefore provides information on changes in the money supply and other
monetary aggregates, as well as information on the flows of money supply formation.
The content of individual columns is similar to that of Table 1.
Tables 3 and 3A: BALANCE SHEET OF THE NATIONALTables 3 and 3A: BALANCE SHEET OF THE NATIONALTables 3 and 3A: BALANCE SHEET OF THE NATIONALTables 3 and 3A: BALANCE SHEET OF THE NATIONAL
BANK OF YUGOSLAVIABANK OF YUGOSLAVIABANK OF YUGOSLAVIABANK OF YUGOSLAVIA
This is the financial report of the NBY as the central bank of the country. It shows all theassets and liabilities of the NBY related to its operations. The balance sheet provides the figures for reservemoney issue, or the flows of reserve money creation and withdrawal, on the assets side, and the forms ofreserve money holdings, on the liability side.
The following claims and liabilities are included under the columns:
66
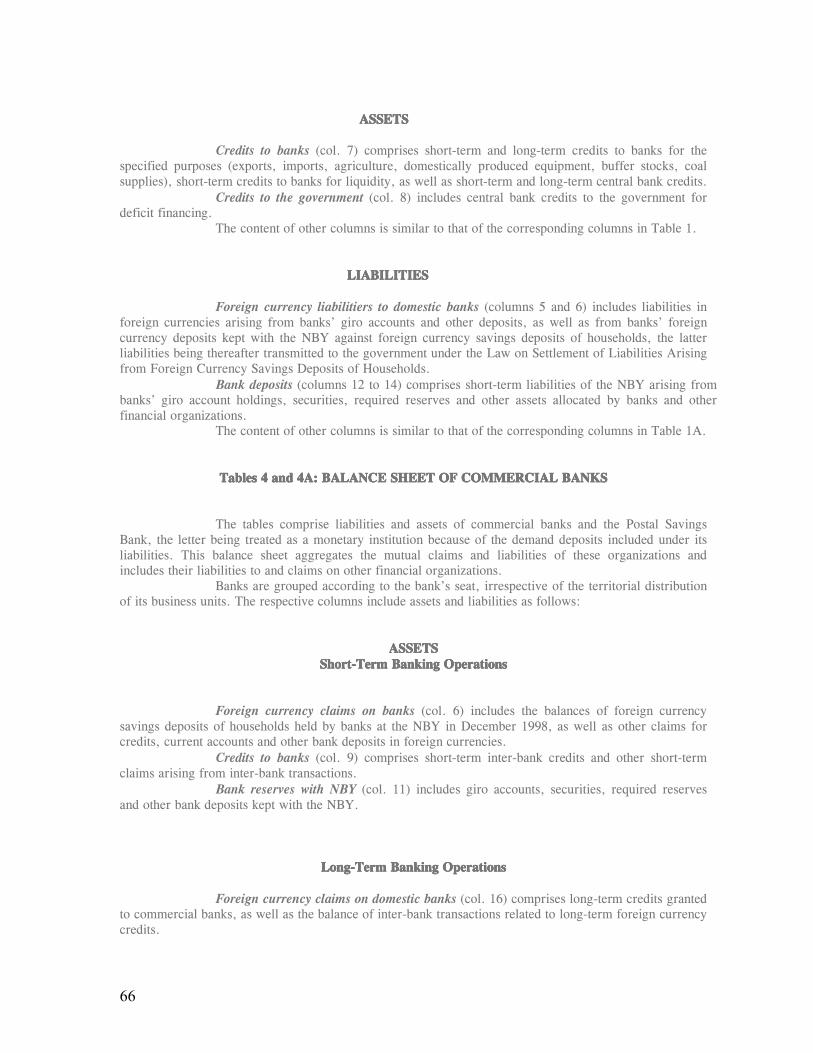
ASSETSASSETSASSETSASSETS
Credits to banks (col. 7) comprises short-term and long-term credits to banks for thespecified purposes (exports, imports, agriculture, domestically produced equipment, buffer stocks, coalsupplies), short-term credits to banks for liquidity, as well as short-term and long-term central bank credits.
Credits to the government (col. 8) includes central bank credits to the government fordeficit financing.
The content of other columns is similar to that of the corresponding columns in Table 1.
LIABILITIESLIABILITIESLIABILITIESLIABILITIES
Foreign currency liabilitiers to domestic banks (columns 5 and 6) includes liabilities inforeign currencies arising from banks� giro accounts and other deposits, as well as from banks� foreigncurrency deposits kept with the NBY against foreign currency savings deposits of households, the latterliabilities being thereafter transmitted to the government under the Law on Settlement of Liabilities Arisingfrom Foreign Currency Savings Deposits of Households.
Bank deposits (columns 12 to 14) comprises short-term liabilities of the NBY arising frombanks� giro account holdings, securities, required reserves and other assets allocated by banks and otherfinancial organizations.
The content of other columns is similar to that of the corresponding columns in Table 1A.
Tables 4 and 4A: BALANCE SHEET OF COMMERCIAL BANKSTables 4 and 4A: BALANCE SHEET OF COMMERCIAL BANKSTables 4 and 4A: BALANCE SHEET OF COMMERCIAL BANKSTables 4 and 4A: BALANCE SHEET OF COMMERCIAL BANKS
The tables comprise liabilities and assets of commercial banks and the Postal SavingsBank, the letter being treated as a monetary institution because of the demand deposits included under itsliabilities. This balance sheet aggregates the mutual claims and liabilities of these organizations andincludes their liabilities to and claims on other financial organizations.
Banks are grouped according to the bank�s seat, irrespective of the territorial distributionof its business units. The respective columns include assets and liabilities as follows:
Foreign currency claims on banks (col. 6) includes the balances of foreign currencysavings deposits of households held by banks at the NBY in December 1998, as well as other claims forcredits, current accounts and other bank deposits in foreign currencies.
Credits to banks (col. 9) comprises short-term inter-bank credits and other short-termclaims arising from inter-bank transactions.
Bank reserves with NBY (col. 11) includes giro accounts, securities, required reservesand other bank deposits kept with the NBY.
Foreign currency claims on domestic banks (col. 16) comprises long-term credits grantedto commercial banks, as well as the balance of inter-bank transactions related to long-term foreign currencycredits.
Foreign currency liabilities to domestic banks (col. 5) comprises liabilities for foreigncurrency credits and deposits arising from inter-bank transactions.
Liabilities to domestic banks (col. 12) includes short-term bank liabilities for central bankcredits and dinar inter-bank lending.
Other liabilities to domestic banks (col. 13) includes liabilities for interest, exchangelosses and other liabilities.
Foreign currency liabilities to domestic banks (col. 17) comprises long-term foreigncurrency liabilities of banks for credits and other liabilities arising from inter-bank transactions.
The content of other columns is similar to that of the table covering the balance sheet ofall banks and other financial organizations.
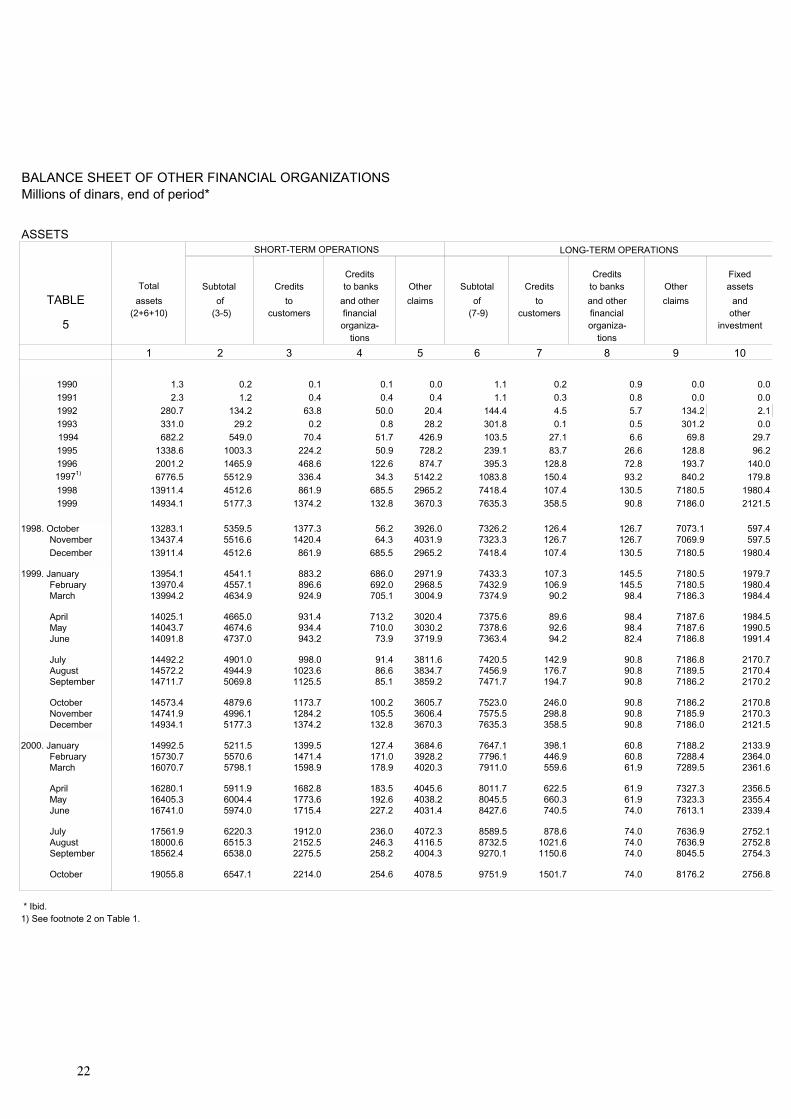
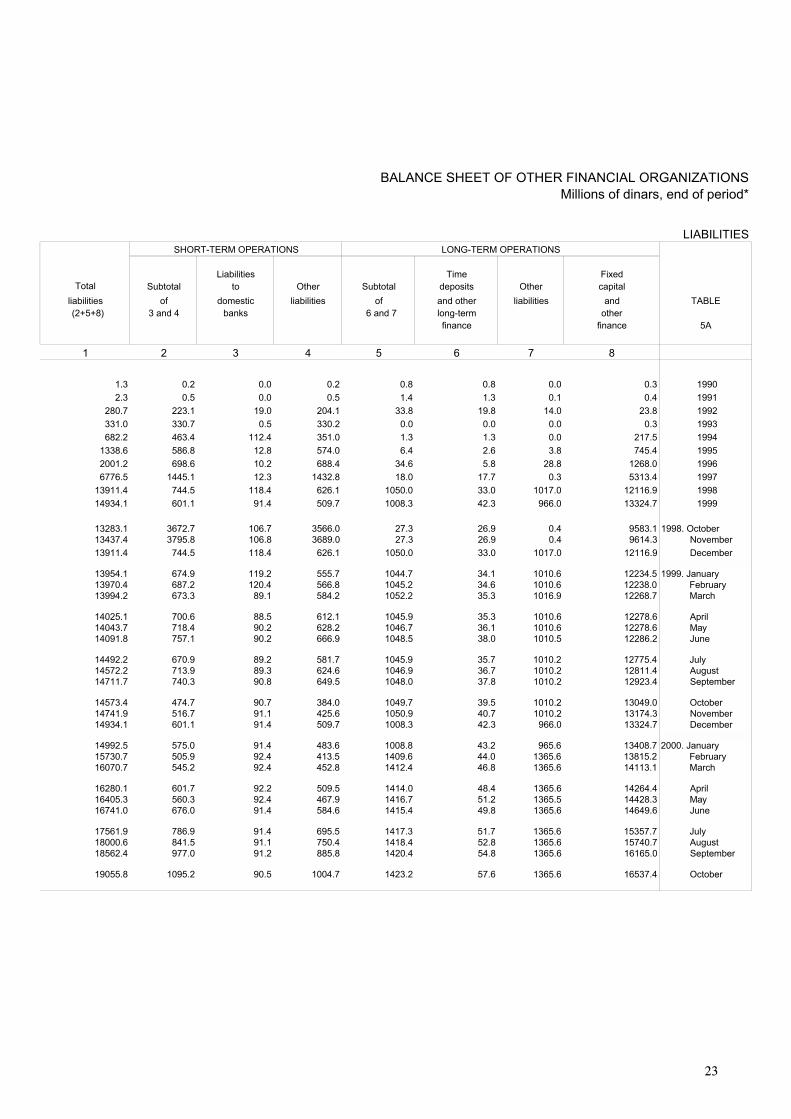
Tables 5 and 5A: BALANCE SHEET OF OTHER FINANCIAL ORGANIZATIONSTables 5 and 5A: BALANCE SHEET OF OTHER FINANCIAL ORGANIZATIONSTables 5 and 5A: BALANCE SHEET OF OTHER FINANCIAL ORGANIZATIONSTables 5 and 5A: BALANCE SHEET OF OTHER FINANCIAL ORGANIZATIONS
This balance sheet comprises assets and liabilities of non-monetary financial organizationshaving no accounts in their liabilities from which withdrawals earmarked for payments may be made ondemand.
Table 6: NATIONAL BANK OF YUGOSLAVIA LENDINGTable 6: NATIONAL BANK OF YUGOSLAVIA LENDINGTable 6: NATIONAL BANK OF YUGOSLAVIA LENDINGTable 6: NATIONAL BANK OF YUGOSLAVIA LENDING
The table gives a detailed purpose-by-purpose breakdown of NBY credits and otherinvestments, the respective totals being shown in Table 3. Detailed information on terms and conditions ofNBY credits and other investments are given in the NBY decisions on measures for the implementation ofmonetary and credit policy.
The table shows in detail investments in the securities purchased from the reserve moneyissue through banks, as well as the securities traded in the securities market.
Table 7: CREDITS AND OTHER BANK INVESTMENTSTable 7: CREDITS AND OTHER BANK INVESTMENTSTable 7: CREDITS AND OTHER BANK INVESTMENTSTable 7: CREDITS AND OTHER BANK INVESTMENTS
The table gives the breakdown of credits and other bank investments by sector andpurpose. The respective totals, broken down by institutional sector and maturity, are shown in the tablecovering the balance sheet of all banks and other financial organizations.
Tables 8 and 8A: DEPOSITS WITH BANKS AND OTHER Tables 8 and 8A: DEPOSITS WITH BANKS AND OTHER Tables 8 and 8A: DEPOSITS WITH BANKS AND OTHER Tables 8 and 8A: DEPOSITS WITH BANKS AND OTHER FINANCIAL ORGANIZATIONS FINANCIAL ORGANIZATIONS FINANCIAL ORGANIZATIONS FINANCIAL ORGANIZATIONS
The table gives the breakdown of deposits kept with banks and other financialorganizations by sector, maturity and type of deposit.
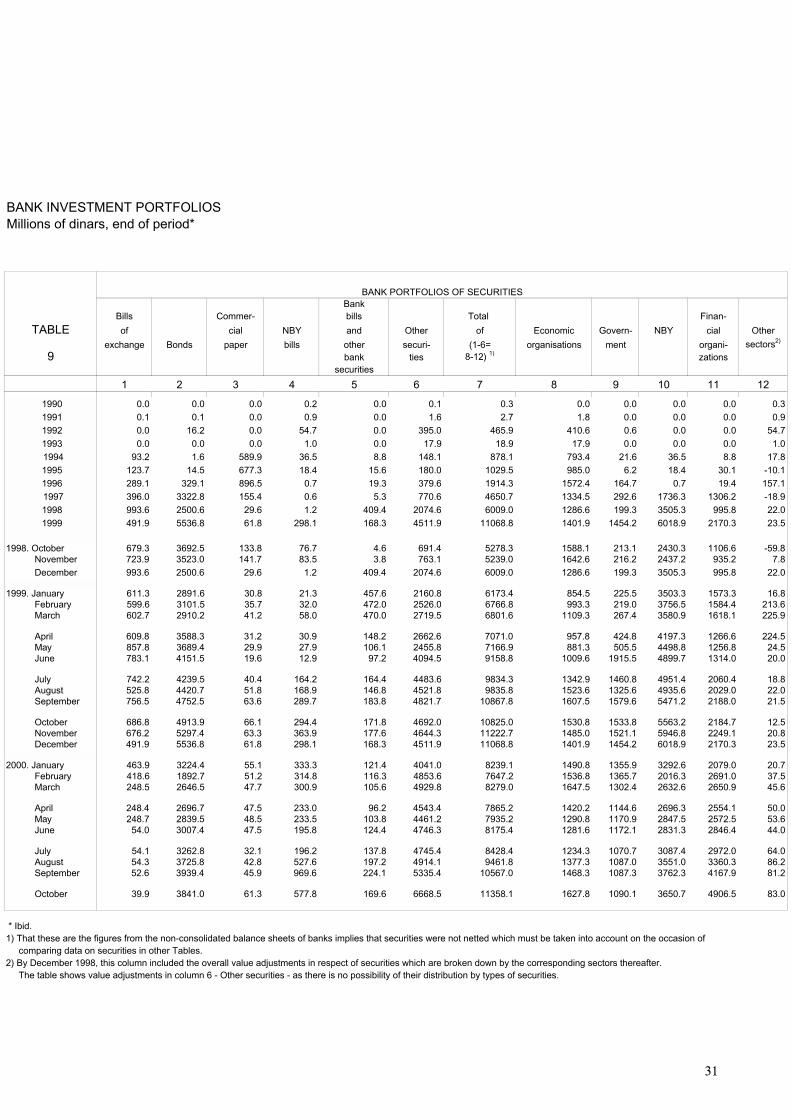
Table 9: BANK INVESTMENT PORTFOLIOSTable 9: BANK INVESTMENT PORTFOLIOSTable 9: BANK INVESTMENT PORTFOLIOSTable 9: BANK INVESTMENT PORTFOLIOS
The table covers all the securities issued or held by organizations conducting theirtransactions through banks or other financial organizations. Securities are classified by type and sector.
68
Bills of exchange (col. 1) comprises discounted bills of exchange (eligible forrediscount), and rediscounted bills of exchange.
Bonds (col. 2) comprises short-dated and long-dated government bonds and other issuesof bonds subscribed from required reserves and giro holdings.
Commercial papers (col. 3) comprises commercial papers issued by legal entities forfinancing the specified purposes, primarily in the field of agricultural production.
NBY bills (col. 4) comprises NBY bills subscribed by banks.
Tables 10 and 10A: FOREIGN CURRENCY CLAIMSTables 10 and 10A: FOREIGN CURRENCY CLAIMSTables 10 and 10A: FOREIGN CURRENCY CLAIMSTables 10 and 10A: FOREIGN CURRENCY CLAIMSAND LIABILITIES OF BANKSAND LIABILITIES OF BANKSAND LIABILITIES OF BANKSAND LIABILITIES OF BANKS
The table covers short-term and long-term foreign currency claims of banks on foreignand domestic customers. It shows short-term and long-term bank liabilities to foreign customers, whereasdeposit liabilities to domestic customers are shown in greater detail.
Table 11: NET DOMESTIC ASSETS OF BANKSTable 11: NET DOMESTIC ASSETS OF BANKSTable 11: NET DOMESTIC ASSETS OF BANKSTable 11: NET DOMESTIC ASSETS OF BANKS
The flows of total net domestic assets formation are shown for the banking system. Theasset side shows total dinar bank credits and foreign currency claims at home, which comprise claims ondomestic customers, including inter-bank claims less other liabilities to domestic customers and inter-bankforeign currency liabilities. Other assets are net of other liabilities and all the asset and liability items, notincluded in other flows shown herein, are comprised. On the liability side, net foreign liabilities of banksare shown in the form of external liabilities arising from the operations of banks and their customers withthe rest of the world. Total deposits comprise the money supply and quasi money (the quasi money is splitinto dinar and foreign currency deposits).
Tables 12-14: MONEY SUPPLY AND OTHER DEPOSITSTables 12-14: MONEY SUPPLY AND OTHER DEPOSITSTables 12-14: MONEY SUPPLY AND OTHER DEPOSITSTables 12-14: MONEY SUPPLY AND OTHER DEPOSITS
The tables show the figures for the narrowly and broadly defined money supply, brokendown by sector.
M1 comprises the balances of giro, current and other account holders maintained on theliability side of banks' balance sheets (deposit money), from which payments are directly made, pluscurrency in circulation.
M2 comprises M1 plus other dinar demand deposits, time deposits (not including thedeposits of international financial organizations kept with the NBY), as well as foreign currency demanddeposits (not including the old foreign currency savings deposits).
M3 comprises M2 plus long-term dinar and foreign currency deposits (not including thespecific foreign currency deposits of banks which turned out to be the pure inter-bank relation but whichhave been included in this aggregate hitherto).
69
Table 15: NET DOMESTIC ASSETS OF THE NATIONALTable 15: NET DOMESTIC ASSETS OF THE NATIONALTable 15: NET DOMESTIC ASSETS OF THE NATIONALTable 15: NET DOMESTIC ASSETS OF THE NATIONALBANK OF YUGOSLAVIABANK OF YUGOSLAVIABANK OF YUGOSLAVIABANK OF YUGOSLAVIA
The table gives information about the flows of reserve money creation and withdrawal. Itshows the figures for central bank credits, foreign exchange transactions with domestic and foreigncustomers, other net assets and net domestic assets of the NBY. The reserve money figures are alsopresented.
Table 16: BANK LIQUIDITYTable 16: BANK LIQUIDITYTable 16: BANK LIQUIDITYTable 16: BANK LIQUIDITY
The table contains data on the primary liquidity of the banking system (banks' giroaccount holdings with the NBY and vault cash) as well as data on the secondary liquidity (credits forliquidity, required reserve withdrawals). The liquidity ratio is calculated as the ratio of the primary bankliquidity (columns 1 and 2) and other short-term sources of bank liquidity which comprise deposit money,other demand deposits, time deposits, short�term liabilities in respect of securities issued, and other short-term liabilities due and payable.
Table 17 contains the lending and borrowing rates of the NBY, on a monthly basis, which
are applied to the calculation of interest on credits, other bank investments, as well as on deposits kept withthe NBY.
Tables 18 and 18A contain the weighted (respectively, by the total amount of grantedcredits and the total amount of outstanding deposits) lending and borrowing rates of banks, calculated onthe basis of the monthly reported data to the NBY by banks.
Tables 19-23: INDIVIDUAL SECTORSTables 19-23: INDIVIDUAL SECTORSTables 19-23: INDIVIDUAL SECTORSTables 19-23: INDIVIDUAL SECTORS' CLAIMS AND LIABILITIES CLAIMS AND LIABILITIES CLAIMS AND LIABILITIES CLAIMS AND LIABILITIES
The claims and liabilities of individual institutional sectors are shown in detail. Theeconomic organizations� claims and liabilities relate to the legal entities performing economic activities andpublic enterprises; the non-economic organizations� claims and liabilities relate to the legal entitiesperforming non-economic activities as well as to the foreign legal entities and non-residents. Table 23shows the claims and liabilities of the federal government, and federal and local authorities. The definitionsof individual claims and liabilities mainly correspond to the notes given in the table of the Balance Sheet ofAll Banks and Other Financial Organizations.
Individual rates of exchange represent the middle rates of foreign currencies in dinarterms as determined in the domestic foreign exchange market at the end of the corresponding period. Thedinar rate of exchange vis-a-vis the pound sterling and US dollar is determined for 1 unit of thesecurrencies, and for 100 units of other currencies.
The change in the nominal effective rate index of the dinar points to the change in thenational currency rate of exchange against the weighted mean of seven foreign currencies: US dollar (43per cent), Deutschemark (30 per cent), Italian lira (9 per cent), Austrian schilling (6 per cent), Swiss franc(5 per cent), French franc (4 per cent) and pound sterling (3 per cent). The magnitude of weights depends
70
on the share of the above mentioned currencies in Yugoslavia's convertible currency receipts on currentaccount transactions over the 1984-86 period.
The change in the real effective rate index of the dinar reflects the change in the nominaleffective rate deflated by the relative differences between the domestic inflation and the weighted foreigninflation. The number of currencies and the magnitude of weights for illustrating the combined foreigninflation are the same as for the calculation of the nominal effective rate of exchange.
Index below 100 points to a depreciation of the (nominal and real) effective rate of thedinar, and index above 100 points to its appreciation.
71
MANAGEMENT OF THE NATIONAL BANK OF YUGOSLAVIMANAGEMENT OF THE NATIONAL BANK OF YUGOSLAVIMANAGEMENT OF THE NATIONAL BANK OF YUGOSLAVIMANAGEMENT OF THE NATIONAL BANK OF YUGOSLAVIAAAA
Governor of the National Bank of YugoslaviaGovernor of the National Bank of YugoslaviaGovernor of the National Bank of YugoslaviaGovernor of the National Bank of Yugoslavia
THE NATIONAL BANK OF YUGOSLAVIA BULLETIN is a reliable source of is a reliable source of is a reliable source of is a reliable source of
monetary and financial statistics presented in time series. It contains the annual data for the last tenmonetary and financial statistics presented in time series. It contains the annual data for the last tenmonetary and financial statistics presented in time series. It contains the annual data for the last tenmonetary and financial statistics presented in time series. It contains the annual data for the last ten
years and the monthly data for the last two years. Some tables give the breakdown of statistics byyears and the monthly data for the last two years. Some tables give the breakdown of statistics byyears and the monthly data for the last two years. Some tables give the breakdown of statistics byyears and the monthly data for the last two years. Some tables give the breakdown of statistics by
republic and province. Explanations for the tables are given at the end of the republic and province. Explanations for the tables are given at the end of the republic and province. Explanations for the tables are given at the end of the republic and province. Explanations for the tables are given at the end of the Bulletin.
The National Bank of Yugoslavia had regularly issued the statistical bulletin fromThe National Bank of Yugoslavia had regularly issued the statistical bulletin fromThe National Bank of Yugoslavia had regularly issued the statistical bulletin fromThe National Bank of Yugoslavia had regularly issued the statistical bulletin from
1972 to 1989, when the respective figures became unavailable. The reissued 1972 to 1989, when the respective figures became unavailable. The reissued 1972 to 1989, when the respective figures became unavailable. The reissued 1972 to 1989, when the respective figures became unavailable. The reissued Bulletin was somewhat was somewhat was somewhat was somewhat
abridged, but the statistical comprehensiveness of it will be subsequently extended onto economicabridged, but the statistical comprehensiveness of it will be subsequently extended onto economicabridged, but the statistical comprehensiveness of it will be subsequently extended onto economicabridged, but the statistical comprehensiveness of it will be subsequently extended onto economic
developments and external economic relations.developments and external economic relations.developments and external economic relations.developments and external economic relations.
�The Rule Book on the List and General Groups of Accounts for Banks and Other �The Rule Book on the List and General Groups of Accounts for Banks and Other �The Rule Book on the List and General Groups of Accounts for Banks and Other �The Rule Book on the List and General Groups of Accounts for Banks and Other
Financial Organizations� and �The Rule Book on the List and General Groups of Accounts for theFinancial Organizations� and �The Rule Book on the List and General Groups of Accounts for theFinancial Organizations� and �The Rule Book on the List and General Groups of Accounts for theFinancial Organizations� and �The Rule Book on the List and General Groups of Accounts for the
National Bank of Yugoslavia�, both based on completely different principles than previously, tookNational Bank of Yugoslavia�, both based on completely different principles than previously, tookNational Bank of Yugoslavia�, both based on completely different principles than previously, tookNational Bank of Yugoslavia�, both based on completely different principles than previously, took
effect from the end of 1998. These charts of accounts called for reentering the book positions of alleffect from the end of 1998. These charts of accounts called for reentering the book positions of alleffect from the end of 1998. These charts of accounts called for reentering the book positions of alleffect from the end of 1998. These charts of accounts called for reentering the book positions of all
accounts in bank accounting. As this tremendous work took some time, there was a period of severalaccounts in bank accounting. As this tremendous work took some time, there was a period of severalaccounts in bank accounting. As this tremendous work took some time, there was a period of severalaccounts in bank accounting. As this tremendous work took some time, there was a period of several
months in which the balance sheet figures were unavailable. This, of course, was the main reason formonths in which the balance sheet figures were unavailable. This, of course, was the main reason formonths in which the balance sheet figures were unavailable. This, of course, was the main reason formonths in which the balance sheet figures were unavailable. This, of course, was the main reason for
which the which the which the which the National Bank of Yugoslavia Bulletin was not temporarily issued. Another, not less was not temporarily issued. Another, not less was not temporarily issued. Another, not less was not temporarily issued. Another, not less
important and serious reason for this, is the war (the NATO aggression against Yugoslavia), whichimportant and serious reason for this, is the war (the NATO aggression against Yugoslavia), whichimportant and serious reason for this, is the war (the NATO aggression against Yugoslavia), whichimportant and serious reason for this, is the war (the NATO aggression against Yugoslavia), which
lasted from March 24 through to June 26, 1999.lasted from March 24 through to June 26, 1999.lasted from March 24 through to June 26, 1999.lasted from March 24 through to June 26, 1999.
SinceSinceSinceSince September 1999, the September 1999, the September 1999, the September 1999, the Bulletin has been issued with revised and strictly has been issued with revised and strictly has been issued with revised and strictly has been issued with revised and strictly
1111 Balance Sheet of All Banks and Other Financial Organizations - ASSETSBalance Sheet of All Banks and Other Financial Organizations - ASSETSBalance Sheet of All Banks and Other Financial Organizations - ASSETSBalance Sheet of All Banks and Other Financial Organizations - ASSETS
1A1A1A1A Balance Sheet of All Banks and OtheBalance Sheet of All Banks and OtheBalance Sheet of All Banks and OtheBalance Sheet of All Banks and Other Financial Organizations - r Financial Organizations - r Financial Organizations - r Financial Organizations - LIABILITIESLIABILITIESLIABILITIESLIABILITIES
2222 Balance Sheet of All Banks - ASSETSBalance Sheet of All Banks - ASSETSBalance Sheet of All Banks - ASSETSBalance Sheet of All Banks - ASSETS
2A2A2A2A Balance Sheet of All Banks - LIABILITIESBalance Sheet of All Banks - LIABILITIESBalance Sheet of All Banks - LIABILITIESBalance Sheet of All Banks - LIABILITIES
3333 Balance Sheet of the National Bank of Yugoslavia - ASSETSBalance Sheet of the National Bank of Yugoslavia - ASSETSBalance Sheet of the National Bank of Yugoslavia - ASSETSBalance Sheet of the National Bank of Yugoslavia - ASSETS
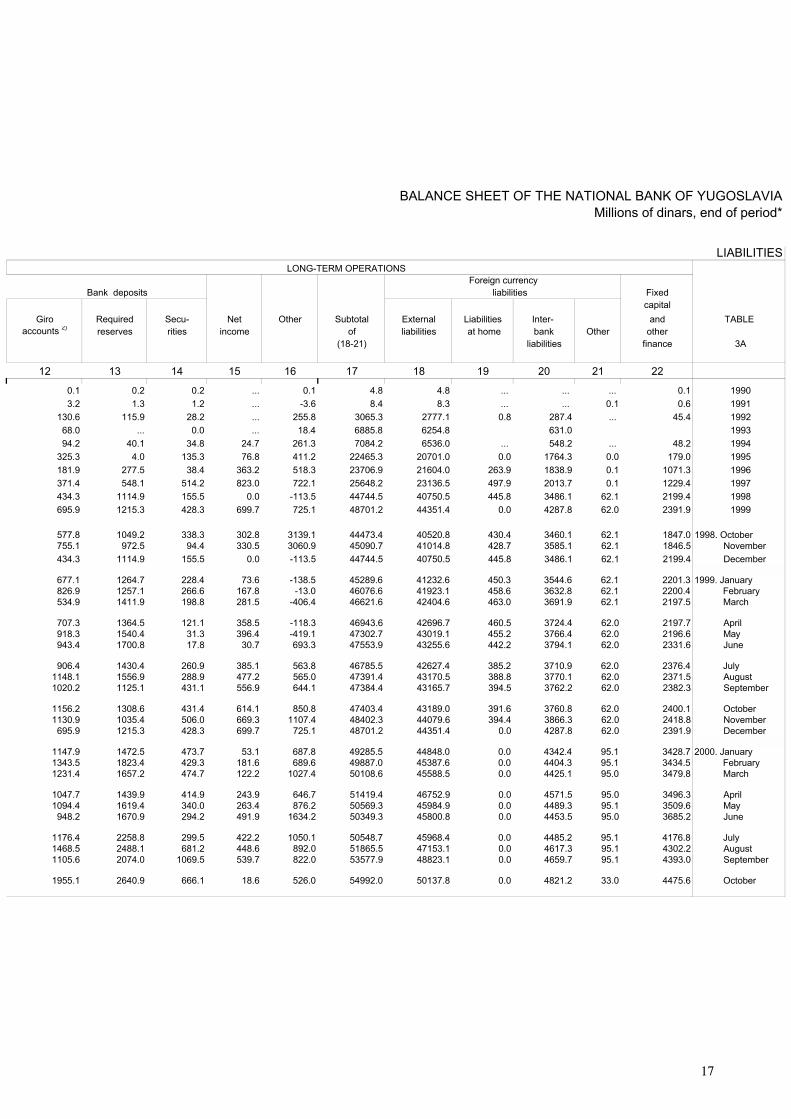
3A3A3A3A Balance Sheet of the National Bank of Yugoslavia - LIABILITIESBalance Sheet of the National Bank of Yugoslavia - LIABILITIESBalance Sheet of the National Bank of Yugoslavia - LIABILITIESBalance Sheet of the National Bank of Yugoslavia - LIABILITIES
4444 BalanBalanBalanBalance Sheet of Commercial Banks - ASSETSce Sheet of Commercial Banks - ASSETSce Sheet of Commercial Banks - ASSETSce Sheet of Commercial Banks - ASSETS
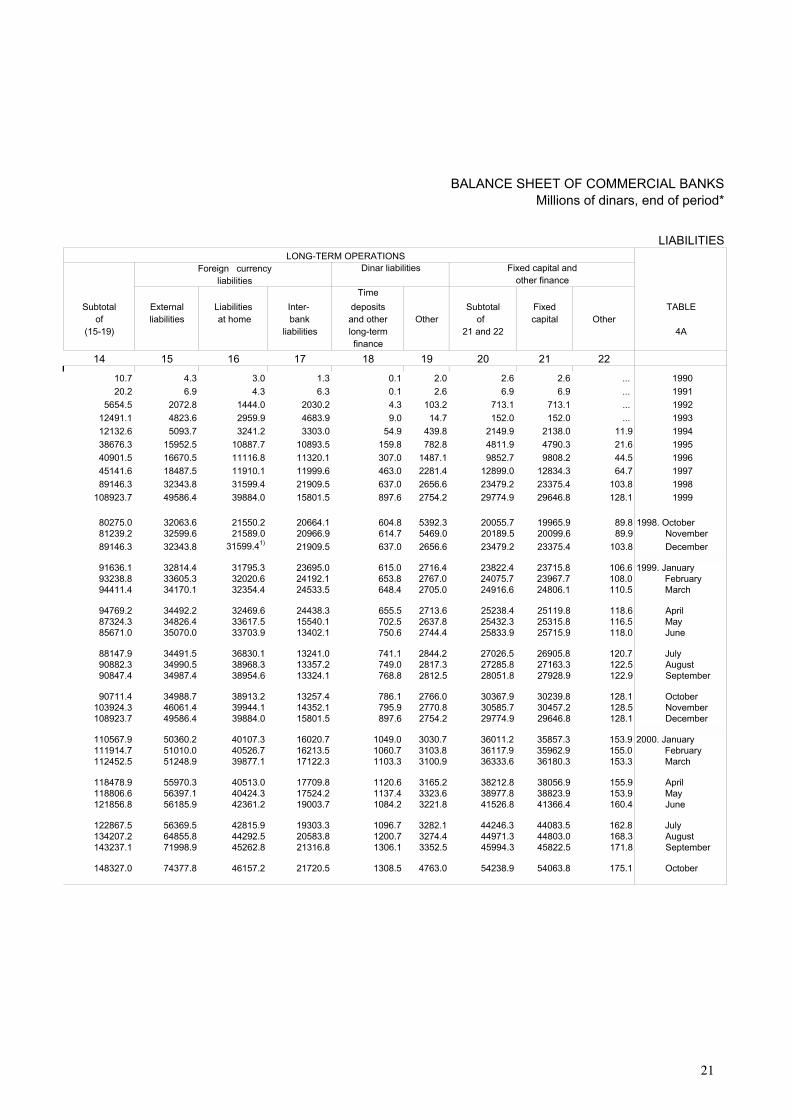
4A Balance Sheet of Commercial Banks - LIABILITIES4A Balance Sheet of Commercial Banks - LIABILITIES4A Balance Sheet of Commercial Banks - LIABILITIES4A Balance Sheet of Commercial Banks - LIABILITIES
5555 Balance Sheet of Other Financial Organizations - ASSETSBalance Sheet of Other Financial Organizations - ASSETSBalance Sheet of Other Financial Organizations - ASSETSBalance Sheet of Other Financial Organizations - ASSETS
5A 5A 5A 5A Balance Sheet of Other Financial Organizations - LIABILITIESBalance Sheet of Other Financial Organizations - LIABILITIESBalance Sheet of Other Financial Organizations - LIABILITIESBalance Sheet of Other Financial Organizations - LIABILITIES
6666 National Bank of Yugoslavia LendingNational Bank of Yugoslavia LendingNational Bank of Yugoslavia LendingNational Bank of Yugoslavia Lending
7 7 7 7 Credits and Other Bank InvestmentsCredits and Other Bank InvestmentsCredits and Other Bank InvestmentsCredits and Other Bank Investments
8888 Deposits with Banks and Other Financial Organizations - Short-Term Deposits with Banks and Other Financial Organizations - Short-Term Deposits with Banks and Other Financial Organizations - Short-Term Deposits with Banks and Other Financial Organizations - Short-Term
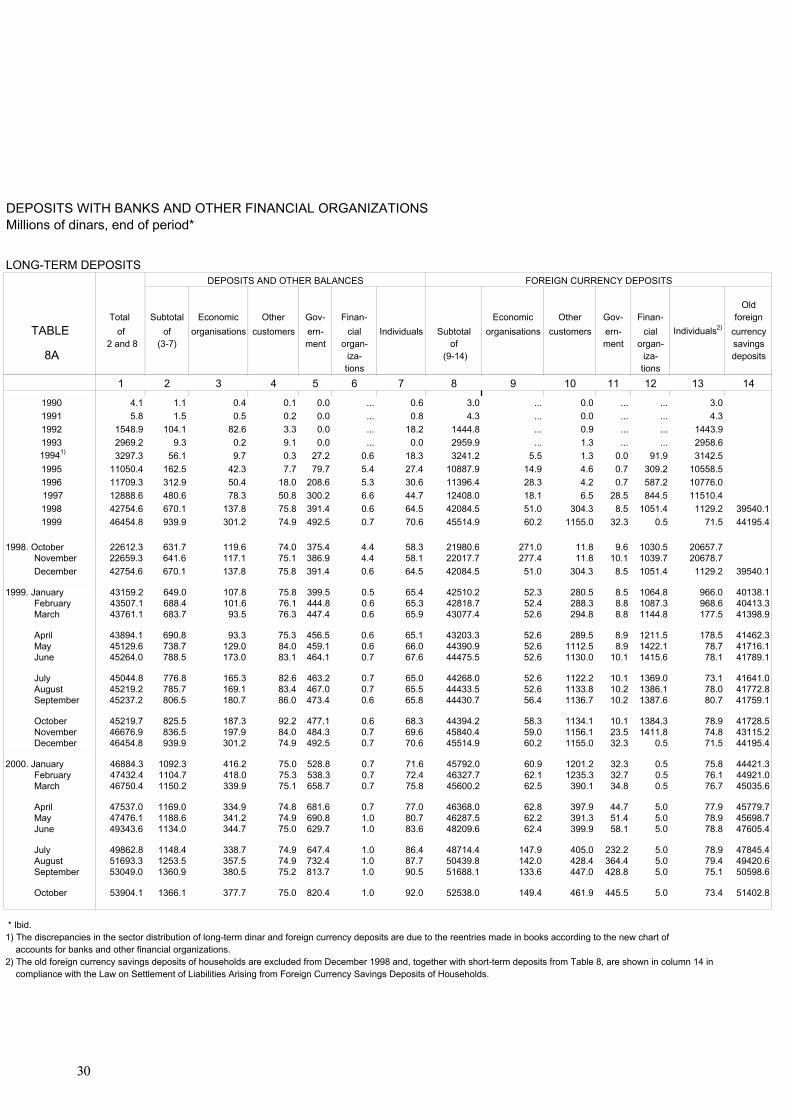
8A8A8A8A Deposits with Banks and Other Financial Organizations - Long-Term Deposits with Banks and Other Financial Organizations - Long-Term Deposits with Banks and Other Financial Organizations - Long-Term Deposits with Banks and Other Financial Organizations - Long-Term
9999 Bank Investment PortfoliosBank Investment PortfoliosBank Investment PortfoliosBank Investment Portfolios
10101010 Foreign Currency Claims and Liabilities ofForeign Currency Claims and Liabilities ofForeign Currency Claims and Liabilities ofForeign Currency Claims and Liabilities of Banks - ASSETS Banks - ASSETS Banks - ASSETS Banks - ASSETS
10A10A10A10A Foreign Currency Claims and Liabilities of Banks - LIABILITIESForeign Currency Claims and Liabilities of Banks - LIABILITIESForeign Currency Claims and Liabilities of Banks - LIABILITIESForeign Currency Claims and Liabilities of Banks - LIABILITIES
11 Net Domestic Assets of Banks11 Net Domestic Assets of Banks11 Net Domestic Assets of Banks11 Net Domestic Assets of Banks
12 12 12 12 Money Supply (M1) by SectorsMoney Supply (M1) by SectorsMoney Supply (M1) by SectorsMoney Supply (M1) by Sectors
13131313 Money Supply and Other Short-Term Deposits (M2) by SectorsMoney Supply and Other Short-Term Deposits (M2) by SectorsMoney Supply and Other Short-Term Deposits (M2) by SectorsMoney Supply and Other Short-Term Deposits (M2) by Sectors
14141414 Total Liquid Assets (M3) by SectorsTotal Liquid Assets (M3) by SectorsTotal Liquid Assets (M3) by SectorsTotal Liquid Assets (M3) by Sectors
15151515 Net Domestic Assets of the National Bank of YugoslaviaNet Domestic Assets of the National Bank of YugoslaviaNet Domestic Assets of the National Bank of YugoslaviaNet Domestic Assets of the National Bank of Yugoslavia
16161616 Bank Liquidity in Dinar TermsBank Liquidity in Dinar TermsBank Liquidity in Dinar TermsBank Liquidity in Dinar Terms
17171717 National Bank of Yugoslavia Rates of InterestNational Bank of Yugoslavia Rates of InterestNational Bank of Yugoslavia Rates of InterestNational Bank of Yugoslavia Rates of Interest
18181818 Weighted Rates of Interest on Bank CreditsWeighted Rates of Interest on Bank CreditsWeighted Rates of Interest on Bank CreditsWeighted Rates of Interest on Bank Credits
18A18A18A18A Weighted Rates of Interest on Bank DepositsWeighted Rates of Interest on Bank DepositsWeighted Rates of Interest on Bank DepositsWeighted Rates of Interest on Bank Deposits
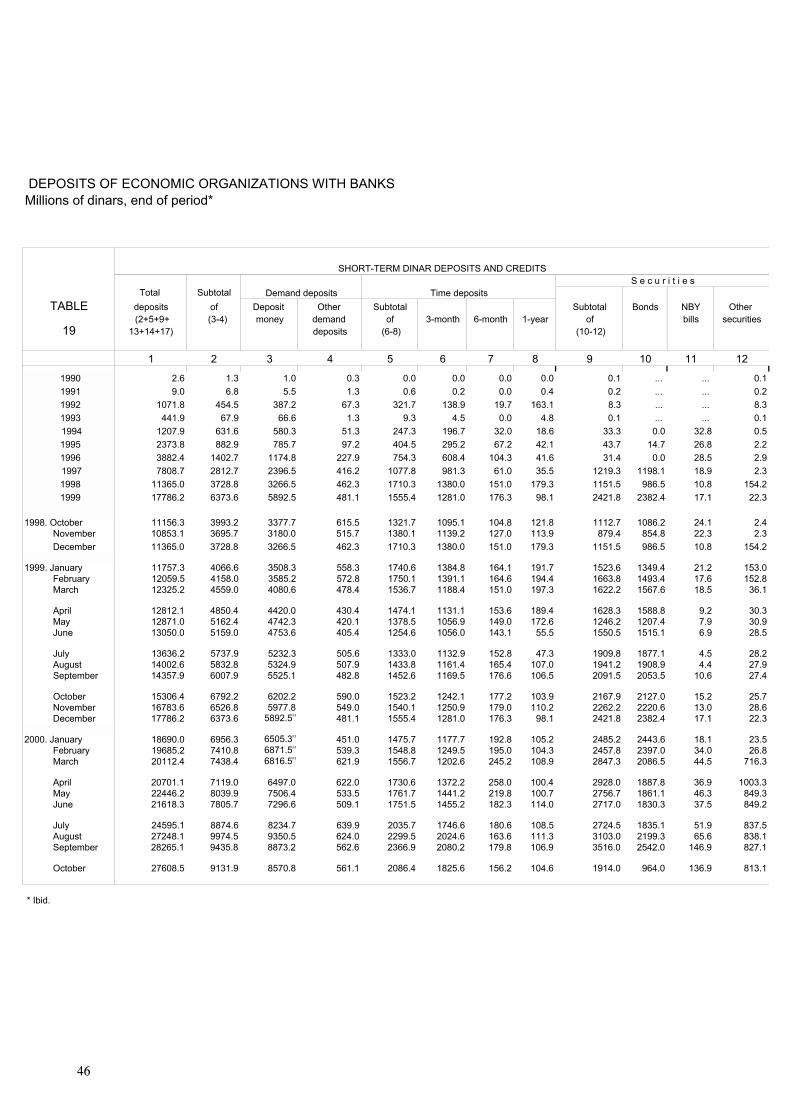
19191919 Deposits of Economic Organizations with Banks and Other Financial OrganizationsDeposits of Economic Organizations with Banks and Other Financial OrganizationsDeposits of Economic Organizations with Banks and Other Financial OrganizationsDeposits of Economic Organizations with Banks and Other Financial Organizations
20202020 Economic Organizations� Borrowings from Banks and Other Financial OrganizationsEconomic Organizations� Borrowings from Banks and Other Financial OrganizationsEconomic Organizations� Borrowings from Banks and Other Financial OrganizationsEconomic Organizations� Borrowings from Banks and Other Financial Organizations
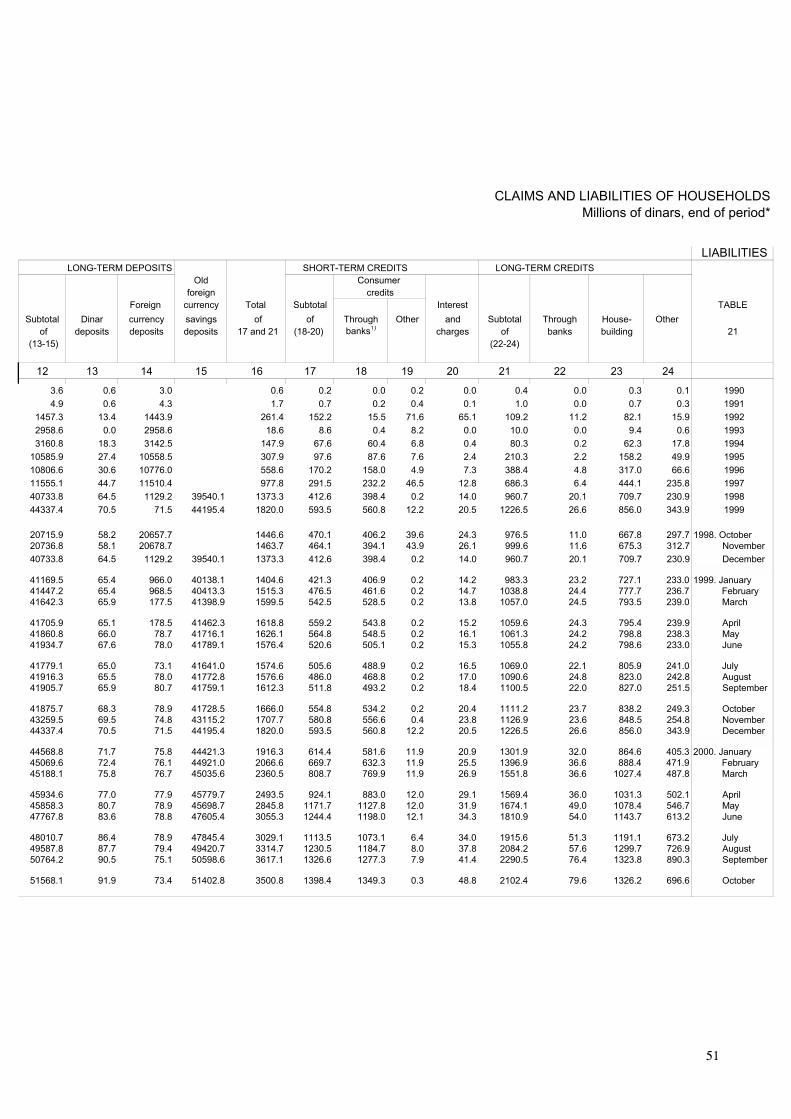
21212121 Claims and Liabilities of HouseholdsClaims and Liabilities of HouseholdsClaims and Liabilities of HouseholdsClaims and Liabilities of Households
22222222 Claims and Liabilities of Other Customers, Financial Intermediaries anClaims and Liabilities of Other Customers, Financial Intermediaries anClaims and Liabilities of Other Customers, Financial Intermediaries anClaims and Liabilities of Other Customers, Financial Intermediaries and Other Legal Entitiesd Other Legal Entitiesd Other Legal Entitiesd Other Legal Entities
23232323 Claims and Liabilities of the GovernmentClaims and Liabilities of the GovernmentClaims and Liabilities of the GovernmentClaims and Liabilities of the Government
The Unofficial Exchange Rate of the Deutschemark, 1996-2000 The Unofficial Exchange Rate of the Deutschemark, 1996-2000 The Unofficial Exchange Rate of the Deutschemark, 1996-2000 The Unofficial Exchange Rate of the Deutschemark, 1996-2000
The Weighted Interest Rates on Commercial Papers, The Weighted Interest Rates on Commercial Papers, The Weighted Interest Rates on Commercial Papers, The Weighted Interest Rates on Commercial Papers,
Bank Bills and Certificates of Deposit Bank Bills and Certificates of Deposit Bank Bills and Certificates of Deposit Bank Bills and Certificates of Deposit
REFERENCE NOTES AND MARKSREFERENCE NOTES AND MARKSREFERENCE NOTES AND MARKSREFERENCE NOTES AND MARKS
The monthly figures are presented in the time series for the 25-month intervals,The monthly figures are presented in the time series for the 25-month intervals,The monthly figures are presented in the time series for the 25-month intervals,The monthly figures are presented in the time series for the 25-month intervals,
while the annual figures are given from 1989 onwards until the ten year time series are formed. Thewhile the annual figures are given from 1989 onwards until the ten year time series are formed. Thewhile the annual figures are given from 1989 onwards until the ten year time series are formed. Thewhile the annual figures are given from 1989 onwards until the ten year time series are formed. The
figures showing the respective positions relate to the end of periods. Some tables end with the figuresfigures showing the respective positions relate to the end of periods. Some tables end with the figuresfigures showing the respective positions relate to the end of periods. Some tables end with the figuresfigures showing the respective positions relate to the end of periods. Some tables end with the figures
for the last end-of-month positions broken down by republic and province. The figures are shown infor the last end-of-month positions broken down by republic and province. The figures are shown infor the last end-of-month positions broken down by republic and province. The figures are shown infor the last end-of-month positions broken down by republic and province. The figures are shown in
millions of dinars with one decimal, unless otherwise indicated. Statistics are usually taken from bankmillions of dinars with one decimal, unless otherwise indicated. Statistics are usually taken from bankmillions of dinars with one decimal, unless otherwise indicated. Statistics are usually taken from bankmillions of dinars with one decimal, unless otherwise indicated. Statistics are usually taken from bank
accounting.accounting.accounting.accounting.
The symbols used in the tables have the following meanings:The symbols used in the tables have the following meanings:The symbols used in the tables have the following meanings:The symbols used in the tables have the following meanings:
- - - - no observationno observationno observationno observation............ not availablenot availablenot availablenot availableoooo figures below 0.05figures below 0.05figures below 0.05figures below 0.05XXXX adjusted dataadjusted dataadjusted dataadjusted data0000 incomplete or provisional dataincomplete or provisional dataincomplete or provisional dataincomplete or provisional data∅∅∅∅ averageaverageaverageaverage1)1)1)1) reference marks reference marks reference marks reference marks inside the tablesinside the tablesinside the tablesinside the tables
BALANCE SHEET OF ALL BANKS AND OTHER FINANCIAL ORGANIZATIONSMillions of dinars, end of period*
ASSETS
Total Subtotal Gold TABLE assets of and External Claims Credits Interest
(2+10+17) (3-9) foreign claims at home to Securities and Other 1 exchange customers charges
October 336221.5 152652.3 34144.3 25822.3 52348.9 24081.9 8023.2 6920.3 1311.4
* Ibid. As a result of the 1993 denomination, accomplished by deleting six zeros, the end-of-1993 positions are shown in quintillions (billion billions) of dinars. With effect from January 1994, the amounts are shown in millions of new dinars. 1) As a result of the application of the new chart of accounts for banks and other financial organizations in October 1994 and making the corresponding reentries in books, other claims and other liabilities were substantially reduced, thus reducing the total assets and liabilities of banks and other financial organizations as well.2) Including the foreign currency credits of the Fund for Development of Serbia since July 1997.3) The book positions were reentered in the accounts prescribed by the new chart of accounts for banks and other financial organizations based on the balance sheet principle (the Official Gazette of the FRY, Nos. 51/97, 49/98 and 56/98) but not on the functional principle as previously. Because of a rather long delay in data publication due to the war, which lasted from March 24 to June 26, 1999, and the transition to the new chart of accounts, the figures shown for December 1998 cover the final entries. In previous years, data for December were shown without the final entries subsequently recorded after the end of the first quarter of the current year.
claims Foreign currency
SHORT-TERM OPERATIONS
Dinar claims
6
BALANCE SHEET OF ALL BANKS AND OTHER FINANCIAL ORGANIZATIONS Millions of dinars, end of period*
ASSETSLONG-TERM OPERATIONS
Foreign currency claims Dinar claims
FixedSubtotal External Claims Credits Other Quota assets TABLE
of claims at home to Securities invest- payments and (11-16) customers ments to IFOs other 1
153346.8 4884.0 128041.7 12085.2 0.0 16.7 8319.2 30222.4 October
4) As inter-bank credit relations comprise the specified securities of ultimate credit users, the inter-bank relations and securities were entirely consolidated and their balance included in this position, so that the respective figures are not strictly comparable with the historical data.5) The figures are not comparable with the historical data, as the exchange losses originating from the old foreign currency savings deposits were removed from the balance sheet of the NBY and transmitted to the government in compliance with the Law on Settlement of Liabilities Arising from Foreign Currency Savings Deposits of Households.6) In conformity with the Law on Settlement of Liabilities Arising from Foreign Currency Savings Deposits of Households, claims for the old foreign currency savings deposits of households are shown as claims on the government.
7
BALANCE SHEET OF ALL BANKS AND OTHER FINANCIAL ORGANIZATIONSMillions of dinars, end of period*
LIABILITIESSHORT-TERM OPERATIONS
Foreign currency liabilities Dinar liabilities
Total Subtotal TABLE liabilities of External Liabilities Currency Deposit Other Time Float Net
(2+13+18) (3-12) liabilities at home in money demand deposits Securities income Other1A circu- deposits lation
* Ibid.1) Under the Law on Settlement of Liabilities Arising from Foreign Currency Savings Deposits of Households, short-term deposits were converted into long-term ones.
8
BALANCE SHEET OF ALL BANKS AND OTHER FINANCIAL ORGANIZATIONS Millions of dinars, end of period*
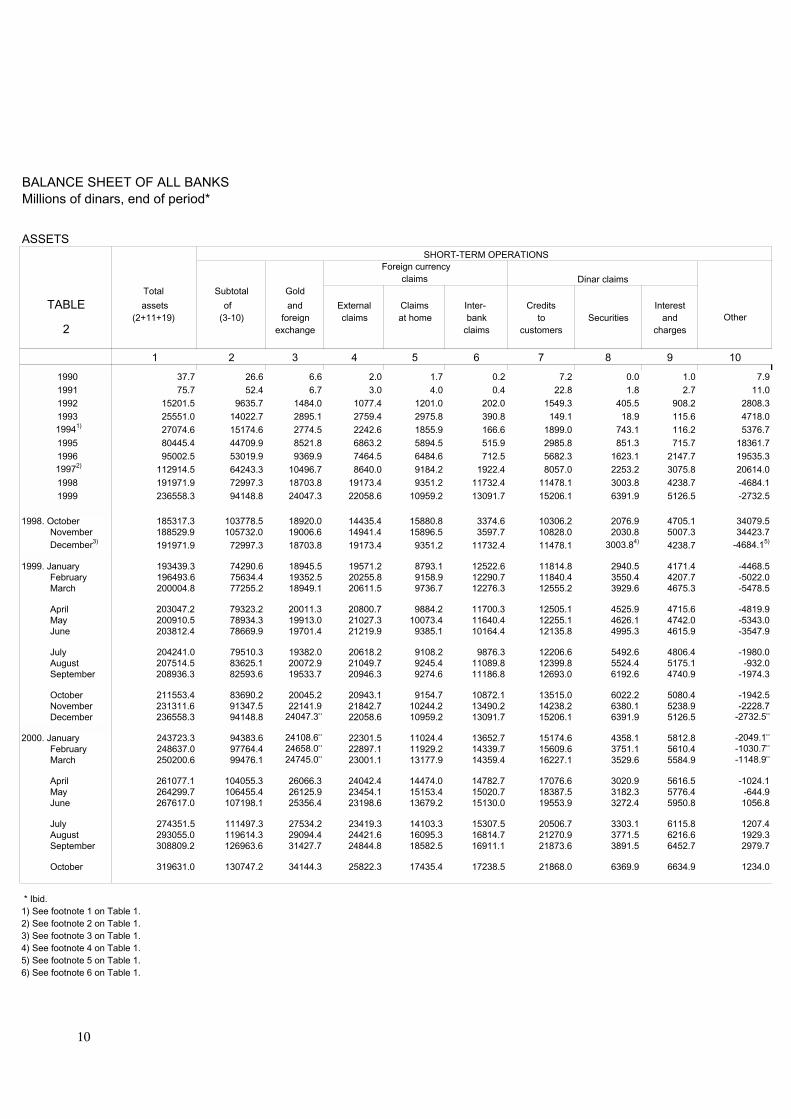
* Ibid.1) See footnote 1 on Table 1.2) See footnote 2 on Table 1.3) See footnote 3 on Table 1.4) See footnote 4 on Table 1.5) See footnote 5 on Table 1.6) See footnote 6 on Table 1.
Dinar claims
SHORT-TERM OPERATIONS
10
BALANCE SHEET OF ALL BANKSMillions of dinars, end of period*
ASSETS
Fixed
assetsSubtotal External Claims Inter Credits Other Quota and TABLE
of claims at home claims to Securities investiments payments other(12-18) bank customers to IFOs investment 2
* Ibid.1) As a result of the application of the new chart of accounts for banks and other financial organizations in October 1994 and making reentries for other claims and other liabilities in books, these claims and liabilities were substantially reduced, thus reducing the total assets and liabilities of the National Bank of Yugoslavia.2) The book positions were reentered in the accounts prescribed by the new chart of accounts for banks and other financial organizations based on the balance sheet principle but not on the functional principle as previously. The figures shown for December 1998 cover the final entries.3) The figures are not comparable with the historical data, as the exchange losses originating from the old foreign currency savings deposits were removed from the balance sheet of the NBY and transmitted to the government in compliance with the Law on Settlement of Liabilities Arising from Foreign Currency Savings Deposits of Households.
SHORT-TERM OPERATIONS
claims Foreign currency
14
BALANCE SHEET OF THE NATIONAL BANK OF YUGOSLAVIAMillions of dinars, end of period*
ASSETS
Foreign currency claims Fixed
Quota assetsSubtotal External Claims Dinar payments and TABLE
of claims on domestic credits to IFOs other (13-16) banks investment 3
* Ibid.1) Including other demand deposits but not deposits of international financial organizations.2) Including vault cash.3) In compliance with the Law on Settlement of Liabilities Arising from Foreign Currency Savings Deposits of Households, liabilities in respect of foreign currency savings deposits of households were transmitted to the government.
SHORT-TERM OPERATIONS
16
BALANCE SHEET OF THE NATIONAL BANK OF YUGOSLAVIA Millions of dinars, end of period*
LIABILITIES
Foreign currency Bank deposits liabilities Fixed
capitalGiro Required Secu- Net Other Subtotal External Liabilities Inter- and TABLE
accounts 2) reserves rities income of liabilities at home bank Other other (18-21) liabilities finance 3A
* Ibid.1) As a result of reentering book positions in the accounts prescribed by the new chart of accounts for banks and other financial organizations in October 1994, a discrepancy was particularly observable in inter-bank dinar and foreign currency claims and liabilities. 2) See footnote 3 on Table 1.3) In compliance with the Law on Settlement of Liabilities Arising from Foreign Currency Savings Deposits of Households, claims on the NBY for the old foreign currency savings deposits of households were transmitted to the government.
SHORT-TERM OPERATIONS
18
BALANCE SHEET OF COMMERCIAL BANKS Millions of dinars, end of period*
ASSETS
Foreign currency claims Fixed
assetsSubtotal External Claims Inter- Credits Other and TABLE
of claims at home bank to Securities invest- Other other (14-20) claims customers ments investment 4
Total Subtotal to Other Subtotal deposits Other capitalliabilities of domestic liabilities of and other liabilities and TABLE (2+5+8) 3 and 4 banks 6 and 7 long-term other
* Ibid.1) Including giro account overdrafts and, since May 1998, the conversion of short-term investments in securities earmarked for financing agricultural production into long-term credits to banks has been recorded in compliance with a special law.
through banks
CREDITS TO BANKSCredits to banks Investments in securities
24
NATIONAL BANK OF YUGOSLAVIA LENDING Millions of dinars, end of period*
Lending Foreign
Subtotal to Bills Commercial Other currency TABLEof government of paper Bonds securities claims
* Ibid.2) As a result of transition to the new chart of accounts and data reprocessing, there is a mismatch, during the period 1990 as compared to November 1998, between data on dinar bank credits in this Table and in Table 11 - Net Domestic Assets of Banks - where some credits granted on behalf and for account are included in this period.3) As inter-bank credit relations comprise the specified securities of ultimate credit users, the inter-bank relations and securities were entirely consolidated and the balance included in this position, so that the respective figures for December 1998 are not comparable with the historical data. Therefore, the total amount of investments in securities cannot be derived from the data shown by banks and republics. The same applies to the summary columns comprising data on securities.
Other short-term credits
26
CREDITS AND OTHER BANK INVESTMENTS Millions of dinars, end of period*
LONG-TERM LOANS Arrears
of long- ForeignTotal Subtotal Economic Other Credits Secu- term currency TABLE
of of organisations customers Govern- to rities credits claims (13+18+19) (14-17) ment individuals and at home1) 7
* Ibid.1) Including short-term foreign currency deposits.2) Excluding the old foreign currency savings deposits of households, as shown in Table 8A, from December 1998.
28
DEPOSITS WITH BANKS AND OTHER FINANCIAL ORGANIZATIONS Millions of dinars, end of period*
SHORT-TERM DEPOSITSTIME DEPOSITS FOREIGN CURRENCY
DEMAND DEPOSITS 1)
Gov- Finan- Non-
Economic Other ern- cial Individuals resi- Economic Other Gov- Individuals2) TABLEorganisations customers ment organi- dents organisations customers ern-
DEPOSITS WITH BANKS AND OTHER FINANCIAL ORGANIZATIONSMillions of dinars, end of period*
LONG-TERM DEPOSITS
OldTotal Subtotal Economic Other Gov- Finan- Economic Other Gov- Finan- foreign
TABLE of of organisations customers ern- cial Individuals Subtotal organisations customers ern- cial Individuals2) currency 2 and 8 (3-7) ment organ- of ment organ- savings
* Ibid.1) The discrepancies in the sector distribution of long-term dinar and foreign currency deposits are due to the reentries made in books according to the new chart of accounts for banks and other financial organizations. 2) The old foreign currency savings deposits of households are excluded from December 1998 and, together with short-term deposits from Table 8, are shown in column 14 in compliance with the Law on Settlement of Liabilities Arising from Foreign Currency Savings Deposits of Households.
DEPOSITS AND OTHER BALANCES FOREIGN CURRENCY DEPOSITS
30
BANK INVESTMENT PORTFOLIOSMillions of dinars, end of period*
Bank Bills Commer- bills Total Finan-
TABLE of cial NBY and Other of Economic Govern- NBY cial Otherexchange Bonds paper bills other securi- (1-6= organisations ment organi- sectors2)
* Ibid.1) That these are the figures from the non-consolidated balance sheets of banks implies that securities were not netted which must be taken into account on the occasion of comparing data on securities in other Tables.2) By December 1998, this column included the overall value adjustments in respect of securities which are broken down by the corresponding sectors thereafter. The table shows value adjustments in column 6 - Other securities - as there is no possibility of their distribution by types of securities.
BANK PORTFOLIOS OF SECURITIES
31
FOREIGN CURRENCY CLAIMS AND LIABILITIES OF BANKSMillions of dinars, end of period*
ASSETSSHORT-TERM OPERATIONS
Foreign currencies External claims
TABLE Gold Vault External Bilateral
cash and accounts accounts Credits Other 10 cheques
10612.7 3890.4 24516.3 5973.8 3150.6 1733.3 128041.7 42829.9 October
3) In compliance with the Law on Settlement of Liabilities Arising from Foreign Currency Savings Deposits of Households, claims on the NBY for the old foreign currency savings deposits of households were transmitted to the government, i.e., from column 9 to column 13.
Claims at home Claims at home
33
FOREIGN CURRENCY CLAIMS AND LIABILITIES OF BANKSMillions of dinars, end of period*
LIABILITIES
External liabilities
TimeTABLE deposits Inter-
Credits of Other Economic House- Other Economic House- bank Other 10A non- organisations holds organisations holds operations
* Ibid.1) As a result of making reentries in books according to the new chart of accounts for banks and other financial organizations in October 1994, the distribution of household deposits was somewhat different and inter-bank liabilities and other liabilities show some discrepancies.2) On the occasion of reentering book positions according to the new chart of accounts, some deposits previously recorded as resident deposits were reentered in books as non-resident deposits.
SHORT-TERM OPERATIONS
Time depositsDemand deposits Liabilities at home
34
FOREIGN CURRENCY CLAIMS AND LIABILITIES OF BANKSMillions of dinars, end of period*
LIABILITIES
in respect of creditsOld foreigncurrency Inter- TABLE
Total Of which Economic House- savings depo- Other bank IFOs organisations holds sits of operations 10A
127323.7 8666.7 149.3 73.4 51402.8 912.5 27507.2 October
3) Excluding the old foreign currency savings deposits of households shown in column 15 of this Table. 4) Excluding the NBY liabilities to banks for the old foreign currency savings deposits of households.
Time deposits
LONG-TERM OPERATIONS Liabilities at home External liabilities
35
NET DOMESTIC ASSETS OF BANKSMillions of dinars, end of period*
Net Net Exter- Total Mon- Cur- De- Non- Di- For- Foreign domes- for- Exter- nal depos- ey rency posit mone- nar reign Other
Dinar cur- tic eign nal liabil- its sup- in mon- tary de- cur- netTABLE credits rency assets liabil- claims ities (8+11) ply circu- ey depos- pos- rency liabil-
claims at (1+2)= ities (9+10) lation its its2) depos- ities3)
* Ibid.1) Claims on domestic clients and short-term and long-term inter-bank claims less short-term and long-term inter-bank liabilities and other liabilities in foreign currencies. Including the old foreign currency savings deposits of households, or the government liabilities therefor, with effect from December 1998.2) Short-term and long-term deposits. 3) Other domestic liabilities net of other claims, in dinar terms. The exchange losses originating from the old foreign currency savings deposits of households transmitted from the NBY to the government by law were excluded from other assets of the NBY in December 1998.
36
MONEY SUPPLY (M1) BY SECTORSMillions of dinars, end of period*
Other Rest Total Economic Government Non-economic financial Households1) of the
TABLE of organizations organizations organi- world (2-7) zations
October 45159.6 25166.9 5037.5 3400.1 433.3 11030.1 91.7
* Ibid.1) The definition of this monetary aggregate has been changed so that, apart from the deposits included so far, it comprises short-term foreign exchange liabilities to domestic customers but not the old foreign currency savings deposits of households (see the explanatory notes to the tables). The table has been completely revised and the figures shown in it are strictly comparable.2) Including currency in circulation.
38
MONEY SUPPLY (M3) BY SECTORSMillions of dinars, end of period*
Other Rest Total Economic Government Non-economic financial Households1) of the
TABLE of organizations organizations organi- world (2-7) zations
* Ibid.1) Including vault cash. 2) Excluded from other assets of the NBY are the exchange losses originating from the old foreign currency savings deposits of households transmitted from the NBY to the government by law.
40
NET DOMESTIC ASSETS OF THE NATIONAL BANK OF YUGOSLAVIA Millions of dinars, end of period*
Other net assetsTotal Sub- Cur- Deposit Foreign
of total rency money currency 12 and 20 of in Subtotal Giro ac- Required NBY Other deposits Net Other Other TABLE
(13+14 circu- of counts 1) reserves securities bank with of assets liabil- +15) lation (16-19) reserves NBY 22 less 23 ities 15
* Ibid.1) Ratio of giro account balances and vault cash to short-term dinar assets of banks: deposit money, other demand deposits, short-term time deposits, short-dated securities and other short-term liabilities due.
42
NATIONAL BANK OF YUGOSLAVIA RATES OF INTEREST1)
(Monthly rates, in percentages)
T A B L E 17 1999 2000October November December January February March April May June July August September October
Arrears of central bank credits 3.02 3.02 3.02 3.02 3.02 3.02 3.02 3.02 3.02 3.02 3.02 3.02 3.02
Late required reserve allocations and the amount of required reserve assets used for liquidity 2.00 2.00 2.00 3.90 2.86 2.85 2.86 2.86 4.00 4.00 4.00 2.00 2.00
Advance payments to authorized exchange dealers not used in the current decade 6.00 6.00 6.00 6.00 6.00 6.00 - - - - - - -
Bonds issued against the conversion of NBY claims on banks 2.00 2.00 2.00 2.00 2.00 2.00 2.00 2.00 2.00 2.00 2.00 2.00 2.00
Federal and republican government deposits and public fund deposits - - - - - - - - - - - - -
1) The rate of interest on the obligatory subscription of NBY bills prescribed by the decision in effect from July 5, 1999.2) With effect from September 11, 1999, the rate of interest on the voluntary subscription of NBY bills is prescribed be the Governor in the manner and under the conditions prescribed by Item 7 of the Decision on the Conditions for Participation of the National Bank of Yugoslavia in the Money Market.
43
WEIGHTED RATES OF INTEREST ON BANK CREDITS(Monthly rates, in percentages)
TABLE 18October November December January February March April1)1)1)1) May June July August September October
1) With effect from February 2000, the calculation of the average weighted borrowing rate of interest excludes demand deposits, giro and current accounts, time deposits for less than 15 days and over three years.
1999
45
DEPOSITS OF ECONOMIC ORGANIZATIONS WITH BANKSMillions of dinars, end of period*
Total Subtotal
TABLE deposits of Deposit Other Subtotal Subtotal Bonds NBY Other (2+5+9+ (3-4) money demand of 3-month 6-month 1-year of bills securities
* Ibid.1) Unlike the previous Chart of Accounts, the four-digit analytics of the new Chart of Accounts precludes the purpose-by-purpose monitoring of credits granted to the economic sector, but enables the monitoring of total short-term credits only.2) Including the foreign currency credits granted by the Fund for Development of Serbia with effect from July 1997.
48
ECONOMIC ORGANIZATIONS' BORROWINGS FROM BANKSAND OTHER FINANCIAL ORGANISATIONS