Bulletin of the Seismological Society of America. Vol. 53, No. 3, pp. 549-562. April, 1963 PROCESSING OF SEISMIC DATA FROM AN AUTOMATIC DIGITAL RECORDER BY ROBERT A. PHINNEY AND STEWART W. SMITH ABSTRACT Data from a three-component, long-period seismometer system is recorded in digital form on magnetic tape by a device which has been described by Miller. Preliminary editing and proc- essing is performed to select events of interest from the 24-hour tapes and place them on a library tape that is compatible with a computer. Emphasis is placed on location, correction, and flagging of errors that occur during the recording and editing process. Processing routines developed include: correction for seismometer response, orbital motion functions, energy computation, band pass filtering for mode separation, etc. The dynamic range of the system is 86 db and the response is adequate over the range .02 to 2.0 cps. For the purpose of detailed analysis, digital records from this system are superior t~opaper records from any of the existing seismographs in use at this laboratory. The main disadvantage of data in this form is the difficulty of inspecting signals by eye in order ~o make preliminary interpretations. INTRODUCTION It is the purpose of this paper to describe one particular solution to the problem of continuous high speed digital recording of seismic data. Simpson (1961) has described a data handling system at MIT, based on routinely hand-digitized seismic data. Haubrich and Iyer (1962) and DeBremaecker et al. (1962) record selected time intervals on punched paper tape. Bogert (1961) records on analog magnetic tape and electronically digitizes events of special interest. These systems are kept within reasonable bounds by the limited objectives of the investigators, which enable them to retain only specially desired data intervals. The system described here is a general- purpose digital library system, with the objective of preserving and cataloging a wide class of digital seismograms. This paper will describe in detail the characteris- tics of our tape library, the methods we use for file processing, and some preliminary results of analysis. In a previous work (Miller, 1963), the digital recording system now in use at the California Institute of Technology was described from the design point of view. Signals from the three components are filtered (for aliasing), preamplified, and digitized by four place digital voltmeters. Data words, consisting of six 5-bit 2421 BCD characters (four numeric, one sign, and one error flag), are formed and written on 1 inch magnetic tape at a density of 200 bits per inch. All three components are handled in parallel, there being separate amplifiers and digitizers for each com- ponent, and are written on the tape in 3 parallel 5-bit channels. At a digitizing interval of 0.1 seconds, 24 hours of data may be recorded on a single 3600 foot reel of tape. The sensing instrument is a matched 3 component set of long period Press-Ewing pendulums. The free period is set at 24 seconds and is checked regularly so that signals can be digitally compensated for the instrument response. The response function is shown in figure I. The electromagnetic coil pickup is coupled to a critic- ally damped RLC low pass filter by the damping resister R~, which overdamps the pendulum by about 20 per cent. It can be seen that the low pass filterdoes not reject 549
Transcript
Bulletin of the Seismological Society of America. Vol. 53, No. 3, pp. 549-562. April, 1963
P R O C E S S I N G OF S E I S M I C D A T A F R O M AN A U T O M A T I C
D I G I T A L R E C O R D E R
BY ROBERT A. PHINNEY AND STEWART W. SMITH
ABSTRACT
Data from a three-component, long-period seismometer system is recorded in digital form on magnetic tape by a device which has been described by Miller. Preliminary editing and proc- essing is performed to select events of interest from the 24-hour tapes and place them on a library tape that is compatible with a computer. Emphasis is placed on location, correction, and flagging of errors that occur during the recording and editing process. Processing routines developed include: correction for seismometer response, orbital motion functions, energy computation, band pass filtering for mode separation, etc. The dynamic range of the system is 86 db and the response is adequate over the range .02 to 2.0 cps. For the purpose of detailed analysis, digital records from this system are superior t~o paper records from any of the existing seismographs in use at this laboratory. The main disadvantage of data in this form is the difficulty of inspecting signals by eye in order ~o make preliminary interpretations.
INTRODUCTION
I t is the purpose of this paper to describe one particular solution to the problem of continuous high speed digital recording of seismic data. Simpson (1961) has described a data handling system at M I T , based on routinely hand-digitized seismic data. Haubrich and Iyer (1962) and DeBremaecker et al. (1962) record selected t ime intervals on punched paper tape. Bogert (1961) records on analog magnetic tape and electronically digitizes events of special interest. These systems are kept within reasonable bounds by the limited objectives of the investigators, which enable them to retain only specially desired da ta intervals. The system described here is a general- purpose digital l ibrary system, with the objective of preserving and cataloging a wide class of digital seismograms. This paper will describe in detail the characteris- tics of our tape library, the methods we use for file processing, and some preliminary results of analysis.
In a previous work (Miller, 1963), the digital recording system now in use at the California Inst i tute of Technology was described from the design point of view. Signals from the three components are filtered (for aliasing), preamplified, and digitized by four place digital voltmeters. Da ta words, consisting of six 5-bit 2421 BCD characters (four numeric, one sign, and one error flag), are formed and wri t ten on 1 inch magnetic tape at a density of 200 bits per inch. All three components are handled in parallel, there being separate amplifiers and digitizers for each com- ponent, and are writ ten on the tape in 3 parallel 5-bit channels. At a digitizing interval of 0.1 seconds, 24 hours of data may be recorded on a single 3600 foot reel of tape.
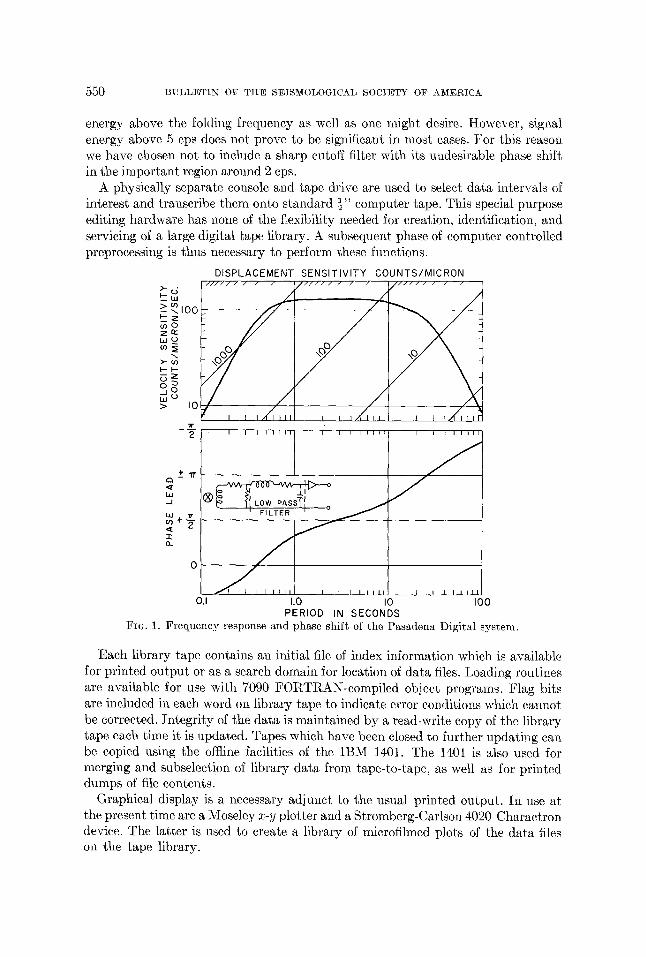
The sensing instrument is a matched 3 component set of long period Press-Ewing pendulums. The free period is set at 24 seconds and is checked regularly so that signals can be digitally compensated for the instrument response. The response function is shown in figure I. The electromagnetic coil pickup is coupled to a critic- ally damped RLC low pass filter by the damping resister R~, which overdamps the pendulum by about 20 per cent. It can be seen that the low pass filter does not reject
549
550 BULLETIN OF THE SEISMOLOGICAL SOCIETY OF AMERICA
energy above the folding frequency as well as one might desire. However, signal energy above 5 eps does not prove to be significant in most cases. For this reason we have chosen not to include a sharp cutoff filter with its undesirable phase shift in the important region around 2 cps.
A physically separate console and tape drive are used to select data intervals of interest and transcribe them onto standard ½" computer tape. This special-purpose editing hardware has none of the flexibility needed for creation, identification, and servicing of a large digital tape library. A subsequent phase of computer eontroUed preprocessing is thus necessary to perform these functions.
DISPLACEMENT SENSITIVITY COUNTS/MICRON I / / / / / / I / I / / / I / / / / / / / / /
> ~ I00 7_
Z n e
"'"2_
. o / /1 t~j Co
> I0 ! I I I Z I l l I I I / I 1 1 1 1 7
_Tr 2
-.+ "IT
.- i
"/r
a.
I I I I I I I I
F I L T E R
i I i i i i i
/
I I I I I fl
I.O I0 PERIOD IN SECONDS
L I I I llIl
O.I I00
FIG. 1. Frequency response and phase shift of the Pasadena Digi ta l system.
Each library tape contains an initial file of index information which is available for printed output or as a search domain for location of data files. Loading routines are available for use with 7090 FORTRAN-compiled object programs. Flag bits are included in each word on library tape to indicate error conditions which cannot be corrected. Integri ty of the data is maintained by a read-write copy of the library tape each time it is updated. Tapes which have been closed to further updating can be copied using the offline facilities of the IBM 1401. The 1401 is also used for merging and subseleetion of library data from tape-to-tape, as well as for printed dumps of file contents.
Graphical display is a necessary adjunct to the usual printed output. In use at the present time are a Moseley z-y plotter and a Stromberg-Carlson 4020 Charaetron device. The latter is used to create a library of microfilmed plots of the data files on the tape library.
P R O C E S S I N G O F SEISMIC DATA 551
LIBRARY TAPE FILE MAINTENANCE
The original tape written by the recording equipment is not compatible with the high speed drives employed with large digital computers. Conversion to a com- patible tape occurs when the editing equipment spills the data into an output buffer (the Digilog) attached to a standard high speed tape drive. The resulting inter- mediate tape consists of unlabeled low density files of BCD data written in odd (binary) parity. By means of an updating package for the 7090, these files are assigned identifying records, converted to fixed point binary, packed two points per computer word, and written onto a library tape in high density. Error conditions are sensed during updating and all irrecoverable errors are flagged in the data word itself and tabulated on the output tape.
RECORDING INSTRUMENTS -DIGITIZER
/ x = ,~ p Y ~ Z ~ /
RECORDER -~
L I B R A R Y TAPE CREATION 8, U P D A T I N G
@ CONTgOL (~) JOB l ' & l T f'&'l INPUT ~ ~ ' ~ - ~ JOB ~CONNUI//-17~anl RAWI B rm I OUTPBT ~ '~ ~"~ I DA..TA ~ "~-
3 / t--=--:a~ - I 9 ~ L
5[,i1,5.____/F B C O - BIIN A R f l I - - ~ ] ] . . , - - I
FAIE#' L/ERARY | 6 161 I OLD LIBRARY ~j.4- -1 I I [ [ I
SOffRCE TAPE X, Y,Z IN PARALLEL 2421 BeD, BCH./POINT CONTINUOUS DATA STRING 24 HOURS CAPACITY ON EACH OF 5 CHANRELS
/NTERNEO/ATE ]APE: l/2"x 2400' UNLABELED DATA STRINGS (SERIAL} SEPARATED BY END OF FILE MARKS B42J BCD, BCHI/POINT, Ill lORD RECORDS, 2OOCH./INDH, 5,000,000 PT. CAPACITY, BO HOURS TOTAL
COPYING, MERGING, I F----'-m---- ~ r ~ r~ L IST ING
I I ] 14ol ~ I TAP[ DUWP
- - - - . { )I/2"x2400' LABELED DATA FILES AND BDB INDEX FILE 2POINTS/WORD, TAPE x...._.JBBI/ORDS/RECORD, 556 DE/INCH, 3,400,000 POINT CAPACITY
Fro. 2. Flow sheet for generation of library taloes from the digital seisInogr~ph.
A step-by-step resume of the data flow follows. Figure 2 is a graphical summary of the process.
1) The station chronometer initiates each daily recording. Subsequent time- keeping is handled by counting time flags. (These are put on the tape every 2048 points.) When the tape is unloaded, it is set aside for editing if any earthquake or blast records of interest are present (reference must be made to the regular photo- graphic station records). Data intervals to be saved on the library tape are manually selected by specifying the time interval of interest and converting this to a time flag count and a word count.
2) Using these counts as dial settings on the editing console, the operator trans- scribes the proper sections of tape onto an intermediate low density magnetic tape.
3) Updating consists of three phases:
552 BULLETIN OF THE SEISMOLOGICAL SOCIETY OF AMERICA
SEISMOLOGICAL LAB DIGITAL TAPE NO. 2/62
INDEX FILE LISTING 29 AUG 62 IAPE CIT 066
CODE 20020E 20020N 20020Z
2OOZIN 2 0 0 Z [ Z
20035E
20036E 20036Z
20037E 20037Z
20038E. 20038Z
20039E ~0039Z
DELTA T = . I SEC.
STA INST DATE START SAMPLES PAS WML l l J U L 6 2 1 2 5 4 / 4 3 . 0 057168 PAS WMI IIJUL62 1254/43.0 057169 PAS NMI IIJUL62 1 2 5 4 / 4 3 . 0 140129
PAS WMI 03JUL62 1830102 .7 099958 PAS WMI 03JUL62 1830102 .7 099957
a) BCD card images from the job input are used to update the index file under control of the FAP update preprocessor, which permits insertions, deletions, and additions to the input file.
b) The remaining files from the old library (all binary data) are copied into memory and ~written on the new library. In this way the signal strength on the tape is kept high and tape flaws are detected before they become too severe.
c) Data files from the intermediate tapes are read, checked for errors, converted to binary and packed (2 points per word). Converted information is output to the new library. A series of integers from the job input acts as interpretive control of the file manipulation. I t permits switching back and forth among the various input and output units, and makes possible mid-job changing of reels without waste of processing time.
4) Off line, the error statistics are printed, the index file is listed and the binary files are dumped in octal.
0 ~ 0 N ~ C ~ 5 NNnn~l~N~fl~4 n ~ N ~ l ~ N ~ l ~ ~ n f i f i l ~ f i N ~ 4 NfiNOn~flNO01 4NNNN~ONNfi? &~ONll~OOnl4 40N~I~400012 CCCCC3000003 CO001 000010 00001 000015 00002 000031 000031 60014 000012000000 00000 04, 000006 00000 400004
FIG. 4. Primary form of documentation of library tapes, an octal tape dump with two data samples per word.
LIBRARY TAPE FORMAT
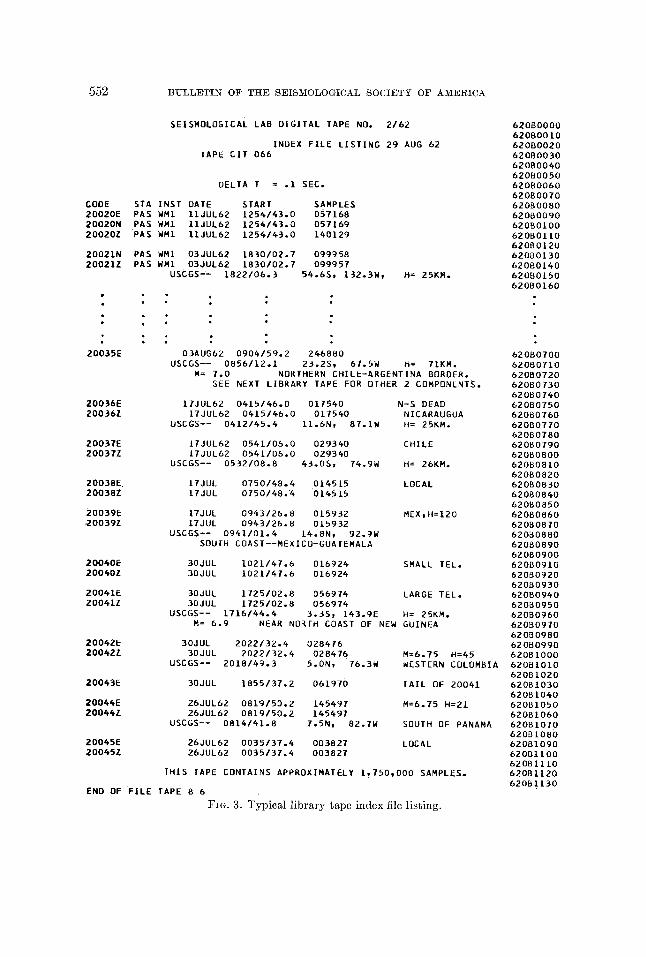
The first file on every library tape consists of 14 word records written in BCD (even) parity. Each record corresponds to a card image obtained during an update run. This file gives a printed listing of the tape contents when put on a 1401 or ordinary tape-to-printer. Figure 3 shows a typical listing. Blank lines and comments are included to increase the readability of the file. Columns 2-7 are reserved for the 6-character file codes, arranged in strictly increasing order. Columns 73-80 contain the serialization used for updating control and have no fixed relationship to the file codes. All other fields are unrestricted; by convention, however, the initial time and word length of the file are listed.
The data files follow the index file in the same sequence given by the file codes in the index. Each file contains an unrestricted number of 86 word records. The first record acts as a control block, and contains a flag (all l's in word 1) and a file code (word 2). The data records consist of 171 data halfwords and a trailing zero half- word. For each halfword the format is: (from the left) bit 1--sign, bit 2--indicates a lateral parity check in transcribing the intermediate tape, bit 3--flag generated by the digitizer to indicate unbalance or clipping, bit 4--indicates that the word on
5 5 4 B U L L E T I N OF T H E S E I S M O L O G I C A L S O C I E T Y OF A M E R I C A
intermediate tape contained illegal BCD characters which could not be exorcised during updating. Bits 5-18 form a binary integer right justified. A small portion of the octal dump from a blast-generated P-wave appears in figure 4 as an illustration.
A special loading routine is needed for access to the data. I t uses the index file to locate the desired data file, and uses the control block in the data file to verify correct positioning. Parameters in the calling sequence prescribe skipping or input of a selected number of minutes (600 word blocks) of data. This loader can also be called under the supervision of a filter and decimation routine. This permits input of time intervals too long to be included in memory at 10 samples per second.
OCCURRENCE, DETECTION, AND REMOVAL OF ERRORS
1) Flags: If the digitizer fails to balance due to high slew rate or clipping, a special character is inserted on the source tape and the data value is set at -9999 . Errors of this kind are definitely not random, and in fact, tend to occur in the middle of an interesting event. Without frequent maintenance of the digitizer these balance errors may crop up at any time, normally in long strings. Due to the special needs of the different users and the nonrandom nature of the errors, no corrections are carried out on the data during updating. Bit position 16 of the data halfword is set to indicate a flag. A rough tabulation of flag occurrence on library tape 1/62 should indicate the order of difficulty involved:
No flag errors: Few errors, random in nature, easily removed: Moderate clipping, could be restored by hand: Severe clipping and slew problems, significant part of the data
unusable :
number of files
18 10
5 6
39
Action to be taken must depend on the needs of the user. The loading routine, therefore, provides several built-in options for repairing the input series.
2) Par i ty errors: Par i ty errors in reading or copying of library tapes are nearly nonexistent. This is due to the read-write checking of the 7090 which makes it very difficult for a tape writ ten online by an IBM drive to have a weak or improperly shaped signal. Tapes written by the digilog, however, are not checked when written, giving rise to occasional pari ty errors. When these occur without associated character shifts (see below) the updating routine flags the offending data points in bit position 17. Records giving a pari ty check are always reread 10 or 20 times before the condition is accepted as irreparable. So-called permanent read redun- dancies are the only real problem.
3) Character shifts: Stray electrical noise often causes the digilog to insert one or more extra characters (bytes) into a file. This has the effect of shifting all the subsequent data some multiple of 6 bits. The effect is cumulative and does not increase the record length-- the shifted bits are shifted into the subsequent record. A more difficult problem occurs when the 729IV thinks it sees a byte which is not present or fails to pick up a byte due to weak signal. Shifts occur here, too, but they do not extend beyond the record; when they occur, however, there are often several
PROCESSING OF SEISMIC DATA 555
in one record, with both directions of shift. The updating program detects shifted records by finding illegal characters in the sign and flag characters of the input data word (sign must be 8 or 9 and flag must be 9 or 5). Attempts are then made to restore the shifts. When the best practical repair job has been done, the record is rechecked for illegal characters, and the appropriate words are flagged in bit 15 before output on the library tape. Then if more than 5 records, each having more than 20 bad words, occur in sequence the file is considered to be worthless beyond that point and processing is terminated. Read redundancies are almost always associated with shifted records, but it is meaningless to try to localize them in this case.
Benioff S.P. I -0.2
Torsion N-S
Senioff L.P 1-90
Press-Ewing 30-90
Benioff Ultra Sensitive L.P.
FIG. 5. Explosion at the Nevada Test Site on 27 June 1962, recorded on five different seismographs at Pasadena. Minute marks are shown.
APPLICATIONS OF DIGITAL ANALYSIS
A selection of results obtained with some early data will be shown in order to point up the broad range of amplitude and frequency which can be recorded and the flexibility with which analysis tools can be shaped for particular applications.
Figure 5 is a reproduction of photographic records of the vertical component at Pasadena as seen by five different routine instruments. The event is an underground nuclear explosion at the Nevada Test Site, 385 km distant. This suite of instruments samples the different frequency bands with different sensitivities in a manner that has evolved over many years of experimentation. The various instrument responses were developed in order to study specific problems. While the existing seismograph systems give a remarkably good representation of earthquake signals over a tre- mendous range of amplitudes and frequencies, the types of analysis that can be performed on data in this form are very limited. For example, of the records shown in figure 5, only the Benioff ultra-sensitive record can be considered for any kind of analysis other than picking arrivals. At shorter periods only the vaguest kind of registration is given. Other limitations are evident: if the event were small enough for the signal to be visible on the Benioff short period, the other instruments would show virtually nothing. Thus, for a given instrument and a given epicentral distance
5 5 6 B U L L E T I N OF T H E SEISMOLOGICAL SOCIETY OF AMERICA
there is only a very narrow range of source strengths which will register satis- factorily.
By comparison we show in figure 6 the same event as recorded by the digital system in Pasadena. By displaying the signal in various octaves of frequency the figure is crudely analogous to the frequency separation shown in figure 5 from five different instruments. The top trace represents a plot of the unfiltered data on a Moseley x-y plotter. The other six traces show the record as seen through phase- shift-free frequency windows flat between the limits specified. The great dynamic
. ~1 t /.;l:::I:; I: I ~;I . l i : i i : , i i i i i i L ~ UNFILTERED
:~ C:. J :; l , L l ~ l C JiJ b *a l l l i g
~'>
~o
Ld
O Ld :->
o O
'_¢5
7>
_ o Q
FIG. 6. Explosion at the Nevada Test Site, 27 June 1962, recorded on digital system at Pasadena. Vertical component filtered in octaves. Lower trace simulates Benioff ultra-sensitive long-period seismograph. Vertical lines connecting traces are at 1 minute intervals.
range is illustrated by the different scales used in plotting. The bot tom trace shows the signal as filtered to simulate the ultra-sensitive Benioff in figure 5. (The two pulse shapes are slightly different due to uncompensated phase differences.) A greatly expanded version of the high frequency P-wave appears on the top of figures 10 and 11. The superior fidelity of the digital instrument is self-evident. Figure 6 shows one advantage over analog tape. The very weak, longer-period signals were easily recovered from a short period signal 100 times as large. This would have been possible had the original signal been 5 times larger or 5 times smaller.
Particle motion studies have been made for a number of years by many investi-
PROCESSING OF SEISMIC DATA 557
42~ LOW PASS UP HIGH PASS t~, ~ ,22" \ \\
0 0 - - N 3 0 ° E
-IO0 ~ - I00 o~
- I00 0 +100 - I00 0 +100 FIG. 7. Par t ic le m o t i on in the ver t ica l p lane for a 2-second in terva l beginning 5.5 seconds af te r
}PIG. 8. Particle motion in the horizontal plane for three 2-second intervals. Low pass filter 0-1 cps, high pass filter 1-5 cps. a) interval beginning .5 seconds before Pn; b) Interval begin- ning 1.5 seconds after P~; c) Interval beginning 5.5 seconds after P,.
gators who have manual ly read photographic records and plotted the results. They have also been recorded directly by means of vector seismographs (Benioff et al., 1950). The orbital motion of seismic waves has been primarily of interest in the s tudy of ear thquake source mechanisms. I t has never been used extensively as a routine criterion in picking and identification of phases. With the digital system it is possible to produce a set of particle motion plots on microfilm for different fre-
558 BULLETIN OF THE SEISMOLOGICAL SOCIETY OF AMERICA
quency bands, covering an entire seismogram one cycle at a time. The problem then becomes one of interpretation, because in general the seismologist will have neither the time nor patience to even look at all these plots. Clearly, it is desirable for a machine to do some of the preliminary interpretation in this case, and present the particle motion information in a more compact manner. One approach to this problem will be discussed in a later section.
The initial experimentation with particle motion studies produced some interesting examples, some of which are shown in figures 7, 8, and 9. Figure 8 shows the change in horizontal polarization of the Pn wave group as a function of time and frequency for an explosion at 385 kilometers. Initially, (figure 8a) the polarization is longitudinal within 6 degrees of the correct azimuth at both high and low fre- quencies. The subsequent 2 seconds, figure 8b, show that the high frequencies have rotated 13 degrees to the north while the low frequency component has remained
+200
0
-200
\33 °
\
P~
\ \ \
- 2 0 0 0 +200
UP
+200
0
-200
Pg
\ -200 0 +200
--~ N3OOE mV
\
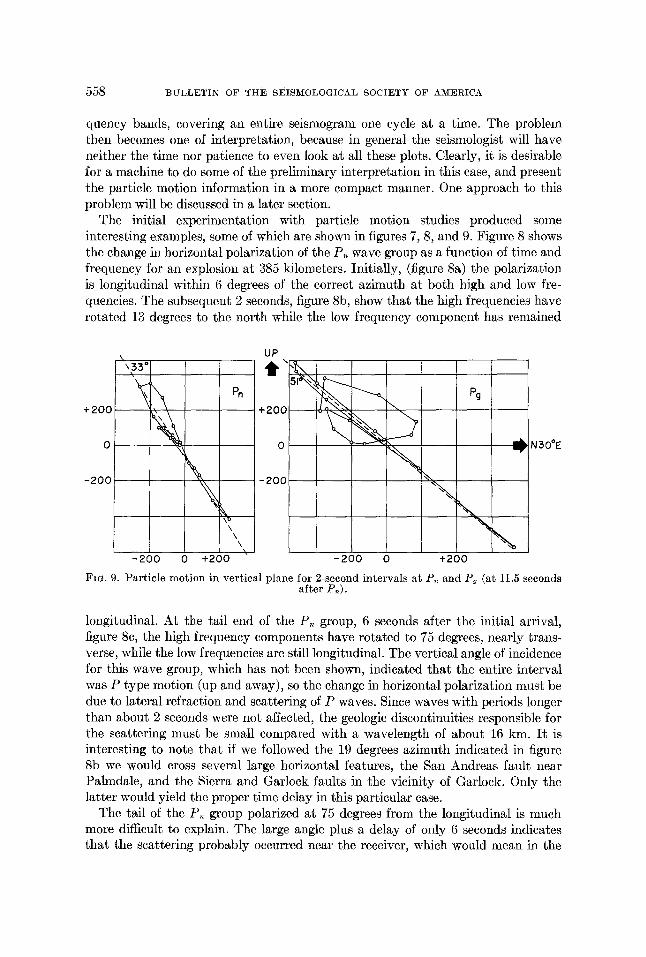
FIG. 9. Particle motion in vertical plane for 2-second intervals at P~ and Pg (at 11.5 seconds after Pn).
longitudinal. At the tail end of the P~ group, 6 seconds after the initial arrival, figure 8e, the high frequency components have rotated to 75 degrees, nearly trans- verse, while the low frequencies are still longitudinal. The vertical angle of incidence for this wave group, which has not been shown, indicated that the entire interval was P type motion (up and away), so the change in horizontal polarization must be due to lateral refraction and scattering of P waves. Since waves with periods longer than about 2 seconds were not affected, the geologic discontinuities responsible for the scattering must be small compared with a wavelength of about 16 kin. I t is interesting to note that if we followed the 19 degrees azimuth indicated in figure 8b we would cross several large horizontal features, the San Andreas fault near Palmdale, and the Sierra and Garlock faults in the vicinity of Garlock. Only the latter would yield the proper time delay in this particular case.
The tail of the P~ group polarized at 75 degrees from the longitudinal is much more difficult to explain. The large angle plus a delay of only 6 seconds indicates that the scattering probably occurred near the receiver, which would mean in the
PROCESSING OF SEISMIC DATA 559
0 5 I0 15 20 25 30 +600] I I i I I 1 I I I I I I ] I I I .I I I I I I | I I I I I I l z(t) p (
° vvvvvl v VV vlv I v- vI v v 1 - 6 0 0
1,0
0 t' " '1 I I
I I I I 0
8yz
0
w,v, I 7 n i
- 9 o ' I i i i 5 I0 :30
SECONDS
I I I
I
L llll
15 20 A F T E R Pn
25 i
+ 6 0 0 z(t)
(Counts] 0
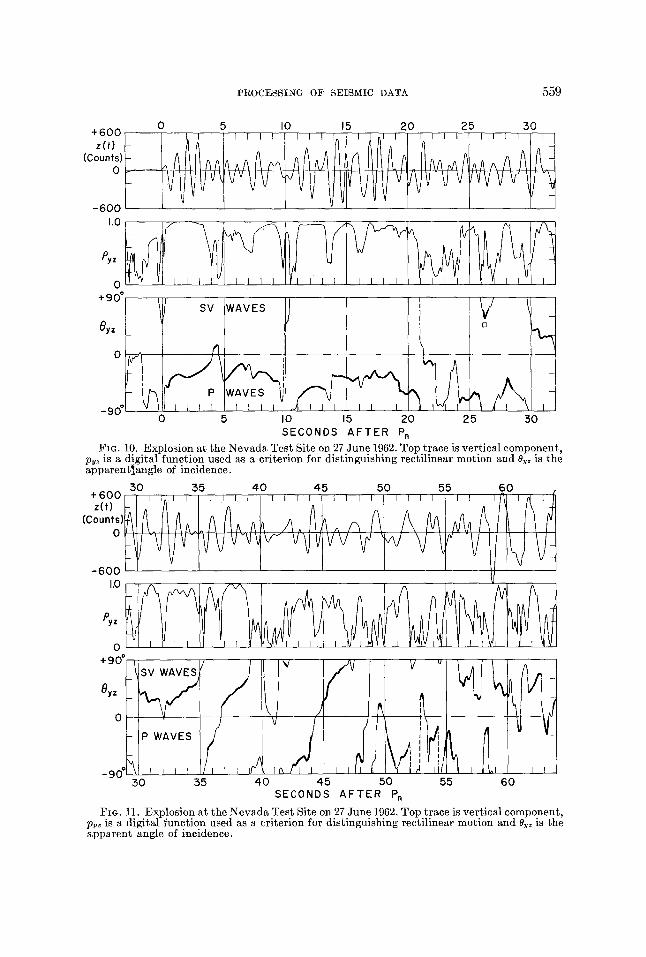
FIG. 10. Explosion at the Nevada Test Site on 27 June 1962. Top trace is vertical component, py~ is a digital function used as a criterion for distinguishing rectilinear motion and e~ is the apparent]angle of incidence.
50 55 40 45 50 55 60
- 6 0 0 1.0
P,z
I I f ~ l I l I I t l I I ] I I I
"9° svw v f v ~ y z _
I/ ~ . a k ~ / l \ / ! ', v ,,/), _ 9 0 ° ~ I i I I I / I I I ~/"~ ] : ~ I F I ] I i ] l ~ IL I ": i : ~ ~l l l
50 55 4 0 45 50 55 SECONDS A F T E R Pn
6O
FIG. 11. Explosion at the Nevada Test Site on 27 June 1962, Top trace is vertical component, p~ is a digital function used as a criterion for distinguishing rectilinear motion and Oy~ is the apparent angle of incidence.
5 6 0 BULLETIN OF THE SEISMOLOGICAL SOCIETY OF AMERICA
Transverse Range province within 40-50 km of Pasadena. Another explosion at the Nevada Test Site on May 12, 1962 showed almost exactly this same effect.
In figure 9 the vertical angle of incidence is shown for two phases, P~ and Pg. If we take a surface velocity of 4 kin/see the apparent angles of incidence lead to velocities of 8.1 and 5.4 km/see for the respective velocities of P . and PC which is in good agreement with observed velocities. This preliminary work indicates that angle of incidence will be one of the criteria that a machine will be able to use for phase identification.
Figure 7 demonstrates the dependence of apparent angle of incidence on frequency for a phase that is most likely P,,. It was recognized by Gutenberg (1952) that the apparent angle of incidence for any phase should be greater for long wavelengths than for short simply because the long wavelengths sample over a greater depth and have a higher apparent surface velocity. He effectively used the earth as a low pass filter by observing that at greater epieentral distances, as the predominant period of waves increases, the apparent angle of incidence could only be explained by using a higher surface velocity. Here we are able to do the filtering directly and, in fact, compute the angle of incidence as a continuous function of frequency.
As an example of the kind of analysis now easily carried out automatically, we show in figures 10 and 11 the result of subjecting the three-component seismogram to a specially designed moving filter. For each value of the lag r, the points y, to y,-.+l and z~ to z~_,,+~ are regarded as determining an orthogonal least squares regression line in the y-z plane. For each lag one can compute an angle of tilt 0 and, as a reliability measure, a normalized correlation coefficient p which in this case is just
~ y i z l PY~ = %/x", 2<-,
A.,Y~ /_.,z¢
G, and py~ are funetionals of the orbit which depend on the parameter n, and which cull out those parts of the signal having a rectilinear orbit in the y-z plane. If the window is too short, we increase the variability of 0 and p to a point where the results have doubtful meaning. By increasing n we obtain the increased reliability of numbers but may average over details of significance. Digital functions of this sort may be designed to pick out any geometrical property of the particle orbit in 2 or 3 dimensions. In the example shown, the first minute of signal following P~ from the 27 June Nevada blast is analyzed for 0 and p using a 10 point (1 second) window. The vertical component is shown above for comparison. In the 0 plot the portions of heavy line represent angles that have some significance, based on a combination of criteria such as high p, low variability in p or 0, and the existence of isolated or pronounced peaks in p going with plateaus in 0. It is now easy to pick out possible arrivals of both types P and S V . Since the time axes are adjusted so that O(t) is a function of the time interval (t -- 1) to t, most arrivals appear delayed about 1 second in p and 0. Tentative picks can be made without any recourse to travel-time information or records from other stations: Pg at 11.1 see., S~ at 30 sec., So at 56 seconds. Further analysis of the angles involved requires that correction
PROCESSING OF SEISMIC DATA 561
for the different response functions of the two components be made, and that the effect of crustal layering be included (Haskell, 1962). Preliminary work of the same kind with the x-y axes indicates that several laterally refracted waves can be picked out without ambiguity.
Certain limitations of these rectilinear orbital functions are evident. When two waves of different phase and polarization overlap, the correlation may be very low and the angle meaningless. A probable example of this is the "hole" in the S,, wave at 32 see. Between 48 seconds and 64 seconds the increased complexity of the p, 0 plots suggests that too many phases are arriving to make a complete separation by this particular method. It might be profitable to inspect this interval instead in terms of orbital ellipses. Many important types of elliptically polarized waves with low eccentricity are not picked up by a rectilinear detector. By a natural extension of the rectilinear version we may attempt to minimize the orthogonal distances between the data and an ellipse of three parameters. We may, in contrast, look at some integrated relation between y and z as a function of time. The former method throws away certain information, but is not bothered by aliasing. The latte r requires good guesses or estimates of the signal spectra, but can be much more fifformative.
CO NCLIJSIONS
The combination of a high-speed automatic digital seismometer and a magnetic- tape data library system promises to permit more detailed and searching analysis of seismograms than has been hitherto possible. The system represents a substantial improvement in dynamic range, frequency passband, accuracy, reproducibility, flexibility, and speed over any previous routine seismic data collection system. It will now be possible to utilize more fully the three-component nature of the signal and to automatically compensate for the response of the instruments.
ACKNOWLEDGMENTS
Mr. Saul Shragowitz is responsible for much of the programming for the 7090. Mr. John Nordquist has supervised preliminary processing and editing of the source tapes.
This research was supported by Grant AF-AFOSR-25-63 of the Air Force Office of Scientific Research as part of the Advanced Research Projects Agency project Vela.
BIBLIOGRAPHY
Benioff, It., B. Gutenberg, and C. F. Richter 1950. "Progress Report, Seismological Laboratory, California Institute of Technology,
1949," Trans. AGU, 31: 463. Bogert, B. P.
1961. "Seismic Data Collection, Reduction and Digitization," Bull. Seism. Soc. Am., 51: 515-525.
De Bremaecker, J. Cl., P. Donoho, and J. H. Michel 1962. "A Direct Digitizing Seismograph," Bull. Seism. Soc. Am,, 52: 661-672.
Gutenberg, B. 1952. "SV and SH," Trans. AGU, 33: 573-584.
Haskell, N. A., 1962. "Crustal Reflection of Plane P and SV Waves," Jour. Geophys. Res., 67: 4751-
4768.
5 6 2 BULLETIN OF THE SEISMOLOGICAL SOCIETY OF AMERICA
Haubrich, R. A., and H. M. Iyer 1962. "Digital Seismograph System for Measuring Earth Noise," Bull: Seism. Soc. Am.~
52: 87-93. Miller, W. F.
1963. "The Caltech Digital Seismometer" J. Geophys. Res., 68: 841-847. Simpson, S. M.
1961. "Initial Studies on Underground Nuclear Detection With Seismic Data Prepared by a Novel Digitization System; Annual Report No. 1," Contract AF-19 (604) 7378.