Bureau of Economic AnalysisTable 1.1.1. Percent Change From Preceding Period in Real Gross Domestic Product[Percent] Seasonally adjusted at annual ratesLast Revised on: September 28, 2017 - Next Release Date October 27, 2017
23 Federal -0.01 0.00 -0.06 0.11 -0.03 -0.16 0.13 24 National defense -0.09 -0.03 -0.08 0.10 -0.13 -0.13 0.18 25 Nondefense 0.09 0.03 0.02 0.01 0.10 -0.03 -0.05 26 State and local 0.26 0.13 -0.11 -0.02 0.06 0.05 -0.16
Bureau of Economic AnalysisTable 1.1.2. Contributions to Percent Change in Real Gross Domestic ProductSeasonally adjusted at annual ratesLast Revised on: September 28, 2017 - Next Release Date October 27, 2017
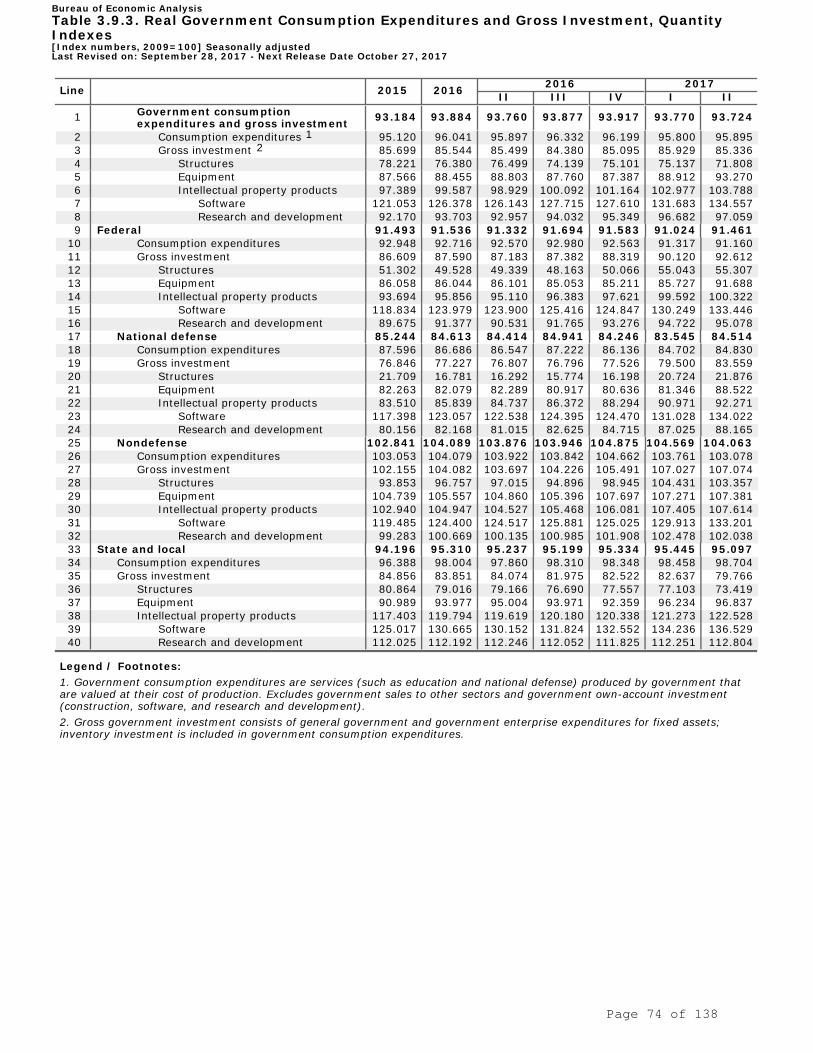
23 Federal 91.493 91.536 91.332 91.694 91.583 91.024 91.461 24 National defense 85.244 84.613 84.414 84.941 84.246 83.545 84.514 25 Nondefense 102.841 104.089 103.876 103.946 104.875 104.569 104.063 26 State and local 94.196 95.310 95.237 95.199 95.334 95.445 95.097
Bureau of Economic AnalysisTable 1.1.3. Real Gross Domestic Product, Quantity Indexes[Index numbers, 2009=100] Seasonally adjustedLast Revised on: September 28, 2017 - Next Release Date October 27, 2017
23 Federal 109.866 110.488 110.438 110.571 110.782 112.266 112.763 24 National defense 108.872 109.285 109.235 109.368 109.562 110.882 111.280 25 Nondefense 111.511 112.448 112.397 112.532 112.768 114.494 115.139 26 State and local 113.168 114.164 114.083 114.506 114.979 116.220 116.664
Bureau of Economic AnalysisTable 1.1.4. Price Indexes for Gross Domestic Product[Index numbers, 2009=100] Seasonally adjustedLast Revised on: September 28, 2017 - Next Release Date October 27, 2017
23 Federal 1,224.0 1,231.5 1,228.2 1,234.6 1,235.4 1,244.3 1,255.8 24 National defense 731.6 728.9 726.9 732.3 727.6 730.2 741.4 25 Nondefense 492.4 502.6 501.3 502.3 507.8 514.1 514.5 26 State and local 1,994.9 2,036.3 2,033.3 2,040.0 2,051.4 2,075.9 2,076.2
Bureau of Economic AnalysisTable 1.1.5. Gross Domestic Product[Billions of dollars] Seasonally adjusted at annual ratesLast Revised on: September 28, 2017 - Next Release Date October 27, 2017
23 Federal 1,114.1 1,114.6 1,112.1 1,116.5 1,115.2 1,108.4 1,113.7 24 National defense 672.0 667.0 665.4 669.6 664.1 658.6 666.2 25 Nondefense 441.6 447.0 446.1 446.4 450.3 449.0 446.9 26 State and local 1,762.8 1,783.6 1,782.3 1,781.6 1,784.1 1,786.2 1,779.6 27 Residual -44.8 -49.8 -48.2 -54.2 -55.2 -54.0 -63.5
Legend / Footnotes:Note. Chained (2009) dollar series are calculated as the product of the chain-type quantity index and the 2009 current-dollar value of the corresponding series, divided by100. Because the formula for the chain-type quantity indexes uses weights of more than one period, the corresponding chained-dollar estimates are usually not additive.The residual line is the difference between the first line and the sum of the most detailed lines.
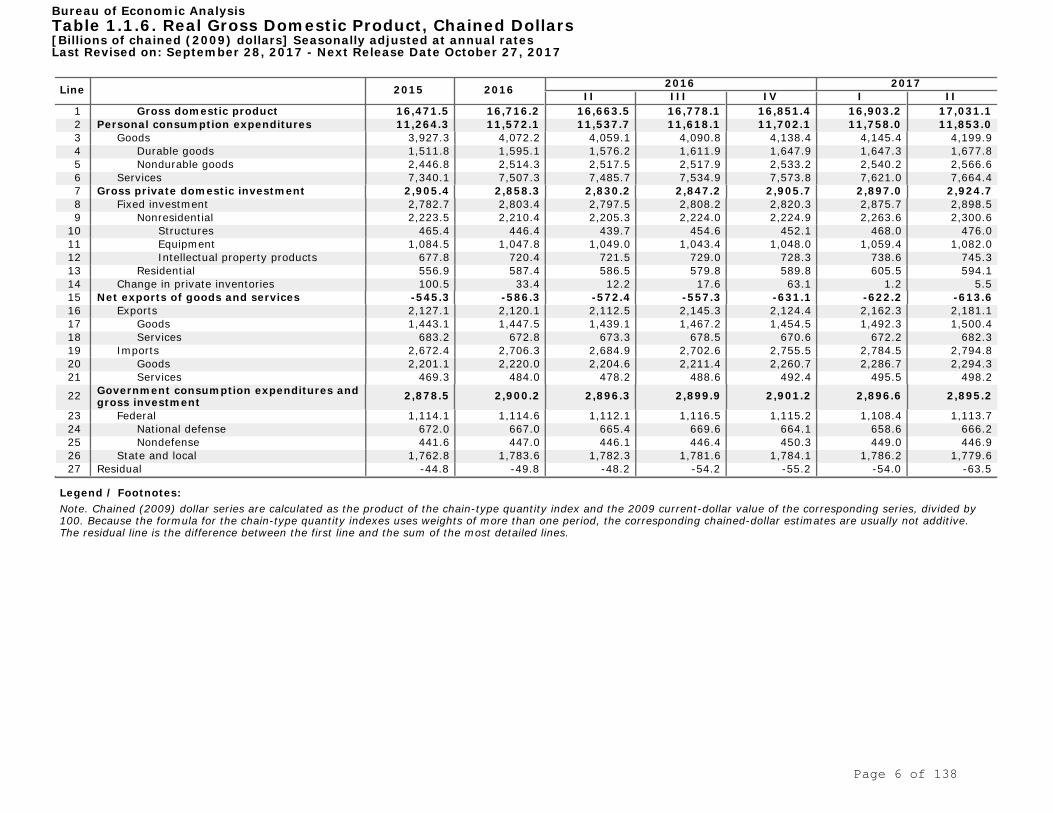
Bureau of Economic AnalysisTable 1.1.6. Real Gross Domestic Product, Chained Dollars[Billions of chained (2009) dollars] Seasonally adjusted at annual ratesLast Revised on: September 28, 2017 - Next Release Date October 27, 2017
Legend / Footnotes:1. The percent change for this series is calculated from the implicit price deflator in NIPA table 1.1.9.
Bureau of Economic AnalysisTable 1.1.7. Percent Change From Preceding Period in Prices for Gross Domestic Product[Percent] Seasonally adjusted at annual ratesLast Revised on: September 28, 2017 - Next Release Date October 27, 2017
23 Federal 0.04 0.04 0.07 0.03 0.05 0.35 0.12 24 National defense 0.01 0.02 0.04 0.02 0.03 0.18 0.06 25 Nondefense 0.03 0.02 0.03 0.01 0.02 0.16 0.06 26 State and local 0.06 0.10 0.39 0.16 0.18 0.47 0.17
Bureau of Economic AnalysisTable 1.1.8. Contributions to Percent Change in the Gross Domestic Product Price IndexSeasonally adjusted at annual ratesLast Revised on: September 28, 2017 - Next Release Date October 27, 2017
Bureau of Economic AnalysisTable 1.1.9. Implicit Price Deflators for Gross Domestic Product[Index numbers, 2009=100] Seasonally adjustedLast Revised on: September 28, 2017 - Next Release Date October 27, 2017
23 Federal 6.8 6.6 6.6 6.6 6.5 6.5 6.5 24 National defense 4.0 3.9 3.9 3.9 3.8 3.8 3.9 25 Nondefense 2.7 2.7 2.7 2.7 2.7 2.7 2.7 26 State and local 11.0 10.9 11.0 10.9 10.9 10.9 10.8
Bureau of Economic AnalysisTable 1.1.10. Percentage Shares of Gross Domestic Product[Percent]Last Revised on: September 28, 2017 - Next Release Date October 27, 2017
36 Gross domestic purchases excluding foodand energy 3
1.3 1.4 1.5 1.8 1.7
37 Gross domestic product 1.2 1.2 1.5 2.0 1.6
38 Gross domestic product excluding foodand energy 1
1.5 1.6 1.7 2.0 1.8
39 Personal consumption expenditures 1.0 1.2 1.6 2.0 1.6
40 Personal consumption expendituresexcluding food and energy 3
1.7 1.8 1.9 1.8 1.5
41 Market-based PCE 4 0.6 0.7 1.3 1.8 1.3
42 Market-based PCE excluding food andenergy 4
1.4 1.5 1.5 1.5 1.2
Legend / Footnotes:1. Final sales to domestic purchasers less government consumption expenditures and gross investment. 2. The arithmetic average of gross domestic product and of gross domestic income, deflated by the implicit price deflator forGDP. 3. Food excludes personal consumption expenditures for purchased meals and beverages, which are classified in food services. 4. Market-based PCE is a supplemental measure that is based on household expenditures for which there are observable pricemeasures. It excludes most imputed transactions (for example, financial services furnished without payment) and the finalconsumption expenditures of nonprofit institutions serving households. Note. Percent changes for real estimates are calculated from corresponding quantity indexes presented in NIPA tables 1.1.3,1.2.3, 1.4.3, and 1.7.3. Percent changes in price estimates are calculated from corresponding price indexes presented in NIPAtables 1.1.4, 1.6.4, and 2.3.4.
Bureau of Economic AnalysisTable 1.1.11. Real Gross Domestic Product: Percent Change From Quarter One Year Ago[Percent]Last Revised on: September 28, 2017 - Next Release Date October 27, 2017
22 Final sales of domestic product, currentdollars 3.8 3.2 5.4 4.1 2.7 4.8 4.0
Legend / Footnotes:1. Prior to 1959, inventories held by construction establishments are included in nondurable goods. Beginning with 1959, these inventories are included in durable goods.Estimates for durable goods and nondurable goods for 1996 and earlier periods are based on the 1987 Standard Industrial Classification (SIC); later estimates for theseindustries are based on the North American Industry Classification System (NAICS). 2. Includes government consumption expenditures, which are for services (such as education and national defense) produced by government. In current dollars, theseservices are valued at their cost of production. 3. Some components of final sales of computers include computer parts.
Bureau of Economic AnalysisTable 1.2.1. Percent Change From Preceding Period in Real Gross Domestic Product by Major Type of Product[Percent] Seasonally adjusted at annual ratesLast Revised on: September 28, 2017 - Next Release Date October 27, 2017
Legend / Footnotes:1. Prior to 1959, inventories held by construction establishments are included in nondurable goods. Beginning with 1959, these inventories are included in durable goods.Estimates for durable goods and nondurable goods for 1996 and earlier periods are based on the 1987 Standard Industrial Classification (SIC); later estimates for theseindustries are based on the North American Industry Classification System (NAICS). 2. Includes government consumption expenditures, which are for services (such as education and national defense) produced by government. In current dollars, theseservices are valued at their cost of production. 3. Some components of final sales of computers include computer parts.
Bureau of Economic AnalysisTable 1.2.2. Contributions to Percent Change in Real Gross Domestic Product by Major Type of ProductSeasonally adjusted at annual ratesLast Revised on: September 28, 2017 - Next Release Date October 27, 2017
Legend / Footnotes:1. Prior to 1959, inventories held by construction establishments are included in nondurable goods. Beginning with 1959, these inventories are included in durable goods.Estimates for durable goods and nondurable goods for 1996 and earlier periods are based on the 1987 Standard Industrial Classification (SIC); later estimates for theseindustries are based on the North American Industry Classification System (NAICS). 2. Includes government consumption expenditures, which are for services (such as education and national defense) produced by government. In current dollars, theseservices are valued at their cost of production. 3. Some components of final sales of computers include computer parts.
Bureau of Economic AnalysisTable 1.2.3. Real Gross Domestic Product by Major Type of Product, Quantity Indexes[Index numbers, 2009=100] Seasonally adjustedLast Revised on: September 28, 2017 - Next Release Date October 27, 2017
Legend / Footnotes:1. Prior to 1959, inventories held by construction establishments are included in nondurable goods. Beginning with 1959, these inventories are included in durable goods.Estimates for durable goods and nondurable goods for 1996 and earlier periods are based on the 1987 Standard Industrial Classification (SIC); later estimates for theseindustries are based on the North American Industry Classification System (NAICS). 2. Includes government consumption expenditures, which are for services (such as education and national defense) produced by government. In current dollars, theseservices are valued at their cost of production. 3. Some components of final sales of computers include computer parts.
Bureau of Economic AnalysisTable 1.2.4. Price Indexes for Gross Domestic Product by Major Type of Product[Index numbers, 2009=100] Seasonally adjustedLast Revised on: September 28, 2017 - Next Release Date October 27, 2017
Legend / Footnotes:1. Prior to 1959, inventories held by construction establishments are included in nondurable goods. Beginning with 1959, these inventories are included in durable goods.Estimates for durable goods and nondurable goods for 1996 and earlier periods are based on the 1987 Standard Industrial Classification (SIC); later estimates for theseindustries are based on the North American Industry Classification System (NAICS). 2. Includes government consumption expenditures, which are for services (such as education and national defense) produced by government. In current dollars, theseservices are valued at their cost of production. 3. Some components of final sales of computers include computer parts.
Bureau of Economic AnalysisTable 1.2.5. Gross Domestic Product by Major Type of Product[Billions of dollars] Seasonally adjusted at annual ratesLast Revised on: September 28, 2017 - Next Release Date October 27, 2017
Legend / Footnotes:1. Prior to 1959, inventories held by construction establishments are included in nondurable goods. Beginning with 1959, these inventories are included in durable goods.Estimates for durable goods and nondurable goods for 1996 and earlier periods are based on the 1987 Standard Industrial Classification (SIC); later estimates for theseindustries are based on the North American Industry Classification System (NAICS). 2. Includes government consumption expenditures, which are for services (such as education and national defense) produced by government. In current dollars, theseservices are valued at their cost of production. 3. Some components of final sales of computers include computer parts. Note. Chained (2009) dollar series are calculated as the product of the chain-type quantity index and the 2009 current-dollar value of the corresponding series, divided by100. Because the formula for the chain-type quantity indexes uses weights of more than one period, the corresponding chained-dollar estimates are usually not additive.The residual line following change in private inventories is the difference between gross domestic product and the sum of final sales of domestic product and of change inprivate inventories; the residual line following structures is the difference between gross domestic product and the sum of the detailed lines of goods, of services, and ofstructures.
Bureau of Economic AnalysisTable 1.2.6. Real Gross Domestic Product by Major Type of Product, Chained Dollars[Billions of chained (2009) dollars] Seasonally adjusted at annual ratesLast Revised on: September 28, 2017 - Next Release Date October 27, 2017
Legend / Footnotes:1. Equals gross domestic product excluding gross value added of households and institutions and of general government. 2. Equals gross domestic business value added excluding gross farm value added. 3. Equals compensation of employees of nonprofit institutions, the rental value of nonresidential fixed assets owned and used by nonprofit institutions serving households,and rental income of persons for tenant-occupied housing owned by nonprofit institutions. 4. Equals compensation of general government employees plus general government consumption of fixed capital.
Bureau of Economic AnalysisTable 1.3.1. Percent Change From Preceding Period in Real Gross Value Added by Sector[Percent] Seasonally adjusted at annual ratesLast Revised on: September 28, 2017 - Next Release Date October 27, 2017
Legend / Footnotes:1. Equals gross domestic product excluding gross value added of households and institutions and of general government. 2. Equals gross domestic business value added excluding gross farm value added. 3. Equals compensation of employees of nonprofit institutions, the rental value of nonresidential fixed assets owned and used by nonprofit institutions serving households,and rental income of persons for tenant-occupied housing owned by nonprofit institutions. 4. Equals compensation of general government employees plus general government consumption of fixed capital.
Bureau of Economic AnalysisTable 1.3.3. Real Gross Value Added by Sector, Quantity Indexes[Index numbers, 2009=100] Seasonally adjustedLast Revised on: September 28, 2017 - Next Release Date October 27, 2017
Legend / Footnotes:1. Equals gross domestic product excluding gross value added of households and institutions and of general government. 2. Equals gross domestic business value added excluding gross farm value added. 3. Equals compensation of employees of nonprofit institutions, the rental value of nonresidential fixed assets owned and used by nonprofit institutions serving households,and rental income of persons for tenant-occupied housing owned by nonprofit institutions. 4. Equals compensation of general government employees plus general government consumption of fixed capital.
Bureau of Economic AnalysisTable 1.3.4. Price Indexes for Gross Value Added by Sector[Index numbers, 2009=100] Seasonally adjustedLast Revised on: September 28, 2017 - Next Release Date October 27, 2017
Legend / Footnotes:1. Equals gross domestic product excluding gross value added of households and institutions and of general government. 2. Equals gross domestic business value added excluding gross farm value added. 3. Equals compensation of employees of nonprofit institutions, the rental value of nonresidential fixed assets owned and used by nonprofit institutions serving households,and rental income of persons for tenant-occupied housing owned by nonprofit institutions. 4. Equals compensation of general government employees plus general government consumption of fixed capital.
Bureau of Economic AnalysisTable 1.3.5. Gross Value Added by Sector[Billions of dollars] Seasonally adjusted at annual ratesLast Revised on: September 28, 2017 - Next Release Date October 27, 2017
Legend / Footnotes:1. Equals gross domestic product excluding gross value added of households and institutions and of general government. 2. Equals gross domestic business value added excluding gross farm value added. 3. Equals compensation of employees of nonprofit institutions, the rental value of nonresidential fixed assets owned and used by nonprofit institutions serving households,and rental income of persons for tenant-occupied housing owned by nonprofit institutions. 4. Equals compensation of general government employees plus general government consumption of fixed capital. Note. Chained (2009) dollar series are calculated as the product of the chain-type quantity index and the 2009 current-dollar value of the corresponding series, divided by100. Because the formula for the chain-type quantity indexes uses weights of more than one period, the corresponding chained-dollar estimates are usually not additive.The residual line is the difference between the first line and the sum of the most detailed lines.
Bureau of Economic AnalysisTable 1.3.6. Real Gross Value Added by Sector, Chained Dollars[Billions of chained (2009) dollars] Seasonally adjusted at annual ratesLast Revised on: September 28, 2017 - Next Release Date October 27, 2017
Page 22 of 138
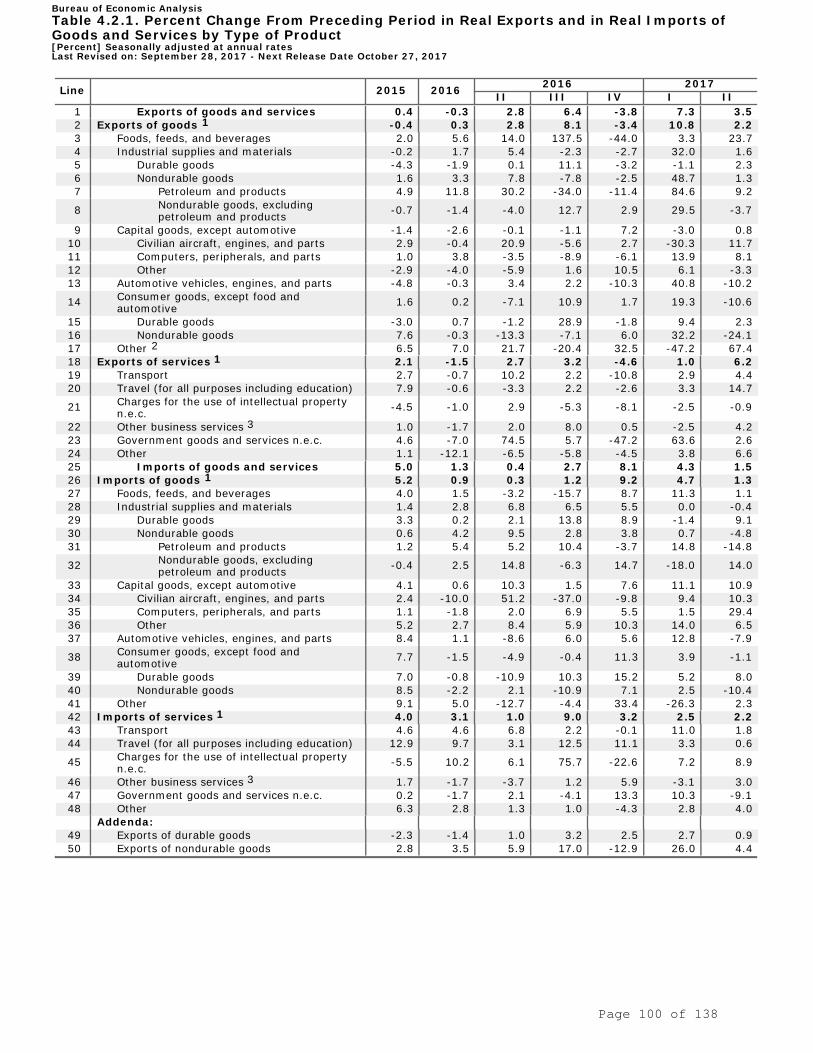
Line 2015 2016 2016 2017 II III IV I II
1 Gross domestic product 2.9 1.5 2.2 2.8 1.8 1.2 3.1 2 Less: Exports of goods and services 0.4 -0.3 2.8 6.4 -3.8 7.3 3.5 3 Plus: Imports of goods and services 5.0 1.3 0.4 2.7 8.1 4.3 1.5 4 Equals: Gross domestic purchases 3.5 1.7 1.9 2.4 3.3 1.0 2.8 5 Less: Change in private inventories --- --- --- --- --- --- --- 6 Equals: Final sales to domestic purchasers 3.3 2.1 2.6 2.2 2.3 2.4 2.7 Addenda: 7 Final sales of domestic product 2.6 1.9 2.9 2.6 0.7 2.7 2.9 8 Final sales to private domestic purchasers 1 3.7 2.3 3.3 2.6 2.7 3.1 3.3 9 Gross domestic purchases, current dollars 3.9 2.7 4.1 3.9 5.3 3.6 3.6
10 Final sales to domestic purchasers, currentdollars 3.8 3.1 4.7 3.8 4.1 5.0 3.5
11 Final sales to private domestic purchasers,current dollars 1
4.2 3.5 5.4 4.3 4.7 5.2 4.0
Legend / Footnotes:1. Final sales to domestic purchasers less government consumption expenditures and gross investment.
Bureau of Economic AnalysisTable 1.4.1. Percent Change From Preceding Period in Real Gross Domestic Product, Real Gross Domestic Purchases, and RealFinal Sales to Domestic Purchasers[Percent] Seasonally adjusted at annual ratesLast Revised on: September 28, 2017 - Next Release Date October 27, 2017
Page 23 of 138
Line 2015 2016 2016 2017 II III IV I II
1 Gross domestic product 114.237 115.934 115.568 116.363 116.872 117.231 118.118 2 Less: Exports of goods and services 133.967 133.527 133.051 135.115 133.799 136.187 137.374 3 Plus: Imports of goods and services 134.751 136.463 135.384 136.275 138.942 140.407 140.924 4 Equals: Gross domestic purchases 114.871 116.791 116.349 117.028 117.986 118.276 119.087 5 Less: Change in private inventories --- --- --- --- --- --- --- 6 Equals: Final sales to domestic purchasers 112.957 115.296 115.001 115.632 116.281 116.983 117.756 Addenda: 7 Final sales of domestic product 112.275 114.402 114.185 114.930 115.129 115.908 116.753 8 Final sales to private domestic purchasers 1 118.199 120.973 120.633 121.401 122.212 123.140 124.130
Legend / Footnotes:1. Final sales to domestic purchasers less government consumption expenditures and gross investment.
Bureau of Economic AnalysisTable 1.4.3. Real Gross Domestic Product, Real Gross Domestic Purchases, and Real Final Sales to Domestic Purchasers,Quantity Indexes[Index numbers, 2009=100] Seasonally adjustedLast Revised on: September 28, 2017 - Next Release Date October 27, 2017
Page 24 of 138
Line 2015 2016 2016 2017 II III IV I II
1 Gross domestic product 110.012 111.419 111.257 111.641 112.190 112.752 113.037 2 Less: Exports of goods and services 106.481 104.458 104.233 104.813 105.516 106.168 106.136 3 Plus: Imports of goods and services 104.364 101.090 100.693 101.439 101.835 103.381 103.134 4 Equals: Gross domestic purchases 109.564 110.661 110.470 110.887 111.393 112.100 112.340 5 Less: Change in private inventories --- --- --- --- --- --- --- 6 Equals: Final sales to domestic purchasers 109.659 110.785 110.588 111.015 111.515 112.219 112.458 Addenda: 7 Final sales of domestic product 110.116 111.554 111.386 111.781 112.324 112.883 113.166 8 Final sales to private domestic purchasers 1 109.125 110.305 110.084 110.533 111.059 111.636 111.830
9 Implicit price deflator for final sales todomestic purchasers 109.659 110.785 110.585 111.011 111.511 112.215 112.454
Legend / Footnotes:1. Final sales to domestic purchasers less government consumption expenditures and gross investment.
Bureau of Economic AnalysisTable 1.4.4. Price Indexes for Gross Domestic Product, Gross Domestic Purchases, and Final Sales to Domestic Purchasers[Index numbers, 2009=100] Seasonally adjustedLast Revised on: September 28, 2017 - Next Release Date October 27, 2017
Page 25 of 138
Line 2015 2016 2016 2017 II III IV I II
1 Gross domestic product 18,120.7 18,624.5 18,538.0 18,729.1 18,905.5 19,057.7 19,250.0 2 Less: Exports of goods and services 2,264.9 2,214.6 2,201.8 2,248.4 2,241.5 2,295.6 2,314.9 3 Plus: Imports of goods and services 2,789.0 2,735.8 2,703.4 2,741.3 2,805.8 2,878.4 2,882.1 4 Equals: Gross domestic purchases 18,644.8 19,145.7 19,039.6 19,222.0 19,469.9 19,640.5 19,817.2 5 Less: Change in private inventories 111.9 35.1 12.2 16.5 69.5 -0.1 4.9 6 Equals: Final sales to domestic purchasers 18,532.8 19,110.6 19,027.4 19,205.5 19,400.4 19,640.7 19,812.4 Addenda: 7 Final sales of domestic product 18,008.8 18,589.4 18,525.9 18,712.7 18,836.1 19,057.8 19,245.2 8 Final sales to private domestic purchasers 1 15,313.9 15,842.8 15,765.9 15,930.9 16,113.6 16,320.4 16,480.3
Legend / Footnotes:1. Final sales to domestic purchasers less government consumption expenditures and gross investment.
Bureau of Economic AnalysisTable 1.4.5. Relation of Gross Domestic Product, Gross Domestic Purchases, and Final Sales to Domestic Purchasers[Billions of dollars] Seasonally adjusted at annual ratesLast Revised on: September 28, 2017 - Next Release Date October 27, 2017
Page 26 of 138
Line 2015 2016 2016 2017 II III IV I II
1 Gross domestic product 16,471.5 16,716.2 16,663.5 16,778.1 16,851.4 16,903.2 17,031.1 2 Less: Exports of goods and services 2,127.1 2,120.1 2,112.5 2,145.3 2,124.4 2,162.3 2,181.1 3 Plus: Imports of goods and services 2,672.4 2,706.3 2,684.9 2,702.6 2,755.5 2,784.5 2,794.8 4 Equals: Gross domestic purchases 17,017.2 17,301.6 17,236.2 17,336.7 17,478.6 17,521.6 17,641.8 5 Less: Change in private inventories 100.5 33.4 12.2 17.6 63.1 1.2 5.5 6 Equals: Final sales to domestic purchasers 16,900.4 17,250.3 17,206.1 17,300.6 17,397.7 17,502.7 17,618.3 Addenda: 7 Final sales of domestic product 16,354.3 16,664.1 16,632.6 16,741.1 16,770.0 16,883.5 17,006.6 8 Final sales to private domestic purchasers 1 14,033.4 14,362.7 14,322.3 14,413.5 14,509.8 14,619.9 14,737.6
Legend / Footnotes:1. Final sales to domestic purchasers less government consumption expenditures and gross investment. Note. Chained (2009) dollar series are calculated as the product of the chain-type quantity index and the 2009 current-dollar value of the corresponding series, divided by100. Because the formula for the chain-type quantity indexes uses weights of more than one period, the corresponding chained-dollar estimates are usually not additive.
Bureau of Economic AnalysisTable 1.4.6. Relation of Real Gross Domestic Product, Real Gross Domestic Purchases, and Real Final Sales to DomesticPurchasers, Chained Dollars[Billions of chained (2009) dollars] Seasonally adjusted at annual ratesLast Revised on: September 28, 2017 - Next Release Date October 27, 2017
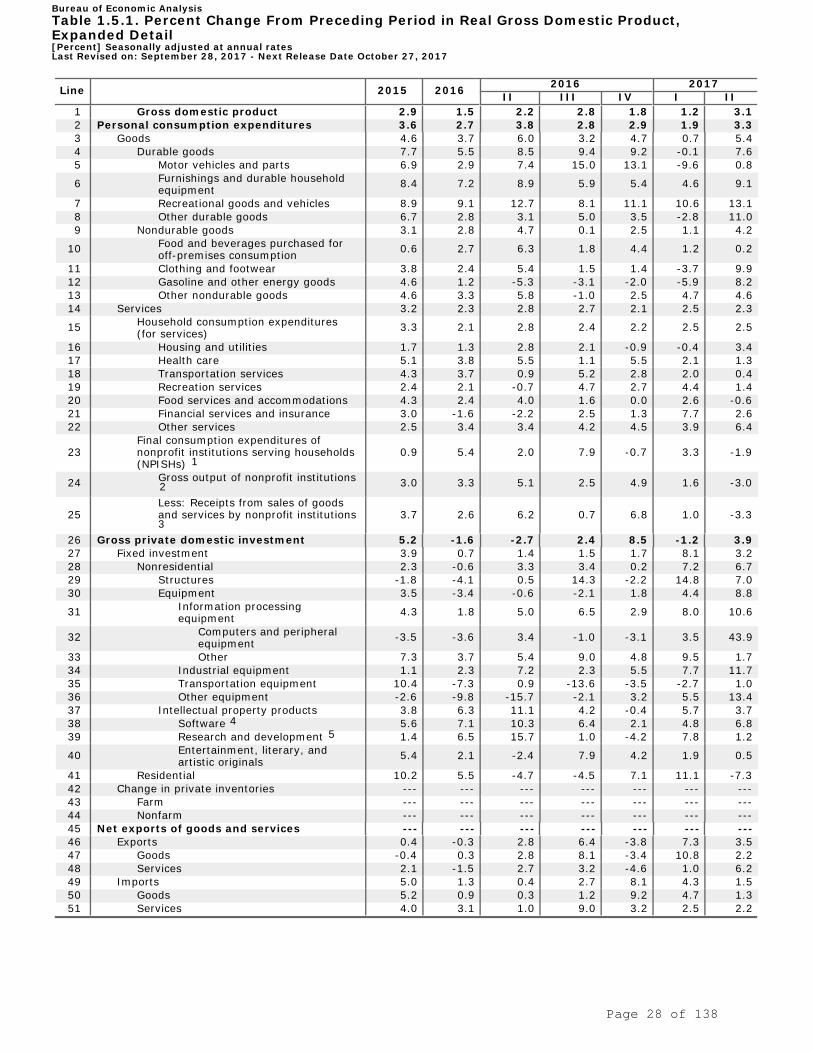
Bureau of Economic AnalysisTable 1.5.1. Percent Change From Preceding Period in Real Gross Domestic Product,Expanded Detail[Percent] Seasonally adjusted at annual ratesLast Revised on: September 28, 2017 - Next Release Date October 27, 2017
Legend / Footnotes:1. Net expenses of NPISHs, defined as their gross operating expenses less primary sales to households. 2. Gross output is net of unrelated sales, secondary sales, and sales to business, to government, and to the rest of the world;excludes own-account investment (construction and software). 3. Excludes unrelated sales, secondary sales, and sales to business, to government, and to the rest of the world; includesmembership dues and fees. 4. Excludes software embedded, or bundled, in computers and other equipment. 5. Research and development investment excludes expenditures for software development. Software developmentexpenditures are included in software investment on line 38.
Bureau of Economic AnalysisTable 1.5.1. Percent Change From Preceding Period in Real Gross Domestic Product,Expanded Detail[Percent] Seasonally adjusted at annual ratesLast Revised on: September 28, 2017 - Next Release Date October 27, 2017
Bureau of Economic AnalysisTable 1.5.2. Contributions to Percent Change in Real Gross Domestic Product, Expanded DetailSeasonally adjusted at annual ratesLast Revised on: September 28, 2017 - Next Release Date October 27, 2017
Legend / Footnotes:1. Net expenses of NPISHs, defined as their gross operating expenses less primary sales to households. 2. Gross output is net of unrelated sales, secondary sales, and sales to business, to government, and to the rest of the world;excludes own-account investment (construction and software). 3. Excludes unrelated sales, secondary sales, and sales to business, to government, and to the rest of the world; includesmembership dues and fees. 4. Excludes software embedded, or bundled, in computers and other equipment. 5. Research and development investment excludes expenditures for software development. Software developmentexpenditures are included in software investment on line 38.
Bureau of Economic AnalysisTable 1.5.2. Contributions to Percent Change in Real Gross Domestic Product, Expanded DetailSeasonally adjusted at annual ratesLast Revised on: September 28, 2017 - Next Release Date October 27, 2017
Bureau of Economic AnalysisTable 1.5.3. Real Gross Domestic Product, Expanded Detail, Quantity Indexes[Index numbers, 2009=100] Seasonally adjustedLast Revised on: September 28, 2017 - Next Release Date October 27, 2017
Legend / Footnotes:1. Net expenses of NPISHs, defined as their gross operating expenses less primary sales to households. 2. Gross output is net of unrelated sales, secondary sales, and sales to business, to government, and to the rest of the world;excludes own-account investment (construction and software). 3. Excludes unrelated sales, secondary sales, and sales to business, to government, and to the rest of the world; includesmembership dues and fees. 4. Excludes software embedded, or bundled, in computers and other equipment. 5. Research and development investment excludes expenditures for software development. Software developmentexpenditures are included in software investment on line 38.
Bureau of Economic AnalysisTable 1.5.3. Real Gross Domestic Product, Expanded Detail, Quantity Indexes[Index numbers, 2009=100] Seasonally adjustedLast Revised on: September 28, 2017 - Next Release Date October 27, 2017
Bureau of Economic AnalysisTable 1.5.4. Price Indexes for Gross Domestic Product, Expanded Detail[Index numbers, 2009=100] Seasonally adjustedLast Revised on: September 28, 2017 - Next Release Date October 27, 2017
Legend / Footnotes:1. Net expenses of NPISHs, defined as their gross operating expenses less primary sales to households. 2. Gross output is net of unrelated sales, secondary sales, and sales to business, to government, and to the rest of the world;excludes own-account investment (construction and software). 3. Excludes unrelated sales, secondary sales, and sales to business, to government, and to the rest of the world; includesmembership dues and fees. 4. Excludes software embedded, or bundled, in computers and other equipment. 5. Research and development investment excludes expenditures for software development. Software developmentexpenditures are included in software investment on line 38.
Bureau of Economic AnalysisTable 1.5.4. Price Indexes for Gross Domestic Product, Expanded Detail[Index numbers, 2009=100] Seasonally adjustedLast Revised on: September 28, 2017 - Next Release Date October 27, 2017
Bureau of Economic AnalysisTable 1.5.5. Gross Domestic Product, Expanded Detail[Billions of dollars] Seasonally adjusted at annual ratesLast Revised on: September 28, 2017 - Next Release Date October 27, 2017
Legend / Footnotes:1. Net expenses of NPISHs, defined as their gross operating expenses less primary sales to households. 2. Gross output is net of unrelated sales, secondary sales, and sales to business, to government, and to the rest of the world; excludesown-account investment (construction and software). 3. Excludes unrelated sales, secondary sales, and sales to business, to government, and to the rest of the world; includes membership dues andfees. 4. Excludes software embedded, or bundled, in computers and other equipment. 5. Research and development investment excludes expenditures for software development. Software development expenditures are included insoftware investment on line 38.
Bureau of Economic AnalysisTable 1.5.5. Gross Domestic Product, Expanded Detail[Billions of dollars] Seasonally adjusted at annual ratesLast Revised on: September 28, 2017 - Next Release Date October 27, 2017
Bureau of Economic AnalysisTable 1.5.6. Real Gross Domestic Product, Expanded Detail, Chained Dollars[Billions of chained (2009) dollars] Seasonally adjusted at annual ratesLast Revised on: September 28, 2017 - Next Release Date October 27, 2017
Legend / Footnotes:1. Net expenses of NPISHs, defined as their gross operating expenses less primary sales to households. 2. Gross output is net of unrelated sales, secondary sales, and sales to business, to government, and to the rest of the world; excludesown-account investment (construction and software). 3. Excludes unrelated sales, secondary sales, and sales to business, to government, and to the rest of the world; includes membership dues andfees. 4. The quantity index for computers can be used to accurately measure the real growth of this component. However, because computers exhibitrapid changes in prices relative to other prices in the economy, the chained-dollar estimates should not be used to measure the component'srelative importance or its contribution to the growth rate of more aggregate series; accurate estimates of these contributions are shown in table1.5.2 and real growth rates are shown in table 1.5.1. 5. Excludes software embedded, or bundled, in computers and other equipment. 6. Research and development investment excludes expenditures for software development. Software development expenditures are included insoftware investment on line 38. Note. The residual line is the difference between the first line and the sum of the most detailed lines.
Bureau of Economic AnalysisTable 1.5.6. Real Gross Domestic Product, Expanded Detail, Chained Dollars[Billions of chained (2009) dollars] Seasonally adjusted at annual ratesLast Revised on: September 28, 2017 - Next Release Date October 27, 2017
Bureau of Economic AnalysisTable 1.6.4. Price Indexes for Gross Domestic Purchases[Index numbers, 2009=100] Seasonally adjustedLast Revised on: September 28, 2017 - Next Release Date October 27, 2017
Legend / Footnotes:1. Excludes software embedded, or bundled, in computers and other equipment. 2. Some components of final sales of computers include computer parts. 3. Food excludes personal consumption expenditures for purchased meals and beverages, which are classified in food services.
Bureau of Economic AnalysisTable 1.6.4. Price Indexes for Gross Domestic Purchases[Index numbers, 2009=100] Seasonally adjustedLast Revised on: September 28, 2017 - Next Release Date October 27, 2017
Bureau of Economic AnalysisTable 1.6.7. Percent Change From Preceding Period in Prices for Gross Domestic Purchases[Percent] Seasonally adjusted at annual ratesLast Revised on: September 28, 2017 - Next Release Date October 27, 2017
63 Gross domestic product excludingfood and energy 1.3 1.6 2.2 1.9 1.6 2.4 1.1
64 Final sales of domestic product 1.1 1.3 2.4 1.4 2.0 2.0 1.0 65 Final sales to domestic purchasers 0.5 1.0 2.1 1.6 1.8 2.5 0.9 66 Final sales to private domestic purchasers 0.4 1.1 2.0 1.6 1.9 2.1 0.7
67 Implicit price deflator for gross domesticpurchases 4
0.4 1.0 2.1 1.5 1.9 2.5 0.8
Legend / Footnotes:1. Excludes software embedded, or bundled, in computers and other equipment. 2. Some components of final sales of computers include computer parts. 3. Food excludes personal consumption expenditures for purchased meals and beverages, which are classified in food services. 4. The percent change for this series is calculated from the implicit price deflator in NIPA table 1.6.4.
Bureau of Economic AnalysisTable 1.6.7. Percent Change From Preceding Period in Prices for Gross Domestic Purchases[Percent] Seasonally adjusted at annual ratesLast Revised on: September 28, 2017 - Next Release Date October 27, 2017
Bureau of Economic AnalysisTable 1.6.8. Contributions to Percent Change in the Gross Domestic Purchases Price IndexSeasonally adjusted at annual ratesLast Revised on: September 28, 2017 - Next Release Date October 27, 2017
Legend / Footnotes:1. Excludes software embedded, or bundled, in computers and other equipment. 2. Some components of final sales of computers include computer parts. 3. Food excludes personal consumption expenditures for purchased meals and beverages, which are classified in food services.
Bureau of Economic AnalysisTable 1.6.8. Contributions to Percent Change in the Gross Domestic Purchases Price IndexSeasonally adjusted at annual ratesLast Revised on: September 28, 2017 - Next Release Date October 27, 2017
Page 45 of 138
Line 2015 2016 2016 2017 II III IV I II
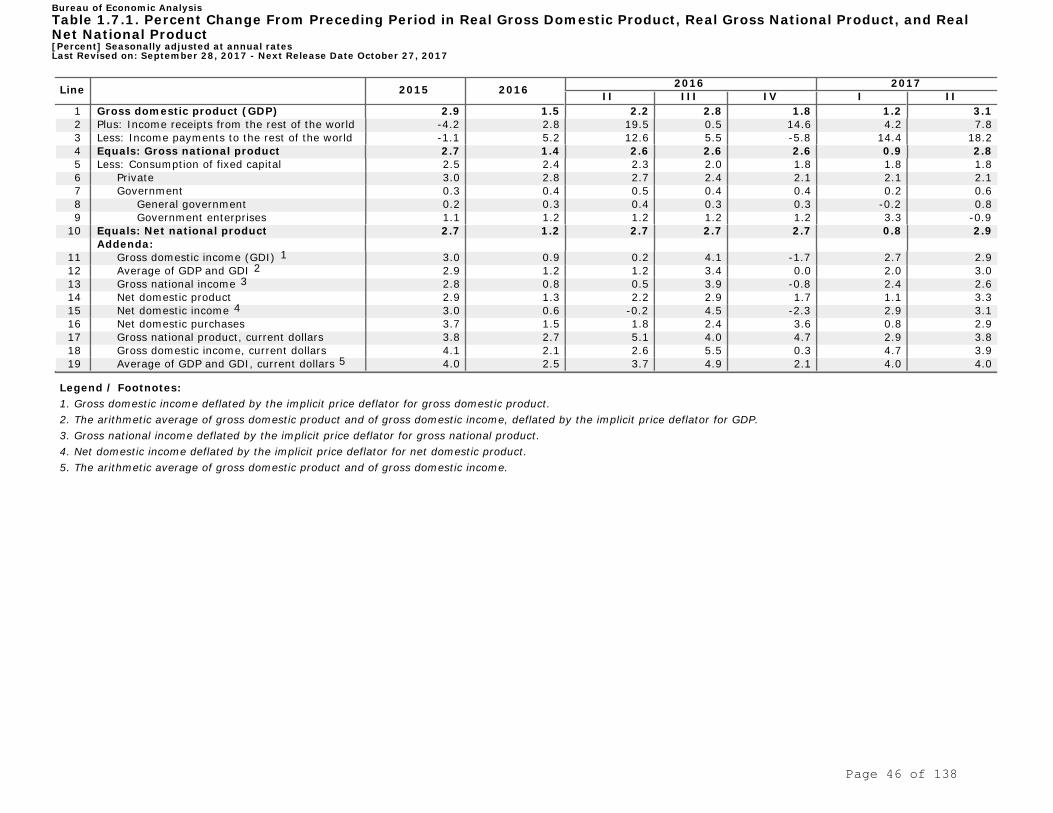
1 Gross domestic product (GDP) 2.9 1.5 2.2 2.8 1.8 1.2 3.1 2 Plus: Income receipts from the rest of the world -4.2 2.8 19.5 0.5 14.6 4.2 7.8 3 Less: Income payments to the rest of the world -1.1 5.2 12.6 5.5 -5.8 14.4 18.2 4 Equals: Gross national product 2.7 1.4 2.6 2.6 2.6 0.9 2.8 5 Less: Consumption of fixed capital 2.5 2.4 2.3 2.0 1.8 1.8 1.8 6 Private 3.0 2.8 2.7 2.4 2.1 2.1 2.1 7 Government 0.3 0.4 0.5 0.4 0.4 0.2 0.6 8 General government 0.2 0.3 0.4 0.3 0.3 -0.2 0.8 9 Government enterprises 1.1 1.2 1.2 1.2 1.2 3.3 -0.9
10 Equals: Net national product 2.7 1.2 2.7 2.7 2.7 0.8 2.9 Addenda:
11 Gross domestic income (GDI) 1 3.0 0.9 0.2 4.1 -1.7 2.7 2.9 12 Average of GDP and GDI 2 2.9 1.2 1.2 3.4 0.0 2.0 3.0 13 Gross national income 3 2.8 0.8 0.5 3.9 -0.8 2.4 2.6 14 Net domestic product 2.9 1.3 2.2 2.9 1.7 1.1 3.3 15 Net domestic income 4 3.0 0.6 -0.2 4.5 -2.3 2.9 3.1 16 Net domestic purchases 3.7 1.5 1.8 2.4 3.6 0.8 2.9 17 Gross national product, current dollars 3.8 2.7 5.1 4.0 4.7 2.9 3.8 18 Gross domestic income, current dollars 4.1 2.1 2.6 5.5 0.3 4.7 3.9 19 Average of GDP and GDI, current dollars 5 4.0 2.5 3.7 4.9 2.1 4.0 4.0
Legend / Footnotes:1. Gross domestic income deflated by the implicit price deflator for gross domestic product. 2. The arithmetic average of gross domestic product and of gross domestic income, deflated by the implicit price deflator for GDP. 3. Gross national income deflated by the implicit price deflator for gross national product. 4. Net domestic income deflated by the implicit price deflator for net domestic product. 5. The arithmetic average of gross domestic product and of gross domestic income.
Bureau of Economic AnalysisTable 1.7.1. Percent Change From Preceding Period in Real Gross Domestic Product, Real Gross National Product, and RealNet National Product[Percent] Seasonally adjusted at annual ratesLast Revised on: September 28, 2017 - Next Release Date October 27, 2017
Page 46 of 138
Line 2015 2016 2016 2017 II III IV I II
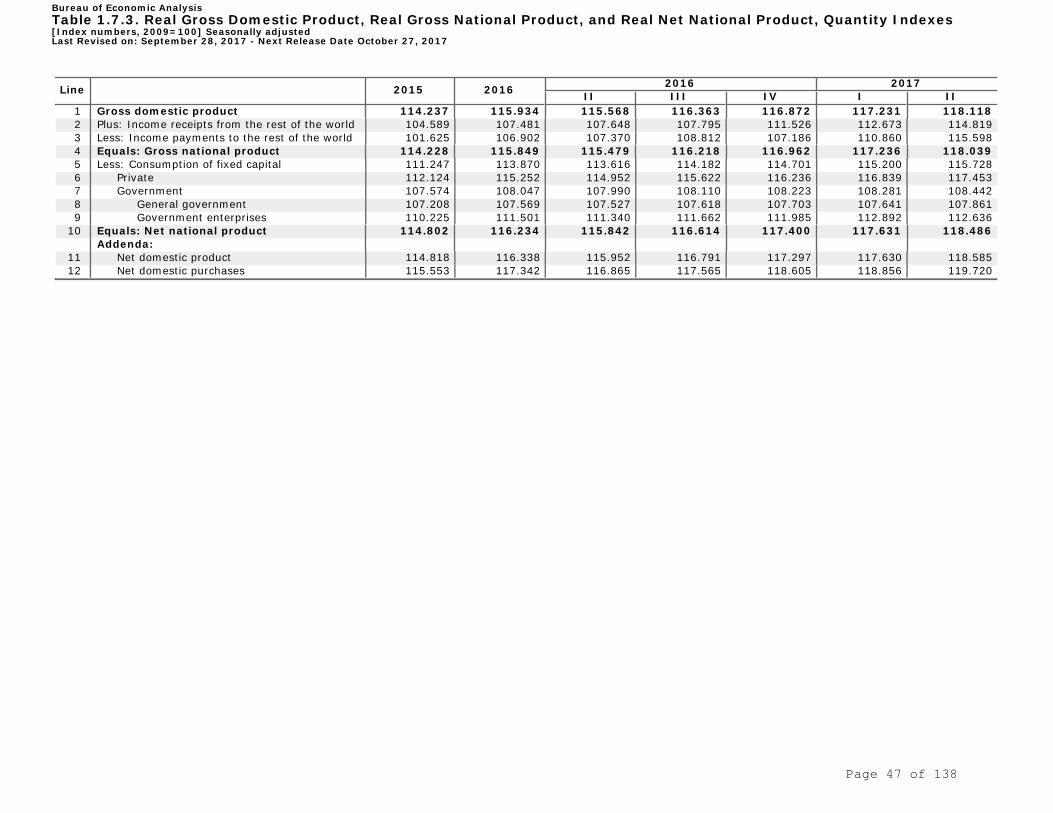
1 Gross domestic product 114.237 115.934 115.568 116.363 116.872 117.231 118.118 2 Plus: Income receipts from the rest of the world 104.589 107.481 107.648 107.795 111.526 112.673 114.819 3 Less: Income payments to the rest of the world 101.625 106.902 107.370 108.812 107.186 110.860 115.598 4 Equals: Gross national product 114.228 115.849 115.479 116.218 116.962 117.236 118.039 5 Less: Consumption of fixed capital 111.247 113.870 113.616 114.182 114.701 115.200 115.728 6 Private 112.124 115.252 114.952 115.622 116.236 116.839 117.453 7 Government 107.574 108.047 107.990 108.110 108.223 108.281 108.442 8 General government 107.208 107.569 107.527 107.618 107.703 107.641 107.861 9 Government enterprises 110.225 111.501 111.340 111.662 111.985 112.892 112.636
10 Equals: Net national product 114.802 116.234 115.842 116.614 117.400 117.631 118.486 Addenda:
Bureau of Economic AnalysisTable 1.7.3. Real Gross Domestic Product, Real Gross National Product, and Real Net National Product, Quantity Indexes[Index numbers, 2009=100] Seasonally adjustedLast Revised on: September 28, 2017 - Next Release Date October 27, 2017
Page 47 of 138
Line 2015 2016 2016 2017 II III IV I II
1 Gross domestic product 110.012 111.419 111.257 111.641 112.190 112.752 113.037 2 Plus: Income receipts from the rest of the world 119.778 121.050 120.812 121.312 121.906 122.564 122.800 3 Less: Income payments to the rest of the world 120.248 121.600 121.382 121.856 122.406 123.522 123.789 4 Equals: Gross national product 110.109 111.511 111.348 111.734 112.285 112.834 113.118 5 Less: Consumption of fixed capital 107.849 108.151 108.084 108.262 108.594 109.451 110.211 6 Private 107.433 107.714 107.624 107.828 108.172 109.009 109.829 7 Government 109.591 109.996 110.030 110.088 110.367 111.313 111.794 8 General government 109.165 109.530 109.610 109.599 109.823 110.536 111.002 9 Government enterprises 112.742 113.429 113.143 113.694 114.370 116.970 117.561
10 Equals: Net national product 110.539 112.150 111.968 112.394 112.987 113.476 113.670 Addenda:
Bureau of Economic AnalysisTable 1.7.4. Price Indexes for Gross Domestic Product, Gross National Product, and Net National Product[Index numbers, 2009=100] Seasonally adjustedLast Revised on: September 28, 2017 - Next Release Date October 27, 2017
Page 48 of 138
Line 2015 2016 2016 2017 II III IV I II
1 Gross domestic product (GDP) 18,120.7 18,624.5 18,538.0 18,729.1 18,905.5 19,057.7 19,250.0 2 Plus: Income receipts from the rest of the world 812.9 844.3 843.8 848.4 882.1 895.9 914.8 3 Less: Income payments to the rest of the world 608.4 647.2 648.8 660.1 653.1 681.7 712.4 4 Equals: Gross national product 18,325.2 18,821.6 18,733.0 18,917.5 19,134.5 19,272.0 19,452.4 5 Less: Consumption of fixed capital 2,841.5 2,916.7 2,908.3 2,927.6 2,950.0 2,986.2 3,020.7 6 Private 2,319.6 2,390.5 2,382.3 2,400.7 2,421.2 2,452.5 2,484.0 7 Domestic business 1,846.9 1,895.3 1,890.8 1,900.9 1,914.3 1,940.9 1,964.2 8 Capital consumption allowances 1,946.9 2,005.6 1,997.4 2,014.6 2,030.9 2,047.5 2,064.7 9 Less: Capital consumption adjustment 100.0 110.3 106.7 113.7 116.6 106.6 100.5
10 Households and institutions 472.7 495.3 491.5 499.8 506.9 511.6 519.8 11 Government 521.9 526.2 526.1 526.9 528.8 533.6 536.7 12 General government 456.7 459.8 460.0 460.3 461.6 464.3 467.2 13 Government enterprises 65.2 66.4 66.1 66.6 67.2 69.3 69.5 14 Equals: Net national product 15,483.7 15,904.8 15,824.7 15,989.9 16,184.5 16,285.8 16,431.7 15 Less: Statistical discrepancy -255.9 -147.2 -132.9 -195.2 -34.4 -102.4 -95.4 16 Equals: National income 15,739.6 16,052.0 15,957.6 16,185.1 16,218.9 16,388.2 16,527.1
18 Taxes on production and imports less subsidies 1 1,198.5 1,226.2 1,214.3 1,233.5 1,242.5 1,248.2 1,261.2
19 Contributions for government social insurance,domestic 1,208.0 1,245.3 1,245.4 1,258.2 1,250.2 1,284.1 1,297.4
20 Net interest and miscellaneous payments onassets 583.4 570.6 568.0 573.7 566.5 588.2 598.3
21 Business current transfer payments (net) 165.0 164.0 165.0 151.2 176.6 176.5 164.6 22 Current surplus of government enterprises 1 -14.3 -10.1 -10.3 -10.1 -10.2 -11.0 -10.7 23 Plus: Personal income receipts on assets 2,387.1 2,377.8 2,371.4 2,373.2 2,391.6 2,420.1 2,434.5 24 Plus: Personal current transfer receipts 2,684.4 2,768.4 2,760.2 2,777.4 2,795.9 2,831.9 2,836.9 25 Equals: Personal income 15,553.0 15,928.7 15,910.1 16,028.0 16,025.7 16,245.2 16,364.4
Addenda: 26 Gross domestic income (GDI) 18,376.6 18,771.6 18,670.9 18,924.4 18,939.9 19,160.1 19,345.4 27 Average of GDP and GDI 2 18,248.7 18,698.1 18,604.5 18,826.7 18,922.7 19,108.9 19,297.7 28 Gross national income 18,581.1 18,968.7 18,865.9 19,112.7 19,168.9 19,374.4 19,547.8 29 Gross national factor income 3 17,232.0 17,588.6 17,496.9 17,738.1 17,760.0 17,960.7 18,132.7 30 Net domestic product 15,279.2 15,707.8 15,629.7 15,801.5 15,955.6 16,071.5 16,229.3 31 Net domestic income 15,535.1 15,854.9 15,762.6 15,996.7 15,990.0 16,174.0 16,324.7 32 Net national factor income 4 14,390.4 14,671.9 14,588.5 14,810.5 14,810.1 14,974.5 15,112.1 33 Net domestic purchases 15,803.2 16,229.0 16,131.3 16,294.3 16,519.9 16,654.4 16,796.6 34 Statistical discrepancy as a percentage of GDP -1.4 -0.8 -0.7 -1.0 -0.2 -0.5 -0.5
Legend / Footnotes:1. Prior to 1959, current surplus of government enterprises (line 22) is not shown separately; subsidies are included net of the current surplus ofgovernment enterprises in line 18. 2. The arithmetic average of gross domestic product and of gross domestic income. 3. Consists of compensation of employees, proprietors' income with inventory valuation adjustment (IVA) and capital consumption adjustment(CCAdj), rental income of persons with CCAdj, corporate profits with IVA and CCAdj, net interest and miscellaneous payments, and consumption offixed capital. 4. Consists of gross national factor income less consumption of fixed capital.
Bureau of Economic AnalysisTable 1.7.5. Relation of Gross Domestic Product, Gross National Product, Net NationalProduct, National Income, and Personal Income[Billions of dollars] Seasonally adjusted at annual ratesLast Revised on: September 28, 2017 - Next Release Date October 27, 2017
Page 49 of 138
Line 2015 2016 2016 2017 II III IV I II
1 Gross domestic product (GDP) 16,471.5 16,716.2 16,663.5 16,778.1 16,851.4 16,903.2 17,031.1 2 Plus: Income receipts from the rest of the world 678.7 697.4 698.5 699.5 723.7 731.1 745.1 3 Less: Income payments to the rest of the world 505.9 532.2 534.5 541.7 533.6 551.9 575.5 4 Equals: Gross national product 16,642.8 16,879.0 16,825.0 16,932.8 17,041.1 17,081.0 17,198.0 5 Less: Consumption of fixed capital 2,634.8 2,696.9 2,690.9 2,704.3 2,716.5 2,728.4 2,740.9 6 Private 2,159.1 2,219.4 2,213.6 2,226.5 2,238.3 2,249.9 2,261.7 7 Government 476.3 478.4 478.1 478.6 479.1 479.4 480.1 8 General government 418.4 419.8 419.6 420.0 420.3 420.1 420.9 9 Government enterprises 57.8 58.5 58.4 58.6 58.8 59.2 59.1
10 Equals: Net national product 14,007.4 14,182.2 14,134.3 14,228.6 14,324.4 14,352.7 14,457.0 Addenda:
11 Gross domestic income (GDI) 1 16,704.1 16,848.2 16,783.0 16,953.0 16,882.1 16,994.1 17,115.5 12 Average of GDP and GDI 2 16,587.8 16,782.2 16,723.2 16,865.6 16,866.8 16,948.7 17,073.3 13 Gross national income 3 16,875.3 17,011.0 16,944.4 17,107.5 17,071.7 17,171.8 17,282.3 14 Net domestic product 13,836.0 14,019.2 13,972.6 14,073.7 14,134.7 14,174.8 14,289.9 15 Net domestic income 4 14,067.8 14,150.5 14,091.4 14,247.6 14,165.2 14,265.2 14,373.9 16 Net domestic purchases 14,381.5 14,604.1 14,544.8 14,631.9 14,761.3 14,792.5 14,900.1
Legend / Footnotes:1. Gross domestic income deflated by the implicit price deflator for gross domestic product. 2. The arithmetic average of gross domestic product and of gross domestic income, deflated by the implicit price deflator for GDP. 3. Gross national income deflated by the implicit price deflator for gross national product. 4. Net domestic income deflated by the implicit price deflator for net domestic product. Note. Except as noted in footnotes 1, 2 and 3, chained (2009) dollar series are calculated as the product of the chain-type quantity index and the 2009 current-dollar valueof the corresponding series, divided by 100. Because the formula for the chain-type quantity indexes uses weights of more than one period, the correspondingchained-dollar estimates are usually not additive.
Bureau of Economic AnalysisTable 1.7.6. Relation of Real Gross Domestic Product, Real Gross National Product, and Real Net National Product, ChainedDollars[Billions of chained (2009) dollars] Seasonally adjusted at annual ratesLast Revised on: September 28, 2017 - Next Release Date October 27, 2017
Legend / Footnotes:1. Deflator is the gross domestic purchases price index. 2. This measure is called 'real gross domestic income' in the System of National Accounts, 2008. 3. This measure is called 'real gross national income' in the System of National Accounts, 2008. 4. Deflator is the net domestic purchases price index.
Bureau of Economic AnalysisTable 1.8.3. Command-Basis Real Gross Domestic Product and Gross National Product, Quantity Indexes[Index numbers, 2009=100] Seasonally adjustedLast Revised on: September 28, 2017 - Next Release Date October 27, 2017
Legend / Footnotes:1. Deflator is the gross domestic purchases price index. 2. This measure is called 'real gross domestic income' in the System of National Accounts, 2008. 3. This measure is called 'real gross national income' in the System of National Accounts, 2008. 4. Deflator is the net domestic purchases price index. 5. Ratio (multiplied by 100) of price index for gross domestic product to the price index for gross domestic purchases. 6. Ratio (multiplied by 100) of the price index for exports of goods and services to the price index for imports of goods and services. 7. Ratio (multiplied by 100) of the price index for goods exports to the price index for goods imports. 8. Ratio (multiplied by 100) of the price index for goods exports to the price index for nonpetroleum goods imports.
Bureau of Economic AnalysisTable 1.8.6. Command-Basis Real Gross Domestic Product and Gross National Product, Chained Dollars[Billions of chained (2009) dollars] Seasonally adjusted at annual ratesLast Revised on: September 28, 2017 - Next Release Date October 27, 2017
Page 52 of 138
Line 2015 2016 2016 2017 II III IV I II
1 Gross domestic income 18,376.6 18,771.6 18,670.9 18,924.4 18,939.9 19,160.1 19,345.4 2 Compensation of employees, paid 9,720.0 9,992.2 9,993.1 10,095.1 10,029.0 10,179.8 10,285.4 3 Wages and salaries 7,870.6 8,098.8 8,103.7 8,191.8 8,121.9 8,245.5 8,335.7 4 To persons 7,852.3 8,078.7 8,083.7 8,171.5 8,101.3 8,225.5 8,315.0 5 To the rest of the world 18.3 20.1 20.1 20.3 20.6 20.0 20.6 6 Supplements to wages and salaries 1,849.4 1,893.4 1,889.4 1,903.4 1,907.1 1,934.2 1,949.7 7 Taxes on production and imports 1,255.8 1,288.0 1,276.4 1,296.6 1,304.1 1,309.2 1,321.3 8 Less: Subsidies 1 57.3 61.8 62.1 63.0 61.6 61.0 60.1 9 Net operating surplus 4,616.6 4,636.5 4,555.1 4,668.1 4,718.5 4,746.0 4,778.1
Legend / Footnotes:1. Prior to 1959, subsidies (line 8) and the current surplus of government enterprises (line 20) are not shown separately; subsidies are presented net of the current surplusof government enterprises.
Bureau of Economic AnalysisTable 1.10. Gross Domestic Income by Type of Income[Billions of dollars] Seasonally adjusted at annual ratesLast Revised on: September 28, 2017 - Next Release Date October 27, 2017
Page 53 of 138
Line 2015 2016 2016 2017 II III IV I II
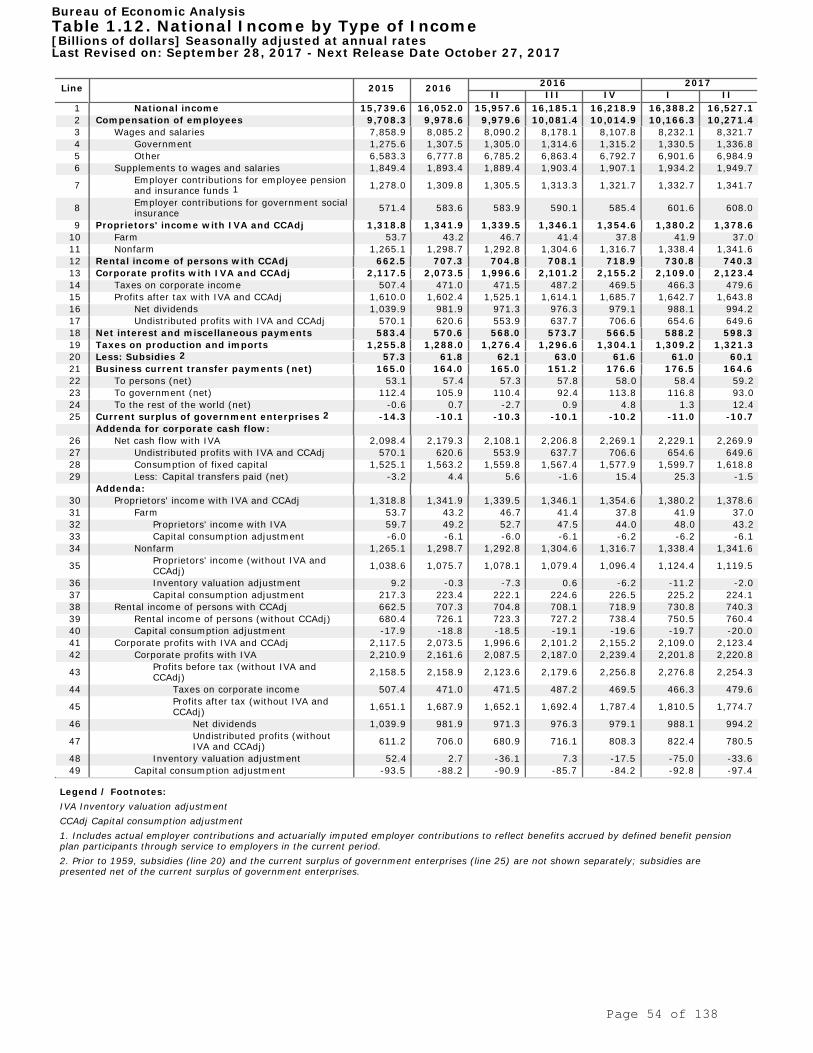
1 National income 15,739.6 16,052.0 15,957.6 16,185.1 16,218.9 16,388.2 16,527.1 2 Compensation of employees 9,708.3 9,978.6 9,979.6 10,081.4 10,014.9 10,166.3 10,271.4 3 Wages and salaries 7,858.9 8,085.2 8,090.2 8,178.1 8,107.8 8,232.1 8,321.7 4 Government 1,275.6 1,307.5 1,305.0 1,314.6 1,315.2 1,330.5 1,336.8 5 Other 6,583.3 6,777.8 6,785.2 6,863.4 6,792.7 6,901.6 6,984.9 6 Supplements to wages and salaries 1,849.4 1,893.4 1,889.4 1,903.4 1,907.1 1,934.2 1,949.7
7 Employer contributions for employee pensionand insurance funds 1
Legend / Footnotes:IVA Inventory valuation adjustment CCAdj Capital consumption adjustment 1. Includes actual employer contributions and actuarially imputed employer contributions to reflect benefits accrued by defined benefit pensionplan participants through service to employers in the current period. 2. Prior to 1959, subsidies (line 20) and the current surplus of government enterprises (line 25) are not shown separately; subsidies arepresented net of the current surplus of government enterprises.
Bureau of Economic AnalysisTable 1.12. National Income by Type of Income[Billions of dollars] Seasonally adjusted at annual ratesLast Revised on: September 28, 2017 - Next Release Date October 27, 2017
42 Consumption of fixed capital 3 1,255.8 1,292.5 1,288.9 1,296.9 1,304.1 1,313.3 1,323.0 43 Net value added 4 7,102.3 7,179.3 7,124.4 7,268.7 7,177.2 7,252.8 7,399.6
Legend / Footnotes:1. Estimates for financial corporate business and nonfinancial corporate business for 2000 and earlier periods are based on the 1987 StandardIndustrial Classification (SIC); later estimates for these industries are based on the North American Industry Classification System (NAICS). 2. The current-dollar gross value added is deflated using the gross value added chain-type price index for nonfinancial industries from theGDP-by-industry accounts. For periods when this price index is not available, the chain-type price index for GDP goods and structures is used. 3. Chained-dollar consumption of fixed capital of nonfinancial corporate business is calculated as the product of the chain-type quantity index andthe 2009 current-dollar value of the corresponding series, divided by 100. 4. Chained-dollar net value added of nonfinancial corporate business is the difference between the gross product and the consumption of fixedcapital. IVA Inventory valuation adjustment CCAdj Capital consumption adjustment
Bureau of Economic AnalysisTable 1.14. Gross Value Added of Domestic Corporate Business in Current Dollars and GrossValue Added of Nonfinancial Domestic Corporate Business in Current and Chained Dollars[Billions of dollars] Seasonally adjusted at annual ratesLast Revised on: September 28, 2017 - Next Release Date October 27, 2017
Page 55 of 138
Line 2015 2016 2016 2017 II III IV I II
1 Price per unit of real gross value added ofnonfinancial corporate business 1
3 Unit nonlabor cost 0.301 0.299 0.300 0.296 0.303 0.302 0.300 4 Consumption of fixed capital 0.160 0.161 0.162 0.160 0.162 0.163 0.162
5 Taxes on production and imports lesssubsidies plus business current transferpayments (net)
0.104 0.103 0.102 0.101 0.105 0.102 0.101
6 Net interest and miscellaneous payments 0.037 0.036 0.036 0.035 0.035 0.036 0.036
7 Corporate profits with IVA and CCAdj (unitprofits from current production) 0.153 0.144 0.140 0.143 0.142 0.141 0.145
8 Taxes on corporate income 0.034 0.032 0.032 0.032 0.033 0.032 0.034 9 Profits after tax with IVA and CCAdj 0.119 0.112 0.108 0.110 0.108 0.109 0.111
Legend / Footnotes:1. The implicit price deflator for gross value added of nonfinancial corporate business divided by 100. Estimates for nonfinancial corporate business for 2000 and earlierperiods are based on the 1987 Standard Industrial Classification (SIC); later estimates for these industries are based on the North American Industry Classification System(NAICS). Note. The current-dollar gross value added is deflated using the gross value added chain-type price index for nonfinancial industries from the GDP-by-industry accounts. Forperiods when this price index is not available, the chain-type price index for GDP goods and structures is used. IVA Inventory valuation adjustment CCAdj Capital consumption adjustment
Bureau of Economic AnalysisTable 1.15. Price, Costs, and Profit Per Unit of Real Gross Value Added of Nonfinancial Domestic Corporate Business[Dollars] Seasonally adjusted at annual ratesLast Revised on: September 28, 2017 - Next Release Date October 27, 2017
Page 56 of 138
Line 2015 2016 2016 2017 II III IV I II
Production in the United States: 1 Gross domestic product (GDP) 2.9 1.5 2.2 2.8 1.8 1.2 3.1 2 Gross domestic income (GDI) 3.0 0.9 0.2 4.1 -1.7 2.7 2.9 3 Average of GDP and GDI 1 2.9 1.2 1.2 3.4 0.0 2.0 3.0 4 Net domestic product 2 2.9 1.3 2.2 2.9 1.7 1.1 3.3 5 Net domestic income 2 3.0 0.6 -0.2 4.5 -2.3 2.9 3.1
Production by labor and capital supplied byU.S. residents:
6 Gross national product 2.7 1.4 2.6 2.6 2.6 0.9 2.8 7 Gross national income 2.8 0.8 0.5 3.9 -0.8 2.4 2.6 8 Net national product 2 2.7 1.2 2.7 2.7 2.7 0.8 2.9 Final expenditures by U.S. residents: 9 Gross domestic purchases 3.5 1.7 1.9 2.4 3.3 1.0 2.8
10 Final sales to domestic purchasers 3 3.3 2.1 2.6 2.2 2.3 2.4 2.7
11 Final sales to private domesticpurchasers 4
3.7 2.3 3.3 2.6 2.7 3.1 3.3
Purchasing power of income: 5 12 Command-basis gross domestic product 3.5 1.8 2.6 2.6 1.9 0.7 3.2 13 Command-basis net domestic product 2 3.7 1.7 2.6 2.8 2.0 0.5 3.5 14 Command-basis gross national product 3.3 1.7 2.9 2.4 2.8 0.3 2.9 15 Command-basis net national product 2 3.5 1.6 3.1 2.5 3.0 0.1 3.1
After-tax income received by the personalsector:
16 Disposable personal income 4.2 1.4 1.9 0.7 -1.8 2.9 3.3
Legend / Footnotes:1. The arithmetic average of gross domestic product and of gross domestic income, deflated by the implicit price deflator for GDP. 2. In this table, the net measures are the corresponding gross measures excluding the depreciation of fixed assets as measured by the consumption of fixed capital. 3. Gross domestic purchases excluding change in private inventories. 4. Final sales to domestic purchasers less government consumption expenditures and gross investment. 5. The command-basis estimates (lines 12-15) measure the purchasing power of the income generated by the sale of goods and services produced; they reflect gains orlosses in real income resulting from changes in the terms of trade for exports and imports. For more detail on the command-basis measures, see NIPA tables 1.8.3 and1.8.6.
Bureau of Economic AnalysisTable 1.17.1. Percent Change From Preceding Period in Real Gross Domestic Product, Real Gross Domestic Income, and OtherMajor NIPA Aggregates[Percent] Seasonally adjusted at annual ratesLast Revised on: September 28, 2017 - Next Release Date October 27, 2017
Page 57 of 138
Line 2015 2016 2016 2017 II III IV I II
Production in the United States: 1 Gross domestic product (GDP) 18,120.7 18,624.5 18,538.0 18,729.1 18,905.5 19,057.7 19,250.0 2 Gross domestic income (GDI) 18,376.6 18,771.6 18,670.9 18,924.4 18,939.9 19,160.1 19,345.4 3 Average of GDP and GDI 1 18,248.7 18,698.1 18,604.5 18,826.7 18,922.7 19,108.9 19,297.7 4 Net domestic product 2 15,279.2 15,707.8 15,629.7 15,801.5 15,955.6 16,071.5 16,229.3 5 Net domestic income 2 15,535.1 15,854.9 15,762.6 15,996.7 15,990.0 16,174.0 16,324.7
Production by labor and capital supplied byU.S. residents:
6 Gross national product 18,325.2 18,821.6 18,733.0 18,917.5 19,134.5 19,272.0 19,452.4 7 Gross national income 18,581.1 18,968.7 18,865.9 19,112.7 19,168.9 19,374.4 19,547.8 8 Net national product 2 15,483.7 15,904.8 15,824.7 15,989.9 16,184.5 16,285.8 16,431.7 9 National income 3 15,739.6 16,052.0 15,957.6 16,185.1 16,218.9 16,388.2 16,527.1 Final expenditures by U.S. residents:
13 Disposable personal income 13,615.0 13,968.6 13,959.4 14,044.3 14,048.5 14,226.4 14,351.5
Legend / Footnotes:1. The arithmetic average of gross domestic product and of gross domestic income. 2. In this table, net measures are the corresponding gross measures excluding the depreciation of fixed assets as measured by the consumption of fixed capital. 3. Equals gross national income less the depreciation of fixed assets as measured by the consumption of fixed capital. 4. Equals gross domestic purchases less change in private inventories. 5. Final sales to domestic purchasers less government consumption expenditures and gross investment.
Bureau of Economic AnalysisTable 1.17.5. Gross Domestic Product, Gross Domestic Income, and Other Major NIPA Aggregates[Billions of dollars] Seasonally adjusted at annual ratesLast Revised on: September 28, 2017 - Next Release Date October 27, 2017
Page 58 of 138
Line 2015 2016 2016 2017 II III IV I II
Production in the United States: 1 Gross domestic product (GDP) 16,471.5 16,716.2 16,663.5 16,778.1 16,851.4 16,903.2 17,031.1 2 Gross domestic income (GDI) 16,704.1 16,848.2 16,783.0 16,953.0 16,882.1 16,994.1 17,115.5 3 Average of GDP and GDI 1 16,587.8 16,782.2 16,723.2 16,865.6 16,866.8 16,948.7 17,073.3 4 Net domestic product 2 13,836.0 14,019.2 13,972.6 14,073.7 14,134.7 14,174.8 14,289.9 5 Net domestic income 2 14,067.8 14,150.5 14,091.4 14,247.6 14,165.2 14,265.2 14,373.9
Production by labor and capital supplied byU.S. residents:
6 Gross national product 16,642.8 16,879.0 16,825.0 16,932.8 17,041.1 17,081.0 17,198.0 7 Gross national income 16,875.3 17,011.0 16,944.4 17,107.5 17,071.7 17,171.8 17,282.3 8 Net national product 2 14,007.4 14,182.2 14,134.3 14,228.6 14,324.4 14,352.7 14,457.0 Final expenditures by U.S. residents: 9 Gross domestic purchases 17,017.2 17,301.6 17,236.2 17,336.7 17,478.6 17,521.6 17,641.8
10 Final sales to domestic purchasers 3 16,900.4 17,250.3 17,206.1 17,300.6 17,397.7 17,502.7 17,618.3
Purchasing power of income: 5 12 Command-basis gross domestic product 16,539.0 16,830.1 16,781.0 16,890.3 16,971.9 17,000.7 17,135.5 13 Command-basis net domestic product 2 13,904.6 14,134.6 14,091.5 14,187.5 14,257.0 14,274.0 14,395.6 14 Command-basis gross national product 16,725.6 17,008.2 16,957.5 17,060.2 17,177.4 17,191.8 17,315.6 15 Command-basis net national product 2 14,090.7 14,312.0 14,267.3 14,356.6 14,461.5 14,464.3 14,575.1
After-tax income received by the personalsector:
16 Disposable personal income 12,436.0 12,608.2 12,627.2 12,649.2 12,590.8 12,680.4 12,783.3
Legend / Footnotes:1. The arithmetic average of gross domestic product and of gross domestic income, deflated by the implicit price deflator for GDP. 2. In this table, the net measures are the corresponding gross measures excluding the depreciation of fixed assets as measured by the consumption of fixed capital. 3. Gross domestic purchases excluding change in private inventories. 4. Final sales to domestic purchasers less government consumption expenditures and gross investment. 5. The command-basis estimates (lines 12-15) measure the purchasing power of the income generated by the sale of goods and services produced; they reflect gains orlosses in real income resulting from changes in the terms of trade for exports and imports. For more detail on the command-basis measures, see NIPA tables 1.8.3 and1.8.6.
Bureau of Economic AnalysisTable 1.17.6. Real Gross Domestic Product, Real Gross Domestic Income, and Other Major NIPA Aggregates, Chained Dollars[Billions of chained (2009) dollars] Seasonally adjusted at annual ratesLast Revised on: September 28, 2017 - Next Release Date October 27, 2017
Page 59 of 138
Line 2015 2016 2016 2017 II III IV I II
1 Personal income 15,553.0 15,928.7 15,910.1 16,028.0 16,025.7 16,245.2 16,364.4 2 Compensation of employees 9,708.3 9,978.6 9,979.6 10,081.4 10,014.9 10,166.3 10,271.4 3 Wages and salaries 7,858.9 8,085.2 8,090.2 8,178.1 8,107.8 8,232.1 8,321.7 4 Private industries 6,583.3 6,777.8 6,785.2 6,863.4 6,792.7 6,901.6 6,984.9 5 Government 1,275.6 1,307.5 1,305.0 1,314.6 1,315.2 1,330.5 1,336.8 6 Supplements to wages and salaries 1,849.4 1,893.4 1,889.4 1,903.4 1,907.1 1,934.2 1,949.7
7 Employer contributions for employeepension and insurance funds 1
Legend / Footnotes:1. Includes actual employer contributions and actuarially imputed employer contributions to reflect benefits accrued by defined benefit pensionplan participants through service to employers in the current period. 2. Social security benefits include old-age, survivors, and disability insurance benefits that are distributed from the federal old-age and survivorsinsurance trust fund and the disability insurance trust fund. 3. Medicare benefits include hospital and supplementary medical insurance benefits that are distributed from the federal hospital insurance trustfund and the supplementary medical insurance trust fund. 4. Consists of nonmortgage interest paid by households. 5. The current-dollar measure is deflated by the implicit price deflator for personal consumption expenditures.
Bureau of Economic AnalysisTable 2.1. Personal Income and Its Disposition[Billions of dollars] Seasonally adjusted at annual ratesLast Revised on: September 28, 2017 - Next Release Date October 27, 2017
Legend / Footnotes:1. Other services-producing industries consists of information; finance and insurance; real estate and rental and leasing; professional, scientific, and technical services;management of companies and enterprises, administrative and support and waste management and remediation services; educational services; health care and socialassistance; arts, entertainment, and recreation; accommodation and food services; and other services. Note. Estimates in this table are based on the 2002 North American Industry Classification System (NAICS).
Bureau of Economic AnalysisTable 2.2B. Wages and Salaries by Industry[Billions of dollars] Seasonally adjusted at annual ratesLast Revised on: September 28, 2017 - Next Release Date October 27, 2017
24 Less: Receipts from sales of goods andservices by nonprofit institutions 3
3.7 2.6 6.2 0.7 6.8 1.0 -3.3
Addenda: 25 PCE excluding food and energy 4 4.0 2.8 3.6 2.9 3.4 2.5 3.0 26 Energy goods and services 5 2.5 0.4 4.3 3.0 -9.4 -9.6 15.5 27 Market-based PCE 6 3.7 2.8 4.2 2.5 3.1 1.4 3.6
28 Market-based PCE excluding food and energy 6
4.1 3.0 4.0 2.5 3.6 2.0 3.3
Legend / Footnotes:1. Net expenses of NPISHs, defined as their gross operating expenses less primary sales to households. 2. Gross output is net of unrelated sales, secondary sales, and sales to business, to government, and to the rest of the world; excludes own-account investment(construction and software). 3. Excludes unrelated sales, secondary sales, and sales to business, to government, and to the rest of the world; includes membership dues and fees. 4. Food consists of food and beverages purchased for off-premises consumption; food services, which include purchased meals and beverages, are not classified as food. 5. Consists of gasoline and other energy goods and of electricity and gas services. 6. Market-based PCE is a supplemental measure that is based on household expenditures for which there are observable price measures.It excludes most imputedtransactions (for example, financial services furnished without payment) and the final consumption expenditures of nonprofit institutions serving households.
Bureau of Economic AnalysisTable 2.3.1. Percent Change From Preceding Period in Real Personal Consumption Expenditures by Major Type of Product[Percent] Seasonally adjusted at annual ratesLast Revised on: September 28, 2017 - Next Release Date October 27, 2017
24 Less: Receipts from sales of goods andservices by nonprofit institutions 3
0.30 0.21 0.49 0.06 0.55 0.08 -0.28
Addenda: 25 PCE excluding food and energy 4 3.48 2.52 3.19 2.57 3.00 2.24 2.69 26 Energy goods and services 5 0.12 0.02 0.17 0.12 -0.38 -0.40 0.57 27 Market-based PCE 6 3.28 2.51 3.71 2.20 2.71 1.25 3.12
28 Market-based PCE excluding food and energy 6
3.11 2.30 3.09 1.96 2.79 1.56 2.54
Legend / Footnotes:1. Net expenses of NPISHs, defined as their gross operating expenses less primary sales to households. 2. Gross output is net of unrelated sales, secondary sales, and sales to business, to government, and to the rest of the world; excludes own-account investment(construction and software). 3. Excludes unrelated sales, secondary sales, and sales to business, to government, and to the rest of the world; includes membership dues and fees. 4. Food consists of food and beverages purchased for off-premises consumption; food services, which include purchased meals and beverages, are not classified as food. 5. Consists of gasoline and other energy goods and of electricity and gas services. 6. Market-based PCE is a supplemental measure that is based on household expenditures for which there are observable price measures.It excludes most imputedtransactions (for example, financial services furnished without payment) and the final consumption expenditures of nonprofit institutions serving households.
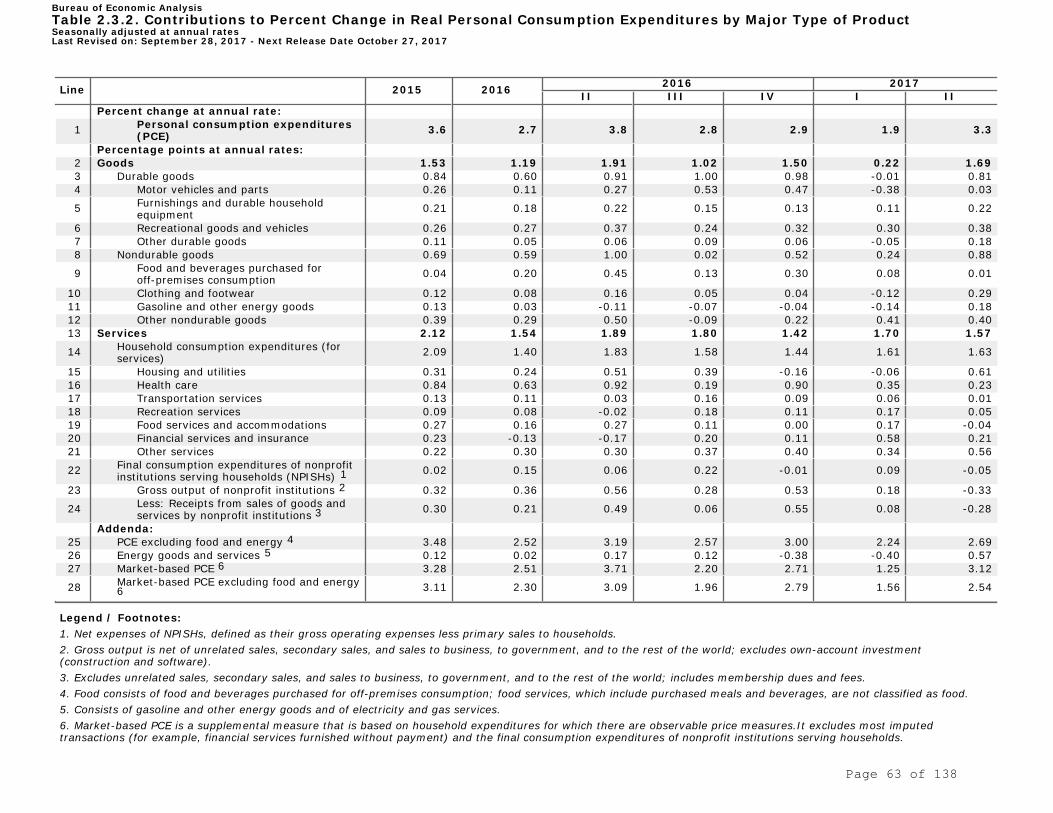
Bureau of Economic AnalysisTable 2.3.2. Contributions to Percent Change in Real Personal Consumption Expenditures by Major Type of ProductSeasonally adjusted at annual ratesLast Revised on: September 28, 2017 - Next Release Date October 27, 2017
Legend / Footnotes:1. Net expenses of NPISHs, defined as their gross operating expenses less primary sales to households. 2. Gross output is net of unrelated sales, secondary sales, and sales to business, to government, and to the rest of the world; excludes own-account investment(construction and software). 3. Excludes unrelated sales, secondary sales, and sales to business, to government, and to the rest of the world; includes membership dues and fees. 4. Food consists of food and beverages purchased for off-premises consumption; food services, which include purchased meals and beverages, are not classified as food. 5. Consists of gasoline and other energy goods and of electricity and gas services. 6. Market-based PCE is a supplemental measure that is based on household expenditures for which there are observable price measures.It excludes most imputedtransactions (for example, financial services furnished without payment) and the final consumption expenditures of nonprofit institutions serving households.
Bureau of Economic AnalysisTable 2.3.3. Real Personal Consumption Expenditures by Major Type of Product, Quantity Indexes[Index numbers, 2009=100] Seasonally adjustedLast Revised on: September 28, 2017 - Next Release Date October 27, 2017
Legend / Footnotes:1. Net expenses of NPISHs, defined as their gross operating expenses less primary sales to households. 2. Gross output is net of unrelated sales, secondary sales, and sales to business, to government, and to the rest of the world; excludes own-account investment(construction and software). 3. Excludes unrelated sales, secondary sales, and sales to business, to government, and to the rest of the world; includes membership dues and fees. 4. Food consists of food and beverages purchased for off-premises consumption; food services, which include purchased meals and beverages, are not classified as food. 5. Consists of gasoline and other energy goods and of electricity and gas services. 6. Market-based PCE is a supplemental measure that is based on household expenditures for which there are observable price measures.It excludes most imputedtransactions (for example, financial services furnished without payment) and the final consumption expenditures of nonprofit institutions serving households.
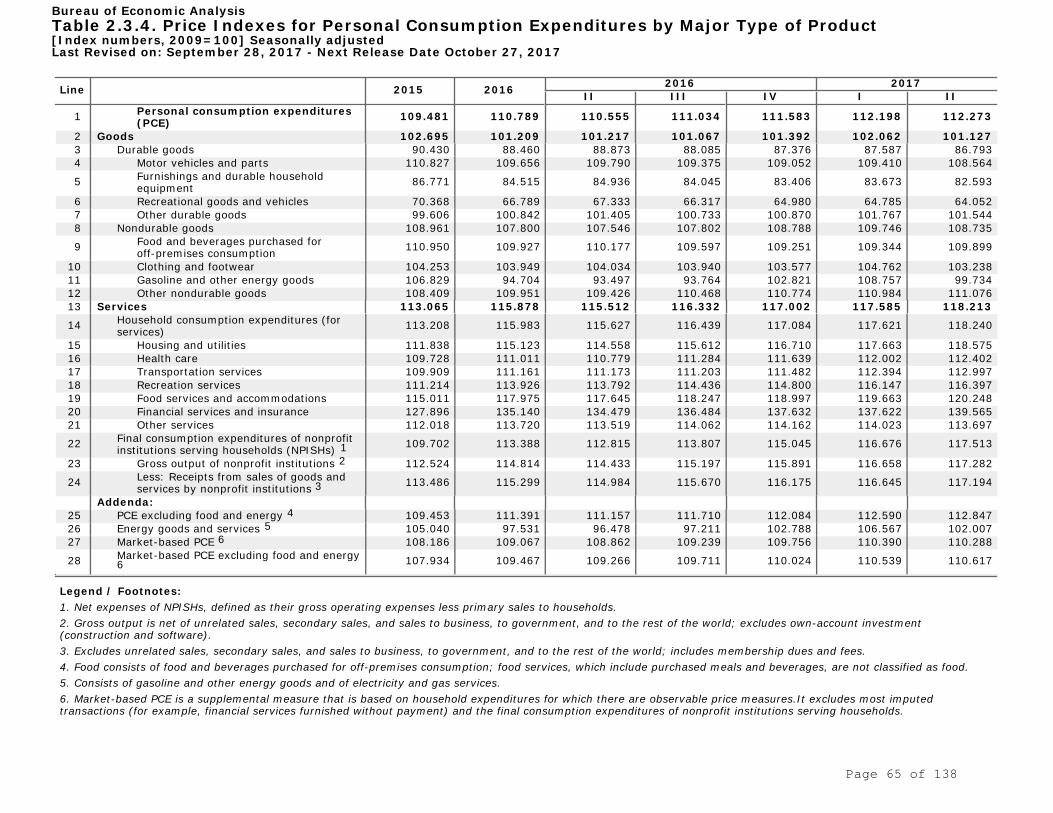
Bureau of Economic AnalysisTable 2.3.4. Price Indexes for Personal Consumption Expenditures by Major Type of Product[Index numbers, 2009=100] Seasonally adjustedLast Revised on: September 28, 2017 - Next Release Date October 27, 2017
Legend / Footnotes:1. Net expenses of NPISHs, defined as their gross operating expenses less primary sales to households. 2. Gross output is net of unrelated sales, secondary sales, and sales to business, to government, and to the rest of the world; excludes own-account investment(construction and software). 3. Excludes unrelated sales, secondary sales, and sales to business, to government, and to the rest of the world; includes membership dues and fees. 4. Food consists of food and beverages purchased for off-premises consumption; food services, which include purchased meals and beverages, are not classified as food. 5. Consists of gasoline and other energy goods and of electricity and gas services. 6. Market-based PCE is a supplemental measure that is based on household expenditures for which there are observable price measures.It excludes most imputedtransactions (for example, financial services furnished without payment) and the final consumption expenditures of nonprofit institutions serving households.
Bureau of Economic AnalysisTable 2.3.5. Personal Consumption Expenditures by Major Type of Product[Billions of dollars] Seasonally adjusted at annual ratesLast Revised on: September 28, 2017 - Next Release Date October 27, 2017
Legend / Footnotes:1. Net expenses of NPISHs, defined as their gross operating expenses less primary sales to households. 2. Gross output is net of unrelated sales, secondary sales, and sales to business, to government, and to the rest of the world; excludes own-account investment(construction and software). 3. Excludes unrelated sales, secondary sales, and sales to business, to government, and to the rest of the world; includes membership dues and fees. 4. Food consists of food and beverages purchased for off-premises consumption; food services, which include purchased meals and beverages, are not classified as food. 5. Consists of gasoline and other energy goods and of electricity and gas services. 6. Market-based PCE is a supplemental measure that is based on household expenditures for which there are observable price measures.It excludes most imputedtransactions (for example, financial services furnished without payment) and the final consumption expenditures of nonprofit institutions serving households. Note. Chained (2009) dollar series are calculated as the product of the chain-type quantity index and the 2009 current-dollar value of the corresponding series, divided by100. Because the formula for the chain-type quantity indexes uses weights of more than one period, the corresponding chained-dollar estimates are usually not additive.The residual line is the difference between the first line and the sum of the most detailed lines.
Bureau of Economic AnalysisTable 2.3.6. Real Personal Consumption Expenditures by Major Type of Product, Chained Dollars[Billions of chained (2009) dollars] Seasonally adjusted at annual ratesLast Revised on: September 28, 2017 - Next Release Date October 27, 2017
24 Less: Receipts from sales of goods andservices by nonprofit institutions 3
1.3 1.6 2.2 2.4 1.8 1.6 1.9
Addenda: 25 PCE excluding food and energy 4 1.3 1.8 2.0 2.0 1.3 1.8 0.9 26 Energy goods and services 5 -17.8 -7.1 12.7 3.1 25.0 15.5 -16.0 27 Market-based PCE 6 -0.1 0.8 1.7 1.4 1.9 2.3 -0.4
28 Market-based PCE excluding food and energy 6
1.1 1.4 1.5 1.6 1.1 1.9 0.3
Legend / Footnotes:1. Net expenses of NPISHs, defined as their gross operating expenses less primary sales to households. 2. Gross output is net of unrelated sales, secondary sales, and sales to business, to government, and to the rest of the world; excludes own-account investment(construction and software). 3. Excludes unrelated sales, secondary sales, and sales to business, to government, and to the rest of the world; includes membership dues and fees. 4. Food consists of food and beverages purchased for off-premises consumption; food services, which include purchased meals and beverages, are not classified as food. 5. Consists of gasoline and other energy goods and of electricity and gas services. 6. Market-based PCE is a supplemental measure that is based on household expenditures for which there are observable price measures.It excludes most imputedtransactions (for example, financial services furnished without payment) and the final consumption expenditures of nonprofit institutions serving households.
Bureau of Economic AnalysisTable 2.3.7. Percent Change From Preceding Period in Prices for Personal Consumption Expenditures by Major Type of Product[Percent] Seasonally adjusted at annual ratesLast Revised on: September 28, 2017 - Next Release Date October 27, 2017
Page 68 of 138
Line 2015 2016 2016 2017 II III IV I II
1 Current receipts 5,260.0 5,312.8 5,281.2 5,359.3 5,371.3 5,490.2 5,466.9 2 Current tax receipts 3,711.0 3,728.9 3,708.3 3,776.2 3,760.3 3,804.7 3,825.1 3 Personal current taxes 1,937.9 1,960.1 1,950.7 1,983.8 1,977.2 2,018.8 2,012.9 4 Taxes on production and imports 1,255.8 1,288.0 1,276.4 1,296.6 1,304.1 1,309.2 1,321.3 5 Taxes on corporate income 496.3 459.4 460.2 475.0 457.3 454.9 468.8 6 Taxes from the rest of the world 21.0 21.4 21.0 20.9 21.8 21.7 22.1 7 Contributions for government social insurance 1,213.2 1,250.5 1,250.5 1,263.4 1,255.5 1,289.6 1,302.9 8 From persons 1,208.0 1,245.3 1,245.4 1,258.2 1,250.2 1,284.1 1,297.4 9 From the rest of the world 1 5.2 5.1 5.1 5.2 5.3 5.5 5.5
10 Income receipts on assets 125.1 125.1 113.1 126.1 134.8 155.2 139.0 11 Interest and miscellaneous receipts 105.0 105.7 104.8 106.1 108.7 110.6 114.1 12 Interest receipts 2 85.8 87.6 86.5 87.9 90.2 92.5 93.8 13 Rents and royalties 19.3 18.1 18.2 18.2 18.5 18.2 20.3 14 Dividends 20.1 19.4 8.3 19.9 26.0 44.6 24.8 15 Current transfer receipts 224.9 218.4 219.6 203.6 231.0 251.8 210.6 16 From business (net) 112.4 105.9 110.4 92.4 113.8 116.8 93.0 17 From persons 105.4 108.9 108.1 109.0 110.6 112.3 114.1 18 From the rest of the world 3 7.1 3.7 1.1 2.2 6.5 22.7 3.5 19 Current surplus of government enterprises 4 -14.3 -10.1 -10.3 -10.1 -10.2 -11.0 -10.7 20 Current expenditures 5,993.0 6,177.5 6,154.6 6,200.5 6,247.2 6,322.9 6,305.4 21 Consumption expenditures 2,610.8 2,658.1 2,651.8 2,672.6 2,678.1 2,701.3 2,714.5 22 Current transfer payments 2,704.8 2,785.5 2,771.9 2,794.9 2,811.1 2,848.9 2,850.5 23 Government social benefits 2,651.5 2,731.9 2,723.8 2,741.0 2,758.9 2,794.9 2,799.4 24 To persons 2,631.2 2,711.0 2,703.0 2,719.7 2,737.9 2,773.4 2,777.8 25 To the rest of the world 5 20.2 20.9 20.8 21.3 21.0 21.5 21.7
26 Other current transfer payments to the restof the world 3,5
53.3 53.6 48.1 53.9 52.2 54.0 51.0
27 Interest payments 2 620.2 672.1 668.9 670.0 696.3 711.7 680.3 28 To persons and business 2 523.8 572.5 569.5 570.0 593.8 608.9 575.2 29 To the rest of the world 96.4 99.6 99.4 100.0 102.5 102.7 105.1 30 Subsidies 4 57.3 61.8 62.1 63.0 61.6 61.0 60.1 31 Net government saving -733.0 -864.7 -873.4 -841.3 -875.9 -832.6 -838.5 32 Social insurance funds -301.0 -312.8 -307.6 -305.8 -324.7 -306.5 -303.9 33 Other -432.0 -551.9 -565.8 -535.4 -551.2 -526.1 -534.7
Addenda: 34 Total receipts 5,285.4 5,338.3 5,306.8 5,384.6 5,397.2 5,517.0 5,494.0 35 Current receipts 5,260.0 5,312.8 5,281.2 5,359.3 5,371.3 5,490.2 5,466.9 36 Capital transfer receipts 25.4 25.5 25.6 25.3 25.9 26.7 27.1 37 Total expenditures 6,066.5 6,269.7 6,221.8 6,290.2 6,347.1 6,427.1 6,404.4 38 Current expenditures 5,993.0 6,177.5 6,154.6 6,200.5 6,247.2 6,322.9 6,305.4 39 Gross government investment 608.1 609.7 609.7 602.0 608.7 618.9 617.5 40 Capital transfer payments 7.8 6.7 5.7 5.6 9.7 8.7 7.9 41 Net purchases of nonproduced assets -20.5 1.9 -22.1 9.0 10.4 10.3 10.2 42 Less: Consumption of fixed capital 521.9 526.2 526.1 526.9 528.8 533.6 536.7 43 Net lending or net borrowing (-) -781.1 -931.4 -915.0 -905.6 -949.9 -910.2 -910.4
Legend / Footnotes:1. Consists primarily of contributions by residents of the U.S. territories and the Commonwealths of Puerto Rico and NorthernMariana Islands. 2. Prior to 1960, interest payments to persons (line 28) and interest receipts on line 12 are not shown separately, but areincluded in interest payments (line 27), which is shown net of interest receipts. Interest payments to persons and businessincludes interest accrued on the actuarial liabilities of defined benefit pension plans for government employees. 3. Prior to 1999, current transfer payments to the rest of the world (line 26) are displayed net of current transfer receipts fromthe rest of the world (line 18). 4. Prior to 1959, subsidies (line 30) and the current surplus of government enterprises (line 19) are not shown separately;subsidies are presented net of the current surplus of government enterprises. 5. Prior to 1960, government social benefits to the rest of the world are included in line 26, 'Other current transfer payments tothe rest of the world.'
Bureau of Economic AnalysisTable 3.1. Government Current Receipts and Expenditures[Billions of dollars] Seasonally adjusted at annual ratesLast Revised on: September 28, 2017 - Next Release Date October 27, 2017
Page 69 of 138
Line 2015 2016 2016 2017 II III IV I II
1 Current receipts 3,441.4 3,452.1 3,441.7 3,486.3 3,479.4 3,589.2 3,564.9 2 Current tax receipts 2,126.9 2,100.2 2,096.3 2,131.6 2,113.0 2,133.4 2,155.6 3 Personal current taxes 1 1,528.5 1,540.5 1,537.9 1,557.9 1,552.0 1,574.0 1,591.4 4 Taxes on production and imports 2 140.2 137.0 135.5 136.7 138.5 128.8 131.6 5 Excise taxes 102.1 99.5 98.4 99.4 101.4 91.3 93.2 6 Customs duties 38.1 37.5 37.0 37.3 37.1 37.5 38.5 7 Taxes on corporate income 437.1 401.2 401.9 416.1 400.8 408.8 410.4 8 Federal Reserve banks 110.4 91.5 101.0 90.8 73.1 92.4 88.6 9 Other 326.7 309.8 300.8 325.3 327.7 316.4 321.8
10 Taxes from the rest of the world 21.0 21.4 21.0 20.9 21.8 21.7 22.1 11 Contributions for government social insurance 1,193.4 1,230.2 1,230.2 1,243.1 1,235.1 1,269.2 1,282.5 12 From persons 1,188.2 1,225.1 1,225.1 1,237.9 1,229.8 1,263.7 1,277.0 13 From the rest of the world 3 5.2 5.1 5.1 5.2 5.3 5.5 5.5 14 Income receipts on assets 48.9 46.8 35.1 47.6 55.9 76.5 59.9 15 Interest receipts 4 26.4 27.3 26.4 27.4 29.6 31.8 32.9 16 Dividends 16.0 14.8 3.9 15.4 21.4 40.0 20.2 17 Rents and royalties 5 6.6 4.7 4.9 4.8 5.0 4.7 6.8 18 Current transfer receipts 77.0 78.3 84.0 67.8 78.9 113.5 70.7 19 From business 44.1 47.4 56.0 38.5 44.4 62.1 37.8 20 From persons 26.3 27.3 26.9 27.2 27.9 28.6 29.4 21 From the rest of the world 6 6.6 3.7 1.1 2.2 6.5 22.7 3.5 22 Current surplus of government enterprises 7 -4.7 -3.5 -4.0 -3.8 -3.5 -3.4 -3.8 23 Current expenditures 4,028.0 4,149.4 4,130.3 4,165.3 4,193.3 4,242.0 4,198.3 24 Consumption expenditures 960.0 964.5 962.5 968.2 965.9 968.0 970.8 25 Current transfer payments 2,572.8 2,648.4 2,634.2 2,663.4 2,669.3 2,700.9 2,685.6 26 Government social benefits 1,987.4 2,039.3 2,036.7 2,043.9 2,050.8 2,082.7 2,090.4 27 To persons 1,967.2 2,018.4 2,015.9 2,022.6 2,029.8 2,061.2 2,068.8 28 To the rest of the world 8 20.2 20.9 20.8 21.3 21.0 21.5 21.7 29 Other current transfer payments 585.4 609.2 597.5 619.6 618.5 618.2 595.2
30 Grants-in-aid to state and localgovernments 532.1 555.5 549.4 565.7 566.3 564.2 544.1
31 To the rest of the world 6,8 53.3 53.6 48.1 53.9 52.2 54.0 51.0 32 Interest payments 4 438.4 475.1 472.1 471.1 497.0 512.7 482.3 33 To persons and business 4 344.6 378.5 375.6 374.2 398.0 413.2 380.4 34 To the rest of the world 93.9 96.6 96.5 97.0 99.0 99.4 101.9 35 Subsidies 7 56.7 61.3 61.5 62.5 61.1 60.5 59.6 36 Net federal government saving -586.7 -697.3 -688.5 -679.1 -714.0 -652.8 -633.4 37 Social insurance funds -306.4 -318.1 -313.0 -311.2 -330.1 -311.8 -309.2 38 Other -280.3 -379.1 -375.5 -367.8 -383.9 -341.0 -324.2
Addenda: 39 Total receipts 3,461.6 3,472.1 3,461.9 3,506.1 3,499.8 3,610.5 3,586.5 40 Current receipts 3,441.4 3,452.1 3,441.7 3,486.3 3,479.4 3,589.2 3,564.9 41 Capital transfer receipts 20.2 20.0 20.1 19.9 20.4 21.3 21.6 42 Total expenditures 4,061.5 4,210.1 4,164.5 4,232.9 4,266.2 4,320.5 4,285.4 43 Current expenditures 4,028.0 4,149.4 4,130.3 4,165.3 4,193.3 4,242.0 4,198.3 44 Gross government investment 264.0 267.0 265.8 266.3 269.5 276.4 285.0 45 Capital transfer payments 71.6 73.7 72.4 74.1 75.2 75.4 76.2 46 Net purchases of nonproduced assets -30.7 -8.6 -32.6 -1.5 -0.2 -0.4 -0.6 47 Less: Consumption of fixed capital 271.3 271.3 271.4 271.3 271.6 272.8 273.6 48 Net lending or net borrowing (-) -600.0 -738.0 -702.6 -726.8 -766.5 -710.0 -698.9
Legend / Footnotes:1. Includes dividends tax for 1933-34 and automobile use tax for 1942-46 as shown in table 3.4. 2. Includes the capital stock tax for 1933-45 as shown in table 3.5. 3. Consists primarily of contributions by residents of the U.S. territories and the Commonwealths of Puerto Rico and NorthernMariana Islands. 4. Prior to 1960, interest payments to persons and business (line 33) and interest receipts (line 15) are not shown separately,but are included in interest payments (line 32), which is shown net of interest receipts. Interest payments to persons andbusiness includes interest accrued on the actuarial liabilities of defined benefit pension plans for federal government employees. 5. Rents and royalties are receipts from the leasing of federally owned lands and mineral deposits. These values do not includebonus payments made to secure such leases. 6. Prior to 1999, current transfer payments to the rest of the world are displayed net of current transfer receipts from the restof the world. 7. Prior to 1959, subsidies (line 35) and the current surplus of government enterprises (line 22) are not shown separately;subsidies are presented net of the current surplus of government enterprises. 8. Prior to 1960, government social benefits to the rest of the world (line 28) are included in line 31, 'Other current transferpayments to the rest of the world.'
Bureau of Economic AnalysisTable 3.2. Federal Government Current Receipts and Expenditures[Billions of dollars] Seasonally adjusted at annual ratesLast Revised on: September 28, 2017 - Next Release Date October 27, 2017
Page 70 of 138
Line 2015 2016 2016 2017 II III IV I II
1 Current receipts 2,350.7 2,416.3 2,388.9 2,438.7 2,458.2 2,465.2 2,446.1 2 Current tax receipts 1,584.1 1,628.7 1,612.0 1,644.7 1,647.3 1,671.3 1,669.5 3 Personal current taxes 409.4 419.6 412.8 425.9 425.2 444.8 421.4 4 Income taxes 374.1 383.2 376.7 389.5 388.2 407.3 383.7 5 Other 35.4 36.4 36.1 36.4 37.0 37.5 37.7 6 Taxes on production and imports 1,115.6 1,151.0 1,141.0 1,159.8 1,165.6 1,180.4 1,189.7 7 Sales taxes 542.9 556.8 550.4 561.9 562.6 567.3 570.4 8 Property taxes 479.4 499.8 497.2 502.6 507.8 515.4 521.1 9 Other 93.3 94.3 93.3 95.3 95.2 97.7 98.2
10 Taxes on corporate income 59.2 58.1 58.3 58.9 56.5 46.1 58.4 11 Contributions for government social insurance 19.8 20.3 20.2 20.3 20.4 20.4 20.4 12 Income receipts on assets 76.3 78.2 78.0 78.5 78.8 78.7 79.1 13 Interest receipts 1 59.4 60.3 60.2 60.5 60.7 60.6 61.0 14 Dividends 4.2 4.6 4.5 4.5 4.7 4.6 4.6 15 Rents and royalties 12.7 13.3 13.3 13.4 13.5 13.5 13.5 16 Current transfer receipts 680.0 695.6 685.0 701.5 718.4 702.6 684.0 17 Federal grants-in-aid 532.1 555.5 549.4 565.7 566.3 564.2 544.1 18 From business (net) 68.3 58.5 54.4 54.0 69.5 54.7 55.2 19 From persons 79.1 81.6 81.2 81.9 82.7 83.7 84.7 20 From the rest of the world 0.5 0.0 0.0 0.0 0.0 0.0 0.0 21 Current surplus of government enterprises -9.6 -6.6 -6.4 -6.3 -6.7 -7.7 -6.9 22 Current expenditures 2,497.0 2,583.7 2,573.8 2,600.9 2,620.1 2,645.1 2,651.3 23 Consumption expenditures 1,650.8 1,693.6 1,689.4 1,704.4 1,712.2 1,733.4 1,743.7 24 Current transfer payments 664.0 692.6 687.1 697.1 708.1 712.2 709.0
25 Government social benefit payments topersons 664.0 692.6 687.1 697.1 708.1 712.2 709.0
26 Current transfer payments to the rest of theworld 0.0 0.0 0.0 0.0 0.0 0.0 0.0
27 Interest payments 1 181.7 197.0 196.8 198.9 199.3 199.0 198.0 28 To persons and business 1 179.2 194.0 193.9 195.9 195.8 195.7 194.8 29 To the rest of the world 2.5 3.0 2.9 3.0 3.5 3.3 3.2 30 Subsidies 0.5 0.5 0.5 0.5 0.5 0.5 0.5
31 Net state and local governmentsaving -146.4 -167.4 -184.9 -162.2 -161.9 -179.8 -205.2
32 Social insurance funds 5.3 5.4 5.4 5.4 5.4 5.3 5.3 33 Other -151.7 -172.8 -190.3 -167.6 -167.3 -185.2 -210.5
Addenda: 34 Total receipts 2,419.6 2,488.7 2,461.1 2,512.6 2,529.3 2,537.4 2,519.9 35 Current receipts 2,350.7 2,416.3 2,388.9 2,438.7 2,458.2 2,465.2 2,446.1 36 Capital transfer receipts 69.0 72.4 72.2 73.9 71.1 72.2 73.8 37 Total expenditures 2,600.8 2,682.0 2,673.5 2,691.4 2,712.7 2,737.5 2,731.4 38 Current expenditures 2,497.0 2,583.7 2,573.8 2,600.9 2,620.1 2,645.1 2,651.3 39 Gross government investment 344.1 342.7 343.9 335.6 339.2 342.5 332.5 40 Capital transfer payments 0.0 0.0 0.0 0.0 0.0 0.0 0.0 41 Net purchases of nonproduced assets 10.2 10.5 10.5 10.5 10.6 10.7 10.8 42 Less: Consumption of fixed capital 250.6 254.9 254.7 255.6 257.2 260.8 263.2 43 Net lending or net borrowing (-) -181.2 -193.4 -212.4 -178.8 -183.4 -200.1 -211.5
Legend / Footnotes:1. Prior to 1946, interest receipts (line 13) are not shown separately, but are shown net of interest payments. Interestpayments includes interest accrued on the actuarial liabilities of defined benefit pension plans for state and local governmentemployees.
Bureau of Economic AnalysisTable 3.3. State and Local Government Current Receipts and Expenditures[Billions of dollars] Seasonally adjusted at annual ratesLast Revised on: September 28, 2017 - Next Release Date October 27, 2017
Page 71 of 138
Line 2015 2016 2016 2017 II III IV I II
1 Government consumptionexpenditures and gross investment 1.4 0.8 -0.9 0.5 0.2 -0.6 -0.2
Legend / Footnotes:1. Government consumption expenditures are services (such as education and national defense) produced by government thatare valued at their cost of production. Excludes government sales to other sectors and government own-account investment(construction, software, and research and development). 2. Gross government investment consists of general government and government enterprise expenditures for fixed assets;inventory investment is included in government consumption expenditures.
Bureau of Economic AnalysisTable 3.9.1. Percent Change From Preceding Period in Real Government ConsumptionExpenditures and Gross Investment[Percent] Seasonally adjusted at annual ratesLast Revised on: September 28, 2017 - Next Release Date October 27, 2017
Page 72 of 138
Line 2015 2016 2016 2017 II III IV I II
Percent change at annual rate:
1 Government consumptionexpenditures and gross investment 1.4 0.8 -0.9 0.5 0.2 -0.6 -0.2
Legend / Footnotes:1. Government consumption expenditures are services (such as education and national defense) produced by government thatare valued at their cost of production. Excludes government sales to other sectors and government own-account investment(construction, software, and research and development). 2. Gross government investment consists of general government and government enterprise expenditures for fixed assets;inventory investment is included in government consumption expenditures.
Bureau of Economic AnalysisTable 3.9.2. Contributions to Percent Change in Real Government Consumption Expendituresand Gross InvestmentSeasonally adjusted at annual ratesLast Revised on: September 28, 2017 - Next Release Date October 27, 2017
Page 73 of 138
Line 2015 2016 2016 2017 II III IV I II
1 Government consumptionexpenditures and gross investment 93.184 93.884 93.760 93.877 93.917 93.770 93.724
Legend / Footnotes:1. Government consumption expenditures are services (such as education and national defense) produced by government thatare valued at their cost of production. Excludes government sales to other sectors and government own-account investment(construction, software, and research and development). 2. Gross government investment consists of general government and government enterprise expenditures for fixed assets;inventory investment is included in government consumption expenditures.
Bureau of Economic AnalysisTable 3.9.3. Real Government Consumption Expenditures and Gross Investment, QuantityIndexes[Index numbers, 2009=100] Seasonally adjustedLast Revised on: September 28, 2017 - Next Release Date October 27, 2017
Page 74 of 138
Line 2015 2016 2016 2017 II III IV I II
1 Government consumptionexpenditures and gross investment 111.825 112.676 112.608 112.919 113.291 114.624 115.088
Legend / Footnotes:1. Government consumption expenditures are services (such as education and national defense) produced by government thatare valued at their cost of production. Excludes government sales to other sectors and government own-account investment(construction, software, and research and development). 2. Gross government investment consists of general government and government enterprise expenditures for fixed assets;inventory investment is included in government consumption expenditures.
Bureau of Economic AnalysisTable 3.9.4. Price Indexes for Government Consumption Expenditures and Gross Investment[Index numbers, 2009=100] Seasonally adjustedLast Revised on: September 28, 2017 - Next Release Date October 27, 2017
Page 75 of 138
Line 2015 2016 2016 2017 II III IV I II
1 Government consumptionexpenditures and gross investment 3,218.9 3,267.8 3,261.5 3,274.6 3,286.8 3,320.2 3,332.1
Legend / Footnotes:1. Government consumption expenditures are services (such as education and national defense) produced by government thatare valued at their cost of production. Excludes government sales to other sectors and government own-account investment(construction, software, and research and development). 2. Gross government investment consists of general government and government enterprise expenditures for fixed assets;inventory investment is included in government consumption expenditures.
Bureau of Economic AnalysisTable 3.9.5. Government Consumption Expenditures and Gross Investment[Billions of dollars] Seasonally adjusted at annual ratesLast Revised on: September 28, 2017 - Next Release Date October 27, 2017
Page 76 of 138
Line 2015 2016 2016 2017 II III IV I II
1 Government consumptionexpenditures and gross investment 2,878.5 2,900.2 2,896.3 2,899.9 2,901.2 2,896.6 2,895.2
Legend / Footnotes:1. Government consumption expenditures are services (such as education and national defense) produced by government thatare valued at their cost of production. Excludes government sales to other sectors and government own-account investment(construction, software, and research and development). 2. Gross government investment consists of general government and government enterprise expenditures for fixed assets;inventory investment is included in government consumption expenditures. Note. Chained (2009) dollar series are calculated as the product of the chain-type quantity index and the 2009 current-dollarvalue of the corresponding series, divided by 100. Because the formula for the chain-type quantity indexes uses weights ofmore than one period, the corresponding chained-dollar estimates are usually not additive. The residual line is the differencebetween the first line and the sum of the most detailed lines.
Bureau of Economic AnalysisTable 3.9.6. Real Government Consumption Expenditures and Gross Investment, ChainedDollars[Billions of chained (2009) dollars] Seasonally adjusted at annual ratesLast Revised on: September 28, 2017 - Next Release Date October 27, 2017
51 Consumption of generalgovernment fixed capital 2
1.1 1.1 1.1 1.1 1.1 -0.1 2.3
Bureau of Economic AnalysisTable 3.10.1. Percent Change From Preceding Period in Real Government ConsumptionExpenditures and General Government Gross Output[Percent] Seasonally adjusted at annual ratesLast Revised on: September 28, 2017 - Next Release Date October 27, 2017
Page 78 of 138
Bureau of Economic AnalysisTable 3.10.1. Percent Change From Preceding Period in Real Government ConsumptionExpenditures and General Government Gross Output[Percent] Seasonally adjusted at annual ratesLast Revised on: September 28, 2017 - Next Release Date October 27, 2017
58 Tuition and related educationalcharges -1.0 -0.7 -0.7 0.7 -0.9 2.0 2.8
59 Health and hospital charges 4.1 3.3 2.6 1.3 1.3 2.0 2.8 60 Other sales 5 2.2 1.2 1.1 1.1 2.1 2.9 2.8
Legend / Footnotes:1. Government consumption expenditures are services (such as education and national defense) produced by government thatare valued at their cost of production. Excludes government sales to other sectors and government own-account investment(construction, software, and research and development). 2. Consumption of fixed capital, or depreciation, is included in government gross output as a partial measure of the services ofgeneral government fixed assets; the use of depreciation assumes a zero net return on these assets. 3. Includes general government intermediate inputs for goods and services sold to other sectors and for own-accountinvestment. 4. Own-account investment is measured in current dollars by compensation of general government employees and relatedexpenditures for goods and services and is classified as investment in structures, software, and research and development intable 3.9.5. 5. Includes federal purchases of research and development produced by state and local general government.
Bureau of Economic AnalysisTable 3.10.1. Percent Change From Preceding Period in Real Government ConsumptionExpenditures and General Government Gross Output[Percent] Seasonally adjusted at annual ratesLast Revised on: September 28, 2017 - Next Release Date October 27, 2017
Bureau of Economic AnalysisTable 3.10.3. Real Government Consumption Expenditures and General Government GrossOutput, Quantity Indexes[Index numbers, 2009=100] Seasonally adjustedLast Revised on: September 28, 2017 - Next Release Date October 27, 2017
Page 81 of 138
Bureau of Economic AnalysisTable 3.10.3. Real Government Consumption Expenditures and General Government GrossOutput, Quantity Indexes[Index numbers, 2009=100] Seasonally adjustedLast Revised on: September 28, 2017 - Next Release Date October 27, 2017
58 Tuition and related educationalcharges 96.528 95.878 95.802 95.978 95.768 96.247 96.920
59 Health and hospital charges 114.476 118.231 118.141 118.512 118.900 119.494 120.331 60 Other sales 5 103.474 104.677 104.466 104.759 105.305 106.065 106.808
Legend / Footnotes:1. Government consumption expenditures are services (such as education and national defense) produced by government thatare valued at their cost of production. Excludes government sales to other sectors and government own-account investment(construction, software, and research and development). 2. Consumption of fixed capital, or depreciation, is included in government gross output as a partial measure of the services ofgeneral government fixed assets; the use of depreciation assumes a zero net return on these assets. 3. Includes general government intermediate inputs for goods and services sold to other sectors and for own-accountinvestment. 4. Own-account investment is measured in current dollars by compensation of general government employees and relatedexpenditures for goods and services and is classified as investment in structures, software, and research and development intable 3.9.5. 5. Includes federal purchases of research and development produced by state and local general government.
Bureau of Economic AnalysisTable 3.10.3. Real Government Consumption Expenditures and General Government GrossOutput, Quantity Indexes[Index numbers, 2009=100] Seasonally adjustedLast Revised on: September 28, 2017 - Next Release Date October 27, 2017
Bureau of Economic AnalysisTable 3.10.4. Price Indexes for Government Consumption Expenditures and GeneralGovernment Gross Output[Index numbers, 2009=100] Seasonally adjustedLast Revised on: September 28, 2017 - Next Release Date October 27, 2017
Page 84 of 138
Bureau of Economic AnalysisTable 3.10.4. Price Indexes for Government Consumption Expenditures and GeneralGovernment Gross Output[Index numbers, 2009=100] Seasonally adjustedLast Revised on: September 28, 2017 - Next Release Date October 27, 2017
58 Tuition and related educationalcharges 129.371 132.855 132.678 133.015 133.970 134.393 135.099
59 Health and hospital charges 111.697 113.046 112.785 113.361 113.764 114.075 114.544 60 Other sales 5 111.875 112.951 112.731 113.142 113.489 114.337 115.030
Legend / Footnotes:1. Government consumption expenditures are services (such as education and national defense) produced by government thatare valued at their cost of production. Excludes government sales to other sectors and government own-account investment(construction, software, and research and development). 2. Consumption of fixed capital, or depreciation, is included in government gross output as a partial measure of the services ofgeneral government fixed assets; the use of depreciation assumes a zero net return on these assets. 3. Includes general government intermediate inputs for goods and services sold to other sectors and for own-accountinvestment. 4. Own-account investment is measured in current dollars by compensation of general government employees and relatedexpenditures for goods and services and is classified as investment in structures, software, and research and development intable 3.9.5. 5. Includes federal purchases of research and development produced by state and local general government.
Bureau of Economic AnalysisTable 3.10.4. Price Indexes for Government Consumption Expenditures and GeneralGovernment Gross Output[Index numbers, 2009=100] Seasonally adjustedLast Revised on: September 28, 2017 - Next Release Date October 27, 2017
51 Consumption of generalgovernment fixed capital 2
192.9 196.1 196.1 196.6 197.6 199.2 201.4
Bureau of Economic AnalysisTable 3.10.5. Government Consumption Expenditures and General Government Gross Output[Billions of dollars] Seasonally adjusted at annual ratesLast Revised on: September 28, 2017 - Next Release Date October 27, 2017
Page 87 of 138
Bureau of Economic AnalysisTable 3.10.5. Government Consumption Expenditures and General Government Gross Output[Billions of dollars] Seasonally adjusted at annual ratesLast Revised on: September 28, 2017 - Next Release Date October 27, 2017
58 Tuition and related educationalcharges 98.9 100.8 100.6 101.1 101.6 102.4 103.7
59 Health and hospital charges 213.5 223.2 222.5 224.3 225.8 227.6 230.1 60 Other sales 5 142.7 145.7 145.1 146.1 147.3 149.5 151.4
Legend / Footnotes:1. Government consumption expenditures are services (such as education and national defense) produced by government thatare valued at their cost of production. Excludes government sales to other sectors and government own-account investment(construction, software, and research and development). 2. Consumption of fixed capital, or depreciation, is included in government gross output as a partial measure of the services ofgeneral government fixed assets; the use of depreciation assumes a zero net return on these assets. 3. Includes general government intermediate inputs for goods and services sold to other sectors and for own-accountinvestment. 4. Own-account investment is measured in current dollars by compensation of general government employees and relatedexpenditures for goods and services and is classified as investment in structures, software, and research and development intable 3.9.5. 5. Includes federal purchases of research and development produced by state and local general government.
Bureau of Economic AnalysisTable 3.10.5. Government Consumption Expenditures and General Government Gross Output[Billions of dollars] Seasonally adjusted at annual ratesLast Revised on: September 28, 2017 - Next Release Date October 27, 2017
51 Consumption of generalgovernment fixed capital 2
175.2 177.2 176.9 177.4 177.9 177.8 178.8
Bureau of Economic AnalysisTable 3.10.6. Real Government Consumption Expenditures and General Government GrossOutput, Chained Dollars[Billions of chained (2009) dollars] Seasonally adjusted at annual ratesLast Revised on: September 28, 2017 - Next Release Date October 27, 2017
Page 90 of 138
Bureau of Economic AnalysisTable 3.10.6. Real Government Consumption Expenditures and General Government GrossOutput, Chained Dollars[Billions of chained (2009) dollars] Seasonally adjusted at annual ratesLast Revised on: September 28, 2017 - Next Release Date October 27, 2017
Legend / Footnotes:1. Government consumption expenditures are services (such as education and national defense) produced by government thatare valued at their cost of production. Excludes government sales to other sectors and government own-account investment(construction, software, and research and development). 2. Consumption of fixed capital, or depreciation, is included in government gross output as a partial measure of the services ofgeneral government fixed assets; the use of depreciation assumes a zero net return on these assets. 3. Includes general government intermediate inputs for goods and services sold to other sectors and for own-accountinvestment. 4. Own-account investment is measured in current dollars by compensation of general government employees and relatedexpenditures for goods and services and is classified as investment in structures, software, and research and development intable 3.9.5. 5. Includes federal purchases of research and development produced by state and local general government. Note. Chained (2009) dollar series are calculated as the product of the chain-type quantity index and the 2009 current-dollarvalue of the corresponding series, divided by 100. Because the formula for the chain-type quantity indexes uses weights ofmore than one period, the corresponding chained-dollar estimates are usually not additive. The residual line is the differencebetween the first line and the sum of the most detailed lines.
Bureau of Economic AnalysisTable 3.10.6. Real Government Consumption Expenditures and General Government GrossOutput, Chained Dollars[Billions of chained (2009) dollars] Seasonally adjusted at annual ratesLast Revised on: September 28, 2017 - Next Release Date October 27, 2017
Page 92 of 138
Line 2015 2016 2016 2017 II III IV I II
1 National defense consumptionexpenditures and gross investment -2.2 -0.7 -2.1 2.5 -3.2 -3.3 4.7
2 Consumption expenditures 1 -2.2 -1.0 -1.3 3.2 -4.9 -6.5 0.6 3 Gross output of general government -2.2 -1.0 -1.2 3.2 -4.4 -6.1 0.8 4 Value added -2.1 -0.6 -0.6 0.3 -1.2 -1.2 -0.4
5 Compensation of general governmentemployees -2.4 -0.1 -0.3 1.3 -1.2 -1.1 0.2
Legend / Footnotes:1. National defense consumption expenditures are defense services produced by government that are valued at their cost ofproduction. Excludes government sales to other sectors and government own-account investment (construction, software, andresearch and development). 2. Consumption of fixed capital, or depreciation, is included in government gross output as a partial measure of the services ofgeneral government fixed assets; the use of depreciation assumes a zero net return on these assets. 3. Includes general government intermediate inputs for goods and services sold to other sectors and for own-accountinvestment. 4. Own-account investment is measured in current dollars by compensation of general government employees and relatedexpenditures for goods and services and is classified as investment in structures, software, and research and development. 5. Gross government investment consists of general government and government enterprise expenditures for fixed assets;inventory investment is included in government consumption expenditures.
Bureau of Economic AnalysisTable 3.11.1. Percent Change From Preceding Period in Real National Defense ConsumptionExpenditures and Gross Investment by Type[Percent] Seasonally adjusted at annual ratesLast Revised on: September 28, 2017 - Next Release Date October 27, 2017
Page 93 of 138
Line 2015 2016 2016 2017 II III IV I II
Percent change at annual rate:
1 National defense consumptionexpenditures and gross investment -2.2 -0.7 -2.1 2.5 -3.2 -3.3 4.7
Percentage points at annual rates: 2 Consumption expenditures 1 -1.80 -0.84 -1.09 2.51 -3.99 -5.32 0.51 3 Gross output of general government -1.83 -0.82 -1.05 2.61 -3.76 -5.20 0.70 4 Value added -1.13 -0.32 -0.36 0.17 -0.66 -0.66 -0.22
5 Compensation of general governmentemployees -0.77 -0.05 -0.10 0.43 -0.39 -0.38 0.07
Legend / Footnotes:1. National defense consumption expenditures are defense services produced by government that are valued at their cost ofproduction. Excludes government sales to other sectors and government own-account investment (construction, software, andresearch and development). 2. Consumption of fixed capital, or depreciation, is included in government gross output as a partial measure of the services ofgeneral government fixed assets; the use of depreciation assumes a zero net return on these assets. 3. Includes general government intermediate inputs for goods and services sold to other sectors and for own-accountinvestment. 4. Own-account investment is measured in current dollars by compensation of general government employees and relatedexpenditures for goods and services and is classified as investment in structures, software, and research and development. 5. Gross government investment consists of general government and government enterprise expenditures for fixed assets;inventory investment is included in government consumption expenditures.
Bureau of Economic AnalysisTable 3.11.2. Contributions to Percent Change in National Defense Consumption Expendituresand Gross Investment by TypeSeasonally adjusted at annual ratesLast Revised on: September 28, 2017 - Next Release Date October 27, 2017
Page 94 of 138
Line 2015 2016 2016 2017 II III IV I II
1 National defense consumptionexpenditures and gross investment 85.244 84.613 84.414 84.941 84.246 83.545 84.514
2 Consumption expenditures 1 87.596 86.686 86.547 87.222 86.136 84.702 84.830 3 Gross output of general government 88.247 87.383 87.222 87.901 86.915 85.566 85.739 4 Value added 97.434 96.857 96.855 96.927 96.633 96.343 96.245
5 Compensation of general governmentemployees 94.295 94.157 94.055 94.361 94.085 93.819 93.865
Legend / Footnotes:1. National defense consumption expenditures are defense services produced by government that are valued at their cost ofproduction. Excludes government sales to other sectors and government own-account investment (construction, software, andresearch and development). 2. Consumption of fixed capital, or depreciation, is included in government gross output as a partial measure of the services ofgeneral government fixed assets; the use of depreciation assumes a zero net return on these assets. 3. Includes general government intermediate inputs for goods and services sold to other sectors and for own-accountinvestment. 4. Own-account investment is measured in current dollars by compensation of general government employees and relatedexpenditures for goods and services and is classified as investment in structures, software, and research and development. 5. Gross government investment consists of general government and government enterprise expenditures for fixed assets;inventory investment is included in government consumption expenditures.
Bureau of Economic AnalysisTable 3.11.3. Real National Defense Consumption Expenditures and Gross Investment byType, Quantity Indexes[Index numbers, 2009=100] Seasonally adjustedLast Revised on: September 28, 2017 - Next Release Date October 27, 2017
Page 95 of 138
Line 2015 2016 2016 2017 II III IV I II
1 National defense consumptionexpenditures and gross investment 108.872 109.285 109.235 109.368 109.562 110.882 111.280
2 Consumption expenditures 1 109.493 110.071 110.008 110.171 110.404 111.966 112.388 3 Gross output of general government 109.429 110.019 109.950 110.123 110.358 111.915 112.338 4 Value added 109.937 110.884 110.844 110.909 111.134 112.874 113.303
5 Compensation of general governmentemployees 110.829 112.380 112.306 112.385 112.662 115.272 115.793
Legend / Footnotes:1. National defense consumption expenditures are defense services produced by government that are valued at their cost ofproduction. Excludes government sales to other sectors and government own-account investment (construction, software, andresearch and development). 2. Consumption of fixed capital, or depreciation, is included in government gross output as a partial measure of the services ofgeneral government fixed assets; the use of depreciation assumes a zero net return on these assets. 3. Includes general government intermediate inputs for goods and services sold to other sectors and for own-accountinvestment. 4. Own-account investment is measured in current dollars by compensation of general government employees and relatedexpenditures for goods and services and is classified as investment in structures, software, and research and development. 5. Gross government investment consists of general government and government enterprise expenditures for fixed assets;inventory investment is included in government consumption expenditures.
Bureau of Economic AnalysisTable 3.11.4. Price Indexes for National Defense Consumption Expenditures and GrossInvestment by Type[Index numbers, 2009=100] Seasonally adjustedLast Revised on: September 28, 2017 - Next Release Date October 27, 2017
Page 96 of 138
Line 2015 2016 2016 2017 II III IV I II
1 National defense consumptionexpenditures and gross investment 731.6 728.9 726.9 732.3 727.6 730.2 741.4
2 Consumption expenditures 1 588.2 585.2 583.9 589.3 583.2 581.6 584.7 3 Gross output of general government 614.7 612.0 610.5 616.2 610.6 609.6 613.1 4 Value added 400.0 401.1 400.9 401.5 401.1 406.1 407.2
5 Compensation of general governmentemployees 239.1 242.1 241.7 242.6 242.5 247.4 248.7
Legend / Footnotes:1. National defense consumption expenditures are defense services produced by government that are valued at their cost ofproduction. Excludes government sales to other sectors and government own-account investment (construction, software, andresearch and development). 2. Consumption of fixed capital, or depreciation, is included in government gross output as a partial measure of the services ofgeneral government fixed assets; the use of depreciation assumes a zero net return on these assets. 3. Includes general government intermediate inputs for goods and services sold to other sectors and for own-accountinvestment. 4. Own-account investment is measured in current dollars by compensation of general government employees and relatedexpenditures for goods and services and is classified as investment in structures, software, and research and development. 5. Gross government investment consists of general government and government enterprise expenditures for fixed assets;inventory investment is included in government consumption expenditures.
Bureau of Economic AnalysisTable 3.11.5. National Defense Consumption Expenditures and Gross Investment by Type[Billions of dollars] Seasonally adjusted at annual ratesLast Revised on: September 28, 2017 - Next Release Date October 27, 2017
Page 97 of 138
Line 2015 2016 2016 2017 II III IV I II
1 National defense consumptionexpenditures and gross investment 672.0 667.0 665.4 669.6 664.1 658.6 666.2
2 Consumption expenditures 1 537.2 531.6 530.8 534.9 528.3 519.5 520.3 3 Gross output of general government 561.7 556.2 555.2 559.5 553.3 544.7 545.8 4 Value added 363.9 361.7 361.7 362.0 360.9 359.8 359.4
5 Compensation of general governmentemployees 215.8 215.4 215.2 215.9 215.3 214.7 214.8
Legend / Footnotes:1. National defense consumption expenditures are defense services produced by government that are valued at their cost ofproduction. Excludes government sales to other sectors and government own-account investment (construction, software, andresearch and development). 2. Consumption of fixed capital, or depreciation, is included in government gross output as a partial measure of the services ofgeneral government fixed assets; the use of depreciation assumes a zero net return on these assets. 3. Includes general government intermediate inputs for goods and services sold to other sectors and for own-accountinvestment. 4. Own-account investment is measured in current dollars by compensation of general government employees and relatedexpenditures for goods and services and is classified as investment in structures, software, and research and development. 5. Gross government investment consists of general government and government enterprise expenditures for fixed assets;inventory investment is included in government consumption expenditures. Note. Chained (2009) dollar series are calculated as the product of the chain-type quantity index and the 2009 current-dollarvalue of the corresponding series, divided by 100. Because the formula for the chain-type quantity indexes uses weights ofmore than one period, the corresponding chained-dollar estimates are usually not additive. The residual line is the differencebetween the first line and the sum of the most detailed lines.
Bureau of Economic AnalysisTable 3.11.6. Real National Defense Consumption Expenditures and Gross Investment byType, Chained Dollars[Billions of chained (2009) dollars] Seasonally adjusted at annual ratesLast Revised on: September 28, 2017 - Next Release Date October 27, 2017
Page 98 of 138
Line 2015 2016 2016 2017 II III IV I II
1 Current receipts from the rest of theworld 3,209.1 3,199.1 3,186.2 3,237.2 3,268.6 3,353.9 3,371.3
28 Reinvested earnings on foreign directinvestment in the United States 80.9 97.8 108.8 115.8 74.3 99.8 79.4
29 Current taxes and transfer payments to therest of the world 2
262.3 277.1 265.8 279.3 286.7 281.1 290.6
30 From persons 176.5 187.3 185.6 187.6 193.5 190.8 192.4 31 From government 73.5 74.5 68.9 75.2 73.2 75.5 72.7 32 From business 12.3 15.3 11.3 16.5 19.9 14.9 25.4 33 Balance on current account, NIPAs -450.6 -460.9 -431.7 -443.4 -477.0 -487.4 -513.7
Addenda: 34 Net lending or net borrowing (-), NIPAs -451.0 -461.4 -432.1 -443.8 -477.4 -487.7 -514.1 35 Balance on current account, NIPAs -450.6 -460.9 -431.7 -443.4 -477.0 -487.4 -513.7
36 Less: Capital account transactions (net) 3
0.4 0.4 0.4 0.4 0.4 0.4 0.4
Legend / Footnotes:1. Exports and imports of certain goods, primarily military equipment purchased and sold by the federal government, areincluded in services. Beginning with 1986, repairs and alterations of equipment are reclassified from goods to services. 2. Prior to 1999, current taxes, contributions for government social insurance, and transfer receipts from the rest of the world(line 13) are not separately displayed, and line 29 includes current taxes and transfer payments to the rest of the world net ofcurrent taxes, contributions for government social insurance, and transfer receipts from the rest of the world. 3. Consists of capital transfers and the acquisition and disposal of nonproduced nonfinancial assets. Prior to 1982, reflects onlycapital grants paid to the U.S. territories and the Commonwealths of Puerto Rico and Northern Mariana Islands.
Bureau of Economic AnalysisTable 4.1. Foreign Transactions in the National Income and Product Accounts[Billions of dollars] Seasonally adjusted at annual ratesLast Revised on: September 28, 2017 - Next Release Date October 27, 2017
Bureau of Economic AnalysisTable 4.2.1. Percent Change From Preceding Period in Real Exports and in Real Imports ofGoods and Services by Type of Product[Percent] Seasonally adjusted at annual ratesLast Revised on: September 28, 2017 - Next Release Date October 27, 2017
Legend / Footnotes:n.e.c. Not elsewhere classified 1. Exports and imports of certain goods, primarily military equipment purchased and sold by the federal government, areincluded in services. Beginning with 1986, repairs and alterations of equipment are reclassified from goods to services. 2. Includes net exports of goods under merchanting, beginning in 1999, reclassified from services to goods. 3. Includes maintenance and repair services, insurance services, financial services, telecommunication, computer andinformation services and other other business services. 4. Includes parts of foods, feeds, and beverages, of nondurable industrial supplies and materials, and of nondurablenonautomotive consumer goods.
Bureau of Economic AnalysisTable 4.2.1. Percent Change From Preceding Period in Real Exports and in Real Imports ofGoods and Services by Type of Product[Percent] Seasonally adjusted at annual ratesLast Revised on: September 28, 2017 - Next Release Date October 27, 2017
45 Charges for the use of intellectual propertyn.e.c. -0.08 0.15 0.09 0.94 -0.43 0.11 0.14
46 Other business services 3 0.13 -0.14 -0.30 0.10 0.47 -0.25 0.23 47 Government goods and services n.e.c. 0.00 -0.01 0.02 -0.03 0.10 0.08 -0.07 48 Other 0.01 0.01 0.00 0.00 -0.01 0.01 0.01
Legend / Footnotes:n.e.c. Not elsewhere classified 1. Exports and imports of certain goods, primarily military equipment purchased and sold by the federal government, areincluded in services. 2. Includes net exports of goods under merchanting, beginning in 1999, reclassified from services to goods. 3. Includes maintenance and repair services, insurance services, financial services, telecommunication, computer andinformation services and other other business services.
Bureau of Economic AnalysisTable 4.2.2. Contributions to Percent Change in Real Exports and Real Imports of Goods andServices by Type of ProductSeasonally adjusted at annual ratesLast Revised on: September 28, 2017 - Next Release Date October 27, 2017
Bureau of Economic AnalysisTable 4.2.3. Real Exports and Imports of Goods and Services by Type of Product, QuantityIndexes[Index numbers, 2009=100] Seasonally adjustedLast Revised on: September 28, 2017 - Next Release Date October 27, 2017
Legend / Footnotes:n.e.c. Not elsewhere classified 1. Exports and imports of certain goods, primarily military equipment purchased and sold by the federal government, areincluded in services. Beginning with 1986, repairs and alterations of equipment are reclassified from goods to services. 2. Includes net exports of goods under merchanting, beginning in 1999, reclassified from services to goods. 3. Includes maintenance and repair services, insurance services, financial services, telecommunication, computer andinformation services and other other business services. 4. Includes parts of foods, feeds, and beverages, of nondurable industrial supplies and materials, and of nondurablenonautomotive consumer goods.
Bureau of Economic AnalysisTable 4.2.3. Real Exports and Imports of Goods and Services by Type of Product, QuantityIndexes[Index numbers, 2009=100] Seasonally adjustedLast Revised on: September 28, 2017 - Next Release Date October 27, 2017
Bureau of Economic AnalysisTable 4.2.4. Price Indexes for Exports and Imports of Goods and Services by Type of Product[Index numbers, 2009=100] Seasonally adjustedLast Revised on: September 28, 2017 - Next Release Date October 27, 2017
Legend / Footnotes:n.e.c. Not elsewhere classified 1. Exports and imports of certain goods, primarily military equipment purchased and sold by the federal government, areincluded in services. Beginning with 1986, repairs and alterations of equipment are reclassified from goods to services. 2. Includes net exports of goods under merchanting, beginning in 1999, reclassified from services to goods. 3. Includes maintenance and repair services, insurance services, financial services, telecommunication, computer andinformation services and other other business services. 4. Includes parts of foods, feeds, and beverages, of nondurable industrial supplies and materials, and of nondurablenonautomotive consumer goods.
Bureau of Economic AnalysisTable 4.2.4. Price Indexes for Exports and Imports of Goods and Services by Type of Product[Index numbers, 2009=100] Seasonally adjustedLast Revised on: September 28, 2017 - Next Release Date October 27, 2017
Bureau of Economic AnalysisTable 4.2.5. Exports and Imports of Goods and Services by Type of Product[Billions of dollars] Seasonally adjusted at annual ratesLast Revised on: September 28, 2017 - Next Release Date October 27, 2017
Legend / Footnotes:n.e.c. Not elsewhere classified 1. Exports and imports of certain goods, primarily military equipment purchased and sold by the federal government, areincluded in services. Beginning with 1986, repairs and alterations of equipment are reclassified from goods to services. 2. Includes net exports of goods under merchanting, beginning in 1999, reclassified from services to goods. 3. Includes maintenance and repair services, insurance services, financial services, telecommunication, computer andinformation services and other other business services. 4. Includes parts of foods, feeds, and beverages, of nondurable industrial supplies and materials, and of nondurablenonautomotive consumer goods.
Bureau of Economic AnalysisTable 4.2.5. Exports and Imports of Goods and Services by Type of Product[Billions of dollars] Seasonally adjusted at annual ratesLast Revised on: September 28, 2017 - Next Release Date October 27, 2017
46 Charges for the use of intellectual propertyn.e.c. 36.3 40.1 38.0 43.8 41.0 41.8 42.7
47 Other business services 4 212.8 209.3 207.7 208.3 211.4 209.7 211.2 48 Government goods and services n.e.c. 23.4 23.0 22.9 22.7 23.4 24.0 23.4 49 Other 6.0 6.1 6.2 6.2 6.1 6.2 6.2 50 Residual -67.6 -70.6 -68.1 -73.1 -73.6 -76.7 -78.4
Addenda:
Bureau of Economic AnalysisTable 4.2.6. Real Exports and Imports of Goods and Services by Type of Product, ChainedDollars[Billions of chained (2009) dollars] Seasonally adjusted at annual ratesLast Revised on: September 28, 2017 - Next Release Date October 27, 2017
Legend / Footnotes:n.e.c. Not elsewhere classified 1. Exports and imports of certain goods, primarily military equipment purchased and sold by the federal government, areincluded in services. Beginning with 1986, repairs and alterations of equipment are reclassified from goods to services. 2. The quantity index for computers can be used to accurately measure the real growth of this component. However, becausecomputers exhibit rapid changes in prices relative to other prices in the economy, the chained-dollar estimates should not beused to measure the component's relative importance or its contribution to the growth rate of more aggregate series; accurateestimates of these contributions are shown in table 4.2.2 and real growth rates are shown in table 4.2.1. 3. Includes net exports of goods under merchanting, beginning in 1999, reclassified from services to goods. 4. Includes maintenance and repair services, insurance services, financial services, telecommunication, computer andinformation services and other other business services. 5. Includes parts of foods, feeds, and beverages, of nondurable industrial supplies and materials, and of nondurablenonautomotive consumer goods. Note. Chained (2009) dollar series are calculated as the product of the chain-type quantity index and the 2009 current-dollarvalue of the corresponding series, divided by 100. Because the formula for the chain-type quantity indexes uses weights ofmore than one period, the corresponding chained-dollar estimates are usually not additive. For exports and for imports, theresidual line is the difference between the aggregate line and the sum of the most detailed lines.
Bureau of Economic AnalysisTable 4.2.6. Real Exports and Imports of Goods and Services by Type of Product, ChainedDollars[Billions of chained (2009) dollars] Seasonally adjusted at annual ratesLast Revised on: September 28, 2017 - Next Release Date October 27, 2017
Bureau of Economic AnalysisTable 5.1. Saving and Investment by Sector[Billions of dollars] Seasonally adjusted at annual ratesLast Revised on: September 28, 2017 - Next Release Date October 27, 2017
Page 111 of 138
Line 2015 2016 2016 2017 II III IV I II
51 Domestic business 565.2 425.4 402.2 412.8 457.3 425.4 457.8 52 Households and institutions 208.8 241.3 238.6 234.5 247.7 250.8 236.4 53 Government 86.2 83.5 83.6 75.1 79.9 85.3 80.8 54 Federal -7.3 -4.3 -5.6 -5.0 -2.1 3.5 11.5 55 State and local 93.5 87.8 89.2 80.0 82.0 81.8 69.3
56 Gross saving as a percentage of grossnational income 18.9 17.7 17.7 17.8 17.2 17.4 17.3
57 Net saving as a percentage of grossnational income 3.6 2.3 2.3 2.5 1.8 1.9 1.8
58 Disaster losses 2 0.0 0.0 0.0 0.0 0.0 0.0 0.0 59 Private 0.0 0.0 0.0 0.0 0.0 0.0 0.0 60 Domestic business 0.0 0.0 0.0 0.0 0.0 0.0 0.0 61 Households and institutions 0.0 0.0 0.0 0.0 0.0 0.0 0.0 62 Government 0.0 0.0 0.0 0.0 0.0 0.0 0.0 63 Federal 0.0 0.0 0.0 0.0 0.0 0.0 0.0 64 State and local 0.0 0.0 0.0 0.0 0.0 0.0 0.0
Legend / Footnotes:1. Consists of capital transfers and the acquisition and disposal of nonproduced nonfinancial assets. Prior to 1982, reflects onlycapital grants paid to the U.S. territories and the Commonwealths of Puerto Rico and Northern Mariana Islands. 2. Consists of damages to fixed assets.
Bureau of Economic AnalysisTable 5.1. Saving and Investment by Sector[Billions of dollars] Seasonally adjusted at annual ratesLast Revised on: September 28, 2017 - Next Release Date October 27, 2017
31 Private fixed investment in informationprocessing equipment and software 5.0 4.6 7.8 6.4 2.5 6.3 8.5
Legend / Footnotes:1. Includes petroleum and mineral exploration. 2. Consists primarily of religious, educational, vocational, lodging, railroads, farm, and amusement and recreational structures, net purchases of used structures, andbrokers' commissions on the sale of structures. 3. Includes communication equipment, nonmedical instruments, medical equipment and instruments, photocopy and related equipment, and office and accountingequipment. 4. Consists primarily of furniture and fixtures, agricultural machinery, construction machinery, mining and oilfield machinery, service industry machinery, and electricalequipment not elsewhere classified. 5. Excludes software embedded, or bundled, in computers and other equipment. 6. Research and development investment excludes expenditures for software development. Software development expenditures are included in software investment on line17. 7. Consists primarily of manufactured homes, improvements, dormitories, net purchases of used structures, and brokers' commissions on the sale of residential structuresand adjoining land, and other ownership transfer costs. 8. Excludes net purchases of used structures and brokers' commissions on the sale of structures. 9. Excludes net purchases of used structures and brokers' commissions and other ownership transfer costs.
Bureau of Economic AnalysisTable 5.3.1. Percent Change From Preceding Period in Real Private Fixed Investment by Type[Percent] Seasonally adjusted at annual ratesLast Revised on: September 28, 2017 - Next Release Date October 27, 2017
Page 113 of 138
Bureau of Economic AnalysisTable 5.3.1. Percent Change From Preceding Period in Real Private Fixed Investment by Type[Percent] Seasonally adjusted at annual ratesLast Revised on: September 28, 2017 - Next Release Date October 27, 2017
31 Private fixed investment in informationprocessing equipment and software 1.07 0.97 1.63 1.37 0.53 1.36 1.79
Legend / Footnotes:1. Includes petroleum and mineral exploration. 2. Consists primarily of religious, educational, vocational, lodging, railroads, farm, and amusement and recreational structures,net purchases of used structures, and brokers' commissions on the sale of structures. 3. Includes communication equipment, nonmedical instruments, medical equipment and instruments, photocopy and relatedequipment, and office and accounting equipment. 4. Consists primarily of furniture and fixtures, agricultural machinery, construction machinery, mining and oilfield machinery,service industry machinery, and electrical equipment not elsewhere classified. 5. Excludes software embedded, or bundled, in computers and other equipment. 6. Research and development investment excludes expenditures for software development. Software developmentexpenditures are included in software investment on line 17. 7. Consists primarily of manufactured homes, improvements, dormitories, net purchases of used structures, and brokers'commissions on the sale of residential structures and adjoining land, and other ownership transfer costs. 8. Excludes net purchases of used structures and brokers' commissions on the sale of structures. 9. Excludes net purchases of used structures and brokers' commissions and other ownership transfer costs.
Bureau of Economic AnalysisTable 5.3.2. Contributions to Percent Change in Real Private Fixed Investment by TypeSeasonally adjusted at annual ratesLast Revised on: September 28, 2017 - Next Release Date October 27, 2017
31 Private fixed investment in informationprocessing equipment and software 132.824 138.892 138.235 140.409 141.262 143.429 146.396
Legend / Footnotes:1. Includes petroleum and mineral exploration. 2. Consists primarily of religious, educational, vocational, lodging, railroads, farm, and amusement and recreational structures, net purchases of used structures, andbrokers' commissions on the sale of structures. 3. Annual chain-type quantity indexes for computers and peripheral equipment: 1959, .0000041; 1960, .000051; 1961, .000093; 1962, .00017; 1963, .00056. Quarterlychain-type quantity indexes for computers and peripheral equipment: 1959:1, .0000006; 1959:2, .0000003; 1959:3, .0000033; 1959:4, .0000123; 1960:1, .000035;1960:2, .000040, 1960:3, .000054; 1960:4, .000073; 1961:1, .000073; 1961:2, .000077; 1961:3, .000110; 1961:4, .000111; 1962:1, .00013; 1962:2, .00013; 1962:3,.00018, 1962:4, .00027; 1963:1, .00040; 1963:2, .00053; 1963:3, .00063; 1963:4, .00069. 4. Includes communication equipment, nonmedical instruments, medical equipment and instruments, photocopy and related equipment, and office and accountingequipment. 5. Consists primarily of furniture and fixtures, agricultural machinery, construction machinery, mining and oilfield machinery, service industry machinery, and electricalequipment not elsewhere classified. 6. Excludes software embedded, or bundled, in computers and other equipment. 7. Research and development investment excludes expenditures for software development. Software development expenditures are included in software investment on line17.
Bureau of Economic AnalysisTable 5.3.3. Real Private Fixed Investment by Type, Quantity Indexes[Index numbers, 2009=100] Seasonally adjustedLast Revised on: September 28, 2017 - Next Release Date October 27, 2017
Page 116 of 138
8. Consists primarily of manufactured homes, improvements, dormitories, net purchases of used structures, and brokers' commissions on the sale of residential structures. 9. Excludes net purchases of used structures and brokers' commissions on the sale of structures. 10. Excludes net purchases of used structures and brokers' commissions and other ownership transfer costs.
Bureau of Economic AnalysisTable 5.3.3. Real Private Fixed Investment by Type, Quantity Indexes[Index numbers, 2009=100] Seasonally adjustedLast Revised on: September 28, 2017 - Next Release Date October 27, 2017
31 Private fixed investment in informationprocessing equipment and software 93.266 92.191 92.278 92.049 91.953 91.635 91.881
Legend / Footnotes:1. Includes petroleum and mineral exploration. 2. Consists primarily of religious, educational, vocational, lodging, railroads, farm, and amusement and recreational structures, net purchases of used structures, andbrokers' commissions on the sale of structures. 3. Includes communication equipment, nonmedical instruments, medical equipment and instruments, photocopy and related equipment, and office and accountingequipment. 4. Consists primarily of furniture and fixtures, agricultural machinery, construction machinery, mining and oilfield machinery, service industry machinery, and electricalequipment not elsewhere classified. 5. Excludes software embedded, or bundled, in computers and other equipment. 6. Research and development investment excludes expenditures for software development. Software development expenditures are included in software investment on line17. 7. Consists primarily of manufactured homes, improvements, dormitories, net purchases of used structures, and brokers' commissions on the sale of residential structuresand adjoining land, and other ownership transfer costs. 8. Excludes net purchases of used structures and brokers' commissions on the sale of structures. 9. Excludes net purchases of used structures and brokers' commissions and other ownership transfer costs.
Bureau of Economic AnalysisTable 5.3.4. Price Indexes for Private Fixed Investment by Type[Index numbers, 2009=100] Seasonally adjustedLast Revised on: September 28, 2017 - Next Release Date October 27, 2017
Page 118 of 138
Bureau of Economic AnalysisTable 5.3.4. Price Indexes for Private Fixed Investment by Type[Index numbers, 2009=100] Seasonally adjustedLast Revised on: September 28, 2017 - Next Release Date October 27, 2017
31 Private fixed investment in informationprocessing equipment and software 635.3 656.7 654.2 662.9 666.2 674.1 689.9
Legend / Footnotes:1. Includes petroleum and mineral exploration. 2. Consists primarily of religious, educational, vocational, lodging, railroads, farm, and amusement and recreational structures, net purchases of used structures, andbrokers' commissions on the sale of structures. 3. Includes communication equipment, nonmedical instruments, medical equipment and instruments, photocopy and related equipment, and office and accountingequipment. 4. Consists primarily of furniture and fixtures, agricultural machinery, construction machinery, mining and oilfield machinery, service industry machinery, and electricalequipment not elsewhere classified. 5. Excludes software embedded, or bundled, in computers and other equipment. 6. Research and development investment excludes expenditures for software development. Software development expenditures are included in software investment on line17. 7. Consists primarily of manufactured homes, improvements, dormitories, net purchases of used structures, and brokers' commissions on the sale of residential structuresand adjoining land, and other ownership transfer costs. 8. Excludes net purchases of used structures and brokers' commissions on the sale of structures. 9. Excludes net purchases of used structures and brokers' commissions and other ownership transfer costs.
Bureau of Economic AnalysisTable 5.3.5. Private Fixed Investment by Type[Billions of dollars] Seasonally adjusted at annual ratesLast Revised on: September 28, 2017 - Next Release Date October 27, 2017
Page 120 of 138
Bureau of Economic AnalysisTable 5.3.5. Private Fixed Investment by Type[Billions of dollars] Seasonally adjusted at annual ratesLast Revised on: September 28, 2017 - Next Release Date October 27, 2017
32 Private fixed investment in informationprocessing equipment and software 681.2 712.3 708.9 720.1 724.5 735.6 750.8
Legend / Footnotes:1. Includes petroleum and mineral exploration. 2. Consists primarily of religious, educational, vocational, lodging, railroads, farm, and amusement and recreational structures, net purchases of used structures, andbrokers' commissions on the sale of structures. 3. The quantity index for computers can be used to accurately measure the real growth rate of this component. However, because computers exhibit rapid changes inprices relative to other prices in the economy, the chained-dollar estimates should not be used to measure the component's relative importance or its contribution to thegrowth rate of more aggregate series; accurate estimates of these contributions are shown in table 5.3.2 and real growth rates are shown in table 5.3.1. 4. Includes communication equipment, nonmedical instruments, medical equipment and instruments, photocopy and related equipment, and office and accountingequipment. 5. Consists primarily of furniture and fixtures, agricultural machinery, construction machinery, mining and oilfield machinery, service industry machinery, and electricalequipment not elsewhere classified. 6. Excludes software embedded, or bundled, in computers and other equipment. 7. Research and development investment excludes expenditures for software development. Software development expenditures are included in software investment on line17.
Bureau of Economic AnalysisTable 5.3.6. Real Private Fixed Investment by Type, Chained Dollars[Billions of chained (2009) dollars] Seasonally adjusted at annual ratesLast Revised on: September 28, 2017 - Next Release Date October 27, 2017
Page 122 of 138
8. Consists primarily of manufactured homes, improvements, dormitories, net purchases of used structures, and brokers' commissions on the sale of residential structures. 9. Excludes net purchases of used structures and brokers' commissions on the sale of structures. 10. Excludes net purchases of used structures and brokers' commissions and other ownership transfer costs. Note. Chained (2009) dollar series are calculated as the product of the chain-type quantity index and the 2009 current-dollar value of the corresponding series, divided by100. Because the formula for the chain-type quantity indexes uses weights of more than one period, the corresponding chained-dollar estimates are usually not additive.The residual line is the difference between the first line and the sum of the most detailed lines.
Bureau of Economic AnalysisTable 5.3.6. Real Private Fixed Investment by Type, Chained Dollars[Billions of chained (2009) dollars] Seasonally adjusted at annual ratesLast Revised on: September 28, 2017 - Next Release Date October 27, 2017
Legend / Footnotes:1. This series is derived from the Census Bureau series 'current cost inventories.' 2. The inventory valuation adjustment (IVA) shown in this table differs from the IVA that adjusts business incomes. The IVA in this table reflects the mix of methods (suchas first-in, first-out and last-in, first-out) underlying inventories derived primarily from Census Bureau statistics (see footnote 1).This mix differs from that underlyingbusiness income derived primarily from Internal Revenue Service statistics. Note. Estimates in this table are based on the North American Industry Classification System (NAICS).
Bureau of Economic AnalysisTable 5.7.5B. Change in Private Inventories by Industry[Billions of dollars] Seasonally adjusted at annual ratesLast Revised on: September 28, 2017 - Next Release Date October 27, 2017
Legend / Footnotes:Note. Estimates in this table are based on the North American Industry Classification System (NAICS). Chained (2009) dollar series for real change in private inventories are calculated as the period-to-period change in chained-dollar end-of-period inventories. Quarterlychanges in end-of-period inventories are stated at annual rates. Because the formula for the chain-type quantity indexes uses weights of more than one period, thecorresponding chained-dollar estimates are usually not additive. The residual line is the difference between the first line and the sum of the most detailed lines.
Bureau of Economic AnalysisTable 5.7.6B. Change in Real Private Inventories by Industry, Chained Dollars[Billions of chained (2009) dollars] Seasonally adjusted at annual ratesLast Revised on: September 28, 2017 - Next Release Date October 27, 2017
26 Final sales of goods and structuresof domestic business 2
574.2 578.1 580.4 588.4 594.1
Ratios of private inventories to finalsales of domestic business:
27 Private inventories to final sales 2.36 2.32 2.35 2.36 2.34 28 Nonfarm inventories to final sales 2.17 2.15 2.17 2.18 2.16
29 Nonfarm inventories to final sales ofgoods and structures 4.03 4.01 4.06 4.07 4.04
Legend / Footnotes:1. Inventories are as of the end of the quarter. The quarter-to-quarter change in inventories calculated from current-dollar inventories in this table is not the current-dollarchange in private inventories component of GDP. The former is the difference between two inventory stocks, each valued at its respective end-of-quarter prices. The latteris the change in the physical volume of inventories valued at average prices of the quarter. In addition, changes calculated from this table are at quarterly rates, whereas,the change in private inventories is stated at annual rates. 2. Quarterly totals at monthly rates. Final sales of domestic business equals final sales of domestic product less gross output of general government, gross value added ofnonprofit institutions, compensation paid to domestic workers, and imputed rental of owner-occupied nonfarm housing. It includes a small amount of final sales by farm andby government enterprises. Note. Estimates in this table are based on the North American Industry Classification System (NAICS).
Bureau of Economic AnalysisTable 5.8.5B. Private Inventories and Domestic Final Sales by Industry[Billions of dollars] Seasonally adjusted at annual ratesLast Revised on: September 28, 2017 - Next Release Date October 27, 2017
27 Final sales of goods and structuresof domestic business 2
546.9 551.4 551.6 558.3 564.4
Ratios of private inventories to final salesof domestic business:
28 Private inventories to final sales 2.37 2.35 2.36 2.34 2.32 29 Nonfarm inventories to final sales 2.21 2.20 2.21 2.19 2.17
30 Nonfarm inventories to final sales of goodsand structures 3.92 3.90 3.93 3.88 3.84
Legend / Footnotes:1. Inventories are as of the end of the quarter.The quarter-to-quarter changes calculated from this table are at quarterly rates, whereas the change in private inventoriescomponent of GDP is stated at annual rates. 2. Quarterly totals at monthly rates. Final sales of domestic business equals final sales of domestic product less gross output of general government, gross value added ofnonprofit institutions, compensation paid to domestic workers, and imputed rental of owner-occupied nonfarm housing. It includes a small amount of final sales by farm andby government enterprises. Note. Estimates in this table are based on the North American Industry Classification System (NAICS). Chained (2009) dollar inventory series are calculated to ensure that the chained (2009) dollar change in inventories for 2009 equals the current-dollar change in inventoriesfor 2009 and that the average of the 2008 and 2009 end-of-year chain-weighted and fixed-weighted inventories are equal.
Bureau of Economic AnalysisTable 5.8.6B. Real Private Inventories and Real Domestic Final Sales by Industry, Chained Dollars[Billions of chained (2009) dollars] Seasonally adjusted at annual ratesLast Revised on: September 28, 2017 - Next Release Date October 27, 2017
Legend / Footnotes:1. Implicit price deflators are as of the end of the quarter and are consistent with inventory stocks. Note. Estimates in this table are based on the North American Industry Classification System (NAICS).
Bureau of Economic AnalysisTable 5.8.9B. Implicit Price Deflators for Private Inventories by Industry[Index numbers, 2009=100] Seasonally adjustedLast Revised on: September 28, 2017 - Next Release Date October 27, 2017
Page 128 of 138
Line 2015 2016 2016 2017 II III IV I II
1 National income without capitalconsumption adjustment 15,639.6 15,941.7 15,850.9 16,071.4 16,102.3 16,281.6 16,426.5
19 Other services, except government 455.9 469.5 467.5 473.9 472.7 478.1 482.9 20 Government 1,822.5 1,873.7 1,868.7 1,882.8 1,887.3 1,909.6 1,920.7 21 Rest of the world 204.5 197.1 195.0 188.3 228.9 214.3 202.4
Legend / Footnotes:1. Consists of professional, scientific, and technical services; management of companies and enterprises; and administrative and waste management services. Note. Estimates in this table are based on the 2002 North American Industry Classification System (NAICS).
Bureau of Economic AnalysisTable 6.1D. National Income Without Capital Consumption Adjustment by Industry[Billions of dollars] Seasonally adjusted at annual ratesLast Revised on: September 28, 2017 - Next Release Date October 27, 2017
Page 129 of 138
Line 2015 2016 2016 2017 II III IV I II
1 Corporate profits with inventoryvaluation and capital consumptionadjustments
Legend / Footnotes:1. Consists of finance and insurance and bank and other holding companies. 2. Consists of credit intermediation and related activities; securities, commodity contracts, and other financial investments and related activities; insurance carriers andrelated activities; funds, trusts, and other financial vehicles; and bank and other holding companies. 3. Consists of wood products; nonmetallic mineral products; primary metals; other transportation equipment; furniture and related products; and miscellaneousmanufacturing. 4. Consists of textile mills and textile product mills; apparel; leather and allied products; paper products; printing and related support activities; and plastics and rubberproducts. 5. Consists of agriculture, forestry, fishing, and hunting; mining; construction; real estate and rental and leasing; professional, scientific, and technical services;administrative and waste management services; educational services; health care and social assistance; arts, entertainment, and recreation; accommodation and foodservices; and other services, except government.
Bureau of Economic AnalysisTable 6.16D. Corporate Profits by Industry[Billions of dollars] Seasonally adjusted at annual ratesLast Revised on: September 28, 2017 - Next Release Date October 27, 2017
Page 130 of 138
Note. Estimates in this table are based on the 2002 North American Industry Classification System (NAICS).
Bureau of Economic AnalysisTable 6.16D. Corporate Profits by Industry[Billions of dollars] Seasonally adjusted at annual ratesLast Revised on: September 28, 2017 - Next Release Date October 27, 2017
Bureau of Economic AnalysisTable 7.1. Selected Per Capita Product and Income Series in Current and Chained Dollars[Dollars] Seasonally adjusted at annual ratesLast Revised on: September 28, 2017 - Next Release Date October 27, 2017
42 Final sales of motor vehicles to domesticpurchasers 8.7 1.9 2.2 6.7 6.2 -9.7 1.9
43 Private fixed investment in new autos andnew light trucks 12.3 5.7 0.5 6.2 2.0 -12.7 -5.2
44 Domestic output of new autos 2 -4.2 -5.1 -6.6 7.6 -22.9 -21.5 -15.0 45 Sales of imported new autos 3 -3.2 -8.1 -4.2 15.2 -15.1 -1.6 -8.9
Legend / Footnotes:1. Consists of used light trucks only. 2. Consists of final sales and change in private inventories of new autos assembled in the United States. 3. Consists of sales of imported new autos in personal consumption expenditures, in private fixed investment, and in grossgovernment investment.
Bureau of Economic AnalysisTable 7.2.1B. Percent Change From Preceding Period in Real Motor Vehicle Output[Percent] Seasonally adjusted at annual ratesLast Revised on: September 28, 2017 - Next Release Date October 27, 2017
42 Final sales of motor vehicles to domesticpurchasers 184.397 187.984 185.999 189.044 191.913 187.073 187.961
43 Private fixed investment in new autos andnew light trucks 243.102 256.988 254.796 258.687 260.000 251.314 248.006
44 Domestic output of new autos 2 185.050 175.533 175.977 179.211 167.920 158.050 151.746 45 Sales of imported new autos 3 143.364 131.702 130.347 135.046 129.647 129.121 126.132
Legend / Footnotes:1. Consists of used light trucks only. 2. Consists of final sales and change in private inventories of new autos assembled in the United States. 3. Consists of sales of imported new autos in personal consumption expenditures, in private fixed investment, and in grossgovernment investment.
Bureau of Economic AnalysisTable 7.2.3B. Real Motor Vehicle Output, Quantity Indexes[Index numbers, 2009=100] Seasonally adjustedLast Revised on: September 28, 2017 - Next Release Date October 27, 2017
42 Final sales of motor vehicles to domesticpurchasers 109.608 109.375 109.278 109.344 109.289 109.982 109.316
43 Private fixed investment in new autos andnew light trucks 108.568 108.796 108.651 108.710 108.866 109.521 108.910
44 Domestic output of new autos 2 103.418 102.838 102.924 102.680 102.553 103.075 102.570 45 Sales of imported new autos 3 105.198 104.678 104.570 104.487 104.557 105.261 104.466
Legend / Footnotes:1. Consists of used light trucks only. 2. Consists of final sales and change in private inventories of new autos assembled in the United States. 3. Consists of sales of imported new autos in personal consumption expenditures, in private fixed investment, and in grossgovernment investment.
Bureau of Economic AnalysisTable 7.2.4B. Price Indexes for Motor Vehicle Output[Index numbers, 2009=100] Seasonally adjustedLast Revised on: September 28, 2017 - Next Release Date October 27, 2017
42 Final sales of motor vehicles to domesticpurchasers 653.5 664.8 657.2 668.3 678.1 665.2 664.3
43 Private fixed investment in new autos andnew light trucks 263.4 279.1 276.3 280.7 282.5 274.7 269.6
44 Domestic output of new autos 2 114.5 108.1 108.4 110.2 103.1 97.5 93.2 45 Sales of imported new autos 3 111.5 101.9 100.8 104.3 100.2 100.5 97.4
Legend / Footnotes:1. Consists of used light trucks only. 2. Consists of final sales and change in private inventories of new autos assembled in the United States. 3. Consists of sales of imported new autos in personal consumption expenditures, in private fixed investment, and in grossgovernment investment.
Bureau of Economic AnalysisTable 7.2.5B. Motor Vehicle Output[Billions of dollars] Seasonally adjusted at annual ratesLast Revised on: September 28, 2017 - Next Release Date October 27, 2017
43 Final sales of motor vehicles to domesticpurchasers 596.2 607.8 601.4 611.2 620.5 604.8 607.7
44 Private fixed investment in new autos andnew light trucks 242.7 256.5 254.3 258.2 259.5 250.9 247.6
45 Domestic output of new autos 2 110.8 105.1 105.4 107.3 100.5 94.6 90.8 46 Sales of imported new autos 3 106.0 97.4 96.4 99.9 95.9 95.5 93.3
Legend / Footnotes:1. Consists of used light trucks only. 2. Consists of final sales and change in private inventories of new autos assembled in the United States. 3. Consists of sales of imported new autos in personal consumption expenditures, in private fixed investment, and in grossgovernment investment. Note. Chained (2009) dollar series are calculated as the product of the chain-type quantity index and the 2009 current-dollarvalue of the corresponding series, divided by 100. Because the formula for the chain-type quantity indexes uses weights ofmore than one period, the corresponding chained-dollar estimates are usually not additive. The residual line is the differencebetween the first line and the sum of the most detailed lines.
Bureau of Economic AnalysisTable 7.2.6B. Real Motor Vehicle Output, Chained Dollars[Billions of chained (2009) dollars] Seasonally adjusted at annual ratesLast Revised on: September 28, 2017 - Next Release Date October 27, 2017
Bureau of Economic AnalysisTable 7.5. Consumption of Fixed Capital by Legal Form of Organization and Type of Income[Billions of dollars] Seasonally adjusted at annual ratesLast Revised on: September 28, 2017 - Next Release Date October 27, 2017