http://www.jstor.org Bureaucracy and Growth: A Cross-National Analysis of the Effects of "Weberian" State Structures on Economic Growth Author(s): Peter Evans and James E. Rauch Source: American Sociological Review, Vol. 64, No. 5 (Oct., 1999), pp. 748-765 Published by: American Sociological Association Stable URL: http://www.jstor.org/stable/2657374 Accessed: 07/09/2008 05:19 Your use of the JSTOR archive indicates your acceptance of JSTOR's Terms and Conditions of Use, available at http://www.jstor.org/page/info/about/policies/terms.jsp. JSTOR's Terms and Conditions of Use provides, in part, that unless you have obtained prior permission, you may not download an entire issue of a journal or multiple copies of articles, and you may use content in the JSTOR archive only for your personal, non-commercial use. Please contact the publisher regarding any further use of this work. Publisher contact information may be obtained at http://www.jstor.org/action/showPublisher?publisherCode=asa. Each copy of any part of a JSTOR transmission must contain the same copyright notice that appears on the screen or printed page of such transmission. JSTOR is a not-for-profit organization founded in 1995 to build trusted digital archives for scholarship. We work with the scholarly community to preserve their work and the materials they rely upon, and to build a common research platform that promotes the discovery and use of these resources. For more information about JSTOR, please contact [email protected].
Transcript
http://www.jstor.org
Bureaucracy and Growth: A Cross-National Analysis of the Effects of "Weberian" StateStructures on Economic GrowthAuthor(s): Peter Evans and James E. RauchSource: American Sociological Review, Vol. 64, No. 5 (Oct., 1999), pp. 748-765Published by: American Sociological AssociationStable URL: http://www.jstor.org/stable/2657374Accessed: 07/09/2008 05:19
Your use of the JSTOR archive indicates your acceptance of JSTOR's Terms and Conditions of Use, available at
http://www.jstor.org/page/info/about/policies/terms.jsp. JSTOR's Terms and Conditions of Use provides, in part, that unless
you have obtained prior permission, you may not download an entire issue of a journal or multiple copies of articles, and you
may use content in the JSTOR archive only for your personal, non-commercial use.
Please contact the publisher regarding any further use of this work. Publisher contact information may be obtained at
BUREAUCRACY AND GROWTH: A CROSS-NATIONAL ANALYSIS OF THE EFFECTS OF
"WEBERIAN" STATE STRUCTURES ON ECONOMIC GROWTH*
Peter Evans James E. Rauch University of California, Berkeley University of California, San Diego
The role of bureaucratic authority structures in facilitating economic growth has been a sociological concern since Max Weber's classic contributions al- most 100 years ago. Using a recent and original data set, we examine the characteristics of core state economic agencies and the growth records of a sample of 35 developing countries for the 1970-1990 period. Our "Weberianness Scale" offers a simple measure of the degree to which these agencies employ meritocratic recruitment and offer predictable, rewarding long-term careers. We find that these "Weberian " characteristics signifi- cantly enhance prospects for economic growth, even when we control for initial levels of GDP per capita and human capital. Our results imply that "Weberianness" should be included as a factor in general models of eco- nomic growth. They also suggest the need for more attention by policymakers to building better bureaucracies and more research by social scientists on variations in how state bureaucracies are organized.
xplaining economic transformation at Li the national level is a classic socio-
logical preoccupation as well as a central concern of economic analysis. There are many ways to approach this task, but one of the most challenging involves trying to ana- lyze the role that public institutions play in fostering (or impeding) economic growth.
* Direct all correspondence to Peter Evans, De- partment of Sociology, 410 Barrows Hall, Uni- versity of California, Berkeley, CA 94720 (pevans @ socrates berkeley .edu). These results grow out of the project on Bureaucratic Structure and Economic Performance directed by Peter Evans and James Rauch. The project was funded in various stages by the Russell Sage Foundation, the Center for Institutional Reform and the Infor- mal Sector, and Policy Research Department of the World Bank. We thank the 126 country ex- perts for their generosity in sharing their knowl- edge and professional expertise. The findings re- ported here were produced by Linus Huang and John Talbot, working under the direction of Peter Evans and James Rauch. Patrick Heller and Mark Ritchie provided invaluable assistance in early stages of the data analysis. For comments on early drafts we thank Ken Bollen, Neil Fligstein, Trond Petersen, and Erik Olin Wright. Christy Getz played an invaluable role in the revision of the manuscript. We also thank two anonymous re- viewers and the ASR Editor for their comments.
Growth depends on governance. Decipher- ing the relation between administrative struc- tures and changing levels of economic out- put is, therefore, a perennial preoccupation of theorists and practitioners alike. In 1997, the World Bank took up the task again in a World Development Report called "The State in a Changing World." Both the choice of topic and the content of the report itself sig- nified an important shift in thinking about the role of the state within the "development establishment." Explaining why some state bureaucracies are more effective than others seems at last to be taking precedence over simply condemning excesses of state inter- vention. Pursuing this agenda requires re-ex- ploring classic arguments on the comparative effectiveness of different forms of adminis- trative organization. It is an obvious oppor- tunity for sociological analysis to make a contribution to the understanding of cross- national differences in rates of economic growth.
Among the classic arguments that need to be brought together with some systematic comparative evidence, Weber's analysis of bureaucracy is perhaps the most obvious can- didate. At the beginning of the century, Weber's ([1904-1911] 1968) monumental
748 American Sociological Review, 1999, Vol. 64 (October:748-765)
WEBERIAN BUREAUCRACY AND ECONOMIC GROWTH 749
essays, Economy and Society, argued for the fundamental value of bureaucracy as one of the institutional foundations of capitalist growth. Subsequent comparative historical analysis (e.g., Polanyi [1944] 1957) echoed Weber's assertions, but the "bureaucracy as a tool of growth" thesis always had to con- tend with the historically prior and ideologi- cally powerful "Smithian" view that govern- ment, regardless of its organizational form, was the enemy of growth as soon as it went beyond protecting property rights.1
In the 1970s and 1980s, neo-classical po- litical economy and rational choice analysis provided new analytical reinforcement for the Smithian perspective (cf. Buchanan, Tollison, and Tullock 1980; Colclough and Manor 1991; Collander 1984; Krueger 1974). Case studies of "rent-seeking" and "predatory" states complemented these ana- lytical arguments with equally powerful em- pirical support (e.g., Bates 1981; Klitgaard 1988). Unfortunately, in the rush to avoid the dangers of state intervention, the question of what kinds of state structures are most likely to promote economic growth was easily lost.
By the 1990s, however, economists (but surprisingly not sociologists) began to focus on cross-national data that demonstrated the importance of looking more closely at how states were organized. Their results showed various measures of "quality of government" to be powerfully connected to economic growth (Knack and Keefer 1995; Mauro 1995). This rapidly growing literature sug- gests that earlier neo-classical visions of government performance were too simplis- tic. Nonetheless, perhaps because of the ab- sence of sociologists from the discussion, a way of describing what "good government" would look like was still lacking.
Contemporary empirical analyses of rent- seeking and corruption often use the term "bureaucracy" in its everyday pejorative sense rather than in the Weberian sense of a set of administrative organizations with spe- cific structural features. Weber viewed bu-
reaucracy, not as a generic collection of state officials, but as a particular kind of organi- zational structure, set in contrast to earlier patrimonial and prebendal forms of govern- ment administration.
The Weberian perspective does not negate the positive effects of strengthening market institutions, but it does postulate that bureau- cratically structured public organizations, us- ing their own distinct set of decision-making procedures, are a necessary complement to market-based institutional arrangements.2 More precisely, Weber argued that public ad- ministrative organizations characterized by meritocratic recruitment and predictable, long-term career rewards will be more effec- tive at facilitating capitalist growth than other forms of state organization. This hy- pothesis cannot be dismissed simply by the discovery that people who call themselves bureaucrats have engaged in rent-seeking or that corrupt governments have undermined economic growth. Addressing the "Weberian state hypothesis" means answering the ques- tion, "Are countries whose administrative apparatuses more closely approximate bu- reaucratic forms of organization character- ized by higher rates of economic growth?" For some reason, students of economic de- velopment have lacked the incentive required to generate a systematic empirical response to this apparently simple question. Our re- search reported here represents an initial ef- fort to fill the lacuna.
Using an original data set, we examine the effect on economic growth of certain struc- tural features that were key elements in Weber's original characterization of bureau- cracy. Our "Weberianness Scale" offers a simple measure of the degree to which core state agencies are characterized by meritocratic recruitment and offer predict- able, rewarding long-term careers.
1 By "Smithian" we mean the standard "laissez- faire" view of government's role that is usually attributed to Adam Smith. Smith's own view was actually more sophisticated, including, for ex- ample, an appreciation of the importance of pub- lic provision of a range of collective goods.
2 The spirit of the Weberian perspective is at least partially recaptured in Williamson's (1985) "new institutionalist" assertions that complex production systems are likely to require mixing (essentially nonmarket) governance structures with more traditional market transactions. But application of the Williamsonian perspective has generally been limited to analyses of relations among private firms and is rarely invoked in stud- ies of state bureaucracies.
750 AMERICAN SOCIOLOGICAL REVIEW
RECENT LITERATURE
The literature on the role that state bureau- cracies play in promoting or impeding eco- nomic growth ranges from detailed case stud- ies of particular agencies in particular coun- tries to cross-national analyses using statisti- cal proxies drawn from many countries. Tra- ditionally, political scientists have dominated the production of case studies (e.g., Stepan 1978; Waterbury 1983) while sociologists have focused more on cross-national analy- ses (e.g., Delacroix and Ragin 1981; Rubinson 1977; Snyder and Kick 1979). In recent years, awakened interest among econ- omists in cross-national analysis has substan- tially expanded the production of cross-na- tional statistical studies. The principal stimu- lus to renewed interest among economists has been the emergence of "endogenous growth theory," which offers formal theoretical sup- port for the proposition that institutional fac- tors could have a fundamental effect on rates of growth (cf. Lucas 1988; also see, e.g., Romer 1986, 1990, 1994).
The endogenous growth perspective legiti- mated a variegated set of cross-national analyses by economists examining the impact of a variety of noneconomic variables on na- tional growth rates (see Crowley et al. 1998). In one of the earliest and most influential of these studies, Barro (1991) emphasized the negative role of government by stressing the negative impact of government consumption (as a share of GDP) on growth rates.
What both the earlier sociology literature and the recent cross-national economics lit- erature lacked was the possibility of seri- ously addressing the question of how varia- tions in the form of state organization might affect economic dynamism. Arguments in the early sociological literature were formulated in terms of the dubious concept of "state strength," with state revenues and expendi- tures offered as proxies for "state strength" (e.g., Rubinson 1977). The cross-national re- gressions of the new endogenous growth models included even more unsatisfying proxies, such as using the annualized num- ber of assassinations or revolutions as a proxy for political stability ( Barro 1991).
Neither economists nor (oddly enough) so- ciologists had focused their cross-national analyses on organizational differences.
Nonetheless, a literature developed that paid serious attention to bureaucratic structures and was directly relevant to the Weberian hy- pothesis. This literature was built around de- tailed case studies of individual countries and focused primarily on a single region. Johnson's (1982) classic study of Japan's Ministry of International Trade and Industry (MITI) during the golden years of Japanese industrialization led the way. Johnson's por- trayal was surprisingly consistent with a Weberian perspective. Subsequent studies of Korea (Amsden 1989) and Taiwan (Wade 1990) reinforced the picture.3 Because the "East Asian Tigers" described in these stud- ies were also the most economically success- ful nations in the world during the 1970s and 1980s, they created a strong prima facie case in favor of the Weberian hypothesis. By the beginning of the 1990s, even the World Bank (1993) seemed to join in the chorus with its East Asian Miracle report that emphasized the positive role played by East Asian bu- reaucracies in the region's spectacular indus- trialization (also see Campos and Root 1996; Cheng, Haggard, and Kang 1995; Koh 1995; Quah 1993). Nonetheless, the argument con- tinued to rest primarily on case studies. The question remained as to whether the Weberian state hypothesis could be substan- tiated with a broader set of systematic evi- dence.
In the 1990s the case-study literature was complemented by efforts to connect varia- tions in the character of state bureaucracies to economic performance by means of quan- titative cross-national analysis. Economists, rather than sociologists, took the lead in de- veloping a more organizational focus. A new set of studies utilized the commercially available assessments of variations across national governments that businessmen had been using for some time.4 The methodologi-
3 Simultaneously, a complementary body of lit- erature began to focus on the weakness of public institutions as a key barrier to growth in sub-Sa- haran Africa (cf. Bates 1989; Callaghy 1989; Easterly and Levine 1997; World Bank 1994, 1997).
4 International Country Risk Guide (ICRG), Business and Environmental Risk Intelligence (BERI), and Business International (BI) are among the most prominent examples of such as- sessments.
WEBERIAN BUREAUCRACY AND ECONOMIC GROWTH 751
cal validity and reliability of these measures were open to question. The rating services that provided them offered little explanation of how their data were derived or why they should be considered reliable. The data seemed to be based primarily on the assess- ments of consultants, but the basis on which these consultants were selected was not usu- ally specified, and methodological issues were clearly not a primary concern.5 The va- lidity of these ratings as independent deter- minants of economic growth was also some- what suspect. Most of the components of the ratings had clear "good" and "bad" poles- more or less corruption, more or less red tape, higher or lower "quality" of the bureau- cracy, and so on. Because raters were aware of the economic performance of the countries they were rating, a tendency to give "good" ratings to high-performing countries and "bad" ratings to low-performing ones was likely to "build in" a correlation between the ratings and economic growth.
Despite their flaws, these ratings did pro- vide a way to compare bureaucracies across a wide set of countries, and they did seem to produce results that confirmed the impor- tance of variations across national bureaucra- cies in explaining variations in economic growth. Mauro (1995), using ratings on "cor- ruption" and "red tape" from Business Inter- national, found that variation in these ratings was significantly associated with increased levels of investment, which were in turn one of the most obvious and powerful predictors of economic growth. Knack and Keefer (1995) used International Country Risk Guide (ICRG) ratings and Business and En- vironmental Risk Intelligence (BERI) rat- ings, and they too discovered that these rat- ings were directly related to variations in the growth of per capita income.6
Use of data on variations in state bureau- cracies gives recent studies a clear advantage over earlier work that had to rely on gross measures, like aggregate government expen- ditures, or distant proxies, like number of as- sassinations. The fact that recent studies con- sistently find relationships between bureau- cratic performance and economic growth provides new incentive for trying to refine our understanding of the roots of "bureau- cratic performance." Nevertheless, even this new generation of studies remains prisoner to the available measures. Convincing efforts to adjudicate the empirical validity of the Weberian state hypothesis must begin with information on how the structure of state bu- reaucracies varies across countries, which is what we have tried to do in our study.
CONNECTING BUREAUCRATIC STRUCTURES AND GROWTH
Contemporary analysis of comparative bu- reaucratic structures needs to move beyond Weber, but Weber's characterizations do pro- vide a simple, accessible starting point for comparative research. In contrasting bureau- cracies with prior organizational forms, We- ber stressed a number of points that lend themselves to relatively objective empirical assessment. We emphasize two of these. The first is the importance of meritocratic recruit- ment, which ideally is based on some combi- nation of education and examination (Gerth and Mills 1958:241; Parsons 1964:333, 339). The second is a predictable career ladder, which provides long-term tangible and intan- gible rewards for those recruited into the bu- reaucracy (Gerth and Mills 1958:200-203; Parsons 1964:334-35; Stinchcombe 1974).
We could have selected other Weberian or- ganizational features.7 One advantage of
5 From the point of view of investors looking for the best current assessment of prospective fu- ture returns in a given locale, the invaluable fea- ture of the data provided by these rating services is their timeliness. ICRG, for example, provides monthly ratings for 130 countries around the world on a variety of political and economic in- dicators. No purely academic study could ever come close to offering such immediate informa- tion.
6 La Porta et al. (1999) offer an excellent dis- cussion of the quality of government institutions,
but they focus on the determinants of quality and performance rather than on their effects on eco- nomic growth.
7 Because the particular characteristics we have chosen to focus on are only a partial set of those described by Weber, stressing other features of Weberian bureaucracy might produce different results. For example, rule-governed decision- making, which is clearly a feature of the bureau- cratic model, might be a double-edged sword, en- hancing predictability and efficiency up to a cer- tain point but producing rigidity and organiza-
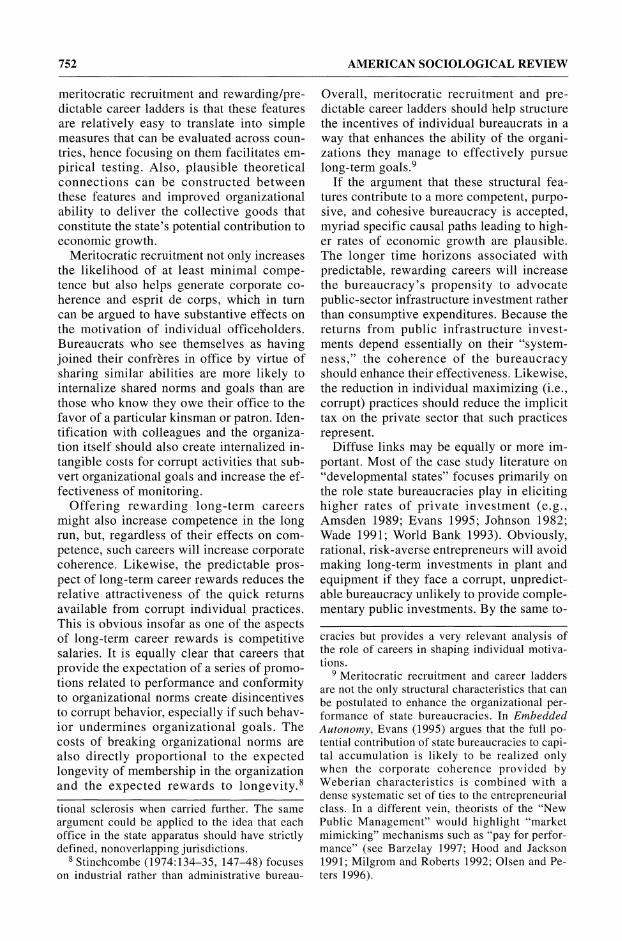
752 AMERICAN SOCIOLOGICAL REVIEW
meritocratic recruitment and rewarding/pre- dictable career ladders is that these features are relatively easy to translate into simple measures that can be evaluated across coun- tries, hence focusing on them facilitates em- pirical testing. Also, plausible theoretical connections can be constructed between these features and improved organizational ability to deliver the collective goods that constitute the state's potential contribution to economic growth.
Meritocratic recruitment not only increases the likelihood of at least minimal compe- tence but also helps generate corporate co- herence and esprit de corps, which in turn can be argued to have substantive effects on the motivation of individual officeholders. Bureaucrats who see themselves as having joined their confreres in office by virtue of sharing similar abilities are more likely to internalize shared norms and goals than are those who know they owe their office to the favor of a particular kinsman or patron. Iden- tification with colleagues and the organiza- tion itself should also create internalized in- tangible costs for corrupt activities that sub- vert organizational goals and increase the ef- fectiveness of monitoring.
Offering rewarding long-term careers might also increase competence in the long run, but, regardless of their effects on com- petence, such careers will increase corporate coherence. Likewise, the predictable pros- pect of long-term career rewards reduces the relative attractiveness of the quick returns available from corrupt individual practices. This is obvious insofar as one of the aspects of long-term career rewards is competitive salaries. It is equally clear that careers that provide the expectation of a series of promo- tions related to performance and conformity to organizational norms create disincentives to corrupt behavior, especially if such behav- ior undermines organizational goals. The costs of breaking organizational norms are also directly proportional to the expected longevity of membership in the organization and the expected rewards to longevity.8
Overall, meritocratic recruitment and pre- dictable career ladders should help structure the incentives of individual bureaucrats in a way that enhances the ability of the organi- zations they manage to effectively pursue long-term goals.9
If the argument that these structural fea- tures contribute to a more competent, purpo- sive, and cohesive bureaucracy is accepted, myriad specific causal paths leading to high- er rates of economic growth are plausible. The longer time horizons associated with predictable, rewarding careers will increase the bureaucracy's propensity to advocate public-sector infrastructure investment rather than consumptive expenditures. Because the returns from public infrastructure invest- ments depend essentially on their "system- ness," the coherence of the bureaucracy should enhance their effectiveness. Likewise, the reduction in individual maximizing (i.e., corrupt) practices should reduce the implicit tax on the private sector that such practices represent.
Diffuse links may be equally or more im- portant. Most of the case study literature on "developmental states" focuses primarily on the role state bureaucracies play in eliciting higher rates of private investment (e.g., Amsden 1989; Evans 1995; Johnson 1982; Wade 1991; World Bank 1993). Obviously, rational, risk-averse entrepreneurs will avoid making long-term investments in plant and equipment if they face a corrupt, unpredict- able bureaucracy unlikely to provide comple- mentary public investments. By the same to-
tional sclerosis when carried further. The same argument could be applied to the idea that each office in the state apparatus should have strictly defined, nonoverlapping jurisdictions.
8 Stinchcombe (1974:134-35, 147-48) focuses on industrial rather than administrative bureau-
cracies but provides a very relevant analysis of the role of careers in shaping individual motiva- tions.
9 Meritocratic recruitment and career ladders are not the only structural characteristics that can be postulated to enhance the organizational per- formance of state bureaucracies. In Embedded Autonomy, Evans (1995) argues that the full po- tential contribution of state bureaucracies to capi- tal accumulation is likely to be realized only when the corporate coherence provided by Weberian characteristics is combined with a dense systematic set of ties to the entrepreneurial class. In a different vein, theorists of the "New Public Management" would highlight "market mimicking" mechanisms such as "pay for perfor- mance" (see Barzelay 1997; Hood and Jackson 1991; Milgrom and Roberts 1992; Olsen and Pe- ters 1996).
WEBERIAN BUREAUCRACY AND ECONOMIC GROWTH 753
ken, shared perceptions of the state bureau- cracy as dependable, predictable, minimally competent and committed to long-term growth makes investment appear less risky.
Competent bureaucracies can help indi- vidual entrepreneurs overcome coordination problems that may be crucial in instigating new activities. They can also turn informa- tional resources into public goods in ways that increase the likelihood and effectiveness of investment (e.g., see Rodrik 1995). For example, when entrepreneurs in small coun- tries are trying to upgrade into world mar- kets, collective action to gather data on ex- ternal markets and enforce standards among local producers may confer important advan- tages. Respected bureaucracies could act as "honest brokers" in overcoming collective action problems among exporters. A stronger version of this argument would see the bu- reaucracy itself as gathering information and providing advice and incentives that help lo- cal firms to better thread their way through the labyrinth of rapidly changing world mar- kets. 10
Adjudicating among the various paths that might account for a connection between competent, coherent state bureaucracies and economic growth would be a challenging and worthwhile task, but it is not our aim here. We aim to establish a basic connection be- tween bureaucratic structures and economic growth, thereby providing additional incen- tive to explore alternative mechanisms that might account for the connection. 1
To reiterate, we assess the effect of a par- ticular set of bureaucratic structures; we do not attempt a comprehensive appraisal of all the features of bureaucratic structure that might enhance economic performance. We
selected meritocratic recruitment and career ladders because of the strong claims in the literature on their behalf and because they constitute an empirically identifiable, theo- retically plausible set of structural character- istics that offers a good starting point for demonstrating the value of doing new re- search on the economic consequences of variations in bureaucratic structures.
Our strategy for connecting bureaucratic structures and economic growth obviously differs from Weber's. Weber was interested in long-term historical changes in organiza- tional forms. We are interested in cross-sec- tional comparisons in the contemporary pe- riod. Our empirical proposition is a simple one. We predict that countries whose bureau- cratic structures incorporated Weberian fea- tures will have experienced more rapid eco- nomic growth over the 20 years between 1970 and 1990 than did those countries in which such features were less fully incorpo- rated.
DATA
The absence of comparable measures of bu- reaucratic structure for a substantial set of countries is one of the principal impediments to assessing the effects of variation in bu- reaucracy on economic growth. We decided that only by collecting new, original data could we surmount this obstacle. The "Web- erian state data set" 12 we have collected is built on comparable expert evaluations of bureaucratic structures in 35 countries, labo- riously gathered over a period of almost three years (1993-1996).
Our sample began with the 30 "semi-in- dustrialized" countries identified by Chenery (1980) and was complemented by 5 poorer
10 According to Keesing (1988), this is essen- tially the role played by trade promotion bureau- cracies in the four Asian tigers. Also see Rodrik (1995).
", There is, of course, another set of arguments in the literature that postulates a more central role for state bureaucracies in shaping national trajec- tories of investment and growth. Such arguments involve both the ability of governments to push entrepreneurs into investing larger shares of their profits by "disciplining" them (cf. Amsden 1989), and the ability of public agencies to stimulate more risky but ultimately rewarding forms of in- vestment through selective subsidies and protec-
tion from external competition (cf. Amsden 1989; Ernst and O'Connor 1992; Evans 1995; Wade 1990). While these arguments are plausible, they clearly require more than minimal competence on the part of the bureaucracy. Insofar as these argu- ments apply, the case for the importance of bu- reaucratic structures becomes much more impor- tant, but the theoretical plausibility of the Weberian hypothesis does not depend on these stronger arguments regarding the role of public institutions in making growth possible.
12 The discussion of the Weberian data set is drawn largely from Talbot (1997).
754 AMERICAN SOCIOLOGICAL REVIEW
countries. Our reasons for starting with the Chenery sample were threefold. To begin with, we estimated that our available re- sources would not allow us to collect data on more than about 35 countries, so the Chenery sample was the right size. Second, we were interested in understanding varia- tions in growth among developing countries rather than between developing and ad- vanced industrial countries. We wanted to in- clude countries that were still confronting the issue of industrial transformation during the period under consideration. The Chenery sample provided a good range of developing countries. Third, we wanted a good range of variation on "Weberianness." Although there were no systematic data available on Web- erianness per se, we knew that variation in "bureaucratic performance" variables was much greater among developing countries than among industrialized countries. This latter consideration was also a motive for in- cluding some additional countries too poor to be included in the Chenery sample. Data on bureaucratic performance made it clear that excluding poorer countries would under- sample the low end of the distribution on bu- reaucratic performance and therefore might also undersample the low ranges of Web- erianness (see Rauch and Evans 1999:8-9, figs. lb, ic). Selection of the poor countries to be added was driven by a desire for in- creased representation of the Caribbean, South Asia, and Sub-Saharan Africa, and by our belief that there was a sufficient corps of experts on the bureaucracies of these coun- tries to allow us to find at least three experts for each of them.13 The resulting sample of 35 countries represents all the major regions of the developing world as well as the south- ern European fringe of the Organization for Economic Cooperation and Development (OECD). It also offers a range of growth per- formance over the 1970s and 1980s from Korea and Singapore (growing consistently at over 6 percent per capita per year) to Zaire (shrinking more than 2 percent). At the same time, our sample of countries offers a good range in terms of "bureaucratic perfor-
mance" as measured by commercial rating services (see Rauch and Evans 1999:8-9, figs. ib, ic).
Obtaining measures of different features of bureaucratic structure in each of these countries required the cooperation of a large number of experts, each of whom had spe- cific knowledge of the state bureaucracy of a particular country. Collecting responses was labor intensive, but the level of collabo- ration was both surprising and gratifying. We were ultimately able to gather responses from a total of 126 experts, a minimum of 3 experts for 32 of our 35 countries, and 2 ex- perts for the remaining 3 countries (Mo- rocco, Thailand, and Uruguay). The experts were drawn from a combination of scholars known for their research on the bureaucra- cies of each country, local officials with reputations for having a broad perspective on their country's administrative structures, and professionals working on these issues in multilateral organizations. Together the ex- perts in our sample account for a substantial portion of the published literature on the state bureaucracies for the countries in our sample. 14
The experts' evaluations were structured by means of a fixed-response question- naire.15 In answering the fixed-response questions, the experts were asked first to identify the central state agencies that played the most important role in formulating eco- nomic policy, and then to answer questions regarding them. 16 We reasoned that the struc- ture of the core economic agencies probably had an effect on economic growth, and be- cause country case studies have shown that there is usually substantial variation across agencies, getting a measure that focused on the most relevant agencies made sense. Questions concerning the state bureaucracy
13 The five countries added to Chenery's sample were Haiti, Nigeria, Pakistan, Sri Lanka, and Zaire. For other analyses of Chenery's initial sample see Feder (1983) and Esfahani (1991).
14 For a more detailed discussion of the distri- bution of different types of experts across coun- tries see Talbot (1997, table 2).
15 All experts were encouraged to provide ad- ditional commentary and complementary materi- als, and most did so. This additional material was reviewed during the coding of the fixed-response questions, but is not analyzed separately here.
16 Specifically, experts were asked to "list the four most important agencies in the central state bureaucracy in order of their power to shape over- all economic policy."
WEBERIAN BUREAUCRACY AND ECONOMIC GROWTH 755
generally followed those focused on the core economic agencies.17
Country experts were not asked to evalu- ate the performance or quality of the bureau- cracy. Instead, the questionnaire focused on specific descriptive features of the bureau- cracy that are subject to objective estimation. We then combined these descriptive features to construct a simple measure that reflected a Weberian bureaucratic structure built on meritocratic recruitment and rewarding pre- dictable career ladders.
Because bureaucratic structures are noto- riously resistant to change, we felt secure in assuming that the differences we discovered among bureaucratic structures would charac- terize the situation in place at the beginning of the period (and, indeed, had probably been in place for some time prior to 1970) and were, therefore, temporally antecedent to growth during the 1970-1990 period. To check on this assumption, experts were asked not only to provide responses that character- ized the entire period but also to note any significant changes during the period. De- spite some references to deterioration in the situation of bureaucrats over time (particu- larly in relation to relative salaries), it was clear from their comments that the bureau- cratic structures they described antedated 1970-1990 economic growth.'8
Ten questions were used to create what we call the "Weberianness Scale." (See Appen- dix A for a discussion of the scale and a list of items.) An initial question indicated the importance of the agencies under consider- ation in generating economic policy. Two of the subsequent questions (questions 2 and 9 in Appendix A) measured the importance of exams in recruiting civil servants to the core economic agencies and more generally.19 Three of the questions tapped issues relating
to careers: whether civil servants, once re- cruited, are likely to stay in the civil service (questions 3 and 5) and whether staying in the civil service implies possibilities for moving up within a hierarchy (question 4). An additional four questions tapped the is- sue of career rewards, both in terms of sala- ries and prestige (questions 6, 7, 8, and 10). The resulting Weberianness Scale provides a succinct, substantively plausible measure of the bureaucratic features that are the focus of our investigation.
To discover what relationship, if any, might exist between these features and economic growth during the 1970-1990 period, we drew on measures from available standard data sets to create our dependent variable, growth in GDP per capita from 1970-1990, and our control variables, initial income level and pre-existing human capital. (See Appen- dix B for definitions and data sources for the dependent variable and control variables.) The 1994 ("Mark 5.5") version of Summers and Heston's (1991) Penn World Tables pro- vided the source for our measures of real GDP per capita in 1965, 1970, and 1990. As our proxy for human capital we used an up- dated version of Barro and Lee's (1993) mea- sure of average years of education for the population 25 years and older.
ANALYSIS
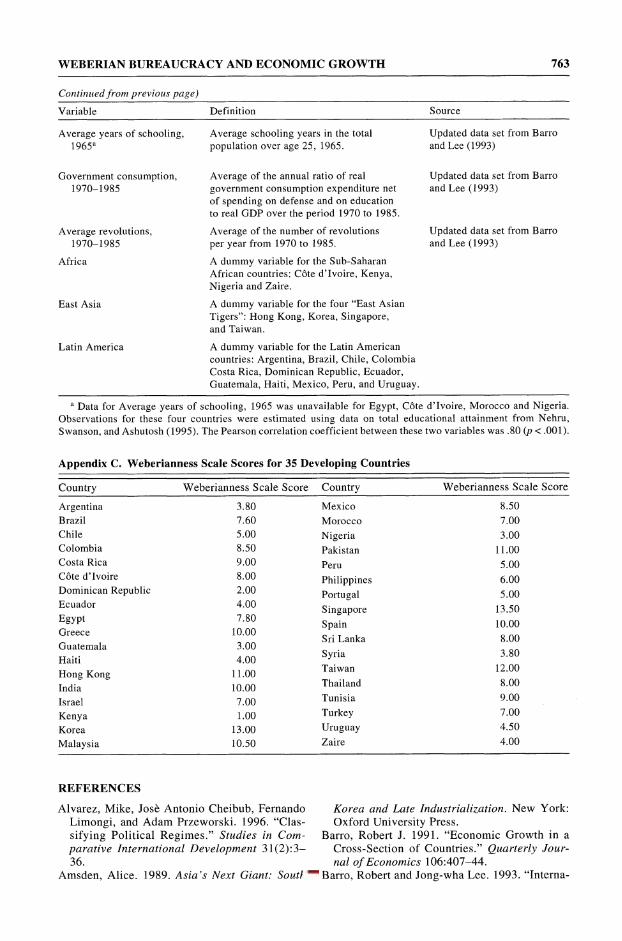
Our aim is to discover whether "Weber- ianness" has an effect on economic growth that is independent of the effects of other variables classically associated with eco- nomic development. There is a strong and significant correlation between score on the Weberianness Scale and total growth of real GDP per capita during the 1970-1990 period (r = .67; p < .001), but it could be argued that Weberianness is simply a proxy for over- all level of development or existing stocks of human capital. (See Appendix C for Weber- ianness Scale Scores for the 35 countries in our sample.) Such an argument cannot be dismissed out of hand. We know that more highly developed bureaucracies are more likely to be found among the developed countries (Rauch and Evans 1999:8, fig la, fig. la; also see World Bank 1997). We also know that high levels of human capital, which are generally associated with high lev-
17 For the full questionnaire see Rauch and Evans (1999, app. A). For coding of question- naire, see Talbot (1997, app. A).
18 Although bureaucratic structures were gen- erally stable during the period under study, ex- perts' comments indicated that the early 1990s may have been a period of change in which a number of bureaucracies were restructured in re- sponse to pressure from multilateral agencies.
19 Question 9 is actually a composite created by combining the answers to questions 17 and 18 on the original questionnaire.
756 AMERICAN SOCIOLOGICAL REVIEW
els of development, are strongly associated with growth. In fact, virtually no association emerged between the degree of approxima- tion to Weberian characteristics and initial levels of per capita income in this sample of developing countries (r = .05). In this sample of developing countries at least, it is hard to argue that past growth or higher levels of in- come are important causes, in themselves, of more Weberian states. Put more optimisti- cally, it seems that low levels of per capita income are not necessarily a barrier to achieving more competent and coherent state bureaucracies. Nonetheless, there is a mod- est (though not significant) correlation be- tween the Weberianness Scale in our sample and preexisting level of human capital (r = .25, p = .15), and human capital has, in turn, a significant positive effect on subsequent growth.
Our first key result, then, is that even after the effects of initial GDP per capita levels and preexisting levels of human capital have been controlled, the relation between the Weberianness Scale score and economic growth remains strong and significant. As the regression equations below indicate, the
Weberianness Scale continues to have a pow- erful and significant effect on economic growth. Weberianness is not simply a spuri- ous proxy for effects of preexisting levels of development or human capital.
The basic equation in unstandardized form is:
% Change in GDP per capita 1970-1990 =
-44.54 - .02 (Real GDP per capita 1965) + 15.77 (Average years of schooling 1965) + 16.05 (Weberianness score). (1)
In standardized form the equation is:
% Change in GDP per capita 1970-1990 =
- .317 (Real GDP per capita 1965) + .307 (Average years of schooling 1965) + .615 (Weberianness score). (2)
The scattergram of growth regressed on the Weberianness Scale with the effects of initial level of GDP per capita and preexist- ing levels of human capital controlled is shown in Figure 1. One of the things that stands out in this scattergram is the strong degree to which the regional distribution of Weberian characteristics parallels regional differences in growth performance.
300 -
Singaporeu
&- 200-Taiwan a
200 -
C CY) Hong Kong Korea
o. I Portugal XO U
100 Tunisia ~~~~ 100 *~~~~~~~~~~~~~ Malaysia Syria
CD - *Morocco Thailand Spain
TUrkeyl MXO L) 0 - Kenya UBrazil Ina CL ~ ~ * Nigeria Egypt
Guatemalabi Ecuador = E Colombia UPakistan .3 O , ,,g~atIsrael EC6te d'lvoire EGreece
Dominican EHaiti UUruguay Republic ArninaE U ECosta Rica
-100 R EChile Sri Lanka 0. ~~~~~~~Zairefl er (U
*eru EPhilippines
-200 l l 0 2 4 6 8 10 12 14
Weberianness Scale (Raw Score)
Figure 1. Scattergram Showing Relationship between Weberianness Scale Score and Unexplained Growth in GDP per Capita, 1970 to 1990
Note: Unexplained growth is that growth not explained by level of GDP in 1965 and years of school in 1965.
WEBERIAN BUREAUCRACY AND ECONOMIC GROWTH 757
400
300- c... t ... n ..... nn .nn n n; .n . n ......... n nn .-~~~~~~~~~~~~~~~~~~~~~~~~~~~~~~~~~~~~~~~~~~~~~~~~~~~~~~~~~~~............. ~~~~~~~~~~~~~~~~~~~~~~~~~~~~~~~~~~~~~~~~~~~~~~~~~. n. .., 5 5. -......n
Mc 200-
~ciu s.
N =15
00 100 N a) ~ I
12 N4
-100- I I II Africa Latin America Other East Asia
Figure 2. Boxplot of Growth in GDP per Capita by Region, 1970 to 1990
Regional differences in both growth in GDP and Weberianness are summarized in Figures 2 and 3. Figure 2 shows the range, interquartile range, and median for growth in GDP for each of four regional country group- ings. When the four regions are arranged in the order that would be expected on basis of the existing literature, they almost form a per- fect regression line with Sub-Saharan Africa at the bottom and the four East Asian tigers at the top. The Latin American region exhibits a growth performance that is clearly inferior to any region except for Sub-Saharan Africa, largely because Latin America's growth ex- perience in the period we are examining is dominated by the "lost decade" of the 1980s.
Figure 3 portrays regional differences in Weberianness Scale scores and makes the parallel between regional variations in growth and regional variations in bureau- cratic structure graphically clear. Just as Sub- Saharan Africa defines the bottom of the scale in terms of growth, it is also the region in which state bureaucracies are least Weberian. Likewise, the four East Asian Tigers epito- mize, during this period at least, both high growth and Weberian bureaucratic traits. The Weberianness Scale appears to capture a key institutional element of the "high perform- ing" East Asian economies while pointing to an institutional deficit that may help explain low rates of growth in Africa.
16 -
14- N 4
O 12- N 15
Cn,
X 10- N = 12
a e~aaa- e a~aa a aa<.-a''a'''".N
a - .-......... ...
u6
04-
0* I
Africa Latin America Other East Asia
Figure 3. Boxplot of Weberianness Scale Score by Region
758 AMERICAN SOCIOLOGICAL REVIEW
Table 1. Standardized Coefficients from Regressions of Growth in Real GDP Per Capita, 1970-1990, on Selected Independent Variables: 35 Developing Countries
Independent Variable Model 1 Model 2 Model 3 Model 4
GDP per capita, 1965 -.317 -.270 -.324 -.150 (-1.749) (-1.472) (-1.753) (-1.251)
Years of school, 1965 .307 .319 .290 .090 (1.645) (1.725) (1.487) (.724)
Latin America -.180 (-1.242)
Africa -.056 (-.367)
East Asia .696** (6.638)
Number of countries 35 35 35 35 Adjusted R2 .460 .469 .444 .774
Note: Numbers in parentheses are t-values.
<.05 ** < .01 (two-tailed tests)
Table 1 presents a set of regressions that add dummy variables for region to the basic regression illustrated in Figure 1. The effects of the Weberianness Scale still appear robust. Introducing the dummy variables for Sub-Sa- haran Africa and Latin America reduce the Weberianness Scale coefficient only mod- estly (Models 2 and 3). Even more important, a significant "bureaucratic structure effect" remains, even when a dummy variable for East Asia (the Four Tigers) is included (Model 4).20
Do the effects of Weberianness continue to be significant in regressions that intro-
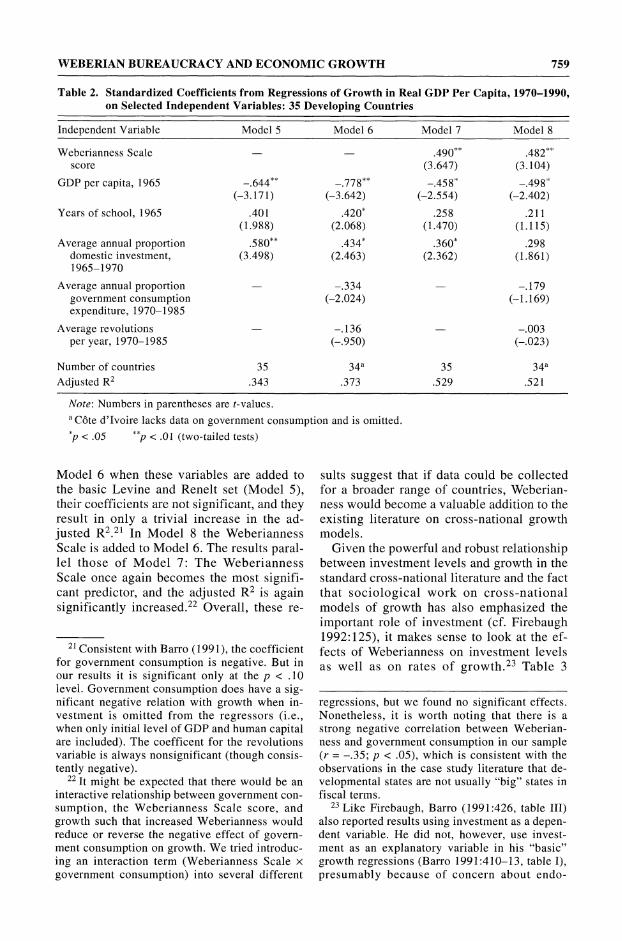
duce other variables used in standard growth models? Levine and Renelt (1992) surveyed 41 studies that used cross-national regressions to explain economic growth. They concluded that even though "over 50 variables have been found to be signifi- cantly correlated with growth in at least one regression" (p. 924), the list of variables whose effects are truly robust is, in fact, small. They identified three basic vari- ables-initial level of GDP per capita, in- vestment, and human capital-as most ro- bustly related to growth (1992:947, table 1). Model 5 in Table 2 shows that the results with respect to these variables using our sample, time period, and variable defini- tions are consistent with previous work, ex- cept that the effects of human capital (years of school) fall short of significance (using a two-tailed test). Initial investment is the most significant predictor of growth, and the initial level of GDP per capita continues to have a negative relation to growth.
When the Weberianness Scale is added to this basic equation (Model 7), it becomes the most powerful predictor of growth and the adjusted R2 increases significantly. Model 6 in Table 2 shows the effects of two additional variables that Barro (1991) found to have significant negative effects on growth-gov- ernment consumption and revolutions. In
20 The effects of the Weberianness Scale are robust in the face of different definitions of re- gional dummy variables (two variations on the East Asian dummy variable that include six or seven Asian countries) and a broader version of the African dummy (which adds three North Af- rican countries). In fact, the Weberianness Scale has a more powerful effect when the broadest definition of "East Asia" is used. Only when the East Asian dummy variable is included along with the Sub-Saharan Africa or Latin American dummy variable does the effect of the Weberian- ness Scale drop below statistical significance. Also, the Weberianness effect is not robust in the face of the simultaneous inclusion of three re- gional dummies, but as these three dummy vari- ables in combination include at least 18 of our 35 countries, this is an extremely stringent test.
WEBERIAN BUREAUCRACY AND ECONOMIC GROWTH 759
Table 2. Standardized Coefficients from Regressions of Growth in Real GDP Per Capita, 1970-1990, on Selected Independent Variables: 35 Developing Countries
Independent Variable Model 5 Model 6 Model 7 Model 8
Average annual proportion - -.334 - -.179 government consumption (-2.024) (-1.169) expenditure, 1970-1985
Average revolutions - -.136 - -.003 per year, 1970-1985 (-.950) (-.023)
Number of countries 35 34a 35 34a Adjusted R2 .343 .373 .529 .521
Note: Numbers in parentheses are t-values. a C6te d'Ivoire lacks data on government consumption and is omitted.
<.05 ** < .01 (two-tailed tests)
Model 6 when these variables are added to the basic Levine and Renelt set (Model 5), their coefficients are not significant, and they result in only a trivial increase in the ad- justed R2.21 In Model 8 the Weberianness Scale is added to Model 6. The results paral- lel those of Model 7: The Weberianness Scale once again becomes the most signifi- cant predictor, and the adjusted R2 is again significantly increased.22 Overall, these re-
suits suggest that if data could be collected for a broader range of countries, Weberian- ness would become a valuable addition to the existing literature on cross-national growth models.
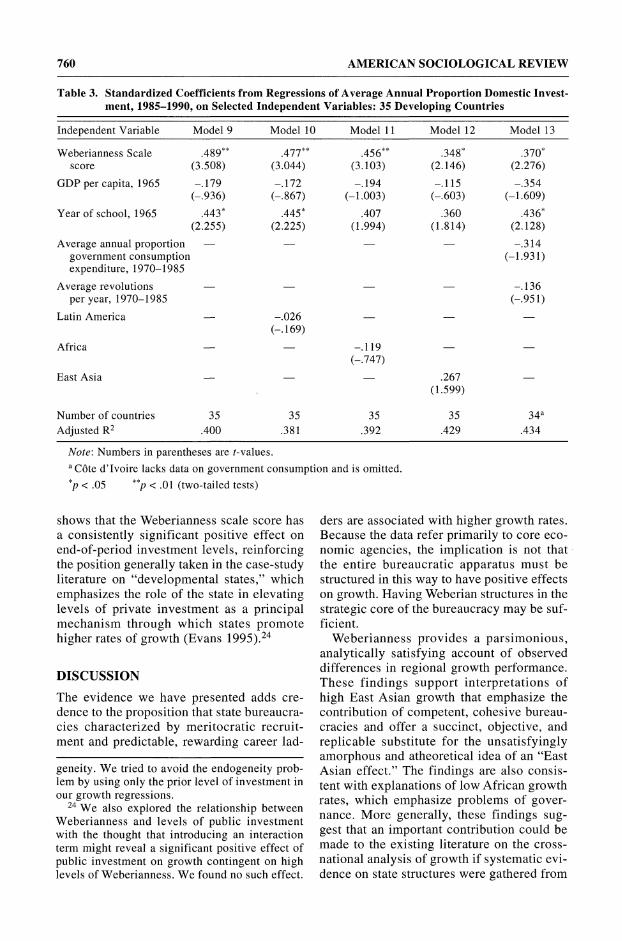
Given the powerful and robust relationship between investment levels and growth in the standard cross-national literature and the fact that sociological work on cross-national models of growth has also emphasized the important role of investment (cf. Firebaugh 1992:125), it makes sense to look at the ef- fects of Weberianness on investment levels as well as on rates of growth.23 Table 3
21 Consistent with Barro (1991), the coefficient for government consumption is negative. But in our results it is significant only at the p < .10 level. Government consumption does have a sig- nificant negative relation with growth when in- vestment is omitted from the regressors (i.e., when only initial level of GDP and human capital are included). The coefficent for the revolutions variable is always nonsignificant (though consis- tently negative).
22 It might be expected that there would be an interactive relationship between government con- sumption, the Weberianness Scale score, and growth such that increased Weberianness would reduce or reverse the negative effect of govern- ment consumption on growth. We tried introduc- ing an interaction term (Weberianness Scale x government consumption) into several different
regressions, but we found no significant effects. Nonetheless, it is worth noting that there is a strong negative correlation between Weberian- ness and government consumption in our sample (r = -.35; p < .05), which is consistent with the observations in the case study literature that de- velopmental states are not usually "big" states in fiscal terms.
23 Like Firebaugh, Barro (1991:426, table III) also reported results using investment as a depen- dent variable. He did not, however, use invest- ment as an explanatory variable in his "basic" growth regressions (Barro 1991:410-13, table I), presumably because of concern about endo-
760 AMERICAN SOCIOLOGICAL REVIEW
Table 3. Standardized Coefficients from Regressions of Average Annual Proportion Domestic Invest- ment, 1985-1990, on Selected Independent Variables: 35 Developing Countries
Independent Variable Model 9 Model 10 Model 11 Model 12 Model 13
GDP per capita, 1965 -.179 -.172 -.194 -.115 -.354 (-.936) (-.867) (-1.003) (-.603) (-1.609)
Year of school, 1965 .443* .445* .407 .360 .436* (2.255) (2.225) (1.994) (1.814) (2.128)
Average annual proportion -.314 government consumption (-1.931) expenditure, 1970-1985
Average revolutions -.136 per year, 1970-1985 (-.951)
Latin America -.026 (-.169)
Africa -.119 (-.747)
East Asia .267 (1.599)
Number of countries 35 35 35 35 34a Adjusted R2 .400 .381 .392 .429 .434
Note: Numbers in parentheses are t-values. a C6te d'Ivoire lacks data on government consumption and is omitted.
<.05 ** < .01 (two-tailed tests)
shows that the Weberianness scale score has a consistently significant positive effect on end-of-period investment levels, reinforcing the position generally taken in the case-study literature on "developmental states," which emphasizes the role of the state in elevating levels of private investment as a principal mechanism through which states promote higher rates of growth (Evans 1995).24
DISCUSSION
The evidence we have presented adds cre- dence to the proposition that state bureaucra- cies characterized by meritocratic recruit- ment and predictable, rewarding career lad-
ders are associated with higher growth rates. Because the data refer primarily to core eco- nomic agencies, the implication is not that the entire bureaucratic apparatus must be structured in this way to have positive effects on growth. Having Weberian structures in the strategic core of the bureaucracy may be suf- ficient.
Weberianness provides a parsimonious, analytically satisfying account of observed differences in regional growth performance. These findings support interpretations of high East Asian growth that emphasize the contribution of competent, cohesive bureau- cracies and offer a succinct, objective, and replicable substitute for the unsatisfyingly amorphous and atheoretical idea of an "East Asian effect." The findings are also consis- tent with explanations of low African growth rates, which emphasize problems of gover- nance. More generally, these findings sug- gest that an important contribution could be made to the existing literature on the cross- national analysis of growth if systematic evi- dence on state structures were gathered from
geneity. We tried to avoid the endogeneity prob- lem by using only the prior level of investment in our growth regressions.
24 We also explored the relationship between Weberianness and levels of public investment with the thought that introducing an interaction term might reveal a significant positive effect of public investment on growth contingent on high levels of Weberianness. We found no such effect.
WEBERIAN BUREAUCRACY AND ECONOMIC GROWTH 761
a larger sample of countries. Weberianness is a potential sociological addition to the small set of robust predictors of growth that have been identified by economists in recent cross -national studies.
Despite the promising character of these results, we stress that the research we present here is only a beginning. Several avenues for further work are obvious. Gathering data on bureaucratic structures for a larger sample of countries is the first step toward a better test of the robustness of the relationship found here.25 The success of the initial effort we re- port here argues that the returns from gather- ing more and better evidence on cross-na- tional variations in the structural character- istics of state bureaucracies would more than justify the effort required.
A more ambitious goal is extending the longitudinal coverage of data collection by looking at changes in the character of public bureaucracies in the 1990s. This task is rel- evant to understanding the roots of the cur- rent economic problems in East Asia. Previ- ous case studies emphasized that it might be difficult to sustain the Weberian character of East Asian bureaucracies (Amsden 1989; Evans 1995). Recent commentators have suggested that the declining integrity of public bureaucracies has played an impor- tant role in the deterioration of East Asian financial systems (e.g., Chang, Park, and Yoo 1998).
Finally, it would be illuminating to exam- ine the relationship between Weberianness and a range of other political, social, and economic variables that have been shown to be related to growth. Political regimes (Alvarez et al. 1996) and the policy outputs commonly used in cross-country regressions (e.g., black market premium, fiscal surplus, price distortions) are two examples.26
Although much remains to be done, one incontrovertible conclusion transcends the exploratory character of our study: The "Weberian-state hypothesis" deserves more attention from sociologists and other social scientists, both empirically and analytically.
Peter Evans is Chancellor's Professor and Chair of the Sociology Department at the University of California, Berkeley. His recent books include State-Society Synergy: Government Action and Social Capital in Development (edited collection, Berkeley, CA. University of California, Berkeley, International and Area Studies Publications, 1997) and Embedded Autonomy: States and In- dustrial Transformation. (Princeton, NJ: Princeton University Press, 1995). He is cur- rently working on an edited collection entitled Livable Cities: The Politics of Urban Livelihood and Sustainability.
James E. Rauch is Professor of Economics at the University of California, San Diego, and Re- search Associate at the National Bureau of Eco- nomic Research. He is author (with Gerald M. Meier) of Leading Issues in Economic Develop- ment (7th ed., Oxford University Press, forthcom- ing) and editor (with Robert C. Feenstra) of Sym- posium on Business and Social Networks in In- ternational Trade, a special issue of the Journal of International Economics (Vol. 48, No. 1, June 1999). He is currently working on a conference volume entitled Networks and Markets.
Appendix A. The "Weberianness" Scale
The Weberianness Scale was created from 10 items in the original questionnaire. The items (with fixed response alternatives abbreviated) are shown below. The full questionnaire and the recoding used in com- piling the scale are available at <weber.ucsd.edu/ -jrauch/webstate>.
The individual responses to the 10 questions (ex- cept question 9) were aggregated to create a coun- try-level data set, in which each country's score was the average of the responses of all experts answer- ing each question for that country. (Country ratings on question 9 were based on the investigators' as- sessment of combined country expert responses to two questions regarding initiation and selectivity of civil service exams.) Country averages for each of the 10 questions were recoded into two or three cat- egories in such a way as to obtain as equal a distri- bution of countries over the categories as possible. The 10 questions were then combined to form a scale.
25 A project is currently in the planning stages at the United Nations University that would ex- tend coverage of the data to an additional 15 or 20 countries in Sub-Saharan Africa. So far, how- ever, most efforts to interest funding agencies in support for building the necessary data infrastruc- ture have had disappointing results.
26 In another paper (Rauch and Evans forth- coming), we examine of the relationship between Weberianness and some commonly used bureau- cratic performance variables.
762 AMERICAN SOCIOLOGICAL REVIEW
1. Which of the following descriptions best fits the role of these agencies in the formulation of eco- nomic policy.
(1) Many new economic policies originate in- side them.
(2) Some new policies originate inside them. (3) They rarely originate new policies.
2. Approximately what proportion of the higher of- ficials in these agencies enter the civil service via a formal examination system?
(1) Less than 30% (2 ) 30-60% (3) 60%-90% (4) More than 90%
3. What is roughly the modal number of years spent by a typical higher level official in one of these agencies during his career?
(1) 1-5 years (2) 5-10 years (3) 10-20 years (4) Entire career
4. What prospects for promotion can someone who enters one of these agencies through a higher civil service examination early in his/her career reasonably expect? Assuming that there are at least a half dozen steps or levels between an en- try-level position and the head of the agency, how would you characterize the possibilities for moving up in the agency? [NB. more than one may apply.]
(1) In most cases, will move up one or two levels. (2) In most cases, will move up three or four
levels. (3) Will move up several levels to the level just
below top political appointees. (4) In at least a few cases, will move up to the
very top.
5. How common is it for higher officials in these agencies to spend substantial proportions of their careers in the private sector, interspersing private and public sector activity?
(1) Normal (2) Frequent but not modal (3) Unusual (4) Almost never
6. How would you estimate the salaries (and per- quisites, not including bribes or other extra-le- gal sources of income) of higher officials in these agencies relative to those of private sec- tor managers with roughly comparable training and responsibilities?
(1) Less than 50% (2) 50-80% (3) 80%-90% (4) Comparable (5) Higher
7. If bribes and other extra-legal perquisites are included what would the proportion be?
(1) Less than 50% (2) 50-80% (3) 80%-90% (4) Comparable (5) Higher
8. Over the period in question (roughly 1970- 1990) what was the movement of legal income in these agencies relative to salaries in the pri- vate sector?
(1) Declined dramatically. (2) Declined slightly. (3) Maintained the same position. (4) Improved their position.
9. This variable was createdfrom the combined re- sponses of all experts for each country, based on an assessment of the importance of civil service examinations for entry into the bureaucracy.
(0) No civil service exams, or exams are of triv- ial importance.
(1) Ambiguous based on experts' responses. (2) Civil service exams are an important com-
ponent of entry to the bureaucracy.
10. Among graduates of the country's most elite university(ies), is a public sector career consid- ered:
(1) The best possible option. (2, 3) Depends on circumstances. (4) A second best option.
Appendix B. Variable Definitions and Data Sources
Variable Definition Source
Total percent growth in GDP Total percentage growth of real GDP Penn World Tables (Mark 5.5) per capita 1970-1990 per capita from 1970 to 1990. (see Summers and Heston
1991)
Domestic investment, Average of the annual ratio of real Penn World Tables (Mark 5.5) 1985-1990 domestic investment (private plus public) Taken from updated data set
to real GDP over the period 1965 to 1970. from Barro and Lee (1993)
Domestic investment, Average of the annual ratio of real Penn World Tables (Mark 5.5) 1965-1970 domestic investment (private plus public) to Taken from updated data set
real GDP over the period 1965 to 1970. from Barro and Lee (1993)
(Continued on next page)
WEBERIAN BUREAUCRACY AND ECONOMIC GROWTH 763
Continued from previous page)
Variable Definition Source
Average years of schooling, Average schooling years in the total Updated data set from Barro 1965a population over age 25, 1965. and Lee (1993)
Government consumption, Average of the annual ratio of real Updated data set from Barro 1970-1985 government consumption expenditure net and Lee (1993)
of spending on defense and on education to real GDP over the period 1970 to 1985.
Average revolutions, Average of the number of revolutions Updated data set from Barro 1970-1985 per year from 1970 to 1985. and Lee (1993)
Africa A dummy variable for the Sub-Saharan African countries: CMte dIvoire, Kenya, Nigeria and Zaire.
East Asia A dummy variable for the four "East Asian Tigers": Hong Kong, Korea, Singapore, and Taiwan.
Latin America A dummy variable for the Latin American countries: Argentina, Brazil, Chile, Colombia Costa Rica, Dominican Republic, Ecuador, Guatemala, Haiti, Mexico, Peru, and Uruguay.
a Data for Average years of schooling, 1965 was unavailable for Egypt, CMte dIvoire, Morocco and Nigeria. Observations for these four countries were estimated using data on total educational attainment from Nehru, Swanson, and Ashutosh (1995). The Pearson correlation coefficient between these two variables was .80 (p < .001).
Appendix C. Weberianness Scale Scores for 35 Developing Countries
Country Weberianness Scale Score Country Weberianness Scale Score
Argentina 3.80 Mexico 8.50 Brazil 7.60 Morocco 7.00 Chile 5.00 Nigeria 3.00 Colombia 8.50 Pakistan 11.00 Costa Rica 9.00 Peru 5.00 CMte d'Ivoire 8.00 Philippines 6.00 Dominican Republic 2.00 Portugal 5.00 Ecuador 4.00 Singapore 13.50 Egypt 7.80 Spain 10.00 Greece 10.00 SriLanka 8.00 Guatemala 3.00 Syria 3.80 Haiti 4.00 Sra38 Hong Kong 11.00 Taiwan 12.00
India 10.00 Thailand 8.00
Israel 7.00 Tunisia 9.00
Kenya 1.00 Turkey 7.00 Korea 13.00 Uruguay 4.50
Malaysia 10.50 Zaire 4.00
REFERENCES
Alvarez, Mike, Jose Antonio Cheibub, Fernando Limongi, and Adam Przeworski. 1996. "Clas- sifying Political Regimes." Studies in Com- parative International Development 31(2):3- 36.
Amsden, Alice. 1989. Asia's Next Giant: South
Korea and Late Industrialization. New York: Oxford University Press.
Barro, Robert J. 1991. "Economic Growth in a Cross-Section of Countries." Quarterly Jour- nal of Economics 106:407-44.
Barro, Robert and Jong-wha Lee. 1993. "Interna-
764 AMERICAN SOCIOLOGICAL REVIEW
tional Comparisons of Educational Attain- ment." Journal of Monetary Economics 32: 363-94.
Barzelay, Michael. 1997. "Results Oriented Gov- ernment: Theories and Research on the New Public Management." Presented at the Aaron Wildavsky Forum for Public Policy, April 3-4, University of California, Berkeley, CA.
Bates, Robert H. 1981. Markets and States in Tropical Africa: The Political Basis of Agricul- tural Policies. Berkeley, CA: University of California Press.
.1989. Beyond the Miracle of the Market: The Institutional Foundations of Agrarian De- velopment in Kenya. Cambrige, England: Cam- bridge University Press.
Buchanan, James M., Robert D. Tollison and Gordon Tullock, eds. 1980. Toward a Theory of the Rent-Seeking Society. College Station, TX: Texas A&M University Press.
Campos, Jose Egardo and Hilton L. Root. 1996. The Key to the Asian Miracle: Making Shared Growth Credible. Washington, DC: Brookings Institution.
Callaghy, Thomas. 1989. "Lost between State and Market: The Politics of Economic Adjustment in Gambia, Zambia, and Nigeria." Pp. 257-319 in Economic Crisis and Policy Choice: The Politics of Economic Adjustment in the Third World, edited by J. M. Nelson. Princeton, NJ: Princeton University Press.
Chang, Ha-Joon, Hong Jae Park, and Chul Gyue Yoo. 1998. "Interpreting the Korean Crisis: Fi- nancial Liberalization, Industrial Policy, and Corporate Governance." Faculty of Economics and Politics, Cambridge University, Cam- bridge, England. Unpublished manuscript.
Cheng, Tun-jen, Stephan Haggard, and David Kang. 1995. "Institutions, Economic Policy and Growth in Korea and Taiwan." Presented at UNCTAD Seminar on Development of East and South-East Asia and a New Development Strategy-The Role of Government, October 30-31, Geneva, Switzerland.
Chenery, Hollis B. 1980. "The Semi-Industrial- ized Countries." Washington, DC: The World Bank. Unpublished manuscript.
Colclough, Christopher and James Manor, eds. 1991. States or Markets: Neo-Liberalism and the Development Policy Debate. Oxford, En- gland: Clarendon.
Collander, David, ed. 1984. Neoclassical Politi- cal Economy: An Analysis of Rent-Seeking and DUP Activities. Cambridge, MA: Ballinger.
Crowley, Angela, James Rauch, Susanne Seagrave, and David Smith. 1998. "Quantita- tive Cross-National Studies of Economic De- velopment: A Comparison of the Economics and Sociology Literatures." Studies in Com- parative International Development 33(2):30-
57. Delacroix, Jacques and Charles Ragin. 1981.
"Structural Blockage: A Cross-national Study of Economic Dependency, State Efficacy, and Underdevelopment." American Journal of So- ciology 86:1311-47.
Easterly, William and Ross Levine. 1997. "Africa's Growth Tragedy: Policies and Ethnic Divisions." Quarterly Journal of Economics 112:1203-50.
Ernst, Dieter and David O'Connor. 1992. Com- peting in the Electronics Industry: The Experi- ence of Newly Industrializing Countries. An OECD Development Centre Study. Paris, France: OECD.
Esfahani, Hadi S. 1991. "Exports, Imports, and Economic Growth in Semi-Industrialized Countries." Journal of Development Econom- ics 35:93-116
Evans, Peter. 1995. Embedded Autonomy: States and Industrial Transformation. Princeton, NJ: Princeton University Press.
Feder, Gershon. 1983. "On Exports and Eco- nomic Growth." Journal of Development Eco- nomics 12(1-2):59-73.
Firebaugh, Glenn. 1992. "Growth Effects of For- eign and Domestic Investment." American Journal of Sociology 98:105-30.
Gerth, Hans and C. W. Mills. 1958. From Max Weber: Essays in Sociology. New York: Ox- ford University Press.
Hood, Christopher and Michael Jackson. 1991. Administrative Argument. Hanover, Adershot, England: Dartmouth.
Johnson, Chalmers. 1982. MITI and the Japanese Miracle: The Growth of Industrial Policy, 1925-1975. Stanford, CA: Stanford University Press.
Keesing, Donald B. 1988. "The Four Successful Exceptions: Official Export Promotion and Support for Export Marketing in Korea, Hong Kong, Singapore, and Taiwan, China." Occa- sional Paper #2, UNDP-World Bank Trade Ex- pansion Program, Washington, DC.
Klitgaard, Robert. 1988. Controlling Corruption. Berkeley, CA: University of California Press.
Knack, Stephen and Philip Keefer. 1995. "Insti- tutions and Economic Performance: Cross- Country Tests Using Alternative Institutional Measures." Economics and Politics 7(3):207- 27.
Koh, Gillian. 1995. "A Sociological Analysis of the Singapore Administrative Elite: The Bu- reaucracy in an Evolving Developmentalist State." Ph.D. dissertation, Sociological Studies, University of Sheffield, Sheffield, England.
Krueger, Anne 0. 1974. "The Political Economy of the Rent-Seeking Society." American Eco- nomic Review 64:291-303.
La Porta, Rafael, Florencio Lopez-de-Silanes,
WEBERIAN BUREAUCRACY AND ECONOMIC GROWTH 765
Andrei Shleifer, and Robert Vishny. 1999. "The Quality of Government." Journal of Law, Eco- nomics, and Organization 15(1):222-79.
Levine, Ross and David Renelt. 1992. "A Sensi- tivity Analysis of Cross-Country Growth Re- gressions." American Economic Review 82: 942-63.
Lucas,Robert. 1988. "On the Mechanics of Eco- nomic Development." Journal of Monetary Economics 22(1):3-42.
Mauro, Paolo. 1995. "Corruption and Growth," Quarterly Journal of Economics 110:681-712.
Milgrom, Paul and John Roberts.1992. Econom- ics, Organization, and Management. Engle- wood Cliffs, NJ: Prentice Hall.
Nehru, Vikram, Eric Swanson, and Ashutosh Dubey. 1995. "A New Database on Human Capital Stock in Developing and Industrial Countries: Sources, Methodology, and Re- sults." Journal of Development Economics 46:379-401.
Olsen, Johan P. and B. Guy Peters, eds. 1996. Lessons from Experience: Experiential Learn- ing in Administrative Reforms in Eight Democ- racies. Oxford, England: Scandinavian Univer- sity Press.
Parsons, Talcott. 1964. Max Weber: The Theory of Economic and Social Organization. New York: Free Press.
Polanyi, Karl. [1944] 1957. The Great Transfor- mation. Boston, MA: Beacon Press.
Quah, Jonathan. 1993. "The Rediscovery of the Market and Public Administration: Some Les- sons from the Singapore Experience." Austra- lian Journal of Public Administration 52:320- 28.
Rauch, James and Peter Evans. 1999. "Bureau- cratic Structure and Bureaucratic Performance in Less Developed Countries." Discussion Pa- per No. 99-06, Department of Economics, Uni- versity of California, San Diego, CA.
Rauch, James and Peter Evans. Forthcoming. "Bureaucratic Structure and Bureaucratic Per- formance in Less Developed Countries." Jour- nal of Public Economics.
Rodrik, Dani. 1995. "Getting Interventions Right: How South Korea and Taiwan Grew Rich." Economic Policy (April)(20):55-97.
Romer, Paul. 1986. "Increasing Returns and Long Run Growth." Journal of Political Economy 94(5): 1002-37.
1990. "Endogenous Technological Change." Journal of Political Economy 98(Oc-
tober, no. 5):71-102. . 1994. "The Origins of Endogenous
Growth." Journal of Economic Perspectives 8(1):3-22.
Rubinson, Richard. 1977. "Dependence, Govern- ment Revenue and Economic Growth, 1995- 1970." Studies in Comparative International Development 12:3-28.
Snyder, David and Edward Kick. 1979. "Struc- tural Position in the World System and Eco- nomic Growth, 1955-1970: A Multiple-Net- work Analysis of Transnational Interactions." American Journal of Sociology 84:1096-1126.
Stepan, Alfred. 1978. The State and Society: Peru in Comparative Perspective. Princeton, NJ: Princeton University Press.
Summers, Robert and Alan Heston. 1991. "The Penn World Table (Mark 5): An Expanded Set of International Comparisons, 1950-1988." Quarterly Journal of Economics 106(2):327- 68. Updated version 5.5 retrieved 1994 (http:// www.nber.org).
Talbot, John. 1997. "A Description of the Weber- ian State' Comparative Data Set." Project document, Bureaucratic Structure and Eco- nomic Performance Project, Department of So- ciology. University of California, Berkeley, CA.
Wade, Robert. 1990. Governing the Market: Eco- nomic Theory and the Role of Government in Taiwan's Industrialization. Princeton, NJ: Princeton University Press.
Waterbury, John. 1983. The Egypt of Nasser and Sadat: The Political Economy of Two Regimes. Princeton, NJ: Princeton University Press.
Weber, Max. [1904-1911] 1968. Economy and Society. Edited by Guenter Roth and Claus Wittich. New York: Bedminster.
Williamson, Oliver. 1985. The Economic Institu- tions of Capitalism. New York: The Free Press.
World Bank. 1993. The East Asian Miracle: Eco- nomic Growth and Public Policy. A World Bank Policy Research Report. New York: Ox- ford University Press.
. 1994. Adjustment in Africa: Reforms, Re- sults and the Road Ahead. New York: Oxford University Press.
. 1997. World Development Report. The State in a Changing World. New York: Oxford University Press.