Page 1
IZA DP No. 1964
Bureaucratic Rents and Life Satisfaction
Simon LuechingerStephan MeierAlois Stutzer
DI
SC
US
SI
ON
PA
PE
R S
ER
IE
S
Forschungsinstitutzur Zukunft der ArbeitInstitute for the Studyof Labor
February 2006
Page 2
Bureaucratic Rents and Life Satisfaction
Simon Luechinger University of Zurich
Stephan Meier
Federal Reserve Bank of Boston
Alois Stutzer University of Zurich
and IZA Bonn
Discussion Paper No. 1964 February 2006
IZA
P.O. Box 7240 53072 Bonn
Germany
Phone: +49-228-3894-0 Fax: +49-228-3894-180
Email: [email protected]
Any opinions expressed here are those of the author(s) and not those of the institute. Research disseminated by IZA may include views on policy, but the institute itself takes no institutional policy positions. The Institute for the Study of Labor (IZA) in Bonn is a local and virtual international research center and a place of communication between science, politics and business. IZA is an independent nonprofit company supported by Deutsche Post World Net. The center is associated with the University of Bonn and offers a stimulating research environment through its research networks, research support, and visitors and doctoral programs. IZA engages in (i) original and internationally competitive research in all fields of labor economics, (ii) development of policy concepts, and (iii) dissemination of research results and concepts to the interested public. IZA Discussion Papers often represent preliminary work and are circulated to encourage discussion. Citation of such a paper should account for its provisional character. A revised version may be available directly from the author.
Page 3
IZA Discussion Paper No. 1964 February 2006
ABSTRACT
Bureaucratic Rents and Life Satisfaction*
The monopoly position of the public bureaucracy in providing public services allows government employees to acquire rents. Those rents can involve higher wages, monetary and non-monetary fringe benefits (e.g. pensions and staffing), and/or bribes. We propose a direct measure to capture the total of these rents: the difference in reported subjective well-being between bureaucrats and people working in the private sector. In a sample of 38 countries, we find large variations in the extent of rents in the public bureaucracy. The extent of rents is determined by differences in institutional constraints and correlates with perceptions of corruption. We find judicial independence to be of major relevance for a tamed bureaucracy. JEL Classification: D72, D73, I31, J30, J45, K42, H11, H83 Keywords: public sector, rents, life satisfaction, corruption, judicial independence Corresponding author: Alois Stutzer Institute for Empirical Research in Economics University of Zurich Bluemlisalpstrasse 10 8006 Zurich Switzerland Email: [email protected]
* We are grateful to Iwan Barankay, Christine Benesch, Matthias Benz, Tim Besley, Andrew Clark, Robert Dur, Reiner Eichenberger, Bruno Frey, Simon Hug, Erzo Luttmer, Dennis Mueller, Susanne Neckermann, Friedrich Schneider, Reto Tanner, Ruut Veenhoven, Rainer Winkelmann, participants of the ASSA meeting, and seminar participants at the London School of Economics, the Swiss Federal Institute of Technology Zurich and the universities of Basel, Bern, Fribourg, Rotterdam and Zurich for helpful comments. Our special thanks go to Carol Graham and Andrew Felton for providing valuable information on life satisfaction in Latin America.
Page 4
2
1 Introduction The monopoly position of the public bureaucracy in providing public services generates
rents for government employees. In contrast to a model of benevolent bureaucracy, a
political economics view predicts that bureaucrats will acquire those rents and protect
them against dissipation.
In order to understand the checks and balances that restrict the rent-seeking of
government sector employees, direct measures of rents are desirable. By a rent, we mean
the utility premium of a worker in the government sector, relative to an equally qualified
worker in the private sector. Those rents can consist, for example, of wage differentials,
monetary fringe benefits (like generous pension schemes, higher job security), non-
monetary job amenities (like larger offices, better staffing, offices with better public
transportation facilities, day-care centers), and, in certain cases, possibilities for
extracting bribes. Traditional approaches, based on wage differentials, cannot capture all
those benefits, or are not applicable, because they start from a competitive equilibrium
where no rents exist. In particular, analyses of wage differentials offer no guidance in
interpreting any wage differential, either in terms of a rent or compensation. Job queues
potentially capture the total compensation, but proxy the rent only for the marginal
position. Further, job queues provide no information on bureaucratic rents, if government
jobs are allocated by cronyism. Setting reported bureaucratic corruption equal to rents is
not appropriate either, because it is not clear whether corruption leads to extra benefits
for public employees, e.g. because there is the possibility of rent dissipation.
Page 5
3
This paper pursues two goals: (1) As a direct measure to capture the rents involved in the
government sector, we propose the difference in reported subjective well-being between
public bureaucrats and people working in the private sector of a country; i.e. if
bureaucrats report higher life satisfaction, this differential is interpreted as a utility
premium, or simply a rent. It is argued that employees in the government sector benefit
from a higher relative advantage or higher rents in countries where there is a larger
positive gap in reported life satisfaction, ceteris paribus. In contrast to previous
approaches for measuring rents in the government sector, our approach has the advantage
of measuring the total net utility differential between people working in the public and
the private sector. (2) We analyze the conditions determining the rents in the public
bureaucracy. The life satisfaction differentials between privately and publicly employed
people are related to political and institutional factors that are argued to facilitate rent
extraction, as well as to institutional constraints that are proposed as effective controls,
guaranteeing efficiency in the government sector.
Rent-seeking activities aim at getting transfers through state activities. As the
engagement for rents involves the investment of valuable resources, there are less
resources available for productive economic activity and a pareto-inferior situation is
achieved. Rent-seeking of private and government actors is thus leading to a lower level
of welfare overall. Opportunities for bureaucratic rent-seeking are manifold and often tied
to the several tiers of principal-agent relationships which characterize bureaucracies, i.e.
those between individual bureaucrats and managers of agencies, those between managers
of agencies and the legislature, or those between officials and voters. First, there are
Page 6
4
several characteristics of government bureaus which hamper the use of explicit incentives
to align the interests of individual bureaucrats with the interests of their superiors.
Second, informational asymmetries give bureaucrats considerable discretion vis-à-vis the
legislature. This allows bureaucrats to pursue their own goals via budget and slack
maximization. Finally, when interest groups succeed in legislating rents, bureaucrats are
likely to share in these rents. Bureaus have a variety of policy-implementing instruments,
making them a worthwhile target for rent-seeking activities. The policies enacted by the
legislature also create property rights, which bureaucrats can sell.
Our empirical analysis explores rents in the government sector from three different
angles. First, we emphasize the policies that create rents. These policies result from rent-
seeking activities by interest groups, and protect firms from competition by erecting
barriers to entry, restricting international trade and implementing price controls. Second,
the extent to which principal-agent problems can be overcome crucially depends on basic
government institutions. We concentrate on two aspects that are widely discussed in the
literature, namely the vertical separation of powers, or fiscal federalism, and the
horizontal separation of powers, or an independent judiciary. Third, the empirical
analysis is supplemented by a test to determine whether rents are appropriated via
corruption.
We study data on the life satisfaction of government and private sector employees from
21 European and 17 Latin American countries, based on the European Social Survey and
the Latino Barometer respectively. For each country, we calculate the relative well-being
differential of an average worker when employed by the government rather than
Page 7
5
privately. This approach enables country specific response behavior to be taken into
account.
We find a large variation in the life satisfaction of government employees, relative to
private employees, ranging from a well-being premium for the former of plus 5 percent to
a disadvantage of minus 3 percent. The variation of these differences across countries is
robust to the control for selection based on observable characteristics. Relative
advantages in life satisfaction in the public bureaucracy do, moreover, not simply reflect
differences in economic development. Rather, taking the level of per capita income into
account, the proxy for rents in the public bureaucracy is higher when internal competition
is hampered by administrative obstacles and price controls. Rents are also higher when
external competition is weakened by regulatory trade barriers. In contrast, rents are lower
in countries with an affordable independent judicial system and a long democratic track
record. We can also show that there is a sizeable positive correlation between the degree
of corruption and the satisfaction gap in a country.
The remainder of the paper is organized as follows: Section 2 introduces our measure for
capturing rents, based on data for people’s reported subjective well-being. It is compared
to previous proxy measures for rents, like wage differentials, queues and perceived
corruption. Section 3 discusses various theories explaining the existence of rents in the
government sector. These theories focus on the organizational structure within
bureaucracies, the institutional structure around them and regulatory policies. The
empirical analysis is presented in section 4. Rents are measured and then statistically
Page 8
6
related to factors that are hypothesized to determine them. Section 5 offers concluding
remarks.
2 Measurement of Rents in the Public Bureaucracy
2.1 Life satisfaction differences between employees in the government and private
sector
The economic idea of a rent is a utility premium an individual can appropriate due to his
or her monopolistic position or informational advantage. In order to directly test for rents
in the public bureaucracy, utility thus has to be measured. We propose to approximate
this utility premium by the relative difference in reported life satisfaction between
workers employed by the government and privately employed workers. This approach
takes advantage of the concept of subjective well-being for economic questions.
Following the economic tradition of relying on the judgment of the persons directly
involved, people are considered to be the best judges of the overall quality of their life.
With the help of representative surveys, it is possible to get indications of individuals’
evaluation of their life satisfaction. People evaluate their level of subjective well-being
with regard to circumstances and comparisons to other persons, past experience and
expectations of the future. Therefore, behind the score indicated by respondents lies a
cognitive assessment on the extent to which they judge the overall quality of their lives in
a favorable way. The measures of reported subjective well-being are thus promising
empirical approximations to individual utility. They passed a series of validation
exercises and seem to significantly correlate with true positive inner feelings (see Frey
Page 9
7
and Stutzer 2002a;b for introductions to the economics of happiness and references to the
validation literature in psychology). Thus, measures of reported subjective well-being
offer new opportunities for understanding the effects of employment conditions on
individual well-being.
Focusing on life satisfaction allows us to capture the total net benefits of a position in the
public bureaucracy. Thereby, benefits can go beyond the immediate job, e.g. due to
advantages on the housing market, or utilization of public services, like education for
one’s children, pension benefits etc.1 This ‘all-inclusive’ aspect differentiates our
approach from previous research studying the job satisfaction of public and private sector
employees (Blanchflower and Oswald 1999; Heywood, Siebert and Wei 2002; Clark and
Senik 2004). The general idea of identifying (labor market) rents by individuals’ self-
evaluation of their situation is, however, implied in this literature and applied by Clark
(2003), and Lalive (2002).
As the net benefits are calculated relative to employees in the private sector, they capture
the relative advantage of working in the public bureaucracy. Thus if conditions are
relatively more favorable in the private sector there might also be a negative life
satisfaction differential.
Our empirical strategy to measure rents in the bureaucracy can be summarized as follows.
The utility or life satisfaction increment or decrement from government sector
employment is isolated in a multivariate regression. The life satisfactionij of individual i
living in country j is explained by a dummy variable that takes on the value 1 if he or she
is a bureaucrat and 0 otherwise, and a vector of other personal characteristics Zij. The
Page 10
8
control variables Zij capture personal characteristics along which individuals in the
government sector and individuals in the private sector might differ from one another,
and which have an impact on reported life satisfaction, such as sex, age, education,
marital status, place of residence/type of neighborhood and citizenship status. Income,
working hours and occupation are not included as control variables, because these job
characteristics may be important channels through which rents are appropriated. If these
job characteristics were held constant, the pervasiveness of any rent in the government
sector would be underestimated. All control variables are transformed into mean
deviation form, Z ij − Z j . The coefficient of the constant term, β0j, can thus be interpreted
as the life satisfaction of the average individual living in country j, if he or she were to
work in the private sector. In order to allow for country specific effects of government
sector employment, as well as for the control variables on life satisfaction, the regression
summarized in the following equation (1) is run for each country j separately:
(1) Life satisfactionij = β0 j + β1 jbureaucratij + β2 j Z ij − Z j( )+ εij .
With the estimated coefficients of the micro-econometric well-being function, the
percentage difference in life satisfaction due to public employment in country j, j∆ , can
be calculated as follows:
(2) ˆ ∆ j =ˆ β 1 j
ˆ β 0 j
.
Standard errors for the country specific relative differentials, ˆ σ ∆ j, are computed using the
delta method.
Page 11
9
We propose the relative satisfaction differential ˆ ∆ j as a proxy for rents in the government
sector.
While measures of subjective well-being have the unique conceptual advantage of
providing an overall evaluation of rents, there are some other conceptual issues which
hamper a simple application as utility proxies.
First, people report their life satisfaction on an ordinal scale. In order to calculate a
relative difference in subjective well-being, the satisfaction scores have, however, to be
cardinally interpreted. There is evidence that a cardinal treatment of life satisfaction is
much less of a problem practically than theoretically (Kahneman 1999). Furthermore,
ordinal and cardinal treatments of satisfaction scores generate quantitatively very similar
results in micro-econometric well-being functions (Ferrer-i-Carbonell and Frijters 2004).
Second, individuals’ use of the response scale might vary, making interpersonal
comparisons difficult. Individuals may use and evaluate some verbalized categories
differently, may set anchors in numerical scales or may only use a certain range of the
response scale to express their subjective well-being. However, for many applications
within a country, individual specific reporting behavior can either be argued not to be
correlated with the variable of interest, or can be controlled for in a panel setting. We do
not see any reason for employees in the government sector to report their subjective well-
being in a systematically different way from employees in the private sector.
Third, the reporting of life satisfaction is partly culturally influenced (Diener and Tov
2005), involving all three of the aspects just mentioned. For instance, Latin Americans
Page 12
10
exhibit high desirability for life satisfaction (Diener 2000). Thus language and culture
specific reporting behavior might bias any correlation in the cross-country context.
Accordingly, we propose looking at the relative life satisfaction gap between publicly and
privately employed people. Calculating a difference within countries cancels out any
country or culture specific anchor effect, which shifts the average level of reported life
satisfaction in a country up or down. Setting the difference in relation to the level,
moreover, allows taking into account that some (language) cultures are reluctant to use
the entire range of the life satisfaction scale to express their subjective well-being.
Moreover, measuring relative differentials allows comparing life satisfaction differentials
resulting from different response scales.
2.2 Previous approaches
Rents in the government sector have so far been addressed indirectly with various
empirical approaches, most importantly wage differentials, queues and perceived
corruption. While these approaches are interesting in their own right, we argue that life
satisfaction differentials have important advantages.
(1) Wage differentials. Various studies compare the wages in the public and the private
sector. The pattern of findings indicates wage premiums for employees in the central
government, but not for workers in the non-central levels of the government sector (see
the survey by Gregory and Borland 1999).
Monetary payoffs are a salient aspect of jobs and probably often related to rents.
However, the identification of rents turns out to be rather difficult. According to the
Page 13
11
theory of compensating wage differentials, differences in salaries reflect differences in
workplace amenities and disamenities. Rents are absent by assumption of a competitive
labor market. Any remaining wage differential in an empirical analysis between public
and private employees is necessarily due to unobserved individual or unobserved job
characteristics. In a context of incomplete competition, wage differentials, however,
capture both unobserved characteristics and rents. Accordingly, empirical research tries
to take into consideration as many individual and job differences as possible to explain
differences in salaries. Most decomposition studies then attribute ex post the unexplained
part of a wage equation (or the difference in the estimated coefficients) to economic rents
captured by employees in the public or private sector. To incorporate all aspects of a job,
the respective variety of job amenities between sectors and across countries, and hidden
returns like bribes, is extremely difficult, if not impossible. Probably due to these
difficulties, we are not aware of any cross-country/cross-regional study that analyzes
predictions of wage differentials based on theories of rent-seeking.
Our approach, based on life satisfaction differentials, measures the total rents involved
without the necessity of having information about every job specific aspect. It allows us
to analyze empirically differences in rents across countries.
(2) Job queues. Queues indicate that people are willing to bear costs in exchange for
expected future benefits (e.g. Krueger, A. B. 1988; Heywood and Mohanty 1995). The
length of a queue, e.g. the number of applicants for a job in the government sector, might
thus indicate rents. Results show that people queue for jobs in the federal bureaucracy.
Job queues have the potential of measuring the total compensation, and not only the wage
Page 14
12
differential. An application of this measure is, however, difficult, and not only for data
reasons. In particular, queuing costs can only proxy the rent for the marginal employee.
More importantly, jobs, which provide rents to their holders, are often assigned to people
by patronage rather than by an open selection process. Life satisfaction differentials allow
for the study of rents of intramarginal employees, independent of how they got their job.
(3) Perceived corruption. Instead of looking at public employees directly in order to
measure rents, people who interact with public employees can be asked about their
experiences with them. This is the approach applied with reported corruption. Business
people, journalists and citizens report their perceived corruption in the government
sector, i.e., the misuse of public positions for private gains. Perceived corruption is then
argued to provide a proxy for rents applicable in empirical analyses (Persson, Tabellini
and Trebbi 2003). It is, however, unclear whether corrupt behavior leads to any utility
premium at all. First, corruption in the form of bribes might compensate for low salaries
in certain positions compared to outside opportunities. Second, the benefits from
corruption might be dissipated in the effort to get and keep a particular position or job.
With measures of life satisfaction, it is possible to study whether any utility premium or
rent to employees in the government sector remains when there is more corruption, or
whether it is used up in the process of defending it. Moreover, bribery and corruption are
only two of many sources of rents in the public bureaucracy.
Page 15
13
3 Theories of Bureaucratic Rents There are several theoretical reasons why rents in the public bureaucracy are to be
expected. In the first part of this section, we outline the theoretical framework for why
rents can exist.2 In particular, the organizational structure of the public bureaus makes it
difficult to align bureaucrats’ interests with those of their principals, the public. In the
second part, the framework is extended to provide empirically testable hypotheses for
when rents are expected to be higher or lower. Two particular aspects are important:
First, the more the state is engaged in regulatory policies, the more opportunities there are
to acquire rents. And second, the more the bureaucracy has to act within a set of checks
and balances, the lower the rents are expected to be. We also discuss why bureaucrats
may enjoy higher utility for other reasons than the failure to align their interests with
those of the principal, and why rents may be dissipated in the process of acquiring them.
3.1 Organizational Structure and Incentives Within Public Bureaus
The organizational structure of public bureaucracies can explain why, on the one hand,
incentives are low powered and, on the other hand, legislative control is limited, leaving
the bureaucracies leeway to maximize budget and slack.
Bureaucracies are characterized by several tiers of principal-agent relationships. At each
level, there are many opportunities of bureaucratic rent-seeking. Within bureaucracies,
there is the relationship between managers of agencies and individual bureaucrats. In this
relationship, several characteristics of government bureaus hamper the use of explicit
incentives to align the interests of individual bureaucrats with their superiors. Most
Page 16
14
notably, there is a multiplicity of dimensions – of tasks, of principals and their often-
conflicting interests about the ends and the means, and of the tiers of management and
front-line workers (Dixit 2002). Moreover, output is difficult to measure in the
government sector. After all, a key characteristic of a government bureau is the non-
market nature of its output. These aspects of the organizational structure, in principal,
allow subordinates in the government sector to withdraw work effort and to pursue their
own goals, giving them higher utility than if they would pursue the goals set for the
agency.
An important principal-agent relationship beyond the eminent bureaucracy involves the
one between legislators and chief bureaucrats. Bureaucrats hold three pivotal advantages
in the bargaining situation with their sponsors: (i) the bureau is a monopolistic supplier,
(ii) this position gives it a monopoly over information, and (iii) it is institutionally
allowed to make take-it-or-leave-it budget proposals. Bureaucrats use this power to
obtain bigger budgets than those legislatures would want to grant in the absence of these
distortions (Niskanen 1971). Large budgets make it easier for bureaucrats to pursue their
goals: ‘salary, perquisites of the office, public reputation, power, patronage, output of the
bureau, ease of making changes, and ease of managing the bureau’ (Niskanen 1971, p.
38). Alternatively, the bureaucrats can be assumed to maximize not the total budget, but
rather discretionary budget or slack, i.e. the difference between the total budget and cost
of production (Migué and Bélanger 1974).
However, while an agency may be a monopoly in the sense that no other agency is
producing that particular output, the manager of the agency is not a monopolist but rather
Page 17
15
subject to competition within the bureaucracy (Breton and Wintrobe 1982). This may
limit the predominance of the bureaucracy over elected officials. Further, the legislature
has authority over the bureau and can structure their bargaining in the way it wants
(Miller and Moe 1983). Finally, administrative procedures can mitigate problems of
asymmetric information. The legislature has a rich menu of control techniques at its
disposal, including competition for budgets among bureaus, ex post sanctions and the
possibility of enfranchising the politically relevant constituencies in the administrative
process which monitor bureaus’ behavior (Weingast and Moran 1983; McCubbins, Noll
and Weingast 1987). However, these instruments are costly and bureaus’ managers are
not passive. Moreover, bureaucrats carry a considerable amount of political clout as a
significant minority of the electorate and often the legislature, as well as a small,
privileged and homogenous interest group (Tullock 1993).
3.2 Regulatory Policies Creating Possibilities for Rent-Seeking
Bureaucrats play an important role on the supply side of the political market for rent-
creating government interventions. On the one hand, bureaus have substantial policy-
implementing authority, making them a worthwhile target for rent-seeking activities. On
the other hand, the policies resulting from the rent-seeking process, even if brokered by
elected officials, create valuable property rights. Bureaucrats can extract part of the
created rents, insofar as they have discretion over the provision of these property rights.
For example, a government official allocating milk quotas to farmers receiving
government-guaranteed prices, or a customs’ officer, may collect bribes for assigning
higher quotas or giving passage through customs. The provision of property rights can be
Page 18
16
influenced by outright corruption or more subtle means, including hiring the relatives of
officials, or employing the officials themselves upon retirement.
From the outset, the two main rent-creating government interventions analyzed in the
rent-seeking literature have been (1) policies sheltering firms from domestic competition
and (2) policies keeping out foreign competitors (Tullock 1967; Krueger, A. O. 1974).
Strict regulations function as barriers to entry and, hence, increase incumbent firms’
profits. Similarly, tariffs and various other forms of trade restrictions keep out foreign
competitors. ‘The monopoly rents that the government can help provide are a prize worth
pursuing, and the pursuit of these rents has been given the name of rent-seeking’ (Mueller
2003, p. 333). The rent-seeking theory comes in two variants, assigning the bureaucracy
different roles in the process. The regulatory capture theory considers the creation of the
regulatory agencies themselves as the prize in the bidding process by interest groups.
Right from the start, the agencies are captured and promote the regulated interests (Stigler
1971). Another strand of the theory considers regulations to be pursued mainly for the
benefits of politicians and bureaucrats (De Soto 1990; Shleifer and Vishny 1998). But
even if regulatory agencies are designed to promote the interests of the regulated industry
at the outset, there is a constant threat that the rents will be annihilated. Interest groups,
therefore, have an incentive to strike bargains with the bureaucrats (McChesney 1987).
Moreover, the higher the rents created by government intervention, the higher are the
incentives for bureaucrats to engage in malfeasant behavior (Ades and Di Tella 1999).
Empirical research has shown that both stricter regulation of entry for start-up firms
Page 19
17
(Djankov et al. 2002), as well as protection from international trade (Ades and Di Tella
1999), are associated with higher levels of perceived corruption.
Accordingly, we expect the level of rents measured by life-satisfaction differentials to be
the higher, (1) the more domestic competition is hampered by regulatory policies and (2)
the more external competition is restricted by government policies.
3.3 Institutional Constraints
At each tier of the multiple principal-agent relationship identified above, the degree of
informational asymmetries, sanctioning mechanisms and, more generally, the constraints
on bureaucratic rent-seeking are essentially determined by the constitutional setting of a
country. Two aspects are particularly important: (1) vertical separation of powers or
federalism and (2) horizontal separation of powers in the form of judicial independence.
The degree of decentralization of a country affects various aspects of government
bureaus. Competition for mobile resources is expected to improve governance by
increasing the cost to officials who provide public services inefficiently (Brennan and
Buchanan 1980). Sub-national jurisdictions are constrained by this competition for
mobile resources in regulating economic activity. Federalism thus diminishes the level
and pervasiveness of economic rent-seeking (Weingast 1995). Competition will also
drive down bribes to be paid to sub-national bureaus dispersing scarce benefits (Rose-
Ackerman 1978). Further, a closer association between expenditures and revenue
mobilization, and lower information costs to citizens at the sub-national level, as well as
more specific tasks particular to a single jurisdiction, may also lead to better
Page 20
18
accountability of bureaucrats and elected officials (Oates 1999). However, this positive
view of fiscal federalism has been challenged. Multiple tiers of government could
weaken accountability, as voters have greater difficulty attributing blame and credit
(Fisman and Gatti 2002). If decentralization is accompanied by a lack of coordination
among bureaucrats in extracting bribes for complementary permits, excessive rent
extraction or ‘overgrazing’ may result. Independent bureaus ignore the negative effects of
raising their bribes on demand for complementary permits and, hence, the bribes to the
other bureaus (Shleifer and Vishny 1993).
Independent courts are an important constraint for administrative decision-making. The
separation of the creation of laws and regulations from the administration of justice
prevents the abuse of the power by one branch of government (see e.g. Hayek 1960).
Constitutional review limits the power of the executive and the legislature to pass laws
and regulations that benefit themselves or allied interest groups (La Porta et al. 2004).
Furthermore, an independent judiciary can examine whether a bureau has interpreted the
law as intended by the enacting legislature, and whether bureaus follow the appropriate
process in making their decisions (Hanssen 2000). Bureaus are thus constrained by the
threat that an independent judiciary may reverse their decisions or impose other actions.
The other branches react accordingly and attempt to undermine judicial independence. By
regulating judicial procedures, for example, the legislature gains control over the
outcome and ensures that disputes are resolved so as to favor itself and its clientele
(Djankov et al. 2003). However, it can be argued that an independent judiciary also
facilitates rent extraction by the other branches. By immunizing laws from short-run
Page 21
19
political pressures, an independent judiciary increases the value of legislation sold to
interest groups (Landes and Posner 1975).
There is also a time dimension to institutional constraints, influencing how binding they
are de facto. A system of checks and balances needs time to develop and consolidate
(Persson and Tabellini 2003). A transition from an autocratic to a more democratic
government is often accompanied by an increase in corruption, which can be attributed to
the underdeveloped institutions under the newly formed democracy (Huntington 1968).
In contrast, rent-seeking activities may be less pervasive in countries recently subjected
to revolutionary upheaval, as a pre-existing interest group structure is typically weakened
or eliminated. Accordingly, long existing and stable democracies suffer from internal
sclerosis, as well-established interest groups successfully defend their members (Olson
1982).
The empirical evidence regarding the influence of federalism and judicial independence
on rents in the bureaucracy is indirect only and focuses on corruption. Moreover,
evidence regarding federalism is mixed. Fisman and Gatti (2002) find decentralization in
government expenditure to be strongly and statistically significantly associated with
lower corruption. Using a dummy variable indicating countries with a federal
constitution, Person, Tabellini and Trebbi (2003) find no relationship, and Treisman
(2000) finds a positive one. For judicial independence, however, the results are
unequivocal. Judicial independence is positively associated with different measures of
economic freedom (La Porta et al. 2004) and higher procedural formalism predicts higher
perceived corruption (Djankov et al. 2003). Finally, countries with a continuous
Page 22
20
experience of democracy in their recent history ceteris paribus have lower levels of
perceived corruption (Treisman 2000; Serra 2004).
Accordingly, we would expect (1) the relationship between rents and federalism to be
ambiguous, (2) rents to be lower with higher judicial independence, and (3) longer
democratic experience in a country to have an ambiguous influence on rents.
3.4 Alternative Causes for Utility Premiums in the Bureaucracy and Rent
Dissipation
So far, the discussion of rents concentrated on situations that allow bureaucrats to capture
rents because of a failure to align their interests to those of the citizens. However, adverse
consequences are not necessarily a corollary of bureaucrats enjoying rents. Some utility
premium for bureaucrats might even be intentional on the part of their principal. A
principal might offer bureaucrats a wage above their opportunity costs in the private
sector, in order to reduce the likelihood that bureaucrats sacrifice the public’s interest for
their own. The size of this wage increase is inversely related to the probability of
detection, and directly related to the size of potential gains from misbehavior (Becker and
Stigler 1974; Acemoglu and Verdier 2000). Especially in countries with underdeveloped
institutions and large gains from misbehavior, a costly efficiency wage may be the lesser
of two evils (Ades and Di Tella 1999).3 In our empirical investigation, we will analyze to
what extent rents can be accounted for by higher regular income.
There are two other reasons for higher utility in the public sector, for which there is no
obvious argument that they depend on the institutional controls discussed above. First, in
Page 23
21
many areas of the public sector, such as the military or academia, only a small fraction of
aspirants get promoted to a permanent position. In these cases, the higher utility enjoyed
by the regular officers and professors might just reflect the prize of the tournament set up
by the principal (Prendergast 1999). Second, public bureaucrats may derive more utility
from their job than their private sector counterparts, because they are intrinsically
motivated and enjoy carrying out their task (Frey 1997), because of a better matching of
principals’ and agents’ mission preferences in the government sector (Besley and Ghatak
2005), or because they are more likely to get utility from the distinction provided by non-
material extrinsic rewards, like titles and orders (Frey 2005). As our interest is primarily
in the variation of rents across countries, any general level effect does not interfere with
the empirical analysis.
Despite the possibility of bureaucratic rent-seeking at each tier of the principal-agent
relationship, it is not clear whether bureaucrats succeed in capturing any rents at all. The
rents may be dissipated in the process of acquiring and defending them (Buchanan 1980).
Similarly, intrinsically motivated agents, sharing the mission of the government bureau,
are prepared to work for less than they could earn in the private sector. Therefore,
whether bureaucrats are able to capture rents, and under what conditions they are able to
do so, are ultimately empirical questions.
4 Empirical Analysis We present the empirical analysis in four steps: First, we introduce the data. Second, the
average levels of rents in our sample of countries are measured, based on our new
Page 24
22
approach. Third, we analyze the determinants of rents by explaining the cross-country
variation in rents, with differences in regulatory policies and institutional constraints.
Fourth, our measure of rents is correlated with perceived corruption indices in order to
validate the latter measure and to test whether bureaucrats are able to acquire a part of
their rents through corrupt behavior.
4.1 Data
There are mainly two data sources containing information on people’s life satisfaction, as
well as their occupation, for a large number of countries: the European Social Survey
(ESS) for 21 European countries4 and the Latinobarometer (LB) for 17 Latin American
countries. For robustness checks, we also use the Eurobarometer Survey Series (EB) with
information for 13 European countries. In all three surveys, random cross-section
samples in the respective countries are interviewed. The ESS was carried out for the first
time in 2002/2003, and the surveys of the LB and EB are repeated annually. Data on
people’s life satisfaction, as well as their occupation, are included in the surveys of 1997,
2000, 2001 and 2003 of the LB and in fourteen surveys of the EB between 1989 and
1994.
Life satisfaction is reported in the ESS using the following question: ‘All things
considered, how satisfied are you with your life as a whole nowadays?’ Individuals are
asked to state their life satisfaction on a scale from 0 (extremely dissatisfied) to 10
(extremely satisfied). The questions asked in the other survey series are similar, though
responses are elicited on a four-point scale. For the LB, the question reads as follows: ‘In
Page 25
23
general, would you say that you are satisfied with your life? Would your say that you are
[4] very satisfied, [3] fairly satisfied, [2] satisfied, or [1] not satisfied?’
In the empirical analysis, the sample is restricted to employed and self-employed
individuals. A dichotomous variable indicates whether an individual is working in the
public bureaucracy. In the ESS, the variable is constructed on the basis of information
about the respondents’ industry (according to the EU industry classification, NACE Rev.
1). It includes people working in the public administration, defense, and compulsory
social security. Other employed or self-employed people are in the reference category.
There are 19,288 observations from the ESS.5 1,356 individuals are classified as public
bureaucrats. For individual countries, the number of observations varies between 524 for
Italy (of which 33 are bureaucrats) and 1,347 for Germany (of which 88 are bureaucrats).
In the case of the LB and the EB, the variable is constructed on the basis of information
about the respondents’ sector of employment. This categorization of the public
bureaucracy does not only include public administration, but public sector employment in
total. Accordingly, the proportion of respondents classified as public bureaucrats is
higher in the LB and the EB than in the ESS. The four waves of the LB used contain
72,150 observations with non-missing values for life satisfaction and a total of 40,539
observations when the sample is restricted to the economically active population. Of
these, 6,587 work in the public sector. The number of observations varies between 1,367
in Paraguay and 2,954 in Ecuador, with the number of bureaucrats varying between 187
in Paraguay and 557 in Panama. Finally, the waves from 1989-1994 of the EB offer
64,470 observations, of which 22,520 are observations for bureaucrats. The number of
Page 26
24
observations varies between 2,435 for Luxembourg (of which 949 are bureaucrats) and
11,987 for Germany (of which 3,697 are bureaucrats).
The restriction of our sample to working respondents leads to lower bound estimates of
bureaucratic rents for two reasons. First, former government sector employees usually
enjoy exceptionally generous retirement provisions. Second, public officials are often
protected from dismissal by special statutes. Hence, former bureaucrats will be
underrepresented among unemployed people. Generous retirement arrangements and
greater job security are both likely to be important aspects of bureaucratic rents.
4.2 Measurement of Rents in the Public Bureaucracy
Rents in the public bureaucracy are measured by the utility differential of government
sector employees relative to employees in the private sector, whereby utility is
approximated by self-reported subjective well-being.
Based on the three data sources, we estimate micro-econometric well-being functions as
outlined in equation (1). For the standard socio-demographic characteristics, we find
similar partial correlations with life satisfaction to those reported in the literature (see e.g.
Di Tella, MacCulloch and Oswald 2001 for the Eurobarometer; Graham and Pettinato
2002 for the Latinobarometer; Frey, Benesch and Stutzer 2005 for the European Social
Survey). We do not report on the life satisfaction functions for each country in detail.
Exemplary, the detailed specification for Europe and Latin America as a whole are
presented in tables A1 to A3 in the appendix. In both regions, public bureaucrats are, on
average, more satisfied with their life than people working in the private sector, though
Page 27
25
the result for the ESS is not statistically different from zero at conventional levels. The
respective coefficients are 0.109 (std. err. 0.097) for the ESS, 0.048 (std. err. 0.013) for
the LB and 0.045 (std. err. 0.045) for the EB and amount to life satisfaction differentials
between 1.5 and 2 percent of the life satisfaction reported by an average individual
working in the private sector. However, these estimates are not very informative, as they
mask considerable variation across countries. The corresponding estimates for the
individual countries are presented in figure 1.
[Figure 1 about here]
There are four countries with life satisfaction differentials for public employees that are
larger than plus 5 percent (the highest decile). These are the Czech Republic, Paraguay,
Poland and Greece. At the other end of the spectrum there are countries in which it is
more attractive to work in the private sector. In the lowest decile, there are four countries
with relative differentials that are around minus 3 to minus 4 percent. These are Finland,
France, Israel and Costa Rica. The relative gaps in life satisfaction are measured with
different degrees of precision, reflected in the confidence interval for each estimation.6
These variations in the standard errors of the relative differentials are taken into account
in the next step of the analysis.
In this analysis, the differences in life satisfaction between government and private
employees are taken as a proxy measure of the relative attractiveness of the two sectors.
This interpretation of relative life satisfaction differentials in single countries has,
however, to be taken with caution. Whether somebody works in the government or in the
private sector is not randomly determined. People rather self-select into jobs given the
Page 28
26
institutional restrictions. They try to find employment in the sector where they expect to
be relatively better off.
While it is inherently interesting to understand who is joining the public service, self-
selection might lead to systematic biases in the current analysis. For example, better
educated people are more likely to join the public administration in many countries. To
the extent that they are more satisfied with life in general, they contribute to a positive
raw differential in subjective well-being even though there might be no rent.
In order to get an unbiased average effect of working in the public bureaucracy on life
satisfacton, an instrumental variable approach would be necessary. However, the
instrumental variable approach has proven to be very difficult to apply in the
determination of public sector specific wage premiums: „[To] identify the selection
equation most studies of a worker’s choice of sector of employment have used variables
such as age or education; yet arguably such variables are more appropriate as explanatory
variables in the earnings regression“ (Gregory and Borland 1999, p. 3599). We thus
resolve to control for differences in observed individual characteristics (like the level of
education), as well as unobserved individual characteristics that are correlated with the
former. This procedure is expected to reduce the bias in calculated differentials.
More important than any bias in the general level of the life satisfaction differential
would be distortions that affect the ranking of countries with regard to rents in the public
bureaucracy. Such distortions would hamper the analysis of the institutional determinants
of rents. The possible distortions can be tentatively assessed by comparing raw life
satisfaction differentials with life satisfaction differentials after controlling for individual
Page 29
27
characteristics. If our proxies for rents are not mere measurement artifacts, they are
expected to be relatively large for the same countries whether observed characteristics are
taken into account or not. In fact, a high Spearman rank order correlation between raw
and corrected life satisfaction differentials of 0.809 is found. Given the stability, we take
the substantial variation in relative life satisfaction differentials across countries as our
explanandum for the next section.
4.3 Determinants of Rents in the Government sector
4.3.1 Empirical strategy
Several determinants of rents are explored, as discussed in section 3. Thereby, we see the
barriers to trade and market entry, as well as constitutional checks and balances in a
country as different aspects of the same phenomenon, reflecting an ‘equilibrium’ state of
a weak or strong institutional environment determining bureaucratic rents. Empirically,
we approach this same phenomenon from those two perspectives, applying different sets
of explanatory variables as proxies.
The tested hypotheses are not mutually exclusive but, on the contrary, highlight different
aspects of bureaucratic rent seeking. Therefore, we test each hypothesis separately.
A key variable in the literature on rent-seeking and corruption is a country’s economic
development. Reported corruption is the lower, the higher the GDP per capita in a
country is. Economic development is an important summary measure, or proxy for a
functioning state and economy, including the public administration. This is reflected in
positive correlations between most variables of good governance and GDP per capita.
Page 30
28
Correlations for our set of variables are provided in table A5 in the appendix. In order to
empirically study whether some institutional or policy variable explains variation in
bureaucratic rents, rather than merely picking up the effect of economic development, we
include GDP per capita in the baseline specification of our analysis. It ensures that we
study the determinants of rents for economically comparable countries.
Rents in the government sector, the dependent variable, are taken from our first step
estimations for single countries. As the dependent variable is measured with unequal
precision across countries, we have to correct for heteroskedasticity. We estimate GLS
models and use the inverse of the estimated standard errors of the relative life satisfaction
differentials as weights. Equation (3) summarizes the specification:
(3) ˆ ∆ jˆ σ ∆ j
= γ 01
ˆ σ ∆ j
+ γ1
x j
ˆ σ ∆ j
+ γ2
log(y j )ˆ σ ∆ j
+u j
ˆ σ ∆ j
,
where ˆ ∆ j denotes the relative life satisfaction differentials, ˆ σ ∆ j the corresponding
standard errors, jx the key explanatory variable, yj the per capita GDP, and uj the error
term.
Before we introduce the individual variables and present the corresponding results, there
are two things worth noting. First, all indices are rescaled in such a way that they take on
values between 0 and 10 and have a straightforward interpretation. Higher values of the
indicator for judicial independence, for example, correspond to more judicial
independence. Second, as our dependent variable is constructed with surveys covering
several years, we use average values whenever an indicator is available for more than one
Page 31
29
year in the period considered. Specifically, all variables based on indices published by
Gwartney and Lawson (2004) are averages of the original indices for the years 2000,
2001 and 2002, and all variables based on indices by Kaufmann, Kraay and Mastruzzi
(2004) are averages of the original indices for the years 1996, 1998, 2000 and 2002. The
descriptive statistics for our explanatory variables are presented in table A4 in the
appendix. The control variable for economic development is the log of the PPP converted
per capita GDP (Heston, Summers and Aten 2002).
4.3.2 Policies weakening economic competition
Rents in the government sector are hypothesized to depend positively on the degree to
which policies protect firms from internal and foreign competition.
We use four variables capturing barriers to entry or the degree of internal competition.
Probably the most thorough measure of entry barriers has been collected by Djankov et
al. (2002). It aggregates the time and out-of-pocket costs of all procedures that an
entrepreneur needs to carry out in order to begin legally operating a firm. In our sample,
the cost of starting a new business varies from 3 percent of per capita GDP for the United
Kingdom to 300 percent of per capita GDP for Bolivia.7 Two further variables are based
on business executives’ perceptions (i) on the extent to which administrative procedures
are an important obstacle to starting a new business and (ii) on how easy it is in general to
start a new business (Gwartney and Lawson 2004). As another indicator for internal
competition, we take an index for the prevalence of price controls in an economy
(Gwartney and Lawson 2004).8
Page 32
30
Restrictions on international trade are measured by two variables (Gwartney and Lawson
2004). The first is a composite index, comprising the government revenues from taxes on
international trade, the mean tariff rate and the standard deviation of tariff rates. The
second is again based on a survey capturing the views of business executives. It
comprehends all trade barriers other than published tariffs and quotas, such as the time
required for administrative red-tape.
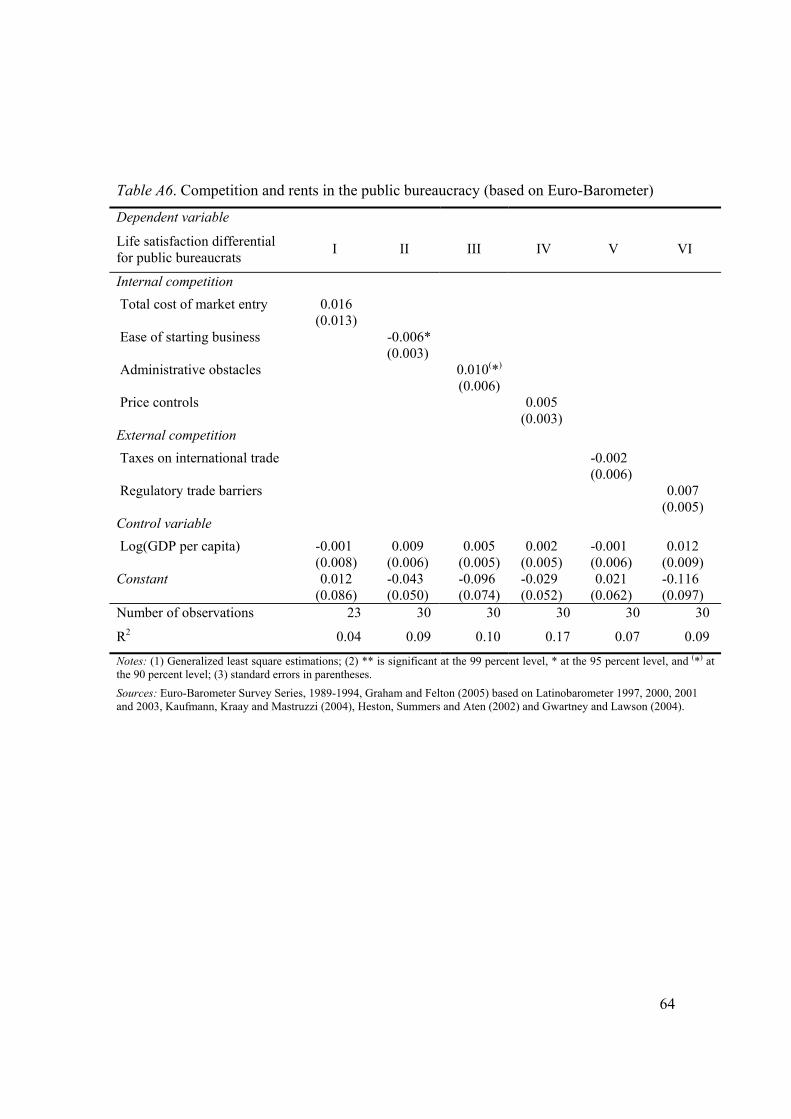
The results for the policy, or regulatory variables, are compatible with the basic
hypothesis. According to the regression results in table 1, bureaucrats benefit from entry
barriers for new firms, impediments to foreign trade and price controls.
[Table 1 about here]
The partial correlation coefficient is largest for the variable administrative obstacles
(table 1, column III). Administrative procedures are the area where bureaucrats have the
most extensive implementation authority. Furthermore, cumbersome procedures give
bureaucrats considerable power over prospective entrants.
Entry barriers in general are measured by two variables (table 1, columns I and II). While
we find a statistically negative association between the perceived ease of entry and
bureaucratic rents, there is no relationship between rents and the cost measure of Djankov
et al. (2002). Price controls, another form of government intervention in domestic
markets, exhibit a positive effect on bureaucratic rents (table 1, column IV). An increase
of the indicators for administrative obstacles and price controls by one standard deviation
is each related to a 1.0 percentage points higher relative life satisfaction differential.
Page 33
31
For protectionist measures, a similar picture emerges, as in the case of policies against
internal competition. Bureaucrats benefit mostly from the creation of those property
rights over which they have an influence and which they administer, namely regulatory
trade barriers (table 1, column V). An increase in the index for regulatory trade barriers
by one standard deviation corresponds to an increase in the relative life satisfaction
differential by 1.5 percentage points. With regard to tariffs and taxes on international
trade, we find a sizeable positive effect on bureaucratic rents. However, the effect is not
statistically significantly different from zero (table 1, column VI).
The results for the sample with the EB data are qualitatively comparable (see table A6 in
the appendix). The size of the coefficients is slightly smaller, which leads the statistical
significance to drop below conventional levels for price controls and regulatory trade
barriers.
4.3.3 Institutional constraints
It is hypothesized that competition through fiscal federalism, legal security through a
judicial system, and uninterrupted experience of democracy are important institutional
constraints on bureaucratic rent-seeking. We use a large set of indicators to operationalize
these institutional factors.
Fiscal decentralization is measured by both the sub-national share of total government
spending and by the sub-national share of total government revenues. The extent of a
sub-national authority’s autonomy, in taxation and in the spending of public funds, are
important aspects of fiscal decentralization. The simple ratios between sub-national taxes
Page 34
32
and total taxes, or between sub-national revenues and total revenues, however, severely
overestimate this autonomy. The central government may set the tax rate, leaving sub-
national authorities as mere tax collectors, without any influence on the allocation of
resources or redistribution. Therefore, we count only those revenues as sub-national
revenues where sub-national governments possess full autonomy to set their own tax rate.
The variable is computed using information of an OECD (2000) study on sub-national
taxing powers. Unfortunately, this information is only available for a small number of
countries.9 With regard to expenditures, no comparable information on expenditure
autonomy is available. However, we do not count transfers to other levels of government
as sub-national expenditures. The data on sub-national expenditure shares are averages
over the years 1994 to 1996 and are from the World Bank (2001), Stein (1999) and
Treisman (2002). The variable for expenditure share varies in the sample from 2.4
percent for Panama to 48.1 percent for Switzerland, and the variable on revenue
decentralization varies from 0 percent for Poland to 35 percent for Switzerland.
Four variables capture the degree to which the judiciary is independent from the other
branches of the government, and the degree to which ordinary people have access to the
judicial system. The first two are based on the perceptions of business executives about
the judicial system in the country in which they operate (Gwartney and Lawson 2004).
The first measures the extent to which a trusted legal framework exists for private
business to challenge the legality of government actions or regulations. The second
measures judicial independence, or the absence of interference by the government or
parties in any disputes. The third is an indicator collected by Djankov et al. (2003). It
Page 35
33
measures substantive and procedural statutory intervention in judicial cases at lower-level
civil trial courts. The fourth variable captures the affordability of a country’s court system
and is based on a survey of small firms (World Bank 2000; 2002).10
The idea, that a system of checks and balances might need time to develop and
consolidate, is captured with a dummy variable for whether the country experienced
uninterrupted democracy from 1950 to 1995 (Treisman 2000).
The general pattern of the results for the institutional variables is that fiscal
decentralization has no effect on bureaucratic rents, or at least none that is statistically
significant, and that judicial constraints and uninterrupted experience of democracy are
related to systematically lower rents of public employees.
[Table 2 about here]
More specifically, the fraction of sub-national expenditure in total government
expenditure seems to have no effect on the rents enjoyed by bureaucrats (table 2, column
I). The effect of sub-national revenue autonomy is quantitatively large (table 2, column
II). However, owing to the small number of countries in the sample, the effect cannot be
estimated with adequate precision. There are two interpretations for the lack of a
statistically significant constraining effect of fiscal decentralization. On the one hand,
there are conflicting theoretical predictions for the effect of decentralization on rent
extraction (as discussed in section 3.3). This fits the mixed empirical evidence on the
effect of decentralization on corruption and might indicate that countervailing effects
cancel each other out. On the other hand, the failure to detect an effect may be due to data
Page 36
34
problems. The quantitatively large effect for sub-national revenue autonomy suggests that
indicators capturing the theoretically essential aspects of fiscal decentralization more
closely may well produce robust results, if available for a larger sample of countries.
Access to an independent and impartial judiciary is an important constraint on rent-
seeking activities by bureaucrats. All results have the expected sign and are, except for
the coefficient for the formalism index of Djankov et al. (2003), statistically significantly
different from zero. Representative of all results, figure 2 shows the scatterplot and the
partial correlation between the relative life satisfaction differentials and impartial courts,
as well as the corresponding 95 percent confidence interval.
[Figure 2 about here]
In order to assess the size of the effects, an increase of the indicators by one standard
deviation is considered. The increment of the relative life satisfaction differentials lies
between around 1.0 percentage point for the affordability index and around 1.5
percentage points for the indices measuring judicial independence and impartiality of
courts. The difference in court impartiality between Venezuela and Denmark translates
into a difference in relative life satisfaction of 5 percentage points. Excluding the Czech
Republic, the relative life satisfaction differentials span over 11 percentage points. Thus,
the estimated effects for judicial constraints are sizeable.
Another sizeable effect is estimated for longstanding experience with democratic
governance. The relative life satisfaction differential is, on average, around 3.5
percentage points smaller in countries with uninterrupted democracy since 1950. This
Page 37
35
supports the hypothesis that checks and balances need time to evolve and are relatively
more important for bureaucratic rents than Olson type sclerosis.
The results for the institutional variables are very similar if estimated with the EB instead
of the ESS data, with two exceptions (see table A7 in the appendix). The result for the
affordability of the legal system vanishes. In contrast, the coefficient for the indicator of
procedural formalism increases, both in size and statistical significance.
4.4 Acquisition of Rents and Perceived Corruption
Can public employees acquire rents through corruption? Measures of perceived
corruption are a widely used proxy for rents in the government sector. However, as
argued in section 3, it is an empirical question whether bureaucrats can acquire rents via
corruption, or whether gains from corruption are either dissipated or compensate for
lower salaries. Our measure of rents allows for the empirical testing of whether higher
corruption is correlated with higher rents.
We measure the pervasiveness of corruption in a country by two variables. The first
variable is an aggregate corruption perception indicator, constructed by Kaufmann, Kraay
and Mastruzzi (2004). This is the most sophisticated corruption index currently available.
It aggregates surveys of perceived corruption across countries, based on the views of
business people, risk analysts, investigative journalists and the general public, by using
an unobserved component model. The focus is on kickbacks in public procurement, the
embezzlement of public funds and the bribery of public officials. The second corruption
indicator specifically captures bureaucratic corruption (Gwartney and Lawson 2004). It is
Page 38
36
based on a survey measuring perceptions of business executives about the frequency of
irregular, additional payments, connected with import and export permits, business
licenses, exchange controls, tax assessments, police protection, or loan applications. The
two indices are highly correlated for our sample (ρ = 95.3).
We find a close positive association between corruption and bureaucratic rents for the
sample considered. Figure 3 visualizes the positive statistical association for the second
indicator.
[Figure 3 about here]
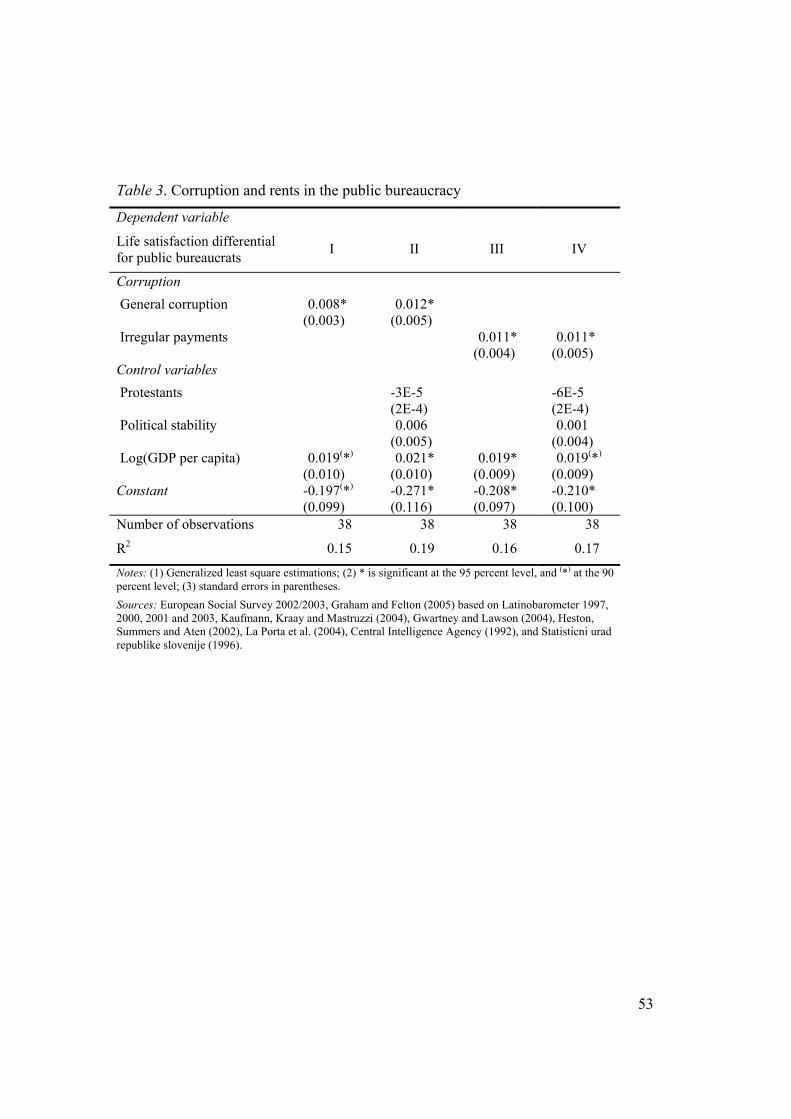
Table 3 presents the complete regression results for both corruption indices. As can be
seen from table 3, columns I and III, the relative life satisfaction differential increases by
0.8 percentage points for every one point increase on the eleven point scale of the index
measuring general corruption, and by 1.1 percentage points for every one point increase
of the index measuring bureaucratic corruption. The magnitude of these coefficients is
sizeable and comparable across the two indices. An increase of one of the corruption
indices by one standard deviation entails an increment in the life satisfaction differential
of 2 percentage points, a magnitude comparable to the difference in the level of rents
between Norway or Sweden on the one hand and Slovenia on the other hand. A similar
thought experiment can be conducted for Paraguay, the country with the highest
corruption level and the second highest life satisfaction differential. If corruption could
be eradicated, bureaucratic rents would practically disappear: the life satisfaction
Page 39
37
differential would lie around -0.5 percent for the index measuring irregular payments to
bureaucrats and around 0.4 percent for the index measuring general corruption.
[Table 3 about here]
Overall, corruption and the level of economic development explain a limited fraction of
bureaucratic rents, amounting to an R2 of 0.15 and 0.16. This leaves sufficient scope for
other factors to contribute to our understanding of rents in the government sector.
The results are very similar for the sample with less European countries, based on the EB.
Columns I and III of table A8 in the appendix show the regression results. The partial
correlations between bureaucratic rents and corruption are marginally stronger for both
corruption indices.
In a robustness analysis, we study whether the results may be driven by a confounding
factor, without corruption having anything to do with bureaucratic rents. As there is no
obvious candidate for such a confounding factor, we include the three most robust
determinants of corruption in the regression. These are the percentage of the population
belonging to the Protestant religion, political stability and, as in all regressions, the level
of economic development (Treisman 2000; Serra 2004).11 Data on religious affiliation
come from La Porta et al. (2004), the Central Intelligence Agency (1992) and the
Slovenian statistical office (1996). The indicator on political stability is borrowed from
Kaufmann, Kraay and Mastruzzi (2004).
Columns II and IV in table 3 depict the results of this robustness test. The positive
relationship between corruption and rents holds, controlling for the most important
Page 40
38
determinants of corruption. In the case of general corruption, the coefficient increases by
50 percent (table 3, columns I and II), and in the case of irregular payments to
bureaucrats, the coefficient is stable (table 3, columns II and IV). The positive
relationship is only slightly less robust for the sample based on the EB data (table A8 in
the appendix, columns II and IV). The magnitude of the coefficients decreases by around
30 percent.
So far, we have interpreted the partial correlation between corruption and bureaucratic
rents as if it would reflect benefits like bribes, contributing to public bureaucrats’ well-
being. However, besides this “literal” interpretation, there are at least two other
interpretations. On the one hand, weak institutional constraints may breed corruption and
simultaneously other forms of bureaucratic rent-seeking, as they facilitate slack. In such a
situation, managers of government bureaus can maintain an oversized staff and a multi-
tiered hierarchy, thus rewarding many employees with leading positions and otherwise
prestigious and pleasant jobs. At the same time, the workload for the individual
bureaucrat is reduced. According to this interpretation, the partial correlation between
corruption and rents would be reduced if it is controlled for alternative forms of
bureaucratic rent seeking (to the extent that these alternative forms are correlated with
corrupt rent-seeking).
Alternatively, it could be explored whether low corruption reflects the use of efficiency
wages. Empirical research has shown that high relative wages are associated with low
levels of corruption in less developed countries (Van Rijckeghem and Weder 2001). In
case efficiency wages are applied and work, larger parts of rents for bureaucrats are due
Page 41
39
to salary premiums in low corruption countries rather than in high corruption countries,
ceteris paribus. When controlling for (relative) income, the partial correlation between
corruption and the relative life satisfaction differential would increase and reveal the total
effect of corruption on rents.
The ESS contains detailed information on respondents’ working hours and official
income. This allows us to address the alternative interpretations. Table 4, columns I and
III, repeat the basic regressions of the relative life satisfaction differentials on corruption
for the sample of 21 European countries covered by the ESS. Columns II and IV show
the regression results for relative life satisfaction differentials that are calculated, holding
individual income and working hours constant. The size of the coefficients decreases by
between a fourth and a fifth if income and working hours are controlled for. Hence,
corruption seems to go hand in hand with bureaucratic rent-seeking, in the form of
reduced work time and higher salaries. The results thus provide no evidence for the
efficiency wage hypothesis for our sample of European countries.
[Table 4 about here]
5 Concluding Remarks A new measure is proposed that directly approaches the idea of rents in the public
bureaucracy as a utility premium of government sector workers relative to their private
sector equivalent. The monopoly position of the public bureaucracy in providing public
services and regulations creates various possibilities for bureaucrats to acquire rents.
Those rents can involve wage differentials, monetary and non-monetary fringe benefits,
Page 42
40
bribes etc. As previous approaches had difficulty in measuring the net total of these rents,
we rely on information about people’s reported life satisfaction. This new approach
allows to capture people’s overall evaluation of their situation, and thus to directly
approximate total net rents. In contrast to the approach based on wage differentials, the
approach is not plagued with the necessity of controlling for all job amenities and
disamenities.
In our empirical analysis, we measure, ceteris paribus, the difference in life satisfaction
between people working in the government sector and people working in the private
sector within a country. The result is the average rent created, and not dissipated, in the
public bureaucracy, taking into account country-specific factors, which affect employees
in both sectors alike. We find that the relative advantage of working in the government
sector differs substantially across countries. In accordance with theories on rent-seeking,
we find that the differences in rents can be partly accounted for by country differences in
regulatory policies and differences in institutional constraints. In particular, independent
courts restrict the leeway of public bureaucracy and, as a consequence, government sector
employees experience lower rents on average. Our proxy measure of rents also correlates
with widely used perceived corruption indices. The fact that rents positively correlate
with corruption shows that the benefits acquired through corruption are neither
completely dissipated, nor do they compensate for potentially lower regular salaries in
the government sector.
In our study, we focus on differences in labor market rents between the public and the
private sector, and try to explain the variation across countries. This leaves at least three
Page 43
41
questions open. First, how is the level of well-being in general affected by the creation of
rents in the public bureaucracy? According to political economics, rent-seeking involves
the unproductive use of resources and is distorting relative prices, and is thus reducing
the overall efficiency of an economy. One therefore expects that rents for public
bureaucrats are associated with a lower average level of well-being in a society. Second,
are there beneficiaries of bureaucratic rent-seeing in the private sector? People working in
protected industries are expected to be relatively better off then the rest. Larger rents in
the public bureaucracy might thus co-exist with larger variation of life satisfaction in the
private sector. Third, how are rents, if there are any, distributed within the public
bureaucracy? While it is likely that possibilities to acquire rents differ between the
hierarchical levels within the public bureaucracy, there is also the possibility of
widespread rent sharing. So far, data restrictions prevent us from further study of these
relevant extensions.
Our new methodological approach can be applied to study other forms of rents outside of
the government sector, where market imperfections have to be assessed. For example, it
can be studied to what extent people exposed to environmental disadvantages are
compensated on the housing and labor market. The approach can also be applied to study
groups (e.g. minorities or women) that are potentially discriminated on the labor market.
More generally, our analysis demonstrates that life satisfaction data can be applied to
validate political economics theories in a new way. Recent research in this vein, for
example, successfully contributes to the understanding of partisan models of political
business cycles (Di Tella and MacCulloch 2005). We show that differences in reported
Page 44
42
life satisfaction provide new insights into theories on rent-seeking in the public
bureaucracy. Public bureaucrats are not only benevolent, but acquire rents if the
restrictions are loose. Those rents are not completely dissipated and lead public
bureaucrats to be more satisfied with their life in general than people working in the
private sector.
Page 45
43
NOTES
1 The approach also allows us to capture any disutility from working in the public bureaucracy. For
example, social status associated with being a bureaucrat may be positive or negative. Similarly, corrupt
bureaucrats may get some negative utility from acting illegally. Or, working in a hierarchy might reduce
people’s job satisfaction and consequently their life satisfaction (Frey and Benz 2004).
2 Rents are, of course, also possible in the private sector. This is, e.g., in industries with monopoly power,
or professions where large entry barriers exist like the liberal professions. These rents affect the distribution
of subjective well-being within the private sector. Overall, they are expected to reduce the level of welfare.
The arguments for within a sector are thus the same as for the distribution between government and private
sector employment.
3 If efficiency wages are paid in order to prevent misuse of bureaucratic leeway, the prediction of the
previous section regarding the relationship between institutional constraints and rents in the public sector
remains unchanged: The weaker the institutional constraints, the higher are rents either through reduced
work effort, corruption etc. or through higher (efficiency) salaries. It is, however, questionable whether,
under weak institutional conditions, “optimal” efficiency wages are introduced.
4 Hungary is a further country covered by the European Social Survey. Hungary cannot be included in our
analysis because information on respondents’ industry is missing.
5 Originally, there are 42,093 observations in the ESS with non-missing values for life satisfaction. Of
these, 21,518 observations are excluded because the respondent was neither employed nor self-employed in
the week preceding the interview or because his/her main income source is neither wage nor income from
self-employment. Furthermore, 1,287 observations are excluded because it is not known in which industry
the respondent works, leaving a total of 19,288 observations.
6 Five countries, the Czech Republic, Paraguay, Austria, Argentina and Panama, exhibit positive relative
differentials, and two countries, Costa Rica and Finland, exhibit negative relative differentials that are
different from zero in a statistically significant way. The estimates that cannot statistically significantly be
Page 46
44
differentiated from zero encompass three groups: First, countries with a positive life satisfaction differential
that is measured imprecisely, such as in Poland, Greece, Germany and Peru; second, countries with a
negative life satisfaction differential that is measured imprecisely, such as in Switzerland, France and
Israel; third, countries with no life satisfaction differential at all, such as Italy, Sweden, Honduras and
Norway.
7 This variable is missing for Costa Rica, El Salvador, Guatemala, Honduras, Luxembourg, Nicaragua and
Paraguay.
8 Countries are given a minimum value of 0 if no price controls or marketing boards are present, a value of
2 if price controls are limited to industries with economies of scale, a value of 4 if price controls are applied
in a few other industries, such as agriculture, and still higher ratings the more frequent price controls are, up
to a maximum value of 10 for the widespread use of price controls throughout various sectors of the
economy.
9 The variable on the revenues of sub-national governments, where they possess full autonomy to set the
tax rate as a share of total revenues, can be computed for Austria, Belgium, the Czech Republic, Denmark,
Finland, Germany, Hungary, Mexico, the Netherlands, Norway, Poland, Portugal, Spain, Sweden,
Switzerland and the United Kingdom. The variable on the sub-national share of total government spending
is available for all countries in the sample, except for Greece.
10 This variable is missing for Austria, Belgium, Denmark, Finland, Greece, Ireland, Israel, Luxembourg,
the Netherlands, Nicaragua, Norway, Paraguay and Switzerland. The formalism index is missing for
Nicaragua.
11 British colonial heritage, and a long and uninterrupted experience of democracy, are further robust
determinants of corruption (Treisman 2000; Serra 2004). However, given our sample of European and
Latin American countries, the former variable has little meaning and would equal a dummy for Ireland,
Israel and the United Kingdom. The latter variable is used as a key explanatory variable.
Page 47
45
REFERENCES Acemoglu, Daron and Thierry Verdier (2000). The Choice between Market Failures and Corruption.
American Economic Review 90(1): 194-211.
Ades, Alberto and Rafael Di Tella (1999). Rents, Competition, and Corruption. American Economic
Review 89(4): 982-993.
Becker, Gary S. and George J. Stigler (1974). Law Enforcement, Malfeasance, and the Compensation of
Enforcers. Journal of Legal Studies 3(1): 1-18.
Besley, Timothy and Maitreesh Ghatak (2005). Competition and Incentives with Motivated Agents.
American Economic Review 95(3): 616-636.
Blanchflower, David G. and Andrew J. Oswald (1999). Well-Being, Insecurity and the Decline of
American Job Satisfaction. Mimeo, Dartmouth College.
Brennan, Geoffrey and James M. Buchanan (1980). The Power to Tax. Cambridge, New York and
Melbourne: Cambridge University Press.
Breton, Albert and Ronald Wintrobe (1982). The Logic of Bureaucratic Conduct. Cambridge, New York
and Melbourne: Cambridge University Press.
Buchanan, James M. (1980). Rent Seeking and Profit Seeking. In: James M. Buchanan, Robert M. Tollison
and Gordon Tullock (eds). Toward a Theory of the Rent-Seeking Society. Texas: Texas A & M
University Press.
Central Intelligence Agency (1992). The World Factbook 1992. Washington, D.C.: Central Intelligence
Agency.
Clark, Andrew E. (2003). Looking for Rents Using Subjective Labour Market Data. Mimeo, Paris: École
Normale Supérieure.
Clark, Andrew E. and Claudia Senik (2004). The (Unexpected) Structure of “Rents” on the French and
British Labour Markets. DELTA Working Papers No. 2004-01, Paris, F: École Normale Supérieure.
De Soto, Hernando (1990). The Other Path. New York, NY: Harper and Row.
Page 48
46
Di Tella, Rafael and Robert J. MacCulloch (2005). Partisan Social Happiness. Review of Economic Studies
72(2): 367-393.
Di Tella, Rafael, Robert J. MacCulloch and Andrew J. Oswald (2001). Preferences over Inflation and
Unemployment: Evidence from Surveys of Happiness. American Economic Review 91(1): 335-341.
Diener, Ed (2000). Positivity and the Construction of Life Satisfaction Judgments: Global Happiness Is Not
the Sum of Its Parts. Journal of Happiness Studies 1(2): 159-176.
Diener, Ed and William Tov (2005). Culture and Subjective Well-Being. In: Shinobu Kitayama and Dov
Cohen (eds). Handbook of Cultural Psychology. New York: Guilford: , forthcoming.
Dixit, Avinash (2002). Incentives and Organizations in the Public Sector: An Interpretative Review.
Journal of Human Resources 37(4): 696-727.
Djankov, Simeon, Rafael La Porta, Florencio Lopez-de-Silanes and Andrei Shleifer (2002). The Regulation
of Entry. Quarterly Journal of Economics 117(1): 1-37.
Djankov, Simeon, Rafael La Porta, Florencio Lopez-de-Silanes and Andrei Shleifer (2003). Courts.
Quarterly Journal of Economics 118(2): 453-517.
Ferrer-i-Carbonell, Ada and Paul Frijters (2004). How Important Is Methodology for the Estimates of the
Determinants of Happiness? Economic Journal 114(497): 641-659.
Fisman, Raymond and Roberta Gatti (2002). Decentralization and Corruption: Evidence across Countries.
Journal of Public Economics 83(3): 325-345.
Frey, Bruno S. (1997). Not Just for the Money: An Economic Theory of Personal Motivation. Cheltenham,
U.K.: Edward Elgar.
Frey, Bruno S. (2005). Knight Fever. Towards an Economics of Awards. CESifo Working Paper No. 1468,
Munich: CESifo.
Frey, Bruno S., Christine Benesch and Alois Stutzer (2005). Does Watching TV Make Us Happy? IEW
Working Paper No. 241, University of Zurich.
Page 49
47
Frey, Bruno S. and Matthias Benz (2004). Being Independent Raises Happiness at Work. Swedish
Economic Policy Review 11(2): 95-134.
Frey, Bruno S. and Alois Stutzer (2002a). Happiness and Economics: How the Economy and Institutions
Affect Well-Being. Princeton, NJ: Princeton University Press.
Frey, Bruno S. and Alois Stutzer (2002b). What Can Economists Learn from Happiness Research? Journal
of Economic Literature 40(2): 402-35.
Graham, Carol and Andy Felton (2005). Life Satisfaction in 17 Latin American Countries. Mimeo, The
Brookings Institution.
Graham, Carol and Stefano Pettinato (2002). Happiness and Hardship. Opportunity and Insecurity in New
Market Economies. Washington, D.C.: The Brookings Institutions Press.
Gregory, Robert G. and Jeff Borland (1999). Recent Developments in Public Sector Labor Markets. In:
Orley Ashenfelter and David Card (eds). Handbook of Labor Economics, vol. 3C. Amsterdam: Elsevier:
3573-3630.
Gwartney, James D. and Robert A. Lawson (2004). Economic Freedom of the World: 2004 Annual Report.
Vancouver: The Fraser Institute.
Hanssen, F. Andrew (2000). Independent Courts and Administrative Agencies: An Empirical Analysis of
the States. Journal of Law, Economics, and Organization 16(2): 534-571.
Hayek, Friedrich A. von (1960). The Constitution of Liberty. Chicago, IL: University of Chicago Press.
Heston, Alan, Robert Summers and Bettina Aten (2002). Penn Word Table 6.1. Mimeo, Center for
International Comparisons, University of Pennsylvania.
Heywood, John S. and Madhu S. Mohanty (1995). Estimation of the US Federal Job Queue in Presence of
an Endogenous Union Queue. Economica 62(248): 479-493.
Heywood, John S., W. Stanley Siebert and Xiangdong Wei (2002). Worker Sorting and Job Satisfaction:
The Case of Union and Government Jobs. Industrial & Labor Relations Review 55(4): 595-609.
Page 50
48
Huntington, Samuel P. (1968). Political Order in Changing Societies. New Heaven, CT: Yale University
Press.
Kahneman, Daniel (1999). Objective Happiness. In: Daniel Kahneman, Ed Diener and Norbert Schwarz
(eds). Well Being: The Foundations of Hedonic Psychology. New York, NY: Russell Sage Foundation:
3-25.
Kaufmann, Daniel, Aart Kraay and Massimo Mastruzzi (2004). Governance Matters III: Governance
Indicators for 1996-2002. Mimeo, The World Bank.
Krueger, Alan B. (1988). The Determinants of Queues for Federal Jobs. Industrial and Labor Relations
Review 41(4): 567-581.
Krueger, Anne O. (1974). The Political Economy of the Rent-Seeking Society. American Economic Review
64(3): 291-303.
La Porta, Rafael, Florencio Lopez-de-Silanes, Christian Pop-Eleches and Andrei Shleifer (2004). Judicial
Checks and Balances. Journal of Political Economy 112(2): 445-470.
Lalive, Rafael (2002). Do Wages Compensate for Workplace Amenities? Mimeo, University of Zurich.
Landes, William M. and Richard A. Posner (1975). The Independent Judiciary in an Interest-Group
Perspective. Journal of Law and Economics 18(3): 875-901.
McChesney, Fred S. (1987). Rent Extraction and Rent Creation in the Economic Theory of Regulation.
Journal of Legal Studies 16(1): 101-118.
McCubbins, Mathew D., Roger G. Noll and Barry R. Weingast (1987). Administrative Procedures as
Instruments of Political Control. Journal of Law, Economics, and Organization 3(2): 243-277.
Migué, Jean-Luc and Gerard Bélanger (1974). Toward a General Theory of Managerial Discretion. Public
Choice 17: 27-47.
Miller, Garry J. and Terry M. Moe (1983). Bureaucrats, Legislators, and the Size of Government. American
Political Science Review 77(2): 297-322.
Page 51
49
Mueller, Dennis C. (2003). Public Choice III. Cambridge, New York and Melbourne: Cambridge
University Press.
Niskanen, William A., Jr. (1971). Bureaucracy and Representative Government. Chicago, IL: Aldine Press.
Oates, Wallace E. (1999). An Essay on Fiscal Federalism. Journal of Economic Literature 37(3): 1120-49.
OECD (2000). Taxing Powers of State and Local Government. OECD Tax Policy Studies Series No. 1,
Organisation for Economic Co-operation and Development.
Olson, Mancur Jr. (1982). The Rise and Decline of Nations: Economic Growth Stagflation and Social
Rigidities. New Haven: Yale University Press.
Persson, Torsten and Guido Tabellini (2003). The Economic Effects of Constitutions: What Do the Data
Say? Cambridge, Mass.: MIT Press.
Persson, Torsten, Guido Tabellini and Francesco Trebbi (2003). Electoral Rules and Corruption. Journal of
the European Economic Association 1(4): 958-989.
Prendergast, Canice (1999). The Provision of Incentives in Firms. Journal of Economic Literature 37(1): 7-
63.
Rose-Ackerman, Susan (1978). Corruption: A Study of Political Economy. New York: Academic Press.
Serra, Danila (2004). Empirical Determinants of Corruption: A Sensitivity Analysis. Mimeo, University of
Oxford.
Shleifer, Andrei and Robert W. Vishny (1993). Corruption. Quarterly Journal of Economics 108(3): 599-
617.
Shleifer, Andrei and Robert W. Vishny (1998). The Grabbing Hand: Government Pathologies and Their
Cures. Cambridge, MA: Harvard University Press.
Statisticni urad republike slovenije (1996). Statistical Yearbook of the Republic of Slovenia 1996.
Ljubljana, SI: Statisticni urad republike slovenije.
Stein, Ernesto (1999). Fiscal Decentralization and Government Size in Latin America. Journal of Applied
Economics 2(2): 357-391.
Page 52
50
Stigler, George J. (1971). The Theory of Economic Regulation. Bell Journal of Economics 2(1): 3-21.
Treisman, Daniel (2000). The Causes of Corruption: A Cross-National Study. Journal of Public Economics
76(3): 399-457.
Treisman, Daniel (2002). Defining and Measuring Decentralization: A Global Perspective. Mimeo,
Department of Political Science, University of California.
Tullock, Gordon (1967). Welfare Costs of Tariffs, Monopolies, and Theft. Western Economic Journal 5(3):
224-232.
Tullock, Gordon (1993). Rent Seeking. Aldershot, UK: Edward Elgar.
Van Rijckeghem, Caroline and Beatrice Weder (2001). Bureaucratic Corruption and the Rate of
Temptation: Do Wages in the Civil Service Affect Corruption, and by How Much? Journal of
Development Economics 65(2): 307-331.
Weingast, Barry R. (1995). The Economic Role of Political Institutions: Market-Preserving Federalism and
Economic Development. Journal of Law, Economics, and Organization 11(1): 1-31.
Weingast, Barry R. and Mark J. Moran (1983). Bureaucratic Discretion or Congressional Control?
Regulatory Policymaking by the Federal Trade Commission. Journal of Political Economy 91(5): 765-
800.
World Bank (2000). World Business Environment Survey. Washington, D.C.: The World Bank.
World Bank (2001). Decentralization and Subnational Regional Economics: Fiscal Indicators. Data
donwloaded at: http://www1.worldbank.org/publicsector/decentralization/data.htm.
World Bank (2002). World Business Environment Survey. Washington, D.C.: The World Bank.
Page 53
51
Table 1. Competition and rents in the public bureaucracy
Dependent variable
Life satisfaction differential for public bureaucrats I II III IV V VI
Internal competition Total cost of market entry 8E-5
(0.010)
Ease of starting business -0.008(*) (0.004)
Administrative obstacles 0.011(*) (0.006)
Price controls 0.007* (0.003)
External competition Tariffs and taxes on inter- national trade
0.009 (0.006)
Regulatory trade barriers 0.010(*) (0.005)
Control variable Log(GDP per capita) -0.006
(0.007) 0.008
(0.007) 0.005
(0.006) 0.002
(0.004) 0.003
(0.006) 0.014
(0.010) Constant 0.064
(0.068) -0.034 (0.052)
-0.109 (0.080)
-0.036 (0.045)
-0.039 (0.058)
-0.151 (0.103)
Number of observations 31 38 38 38 38 38
R2 0.04 0.09 0.10 0.17 0.07 0.09
Notes: (1) Generalized least square estimations; (2) * is significant at the 95 percent level, and (*) at the 90 percent level; (3) standard errors in parentheses. Sources: European Social Survey 2002/2003, Graham and Felton (2005) based on Latinobarometer 1997, 2000, 2001 and 2003, Gwartney and Lawson (2004) and Djankov et al. (2002).
Page 54
52
Table 2. Institutions and rents in the public bureaucracy
Dependent variable
Life satisfaction differential for public bureaucrats I II III IV V VI VII
Fiscal federalism Expenditure share of sub-
national levels 2E-4
(4E-4)
Revenue share (rate autonomy)
-0.066 (0.052)
Judiciary
Impartial courts -0.007* (0.003)
Judicial independence -0.005(*) (0.003)
Procedural formalism 0.005 (0.006)
Affordability of legal system -0.012** (0.004)
Uninterrupted democracy -0.034** (0.012)
Control variable Log(GDP per capita) -0.004
(0.005) 0.008
(0.015) 0.015
(0.009) 0.013
(0.009) 0.003
(0.008) 0.002
(0.006) 0.014
(0.007) Constant 0.035
(0.046) -0.071 (0.150)
-0.098 (0.069)
-0.091 (0.072)
-0.044 (0.091)
0.045 (0.065)
-0.107 (0.058)
Number of observations 37 15 38 38 37 25 38
R2 0.02 0.12 0.12 0.10 0.02 0.29 0.20
Notes: (1) Generalized least square estimations; (2) ** is significant at the 99 percent level, * at the 95 percent level, and (*) at the 90 percent level; (3) standard errors in parentheses. Sources: European Social Survey 2002/2003, Graham and Felton (2005) based on Latinobarometer 1997, 2000, 2001 and 2003, World Bank (2000; 2001; 2002), Stein (1999), Treisman (2000; 2002), OECD (2000), Gwartney and Lawson (2004), and Djankov et al. (2003).
Page 55
53
Table 3. Corruption and rents in the public bureaucracy
Dependent variable
Life satisfaction differential for public bureaucrats I II III IV
Corruption General corruption 0.008*
(0.003) 0.012*
(0.005)
Irregular payments 0.011* (0.004)
0.011* (0.005)
Control variables Protestants -3E-5
(2E-4) -6E-5
(2E-4) Political stability 0.006
(0.005) 0.001
(0.004) Log(GDP per capita) 0.019(*)
(0.010) 0.021*
(0.010) 0.019*
(0.009) 0.019(*)
(0.009) Constant -0.197(*)
(0.099) -0.271* (0.116)
-0.208* (0.097)
-0.210* (0.100)
Number of observations 38 38 38 38
R2 0.15 0.19 0.16 0.17
Notes: (1) Generalized least square estimations; (2) * is significant at the 95 percent level, and (*) at the 90 percent level; (3) standard errors in parentheses. Sources: European Social Survey 2002/2003, Graham and Felton (2005) based on Latinobarometer 1997, 2000, 2001 and 2003, Kaufmann, Kraay and Mastruzzi (2004), Gwartney and Lawson (2004), Heston, Summers and Aten (2002), La Porta et al. (2004), Central Intelligence Agency (1992), and Statisticni urad republike slovenije (1996).
Page 56
54
Table 4. Corruption and rents in the public bureaucracy: the role of personal income and working time
Dependent variable Life satisfaction differentials for public bureaucrats
I Excl. channels
II Incl. income and working hours
III Excl. channels
IV Incl. income and working hours
Corruption General corruption 0.010
(0.007) 0.008
(0.007)
Irregular payments 0.017* (0.007)
0.012 (0.008)
Control variable Log(GDP per capita) -0.010
(0.032) -0.021 (0.034)
-0.001 (0.029)
-0.014 (0.033)
Constant 0.010 (0.330)
0.207 (0.347)
-0.012 (0.306)
0.126 (0.339)
Number of observations 21 21 21 21
R2 0.21 0.18 0.30 0.22
Notes: (1) Generalized least square estimations; (2) * is significant at the 95 percent level; (3) standard errors in parentheses; (4) the dependent variable is the relative life satisfaction differential between public and private sector workers in columns I and III, and between public and private sector workers with identical household income and working hours in columns II and IV. Source: European Social Survey 2002/2003, Kaufmann, Kraay and Mastruzzi (2004), Gwartney and Lawson (2004).
Page 57
55
Figure 1. Relative life satisfaction differentials for Europe and Latin America
Notes: This graph plots estimates for the relative life satisfaction differentials and the corresponding 90 percent confidenceinterval. The relative life satisfaction differentials are computed by dividing the coefficients for government sector employmentby the coefficient for the intercept estimated in micro-econometric life satisfaction functions for the 38 countries. The standarderrors of the relative differentials are computed using the delta method.Sources: European Social Survey 2002/2003, and Graham and Felton (2005) based on Latinobarometer 1997, 2000, 2001 and2003.
-0.15
-0.10
-0.05
0.00
0.05
0.10
0.15
0.20
0.25
CZ PY PL GR AT DE AR PA PE BR UY SI BE BO NIDK GB NL VE EC ES IT SE HN NO MX PT GT SV LU CL CO IE CH FI FR IL CR
Page 58
56
Figure 2. Independent judiciary and rents in the public bureaucracy
ARAT
BE
BOBR
CLCO
CR
CZ
DK
EC
SV
FIFR
DE
GR
GT
HN
IE
IL
IT
LU
MXNL
NI
NO
PA
PY
PE
PL
PT
SI
ESSE
CH
GB
UY
VE
2 4 6 8 10Impartial courts
Notes: (1) Generalized least square estimation; (2) shaded area is 95 percent confidence interval; (3) life satisfaction differentials are corrected for log(GDP per capita) and the constant. Sources: European Social Survey 2002/2003, Graham and Felton (2005) based on Latino-barometer 1997, 2000, 2001 and 2003, Heston, Summers and Aten (2002) and Gwartney and Lawson (2004).
Page 59
57
Figure 3. Corruption and rents in the public bureaucracy
ARAT
BE
BO
BR
CL
CO
CR
CZ
DK
EC
SV
FI FR
DE
GR
GT
HN
IE
IL
IT
LU
MXNL
NI
NO
PA
PY
PE
PL
PT
SI
ESSE
CH
GB
UYVE
0 2 4 6Irregular payments to bureaucrats
Notes: (1) Generalized least square estimation; (2) shaded area is 95 percent confidence interval; (3) life satisfaction differentials are corrected for log(GDP per capita) and the constant. Sources: European Social Survey 2002/2003, Graham and Felton (2005) based on Latinobarometer 1997, 2000, 2001 and 2003, Heston, Summers and Aten (2002) and Gwartney and Lawson (2004).
Page 60
58
Table A1. Estimations incl. control variable for Europe as a whole; part 1 Dependent variable Life satisfaction Coefficient Robust st. error
Public bureaucracy Public bureaucracy 0.109 0.097 Individual characteristics Male Reference group Female 0.190** 0.050 Age -0.081** 0.014 Age2 0.001** 2E-4 Married; with partner 0.470** 0.078 Married; without partner -0.380 0.342 Separated; with partner 0.242 0.338 Separated; without partner -0.468* 0.206 Divorced; with partner 0.491** 0.183 Divorced; without partner -0.353* 0.138 Widowed; with partner 0.518 0.720 Widowed; without partner -0.820* 0.329 Single; with partner 0.539** 0.091 Single; without partner Reference group Sq. root of household size -0.033 0.070 Not completed primary ed. Reference group Primary education -0.220 0.292 Lower secondary ed. 0.414 0.275 Upper secondary ed. 0.608* 0.272 Post sec., non-tertiary ed. 0.670 0.284 Tertiary ed., 1st stage 0.882** 0.274 Tertiary ed., 2nd stage 0.715* 0.284
Table to be continued.
Page 61
59
Table A1. Estimations incl. control variable for Europe as a whole; part 2 Citizen 0.127 0.176
Foreigner Reference group
Living in a big city -0.711** 0.129
Living in suburbs -0.331** 0.129
Living in a small town -0.458** 0.121
Living in a village -0.264* 0.120
Living in the countryside Reference group
Constant
Constant 7.041** 0.025
Number of observations 19,288
Number of public bureaucrats 1,356
R2 0.05
Notes: (1) Least squares estimation (incl. intra- and inter-country weights); all control variables are transformed into mean deviation form such that the coefficient of the constant term can be interpreted as the life satisfaction of the average individual, if he/she were to work in the private sector; (2) ** is significant at the 99 percent level, * at the 95 percent level, and (*) at the 90 percent level; (3) results are not shown for dummies, indicating that sex, age, marital status, household size, education, citizenship status, and community type are not available, as well as for a dummy indicating that a subject belongs to the highest income class. Source: European Social Survey 2002/2003.
Page 62
60
Table A2. Estimations incl. control variable for Europe as a whole
Dependent variable
Life satisfaction Coefficient Robust st. error
Public bureaucracy Public bureaucracy 0.045** 0.008
Individual characteristics Male Reference group
Female 0.021** 0.008
Age -0.014** 0.002
Age2 2E-4** 2E-5
Married 0.089** 0.011
Living together 0.010 0.019
Separated -0.275** 0.043
Divorced -0.161** 0.023
Widowed -0.097** 0.033
Single Reference group
Education, up to 15 years Reference group
Education, 16-19 years 0.043** 0.010
Education, 20 years and more 0.127** 0.011
In education 0.072 0.049
Living in a big city -0.087** 0.010
Living in a small town -0.036** 0.009
Living in the countryside Reference group
Constant Constant 2.670** 0.005
Number of observations 64,470 Number of public bureaucrats
22,520
R2 0.03 Notes: (1) Least squares estimation (incl. inter-country weights); all control variables are transformed into mean deviation form such that the coefficient of the constant term can be interpreted as the life satisfaction of the average individual, if he/she were to work in the private sector; (2) ** is significant at the 99 percent level; (3) results are not shown for dummies, indicating that sex, age, marital status, education, and community type are not available, as well as for a dummy indicating that a subject belongs to the highest income class. Source: Euro-Barometer Survey Series, 1989-1994.
Page 63
61
Table A3. Estimations incl. control variable for Latin America as a whole
Dependent variable
Life satisfaction Coefficient Robust st. error
Public bureaucracy Public bureaucracy 0.048** 0.013
Individual characteristics Male Reference group
Female -0.039** 0.010
Age -0.014** 0.002
Age2 2E-4** 2E-5
Married -0.010 0.012
Divorced -0.077** 0.019
Single Reference group
Illiterate -0.026 0.024
Not completed primary ed. Reference group
Primary education 0.018 0.018
Not completed secondary ed. -0.002 0.017
Completed secondary ed. -0.028(*) 0.017
Not completed university -0.009 0.021
Completed university 0.062** 0.019
Living in the capital -0.157** 0.013
Living in a big city -0.182** 0.014
Living in a small town/village Reference group
Constant Constant 2.670** 0.005
Number of observations 40,539 Number of public bureaucrats
6,587
R2 0.05 Notes: (1) Ordinary least squares estimation; all control variables are transformed into mean deviation form such that the coefficient of the constant term can be interpreted as the life satisfaction of the average individual, if he/she were to work in the private sector; (2) ** is significant at the 99 percent level, and (*) at the 90 percent level; (3) results are not shown for dummies, indicating that sex, age, marital status, education, and community type are not available, as well as for a dummy indicating that a subject belongs to the highest income class. Source: Graham and Felton (2005) based on Latinobarometer 1997, 2000, 2001 and 2003.
Page 64
62
Table A4. Descriptive statistics
Variable
Number of observations
Mean Standard deviation
Min. Max.
Corruption
General corruption a 38 3.43 2.34 0.02 7.14
Irregular payments b 38 3.29 1.74 0.50 6.50
Competition
Total cost of market entry c 31 0.46 0.52 0.03 3.01
Ease of starting business b 38 5.08 1.40 2.50 8.10
Administrative obstacles b 38 5.77 0.81 3.40 7.10
Price controls b 38 3.72 1.43 0.70 7.00
Tariffs and taxes on international trade b 38 1.53 0.76 0.10 3.10
Regulatory trade barriers b 38 2.54 1.49 0.50 5.20
Institutions
Expenditure share of sub-national levels d, e, f 37 21.07 12.65 2.40 48.10
Revenue share (rate autonomy) g 15 0.11 0.13 0.00 0.35
Impartial courts b 38 5.41 2.79 0.80 9.30
Judicial independence b 38 5.57 2.33 1.70 8.90
Procedural formalism h 37 4.17 0.97 2.40 5.91
Affordability of legal system d 25 4.61 0.90 3.15 6.42
Uninterrupted democracy f 38 0.42 0.50 0.00 1.00 Source: a Kaufmann, Kraay and Mastruzzi (2004), b Gwartney and Lawson (2004), c Djankov et al. (2002), d World Bank (2000; 2001; 2002), e Stein (1999), f Treisman (2000; 2002), g OECD (2000) and h Djankov et al. (2003).
Page 65
63
Table A5. Correlation matrix
Life satisf. differential
General corruption
Irregular payments
Total cost of market entry
Ease of starting b.
Admin. obstacles
Price controls
Taxes on intern. trade
Reg. trade barriers
Life satisfaction differential 1.00 General corruption 0.37 1.00 Irregular payments 0.60 0.93 1.00 Total cost of market entry -0.08 0.81 0.67 1.00 Ease of starting business -0.14 -0.85 -0.74 -0.94 1.00 Administrative obstacles 0.14 0.93 0.81 0.93 -0.94 1.00 Price controls 0.34 0.67 0.77 0.55 -0.43 0.55 1.00 Taxes on international trade 0.35 0.93 0.87 0.66 -0.67 0.85 0.65 1.00 Regulatory trade barriers 0.40 0.94 0.92 0.71 -0.69 0.85 0.78 0.97 1.00 Exp. share of subnat. levels -0.11 -0.29 -0.41 -0.11 0.12 -0.15 -0.52 -0.21 -0.25 Revenue share (rate autonomy) -0.36 -0.59 -0.59 -0.50 0.47 -0.48 -0.72 -0.42 -0.51 Impartial courts -0.40 -0.91 -0.94 -0.74 0.82 -0.83 -0.68 -0.80 -0.84 Judicial independence -0.23 -0.92 -0.85 -0.80 0.79 -0.86 -0.63 -0.88 -0.90 Procedural formalism -0.07 0.59 0.54 0.89 -0.84 0.72 0.45 0.40 0.50 Affordability of legal system -0.17 0.24 0.08 0.24 -0.41 0.32 -0.47 0.17 0.02 Uninterrupted democracy -0.23 -0.77 -0.81 -0.78 0.80 -0.73 -0.69 -0.58 -0.67 Log(GDP per capita) -0.21 -0.95 -0.89 -0.81 0.77 -0.91 -0.77 -0.94 -0.96
Exp. share of subnat. levels
Rev. share (rate auton.)
Impartial courts
Judicial inde-pendence
Procedural formalism
Affordability of legal syst.
Uninterrupt-ed democr.
Log(GDP per capita)
Exp. Share of subnat. levels 1.00 Revenue share (rate autonomy) 0.38 1.00 Impartial courts 0.50 0.47 1.00 Judicial independence 0.21 0.37 0.90 1.00 Procedural formalism -0.03 -0.29 -0.67 -0.71 1.00 Affordability of legal system 0.02 0.37 -0.30 -0.31 0.22 1.00 Uninterrupted democracy 0.55 0.52 0.93 0.81 -0.81 -0.21 1.00 Log(GDP per capita) 0.38 0.51 0.88 0.91 -0.60 -0.12 0.77 1.00
Page 66
64
Table A6. Competition and rents in the public bureaucracy (based on Euro-Barometer)
Dependent variable
Life satisfaction differential for public bureaucrats I II III IV V VI
Internal competition Total cost of market entry 0.016
(0.013)
Ease of starting business -0.006* (0.003)
Administrative obstacles 0.010(*) (0.006)
Price controls 0.005 (0.003)
External competition Taxes on international trade -0.002
(0.006)
Regulatory trade barriers 0.007 (0.005)
Control variable Log(GDP per capita) -0.001
(0.008) 0.009
(0.006) 0.005
(0.005) 0.002
(0.005) -0.001 (0.006)
0.012 (0.009)
Constant 0.012 (0.086)
-0.043 (0.050)
-0.096 (0.074)
-0.029 (0.052)
0.021 (0.062)
-0.116 (0.097)
Number of observations 23 30 30 30 30 30
R2 0.04 0.09 0.10 0.17 0.07 0.09
Notes: (1) Generalized least square estimations; (2) ** is significant at the 99 percent level, * at the 95 percent level, and (*) at the 90 percent level; (3) standard errors in parentheses. Sources: Euro-Barometer Survey Series, 1989-1994, Graham and Felton (2005) based on Latinobarometer 1997, 2000, 2001 and 2003, Kaufmann, Kraay and Mastruzzi (2004), Heston, Summers and Aten (2002) and Gwartney and Lawson (2004).
Page 67
65
Table A7. Institutions and rents in the public bureaucracy (based on Euro-Barometer)
Dependent variable
Life satisfaction differential for public bureaucrats I II III IV V VI VII
Fiscal federalism Expenditure share of sub-
national levels -4E-4 (4E-4)
Revenue share (rate autonomy)
-0.036 (0.029)
Judiciary
Impartial courts -0.008** (0.002)
Judicial independence -0.006** (0.002)
Procedural formalism 0.011* (0.004)
Affordability of legal system -5E-4 (0.005)
Uninterrupted democracy -0.029** (0.009)
Control variable Log(GDP per capita) 0.004
(0.005) -0.016 (0.017)
0.022** (0.007)
0.018* (0.007)
0.012(*) (0.006)
0.009 (0.006)
0.016* (0.006)
Constant -0.020 (0.045)
0.177 (0.168)
-0.147* (0.055)
-0.125* (0.056)
-0.151 (0.076)
-0.068 (0.071)
-0.124* (0.058)
Number of observations 29 9 30 30 29 21 21
R2 0.12 0.20 0.36 0.29 0.20 0.15 0.26
Notes: (1) Generalized least square estimations; (2) ** is significant at the 99 percent level, * at the 95 percent level, and (*) at the 90 percent level; (3) standard errors in parentheses. Sources: Euro-Barometer Survey Series, 1989-1994, Graham and Felton (2005) based on Latinobarometer 1997, 2000, 2001 and 2003, World Bank (2000; 2001; 2002), Stein (1999), Treisman (2000; 2002), OECD (2000), Gwartney and Lawson (2004) and Djankov et al. (2003).
Page 68
66
Table A8. Corruption and rents in the public bureaucracy (based on Euro-Barometer)
Dependent variable
Life satisfaction differential for public bureaucrats I II III IV
Corruption General corruption 0.009**
(0.003) 0.006
(0.004)
Irregular payments 0.013** (0.003)
0.009* (0.004)
Control variables Protestants -2E-4*
(8E-5) -1E-4
(1E-4) Political stability 0.003
(0.004) 0.001
(0.004) Log(GDP per capita) 0.025**
(0.008) 0.017(*)
(0.008) 0.025**
(0.007) 0.019*
(0.008) Constant -0.252**
(0.088) -0.184(*) (0.091)
-0.262** (0.074)
-0.198* (0.080)
Number of observations 30 30 30 30
R2 0.41 0.49 0.45 0.51
Notes: (1) Generalized least square estimations; (2) ** is significant at the 99 percent level, * at the 95 percent level, and (*) at the 90 percent level; (3) standard errors in parentheses. Sources: Euro-Barometer Survey Series, 1989-1994, Graham and Felton (2005) based on Latinobarometer 1997, 2000, 2001 and 2003, Kaufmann, Kraay and Mastruzzi (2004), Gwartney and Lawson (2004), Heston, Summers and Aten (2002), La Porta et al. (2004), Central Intelligence Agency (1992) and Statisticni urad republike slovenije (1996).