Burning California Chaparral - An Exploratory Study of Some Common Shrubs and Their Combustion Characteristics
David R. Weisel, Darold E. Ward2, Timothy E. Paysen1, and Andrea L. Kooncel
lForester, Research Forester, and Supervisory Research Forester, V.SD.A. Forest Service , Pacific Southwest Forest and Range Experiment Station, Forest Fire Laboratory, 4955 Canyon Crest Dr., Riverside, California 92507, V.S.A.
Tel. 714 2766568, Fax 714 2766426 2Supervisory Research Chemist, V.S.D .A. Forest Service, Intermountain Forest and Range Experiment Station, Fire
Abstract. Prescribed fire is a tool used to manage vegetation in southern California. The nature and quantity of gaseous and particulate emissions have not been described for California chaparral. A study examining carbon monoxide (CO), carbon dioxide (C02), and particulate matteremissions from fuel beds constructed from common chaparral shrubs was initiated. Chamise (Adenostoma Jasciculatum), ceanothus (Ceanothus crassifolius), manzanita (Arctostaphylos glandulosa),and scrub oak (Quercus dwnosa) fuel beds were burned in December 1989,and March, May, and August, 1990. Gas and particulate matter samples were collected from 45 flres. Emission factors for CO2 and particulate matter were affected by species and month individually; month and species interacted and affected CO emission factors. Pearson's correlation coefficient and Kendall's tau indicated that emission factors for CO and particulate matter were inversely related to combustion efficiency.
Periodic fire has been a part of the southern California landscape for centuries. The mountain slopes surrounding the Los Angeles basin are covered at lower elevations (below 1600 m) with chaparral vegetation characteristic of Mediterranean climates (philpot 1977). Management of chaparral is practiced to create vegetational mosaics for wildlife and to minimize wildfire severity through fuel hazard reduction. It is essential that fire be maintained in the chaparral ecosystem for the ecological values it can provide. Prescribed fire is an important tool used for vegetation management under favorable weather conditions. Regulations governing releac;e of emissions in the Los Angeles basin's airshcd have become stricter. Knowledge of emissions from all sources including pre
scribed fIre is required. lnfonnation about the effects of species and month on
chaparral smoke emissions is not available presently; however, larger scale field measurements have been made using airborne sampling systems (Einfield et a1. 1989, Hegg et al. 1989) and ground-based tower systems (Ward and Hardy 1989). The airborne and tower systems are not well-suited for evaluating the effects of species and month on the release of smoke emissions. Such infonnation is needed before smoke management guidelines can be developed. The purpose of our study was to detennine whether species and month affect emissions of carbon monoxide (CO), carbon dioxide (C02), and particulate matter (pm). This paper describes results from an exploratory study designed to measure the emissions released from fuel beds constructed from common chaparral species burned during different seasons of the year.
Study Design and Methods
A randomized complete block design was used for this study. Three replications ofexperimental fires in four important chaparral shrub species were burned in December 1989, March, May, and August 1990 (total of 48 fires); however, only 45 fires were completed, resulting in an unbalanced block design. A block initially consisted of one flre per species in a given month (four fires). Chamise (Adenostoma Jasciculatum), ceanothus (Ceanothus crassifolius), manzanita (Arctostaphylos glandulosa), and scrub oak (Quercus dumosa) were selected for use in this study. These species represented a range in leaf character from needlelike in chamise to broad evergreen in manzanita.
Plant material was collected from the same field location for all four months. Each fuel bed was constructed by loosely piling approximately one kilogram (kg) of the selected species into a hemispherical shape (JI We did not attempt to kccp packing ratio or any other fue '1 - I()
Weise, D.R., Ward, D.E., Paysen, T.E. and Koonce, A.L.
Table 1. Moisture content of samples of four common chaparral species by month.
154
Species! 12/89 3i90 Month2
5/90 8/90
Cham Cean Manz Quer
50.8 (2.0) 63.3 (0.3) 76.3 (4.3) 74.4 (0.2)
101.0 (O.Q) 144.5 (1.5) 92.0 (1.0) 75.0 (2.0)
SO.5 (1.5) 88.0 (1.0) 85.0 (2.0)
109.5 (1.5)
60.0 (0.5) 60.0 (0.5) 89.0 (0.0) 620 (0.5)
! Cham = AiknostomtJ !ascicuJatum. CeIn = C~allOthllS criJSsifolillS. Manz = Arctostaphylos glanduJosa. Quer = QuerciLf dumosa. 2 Values are means expressed as a percentage of oven dry weight (standard error).
bed characteristic constant. Branches less than 0.63 cm in diameter with foliage intact were used. Moisture content on an oven-dry weight basis was measured for each species for each montJi (Table 1). A variety of ignition techniques were used: ethyl alcohol, wood excelsior, and propane torch. Any effects due to ignition techniques were confounded with block and season effects.
Experimental fires were burned on a level table (1 m by 2 m) in a ventilated building at the V.S.D.A. Forest Service Fire LabOratory in Riverside, California. An aluminum hood and stack were constructed to channel smoke from each experimental fIre. A high volume air sampler with a low velocity nozzle positioned parallel 10
the smoke column was placed in the stack approximately 1.8 m above the table. The sampler was used to coilect particulate samples from the smoke column. A small pump collected a sample of the combustion gases behind the high volume sampler's glass-fIber fIlter. Air temperature at the nozzle was less than 250°F. This ensured solidification of aerosols. Particulate samples were collected by maintaining a constant pressure drop df 2.54 cm Hg across the fIlter. Sampling began after the ignition material was no longer visibly present. The gas and particle samples were gathered from primarily flarning combustiori with a small compOnent of smoldering combustion thai was not quantifIed. Sampling ceased after the f1amirig phase had ended or the fitter had becdme loaded witH particulate matter. The fire was eXLinguished immediately in order to determine fuei consumption. Sampling times ranged from 0.25 to 2 minutes (Table 2). Gas and particulate samples were shipped to the V.S.D.A. Forest Service, Fire Sciences Laboratory in Missoula, Montana, for weighing and chemical anaiysis.
The 20.3 by 25.4 cm glass-fiber filters were weighed after being conditioned at 40 to 50 percent relative humidity and 72° F for 24 hours. A Mettler overhead beam balance with closed weighing chamber (accuracy of +/- 0.1 mg) was used. The gas sample bags were analyzed for CO and COl by using both a nondispersive infrared technique (Horiba model PIR-2(00) and a gas chromatographic technique that used a catalyzed
methanizer to convert CO and COl t~ equivalent molar quantities of methane before quantification with a hydrogen flame ionization detector (Carle System gas chromatograph (GC». The total hydrocarbon content of the volatile gases was measured using the Carle GC.
Emission factors were determined using the carbonmass balance method (Ward et al. 1979, Radke et aI. 1990). We assumed thai carbon is released from the fuel in proportion to the rate that the mass of the fuel is lost during consumption in the fIre. This assumption was validated for laboratory fires by Nelson (1982). Emission factors Were ca1cliiated for total particulate matt~r, CO, an~ COl by dividing the emisSion concentration by the total carbon concentration and multiplying by two. Combustion efficiency was defined as the mass of carbon released in the form oreal divided by the total mass of carbon released. It was expressed as a percentage of total caibori.
Analysis of variance (ANOVA) was used to test whether species and monih interaction affected emission factors for CO, COl' and particulate matter. ,The hypotheses that species and month individually did not affect emission factors were also tested. The relationship betweeil combustion efficiency and emission factors was examined also. Both Kendall's fau and Pearsoh 's sample correlation coefficient were ta1ctilate(f io examine the telationships between corribustio~ efti~iency and eHhssion factors for CO arid PM (p. 185-i~4, Hollander anH Wolfe 1973; p. 277, Steel and Torrie 198d). Tau is a distributiori-free statistic that is used to test the independence of two" variables. The only assumptions necessary for hypothesis testing are 1) ttlat each pair of observations is independent of the other pairs and 2) that the pairs come from the same underlying parent Population. Tau measures the amoUnt of association between the two variables - i.e., does an increase in one variable cause an increase (or decrease) in the other variable? The sample correlation coefficient requires that assumption 1 be met and that the pairs of variables come from a bivariate normal distribution. The two statistics assume values ranging from -1 (perfect negative association) to o (no association) to 1 (perfect positive association). Both tests were performed because the distributional
- Burning California Chaparral 155
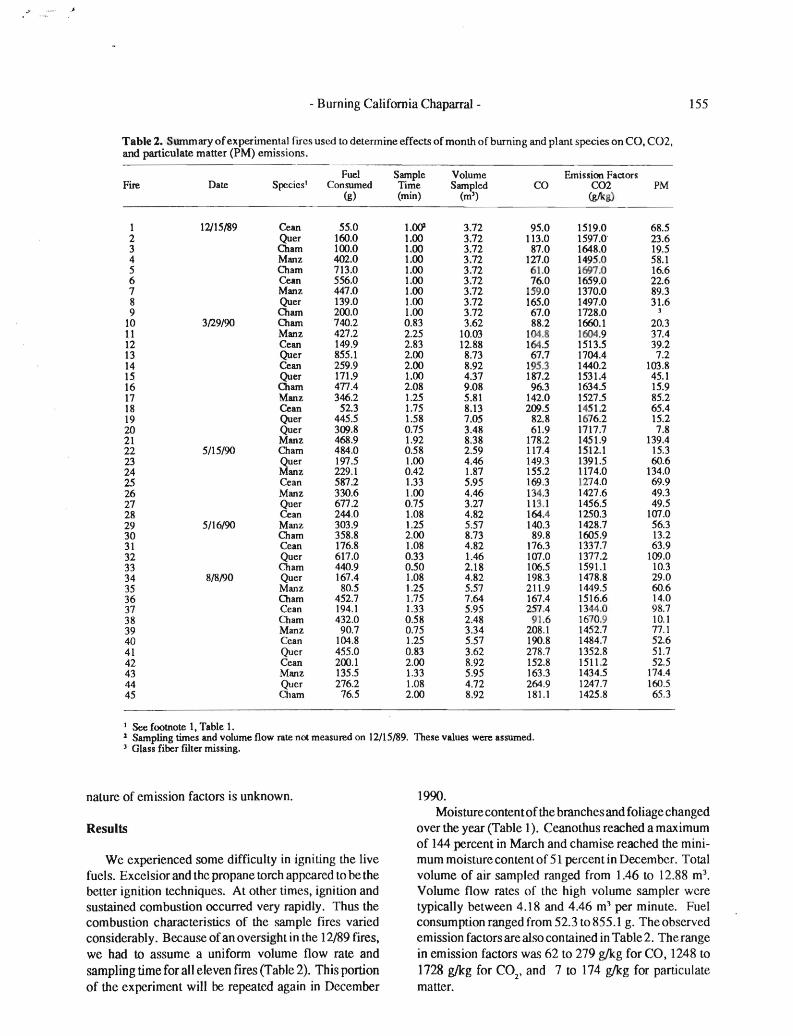
Table 2. Summary ofexperimental flIes used to determine effects of month of burning and plant species on CO, CO2, and particulate matter (PM) emissions.
Fuel Sample Volume Emission Factors Fire Date Species! Consumed Time Sampled CO CO2 PM
I See footnote I, Table 1. 1 Sampling times and volume flow rate not measured on 12115189. These values were assumed. J Glass fiber fLiter missing.
nature of emission factors is unknown. 1990. Moisture content of the branches and foliage changed
Results over the year (Table 1). Ceanothus reached a maximum of 144 percent in March and chamise reached the mini-
We experienced some difficulty in igniting the live mum moisture content of 51 percent in December. Total fuels. Excelsior and the propane torch appeared to be the volume of air sampled ranged from 1.46 to 12.88 m3
•
better ignition techniques. At other times, ignition and Volume flow rates of the high volume sampler were sustained combustion occurred very rapidly. Thus the typically between 4.18 and 4.46 m3 per minute. Fuel combustion characteristics of the sample fires varied consumption ranged from 52.3 to 855.1 g. The observed considerably. Because ofan oversight in the 12/89 fires, emission factors are also contained in Table 2. Therange we had to assume a uniform volume flow rate and in emission factors was 62 to 279 g/kg for CO, 1248 to sampling time for all eleven fires (Table 2). This portion 1728 g/kg for CO , and 7 to 174 g/kg for particulate
2
of the experiment will be repeated again in December matter.
Weise, D.R., Ward, D.E., Paysen, T.E. and Koonce, A.L.
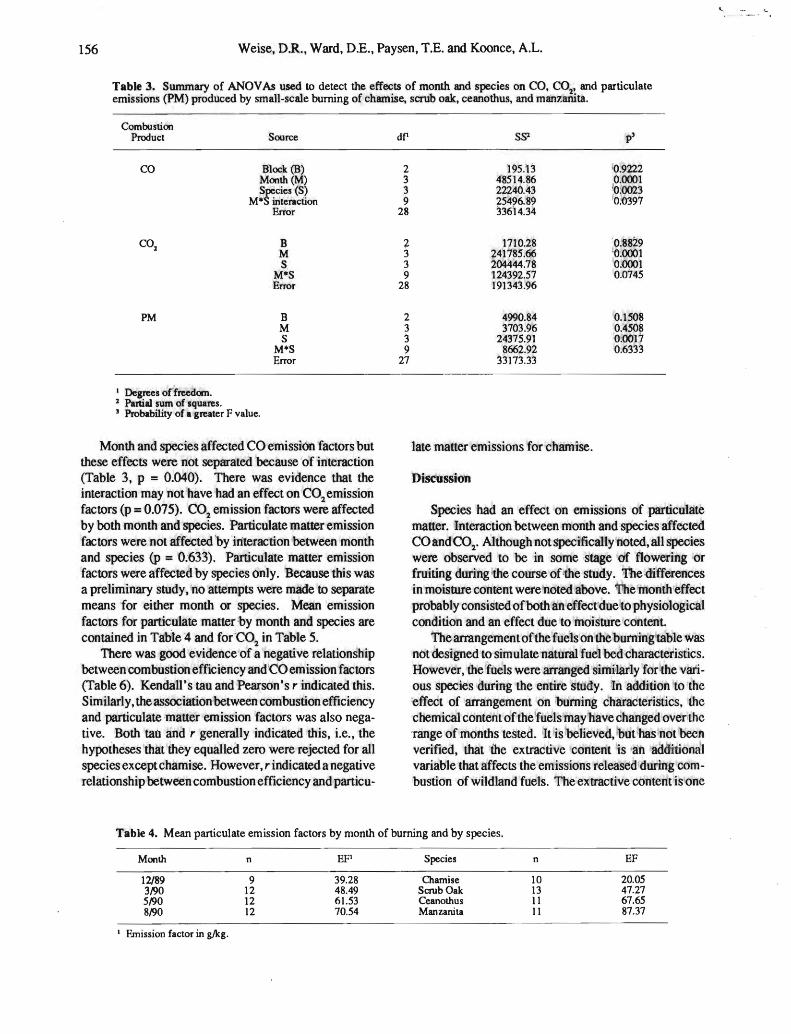
Table 3. Summary of ANOV As used to detect the effects of month and species on CO, CO2' and particulate emissions (PM) produced by small-scale burning of chamise, scrub oak, ceanothus, and manzanita.
156
Combustion Product Soorce dr SSZ p3
co Block(B' Month (M) Species (S)
M·S interaction Error
2 3 3 9
28
195.13 48514.86 22240.43 25496.89 33614.34
iO.9222 ,0.0001 !O.0023 '0:0397
B M S
M·S Error
2 3 3 9
28
1710.28 Z41785.66 204444.78 124392.57 191343.96
0.8829 :0;0001 0.0001 0.0'745
PM B M S
M·S Error
2 3 3 9
27
4990.84 3703.96
24375.91 8662.92
33173.33
0.1508 0.450~ 0.0017 0.6333
I Degrees of'freedom. 2 Partial sum of squares. ] Probability of. greater F value.
Month and species affected CO emission factors bot these effects were not separated because of interaction (Table 3, p = 0.040). There was evidence that the interaction may not have had an effect on CO
2 emission
factors (p = 0.075). CO2
emission factors were affected by both month and species. Particulate matter emission factors were not affected 'by interaction between month and species (p = 0~633). Particulate matter emission factors were affected by species only. Because this was a preliminary study, no attempts were made to separate means for either month or species. Mean emissioR factors for particulate matter ,by month and species are contained in Table 4 and for 'C02 in Table 5.
There was good evidence of a negative relationship between combustion efficiency and:CO emission factors (Table 6). Kendall's tau and Pearson's r indicated this. Similarly, the association between combustion efficiency and particulate matter emission factors was also negative. Both tau and r generally indicated this, i.e., the hypotheses that they equalled zero were rejected for all species except chamise. However, r indicated a negative relationship between combustion efficiency and particu
late matter emissions for chamise.
Discussion
Species had an effect on emissions of particulate matter. Interaction 'between month and species affected CO and CO
2, Although not Specifically noted, all species
were observed to be in some stage de flowering or fruiting during the course of -the study. ThedifferenceS in moisture content were noted above. l1he month effect probably consisted of both an effectdue to physiological condition and an effect due to moisture content.
The arrangementofthe fuels on the buming'table was nOt designed to simulate natural fuel bed characteristics. However, the 'fuels were arranged similarly for-the vW'ious species tiuring the entire stUdy. In addition to the effect of arrangement on 'burning characteristics, the cHemical content of the fuels may1tave changed over lhe 'range of months tested. It is believed, but has not been verified, that ,the extractive content is an -addmona'l variable that affects the emissions released'during combustion of wildland fuels. The extractive content is one
Table 4. Mean particulate emission factors by month of burning and by species.
variable that may have affected the burning characteristics of the species examined here. Thus the emission factors presented in this paper were for very artificial situations.
Although fuel bed variables were neither measured nor controlled in this experiment, the emission factors mea~ured in this study were similar to those observed by Ward and Hardy (1989) for field measurements ofsmoke from prescribed bums in chaparral. Emission factors for particulate matter in our study exceed those reported by Ward and Hardy. They reported emission factors of 12 to 21 g/kg. The emission factors in the present study ranged from 20 to 87 g/kg (Table 4). Conversely, Ward and Hardy reported emission factors of 1600 to 1715 g/ kg for CO and we measured emission factors of 1435 to
2
1608 g/kg (Table 5). Emission factors for CO ranged from 61 to 278 g/kg which is more than twice the range reported by Ward and Hardy (34 to 102 g/kg). More than likel y, the differences are a result of the effcct of fuel bed properties on combustion efficiency. The more porous, natural fuel array would be expected to bum with a higher com busLion efficiency thatlhe compact fuel beds created for this series of laboratory test fires. Using the data of Ward and Hardy (1989), combustion efficiencies for their field experiments ranged from 87 to 94 percent whereas our data suggested lower combustion efficiencies (mean of 81 percent). This result suggests that more carbon was converted to products of incomplete combustion in our laboratory experiments than in the near full-scale field experiments of Ward and Hardy (1989).
Table 6. Summary of teste; of association of CO and particulate matter emission factors with combustion efficiency. Association was measured using Kendall's tau and Pearson's sample correlation coefficient.
Nevertheless, this pilot study has yielded new data regarding the effect ofspecies on emission factors (Table 4).
Summary
Combustion characteristics of live chaparral fuels varied greatly. A propane torch and excelsior each provided good ignition of the fuels. Even though we did not keep characteristics of the fuel beds constant, our measured emission factors for CO, CO
2 , and particulate
matter generally agreed with other published studies. However, the ranges in emission factors were greater than the ranges reported in Ward and Hardy (1989).
Emission factors for particulate matter were affected by species only. Interaction between species and month had an effect on CO and CO
2 emission factors; individual
factor effects were not separated. Emission factors for particulate matter and CO were negatively associated with combustion efficiency. This study provides baseline data for future laboratory and field studies of emissions arising from burning of chaparral and indicates that month and species are potentially important factors. Further research and measurement is needed before absolute emission factors and thus smoke management guidelines for chaparral can be derived.
Acknowledgement. We thank the California Department of Forestry and Fire Protection for providing financial support for this research.
! CO =Carbon mOlloxide, CE ={:ombuslion efficiency, PM =particulate matter. 1 Cean = Ceanolhus crassl!olius, Cham = Adcnoslomajasciculalum, Man? = Arcloslaphylos 81andulosa, Quer =Quercus dumosa. J Kendall's tau. 4 Probability of achieving a greater tau. ~ Pearson's sample correlation coefficienL. 6 Probability of achieving a greater r.
158 Weise, D.R., Ward, D.E., Paysen, T.E. and Koonce, A.L.
References
Einfield, W., B. Mokler, D. Morrison and B. Zak. 1989. Particle and trace element production from flres in the chaparral fuel type. In: Proceedings of the 1989 National Air and Waste Management Association Meeting, June 25-30, 1989, Anaheim, California. No. 089-025.003.
Hegg, D.A., L.F. Radke, P.V. Hobbs, R.A. Rasmussen, andPJ. Riggan. 1989. Emissions of some biomass fires. In: Proceedings of the 1989 National Air and Waste M anagement Association Meeting, JlUle 25-30, 1989, Anaheim, California. No. 089-025.003.
Hol1ander, M. and D.A. Wolfe. 1973. Nonparametric statistical methods. Wiley and Sons, New York, New York. 503 pp.
Nelson, R.M., Jr. 1982. An evaluation of the carbon mass balance technique for estimating emission factors and fuel consumption in forest fires. U.S.D.A. Forest Service Research Paper SE-231. Southeastern Forest Experiment Station. Asheville, North Carolina. 9 pp.
Philpot, C. 1977. Vegetative features as detenninants of fire frequency and intensity. pp 12-16. In: Proceedings of the Symposium on the Environmental Consequences of Fire
and Fuel Management in Mediterranean Ecosystems (Mooney, H.A. and Conrad, C.E., technical coordinators), August 1-5, 1977, Palo Alto, California. U.S.D.A. Forest Service, General Technical Report WO-3, Washington, D.C. 498 pp.
Radke, L.F., lH. Lyons, P. V. Hobbs, D.A. Hegg. D. V. Sandberg and D.E. Ward. 1990. Airborne monitoring and smoke characteristics of prescribed flIes on forest lands in western Washington and Oregon. U.S.D.A. Forest Service, General Tecnical Report PNW-251. Paciflc Northwest Forest Research Station. Portland, Oregon. 81 pp.
Steel, R.G.D. and lH.Torrie. 1980. Principles and procedures ofstatistics -a biometrical approach. 2ndedition. McGrawHill, New York. New York. 633 pp.
Ward, D .E .• R.M. Nelson, Jr., and D. Adams. 1979. Forest fire smoke documentation. In: Proceedings of the 72nd Annual Meeting of the Air Pollution Control Association. JlUle 24-29, 1979, Cincinnati, Ohio. No. 79-6.3.
Ward, D.E. and C.c. Hardy. 1989. Emissions from prescribed burning of chaparral. In: Proceedings of the 1989 National Air and Waste Management Association Meeting, June 25-30, 1989,Anaheim, California. No. 089-025.003.