57
BURNT RIVER WATER TEMPERATURE STUDY STEERING COMMITTEE FINAL REPORT Prepared for the Burnt River Steering Committee by David Duncan and Associates Boise, Idaho April 2002

BURNT RIVER
WATER TEMPERATURE STUDY
STEERING COMMITTEE FINAL REPORT
Prepared for the Burnt River Steering Committee by David Duncan and Associates
Boise Idaho
April 2002
TABLE OF CONTENTS
INTRODUCTION 1 Study Description 1 Study Area 1
OBJECTIVE 1 FACTORS CONTRIBUTING TO STREAM TEMPERATURES 2 Baseline Temperatures 2
Upper Watersheds 2 Lower Watersheds 2
How Does Heat Energy Enter and Leave a Stream 3 Radiation 5
Atmospheric Radiation 7 Radiation from Riparian Vegetation and Topographic Features 7 Solar Radiation 8 Water Radiation 8
Evaporation 8 Convection and Conduction 9 Streambed Conduction 9 Groundwater 9 Stream Characteristics Important to Temperature 10
Elevation 10 Aspect 10 Topographic Features 10 Flow 10 Channel Width and Depth 10 Vegetative Shade 11 Reservoirs 11
Summary 13 Processes that Involve the Transfer of Heat Energy 13 Stream Characteristics Important to Temperature 14
OBJECTIVE 2 TEMPERATURE MANAGEMENT ALTERNATIVES 15 Methodology 15 Shade 15
Site Capability 15 Reclamation Findings 16
Irrigation Operations 17 Combining Shade Improvements with Irrigation Efficiency 17
OBJECTIVE 3 DEVELOP AND TEST A SURROGATE 18 Rationale for a Surrogate 18 Temperature Surrogate 18
Definition 19 Components 19
i
Process 19 Healthy Streams Surrogate 20
Considerations 20 Possible Additional Components 20 Conclusions 21
OBJECTIVE 4 1010 PLAN 22 Conservation Activities 22 Implementation Problems 22
Process 22 Scientific Disagreements 23 Socioeconomic 23
Use of Surrogates 24 Feasibility 24 Measures of Progress 25 Burnt River 1010 Plan 25
FUTURE RESEARCH 26 Objective 1 Factors Contributing to Stream Temperatures 26
Burnt River 26 General 26 Tools 26
Objective 2 Temperature Management Alternatives 27 Objective 3 Develop and Test a Surrogate 27
BIBLIOGRAPHY28
NOTES31
FIGURES
Figure 1 LocationhelliphelliphelliphelliphelliphelliphelliphelliphelliphelliphelliphelliphelliphelliphelliphelliphelliphelliphelliphelliphelliphelliphellipFrontispiece Figure 2 Seven-day Average Maximum Daily Stream Temperatures at Upper Monitoring Sites 2 Figure 3 Seven-day Average Maximum Daily Stream Temperatures at Lower Monitoring Sites 3 Figure 4 Seven-day Average Mean Daily Stream Temperatures at Lower Monitoring Sites 3 Figure 5 Budget of Radiation from the Sun the Atmosphere and the Ground 4 Figure 6 Processes that Involve the Transfer of Heat Energy 5 Figure 7 Energy Processes Occurring in the Lower Burnt River During One July Day 6 Figure 8 Long-wave Radiation in the Lower Burnt River During One July Day 6 Figure 9 Vegetation Shade Angle 11 Figure 10 Unity Reservoir Inflow and Outflow ndash 7-day Average Mean Daily Stream Temperatures
12 Figure 11 Unity Reservoir Inflow and Outflow ndash 7-day Average Maximum Daily Stream
Temperatures 12
ii
APPENDIXES
Appendix A ndash Participant Comments
Appendix B ndash Summary Document ndash Burnt River Research 1998-2000 ndash Rangeland Resources Department Oregon State University
iii
INTRODUCTION
Study Description Sixteen state and Federal agencies and organizations1 signed a Memorandum of Understanding (MOU) which defines a water quality study of the Burnt River subbasin The goals of the study are to provide a broadly-acceptable scientific basis for (1) developing and evaluating alternative approaches to dealing with water temperature concerns and (2) exploring how these approaches might be applied in a pilot basin in the development of an agriculture water quality management area (1010)2 plan as it relates to temperature
The Burnt River Water Temperature Study was organized to include a steering committee and a technical committee Study products include both research and committee reports This report describes the work done by the steering committee to address the four objectives in the MOU3 (1) assess the factors in the Burnt River subbasin that contribute to current stream temperatures (2) evaluate management practices that might reduce current temperatures (3) develop and test a concept using riparian and stream characteristics as a surrogate for temperature goals and (4) use the results of Objectives 1 through 3 as a basis for development of a 1010 plan by the Oregon Department of Agriculture Research for the study was performed by the Bureau of Reclamation (Reclamation) and the Oregon State University (OSU) Rangeland Resources Department This is not a research report Readers should refer to reports prepared by the Rangeland Resources Department and Reclamation for specific discussions relating to research findings4 Reclamation research is summarized in the discussions of Objectives 1 and 2 and a summary of research findings provided by the OSU Rangeland Resources Department is attached as Appendix B
This document has not been formally approved by any of the participating organizations and does not necessarily represent a consensus of the participants In commenting on an earlier draft of this report Environmental Defense has stated that it did not adequately communicate their view of the studyrsquos products and findings5
Study Area The Burnt River subbasin in eastern Oregon (see Figure 1) drains about 1100 square miles that range in elevation from about 7900 feet to 2100 feet Main tributaries originate in the Blue Mountains and join just upstream from Unity Reservoir The reservoir stores spring runoff for irrigation of agricultural crops mainly alfalfa and grass hay and provides recreational opportunities The primary irrigated areas include the area around Whitney on the North Fork the area around the town of Unity on the South Fork the area along the main stem from Unity Dam to the head of the Burnt River Canyon and the Durkee valley below the canyon
Reclamation studied the North Fork and the main stem and modeled the main stem6 from Unity Reservoir to the head of the Burnt River Canyon downstream of Bridgeport OSU studied four headwater tributaries (three South Fork and one North Fork) and the main stem
1
OBJECTIVE 1 FACTORS CONTRIBUTING TO STREAM TEMPERATURES7
Objective 1 Through the use of a mathematical model(s) and properly functioning condition (PFC) analyses and other tools assess the factors in the Burnt River basin that contribute to current stream temperatures4
Approach Reclamation gathered field data on water temperatures streamflows and other environmental factors from 1997 through 1999 developed a computer model of a section of the main stem and identified factors affecting stream water temperature3 OSU studied the relationship of vegetation elevation weather and land use to stream temperature on four tributary streams and the main stem3
Baseline Temperatures
Upper Watersheds The 7-day average maximum daily stream temperatures for 1998 at the upper monitoring sites on the main stem and the North and South forks are shown below in Figure 2 Maximum water temperatures on the upper South Fork were generally cooler than on the upper North Fork and the upper main stem The South Fork is a north facing basin and has significantly higher flows in the summer months than does the North Fork Maximum temperatures on the main stem below Unity Dam are greatly affected by reservoir temperatures They start out the summer cooler than the upper reaches of the tributaries but end up warmer by summerrsquos end
02-Jul 12-Jul 22-Jul 01-Aug 11-Aug 21-Aug 31-Aug 10-Sep 20-Sep
Date 1998
Figure 2 Seven-day Average Maximum Daily Stream Temperatures at Upper Monitoring Sites8
50 55 60 65 70 75 80 85
Deg F
N Fork S Fork Main
Lower Watersheds Seven-day average maximum daily stream temperatures for 1999 at the lower monitoring sites on the North and South forks and the station at the end of the modeled main stem reach are shown below in Figure 3 Seven-day average mean daily temperatures are shown in Figure 4 Maximum water temperatures on the South Fork were higher than those of the other two streams in early and late summer Mean temperatures on the South Fork were lower than the other two streams during
2
the middle of the summer Maximum temperatures on the North Fork tended to be lower than the other two streams during those same periods
17-Ju
n
22-Ju
n
27-Ju
n02
-Jul
07-J
12-ulJu
l
17-Ju
l
22-Ju
l
27-Ju
l
01-A
ug
06-A
ug
11-A
ug
16-A
ug
21-A
26-
ugAug
31-A
ug
05-S
ep
10-S
ep
15-S
ep
20-S
ep
25-S
ep
30- 05Sep -O
ct 50 55 60 65 70 75 80
De g F
N F o r k
S F o r k
Ma i n
DATE 1999
Figure 3 Seven-day Average Maximum Daily Stream Temperatures at Lower Monitoring Sites9
17-Ju
n
22-Ju
n
27-Ju
n02
-Jul
07-Ju
l
12-Ju
l
17-Ju
l
22-Ju
l
27-Ju
l
01-A
ug
06-A
ug
11-A
ug
16-A
ug
21-A
ug
26-A
ug
31-
05-AugSep
10-S
ep
15-S
ep
20-S
ep
25-S
ep
30-S
ep05
-Oct
45 50 55 60 65 70 75
De g F
N F o r k S F o r k Ma i n
DATE 1999
Figure 4 Seven-day Average Mean Daily Stream Temperatures at Lower Monitoring Sites10
How Does Heat Energy Enter and Leave a Stream In December of 2000 Oregonrsquos Independent Multidisciplinary Science Team (IMST) presented a stream temperature report to the governor ldquoThe goal of the workshop was to review empirical evidence and to identify points of agreement disagreement and knowledge gaps within the scientific community concerning the factors that influence stream temperature and fish responses to elevated temperaturesrdquo11
The IMST found that ldquo[s]olar radiation is the principal source of energy that causes stream heating and is the driver of many environmental factors that can influence stream temperature At any given point and at any given time stream temperature is the result of a complex suite of
3
environmental factors that transform solar energy and re-emit it as heat energy within the environment The interactions and effects of these environmental factors are cumulative and complex and vary by site over time and across regionsrdquo12 The report did not go into detail on the physics of these complex factors stating only that ldquo[t]he net rate of gain (stream heating) or loss (stream cooling) as a stream moves through the environment is the algebraic sum of net radiation evaporation convection conduction and advection [groundwater inflowoutflow]rdquo13 Although there is general agreement on basic principles there has been confusion over heat transfer processes especially the transfer of heat between air and water and the role of long-wave radiation This section describes the physics of heat transfer by utilizing actual Burnt River main stem data and presenting it in the context of the heat transfer processes listed in the IMST stream temperature report and a heat transfer diagram from DEQrsquos technical paper explaining the scientific basis for Oregonrsquos stream temperature standard14
Figure 5 shows that solar radiation (short-wave) and long-wave radiation (infrared) from the earth and the atmosphere are major sources of heat Portions of the solar radiation are absorbed at the ground reflected or scattered in the atmosphere Long-wave radiation from the atmosphere is absorbed by the ground or lost from the system and long-wave radiation from the earth is primarily absorbed by the atmosphere Other heat transfer processes include evaporation and convection but these processes transfer much less heat than radiation
Figure 5 Budget of Radiation from the Sun the Atmosphere and the Ground15
Reclamation and DEQ describe ldquohellipsix processes [shown in Figure 6] that allow heat energy exchange between a stream and its environment solar radiation long-wave radiation evaporation convection streambed conduction and groundwater inflowoutflowrdquo16
4
Figure 6 Processes that Involve the Transfer of Heat Energy17
Radiation The temperature of a stream depends upon the energy going into it and the energy coming out of it Figures 7 and 8 below show energy processes that occurred in the lower Burnt River on a typical July day (July 10 1999) Values were computed using weather station and stream temperature data and standard equations18 The analysis assumed 0 percent shade19 and 15 percent cloud cover Solar radiation was based on weather station data Atmospheric radiation values were computed With no shade and cloud cover they were largely a function of air temperature and relative humidity Water radiation (a function of water temperature) was computed Evaporation was computed based on measured wind speed relative humidity air temperature and water temperature Convection was computed based on measured wind speed atmospheric pressure water temperature and air temperature
As shown below in Figure 7 most of the heat transfer to and from a stream results from radiation There are two forms ndash long-wave (infrared) and short-wave (visible and ultraviolet) Long-wave radiation transmits heat to the stream from the atmosphere from riparian vegetation and from topographic features such as canyon walls Solar radiation transmits heat from the sun to the stream either directly or from reflections off clouds The stream surface emits long-wave radiation cooling the stream while heating the surrounding environment
5
Figure 7 Energy Processes Occurring in the Lower Burnt River During One July Day20
Figure 8 shows that combining heat gains and losses due to long-wave radiation obscures the fact that there is considerable loss of heat from the stream from water radiation and considerable heating from atmospheric radiation
Figure 8 Long-wave Radiation in the Lower Burnt River During One July Day21
6
Atmospheric Radiation As shown in Figure 5 long-wave infrared radiation emitted by the atmosphere is the largest source of radiant energy absorbed at the Earthrsquos surface ndash nearly double the amount of energy received directly from the sun (965 thermal units vs 475) As the atmosphere becomes warmer more heat energy is transmitted to a stream through long-wave radiation Thus air temperature is a significant factor in the heat load being imposed on a stream Figure 7 shows that atmospheric radiation accounts for about half of the heat gained by the lower Burnt River during a July day
Reclamation found a very high correlation22 between air temperature and both mean and maximum daily water temperature The correlation increased going downstream (05 downstream of Unity Reservoir to 09 at Huntington) This high correlation was expected because air and water are both heated by solar radiation and air temperature is a major component of atmospheric radiation Reclamation used weather station data and a precise physical equation to determine the effects of atmospheric radiation ldquoThe amount of atmospheric radiation entering a stream is affected by five factors (1) air temperature (major factor) (2) vapor pressure which affects the emissivity (3) cloud cover which converts short-wave solar radiation into long-wave radiation (4) reflection of long-wave radiation at the water-air interface and (5) the interception of long-wave radiation by riparian vegetationrdquo23
Figure 7 shows that atmospheric long-wave radiation tends to be fairly constant but rises during daylight hours Reclamationrsquos calculations of hourly heat fluxes showed that solar short-wave radiation was about 25 times as high as atmospheric long-wave radiation at its peak but over a 24-hour period the average amount of heat gained from atmospheric radiation was about equal to the solar (345 joulesmeter2second for solar radiation vs 330 for atmospheric radiation)18
Modeling runs performed by Reclamation to specifically assess the independent impacts of air temperature showed main stem water temperatures would likely be between 3-4 degF cooler than average during unusually cool periods in the summer (one standard deviation below the mean) and 3-4 degF warmer than average during unusually warm periods (one standard deviation above the mean)24
Radiation from Riparian Vegetation and Topographic Features Riparian vegetation blocks both solar and atmospheric radiation although the vegetation itself will emit long-wave radiation To assess sensitivity to shade Reclamation estimated the hourly heat fluxes if the main stem could receive 50 percent shade25 26 Under these conditions the total long-wave radiation from the atmosphere and riparian vegetation would likely be about 15 percent higher than without the vegetation the riparian vegetation accounted for about 55 percent of the total radiation However these increases were estimated to be more than offset by a 50 percent reduction in solar radiation reaching the stream leaving the stream temperature lower as a result of the increased vegetation
7
The Burnt River Canyon has high walls that provide shade and has good riparian vegetation yet stream temperatures rise more in this river reach than elsewhere The heating in the canyon appears to be largely due to heat transfer from the rocks (long-wave radiation) and high air temperatures
Solar Radiation If you stand in the sun you get warmer than if you are in the shade A stream is no different Previous studies have found that (1) stream temperatures increase with removal of streamside vegetation27 (2) shade reduces stream heating in small (low flow) forested streams by reducing the amount of direct solar radiation28 (3) removal of riparian vegetation has only a modest effect on mean stream temperature since the energy gained from the increased solar radiation is partially offset by the increased energy loss by radiation to the sky29 and (4) shading is associated with significant differences in daily maximum air temperatures30
Supplemental modeling runs31 were performed by Reclamation to specifically assess the independent impacts of solar radiation These showed that the mean main stem water temperatures would likely be between 2-3 degF cooler than average during cloudy periods (solar radiation one standard deviation below the mean) in the summer and 2-3 degF warmer than average during clear periods (solar radiation one standard deviation above the mean) Maximum water temperatures were predicted to be about 4 degF cooler than average during cloudy periods32
Water Radiation Figure 5 above shows that long-wave radiation is the largest source of energy emitted from the earthrsquos surface Figure 7 above shows that more energy is lost to the atmosphere through long-wave water radiation than is gained through long-wave atmospheric radiation
Evaporation As the motion of water molecules increases in response to increased heat energy they begin to overcome the molecular attraction to liquid water causing more molecules to escape as water vapor and releasing heat in the process Wind assists evaporation by removing escaping water molecules before they are forced back into the water surface Figure 7 above shows that a great deal of evaporative cooling took place on the Burnt River on July 10 1999 The cooling picked up along with the wind during the heat of the day and then subsided in the evening hours On July 14 the average wind speed was 28 miles per hour (mph) instead of the 1 mph observed on the 10th and the evaporative cooling was twice as great averaging 228 joulesmeter2second33 Shaded streams tend to have less evaporative cooling because they heat less and have less wind exposure however no attempt was made to measure these effects in the Burnt River
8
Convection and Conduction In conduction heat is transferred from molecule to neighboring molecule with no mass motion of the air or water being involved Convection is the process of transfer of heat from one place to another by the actual mass motion of heated water or air from one place to the other34 Although a great deal of heat can be transferred between air and water through radiation relatively little is transferred through convection since the thermal conductivity of air is very poor Figure 7 shows only a small amount of heat is transferred by convection between air and water Convection added an average of about 27 joulesmeter2second to the main stem near Durkee during the day At night the stream lost an average of about 24 joulesmeter2second back to the air Over ten times more heat was transmitted from the air to the river by long-wave radiation (an average of 322 joulesmeter2second) than by convection (see Figure 7 above)
Streambed Conduction The Oregon DEQ35 has suggested that unshaded shallow streams tend to receive some heat energy from streambed conduction during summer days To the extent that a streambed contains a greater amount of solid rock the heat release would be slower No attempt was made to measure heat transfer through bed conduction in the Burnt River
In contrast data from the Wallowa-Whitman National Forest soil survey program indicates that the heat flux from streambed to stream during the summer will change as the stream flows toward the mouth In the headwaters the streambed is often warmer than the water whereas in the lower elevation areas the streambed is cooler than the stream Streambeds along the reach modeled by Reclamation (Unity Reservoir to Bridgeport 3700 to 3400 feet elevation) would be about 10 degF cooler than maximum daily water temperatures during the summer and about in equilibrium with nighttime temperatures36
Groundwater Previous studies have found that (1) stream systems that receive a large influx of groundwater exhibit a high degree of thermal constancy37 (2) groundwater influx can have a depressing effect on stream temperature38 (3) groundwater temperatures are normally within 2 degF of the mean annual air temperature39 and (4) groundwater is warmer at lower elevations35
Reclamation found that periodic decreases in stream temperatures in the South Fork between Whited and Unity Reservoirs are likely due to subsurface return flows from irrigation Reclamation also found that stream temperatures in the main stem increased in the downstream direction from the dam during the first part of the irrigation season when most of the return flows are warm surface flows and groundwater return flows are limited In the late part of the irrigation season more of the return flow is cool groundwater and the temperature profile flip flops with stream temperatures decreasing in the downstream direction Modeling runs suggested that if these late-season sub-surface return flows were reduced through increased irrigation efficiencies stream temperatures would increase
9
Stream Characteristics Important to Temperature
Elevation Elevation has been defined by the IMST as one of eight factors affecting stream temperature40 The thermal environment is warmer at lower elevations Groundwater inputs are warmer and more heat is transferred to the stream from the warmer air (primarily through radiation) Air soil and water temperatures in the Burnt River subbasin increase about 2 degF for each 500 foot drop in elevation41
Aspect The tributaries that drain north facing basins including the South Fork Camp Creek and Clarks Creek normally have higher base flows and lower stream temperatures during the spring and summer months than south facing basins such as the North Fork and Pritchard Creek
Topographic Features The Burnt River heats up considerably as it goes through the Burnt River Canyon The canyon has high walls that provide shade and good riparian vegetation even though the USFS and BLM permit livestock grazing in the canyon However stream temperatures rise more in this river reach than elsewhere on the Burnt River This heating appears to be largely due to heat radiating from the rocky canyon walls and high air temperatures and perhaps also due in part to the relative absence of subsurface flows into the river
Flow As flow rate decreases the volume of water that is involved in the heat energy balance is reduced but heating processes remain relatively unchanged The result is that during heating periods the stream tends to accumulate more energy per unit volume The daily fluctuation of temperature in a low volume stream such as the North Fork in summer will be far greater than that of a large volume stream42
Reclamation found that the North Fork has flows of only 1-3 cfs at the lower gauging station during the summer and often has stream temperatures in excess of 80 ordmF The South Fork with flows of 15-30 cfs at the forest boundary tends to run cooler than the North Fork
Channel Width and Depth As the width of a stream channel increases so does its surface area increasing the amount of heat energy exchange that occurs between the stream and its environment If flow remains constant stream widening results in reduced channel depth A shallower depth may allow solar energy to strike the streambed and increase streambed conduction In sensitivity tests Reclamation modeled a main stem channel 30 percent narrower than the present channel43 and predicted that the narrowing would result in about a 2 degF decrease in summer stream temperatures
10
The highest summer sun angle in Oregon is roughly 70 ordmF44 On some reaches of narrow east-west oriented tributary streams riparian vegetation will block solar radiation throughout the entire day If the angle from the top of the canopy to the opposite bank is less than 70 solar radiation will reach the stream during part of the day Reclamation surveyed 10 river cross sections in the modeled reach from the Unity Dam to the canyon and found the main stem (shown in Figure 9 below) to average about 40 feet in width The soils and channel type along much of the main stem will support natural growth of willows ranging from 5-15 feet in height45 ldquoCottonwood would be unlikely to occur naturally within the Hereford [modeled] reach of the riverrdquo46 47 Even if sections of the main stem contained dense willow stands in riparian areas they would receive solar radiation whenever the sun elevation is greater than 30 degrees and (as shown in Figure 9) only about 11 percent of the 40 foot width of the modeled reach of the Burnt River would be shaded at the highest summer sun angle
Figure 9 Vegetation Shade Angle
Vegetative Shade The Reclamation study found that the most heavily shaded section of the North Fork displayed lower diurnal swings than the other sections even though it had very low water volume Reclamation used model sensitivity runs to assess the effects of theoretical shade percentages on the main stem Global shade values of 15 percent were predicted to decrease temperatures up to 2 degF Most participants felt that given the present stream width and soil conditions shade values beyond that level were unlikely Many participants felt that 15 percent was beyond the current resource capability Some felt that if taller species could be propagated in the study reach and the stream narrowed through riparian improvements higher shade values could be attained The highest theoretical value for shade studied by Reclamation was 50 percent The model sensitivity run using 50 percent shade predicted a drop in mean stream temperature of about 4 degF and a drop in maximum temperature of about 55 degF
Reservoirs Without Unity Reservoir the stream flows in the Burnt River during the summer and fall months would be much lower (10-15 cfs vs 90-130 cfs) than currently exists Higher flows slow the warming process Larger stream flows (larger water volumes) take longer to increase in temperature than smaller flows
11
Figure 10 below displays the measured 1999 mean daily 7-day average stream temperatures for the lower South Fork before it flows into Unity Reservoir and measurements for the main stem immediately below Unity Dam Figure 10 indicates that the outflow from the reservoir is cooler than the inflow in the early part of the irrigation season and is warmer than the inflow later on in the year The inflow temperatures for the North Fork are not shown in Figure 10 because its flows just above the reservoir are very small and their temperatures are unknown
17-Ju
n
22-Ju
n
27-Ju
n02
-Jul
07-Ju
l
12-Ju
l
17-Ju
l
22-Ju
l
27-Ju
l
01-A
ug
06-A
ug
11-A
ug
16-A
ug
21-A
ug
26-A
ug
31-A
ug
05-Sep
10-Sep
15-Sep
20-Sep
25-Sep
30-Se
05
p-O
ct 45 50 55 60 65 70
Deg F
S Fork Ma i n
DATE 1999
Figure 10 Unity Reservoir Inflow and Outflow ndash 7-day Average Mean Daily Stream Temperatures48
Figure 11 below displays the measured 1999 maximum daily 7-day average stream temperatures for the lower South Fork and the main stem immediately below Unity Dam Figure 11 indicates that the outflow from the reservoir generally has lower maximum daily temperatures than the inflows from the South Fork for most of the irrigation season In late September and beyond the temperatures of the inflows are less than the outflows from the reservoir reflecting cooler air temperatures and shorter day heating periods
17-Ju
n
22-Ju
n
27-Ju
n02
-Jul
07-Ju
l
12-Ju
l
17-Ju
l
22-Ju
l
27-Ju
l
01-A
ug
06-A
ug
11-A
ug
16-A
ug
21-A
ug
26-A
ug
31-A
ug
05-Sep
10-Sep
15-Sep
20-Sep
25-Sep
30-Se
05
p-O
ct
80 75 70Deg 65 60 55 50 45
F S Fork Main
DATE 1999
Figure 11 Unity Reservoir Inflow and Outflow ndash 7-day Average Maximum Daily Stream Temperatures49
The diurnal temperature fluctuation of the river for several miles below Unity Reservoir is smaller than in the river farther downstream The effects of the reservoir on temperature and
12
diurnal fluctuations are seen most strongly in the first 5 miles below the reservoir The effects largely disappear 10 miles below the reservoir
The irrigation facilities on the South Fork above Unity Reservoir significantly alter stream temperature conditions The passage of water through Whited Reservoir on the South Fork increases the mean daily stream temperature by as much as 10 degF until the outlet gates are opened in late July or August During this early part of the irrigation season flow downstream consists of the warmer water from the top of the reservoir (flow over the spillway) Later cooler water from the bottom of the reservoir is released causing a large decrease in temperature below the reservoir Both Whited and Unity reservoirs are somewhat stratified during the irrigation season in terms of water temperature and there can be a significant difference in water temperatures whether water is taken off the top (usually the case at Whited) or the bottom (eg Unity) in certain periods during the irrigation season Since all of the flow in the lower South Fork is diverted for irrigation the South Fork flow into Unity Reservoir is essentially all irrigation return flows (both surface and subsurface) that are generally cooler than the surface water in the South Fork especially during the latter part of the irrigation season
Summary
Processes that Involve the Transfer of Heat Energy
There are six processes that allow heat energy exchange between a stream and its environment solar radiation long-wave radiation evaporation convection streambed conduction and groundwater inflowoutflow Of these radiation is by far the most significant
Solar Radiation
In the summer the main stem Burnt River gains almost all of its heat from radiation with about half of the gain coming from solar radiation and about half coming from atmospheric radiation Anything that reduces the amount of a stream that is exposed to solar radiation (vegetation clouds topographic features reduction in width etc) will reduce the amount of heat added
Atmospheric Radiation
There has been confusion over how heat is transferred between air and water On a typical July day some heat is transferred to the Burnt River by convection but over ten times more heat is transmitted from the air to the river by atmospheric radiation than by convection About half of the heat gained by the river in the summer comes from atmospheric radiation
Cooling Processes
Heat loss occurs primarily through long-wave radiation from the water back to the atmosphere Evaporative cooling produces significant heat loss especially during warm and windy periods
13
Groundwater primarily from irrigation return flows contributes to cooling the main stem in the late part of the irrigation season
Stream Characteristics Important to Temperature Seven stream characteristics were identified as being important to temperature elevation aspect topographic features flow channel width and depth vegetative shade and reservoirs
The thermal environment is warmer at lower elevations Groundwater inputs are warmer and more heat is transferred to streams from warmer air Air soil and water temperatures in the Burnt River subbasin increase about 1 degF for each 250 foot drop in elevation
Aspect stream width and vegetation affect the amount of solar radiation that streams receive Burnt River tributaries draining north facing basins tend to have higher base flows and lower stream temperatures during the spring and summer than south facing basins The width of the main stem (average 40 feet) makes it difficult to shade especially with the predominant native willow species that grow to no more than 15 feet in height The most heavily shaded section of the North Fork displays lower diurnal swings than other sections Model runs showed that increasing shade on the main stem would lower stream temperatures with the greatest effect being on maximum temperatures
Reservoirs have a significant effect on stream temperatures in the Burnt River Higher summer flows with Unity Reservoir (90-130 cfs vs 10-15 cfs without the reservoir) slow the warming process but outflows are warmer than inflows in August and September When water is taken off the top of Whited Reservoir mean daily stream temperatures on the South Fork increase by as much as 10 degF until outlet gates are opened in July or August and cooler water is released from the bottom
14
OBJECTIVE 2 TEMPERATURE MANAGEMENT ALTERNATIVES
Objective 2 Utilize the results of Objective 1 to identify and evaluate management practices that might be employed to reduce current temperatures in the Burnt River basin4
Methodology Reclamation used their calibrated stream temperature computer model6 to evaluate effects of management practices on the Burnt River reach from Unity Dam to the confluence with Clarks Creek at the head of the Burnt River Canyon Findings should not be generalized to any other part of the subbasin
Shade
Site Capability The main problem with shading the main stem appears to be the average width (about 40 feet) of the channel The amount of shade is a function of the type of riparian species how high they grow where they grow their density and their distance from the channel
Vegetation
Site capability work was performed by OSU50 with the assistance of the NRCS and peer reviewed by Forest Service and BLM experts agreed to by study participants The NRCS developed an ecological site description (Willow Riparian) that applies to most of the riparian areas downstream of Unity dam except for a few cottonwood sites below the reach modeled by Reclamation The overstory of the historic climax plant community in these areas was willows with unknown understory Many of these areas have been invaded to varying degrees by reed canary grass
Willows likely would grow in soils and channel types that were normally colonized by the various willow species It was assumed that the willows would grow 5 feet from the water edge for the majority of the summer and only grow in alluvial deposits comprising about one-sixth of a typical river reach Willows were estimated to average between 5 and 15 feet in height (only the taller height was used in shade computations) In her peer review Crowe51 observed that the ldquovegetation heights are probably higher than the average of even the tallest individuals in populations of these shrub speciesrdquo52
Crowe felt that ldquo[c]ottonwood would be unlikely to occur naturally within the Hereford [modeled] reach of the riverrdquo53 The site capability work did not argue that taller species such as cottonwood could not be grown in areas that are described as willow communities In a peer review of the site capability work Leonard54 pointed out that ldquo[c]ottonwoods may grow in this segment if planted but it is highly unlikely that there would be recruitment from seedrdquo55
15
The DEQ has pointed out that taller non-native species have been planted in the study reach and survived and that restoration could be focused on passive regeneration of native vegetation or it could include active planting of willows cottonwood or other taller species
Channel
The site capability work did not address channel changes and their potential effects on shade Channel changes could affect the distribution of willows and reed canary grass Crowe suggested that if the stream evolves to more of an E-type channel morphology the willow stand remnants would be right on the streambank and would provide more shade to the stream56 However she also wondered if movement toward an E-type channel might lead to the reduction of the area available for woody species establishment given the abundance and aggressiveness of reed canary grass in the riparian system She observed that if the channel is or becomes more of a C-type areas other than alluvial bars might be potential sites for shrub establishment unless they are too heavily dominated by reed canary grass Crowe57 pointed out that gravel transportation and sedimentation has an effect on vegetation and wondered if a decrease in the amount of gravel being transported in the river was contributing to a decline in willow populations
Crowe52 and others have wondered if there is a chance that the river is wider than it was before settlement of the valley and if there is a chance that it could become narrower in the future with changes of management in the riparian areas Some sections of the river that have been straightened are wider than unstraightened sections As pointed out above in the discussion of width and depth a narrower channel would lead to increased shade
Reclamation Findings Reclamation investigated the effects of achieving shade potential in the river reach from the Unity Dam to the canyon entrance Their initial modeling runs were based on estimates of the maximum amount of shade attainable under existing soil and stream conditions provided by OSU58 These estimates considered the combined tree shrub grass and bank shade components The estimates were made for each modeling reach and ranged from 28 to 6 percent shade Shade estimates were based upon the average amount of stream area covered by shadow at the hours of 1000 1100 1200 100 and 200 In their final report Reclamation estimated that increasing shade to these levels would have a very slight cooling effect on the stream The largest difference projected in instream temperatures would be about 05 degF for maximum daily temperature at the lowest validation station The shade effects would be more pronounced at the downstream stations and would affect the maximum daily water temperatures more than the mean daily water temperatures
A participant review of the above methodology highlighted the fact that this was a different approach to shade estimates from the effective shade methodology employed by the DEQ In an effort to provide more consistency OSU provided new shade estimates59 to Reclamation for June July and August based on taking an average of estimated shade at each hour of the day from 7 am to 5 pm The new estimates of average shade were 59 percent for June 66 percent for July and 82 percent for August (compared to the 36 percent average used in Reclamationrsquos final report)60
Increasing the estimate of attainable shade from 36 percent to 82 percent for August led to an estimated decrease of 12 degF in maximum daily stream temperature at the lowest validation station
16
as opposed to the earlier projection of a 05 degF decrease61 The changes would be less for June and July when the sun angle would be higher
No assessments were done on headwater streams where shade potential would be much greater nor on the lower reaches of the river that are dominated by midstory shrubs with a very minor cottonwood component
Irrigation Operations Reclamation simulated a number of irrigation efficiencies and found that increasing irrigation efficiencies would likely cause stream temperatures to decrease somewhat until about the middle of July and then warm through the remainder of the irrigation season In the early part of the irrigation season most of the return flows are warm surface flows Increasing efficiencies would reduce these flows lowering stream temperatures However reduction in early season recharge of the shallow aquifer could reduce cool late-season groundwater returns In the later part of the irrigation season more of the return flow is cool groundwater Increasing efficiencies during this part of the year would decrease cool subsurface return flows raising stream temperatures Projected August temperature increases were as high as 2 degF at the site furthest downstream from the Unity Dam Decreased irrigation efficiencies would tend to lower stream temperatures in late July and August However if irrigation efficiencies become too low there could be an increase in overland return flows leading to higher stream temperatures
Combining Shade Improvements with Irrigation Efficiency Reclamation modeled the effects on the upper main stem of combining a 3-6 percent shade increase with an increase of irrigation efficiency from 55 to 70 percent This combination would likely result in a minor cooling (a maximum of about 1 degF) from Unity dam to Pine Creek However in the reach from Pine Creek to the canyon this combination would likely lead to a slight increase in stream temperatures Adding shade to the simulation would result in reducing stream heating while increasing irrigation efficiency would lead to an increase in stream temperatures through a reduction in subsurface return flows Thus the two options appear to act against each other resulting in very minor stream temperature changes
17
OBJECTIVE 3 DEVELOP AND TEST A SURROGATE
Objective 3 Develop and test a concept using riparian and stream characteristics as a surrogate for temperature goals4
Rationale for a Surrogate One of the objectives of the Burnt River study was to develop a surrogate for the 64 degF criterion62
in Oregonrsquos water temperature standard63 Not meeting the criterion brings about a process that leads to regulation under a water quality management plan Although the standard can be satisfied without attaining the 64 ordmF criterion64 many have felt that water quality planning would proceed more smoothly if less attention was given to the criterion and more attention was given to the environmental factors related to temperature If a surrogate based on desired stream and riparian conditions could be developed the criterion could be used only to start the planning process and then the focus could shift from achieving the criterion to achieving the field conditions described in the surrogate This would change the focus from goals that might not be achieved to ones that could be achieved For example in the Burnt River it may not be possible to achieve the 64 degF criterion in all reaches at all times but it should be possible to achieve the field conditions described in a surrogate
Ideally a surrogate would identify conditions that landowners could easily see as problems and then come up with their own solutions Advocates of this approach feel that this changed focus would likely receive more support and cooperation from landowners Surrogates could form the basis of the temperature portion of 1010 plans and could provide the framework for monitoring plans with which to measure progress This kind of approach might also more clearly show that certain problems were not the fault of specific landowners
When the Burnt River study began some participants felt a surrogate could eventually form the basis of an alternative standard (sometimes referred to as a healthy streams standard) but that has not been a study goal65
Two approaches to a surrogate were discussed a surrogate that would reflect the temperature standard and one that would describe the conditions of a healthy stream It was felt that the latter approach should be considered because the present temperature criterion is in essence already a surrogate for a healthy stream
Temperature Surrogate The majority of participants felt that a surrogate could be developed around a description of desired riparian and stream characteristics that could be used as objectives in improving stream temperatures If those factors are brought to as good a condition as they are capable of achieving then summer stream temperatures should be as low as can be expected Most study participants were looking for a simple tool that would show whether or not a stream was functioning as it
18
should Participants were largely in agreement on the concept of a temperature surrogate but were unable to develop a process for testing these concepts on the ground
Definition Although there was no consensus on a definition a surrogate was generally perceived as a set of environmental parameters that can be managed to improve water temperature Much of the discussion involved a perception of surrogates as having two basic elements (1) components of the major environmental factors that affect temperature and (2) the process by which goals are set and progress measured
Components Component categories (vegetation flow and channel morphology) had been defined through the work on the first two study objectives and were generally agreed to Visions of a healthy stream from a temperature perspective usually included unconstrained riparian vegetation good surface and groundwater flows a narrow channel and a stream that is connected to the flood plain all determined and based on the site potential However participants could not agree on specifics
There was discussion of a vegetation component related to ecological site descriptions developed by the NRCS It was agreed that vegetation components affected by management include the establishment recruitment and maintenance of vegetation appropriate to existing site conditions66
Flow components discussed included stream flows irrigation return flows (both surface and subsurface) groundwater flows and factors affecting a watershedrsquos capability to store and release water Channel structural features affecting stream temperatures discussed included bank stability and improved widthdepth ratios where there is potential to do so The possibility of including thermal refugia as a surrogate component was discussed but not pursued The participants recognized that component values will vary across years within climates
Process Although participants reached no consensus they did discuss defining each surrogate component in terms of a process by which goals could be set and progress measured The following potential elements were identified (1) existing condition (2) site potential (the physical maximum that a resource is capable of achieving) (3) inhibiting factors (4) goals or desired future conditions based on resource capability (what can be achieved given identified inhibiting factors) (5) prohibited conditions (6) a monitoring program and (7) progress assessment and review
The OSU Rangeland Resources Department developed an estimate of vegetative site potential in their work on Objective 2 and NRCS personnel made a similar independent analysis but participants did not agree on their findings In general participants were not comfortable with determining site potential or defining specific goals To get around some of these problems some felt that a surrogate could be defined in terms of improvement in stream characteristics but no attempt was made to develop that approach
19
Healthy Streams Surrogate Some participants felt that the 64 degF criterion was itself a surrogate and had been developed partly because it can be objectively measured Some felt that a more appropriate approach would be to develop a surrogate around healthy stream concepts instead of just temperature67
Considerations The purpose of the temperature standard is to protect aquatic life but from a fishery perspective the temperature focus can lead to overlooking other factors that could benefit fish Some of the environmental representatives felt that what was really needed was a healthy stream for aquatic life not just a low temperature In the Burnt River below the dam some felt that through focusing on the 64 degF criterion minor improvements in temperature might be made with perhaps no effect on the fishery If the focus were expanded a better understanding of what could be done to protect the fishery might be obtained
Another disadvantage of the temperature criterion is that landowners tend to identify less with temperature concerns (especially when they feel that targets canrsquot be achieved) than with the concept of a healthy stream A focus on a healthy stream instead of just temperature might yield more landowner support and help them better identify problems so they could develop their own solutions
There was some brief debate over what constitutes a healthy or fully functioning stream a stream that optimizes resources for fish for agriculture or for fish and agriculture However most participants felt that a healthy stream surrogate would probably look similar to a temperature surrogate because things that help stream temperature constitute most of the components of a healthy stream
Possible Additional Components There was some discussion of adding additional components to a healthy streams surrogate
Relating Stream Conditions to Aquatic Life
Some participants wanted to help define a healthy stream by doing a survey of aquatic life and linking the findings to various stream and riparian states For example do fish fare better under banks lined with willows or canary grass But there was insufficient support for a survey
Biological Factors
Adding other factors such as macroinvertebrates into a healthy streams effort was also discussed but adding biological factors to the mix would likely be beyond the Statersquos funding capability as well as landownersrsquo endurance and good will
20
A proposal from a group of northwest Forest Service and BLM scientists attempting to develop a biological analog to Properly Functioning Condition (PFC) was discussed They had suggested two types of assessments a level 1 assessment that would focus generally on physical factors and a level 2 assessment that would provide more detailed habitat mapping macroinvertebrate sampling and assessments of fish communities Level 2 assessments were suggested only for high-priority streams The Burnt River study participants concluded that fortunately physical factors related to temperature are also strongly linked to biological factors and can be used to predict the biological factors and that most streams that are physically healthy are also biologically healthy
Conclusions Most participants concluded that although a healthy stream was desirable defining it and measuring it was very complex and that surrogate development should probably be limited to the physical conditions of streams and riparian areas
21
OBJECTIVE 4 1010 PLAN
Objective 4 Use the results of Objectives 1 through 3 as a basis for development of a SB 1010 plan2 by the Oregon Department of Agriculture This plan will be submitted to EPA68 via DEQ as part of the Burnt River TMDL69 for removal of the river from the 303(d)70 list4
Approach ODA with the assistance from the Burnt River Technical Committee will evaluate the work done under the first three objectives in developing a management plan The plan will be submitted to EPA as part of the TMDL for the Burnt River and upon EPArsquos approval the river will be removed from the 303(d) list4
Conservation Activities The Burnt River has a long history of having a very active SWCD (Soil and Water Conservation District) that has initiated a great number of successful conservation projects However some of the past accepted practices such as channeling are now recognized as being detrimental to bank and channel stability and flood plain connectivity
Much of the Burnt River is now covered by CRMPs (Conservation Resource Management Plans) These have helped coordinate proposed and ongoing conservation projects and have made local landowners aware of problems in the basin and on their own property Most landowners were present when the PFC assessment (Properly Functioning Condition) was done on their property as part of the OSU Range Departmentrsquos portion of the Burnt River study thus gaining additional understanding of the riparian conditions
Implementation Problems During the course of the Burnt River study landowners have expressed considerable frustration with the implementation of Oregonrsquos standard for stream temperature The Burnt River study participants felt that making policy suggestions would be inappropriate but that a summary of the problems encountered may be useful to others who are trying to make the process more effective
With the involvement local landowners have had in the Reclamation and OSU studies (several served on the Technical Committee) most do not see high stream temperatures as a significant man-caused problem in the Burnt River subbasin
Three types of problems have been encountered process scientific disagreements and socioeconomic
Process Although most landowners are now well-informed of the TMDL and 1010 processes some of their initial reluctance to address stream temperatures was due to a lack of understanding of the temperature standard and the processes related to it Some felt that the standard called for all
22
streams in the state to be cooled to 64 degF whether or not that was physically possible It was sometimes felt that if the 64 degF criterion canrsquot be achieved it is fruitless to make changes solely to improve temperature Some feel that if they are having a net positive effect on temperatures itrsquos not necessary for them to make additional improvements in temperature
Many landowners initially did not understand that there are two parts to the temperature standard In addition to the numeric standard there is also a narrative standard The narrative standard provides for a plan to be developed that identifies the reasonable means to address human-caused impacts to water temperature The 1010 plan meets the requirements of the narrative standard and is recognized as agricultures contribution to the Burnt River TMDL
The Burnt River TMDL will be developed similarly to those in other basins The regulatory portion of the Burnt River 1010 plan for agricultural and rural lands will take into consideration what can be accomplished on the ground given the diversity of conditions Thus the goals of the Burnt River TMDL and the 1010 plan are the same with the 1010 plan focusing on how to get to what is reasonable given practical economic and social considerations
Scientific Disagreements Most environmental interests feel that vegetative shade is the most important factor in lowering stream temperatures Many Burnt River landowners are not convinced of the importance of vegetative shade and feel that air temperature and other environmental factors have a greater influence often rendering attempts at lowering stream temperatures with shade ineffective especially at lower elevations Landowners believe that main stem flows are cooler with Unity Reservoir (because of greater volume) than they would be without it However with extremely low inflow the reservoir is in essence a stagnant pool during the summer with releases (from the bottom of the pool) often exceeding 70 ordmF Most landowners believe that these summertime releases are the primary contributor to main stem temperatures that exceed the temperature standard They also believe the primary problem on the North Fork is nearly nonexistent flows during the summertime
Most in the environmental community feel that if mistakes are to be made one should err on the side of assuming too much potential initially so as to achieve as much as possible Some Burnt River landowners fear that when the TMDL is developed for the Burnt River inhibiting factors will not be taken into account when making estimates of site potential for vegetation and shade If that happens they feel that one unachievable goal (the 64 degF criterion) will be replaced by another ndash goals for vegetation will be developed that are just as impossible to reach as the goals for temperature
Socioeconomic Some landowners feel that they are assumed to be guilty of degrading water quality until proven innocent and the burden of proof rests with them They feel that they are being told what to do instead of having the freedom of finding their own solutions They also perceive that they are being asked to achieve a goal that can never be attained and once they give in to that process they put their financial livelihoods at risk
23
Use of Surrogates Although the Burnt River participants could not agree on a temperature surrogate for the Burnt River subbasin they did agree that surrogates in some form needed to be used in 1010 plans TMDLrsquos and 1010 plans developed in Oregon to date have dealt with temperature surrogates not temperature units however the conditions discussed in 1010 plans are not commonly called surrogates The TMDLrsquos developed to date have identified a number of surrogates that could be used in controlling stream temperatures but only vegetation and its related effective shade has been used in load allocation The surrogate goals developed in the TMDL process define conditions on the ground that would have to be achieved if load allocations are to be met The water quality management plan including the 1010 plan describes how those conditions will be achieved ODA believes that 1010 plans should focus on attainable improvements defined in surrogates (leaving the choice of practices to achieve those improvements up to individual landowners) and then whatever temperature results from those improvements would reflect what is reasonable and practical Some felt that attainable surrogates could be defined with the help of resource sites that could be identified as a standard as well as the use of master ranchers who could demonstrate resource capability
Study participants discussed the need to translate surrogates into 1010 plan elements such as actions and prohibited conditions but developed no recommendations Some agricultural representatives wanted to see prevention and control measures focused on things that could be fixed where landowners could see actual improvements There was also considerable discussion of the need to make objectives clear and measurable and developed with respect to a specific time frame However there was an awareness of landowner resistance to this type of approach in a regulatory environment
Feasibility Those contributing to non-point source pollution are responsible for implementing feasible improvements Feasibility is defined in Oregon Administrative Rule as a function of ldquohellipa site-specific balance of the following criteria protection of beneficial uses appropriateness to local conditions use of best treatment technologies or management practices or measures and cost of compliancerdquo71 Some study participants felt that if these criteria were followed increasing shade from 1 percent to the estimated site potential of 5-7 percent on the main stem would not be feasible This is based on the estimate that a 5-7 percent shade impact on stream temperature would be minimal and would be of little or no benefit to fish There was no agreement in the group on this issue
The relationship of feasibility to money and time and the tradeoff between the two was discussed Only so many dollars are available at any given time but given more time more changes are possible There was also some discussion of social factors that may limit the achievement of site potential For example many individuals in the Burnt River subbasin believe that the majority of stream heating is due to natural factors and that solutions such as shading the stream are not effective Landowners are also reluctant to take action to improve temperature unless it can be shown that the changes will have a positive impact on aquatic communities Even some fish
24
biologists argue that if only small amounts of fish are produced in relation to expensive improvements those improvements may not be justifiable
Measures of Progress Study participants discussed means of measuring progress The DEQ was interested in measures of interim progress the ODA talked about the need for stepwise approaches to the temperature standard and OSU thought measures might be developed around vegetative recovery rates No recommendations were developed
Burnt River 1010 Plan The ODA with the assistance of a local water quality management area advisory committee is preparing a 1010 plan which they expect to complete in 2002 The 1010 plan will identify conditions associated with agricultural lands that can contribute to water quality problems and outline a strategy that will include education enforcement and monitoring to mitigate those problems The intent of 1010 is to provide a clear role for ODA to assist and advise producers in watersheds known to have water quality problems to prevent pollution problems wherever possible and to alleviate any existing problems
Typically 1010 plans are being developed prior to the development of a TMDL because of agricultures and the states desire to be proactive For the Burnt River subbasin DEQ is scheduled to begin work on the TMDL in 2005 After the TMDL is developed ODA (with the assistance of the local water quality management area advisory committee) will evaluate the Burnt River 1010 plan in light of the TMDL and make any changes necessary The 1010 plan then becomes the TMDL agricultural implementation plan and is part of DEQs overall management plan that describes the strategy for achieving the TMDL for that basin
25
FUTURE RESEARCH
Study participants did not develop a set of recommendations for further research in the Burnt River This section contains suggestions that were made throughout the course of the study that might be pursued in other basins or at some later date in the Burnt River
Objective 1 Factors Contributing to Stream Temperatures In general study participants agreed on the processes that involve the transfer of heat energy and the stream characteristics that are important to temperature Further investigations that might improve the understanding of these processes are listed below
Burnt River
bull Identify and measure surface return flow sites on the main stem and South Fork
bull Perform flow and temperature analyses with and without Unity Reservoir
bull Study spring water temperatures by elevation to show how source water temperatures change by elevation
General
bull Identify the relationship between PFC and water temperature Currently measurement techniques are not fine enough to measure differences across short reaches
bull Test the hypothesis that summer stream temperatures cannot be maintained below 64 ordmF at elevations below 4500 feet in eastern Oregon unless there are significant cool groundwater inputs72
bull Develop regression equations for predicting water temperatures in other watersheds based on hydrology climate water quality parameters elevation etc73
bull Develop heat budgets on tributary streams Compare these with main stem heat budgets to better assess the impacts of atmospheric radiation
Tools
bull Models o Develop performance criteria for temperature models o Compare the Fish and Wildlife Service SNTemp Model with DEQrsquos Heat Source
Model o Compute present and potential shade using DEQrsquos approach o Use the shade function in the SNTemp Model where there is enough actual or
potential shade to justify its use
26
bull Forward Looking Infrared Technology (FLIR) ndash Consider using (FLIR to identify areas of stream heating
Objective 2 Temperature Management Alternatives Several areas of research associated with potential temperature management alternatives were discussed
bull More research on headwater streams with more shade (narrower channels more vegetation less atmospheric heating)
bull Riparian Vegetation o Map ecological sites o Identify resource sites as standards o Explore the possible introduction of taller species o Study canary grass control o Evaluate reservoir operations for propagating riparian vegetation
bull Irrigation return flows ndash assess options for o Controlling surface return flows o Enhancing cold water inputs
bull Channel o Identify areas where width might be reduced with changed riparian management o Gather more cross-section data to show how channelized sections could be changed o Consider effects of evolution to e-type stream eg on willows reed canary grass
bull Develop a water pollution reduction crediting system
Objective 3 Develop and Test a Surrogate The following items were discussed as steps to be taken in the development and testing of candidate temperature surrogates
bull Develop candidate surrogates and test them on site
bull Define feasibilityDevelop costbenefit analyses of management practices
bull Identifyget buy-off on attainable improvements
bull Define surrogates in terms of 1010 plan elements with clear measurable goals
bull Identify a time frame for accomplishment with measures of interim progress
27
BIBLIOGRAPHY
Adams T and K Sullivan 1989 The Physics of Forest Stream Heating a Simple Model Weyerhaeuser Research Report TFW-WQ3-90-007
Beschta et al 1987 Stream Temperature and Aquatic Habitat Fisheries and forestry interactions pp 191-232 In EO Salo and TW Cundy (eds) Streamside Management Forestry and Fisheries Interactions Institute of Forest Resources Contribution No 57 University of Washington Seattle
Beschta R L and R L Taylor 1988 Stream Temperature Increases and Land Use in a Forested Oregon Watershed Water Resources Bulletin February Vol 24 No 1 19-25
Bliss Tim 2001 Burnt River Water Quality Study Final Report Review Comments Wallowa Whitman National Forest Baker City Oregon
Boyd Matthew S 1997 Thermodynamic Stream Relationships and Management Practices Oregon Department of Environmental Quality Portland
Boyd Matthew and Debra Sturdevant 1997 The Scientific Basis for Oregon=s Stream Temperature Standard Common Questions and Straight Answers Oregon Department of Environmental Quality Portland
Brazier J R and G W Brown 1973 Buffer Strips for Stream Temperature Control Research Paper 15 Forest Research Laboratory School of Forestry Oregon State University Corvallis
Brown G W and J T Krygier 1967 Changing Water Temperatures in Small Mountain Streams Journal of Soil and Water Conservation November-December Pp 242-244
Brown G W and J T Krygier 1970 Effects of Clear-cutting on Stream Temperature Water Resources Research Vol 6 No 4 1133-1139
Brown G W G W Swank and J Rothacher 1971 Water Temperature in the Streamboat Drainage USDA Forest Service Research Paper PNW-119
Crowe Elizabeth 2001 Comments on Vegetative Site Capability for Burnt River Water Quality Study Deschutes National Forest Bend Oregon
Crowe Elizabeth and R Clausnitzer 1997 Midmontane wetland plant associations of the Malhuer Umatilla and Wallowa-Whitman National Forests USDA Forest Service R6-NRshyECOL-TP-22-97
Donato Mary 2002 An Empirical Predictive Stream Temperature Model for the Salmon and Clearwater River Basins Idaho US Geological Survey Water Resources Investigation Report 2002-xxxx (in press)
28
Duncan David 1999 Defining a Surrogate David Duncan and Associates Boise Idaho
Edinger J E D K Brady and J C Geyer 1974 Heat Exchange and Transport in the Environment Report No 14 Electric Power Research Institute Publication No 74-049-00-34
Hidore JJ and J E Oliver 1993 Climatology ndash An Atmospheric Science Macmillan Publishing Company New York New York Pp 23-65
Independent Multidisciplinary Science Team 2000 Influences of Human Activity on Stream Temperatures and Existence of Cold-water Fish in Streams with Elevated Temperature Results of a Workshop ndash Technical Report 2000-2 Corvallis Oregon
Jaindl Ray 2001 Recommendation to Burnt River Steering Committee at their September 21 meeting Salem Oregon
Larson Larry and Michael Borman 2000a Use Attainability Assessment (Temperature Standard) Burnt River Watershed Rangeland Resources Department Oregon State University Corvallis
Larson Larry and Michael Borman 2000b Use Attainability Assessment (Temperature Standard) Burnt River Watershed ndash Appendix A ndash Burnt River Shade Soil Temperature and Groundwater Recharge Estimates A First Approximation Rangeland Resources Department Oregon State University Corvallis
Larson Larry and Michael Borman 2000c Use Attainability Assessment (Temperature Standard) Burnt River Watershed ndash Appendix B ndash Elevation Thermal Environment and Stream Temperature on Headwater Streams in Northeastern Oregon Rangeland Resources Department Oregon State University Corvallis
Larson Larry and Michael Borman 2001 Summary Document Burnt River Research 1998-2000 Rangeland Resources Department Oregon State University Corvallis
Leonard Stephen G 2001 Burnt River Site Capability Review National Riparian Service Team Bend Oregon
McRae G and C J Edwards 1994 Thermal Characteristics of Wisconsin Headwater Streams Occupied by Beaver Implications for Brook Trout Habitat Transactions of the American Fisheries Society 123641-656
Mangelson Kenneth 2000a Burnt River Basin Water Temperature Modeling Study Draft Final Report U S Department of the Interior Bureau of Reclamation Technical Service Center Denver
Mangelson Kenneth 2000b Burnt River Basin Correlation Tables U S Department of the Interior Bureau of Reclamation Technical Service Center Denver
Mangelson Kenneth 2000c Summary Description of Burnt River Modeling Runs to Assess the 29
Impacts of Variations in Air Temperatures and Solar Radiation U S Department of the Interior Bureau of Reclamation Technical Service Center Denver
Mangelson Kenneth 2001a Burnt River Basin Water Temperature Modeling Study Final Report U S Department of the Interior Bureau of Reclamation Technical Service Center Denver
Mangelson Kenneth 2001b Technical Memorandum Water Temperature Computer Modeling Runs for Different Global Shade Estimates than were used in the Final Report U S Department of the Interior Bureau of Reclamation Technical Service Center Denver
Neiburger Morris James G Edinger and William D Bonner 1982 Understanding our Atmospheric Environment WH Freeman San Francisco
Nichols Richard 2001 DEQ Review Comments of Draft Final Report Dated April 2001 Department of Environmental Quality Bend Oregon
Risley John Edwin Roehl and Paul Conrads Estimating maximum Water Temperatures in Small Streams in Western Oregon Using Neural Network Models US Geological Survey Water Resources Investigation Report 2002-xxxx (in press)
Shortley George and Dudley Williams 1961 Elements of Physics for Students of Science and Engineering Prentice-Hall Englewood Cliffs N J
Ward JV 1985 Thermal Characteristics of Running Waters Hydrobiologia 12531-46
30
NOTES 1 MOU Participants Oregon Dept of Environmental Quality Oregon Department of Agriculture Burnt River Irrigation District Powder Basin Watershed Council Bureau of Reclamation Snake River Area Office Oregon State University College of Agricultural Sciences Environmental Defense Oregon Farm Bureau Federation Oregon Department of Fish and Wildlife Natural Resources Conservation Service Wallowa Whitman National Forest Bureau of Land Management Vale District Oregon State University Extension Service Oregon Water Resources Department Oregon Water Resources Congress Burnt River Soil and Water Conservation District Most of the participating agencies and organizations provided members for a steering committee and a technical committee that were established for oversight2 In 1997 the Oregon Legislature adopted Senate Bill 1010 authorizing the Oregon Department of Agriculture to develop and carry out an agricultural water quality management area plan for agricultural and rural lands where a water quality management plan is required by state or federal law Local water quality management area advisory committees are established to participate in the development and ongoing modifications of the plan These plans ldquofor the prevention and control of water pollution from agricultural activities and soil erosion in a management areahelliprdquo(OAR 603-095-0010(5)) are commonly referred to as ldquo1010 plansrdquo ODA administrative rules (OAR 603-090-0030) state that 1010 plans ldquohellipshall describe a program to achieve the water quality goals and standards necessary to protect designated beneficial uses related to water quality as required by state and federal lawrdquo3 MOU Bureau of Reclamation MOU No 1425-8-MU-10-02170 MOU objectives listed in italics at the beginning of each section of the current report4 Technical Reports Larson Larry and Michael Borman 2000a 2000b 2000c 2001 Mangelson Kenneth 2000b 2001a 2001b 5 Environmental Defense Statement The Burnt River Water Quality Study (BRWQS) was initiated in 1998 in an attempt to identify consensus-based actions to improve stream temperature conditions in the Burnt River Basin Environmental Defense=s principal interests in agreeing to participate as a MOA signatory in the BRWQS initiative were in the exploration of alternatives to the temperature standard that could yield better stream health results in the identification of alternative ways that landowners management activities could enhance stream health and in implementing acceptable and low cost incentives for encouraging such land management activities During the ensuing nearly three years of the BRWQS=s process Environmental Defense expressed concerns about the lack of appropriately structured peer reviews of research and studies and the lack of linkages of the project=s research to problem-solving policies and actions Nevertheless the BRWQS=s direction of work became progressively more narrowly focused than the directions indicated by the goals of the MOA signed by the participants in 1998 These goals related to the identification of a surrogate for the temperature standard and the incorporation of the BRWQS project=s work into the agricultural water quality management planning process (1010 plans) for the Burnt and by example the 1010 planning process for other Oregon river basins with temperature problems While some discussion of these goals did occur in BRWQS meetings the BRWQS=s focus became a set of loosely connected technical studies with an ongoing and ad hoc set of reviews These reviews benefited from the experience and expertise of a number of knowledgeable individuals some of who are employed by state or federal agencies At the same time many of these agencies are also stakeholders in the policy-related issues and problems that were to be addressed by the BRWQS In such cases compliance with one criterion for credible research peer reviews -- that reviewing entities have disinterested third-party status -- was problematic Many of the studies conducted as part of the BRWQS=s process addressed relevant issues At the same time Environmental Defense did not envision as a MOA signatory that these studies were to become the principal product of the BRWQS project Environmental Defense continues to support research efforts but we expect such efforts to be undertaken to produce some utility in or to have applicability to the implementation of problem-solving actions In our judgment the BRWQS project has not identified significant and tangible directions or recommendations that will be useful in problem solving with regard to temperature problems in the Burnt River or in other river basins in Oregon or elsewhere Environmental Defense views the BRWQS project as having produced some interesting exchanges of views and information but at the same time falling short of achieving its main objectives6 Reclamation modeled a main stem reach from Unity dam to the head of the Burnt River canyon using the SNTEMP stream temperature model originally developed for and maintained by the U S Fish and Wildlife Service Reclamation assessed model performance based on predictions of stream temperature at the validation stations on the Burnt River during the calibration and verification tests given measured climatological and flow data Findings (1) The pattern
31
and magnitude of ditch diversions and return flows were critical in calibrating the computer model Initial estimates of the timing and rates of irrigation diversions and return flows were modified in the model applications in order to accurately predict instream temperatures (2) The calibrated model performed very well in predicting mean daily water temperatures in comparison with the measured temperatures but the predicting of maximum daily instream temperatures was not as accurate (3) Prediction of maximum daily instream temperatures was improved through the development of regression equations Regression equations were developed using climatic variables flows and mean daily instream temperatures computed by the calibrated model runs and were found to accurately predict maximum daily instream temperatures thoughout the modeling reach except for the stream reach near the dam which is most affected by reservoir outflows 7 The organization of this section and much of the theoretical discussion is based on Boyd and Sturdevant 1997 8 Based on Mangelson 2001a Figures B-8 D-7 and E-4 9 Based on Mangelson 2001a Figures B-14 D-9 and E-610 Based on Mangelson 2001a Figures B-13 D-8 and E-5 11 Independent Multidisciplinary Science Team 2000 p 8 12 Independent Multidisciplinary Science Team 2000 p 23 13 Independent Multidisciplinary Science Team 2000 p 21 Quote taken from Beschta et al 1987 14 Boyd and Sturdevant 1997 15 Neiberger Edinger and Bonner 1982 p 65 16 Mangelson 2001a p iii Boyd and Sturdevant 1997 p 6 17 Based on Boyd and Sturdevant 1997 p 7 and Mangelson 2001a Figure 15 ff p 47 18 Data equations and graphs for other July days are reported in Mangelson 2001a Appendix L 19 Actual shade values were not measured but are somewhat higher Therefore the values for both solar and atmospheric radiation are very slightly overestimated20 Mangelson 2001a Appendix L Burnt River Hourly Heat Flux for Station BR-CP near Durkee for July 14 1999 21 Based on Mangelson 2001a Appendix L Burnt River Hourly Heat Flux for Station BR-CP near Durkee for July 14 1999 22 Mangelson 2001a Appendix C Mangelson 2000b 23 Mangelson 2001a Appendix L The equation for atmospheric radiation is HA = (1-SA)(1+017bullCL
2) (336+0706bull(Rhbull1064TA)12)(10-8bull(TA+27316)4) where HA = atmospheric radiation (Jm2sec) SA = atmospheric shade factor (decimal) CL = (1-SSo)35 = cloud cover (decimal) S = actual sunshine So = optimal sunshine SSo = sunshine ration (decimal) ea = vapor pressure = Rhbull(660bull(1064TA))(mb) Rh = relative humidity TA = air temperature S and So were estimated based on weather station solar and rainfall data All other parameters are based on actual weather station data 24 Mangelson 2000c These findings are based on taking real temperature data and varying them hypothetically while keeping all other variables constant ndash a condition that would not occur in nature The air temperatures modeled would not occur on a regular basis in nature25 Mangelson 2001a Appendix L 26 Reclamation felt attaining 50 percent shade was not possible given the width and soil conditions on the main stem but some participants did not agree27 Brown et al 1971 Beschta and Taylor 1988 Brown and Krygier 1967 and 1970 and Brazier and Brown 1973 28 Brown et al 1971 29 Adams and Sullivan 1989 30 McRae and Edwards 1994 31 Mangelson 2000c These findings are based on taking real solar radiation data and varying them hypothetically while keeping all other variables constant ndash a condition that would not occur in nature The solar radiation modeled would not occur on a regular basis in nature32 Data collected by the Forest Service in 1990-91 showed North Fork Burnt River temperatures ldquomirroring air temperature ndash about 68-70 degF in cool cloudy misty weather and about 78 degF in warm clear weatherrdquo (Bliss 2001) 33 Mangelson 2001a Appendix L Burnt River Hourly Heat Flux for Station BR-CP near Durkee for July 14 1999 34 Shortley and Williams 1961 p 347 35 Boyd and Sturdevant 1997 p 7 36 Data collected by Art Kreger (Wallowa-Whitman National Forest soil scientist) showed mean summer soil temperatures at 20 inch depth in the Burnt River subbasin varying from 38 to 48 degF above 5000 feet on north slopes and above 6000 feet on south slopes Mean soil temperatures were between 54-64 degF below 3000 feet on north slopes and
32
4000 feet on south slopes (Bliss 2001)37 Ward 1985 38 Adams and Sullivan 1989 39 Ward 1985 40 Independent Multidisciplinary Science Team 2000 p 21 41 Mangelson 2001a p iii 42 Boyd and Sturdevant 1997 p 16 43 Reclamation felt that narrowing the channel by 30 percent would not practically occur but some participants felt the channel might be narrowed appreciably from its present width if allowed to evolve toward its potential44 Boyd and Sturdevant 1997 p13 45 Leonard 2001 p2 Crowe 2001 p 2 46 Crowe 2001 p1 Leonard (2001 p2) also states that ldquo[t]he Burnt River from near Unity Reservoir to the canyon near Bridgeport does not exhibit characteristics conducive to cottonwood regenerationrdquo47 Leonard (2001 p2) points out that ldquo[c]ottonwoods may grow in this segment if planted but it is highly unlikely that there would be recruitment from seed 48 Based on Mangelson 2001a Figures B-7 and D-8 49 Based on Mangelson 2001a Figures B-8 and D-9 50 Larson and Borman 2000 pp 3-10 51 Crowe 2001 p 2 At the time of her review Elizabeth Crowe was an Area Ecologist with the Central Oregon Interagency Ecology Group She had previously been an ecologist with the Wallowa Whitman National Forest and had extensive experience in the Burnt River She has published a guide to the plant communities of the Blue Mountains (Crowe and Clausnitzer 1997)52 Three types of willow species are found in Burnt River riparian areas (Coyote Booth and Yellow) Leonard (2001) provided two estimates of Coyote Willow heights (2-3 meters and an average of 87 feet) Crowe (2001) found Coyote Willow to grow to 6 feet in the Blue Mountains and Central Oregon Leonard (2001) provided two estimates of Booth Willow height (2-4 meters and 3-5 meters) Crowe (2001) estimated Booth and Yellow willow to grow to heights between 8 and 13 feet in the Blue Mountains and 7 to 75 feet in Central Oregon53 Crowe 2001 p1 54 At the time of his review Steve Leonard was a Bureau of Land Management ecologist on the National Riparian Service Team Leonard participated in the 1998 interagency Proper Functioning Condition Assessment of the Burnt River 55 Leonard 2001 p2 56 Crowe 2001 p 3 57 Crowe 2001 p4 58 Estimates are contained in Mangelson 2001b p 5 Methodology is discussed in Larson and Borman 2000 pp 3shy10 59 Mangelson 2001b p 5 60 DEQ staff have done quick estimates of effective shade for the modeled reach ldquohellipthat include low end estimates similar to those reported here and high end estimates up to 50 percentrdquo (Nichols 2001 p5)61 Mangelson 2001b p 3 62 When surface water temperatures exceed 64 degF (on a seven day average maximum) in streams where salmonid fish rearing is designated as a beneficial use no measurable surface water temperature increase from human activities is permitted without a DEQ-approved temperature management plan (Oregon Administrative Rules 340-41-725(2)63 Oregonrsquos stream temperature standard is made up of two components (1) the numeric criteria (which includes the 64 degF criterion for salmonid rearing) identified in basin standards which trigger actions to be taken when stream temperatures rise above these criteria and (2) the rule language which puts the criteria in context and explains what constitutes a violation and what needs to happen when a violation occurs The water temperature standard for the Burnt River is described in Oregon Administrative Rules (340-41-765)64 The temperature standard can be satisfied by having an approved water quality management plan in place even if the plan shows that the 64ordmF criterion cannot be met65 The Burnt River study addressed temperature only and did not take into consideration any other parameter such as sediments nutrients or bacteria nor did it evaluate the effect of a decline in existing riparian vegetation on water quality66 Jaindl 2001
33
67 At the beginning of the study agricultural interests were interested in pursuing a prototype healthy streams standard but they abandoned that effort because they felt that the U S Environmental Protection Agency would not support it68 U S Environmental Protection Agency 69 The Total Maximum Daily Load (TMDL) is the total amount of pollutant that can enter a water body without violating water quality standards The TMDL process assesses what is causing temperature standard exceedances (point non-point and background sources) and determines what pollutant loadings must be met to achieve standards (OAR 340-41-026 (3) (a)(D)(ii)70 If a temperature criterion is not being met in a given stream section 303(d) of the Clean Water Act (CWA) requires that the state place that stream on a 303(d) list of water quality limited steams and complete a TMDL The main stem below Unity Dam and the North Fork are currently listed on DEQrsquos 303(d) list as water quality limited for temperature71 OAR 340-41-026(3)(a)(D)(ii) 72 Recent studies done by the US Geological Survey in cooperation with the Oregon and Idaho Departments of Environmental Quality (Donato 2002 Risley et al 2002) have used elevation to estimate ldquonaturalrdquo water temperatures73 The US Geological Survey and the Idaho Department of Environmental Quality (Donato 2002) have developed regression equations to predict stream temperatures in the Salmon and Clearwater basins of Idaho Grand averages have been developed using watershed area elevation and slope and then daily averages have been predicted using a seasonal adjustment factor and air temperature
34
APPENDIX A --PARTICIPANT COMMENTS
Objective 1 Factors Contributing to Stream Temperatures
Environmental Defense
Objectives Achieved
bull Identified physical conditions influenced by human activities (vegetation surface and groundwater flows channel shape sinuosity entrenchmentflood plain connection structures such as reservoirs and diversion dams)
bull Surveyed literature and other water quality planning in Oregon to identify three important factors (stream surface shading flow volume channel width and depth) for managing instream water temperatures
bull Commenced with development of a modeling system (Stream Network Temperature Model plus input data and assumptions) for use in evaluating the relative sensitivity of water temperatures to changes in physical conditions (eg channel shape surface shading)
Objectives Not Achieved
bull Did not identify the relationship between properly functioning conditions (PF C) assessments and water temperature management
bull Did not develop performance criteria for the modeling system or to conduct a performance
evaluation of the modeling system
Objective 2 Temperature Management Alternatives Environmental Defense
Objectives Achieved
bull Commenced with development of a modeling system (Stream Network Temperature Model plus input data and assumptions) for use in evaluating the relative sensitivity of water temperatures to changes in physical conditions (eg channel shape surface shading) and management practices (eg surface flow reduction vegetation propagation)
bull Assessed the potential for increasing stream surface shade through vegetation management
Objectives Not Achieved
bull Did not develop performance criteria for the modeling system or to conduct a performance evaluation of the modeling system Consequently no scenarios (ie variations of physical
A-1
conditions and management practices) were developed to model and conduct both local and global sensitivity analyses to estimate the relative effectiveness (in terms of costs versus benefits) of changing physical conditions through management practices to reduce peak instream temperatures
bull Did not determine what management practices are feasible by building consensus on the definition of feasible and evaluating the potential utility of management practices deemed feasible in terms of the anticipated costs versus benefits
bull Did not consider or develop a water pollution reduction crediting system for landowners voluntarily implementing management practices
Objective 3 Develop a Surrogate Environmental Defense
Objectives Accomplished
bull Discussed a conceptual definition of a surrogate in terms of measures of physical conditions and management practices including vegetation irrigation return flows instream flows cold water refugia channel width sinuosity and PFC assessments
bull Discussed defining a surrogate in terms of a Healthy Streams Standard
bull Developed a seven-part surrogate definition and implementation process that includes (1) establishing the existing physical conditions of each measure (2) defining the peak potential of each measure (3) identifying factors inhibiting ultimate attainment of peak potential (4) establishing g oals that incorporate peak potential and inhibitions (5) defining existing conditions or actions that would be prohibited (6) implementing a monitoring program (7) reviewing all goals definitions and conclusions based on information gathered during implementation
Objectives Not Accomplished
bull Did not reach a consensus on the feasibility of any candidate temperature surrogates
bull Did not propose one or more ldquopilotrdquo temperature surrogate applications at suitable sites to test the concept in on-the-ground situations
Objective 4 1010 Plan Environmental Defense
Objectives Achieved Developed a Final Report summarizing the lack of consensus on procedural scientific and socioeconomic considerations pertaining to the design of a 1010 plan in the Burnt River Basin
A-2
Objectives Not Achieved Did not produce a Final Report with uniformly credible scientific findings and feasible management actions for consideration and possible incorporation into a 1010 plan for the Burnt River Basin or for guidance in the design of temperature control policies and actions in other river basins in Oregon and elsewhere
A-3
APPENDIX B
SUMMARY DOCUMENT
BURNT RIVER RESEARCH 1998-2000
Larry Larson amp Michael Borman Rangeland Resources Department
Oregon State University
April 4 2001 Final report
(revised July 19 2001)
B-1
INTRODUCTION
Thermodynamic laws state that the temperature of an object will spontaneously trend toward the temperature of the surrounding thermal environment (Halliday and Resnik 1988) Temperature difference and exposure time influence this process In the study of water temperature the concept of an equilibrium temperature is used to describe the response of water temperature to meteorological conditions (Edinger et al 1968) The equilibrium temperature is a dynamic number that reflects change in the sum of the radiation conduction and evaporation processes primarily at the water-air interface
Studies were undertaken to evaluate factors that could influence how fast stream temperatures approach thermal equilibrium and influences that could occur after a thermal equilibrium was achieved The studies provide a description of vegetation site potential and associations between headwater elevation weather and land use to observed patterns of stream temperature
VEGETATION SITE POTENTIAL
A study was conducted to provide an initial estimate of the shade potential along the Burnt River The following is an illustration of the geomorphic soil and vegetation patterns that occur along the river between Unity Reservoir and Bridgeport
Geomorphic Soil and Ecological Site Complex
Four ecological sites (Laird et al 1988) dominate the river reach between Unity Reservoir and Bridgeport (wet meadow meadow loamy bottom and sodic meadow) Their occurrence upon the landscape is closely associated with geomorphic surfaces and soils (figures 1-3) The youngest geomorphic surface in the Burnt River valley is called Horseshoe It forms the lowest flood plain and is subject to annual flooding The surface includes channel point bars channel fillings and abandoned meanders The Horseshoe surface is the primary zone of scouring and deposition and is subject to rapid landscape changes due to the abandonment of older channels lateral migration of meanders and downstream movement of alluvial deposits The soil survey describes these young surfaces as Riverwash Fluventic and Fluvaquentic Haploxerolls The next floodplain Ingram is slightly higher than the Horseshoe The soils are more developed and ecological sites have been described within the current soil survey Ingram provides an undulating surface that defines over-bank channeling during flood stage Textures within the Ingram surface will tend to become finer as you move upslope away from the channel Annual flooding is common on the Ingram surface and soils tend to be moist for extended periods forming wet meadow communities over Cumulic Haplaquolls (Boyce and Wingdale soils) in lower areas and meadow communities over Fluvaquentic and Pachic Haploxerolls (Balm and Wingville soils) on elevated surfaces Localized areas within this zone are affected by salt accumulation that has occurred over geologic time These salt-affected surfaces form Typic Haplaquepts (Baldock and Haines soils) which support sodic meadow communities The oldest surface associated with the Burnt River flood plain is called Winkle The surface forms a series of benches and terraces that are remnants of abandoned flood plains Winkle is an undulating surface that provides a variety of local elevation differences
B-2
Flooding in this zone varies from common to infrequent reflecting the elevation pattern of the surface Soils formed on these surfaces tend toward Cumulic and Pachic Halpoxerolls (Jett and Powval soils) or Xerollic Camborthids (Legler soil) which support Loamy bottom communities
The Occurrence of Willow
A fifth ecological site (NRCS 2000) called willow riparian (Booth willow) also occurs within the Hereford reach The willow riparian site forms linear galleries within the Horseshoe surface and localized inclusions within the other ecological sites Dominant willow species for this ecological site include Booth yellow and coyote willow Each species is described as an obligate wetland indicator tolerating some but not prolonged flooding above the root crown and being associated with a water table that drops during the growing season but remains within reach of the root system (Crowe and Clausnitzer 1997) Booth and yellow willow are root crown sprouters that produce a multi-stem treeshrub that is typically less than 15 feet in height Coyote willow sprouts from a creeping root system forming a thicket of single stemmed shrubs Thicket height typically ranges from 5-10 feet Establishment (seed) for each of these species is closely associated with river channel scouring and deposition Booth and yellow willow will tend to be associated with fine sand and silt deposition Soils supporting these species generally contain redoximorphic features several feet below the soil surface Coyote willow on the other hand is normally associated with sandy to skeletal deposits and sites that lack redoximorphic features Seedling establishment for all three species is closely associated with the exposure of fresh mineral deposits that are free of competition and remain moist during initial establishment In addition to seed establishment these species may also become established through the burial of detached limbs and the deposition of plants dislodged from upstream locations during flood events
Integration
Channel scouring and deposition is the principal means by which colonization sites are created for willow in the Hereford reach Substrate size as well as the timing and patterns of substrate deposition will greatly influence willow establishment The Horseshoe surface provides the greatest opportunity for scouring deposition and colonization Additional colonization may occur within the Ingram surface if the deposition remains moist and free of competition during seedling establishment Suitable Ingram surfaces currently support sedge rush and grass communities that rapidly re-colonize areas of deposition following flooding
The majority of the river in the Hereford reach has evolved into an E channel (Rosgen 1996) Its flat gradient and flood plain are dominated by wet meadow and meadow communities In most areas fine sediment deposits are a minimum of 3 feet deep This can generally be interpreted to mean that the channel is no longer recruiting large amounts of gravel into this portion of the valley Lateral channel movement continues to rework existing deposits exposing them and providing sites for plant colonization Alluvial bars are being formed from materials ranging in size from silt and fine sand to gravel Herbaceous colonization increases as the texture of these bars tends toward finer particle sizes Conversely bars dominated by gravel tend to provide a greater opportunity for colonization by species such as coyote willow Overflow channels swales and depressions that occur in the immediate vicinity of the channel may accumulate deposits of silt and fine sand that are of sufficient depth and size to slow re-colonization by herbaceous species When this occurs the potential for establishing Booth and yellow willow is increased
B-6
Findings
The following river shade estimates reflect the availability of substrates commonly associated with the colonization of woody species in riparian areas For the purposes of this study percent shade is defined as the percent of water surface over which direct solar radiation is intercepted by vegetation between 1000 am and 200 pm
APPROXIMATE AMOUNT AND RIVER SHADING ALONG THE MAINSTEM COMMUNITIES OF THE BURNT RIVER
Hereford 2 Durkee3
COMMUNITY 1 MILES SHADE MILES SHADE
Wet meadowmeadow (no gravel) 214 3-4 15 2-3
Loamy bottom 06 2-3 130 1-2
Wet meadowmeadow (gravel) 45 4-5 30 4-5
Riverwash 23 13
Channelized Meadow (no gravel) 15 1-2
Sodic meadow 15 1
Sodic meadow 07 1
1 Community refers to NRCS ecological site description 2 Hereford refers to the Burnt River between Unity Reservoir and Bridgeport 3 Durkee refers to the Burnt River between the canyon mouth above Durkee downstream to Lime The canyon between Bridgeport and Durkee is not included in this table
HEADWATER
A number of literature references indicate that headwater sources reflect the temperature of the thermal mass from which they originate (Ward 1985 Meisner et al1988 Raphel 1962 Adams and Sullivan 1989 McRae and Edwards 1994) When headwater sources contribute significant cold or cool water to a stream their contribution will depress the diurnal range of stream temperature In addition these waters typically show a higher rate of temperature change due to large differences between equilibrium and headwater temperatures
B-7
Study Results ndash Headwater
Average soil temperature at 1-ft depth in August at 6000 ft is 50 F
Headwater data (August 1999) - Barney and Stevens Creeks1
Barney Stevens
Elevation 7150 ft 6600 ft
Source temp 375 F 40 F
Distance to 6000 ft elev 6200 ft 2450 ft
F increase500ft distance 10 09
F increasehr 16 13
Average Velocity 02 fs 02 fs
Average depth 35 in 30 in
Exposure time 85 hr 34 hr
6000 ft temperature 515 F 445 F
1 Water temperatures at source and 6000 ft are rounded to the nearest 05 F
Elk Creek headwater source was not studied However side channel data and field observations note that side channels enter the main stream at 5900 and 5600 ft elevations Their combined contribution is equal to frac12 of the stream flow and enters the stream approximately 3 F cooler then the main channel Field notes indicate that saturated soils and seeps occur in several locations downstream and are more frequent than on any other stream studied
Findings
Based upon headwater temperatures Barney and Stevens Creeks appear to originate from snowmelt that has moved subsurface to the spring sources Barney Creek springs are located at about 7200-ft elevation and temperatures ranged from 374 to 385oF Stevens Creek spring is at nearly 6700-ft elevation and temperatures ranged from 388 to 417oF To reach the spring source from snowmelt water traveled further subsurface to reach Stevens Creek than to reach Barney Creek The thermal environment of the soil appears to have been warmer than the initial snowmelt temperature of the water and to have had a warming effect
Water temperature differences between Barney and Stevens Creeks at the 6000-ft elevation appear related to exposure time differences Barney Creek exposure time was 25 times longer than Stevens Creek At 6000-ft elevation average monthly mean water temperatures were
B-8
493oF (July 1999) to 543oF (July 1998) for Barney Creek and 430oF (July 1999) to 453oF (July 1998) for Stevens Creek
ELEVATION
Elevation differences exert a strong influence on the thermal regime of running water (Ward 1985 Meisner et al 1988 Raphel 1962 McRae and Edwards 1994 Larson and Larson 1997) Air density decreases with increasing elevation which decreases the insulating effect of air at the Earthrsquos surface Lower air temperatures and water vapor pressure reduce the influence of long-wave radiation at higher elevations As a result of these interactions the thermal environment at higher elevations is characterized by more rapid thermal cycling and less warming Waters observed at different elevations reflect these characteristics Waters flowing down an elevation gradient are subject to temperature equilibrium regimes that are warmer than where they originate
Study Results ndash Elevation
Tests were performed to determine if there was an association between elevation and mean air soil and water temperature Results from these tests showed a strong association between elevation and mean daily air soil and water temperatures Mean daily air soil and water temperatures increased with each 500-ft drop in elevation
Water Data - August 1999 Example
Barney Stevens Elk
6000-ft temperature + range 51 + 5 F 45 + 2 F 45 + 3 F
4500-ft temperature + range 58 + 8 F 57 + 8 F 50 + 4 F
Thermal Gradient
6000 ft 78 F 104 F 108 F
4500 ft 44 F 39 F 88 F
Exposure Time (hr) 7 11 45
Temperature Change (F) 7 12 5
Findings
Mean daily air soil and water temperature increased with each 500-ft drop in elevation The pattern was similar to the adiabatic rate of air temperature change which is 3 - 5 F (17 ndash 28 C) for every 1000 ft (300 m) drop in elevation
B-9
Two years of water temperature data from the four headwaters streams suggested that streams that lack significant cold-water inputs will exceed the water temperature standard at about the 4500-ft elevation during July and August
The convergence of mean daily air and mean daily water temperature indicated that Barney and Stevens Creeks were approaching equilibrium as they dropped in elevation As an example the mean air and water temperature differences (air temperature minus water temperature) during August 1999 were 77 68 50 and 45oF on Barney Creek and 104 86 76 and 40oF on Stevens Creek at 6000 5500 5000 and 4500-ft elevations respectively
Total exposure time (spring sources to 4500-ft elevation) for Barney and Stevens Creeks were similar and likely accounted for much of the similarity in the average monthly mean and maximum temperatures at 4500-ft elevation Barney (58 and 67 oF Aug 1999) had a total exposure time of 155 hr Stevens (57 and 64 oF Aug 1999) had a total exposure time of 144 hr
Elk Creek was delayed in reaching thermal equilibrium with its thermal environment Cold water from the side channels a shorter exposure time (greater stream velocity) and an apparent input of ground water (not measured but based on observed saturated soils along much of the creek) contributed to this delay Additional data collection would be required to determine if thermal equilibrium is achieved on Elk Creek before it joins the flow of the mainstem of South Fork Burnt River
WEATHER INFLUENCE
Water temperature follows but lags behind air temperature (Stefan and Preudrsquohomme 1993 McRae and Edwards 1994 Walker and Lawson 1977 Larson and Larson 1997 Mosheni and Stephan 1999) The similarity between mean air and water temperatures increases as the equilibrium temperature is approached (Adams and Sullivan 1989) At that point daily mean air temperature will be near daily mean air temperature Local air temperature is identified as the single most important parameter influencing daily mean stream temperature (Sinokrot and Stefan 1994 Lewis et al 2000) The air mass is large and exhibits significant temperature swings that can occur on daily seasonal regional and local bases These two characteristics exert a strong influence on the equilibrium temperature
Study Results ndash Headwaters
Tests were performed to determine if a relationship could be determined between monthly air and water temperatures Monthly air temperature differences were associated with significant changes in water temperature Water temperature patterns followed air temperature patterns and reflected the cumulative effect of annual monthly and daily patterns of atmospheric conditions on the equilibrium temperatures of July and August
Further analysis determined that the pattern of monthly temperature differences was not repeated in 1998 and 1999 The lack of a repeated pattern between the two years suggests that
B-10
monthly atmospheric variation had a greater influence on water temperature than did fixed solar patterns
Year Mean Air Temperature Mean Water Temperatures
1998 July 2-4 F gt August July 04-3 F gt August
1999 August 1 F gt July August 0-3 gt July
An exception occurred at 5500 ft elevation on Stevens Creek where mean water temperature was 02 F cooler in July than in August 1998
Study Results ndash Mainstem
Mean daily air water and soil temperatures were determined during July and August in 1998 and 1999 between Unity Reservoir and Clarks Creek Peak air and water temperatures occurred daily between 3 and 4 pm unless climatic conditions disrupted the daily cycle of heating Peak energy accumulation occurs several hours after peak solar radiation When we divided the daily pattern of heating into three 4 hour units air heated most rapidly (30 F) during the first 8 hours of the day (600 am - 200 pm) Water heated most rapidly between 10 am and 2 pm At that time water temperatures generally increased 7 F Water temperatures continued to heat until 3 or 4 pm but the heat accumulation occurred at a slower rate If air temperature accumulation during the first 4 hrs did not approach 14 F then daily water temperature patterns lacked a strong heating pattern Peak soil heating at 1-ft occurred at midnight
Mean JulyAugust temperatures for 199899
Mean + range (F)
1998 1999
Air 66 + 19 65 + 20
Water 66 + 7 65 + 7
Soil 61 + 2 61 + 2
Findings
Monthly water temperature differences in 1998 and 1999 were strongly associated with air temperature differences Water temperature patterns followed air temperature patterns Air and water temperatures were warmer in July vs August 1998 and conversely air and water temperatures were warmer in August vs July 1999
Water and soil temperatures lagged behind air temperatures Air temperature lagged behind peak solar radiation
B-11
Air heated most rapidly during the first 8 hrs of the day Water heated most rapidly between 1000 am and 200 pm When air temperature accumulation did not approach 14oF during the first 4-hr period of the day alon g the mainstem Burnt River daily water temperature patterns lacked a strong heating pattern
River temperatures between Unity reservoir and Clarks Creek were near thermal equilibrium Mean air and water temperatures were nearly equivalent Mean air and water temperatures during July and August were 66oF (1998) and 65oF (1999) Water temperatures typically ranged 7oF above and below the mean and air temperatures ranged 19-20oF above and below the mean
RIVER SEGMENT COMPARISONS
The influence of land use was evaluated by comparing segments of the mainstem that are managed for a specific land use In this case segments of the river approximately 1 mile (16 km) in length were monitored for changes in temperature accumulation in the air water and soil Replicates (2 in 1998 3 in 1999) were monitored during July and August of land managed for 1) hay production followed by winter grazing and 2) grazing using a summer rotation pattern Data collection within each segment of the river was designed to measure the pattern of energy accumulation that took place during 1 hour flow periods
Differences in stream temperature that can be associated with land use should be detectable in the temperature accumulation that occurs within a treatment and the extension of the daily temperature range of the water The data indicated that the water flowing through these treatments had similar (Plt005) amounts of temperature increase (Table 9) No significant difference could be detected in the amount of energy accumulated at the time of daily maximum water temperature the magnitude of the daily water temperature range nor the daily mean water temperature between the treatments compared The accuracy of thermister technology limits data collection to + 04 F (02 C) This means that although an energy accumulation was detected within each mile segment of the river it is not possible to provide an accurate measure of the energy accumulation because it falls below the level of equipment accuracy
Results from this study indicated that each segment of the river accumulated similar amounts of energy regardless of the treatment It is appropriate to state that since no significant differences were observed between river segments land use had minimal effect (non-significant) on the rate of energy accumulation
Findings
Water flowing through hay meadow and summer grazing treatments had similar (Plt005) amounts of temperature increase
Study results indicate that each segment of the river accumulated similar (non-significant) amounts of energy regardless of the treatment
B-12
Land Use
Hay meadows Grazing Winter grazing Summer Rotation
Maximum Temperature
1998 July 07 05 NS
August 02 03 NS
1999
July 06 06 NS
August 04 04 NS
Temperature Range
1998 July 07 04 NS
August 05 05 NS
1999 July 07 05 NS
August 05 05 NS
Mean Temperature
1998 July 04 03 NS
August 02 01 NS
1999 July 03 02 NS
August 02 03 NS
Table 9 Comparison of differences (F) during approximately 1 hour flow time in maximum temperature temperature range and mean temperature during July and August of 1998 and 1999
Shade potential for most of the mainstem Burnt River ranges between 3 and 6
B-13
LITERATURE CITED
Adams T and K Sullivan 1989 The physics of forest stream heating a simple model Weyerhaeuser Research Report TFW-WQ3-90-007
Crowe E A and R R Clausnitzer 1997 Mid-Montane Wetland Plant Associations of the Malheur Umatilla and Wallowa-Whitman National Forests USDA Forest Service Pacific Northwest Region Technical Paper R6-NR-ECOL-TP-22-97
Edinger J E DW Duttweiler and J C Geyer 1968 The response of water temperatures to meteorological conditions Water Resources Research 41137-1143
Halliday D and R Resnick 1988 Fundamentals of physics 3rd ed John Wiley amp Sons Inc New York
Laird W E M H Fillmore G D Macdonald and D P Christenson 1988 Soil survey of Baker County area Oregon USDA NRCS US Gov Print Office WA DC
Larson L and P A Larson 1997 The natural heating and cooling of water Rangelands 196-8
Lewis T E D W Lamphear D R McCanne A S Webb J P Krieter and W D Conroy 2000 Regional assessment of stream temperatures across Northern California and their relationship to various landscape level and site-specific attributes Forest Science Project Humbolt State University Foundation Arcata CA pp420
McRae G and C J Edwards 1994 Thermal characteristics of Wisconsin headwater streams occupied by beaver implications for brook trout habitat Transactions of the American Fisheries Society 123641-656
Meisner J D J S Rosenfeld and H A Regier 1988 The role of groundwater in the impact of climate warming on stream salmonines Fisheries 132-8
Mosheni O and H G Stefan 1999 Stream temperatureair temperature relationship a physical interpretation Journal of Hydrology 218128-141
NRCS 2000 Ecological Site Descriptions Oregon
Raphael Jerome M 1962 Prediction of temperature in rivers and reservoirs J of the Power Division Proceedings of the American Society of Civil Engineers 88157-181
B-14
Rosgen D 1996 Applied river morphology Pagosa Springs CO Wildland Hydrology p 352
Sinokrat B A and H G Stefan 1994 Stream water-temperature sensitivity to weather and bed parameters J Hydraulic Eng 120722-735
Stefan H G and E B Preudrsquohomme 1993 Stream temperature estimation from air temperature Water Resources Bulletin 2927-45
Walker J H and J D Lawson 1977 Natural stream temperature variations in a catchment Water Research 11373-377
Ward J V 1985 Thermal characteristics of running waters Hydrobiologia 12531shy46
B-15

INTRODUCTION
Study Description Sixteen state and Federal agencies and organizations1 signed a Memorandum of Understanding (MOU) which defines a water quality study of the Burnt River subbasin The goals of the study are to provide a broadly-acceptable scientific basis for (1) developing and evaluating alternative approaches to dealing with water temperature concerns and (2) exploring how these approaches might be applied in a pilot basin in the development of an agriculture water quality management area (1010)2 plan as it relates to temperature
The Burnt River Water Temperature Study was organized to include a steering committee and a technical committee Study products include both research and committee reports This report describes the work done by the steering committee to address the four objectives in the MOU3 (1) assess the factors in the Burnt River subbasin that contribute to current stream temperatures (2) evaluate management practices that might reduce current temperatures (3) develop and test a concept using riparian and stream characteristics as a surrogate for temperature goals and (4) use the results of Objectives 1 through 3 as a basis for development of a 1010 plan by the Oregon Department of Agriculture Research for the study was performed by the Bureau of Reclamation (Reclamation) and the Oregon State University (OSU) Rangeland Resources Department This is not a research report Readers should refer to reports prepared by the Rangeland Resources Department and Reclamation for specific discussions relating to research findings4 Reclamation research is summarized in the discussions of Objectives 1 and 2 and a summary of research findings provided by the OSU Rangeland Resources Department is attached as Appendix B
This document has not been formally approved by any of the participating organizations and does not necessarily represent a consensus of the participants In commenting on an earlier draft of this report Environmental Defense has stated that it did not adequately communicate their view of the studyrsquos products and findings5
Study Area The Burnt River subbasin in eastern Oregon (see Figure 1) drains about 1100 square miles that range in elevation from about 7900 feet to 2100 feet Main tributaries originate in the Blue Mountains and join just upstream from Unity Reservoir The reservoir stores spring runoff for irrigation of agricultural crops mainly alfalfa and grass hay and provides recreational opportunities The primary irrigated areas include the area around Whitney on the North Fork the area around the town of Unity on the South Fork the area along the main stem from Unity Dam to the head of the Burnt River Canyon and the Durkee valley below the canyon
Reclamation studied the North Fork and the main stem and modeled the main stem6 from Unity Reservoir to the head of the Burnt River Canyon downstream of Bridgeport OSU studied four headwater tributaries (three South Fork and one North Fork) and the main stem
1
OBJECTIVE 1 FACTORS CONTRIBUTING TO STREAM TEMPERATURES7
Objective 1 Through the use of a mathematical model(s) and properly functioning condition (PFC) analyses and other tools assess the factors in the Burnt River basin that contribute to current stream temperatures4
Approach Reclamation gathered field data on water temperatures streamflows and other environmental factors from 1997 through 1999 developed a computer model of a section of the main stem and identified factors affecting stream water temperature3 OSU studied the relationship of vegetation elevation weather and land use to stream temperature on four tributary streams and the main stem3
Baseline Temperatures
Upper Watersheds The 7-day average maximum daily stream temperatures for 1998 at the upper monitoring sites on the main stem and the North and South forks are shown below in Figure 2 Maximum water temperatures on the upper South Fork were generally cooler than on the upper North Fork and the upper main stem The South Fork is a north facing basin and has significantly higher flows in the summer months than does the North Fork Maximum temperatures on the main stem below Unity Dam are greatly affected by reservoir temperatures They start out the summer cooler than the upper reaches of the tributaries but end up warmer by summerrsquos end
02-Jul 12-Jul 22-Jul 01-Aug 11-Aug 21-Aug 31-Aug 10-Sep 20-Sep
Date 1998
Figure 2 Seven-day Average Maximum Daily Stream Temperatures at Upper Monitoring Sites8
50 55 60 65 70 75 80 85
Deg F
N Fork S Fork Main
Lower Watersheds Seven-day average maximum daily stream temperatures for 1999 at the lower monitoring sites on the North and South forks and the station at the end of the modeled main stem reach are shown below in Figure 3 Seven-day average mean daily temperatures are shown in Figure 4 Maximum water temperatures on the South Fork were higher than those of the other two streams in early and late summer Mean temperatures on the South Fork were lower than the other two streams during
2
the middle of the summer Maximum temperatures on the North Fork tended to be lower than the other two streams during those same periods
17-Ju
n
22-Ju
n
27-Ju
n02
-Jul
07-J
12-ulJu
l
17-Ju
l
22-Ju
l
27-Ju
l
01-A
ug
06-A
ug
11-A
ug
16-A
ug
21-A
26-
ugAug
31-A
ug
05-S
ep
10-S
ep
15-S
ep
20-S
ep
25-S
ep
30- 05Sep -O
ct 50 55 60 65 70 75 80
De g F
N F o r k
S F o r k
Ma i n
DATE 1999
Figure 3 Seven-day Average Maximum Daily Stream Temperatures at Lower Monitoring Sites9
17-Ju
n
22-Ju
n
27-Ju
n02
-Jul
07-Ju
l
12-Ju
l
17-Ju
l
22-Ju
l
27-Ju
l
01-A
ug
06-A
ug
11-A
ug
16-A
ug
21-A
ug
26-A
ug
31-
05-AugSep
10-S
ep
15-S
ep
20-S
ep
25-S
ep
30-S
ep05
-Oct
45 50 55 60 65 70 75
De g F
N F o r k S F o r k Ma i n
DATE 1999
Figure 4 Seven-day Average Mean Daily Stream Temperatures at Lower Monitoring Sites10
How Does Heat Energy Enter and Leave a Stream In December of 2000 Oregonrsquos Independent Multidisciplinary Science Team (IMST) presented a stream temperature report to the governor ldquoThe goal of the workshop was to review empirical evidence and to identify points of agreement disagreement and knowledge gaps within the scientific community concerning the factors that influence stream temperature and fish responses to elevated temperaturesrdquo11
The IMST found that ldquo[s]olar radiation is the principal source of energy that causes stream heating and is the driver of many environmental factors that can influence stream temperature At any given point and at any given time stream temperature is the result of a complex suite of
3
environmental factors that transform solar energy and re-emit it as heat energy within the environment The interactions and effects of these environmental factors are cumulative and complex and vary by site over time and across regionsrdquo12 The report did not go into detail on the physics of these complex factors stating only that ldquo[t]he net rate of gain (stream heating) or loss (stream cooling) as a stream moves through the environment is the algebraic sum of net radiation evaporation convection conduction and advection [groundwater inflowoutflow]rdquo13 Although there is general agreement on basic principles there has been confusion over heat transfer processes especially the transfer of heat between air and water and the role of long-wave radiation This section describes the physics of heat transfer by utilizing actual Burnt River main stem data and presenting it in the context of the heat transfer processes listed in the IMST stream temperature report and a heat transfer diagram from DEQrsquos technical paper explaining the scientific basis for Oregonrsquos stream temperature standard14
Figure 5 shows that solar radiation (short-wave) and long-wave radiation (infrared) from the earth and the atmosphere are major sources of heat Portions of the solar radiation are absorbed at the ground reflected or scattered in the atmosphere Long-wave radiation from the atmosphere is absorbed by the ground or lost from the system and long-wave radiation from the earth is primarily absorbed by the atmosphere Other heat transfer processes include evaporation and convection but these processes transfer much less heat than radiation
Figure 5 Budget of Radiation from the Sun the Atmosphere and the Ground15
Reclamation and DEQ describe ldquohellipsix processes [shown in Figure 6] that allow heat energy exchange between a stream and its environment solar radiation long-wave radiation evaporation convection streambed conduction and groundwater inflowoutflowrdquo16
4
Figure 6 Processes that Involve the Transfer of Heat Energy17
Radiation The temperature of a stream depends upon the energy going into it and the energy coming out of it Figures 7 and 8 below show energy processes that occurred in the lower Burnt River on a typical July day (July 10 1999) Values were computed using weather station and stream temperature data and standard equations18 The analysis assumed 0 percent shade19 and 15 percent cloud cover Solar radiation was based on weather station data Atmospheric radiation values were computed With no shade and cloud cover they were largely a function of air temperature and relative humidity Water radiation (a function of water temperature) was computed Evaporation was computed based on measured wind speed relative humidity air temperature and water temperature Convection was computed based on measured wind speed atmospheric pressure water temperature and air temperature
As shown below in Figure 7 most of the heat transfer to and from a stream results from radiation There are two forms ndash long-wave (infrared) and short-wave (visible and ultraviolet) Long-wave radiation transmits heat to the stream from the atmosphere from riparian vegetation and from topographic features such as canyon walls Solar radiation transmits heat from the sun to the stream either directly or from reflections off clouds The stream surface emits long-wave radiation cooling the stream while heating the surrounding environment
5
Figure 7 Energy Processes Occurring in the Lower Burnt River During One July Day20
Figure 8 shows that combining heat gains and losses due to long-wave radiation obscures the fact that there is considerable loss of heat from the stream from water radiation and considerable heating from atmospheric radiation
Figure 8 Long-wave Radiation in the Lower Burnt River During One July Day21
6
Atmospheric Radiation As shown in Figure 5 long-wave infrared radiation emitted by the atmosphere is the largest source of radiant energy absorbed at the Earthrsquos surface ndash nearly double the amount of energy received directly from the sun (965 thermal units vs 475) As the atmosphere becomes warmer more heat energy is transmitted to a stream through long-wave radiation Thus air temperature is a significant factor in the heat load being imposed on a stream Figure 7 shows that atmospheric radiation accounts for about half of the heat gained by the lower Burnt River during a July day
Reclamation found a very high correlation22 between air temperature and both mean and maximum daily water temperature The correlation increased going downstream (05 downstream of Unity Reservoir to 09 at Huntington) This high correlation was expected because air and water are both heated by solar radiation and air temperature is a major component of atmospheric radiation Reclamation used weather station data and a precise physical equation to determine the effects of atmospheric radiation ldquoThe amount of atmospheric radiation entering a stream is affected by five factors (1) air temperature (major factor) (2) vapor pressure which affects the emissivity (3) cloud cover which converts short-wave solar radiation into long-wave radiation (4) reflection of long-wave radiation at the water-air interface and (5) the interception of long-wave radiation by riparian vegetationrdquo23
Figure 7 shows that atmospheric long-wave radiation tends to be fairly constant but rises during daylight hours Reclamationrsquos calculations of hourly heat fluxes showed that solar short-wave radiation was about 25 times as high as atmospheric long-wave radiation at its peak but over a 24-hour period the average amount of heat gained from atmospheric radiation was about equal to the solar (345 joulesmeter2second for solar radiation vs 330 for atmospheric radiation)18
Modeling runs performed by Reclamation to specifically assess the independent impacts of air temperature showed main stem water temperatures would likely be between 3-4 degF cooler than average during unusually cool periods in the summer (one standard deviation below the mean) and 3-4 degF warmer than average during unusually warm periods (one standard deviation above the mean)24
Radiation from Riparian Vegetation and Topographic Features Riparian vegetation blocks both solar and atmospheric radiation although the vegetation itself will emit long-wave radiation To assess sensitivity to shade Reclamation estimated the hourly heat fluxes if the main stem could receive 50 percent shade25 26 Under these conditions the total long-wave radiation from the atmosphere and riparian vegetation would likely be about 15 percent higher than without the vegetation the riparian vegetation accounted for about 55 percent of the total radiation However these increases were estimated to be more than offset by a 50 percent reduction in solar radiation reaching the stream leaving the stream temperature lower as a result of the increased vegetation
7
The Burnt River Canyon has high walls that provide shade and has good riparian vegetation yet stream temperatures rise more in this river reach than elsewhere The heating in the canyon appears to be largely due to heat transfer from the rocks (long-wave radiation) and high air temperatures
Solar Radiation If you stand in the sun you get warmer than if you are in the shade A stream is no different Previous studies have found that (1) stream temperatures increase with removal of streamside vegetation27 (2) shade reduces stream heating in small (low flow) forested streams by reducing the amount of direct solar radiation28 (3) removal of riparian vegetation has only a modest effect on mean stream temperature since the energy gained from the increased solar radiation is partially offset by the increased energy loss by radiation to the sky29 and (4) shading is associated with significant differences in daily maximum air temperatures30
Supplemental modeling runs31 were performed by Reclamation to specifically assess the independent impacts of solar radiation These showed that the mean main stem water temperatures would likely be between 2-3 degF cooler than average during cloudy periods (solar radiation one standard deviation below the mean) in the summer and 2-3 degF warmer than average during clear periods (solar radiation one standard deviation above the mean) Maximum water temperatures were predicted to be about 4 degF cooler than average during cloudy periods32
Water Radiation Figure 5 above shows that long-wave radiation is the largest source of energy emitted from the earthrsquos surface Figure 7 above shows that more energy is lost to the atmosphere through long-wave water radiation than is gained through long-wave atmospheric radiation
Evaporation As the motion of water molecules increases in response to increased heat energy they begin to overcome the molecular attraction to liquid water causing more molecules to escape as water vapor and releasing heat in the process Wind assists evaporation by removing escaping water molecules before they are forced back into the water surface Figure 7 above shows that a great deal of evaporative cooling took place on the Burnt River on July 10 1999 The cooling picked up along with the wind during the heat of the day and then subsided in the evening hours On July 14 the average wind speed was 28 miles per hour (mph) instead of the 1 mph observed on the 10th and the evaporative cooling was twice as great averaging 228 joulesmeter2second33 Shaded streams tend to have less evaporative cooling because they heat less and have less wind exposure however no attempt was made to measure these effects in the Burnt River
8
Convection and Conduction In conduction heat is transferred from molecule to neighboring molecule with no mass motion of the air or water being involved Convection is the process of transfer of heat from one place to another by the actual mass motion of heated water or air from one place to the other34 Although a great deal of heat can be transferred between air and water through radiation relatively little is transferred through convection since the thermal conductivity of air is very poor Figure 7 shows only a small amount of heat is transferred by convection between air and water Convection added an average of about 27 joulesmeter2second to the main stem near Durkee during the day At night the stream lost an average of about 24 joulesmeter2second back to the air Over ten times more heat was transmitted from the air to the river by long-wave radiation (an average of 322 joulesmeter2second) than by convection (see Figure 7 above)
Streambed Conduction The Oregon DEQ35 has suggested that unshaded shallow streams tend to receive some heat energy from streambed conduction during summer days To the extent that a streambed contains a greater amount of solid rock the heat release would be slower No attempt was made to measure heat transfer through bed conduction in the Burnt River
In contrast data from the Wallowa-Whitman National Forest soil survey program indicates that the heat flux from streambed to stream during the summer will change as the stream flows toward the mouth In the headwaters the streambed is often warmer than the water whereas in the lower elevation areas the streambed is cooler than the stream Streambeds along the reach modeled by Reclamation (Unity Reservoir to Bridgeport 3700 to 3400 feet elevation) would be about 10 degF cooler than maximum daily water temperatures during the summer and about in equilibrium with nighttime temperatures36
Groundwater Previous studies have found that (1) stream systems that receive a large influx of groundwater exhibit a high degree of thermal constancy37 (2) groundwater influx can have a depressing effect on stream temperature38 (3) groundwater temperatures are normally within 2 degF of the mean annual air temperature39 and (4) groundwater is warmer at lower elevations35
Reclamation found that periodic decreases in stream temperatures in the South Fork between Whited and Unity Reservoirs are likely due to subsurface return flows from irrigation Reclamation also found that stream temperatures in the main stem increased in the downstream direction from the dam during the first part of the irrigation season when most of the return flows are warm surface flows and groundwater return flows are limited In the late part of the irrigation season more of the return flow is cool groundwater and the temperature profile flip flops with stream temperatures decreasing in the downstream direction Modeling runs suggested that if these late-season sub-surface return flows were reduced through increased irrigation efficiencies stream temperatures would increase
9
Stream Characteristics Important to Temperature
Elevation Elevation has been defined by the IMST as one of eight factors affecting stream temperature40 The thermal environment is warmer at lower elevations Groundwater inputs are warmer and more heat is transferred to the stream from the warmer air (primarily through radiation) Air soil and water temperatures in the Burnt River subbasin increase about 2 degF for each 500 foot drop in elevation41
Aspect The tributaries that drain north facing basins including the South Fork Camp Creek and Clarks Creek normally have higher base flows and lower stream temperatures during the spring and summer months than south facing basins such as the North Fork and Pritchard Creek
Topographic Features The Burnt River heats up considerably as it goes through the Burnt River Canyon The canyon has high walls that provide shade and good riparian vegetation even though the USFS and BLM permit livestock grazing in the canyon However stream temperatures rise more in this river reach than elsewhere on the Burnt River This heating appears to be largely due to heat radiating from the rocky canyon walls and high air temperatures and perhaps also due in part to the relative absence of subsurface flows into the river
Flow As flow rate decreases the volume of water that is involved in the heat energy balance is reduced but heating processes remain relatively unchanged The result is that during heating periods the stream tends to accumulate more energy per unit volume The daily fluctuation of temperature in a low volume stream such as the North Fork in summer will be far greater than that of a large volume stream42
Reclamation found that the North Fork has flows of only 1-3 cfs at the lower gauging station during the summer and often has stream temperatures in excess of 80 ordmF The South Fork with flows of 15-30 cfs at the forest boundary tends to run cooler than the North Fork
Channel Width and Depth As the width of a stream channel increases so does its surface area increasing the amount of heat energy exchange that occurs between the stream and its environment If flow remains constant stream widening results in reduced channel depth A shallower depth may allow solar energy to strike the streambed and increase streambed conduction In sensitivity tests Reclamation modeled a main stem channel 30 percent narrower than the present channel43 and predicted that the narrowing would result in about a 2 degF decrease in summer stream temperatures
10
The highest summer sun angle in Oregon is roughly 70 ordmF44 On some reaches of narrow east-west oriented tributary streams riparian vegetation will block solar radiation throughout the entire day If the angle from the top of the canopy to the opposite bank is less than 70 solar radiation will reach the stream during part of the day Reclamation surveyed 10 river cross sections in the modeled reach from the Unity Dam to the canyon and found the main stem (shown in Figure 9 below) to average about 40 feet in width The soils and channel type along much of the main stem will support natural growth of willows ranging from 5-15 feet in height45 ldquoCottonwood would be unlikely to occur naturally within the Hereford [modeled] reach of the riverrdquo46 47 Even if sections of the main stem contained dense willow stands in riparian areas they would receive solar radiation whenever the sun elevation is greater than 30 degrees and (as shown in Figure 9) only about 11 percent of the 40 foot width of the modeled reach of the Burnt River would be shaded at the highest summer sun angle
Figure 9 Vegetation Shade Angle
Vegetative Shade The Reclamation study found that the most heavily shaded section of the North Fork displayed lower diurnal swings than the other sections even though it had very low water volume Reclamation used model sensitivity runs to assess the effects of theoretical shade percentages on the main stem Global shade values of 15 percent were predicted to decrease temperatures up to 2 degF Most participants felt that given the present stream width and soil conditions shade values beyond that level were unlikely Many participants felt that 15 percent was beyond the current resource capability Some felt that if taller species could be propagated in the study reach and the stream narrowed through riparian improvements higher shade values could be attained The highest theoretical value for shade studied by Reclamation was 50 percent The model sensitivity run using 50 percent shade predicted a drop in mean stream temperature of about 4 degF and a drop in maximum temperature of about 55 degF
Reservoirs Without Unity Reservoir the stream flows in the Burnt River during the summer and fall months would be much lower (10-15 cfs vs 90-130 cfs) than currently exists Higher flows slow the warming process Larger stream flows (larger water volumes) take longer to increase in temperature than smaller flows
11
Figure 10 below displays the measured 1999 mean daily 7-day average stream temperatures for the lower South Fork before it flows into Unity Reservoir and measurements for the main stem immediately below Unity Dam Figure 10 indicates that the outflow from the reservoir is cooler than the inflow in the early part of the irrigation season and is warmer than the inflow later on in the year The inflow temperatures for the North Fork are not shown in Figure 10 because its flows just above the reservoir are very small and their temperatures are unknown
17-Ju
n
22-Ju
n
27-Ju
n02
-Jul
07-Ju
l
12-Ju
l
17-Ju
l
22-Ju
l
27-Ju
l
01-A
ug
06-A
ug
11-A
ug
16-A
ug
21-A
ug
26-A
ug
31-A
ug
05-Sep
10-Sep
15-Sep
20-Sep
25-Sep
30-Se
05
p-O
ct 45 50 55 60 65 70
Deg F
S Fork Ma i n
DATE 1999
Figure 10 Unity Reservoir Inflow and Outflow ndash 7-day Average Mean Daily Stream Temperatures48
Figure 11 below displays the measured 1999 maximum daily 7-day average stream temperatures for the lower South Fork and the main stem immediately below Unity Dam Figure 11 indicates that the outflow from the reservoir generally has lower maximum daily temperatures than the inflows from the South Fork for most of the irrigation season In late September and beyond the temperatures of the inflows are less than the outflows from the reservoir reflecting cooler air temperatures and shorter day heating periods
17-Ju
n
22-Ju
n
27-Ju
n02
-Jul
07-Ju
l
12-Ju
l
17-Ju
l
22-Ju
l
27-Ju
l
01-A
ug
06-A
ug
11-A
ug
16-A
ug
21-A
ug
26-A
ug
31-A
ug
05-Sep
10-Sep
15-Sep
20-Sep
25-Sep
30-Se
05
p-O
ct
80 75 70Deg 65 60 55 50 45
F S Fork Main
DATE 1999
Figure 11 Unity Reservoir Inflow and Outflow ndash 7-day Average Maximum Daily Stream Temperatures49
The diurnal temperature fluctuation of the river for several miles below Unity Reservoir is smaller than in the river farther downstream The effects of the reservoir on temperature and
12
diurnal fluctuations are seen most strongly in the first 5 miles below the reservoir The effects largely disappear 10 miles below the reservoir
The irrigation facilities on the South Fork above Unity Reservoir significantly alter stream temperature conditions The passage of water through Whited Reservoir on the South Fork increases the mean daily stream temperature by as much as 10 degF until the outlet gates are opened in late July or August During this early part of the irrigation season flow downstream consists of the warmer water from the top of the reservoir (flow over the spillway) Later cooler water from the bottom of the reservoir is released causing a large decrease in temperature below the reservoir Both Whited and Unity reservoirs are somewhat stratified during the irrigation season in terms of water temperature and there can be a significant difference in water temperatures whether water is taken off the top (usually the case at Whited) or the bottom (eg Unity) in certain periods during the irrigation season Since all of the flow in the lower South Fork is diverted for irrigation the South Fork flow into Unity Reservoir is essentially all irrigation return flows (both surface and subsurface) that are generally cooler than the surface water in the South Fork especially during the latter part of the irrigation season
Summary
Processes that Involve the Transfer of Heat Energy
There are six processes that allow heat energy exchange between a stream and its environment solar radiation long-wave radiation evaporation convection streambed conduction and groundwater inflowoutflow Of these radiation is by far the most significant
Solar Radiation
In the summer the main stem Burnt River gains almost all of its heat from radiation with about half of the gain coming from solar radiation and about half coming from atmospheric radiation Anything that reduces the amount of a stream that is exposed to solar radiation (vegetation clouds topographic features reduction in width etc) will reduce the amount of heat added
Atmospheric Radiation
There has been confusion over how heat is transferred between air and water On a typical July day some heat is transferred to the Burnt River by convection but over ten times more heat is transmitted from the air to the river by atmospheric radiation than by convection About half of the heat gained by the river in the summer comes from atmospheric radiation
Cooling Processes
Heat loss occurs primarily through long-wave radiation from the water back to the atmosphere Evaporative cooling produces significant heat loss especially during warm and windy periods
13
Groundwater primarily from irrigation return flows contributes to cooling the main stem in the late part of the irrigation season
Stream Characteristics Important to Temperature Seven stream characteristics were identified as being important to temperature elevation aspect topographic features flow channel width and depth vegetative shade and reservoirs
The thermal environment is warmer at lower elevations Groundwater inputs are warmer and more heat is transferred to streams from warmer air Air soil and water temperatures in the Burnt River subbasin increase about 1 degF for each 250 foot drop in elevation
Aspect stream width and vegetation affect the amount of solar radiation that streams receive Burnt River tributaries draining north facing basins tend to have higher base flows and lower stream temperatures during the spring and summer than south facing basins The width of the main stem (average 40 feet) makes it difficult to shade especially with the predominant native willow species that grow to no more than 15 feet in height The most heavily shaded section of the North Fork displays lower diurnal swings than other sections Model runs showed that increasing shade on the main stem would lower stream temperatures with the greatest effect being on maximum temperatures
Reservoirs have a significant effect on stream temperatures in the Burnt River Higher summer flows with Unity Reservoir (90-130 cfs vs 10-15 cfs without the reservoir) slow the warming process but outflows are warmer than inflows in August and September When water is taken off the top of Whited Reservoir mean daily stream temperatures on the South Fork increase by as much as 10 degF until outlet gates are opened in July or August and cooler water is released from the bottom
14
OBJECTIVE 2 TEMPERATURE MANAGEMENT ALTERNATIVES
Objective 2 Utilize the results of Objective 1 to identify and evaluate management practices that might be employed to reduce current temperatures in the Burnt River basin4
Methodology Reclamation used their calibrated stream temperature computer model6 to evaluate effects of management practices on the Burnt River reach from Unity Dam to the confluence with Clarks Creek at the head of the Burnt River Canyon Findings should not be generalized to any other part of the subbasin
Shade
Site Capability The main problem with shading the main stem appears to be the average width (about 40 feet) of the channel The amount of shade is a function of the type of riparian species how high they grow where they grow their density and their distance from the channel
Vegetation
Site capability work was performed by OSU50 with the assistance of the NRCS and peer reviewed by Forest Service and BLM experts agreed to by study participants The NRCS developed an ecological site description (Willow Riparian) that applies to most of the riparian areas downstream of Unity dam except for a few cottonwood sites below the reach modeled by Reclamation The overstory of the historic climax plant community in these areas was willows with unknown understory Many of these areas have been invaded to varying degrees by reed canary grass
Willows likely would grow in soils and channel types that were normally colonized by the various willow species It was assumed that the willows would grow 5 feet from the water edge for the majority of the summer and only grow in alluvial deposits comprising about one-sixth of a typical river reach Willows were estimated to average between 5 and 15 feet in height (only the taller height was used in shade computations) In her peer review Crowe51 observed that the ldquovegetation heights are probably higher than the average of even the tallest individuals in populations of these shrub speciesrdquo52
Crowe felt that ldquo[c]ottonwood would be unlikely to occur naturally within the Hereford [modeled] reach of the riverrdquo53 The site capability work did not argue that taller species such as cottonwood could not be grown in areas that are described as willow communities In a peer review of the site capability work Leonard54 pointed out that ldquo[c]ottonwoods may grow in this segment if planted but it is highly unlikely that there would be recruitment from seedrdquo55
15
The DEQ has pointed out that taller non-native species have been planted in the study reach and survived and that restoration could be focused on passive regeneration of native vegetation or it could include active planting of willows cottonwood or other taller species
Channel
The site capability work did not address channel changes and their potential effects on shade Channel changes could affect the distribution of willows and reed canary grass Crowe suggested that if the stream evolves to more of an E-type channel morphology the willow stand remnants would be right on the streambank and would provide more shade to the stream56 However she also wondered if movement toward an E-type channel might lead to the reduction of the area available for woody species establishment given the abundance and aggressiveness of reed canary grass in the riparian system She observed that if the channel is or becomes more of a C-type areas other than alluvial bars might be potential sites for shrub establishment unless they are too heavily dominated by reed canary grass Crowe57 pointed out that gravel transportation and sedimentation has an effect on vegetation and wondered if a decrease in the amount of gravel being transported in the river was contributing to a decline in willow populations
Crowe52 and others have wondered if there is a chance that the river is wider than it was before settlement of the valley and if there is a chance that it could become narrower in the future with changes of management in the riparian areas Some sections of the river that have been straightened are wider than unstraightened sections As pointed out above in the discussion of width and depth a narrower channel would lead to increased shade
Reclamation Findings Reclamation investigated the effects of achieving shade potential in the river reach from the Unity Dam to the canyon entrance Their initial modeling runs were based on estimates of the maximum amount of shade attainable under existing soil and stream conditions provided by OSU58 These estimates considered the combined tree shrub grass and bank shade components The estimates were made for each modeling reach and ranged from 28 to 6 percent shade Shade estimates were based upon the average amount of stream area covered by shadow at the hours of 1000 1100 1200 100 and 200 In their final report Reclamation estimated that increasing shade to these levels would have a very slight cooling effect on the stream The largest difference projected in instream temperatures would be about 05 degF for maximum daily temperature at the lowest validation station The shade effects would be more pronounced at the downstream stations and would affect the maximum daily water temperatures more than the mean daily water temperatures
A participant review of the above methodology highlighted the fact that this was a different approach to shade estimates from the effective shade methodology employed by the DEQ In an effort to provide more consistency OSU provided new shade estimates59 to Reclamation for June July and August based on taking an average of estimated shade at each hour of the day from 7 am to 5 pm The new estimates of average shade were 59 percent for June 66 percent for July and 82 percent for August (compared to the 36 percent average used in Reclamationrsquos final report)60
Increasing the estimate of attainable shade from 36 percent to 82 percent for August led to an estimated decrease of 12 degF in maximum daily stream temperature at the lowest validation station
16
as opposed to the earlier projection of a 05 degF decrease61 The changes would be less for June and July when the sun angle would be higher
No assessments were done on headwater streams where shade potential would be much greater nor on the lower reaches of the river that are dominated by midstory shrubs with a very minor cottonwood component
Irrigation Operations Reclamation simulated a number of irrigation efficiencies and found that increasing irrigation efficiencies would likely cause stream temperatures to decrease somewhat until about the middle of July and then warm through the remainder of the irrigation season In the early part of the irrigation season most of the return flows are warm surface flows Increasing efficiencies would reduce these flows lowering stream temperatures However reduction in early season recharge of the shallow aquifer could reduce cool late-season groundwater returns In the later part of the irrigation season more of the return flow is cool groundwater Increasing efficiencies during this part of the year would decrease cool subsurface return flows raising stream temperatures Projected August temperature increases were as high as 2 degF at the site furthest downstream from the Unity Dam Decreased irrigation efficiencies would tend to lower stream temperatures in late July and August However if irrigation efficiencies become too low there could be an increase in overland return flows leading to higher stream temperatures
Combining Shade Improvements with Irrigation Efficiency Reclamation modeled the effects on the upper main stem of combining a 3-6 percent shade increase with an increase of irrigation efficiency from 55 to 70 percent This combination would likely result in a minor cooling (a maximum of about 1 degF) from Unity dam to Pine Creek However in the reach from Pine Creek to the canyon this combination would likely lead to a slight increase in stream temperatures Adding shade to the simulation would result in reducing stream heating while increasing irrigation efficiency would lead to an increase in stream temperatures through a reduction in subsurface return flows Thus the two options appear to act against each other resulting in very minor stream temperature changes
17
OBJECTIVE 3 DEVELOP AND TEST A SURROGATE
Objective 3 Develop and test a concept using riparian and stream characteristics as a surrogate for temperature goals4
Rationale for a Surrogate One of the objectives of the Burnt River study was to develop a surrogate for the 64 degF criterion62
in Oregonrsquos water temperature standard63 Not meeting the criterion brings about a process that leads to regulation under a water quality management plan Although the standard can be satisfied without attaining the 64 ordmF criterion64 many have felt that water quality planning would proceed more smoothly if less attention was given to the criterion and more attention was given to the environmental factors related to temperature If a surrogate based on desired stream and riparian conditions could be developed the criterion could be used only to start the planning process and then the focus could shift from achieving the criterion to achieving the field conditions described in the surrogate This would change the focus from goals that might not be achieved to ones that could be achieved For example in the Burnt River it may not be possible to achieve the 64 degF criterion in all reaches at all times but it should be possible to achieve the field conditions described in a surrogate
Ideally a surrogate would identify conditions that landowners could easily see as problems and then come up with their own solutions Advocates of this approach feel that this changed focus would likely receive more support and cooperation from landowners Surrogates could form the basis of the temperature portion of 1010 plans and could provide the framework for monitoring plans with which to measure progress This kind of approach might also more clearly show that certain problems were not the fault of specific landowners
When the Burnt River study began some participants felt a surrogate could eventually form the basis of an alternative standard (sometimes referred to as a healthy streams standard) but that has not been a study goal65
Two approaches to a surrogate were discussed a surrogate that would reflect the temperature standard and one that would describe the conditions of a healthy stream It was felt that the latter approach should be considered because the present temperature criterion is in essence already a surrogate for a healthy stream
Temperature Surrogate The majority of participants felt that a surrogate could be developed around a description of desired riparian and stream characteristics that could be used as objectives in improving stream temperatures If those factors are brought to as good a condition as they are capable of achieving then summer stream temperatures should be as low as can be expected Most study participants were looking for a simple tool that would show whether or not a stream was functioning as it
18
should Participants were largely in agreement on the concept of a temperature surrogate but were unable to develop a process for testing these concepts on the ground
Definition Although there was no consensus on a definition a surrogate was generally perceived as a set of environmental parameters that can be managed to improve water temperature Much of the discussion involved a perception of surrogates as having two basic elements (1) components of the major environmental factors that affect temperature and (2) the process by which goals are set and progress measured
Components Component categories (vegetation flow and channel morphology) had been defined through the work on the first two study objectives and were generally agreed to Visions of a healthy stream from a temperature perspective usually included unconstrained riparian vegetation good surface and groundwater flows a narrow channel and a stream that is connected to the flood plain all determined and based on the site potential However participants could not agree on specifics
There was discussion of a vegetation component related to ecological site descriptions developed by the NRCS It was agreed that vegetation components affected by management include the establishment recruitment and maintenance of vegetation appropriate to existing site conditions66
Flow components discussed included stream flows irrigation return flows (both surface and subsurface) groundwater flows and factors affecting a watershedrsquos capability to store and release water Channel structural features affecting stream temperatures discussed included bank stability and improved widthdepth ratios where there is potential to do so The possibility of including thermal refugia as a surrogate component was discussed but not pursued The participants recognized that component values will vary across years within climates
Process Although participants reached no consensus they did discuss defining each surrogate component in terms of a process by which goals could be set and progress measured The following potential elements were identified (1) existing condition (2) site potential (the physical maximum that a resource is capable of achieving) (3) inhibiting factors (4) goals or desired future conditions based on resource capability (what can be achieved given identified inhibiting factors) (5) prohibited conditions (6) a monitoring program and (7) progress assessment and review
The OSU Rangeland Resources Department developed an estimate of vegetative site potential in their work on Objective 2 and NRCS personnel made a similar independent analysis but participants did not agree on their findings In general participants were not comfortable with determining site potential or defining specific goals To get around some of these problems some felt that a surrogate could be defined in terms of improvement in stream characteristics but no attempt was made to develop that approach
19
Healthy Streams Surrogate Some participants felt that the 64 degF criterion was itself a surrogate and had been developed partly because it can be objectively measured Some felt that a more appropriate approach would be to develop a surrogate around healthy stream concepts instead of just temperature67
Considerations The purpose of the temperature standard is to protect aquatic life but from a fishery perspective the temperature focus can lead to overlooking other factors that could benefit fish Some of the environmental representatives felt that what was really needed was a healthy stream for aquatic life not just a low temperature In the Burnt River below the dam some felt that through focusing on the 64 degF criterion minor improvements in temperature might be made with perhaps no effect on the fishery If the focus were expanded a better understanding of what could be done to protect the fishery might be obtained
Another disadvantage of the temperature criterion is that landowners tend to identify less with temperature concerns (especially when they feel that targets canrsquot be achieved) than with the concept of a healthy stream A focus on a healthy stream instead of just temperature might yield more landowner support and help them better identify problems so they could develop their own solutions
There was some brief debate over what constitutes a healthy or fully functioning stream a stream that optimizes resources for fish for agriculture or for fish and agriculture However most participants felt that a healthy stream surrogate would probably look similar to a temperature surrogate because things that help stream temperature constitute most of the components of a healthy stream
Possible Additional Components There was some discussion of adding additional components to a healthy streams surrogate
Relating Stream Conditions to Aquatic Life
Some participants wanted to help define a healthy stream by doing a survey of aquatic life and linking the findings to various stream and riparian states For example do fish fare better under banks lined with willows or canary grass But there was insufficient support for a survey
Biological Factors
Adding other factors such as macroinvertebrates into a healthy streams effort was also discussed but adding biological factors to the mix would likely be beyond the Statersquos funding capability as well as landownersrsquo endurance and good will
20
A proposal from a group of northwest Forest Service and BLM scientists attempting to develop a biological analog to Properly Functioning Condition (PFC) was discussed They had suggested two types of assessments a level 1 assessment that would focus generally on physical factors and a level 2 assessment that would provide more detailed habitat mapping macroinvertebrate sampling and assessments of fish communities Level 2 assessments were suggested only for high-priority streams The Burnt River study participants concluded that fortunately physical factors related to temperature are also strongly linked to biological factors and can be used to predict the biological factors and that most streams that are physically healthy are also biologically healthy
Conclusions Most participants concluded that although a healthy stream was desirable defining it and measuring it was very complex and that surrogate development should probably be limited to the physical conditions of streams and riparian areas
21
OBJECTIVE 4 1010 PLAN
Objective 4 Use the results of Objectives 1 through 3 as a basis for development of a SB 1010 plan2 by the Oregon Department of Agriculture This plan will be submitted to EPA68 via DEQ as part of the Burnt River TMDL69 for removal of the river from the 303(d)70 list4
Approach ODA with the assistance from the Burnt River Technical Committee will evaluate the work done under the first three objectives in developing a management plan The plan will be submitted to EPA as part of the TMDL for the Burnt River and upon EPArsquos approval the river will be removed from the 303(d) list4
Conservation Activities The Burnt River has a long history of having a very active SWCD (Soil and Water Conservation District) that has initiated a great number of successful conservation projects However some of the past accepted practices such as channeling are now recognized as being detrimental to bank and channel stability and flood plain connectivity
Much of the Burnt River is now covered by CRMPs (Conservation Resource Management Plans) These have helped coordinate proposed and ongoing conservation projects and have made local landowners aware of problems in the basin and on their own property Most landowners were present when the PFC assessment (Properly Functioning Condition) was done on their property as part of the OSU Range Departmentrsquos portion of the Burnt River study thus gaining additional understanding of the riparian conditions
Implementation Problems During the course of the Burnt River study landowners have expressed considerable frustration with the implementation of Oregonrsquos standard for stream temperature The Burnt River study participants felt that making policy suggestions would be inappropriate but that a summary of the problems encountered may be useful to others who are trying to make the process more effective
With the involvement local landowners have had in the Reclamation and OSU studies (several served on the Technical Committee) most do not see high stream temperatures as a significant man-caused problem in the Burnt River subbasin
Three types of problems have been encountered process scientific disagreements and socioeconomic
Process Although most landowners are now well-informed of the TMDL and 1010 processes some of their initial reluctance to address stream temperatures was due to a lack of understanding of the temperature standard and the processes related to it Some felt that the standard called for all
22
streams in the state to be cooled to 64 degF whether or not that was physically possible It was sometimes felt that if the 64 degF criterion canrsquot be achieved it is fruitless to make changes solely to improve temperature Some feel that if they are having a net positive effect on temperatures itrsquos not necessary for them to make additional improvements in temperature
Many landowners initially did not understand that there are two parts to the temperature standard In addition to the numeric standard there is also a narrative standard The narrative standard provides for a plan to be developed that identifies the reasonable means to address human-caused impacts to water temperature The 1010 plan meets the requirements of the narrative standard and is recognized as agricultures contribution to the Burnt River TMDL
The Burnt River TMDL will be developed similarly to those in other basins The regulatory portion of the Burnt River 1010 plan for agricultural and rural lands will take into consideration what can be accomplished on the ground given the diversity of conditions Thus the goals of the Burnt River TMDL and the 1010 plan are the same with the 1010 plan focusing on how to get to what is reasonable given practical economic and social considerations
Scientific Disagreements Most environmental interests feel that vegetative shade is the most important factor in lowering stream temperatures Many Burnt River landowners are not convinced of the importance of vegetative shade and feel that air temperature and other environmental factors have a greater influence often rendering attempts at lowering stream temperatures with shade ineffective especially at lower elevations Landowners believe that main stem flows are cooler with Unity Reservoir (because of greater volume) than they would be without it However with extremely low inflow the reservoir is in essence a stagnant pool during the summer with releases (from the bottom of the pool) often exceeding 70 ordmF Most landowners believe that these summertime releases are the primary contributor to main stem temperatures that exceed the temperature standard They also believe the primary problem on the North Fork is nearly nonexistent flows during the summertime
Most in the environmental community feel that if mistakes are to be made one should err on the side of assuming too much potential initially so as to achieve as much as possible Some Burnt River landowners fear that when the TMDL is developed for the Burnt River inhibiting factors will not be taken into account when making estimates of site potential for vegetation and shade If that happens they feel that one unachievable goal (the 64 degF criterion) will be replaced by another ndash goals for vegetation will be developed that are just as impossible to reach as the goals for temperature
Socioeconomic Some landowners feel that they are assumed to be guilty of degrading water quality until proven innocent and the burden of proof rests with them They feel that they are being told what to do instead of having the freedom of finding their own solutions They also perceive that they are being asked to achieve a goal that can never be attained and once they give in to that process they put their financial livelihoods at risk
23
Use of Surrogates Although the Burnt River participants could not agree on a temperature surrogate for the Burnt River subbasin they did agree that surrogates in some form needed to be used in 1010 plans TMDLrsquos and 1010 plans developed in Oregon to date have dealt with temperature surrogates not temperature units however the conditions discussed in 1010 plans are not commonly called surrogates The TMDLrsquos developed to date have identified a number of surrogates that could be used in controlling stream temperatures but only vegetation and its related effective shade has been used in load allocation The surrogate goals developed in the TMDL process define conditions on the ground that would have to be achieved if load allocations are to be met The water quality management plan including the 1010 plan describes how those conditions will be achieved ODA believes that 1010 plans should focus on attainable improvements defined in surrogates (leaving the choice of practices to achieve those improvements up to individual landowners) and then whatever temperature results from those improvements would reflect what is reasonable and practical Some felt that attainable surrogates could be defined with the help of resource sites that could be identified as a standard as well as the use of master ranchers who could demonstrate resource capability
Study participants discussed the need to translate surrogates into 1010 plan elements such as actions and prohibited conditions but developed no recommendations Some agricultural representatives wanted to see prevention and control measures focused on things that could be fixed where landowners could see actual improvements There was also considerable discussion of the need to make objectives clear and measurable and developed with respect to a specific time frame However there was an awareness of landowner resistance to this type of approach in a regulatory environment
Feasibility Those contributing to non-point source pollution are responsible for implementing feasible improvements Feasibility is defined in Oregon Administrative Rule as a function of ldquohellipa site-specific balance of the following criteria protection of beneficial uses appropriateness to local conditions use of best treatment technologies or management practices or measures and cost of compliancerdquo71 Some study participants felt that if these criteria were followed increasing shade from 1 percent to the estimated site potential of 5-7 percent on the main stem would not be feasible This is based on the estimate that a 5-7 percent shade impact on stream temperature would be minimal and would be of little or no benefit to fish There was no agreement in the group on this issue
The relationship of feasibility to money and time and the tradeoff between the two was discussed Only so many dollars are available at any given time but given more time more changes are possible There was also some discussion of social factors that may limit the achievement of site potential For example many individuals in the Burnt River subbasin believe that the majority of stream heating is due to natural factors and that solutions such as shading the stream are not effective Landowners are also reluctant to take action to improve temperature unless it can be shown that the changes will have a positive impact on aquatic communities Even some fish
24
biologists argue that if only small amounts of fish are produced in relation to expensive improvements those improvements may not be justifiable
Measures of Progress Study participants discussed means of measuring progress The DEQ was interested in measures of interim progress the ODA talked about the need for stepwise approaches to the temperature standard and OSU thought measures might be developed around vegetative recovery rates No recommendations were developed
Burnt River 1010 Plan The ODA with the assistance of a local water quality management area advisory committee is preparing a 1010 plan which they expect to complete in 2002 The 1010 plan will identify conditions associated with agricultural lands that can contribute to water quality problems and outline a strategy that will include education enforcement and monitoring to mitigate those problems The intent of 1010 is to provide a clear role for ODA to assist and advise producers in watersheds known to have water quality problems to prevent pollution problems wherever possible and to alleviate any existing problems
Typically 1010 plans are being developed prior to the development of a TMDL because of agricultures and the states desire to be proactive For the Burnt River subbasin DEQ is scheduled to begin work on the TMDL in 2005 After the TMDL is developed ODA (with the assistance of the local water quality management area advisory committee) will evaluate the Burnt River 1010 plan in light of the TMDL and make any changes necessary The 1010 plan then becomes the TMDL agricultural implementation plan and is part of DEQs overall management plan that describes the strategy for achieving the TMDL for that basin
25
FUTURE RESEARCH
Study participants did not develop a set of recommendations for further research in the Burnt River This section contains suggestions that were made throughout the course of the study that might be pursued in other basins or at some later date in the Burnt River
Objective 1 Factors Contributing to Stream Temperatures In general study participants agreed on the processes that involve the transfer of heat energy and the stream characteristics that are important to temperature Further investigations that might improve the understanding of these processes are listed below
Burnt River
bull Identify and measure surface return flow sites on the main stem and South Fork
bull Perform flow and temperature analyses with and without Unity Reservoir
bull Study spring water temperatures by elevation to show how source water temperatures change by elevation
General
bull Identify the relationship between PFC and water temperature Currently measurement techniques are not fine enough to measure differences across short reaches
bull Test the hypothesis that summer stream temperatures cannot be maintained below 64 ordmF at elevations below 4500 feet in eastern Oregon unless there are significant cool groundwater inputs72
bull Develop regression equations for predicting water temperatures in other watersheds based on hydrology climate water quality parameters elevation etc73
bull Develop heat budgets on tributary streams Compare these with main stem heat budgets to better assess the impacts of atmospheric radiation
Tools
bull Models o Develop performance criteria for temperature models o Compare the Fish and Wildlife Service SNTemp Model with DEQrsquos Heat Source
Model o Compute present and potential shade using DEQrsquos approach o Use the shade function in the SNTemp Model where there is enough actual or
potential shade to justify its use
26
bull Forward Looking Infrared Technology (FLIR) ndash Consider using (FLIR to identify areas of stream heating
Objective 2 Temperature Management Alternatives Several areas of research associated with potential temperature management alternatives were discussed
bull More research on headwater streams with more shade (narrower channels more vegetation less atmospheric heating)
bull Riparian Vegetation o Map ecological sites o Identify resource sites as standards o Explore the possible introduction of taller species o Study canary grass control o Evaluate reservoir operations for propagating riparian vegetation
bull Irrigation return flows ndash assess options for o Controlling surface return flows o Enhancing cold water inputs
bull Channel o Identify areas where width might be reduced with changed riparian management o Gather more cross-section data to show how channelized sections could be changed o Consider effects of evolution to e-type stream eg on willows reed canary grass
bull Develop a water pollution reduction crediting system
Objective 3 Develop and Test a Surrogate The following items were discussed as steps to be taken in the development and testing of candidate temperature surrogates
bull Develop candidate surrogates and test them on site
bull Define feasibilityDevelop costbenefit analyses of management practices
bull Identifyget buy-off on attainable improvements
bull Define surrogates in terms of 1010 plan elements with clear measurable goals
bull Identify a time frame for accomplishment with measures of interim progress
27
BIBLIOGRAPHY
Adams T and K Sullivan 1989 The Physics of Forest Stream Heating a Simple Model Weyerhaeuser Research Report TFW-WQ3-90-007
Beschta et al 1987 Stream Temperature and Aquatic Habitat Fisheries and forestry interactions pp 191-232 In EO Salo and TW Cundy (eds) Streamside Management Forestry and Fisheries Interactions Institute of Forest Resources Contribution No 57 University of Washington Seattle
Beschta R L and R L Taylor 1988 Stream Temperature Increases and Land Use in a Forested Oregon Watershed Water Resources Bulletin February Vol 24 No 1 19-25
Bliss Tim 2001 Burnt River Water Quality Study Final Report Review Comments Wallowa Whitman National Forest Baker City Oregon
Boyd Matthew S 1997 Thermodynamic Stream Relationships and Management Practices Oregon Department of Environmental Quality Portland
Boyd Matthew and Debra Sturdevant 1997 The Scientific Basis for Oregon=s Stream Temperature Standard Common Questions and Straight Answers Oregon Department of Environmental Quality Portland
Brazier J R and G W Brown 1973 Buffer Strips for Stream Temperature Control Research Paper 15 Forest Research Laboratory School of Forestry Oregon State University Corvallis
Brown G W and J T Krygier 1967 Changing Water Temperatures in Small Mountain Streams Journal of Soil and Water Conservation November-December Pp 242-244
Brown G W and J T Krygier 1970 Effects of Clear-cutting on Stream Temperature Water Resources Research Vol 6 No 4 1133-1139
Brown G W G W Swank and J Rothacher 1971 Water Temperature in the Streamboat Drainage USDA Forest Service Research Paper PNW-119
Crowe Elizabeth 2001 Comments on Vegetative Site Capability for Burnt River Water Quality Study Deschutes National Forest Bend Oregon
Crowe Elizabeth and R Clausnitzer 1997 Midmontane wetland plant associations of the Malhuer Umatilla and Wallowa-Whitman National Forests USDA Forest Service R6-NRshyECOL-TP-22-97
Donato Mary 2002 An Empirical Predictive Stream Temperature Model for the Salmon and Clearwater River Basins Idaho US Geological Survey Water Resources Investigation Report 2002-xxxx (in press)
28
Duncan David 1999 Defining a Surrogate David Duncan and Associates Boise Idaho
Edinger J E D K Brady and J C Geyer 1974 Heat Exchange and Transport in the Environment Report No 14 Electric Power Research Institute Publication No 74-049-00-34
Hidore JJ and J E Oliver 1993 Climatology ndash An Atmospheric Science Macmillan Publishing Company New York New York Pp 23-65
Independent Multidisciplinary Science Team 2000 Influences of Human Activity on Stream Temperatures and Existence of Cold-water Fish in Streams with Elevated Temperature Results of a Workshop ndash Technical Report 2000-2 Corvallis Oregon
Jaindl Ray 2001 Recommendation to Burnt River Steering Committee at their September 21 meeting Salem Oregon
Larson Larry and Michael Borman 2000a Use Attainability Assessment (Temperature Standard) Burnt River Watershed Rangeland Resources Department Oregon State University Corvallis
Larson Larry and Michael Borman 2000b Use Attainability Assessment (Temperature Standard) Burnt River Watershed ndash Appendix A ndash Burnt River Shade Soil Temperature and Groundwater Recharge Estimates A First Approximation Rangeland Resources Department Oregon State University Corvallis
Larson Larry and Michael Borman 2000c Use Attainability Assessment (Temperature Standard) Burnt River Watershed ndash Appendix B ndash Elevation Thermal Environment and Stream Temperature on Headwater Streams in Northeastern Oregon Rangeland Resources Department Oregon State University Corvallis
Larson Larry and Michael Borman 2001 Summary Document Burnt River Research 1998-2000 Rangeland Resources Department Oregon State University Corvallis
Leonard Stephen G 2001 Burnt River Site Capability Review National Riparian Service Team Bend Oregon
McRae G and C J Edwards 1994 Thermal Characteristics of Wisconsin Headwater Streams Occupied by Beaver Implications for Brook Trout Habitat Transactions of the American Fisheries Society 123641-656
Mangelson Kenneth 2000a Burnt River Basin Water Temperature Modeling Study Draft Final Report U S Department of the Interior Bureau of Reclamation Technical Service Center Denver
Mangelson Kenneth 2000b Burnt River Basin Correlation Tables U S Department of the Interior Bureau of Reclamation Technical Service Center Denver
Mangelson Kenneth 2000c Summary Description of Burnt River Modeling Runs to Assess the 29
Impacts of Variations in Air Temperatures and Solar Radiation U S Department of the Interior Bureau of Reclamation Technical Service Center Denver
Mangelson Kenneth 2001a Burnt River Basin Water Temperature Modeling Study Final Report U S Department of the Interior Bureau of Reclamation Technical Service Center Denver
Mangelson Kenneth 2001b Technical Memorandum Water Temperature Computer Modeling Runs for Different Global Shade Estimates than were used in the Final Report U S Department of the Interior Bureau of Reclamation Technical Service Center Denver
Neiburger Morris James G Edinger and William D Bonner 1982 Understanding our Atmospheric Environment WH Freeman San Francisco
Nichols Richard 2001 DEQ Review Comments of Draft Final Report Dated April 2001 Department of Environmental Quality Bend Oregon
Risley John Edwin Roehl and Paul Conrads Estimating maximum Water Temperatures in Small Streams in Western Oregon Using Neural Network Models US Geological Survey Water Resources Investigation Report 2002-xxxx (in press)
Shortley George and Dudley Williams 1961 Elements of Physics for Students of Science and Engineering Prentice-Hall Englewood Cliffs N J
Ward JV 1985 Thermal Characteristics of Running Waters Hydrobiologia 12531-46
30
NOTES 1 MOU Participants Oregon Dept of Environmental Quality Oregon Department of Agriculture Burnt River Irrigation District Powder Basin Watershed Council Bureau of Reclamation Snake River Area Office Oregon State University College of Agricultural Sciences Environmental Defense Oregon Farm Bureau Federation Oregon Department of Fish and Wildlife Natural Resources Conservation Service Wallowa Whitman National Forest Bureau of Land Management Vale District Oregon State University Extension Service Oregon Water Resources Department Oregon Water Resources Congress Burnt River Soil and Water Conservation District Most of the participating agencies and organizations provided members for a steering committee and a technical committee that were established for oversight2 In 1997 the Oregon Legislature adopted Senate Bill 1010 authorizing the Oregon Department of Agriculture to develop and carry out an agricultural water quality management area plan for agricultural and rural lands where a water quality management plan is required by state or federal law Local water quality management area advisory committees are established to participate in the development and ongoing modifications of the plan These plans ldquofor the prevention and control of water pollution from agricultural activities and soil erosion in a management areahelliprdquo(OAR 603-095-0010(5)) are commonly referred to as ldquo1010 plansrdquo ODA administrative rules (OAR 603-090-0030) state that 1010 plans ldquohellipshall describe a program to achieve the water quality goals and standards necessary to protect designated beneficial uses related to water quality as required by state and federal lawrdquo3 MOU Bureau of Reclamation MOU No 1425-8-MU-10-02170 MOU objectives listed in italics at the beginning of each section of the current report4 Technical Reports Larson Larry and Michael Borman 2000a 2000b 2000c 2001 Mangelson Kenneth 2000b 2001a 2001b 5 Environmental Defense Statement The Burnt River Water Quality Study (BRWQS) was initiated in 1998 in an attempt to identify consensus-based actions to improve stream temperature conditions in the Burnt River Basin Environmental Defense=s principal interests in agreeing to participate as a MOA signatory in the BRWQS initiative were in the exploration of alternatives to the temperature standard that could yield better stream health results in the identification of alternative ways that landowners management activities could enhance stream health and in implementing acceptable and low cost incentives for encouraging such land management activities During the ensuing nearly three years of the BRWQS=s process Environmental Defense expressed concerns about the lack of appropriately structured peer reviews of research and studies and the lack of linkages of the project=s research to problem-solving policies and actions Nevertheless the BRWQS=s direction of work became progressively more narrowly focused than the directions indicated by the goals of the MOA signed by the participants in 1998 These goals related to the identification of a surrogate for the temperature standard and the incorporation of the BRWQS project=s work into the agricultural water quality management planning process (1010 plans) for the Burnt and by example the 1010 planning process for other Oregon river basins with temperature problems While some discussion of these goals did occur in BRWQS meetings the BRWQS=s focus became a set of loosely connected technical studies with an ongoing and ad hoc set of reviews These reviews benefited from the experience and expertise of a number of knowledgeable individuals some of who are employed by state or federal agencies At the same time many of these agencies are also stakeholders in the policy-related issues and problems that were to be addressed by the BRWQS In such cases compliance with one criterion for credible research peer reviews -- that reviewing entities have disinterested third-party status -- was problematic Many of the studies conducted as part of the BRWQS=s process addressed relevant issues At the same time Environmental Defense did not envision as a MOA signatory that these studies were to become the principal product of the BRWQS project Environmental Defense continues to support research efforts but we expect such efforts to be undertaken to produce some utility in or to have applicability to the implementation of problem-solving actions In our judgment the BRWQS project has not identified significant and tangible directions or recommendations that will be useful in problem solving with regard to temperature problems in the Burnt River or in other river basins in Oregon or elsewhere Environmental Defense views the BRWQS project as having produced some interesting exchanges of views and information but at the same time falling short of achieving its main objectives6 Reclamation modeled a main stem reach from Unity dam to the head of the Burnt River canyon using the SNTEMP stream temperature model originally developed for and maintained by the U S Fish and Wildlife Service Reclamation assessed model performance based on predictions of stream temperature at the validation stations on the Burnt River during the calibration and verification tests given measured climatological and flow data Findings (1) The pattern
31
and magnitude of ditch diversions and return flows were critical in calibrating the computer model Initial estimates of the timing and rates of irrigation diversions and return flows were modified in the model applications in order to accurately predict instream temperatures (2) The calibrated model performed very well in predicting mean daily water temperatures in comparison with the measured temperatures but the predicting of maximum daily instream temperatures was not as accurate (3) Prediction of maximum daily instream temperatures was improved through the development of regression equations Regression equations were developed using climatic variables flows and mean daily instream temperatures computed by the calibrated model runs and were found to accurately predict maximum daily instream temperatures thoughout the modeling reach except for the stream reach near the dam which is most affected by reservoir outflows 7 The organization of this section and much of the theoretical discussion is based on Boyd and Sturdevant 1997 8 Based on Mangelson 2001a Figures B-8 D-7 and E-4 9 Based on Mangelson 2001a Figures B-14 D-9 and E-610 Based on Mangelson 2001a Figures B-13 D-8 and E-5 11 Independent Multidisciplinary Science Team 2000 p 8 12 Independent Multidisciplinary Science Team 2000 p 23 13 Independent Multidisciplinary Science Team 2000 p 21 Quote taken from Beschta et al 1987 14 Boyd and Sturdevant 1997 15 Neiberger Edinger and Bonner 1982 p 65 16 Mangelson 2001a p iii Boyd and Sturdevant 1997 p 6 17 Based on Boyd and Sturdevant 1997 p 7 and Mangelson 2001a Figure 15 ff p 47 18 Data equations and graphs for other July days are reported in Mangelson 2001a Appendix L 19 Actual shade values were not measured but are somewhat higher Therefore the values for both solar and atmospheric radiation are very slightly overestimated20 Mangelson 2001a Appendix L Burnt River Hourly Heat Flux for Station BR-CP near Durkee for July 14 1999 21 Based on Mangelson 2001a Appendix L Burnt River Hourly Heat Flux for Station BR-CP near Durkee for July 14 1999 22 Mangelson 2001a Appendix C Mangelson 2000b 23 Mangelson 2001a Appendix L The equation for atmospheric radiation is HA = (1-SA)(1+017bullCL
2) (336+0706bull(Rhbull1064TA)12)(10-8bull(TA+27316)4) where HA = atmospheric radiation (Jm2sec) SA = atmospheric shade factor (decimal) CL = (1-SSo)35 = cloud cover (decimal) S = actual sunshine So = optimal sunshine SSo = sunshine ration (decimal) ea = vapor pressure = Rhbull(660bull(1064TA))(mb) Rh = relative humidity TA = air temperature S and So were estimated based on weather station solar and rainfall data All other parameters are based on actual weather station data 24 Mangelson 2000c These findings are based on taking real temperature data and varying them hypothetically while keeping all other variables constant ndash a condition that would not occur in nature The air temperatures modeled would not occur on a regular basis in nature25 Mangelson 2001a Appendix L 26 Reclamation felt attaining 50 percent shade was not possible given the width and soil conditions on the main stem but some participants did not agree27 Brown et al 1971 Beschta and Taylor 1988 Brown and Krygier 1967 and 1970 and Brazier and Brown 1973 28 Brown et al 1971 29 Adams and Sullivan 1989 30 McRae and Edwards 1994 31 Mangelson 2000c These findings are based on taking real solar radiation data and varying them hypothetically while keeping all other variables constant ndash a condition that would not occur in nature The solar radiation modeled would not occur on a regular basis in nature32 Data collected by the Forest Service in 1990-91 showed North Fork Burnt River temperatures ldquomirroring air temperature ndash about 68-70 degF in cool cloudy misty weather and about 78 degF in warm clear weatherrdquo (Bliss 2001) 33 Mangelson 2001a Appendix L Burnt River Hourly Heat Flux for Station BR-CP near Durkee for July 14 1999 34 Shortley and Williams 1961 p 347 35 Boyd and Sturdevant 1997 p 7 36 Data collected by Art Kreger (Wallowa-Whitman National Forest soil scientist) showed mean summer soil temperatures at 20 inch depth in the Burnt River subbasin varying from 38 to 48 degF above 5000 feet on north slopes and above 6000 feet on south slopes Mean soil temperatures were between 54-64 degF below 3000 feet on north slopes and
32
4000 feet on south slopes (Bliss 2001)37 Ward 1985 38 Adams and Sullivan 1989 39 Ward 1985 40 Independent Multidisciplinary Science Team 2000 p 21 41 Mangelson 2001a p iii 42 Boyd and Sturdevant 1997 p 16 43 Reclamation felt that narrowing the channel by 30 percent would not practically occur but some participants felt the channel might be narrowed appreciably from its present width if allowed to evolve toward its potential44 Boyd and Sturdevant 1997 p13 45 Leonard 2001 p2 Crowe 2001 p 2 46 Crowe 2001 p1 Leonard (2001 p2) also states that ldquo[t]he Burnt River from near Unity Reservoir to the canyon near Bridgeport does not exhibit characteristics conducive to cottonwood regenerationrdquo47 Leonard (2001 p2) points out that ldquo[c]ottonwoods may grow in this segment if planted but it is highly unlikely that there would be recruitment from seed 48 Based on Mangelson 2001a Figures B-7 and D-8 49 Based on Mangelson 2001a Figures B-8 and D-9 50 Larson and Borman 2000 pp 3-10 51 Crowe 2001 p 2 At the time of her review Elizabeth Crowe was an Area Ecologist with the Central Oregon Interagency Ecology Group She had previously been an ecologist with the Wallowa Whitman National Forest and had extensive experience in the Burnt River She has published a guide to the plant communities of the Blue Mountains (Crowe and Clausnitzer 1997)52 Three types of willow species are found in Burnt River riparian areas (Coyote Booth and Yellow) Leonard (2001) provided two estimates of Coyote Willow heights (2-3 meters and an average of 87 feet) Crowe (2001) found Coyote Willow to grow to 6 feet in the Blue Mountains and Central Oregon Leonard (2001) provided two estimates of Booth Willow height (2-4 meters and 3-5 meters) Crowe (2001) estimated Booth and Yellow willow to grow to heights between 8 and 13 feet in the Blue Mountains and 7 to 75 feet in Central Oregon53 Crowe 2001 p1 54 At the time of his review Steve Leonard was a Bureau of Land Management ecologist on the National Riparian Service Team Leonard participated in the 1998 interagency Proper Functioning Condition Assessment of the Burnt River 55 Leonard 2001 p2 56 Crowe 2001 p 3 57 Crowe 2001 p4 58 Estimates are contained in Mangelson 2001b p 5 Methodology is discussed in Larson and Borman 2000 pp 3shy10 59 Mangelson 2001b p 5 60 DEQ staff have done quick estimates of effective shade for the modeled reach ldquohellipthat include low end estimates similar to those reported here and high end estimates up to 50 percentrdquo (Nichols 2001 p5)61 Mangelson 2001b p 3 62 When surface water temperatures exceed 64 degF (on a seven day average maximum) in streams where salmonid fish rearing is designated as a beneficial use no measurable surface water temperature increase from human activities is permitted without a DEQ-approved temperature management plan (Oregon Administrative Rules 340-41-725(2)63 Oregonrsquos stream temperature standard is made up of two components (1) the numeric criteria (which includes the 64 degF criterion for salmonid rearing) identified in basin standards which trigger actions to be taken when stream temperatures rise above these criteria and (2) the rule language which puts the criteria in context and explains what constitutes a violation and what needs to happen when a violation occurs The water temperature standard for the Burnt River is described in Oregon Administrative Rules (340-41-765)64 The temperature standard can be satisfied by having an approved water quality management plan in place even if the plan shows that the 64ordmF criterion cannot be met65 The Burnt River study addressed temperature only and did not take into consideration any other parameter such as sediments nutrients or bacteria nor did it evaluate the effect of a decline in existing riparian vegetation on water quality66 Jaindl 2001
33
67 At the beginning of the study agricultural interests were interested in pursuing a prototype healthy streams standard but they abandoned that effort because they felt that the U S Environmental Protection Agency would not support it68 U S Environmental Protection Agency 69 The Total Maximum Daily Load (TMDL) is the total amount of pollutant that can enter a water body without violating water quality standards The TMDL process assesses what is causing temperature standard exceedances (point non-point and background sources) and determines what pollutant loadings must be met to achieve standards (OAR 340-41-026 (3) (a)(D)(ii)70 If a temperature criterion is not being met in a given stream section 303(d) of the Clean Water Act (CWA) requires that the state place that stream on a 303(d) list of water quality limited steams and complete a TMDL The main stem below Unity Dam and the North Fork are currently listed on DEQrsquos 303(d) list as water quality limited for temperature71 OAR 340-41-026(3)(a)(D)(ii) 72 Recent studies done by the US Geological Survey in cooperation with the Oregon and Idaho Departments of Environmental Quality (Donato 2002 Risley et al 2002) have used elevation to estimate ldquonaturalrdquo water temperatures73 The US Geological Survey and the Idaho Department of Environmental Quality (Donato 2002) have developed regression equations to predict stream temperatures in the Salmon and Clearwater basins of Idaho Grand averages have been developed using watershed area elevation and slope and then daily averages have been predicted using a seasonal adjustment factor and air temperature
34
APPENDIX A --PARTICIPANT COMMENTS
Objective 1 Factors Contributing to Stream Temperatures
Environmental Defense
Objectives Achieved
bull Identified physical conditions influenced by human activities (vegetation surface and groundwater flows channel shape sinuosity entrenchmentflood plain connection structures such as reservoirs and diversion dams)
bull Surveyed literature and other water quality planning in Oregon to identify three important factors (stream surface shading flow volume channel width and depth) for managing instream water temperatures
bull Commenced with development of a modeling system (Stream Network Temperature Model plus input data and assumptions) for use in evaluating the relative sensitivity of water temperatures to changes in physical conditions (eg channel shape surface shading)
Objectives Not Achieved
bull Did not identify the relationship between properly functioning conditions (PF C) assessments and water temperature management
bull Did not develop performance criteria for the modeling system or to conduct a performance
evaluation of the modeling system
Objective 2 Temperature Management Alternatives Environmental Defense
Objectives Achieved
bull Commenced with development of a modeling system (Stream Network Temperature Model plus input data and assumptions) for use in evaluating the relative sensitivity of water temperatures to changes in physical conditions (eg channel shape surface shading) and management practices (eg surface flow reduction vegetation propagation)
bull Assessed the potential for increasing stream surface shade through vegetation management
Objectives Not Achieved
bull Did not develop performance criteria for the modeling system or to conduct a performance evaluation of the modeling system Consequently no scenarios (ie variations of physical
A-1
conditions and management practices) were developed to model and conduct both local and global sensitivity analyses to estimate the relative effectiveness (in terms of costs versus benefits) of changing physical conditions through management practices to reduce peak instream temperatures
bull Did not determine what management practices are feasible by building consensus on the definition of feasible and evaluating the potential utility of management practices deemed feasible in terms of the anticipated costs versus benefits
bull Did not consider or develop a water pollution reduction crediting system for landowners voluntarily implementing management practices
Objective 3 Develop a Surrogate Environmental Defense
Objectives Accomplished
bull Discussed a conceptual definition of a surrogate in terms of measures of physical conditions and management practices including vegetation irrigation return flows instream flows cold water refugia channel width sinuosity and PFC assessments
bull Discussed defining a surrogate in terms of a Healthy Streams Standard
bull Developed a seven-part surrogate definition and implementation process that includes (1) establishing the existing physical conditions of each measure (2) defining the peak potential of each measure (3) identifying factors inhibiting ultimate attainment of peak potential (4) establishing g oals that incorporate peak potential and inhibitions (5) defining existing conditions or actions that would be prohibited (6) implementing a monitoring program (7) reviewing all goals definitions and conclusions based on information gathered during implementation
Objectives Not Accomplished
bull Did not reach a consensus on the feasibility of any candidate temperature surrogates
bull Did not propose one or more ldquopilotrdquo temperature surrogate applications at suitable sites to test the concept in on-the-ground situations
Objective 4 1010 Plan Environmental Defense
Objectives Achieved Developed a Final Report summarizing the lack of consensus on procedural scientific and socioeconomic considerations pertaining to the design of a 1010 plan in the Burnt River Basin
A-2
Objectives Not Achieved Did not produce a Final Report with uniformly credible scientific findings and feasible management actions for consideration and possible incorporation into a 1010 plan for the Burnt River Basin or for guidance in the design of temperature control policies and actions in other river basins in Oregon and elsewhere
A-3
APPENDIX B
SUMMARY DOCUMENT
BURNT RIVER RESEARCH 1998-2000
Larry Larson amp Michael Borman Rangeland Resources Department
Oregon State University
April 4 2001 Final report
(revised July 19 2001)
B-1
INTRODUCTION
Thermodynamic laws state that the temperature of an object will spontaneously trend toward the temperature of the surrounding thermal environment (Halliday and Resnik 1988) Temperature difference and exposure time influence this process In the study of water temperature the concept of an equilibrium temperature is used to describe the response of water temperature to meteorological conditions (Edinger et al 1968) The equilibrium temperature is a dynamic number that reflects change in the sum of the radiation conduction and evaporation processes primarily at the water-air interface
Studies were undertaken to evaluate factors that could influence how fast stream temperatures approach thermal equilibrium and influences that could occur after a thermal equilibrium was achieved The studies provide a description of vegetation site potential and associations between headwater elevation weather and land use to observed patterns of stream temperature
VEGETATION SITE POTENTIAL
A study was conducted to provide an initial estimate of the shade potential along the Burnt River The following is an illustration of the geomorphic soil and vegetation patterns that occur along the river between Unity Reservoir and Bridgeport
Geomorphic Soil and Ecological Site Complex
Four ecological sites (Laird et al 1988) dominate the river reach between Unity Reservoir and Bridgeport (wet meadow meadow loamy bottom and sodic meadow) Their occurrence upon the landscape is closely associated with geomorphic surfaces and soils (figures 1-3) The youngest geomorphic surface in the Burnt River valley is called Horseshoe It forms the lowest flood plain and is subject to annual flooding The surface includes channel point bars channel fillings and abandoned meanders The Horseshoe surface is the primary zone of scouring and deposition and is subject to rapid landscape changes due to the abandonment of older channels lateral migration of meanders and downstream movement of alluvial deposits The soil survey describes these young surfaces as Riverwash Fluventic and Fluvaquentic Haploxerolls The next floodplain Ingram is slightly higher than the Horseshoe The soils are more developed and ecological sites have been described within the current soil survey Ingram provides an undulating surface that defines over-bank channeling during flood stage Textures within the Ingram surface will tend to become finer as you move upslope away from the channel Annual flooding is common on the Ingram surface and soils tend to be moist for extended periods forming wet meadow communities over Cumulic Haplaquolls (Boyce and Wingdale soils) in lower areas and meadow communities over Fluvaquentic and Pachic Haploxerolls (Balm and Wingville soils) on elevated surfaces Localized areas within this zone are affected by salt accumulation that has occurred over geologic time These salt-affected surfaces form Typic Haplaquepts (Baldock and Haines soils) which support sodic meadow communities The oldest surface associated with the Burnt River flood plain is called Winkle The surface forms a series of benches and terraces that are remnants of abandoned flood plains Winkle is an undulating surface that provides a variety of local elevation differences
B-2
Flooding in this zone varies from common to infrequent reflecting the elevation pattern of the surface Soils formed on these surfaces tend toward Cumulic and Pachic Halpoxerolls (Jett and Powval soils) or Xerollic Camborthids (Legler soil) which support Loamy bottom communities
The Occurrence of Willow
A fifth ecological site (NRCS 2000) called willow riparian (Booth willow) also occurs within the Hereford reach The willow riparian site forms linear galleries within the Horseshoe surface and localized inclusions within the other ecological sites Dominant willow species for this ecological site include Booth yellow and coyote willow Each species is described as an obligate wetland indicator tolerating some but not prolonged flooding above the root crown and being associated with a water table that drops during the growing season but remains within reach of the root system (Crowe and Clausnitzer 1997) Booth and yellow willow are root crown sprouters that produce a multi-stem treeshrub that is typically less than 15 feet in height Coyote willow sprouts from a creeping root system forming a thicket of single stemmed shrubs Thicket height typically ranges from 5-10 feet Establishment (seed) for each of these species is closely associated with river channel scouring and deposition Booth and yellow willow will tend to be associated with fine sand and silt deposition Soils supporting these species generally contain redoximorphic features several feet below the soil surface Coyote willow on the other hand is normally associated with sandy to skeletal deposits and sites that lack redoximorphic features Seedling establishment for all three species is closely associated with the exposure of fresh mineral deposits that are free of competition and remain moist during initial establishment In addition to seed establishment these species may also become established through the burial of detached limbs and the deposition of plants dislodged from upstream locations during flood events
Integration
Channel scouring and deposition is the principal means by which colonization sites are created for willow in the Hereford reach Substrate size as well as the timing and patterns of substrate deposition will greatly influence willow establishment The Horseshoe surface provides the greatest opportunity for scouring deposition and colonization Additional colonization may occur within the Ingram surface if the deposition remains moist and free of competition during seedling establishment Suitable Ingram surfaces currently support sedge rush and grass communities that rapidly re-colonize areas of deposition following flooding
The majority of the river in the Hereford reach has evolved into an E channel (Rosgen 1996) Its flat gradient and flood plain are dominated by wet meadow and meadow communities In most areas fine sediment deposits are a minimum of 3 feet deep This can generally be interpreted to mean that the channel is no longer recruiting large amounts of gravel into this portion of the valley Lateral channel movement continues to rework existing deposits exposing them and providing sites for plant colonization Alluvial bars are being formed from materials ranging in size from silt and fine sand to gravel Herbaceous colonization increases as the texture of these bars tends toward finer particle sizes Conversely bars dominated by gravel tend to provide a greater opportunity for colonization by species such as coyote willow Overflow channels swales and depressions that occur in the immediate vicinity of the channel may accumulate deposits of silt and fine sand that are of sufficient depth and size to slow re-colonization by herbaceous species When this occurs the potential for establishing Booth and yellow willow is increased
B-6
Findings
The following river shade estimates reflect the availability of substrates commonly associated with the colonization of woody species in riparian areas For the purposes of this study percent shade is defined as the percent of water surface over which direct solar radiation is intercepted by vegetation between 1000 am and 200 pm
APPROXIMATE AMOUNT AND RIVER SHADING ALONG THE MAINSTEM COMMUNITIES OF THE BURNT RIVER
Hereford 2 Durkee3
COMMUNITY 1 MILES SHADE MILES SHADE
Wet meadowmeadow (no gravel) 214 3-4 15 2-3
Loamy bottom 06 2-3 130 1-2
Wet meadowmeadow (gravel) 45 4-5 30 4-5
Riverwash 23 13
Channelized Meadow (no gravel) 15 1-2
Sodic meadow 15 1
Sodic meadow 07 1
1 Community refers to NRCS ecological site description 2 Hereford refers to the Burnt River between Unity Reservoir and Bridgeport 3 Durkee refers to the Burnt River between the canyon mouth above Durkee downstream to Lime The canyon between Bridgeport and Durkee is not included in this table
HEADWATER
A number of literature references indicate that headwater sources reflect the temperature of the thermal mass from which they originate (Ward 1985 Meisner et al1988 Raphel 1962 Adams and Sullivan 1989 McRae and Edwards 1994) When headwater sources contribute significant cold or cool water to a stream their contribution will depress the diurnal range of stream temperature In addition these waters typically show a higher rate of temperature change due to large differences between equilibrium and headwater temperatures
B-7
Study Results ndash Headwater
Average soil temperature at 1-ft depth in August at 6000 ft is 50 F
Headwater data (August 1999) - Barney and Stevens Creeks1
Barney Stevens
Elevation 7150 ft 6600 ft
Source temp 375 F 40 F
Distance to 6000 ft elev 6200 ft 2450 ft
F increase500ft distance 10 09
F increasehr 16 13
Average Velocity 02 fs 02 fs
Average depth 35 in 30 in
Exposure time 85 hr 34 hr
6000 ft temperature 515 F 445 F
1 Water temperatures at source and 6000 ft are rounded to the nearest 05 F
Elk Creek headwater source was not studied However side channel data and field observations note that side channels enter the main stream at 5900 and 5600 ft elevations Their combined contribution is equal to frac12 of the stream flow and enters the stream approximately 3 F cooler then the main channel Field notes indicate that saturated soils and seeps occur in several locations downstream and are more frequent than on any other stream studied
Findings
Based upon headwater temperatures Barney and Stevens Creeks appear to originate from snowmelt that has moved subsurface to the spring sources Barney Creek springs are located at about 7200-ft elevation and temperatures ranged from 374 to 385oF Stevens Creek spring is at nearly 6700-ft elevation and temperatures ranged from 388 to 417oF To reach the spring source from snowmelt water traveled further subsurface to reach Stevens Creek than to reach Barney Creek The thermal environment of the soil appears to have been warmer than the initial snowmelt temperature of the water and to have had a warming effect
Water temperature differences between Barney and Stevens Creeks at the 6000-ft elevation appear related to exposure time differences Barney Creek exposure time was 25 times longer than Stevens Creek At 6000-ft elevation average monthly mean water temperatures were
B-8
493oF (July 1999) to 543oF (July 1998) for Barney Creek and 430oF (July 1999) to 453oF (July 1998) for Stevens Creek
ELEVATION
Elevation differences exert a strong influence on the thermal regime of running water (Ward 1985 Meisner et al 1988 Raphel 1962 McRae and Edwards 1994 Larson and Larson 1997) Air density decreases with increasing elevation which decreases the insulating effect of air at the Earthrsquos surface Lower air temperatures and water vapor pressure reduce the influence of long-wave radiation at higher elevations As a result of these interactions the thermal environment at higher elevations is characterized by more rapid thermal cycling and less warming Waters observed at different elevations reflect these characteristics Waters flowing down an elevation gradient are subject to temperature equilibrium regimes that are warmer than where they originate
Study Results ndash Elevation
Tests were performed to determine if there was an association between elevation and mean air soil and water temperature Results from these tests showed a strong association between elevation and mean daily air soil and water temperatures Mean daily air soil and water temperatures increased with each 500-ft drop in elevation
Water Data - August 1999 Example
Barney Stevens Elk
6000-ft temperature + range 51 + 5 F 45 + 2 F 45 + 3 F
4500-ft temperature + range 58 + 8 F 57 + 8 F 50 + 4 F
Thermal Gradient
6000 ft 78 F 104 F 108 F
4500 ft 44 F 39 F 88 F
Exposure Time (hr) 7 11 45
Temperature Change (F) 7 12 5
Findings
Mean daily air soil and water temperature increased with each 500-ft drop in elevation The pattern was similar to the adiabatic rate of air temperature change which is 3 - 5 F (17 ndash 28 C) for every 1000 ft (300 m) drop in elevation
B-9
Two years of water temperature data from the four headwaters streams suggested that streams that lack significant cold-water inputs will exceed the water temperature standard at about the 4500-ft elevation during July and August
The convergence of mean daily air and mean daily water temperature indicated that Barney and Stevens Creeks were approaching equilibrium as they dropped in elevation As an example the mean air and water temperature differences (air temperature minus water temperature) during August 1999 were 77 68 50 and 45oF on Barney Creek and 104 86 76 and 40oF on Stevens Creek at 6000 5500 5000 and 4500-ft elevations respectively
Total exposure time (spring sources to 4500-ft elevation) for Barney and Stevens Creeks were similar and likely accounted for much of the similarity in the average monthly mean and maximum temperatures at 4500-ft elevation Barney (58 and 67 oF Aug 1999) had a total exposure time of 155 hr Stevens (57 and 64 oF Aug 1999) had a total exposure time of 144 hr
Elk Creek was delayed in reaching thermal equilibrium with its thermal environment Cold water from the side channels a shorter exposure time (greater stream velocity) and an apparent input of ground water (not measured but based on observed saturated soils along much of the creek) contributed to this delay Additional data collection would be required to determine if thermal equilibrium is achieved on Elk Creek before it joins the flow of the mainstem of South Fork Burnt River
WEATHER INFLUENCE
Water temperature follows but lags behind air temperature (Stefan and Preudrsquohomme 1993 McRae and Edwards 1994 Walker and Lawson 1977 Larson and Larson 1997 Mosheni and Stephan 1999) The similarity between mean air and water temperatures increases as the equilibrium temperature is approached (Adams and Sullivan 1989) At that point daily mean air temperature will be near daily mean air temperature Local air temperature is identified as the single most important parameter influencing daily mean stream temperature (Sinokrot and Stefan 1994 Lewis et al 2000) The air mass is large and exhibits significant temperature swings that can occur on daily seasonal regional and local bases These two characteristics exert a strong influence on the equilibrium temperature
Study Results ndash Headwaters
Tests were performed to determine if a relationship could be determined between monthly air and water temperatures Monthly air temperature differences were associated with significant changes in water temperature Water temperature patterns followed air temperature patterns and reflected the cumulative effect of annual monthly and daily patterns of atmospheric conditions on the equilibrium temperatures of July and August
Further analysis determined that the pattern of monthly temperature differences was not repeated in 1998 and 1999 The lack of a repeated pattern between the two years suggests that
B-10
monthly atmospheric variation had a greater influence on water temperature than did fixed solar patterns
Year Mean Air Temperature Mean Water Temperatures
1998 July 2-4 F gt August July 04-3 F gt August
1999 August 1 F gt July August 0-3 gt July
An exception occurred at 5500 ft elevation on Stevens Creek where mean water temperature was 02 F cooler in July than in August 1998
Study Results ndash Mainstem
Mean daily air water and soil temperatures were determined during July and August in 1998 and 1999 between Unity Reservoir and Clarks Creek Peak air and water temperatures occurred daily between 3 and 4 pm unless climatic conditions disrupted the daily cycle of heating Peak energy accumulation occurs several hours after peak solar radiation When we divided the daily pattern of heating into three 4 hour units air heated most rapidly (30 F) during the first 8 hours of the day (600 am - 200 pm) Water heated most rapidly between 10 am and 2 pm At that time water temperatures generally increased 7 F Water temperatures continued to heat until 3 or 4 pm but the heat accumulation occurred at a slower rate If air temperature accumulation during the first 4 hrs did not approach 14 F then daily water temperature patterns lacked a strong heating pattern Peak soil heating at 1-ft occurred at midnight
Mean JulyAugust temperatures for 199899
Mean + range (F)
1998 1999
Air 66 + 19 65 + 20
Water 66 + 7 65 + 7
Soil 61 + 2 61 + 2
Findings
Monthly water temperature differences in 1998 and 1999 were strongly associated with air temperature differences Water temperature patterns followed air temperature patterns Air and water temperatures were warmer in July vs August 1998 and conversely air and water temperatures were warmer in August vs July 1999
Water and soil temperatures lagged behind air temperatures Air temperature lagged behind peak solar radiation
B-11
Air heated most rapidly during the first 8 hrs of the day Water heated most rapidly between 1000 am and 200 pm When air temperature accumulation did not approach 14oF during the first 4-hr period of the day alon g the mainstem Burnt River daily water temperature patterns lacked a strong heating pattern
River temperatures between Unity reservoir and Clarks Creek were near thermal equilibrium Mean air and water temperatures were nearly equivalent Mean air and water temperatures during July and August were 66oF (1998) and 65oF (1999) Water temperatures typically ranged 7oF above and below the mean and air temperatures ranged 19-20oF above and below the mean
RIVER SEGMENT COMPARISONS
The influence of land use was evaluated by comparing segments of the mainstem that are managed for a specific land use In this case segments of the river approximately 1 mile (16 km) in length were monitored for changes in temperature accumulation in the air water and soil Replicates (2 in 1998 3 in 1999) were monitored during July and August of land managed for 1) hay production followed by winter grazing and 2) grazing using a summer rotation pattern Data collection within each segment of the river was designed to measure the pattern of energy accumulation that took place during 1 hour flow periods
Differences in stream temperature that can be associated with land use should be detectable in the temperature accumulation that occurs within a treatment and the extension of the daily temperature range of the water The data indicated that the water flowing through these treatments had similar (Plt005) amounts of temperature increase (Table 9) No significant difference could be detected in the amount of energy accumulated at the time of daily maximum water temperature the magnitude of the daily water temperature range nor the daily mean water temperature between the treatments compared The accuracy of thermister technology limits data collection to + 04 F (02 C) This means that although an energy accumulation was detected within each mile segment of the river it is not possible to provide an accurate measure of the energy accumulation because it falls below the level of equipment accuracy
Results from this study indicated that each segment of the river accumulated similar amounts of energy regardless of the treatment It is appropriate to state that since no significant differences were observed between river segments land use had minimal effect (non-significant) on the rate of energy accumulation
Findings
Water flowing through hay meadow and summer grazing treatments had similar (Plt005) amounts of temperature increase
Study results indicate that each segment of the river accumulated similar (non-significant) amounts of energy regardless of the treatment
B-12
Land Use
Hay meadows Grazing Winter grazing Summer Rotation
Maximum Temperature
1998 July 07 05 NS
August 02 03 NS
1999
July 06 06 NS
August 04 04 NS
Temperature Range
1998 July 07 04 NS
August 05 05 NS
1999 July 07 05 NS
August 05 05 NS
Mean Temperature
1998 July 04 03 NS
August 02 01 NS
1999 July 03 02 NS
August 02 03 NS
Table 9 Comparison of differences (F) during approximately 1 hour flow time in maximum temperature temperature range and mean temperature during July and August of 1998 and 1999
Shade potential for most of the mainstem Burnt River ranges between 3 and 6
B-13
LITERATURE CITED
Adams T and K Sullivan 1989 The physics of forest stream heating a simple model Weyerhaeuser Research Report TFW-WQ3-90-007
Crowe E A and R R Clausnitzer 1997 Mid-Montane Wetland Plant Associations of the Malheur Umatilla and Wallowa-Whitman National Forests USDA Forest Service Pacific Northwest Region Technical Paper R6-NR-ECOL-TP-22-97
Edinger J E DW Duttweiler and J C Geyer 1968 The response of water temperatures to meteorological conditions Water Resources Research 41137-1143
Halliday D and R Resnick 1988 Fundamentals of physics 3rd ed John Wiley amp Sons Inc New York
Laird W E M H Fillmore G D Macdonald and D P Christenson 1988 Soil survey of Baker County area Oregon USDA NRCS US Gov Print Office WA DC
Larson L and P A Larson 1997 The natural heating and cooling of water Rangelands 196-8
Lewis T E D W Lamphear D R McCanne A S Webb J P Krieter and W D Conroy 2000 Regional assessment of stream temperatures across Northern California and their relationship to various landscape level and site-specific attributes Forest Science Project Humbolt State University Foundation Arcata CA pp420
McRae G and C J Edwards 1994 Thermal characteristics of Wisconsin headwater streams occupied by beaver implications for brook trout habitat Transactions of the American Fisheries Society 123641-656
Meisner J D J S Rosenfeld and H A Regier 1988 The role of groundwater in the impact of climate warming on stream salmonines Fisheries 132-8
Mosheni O and H G Stefan 1999 Stream temperatureair temperature relationship a physical interpretation Journal of Hydrology 218128-141
NRCS 2000 Ecological Site Descriptions Oregon
Raphael Jerome M 1962 Prediction of temperature in rivers and reservoirs J of the Power Division Proceedings of the American Society of Civil Engineers 88157-181
B-14
Rosgen D 1996 Applied river morphology Pagosa Springs CO Wildland Hydrology p 352
Sinokrat B A and H G Stefan 1994 Stream water-temperature sensitivity to weather and bed parameters J Hydraulic Eng 120722-735
Stefan H G and E B Preudrsquohomme 1993 Stream temperature estimation from air temperature Water Resources Bulletin 2927-45
Walker J H and J D Lawson 1977 Natural stream temperature variations in a catchment Water Research 11373-377
Ward J V 1985 Thermal characteristics of running waters Hydrobiologia 12531shy46
B-15
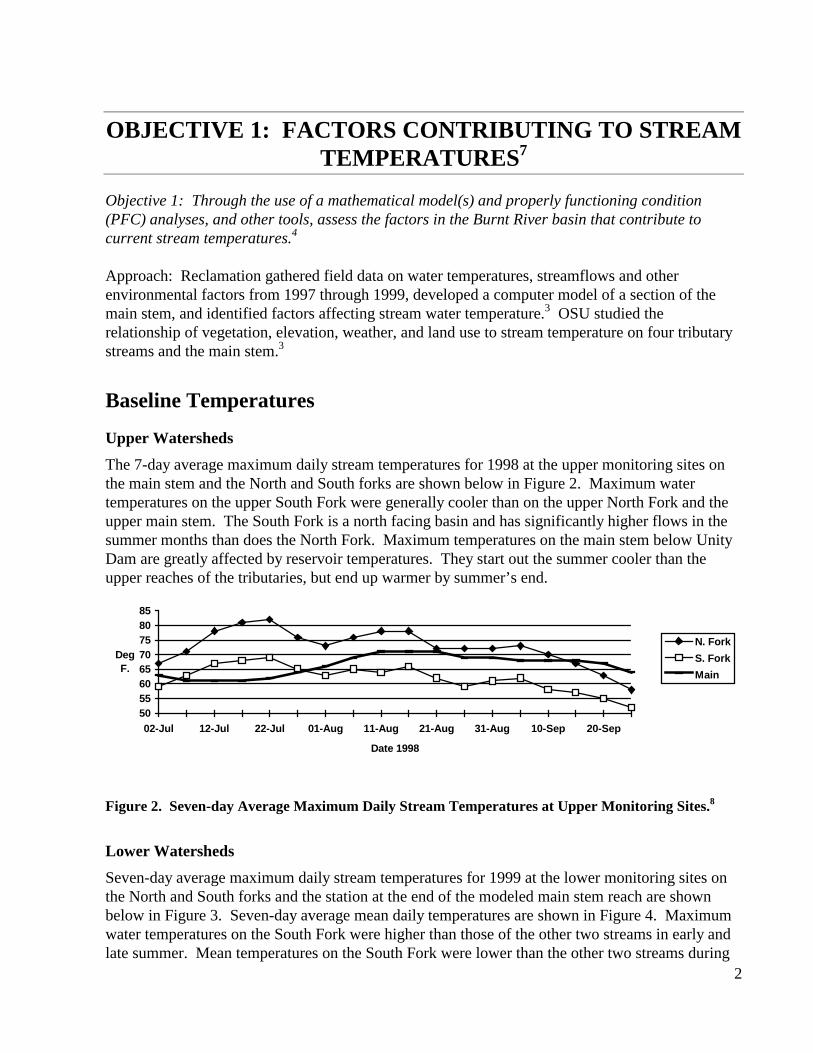
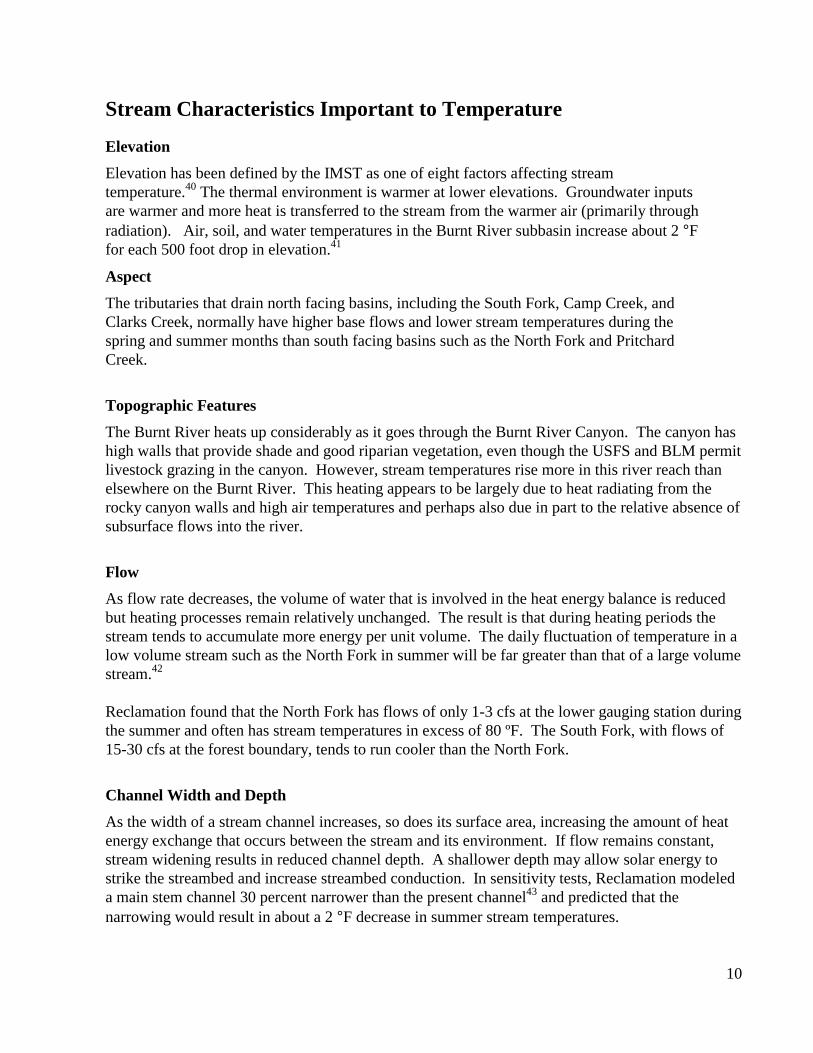
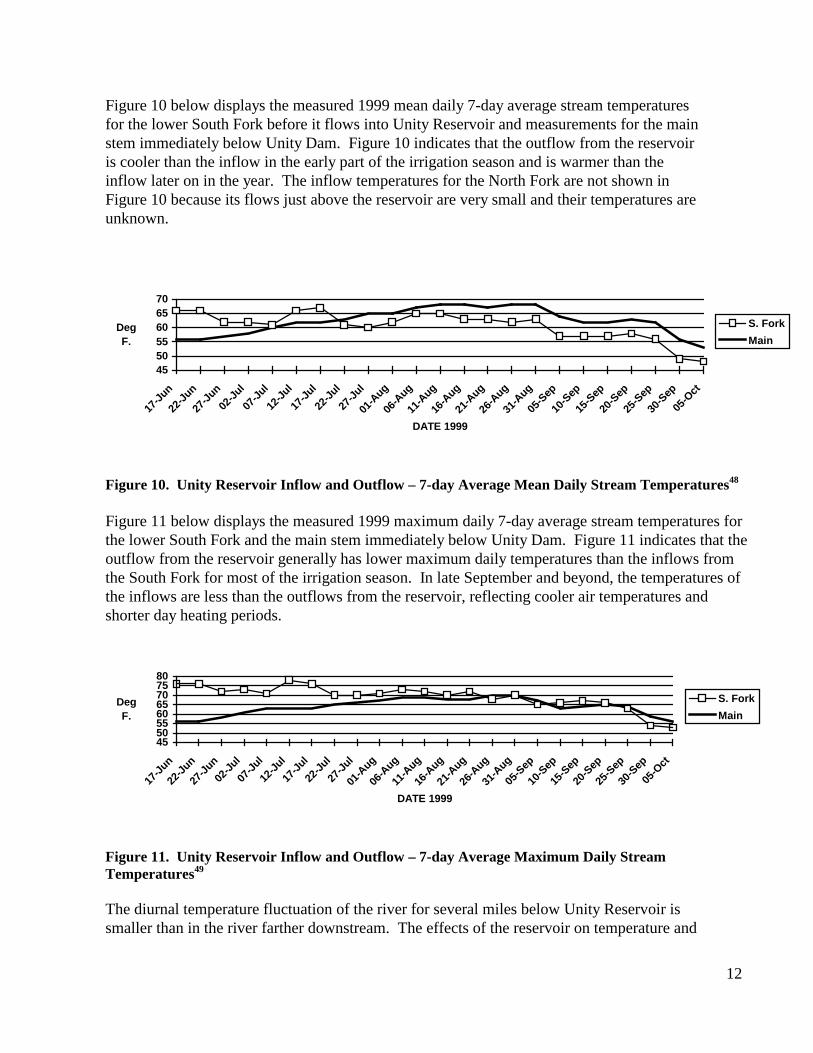
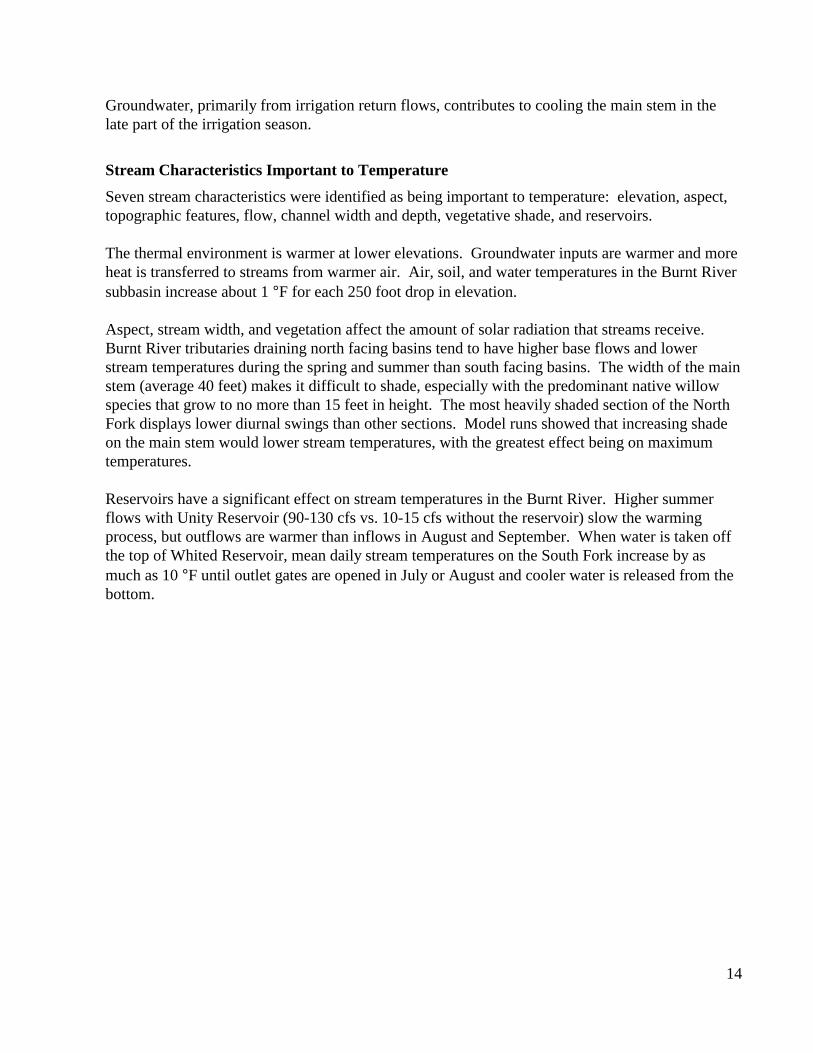

Findings
The following river shade estimates reflect the availability of substrates commonly associated with the colonization of woody species in riparian areas For the purposes of this study percent shade is defined as the percent of water surface over which direct solar radiation is intercepted by vegetation between 1000 am and 200 pm
APPROXIMATE AMOUNT AND RIVER SHADING ALONG THE MAINSTEM COMMUNITIES OF THE BURNT RIVER
Hereford 2 Durkee3
COMMUNITY 1 MILES SHADE MILES SHADE
Wet meadowmeadow (no gravel) 214 3-4 15 2-3
Loamy bottom 06 2-3 130 1-2
Wet meadowmeadow (gravel) 45 4-5 30 4-5
Riverwash 23 13
Channelized Meadow (no gravel) 15 1-2
Sodic meadow 15 1
Sodic meadow 07 1
1 Community refers to NRCS ecological site description 2 Hereford refers to the Burnt River between Unity Reservoir and Bridgeport 3 Durkee refers to the Burnt River between the canyon mouth above Durkee downstream to Lime The canyon between Bridgeport and Durkee is not included in this table
HEADWATER
A number of literature references indicate that headwater sources reflect the temperature of the thermal mass from which they originate (Ward 1985 Meisner et al1988 Raphel 1962 Adams and Sullivan 1989 McRae and Edwards 1994) When headwater sources contribute significant cold or cool water to a stream their contribution will depress the diurnal range of stream temperature In addition these waters typically show a higher rate of temperature change due to large differences between equilibrium and headwater temperatures
B-7
Study Results ndash Headwater
Average soil temperature at 1-ft depth in August at 6000 ft is 50 F
Headwater data (August 1999) - Barney and Stevens Creeks1
Barney Stevens
Elevation 7150 ft 6600 ft
Source temp 375 F 40 F
Distance to 6000 ft elev 6200 ft 2450 ft
F increase500ft distance 10 09
F increasehr 16 13
Average Velocity 02 fs 02 fs
Average depth 35 in 30 in
Exposure time 85 hr 34 hr
6000 ft temperature 515 F 445 F
1 Water temperatures at source and 6000 ft are rounded to the nearest 05 F
Elk Creek headwater source was not studied However side channel data and field observations note that side channels enter the main stream at 5900 and 5600 ft elevations Their combined contribution is equal to frac12 of the stream flow and enters the stream approximately 3 F cooler then the main channel Field notes indicate that saturated soils and seeps occur in several locations downstream and are more frequent than on any other stream studied
Findings
Based upon headwater temperatures Barney and Stevens Creeks appear to originate from snowmelt that has moved subsurface to the spring sources Barney Creek springs are located at about 7200-ft elevation and temperatures ranged from 374 to 385oF Stevens Creek spring is at nearly 6700-ft elevation and temperatures ranged from 388 to 417oF To reach the spring source from snowmelt water traveled further subsurface to reach Stevens Creek than to reach Barney Creek The thermal environment of the soil appears to have been warmer than the initial snowmelt temperature of the water and to have had a warming effect
Water temperature differences between Barney and Stevens Creeks at the 6000-ft elevation appear related to exposure time differences Barney Creek exposure time was 25 times longer than Stevens Creek At 6000-ft elevation average monthly mean water temperatures were
B-8
493oF (July 1999) to 543oF (July 1998) for Barney Creek and 430oF (July 1999) to 453oF (July 1998) for Stevens Creek
ELEVATION
Elevation differences exert a strong influence on the thermal regime of running water (Ward 1985 Meisner et al 1988 Raphel 1962 McRae and Edwards 1994 Larson and Larson 1997) Air density decreases with increasing elevation which decreases the insulating effect of air at the Earthrsquos surface Lower air temperatures and water vapor pressure reduce the influence of long-wave radiation at higher elevations As a result of these interactions the thermal environment at higher elevations is characterized by more rapid thermal cycling and less warming Waters observed at different elevations reflect these characteristics Waters flowing down an elevation gradient are subject to temperature equilibrium regimes that are warmer than where they originate
Study Results ndash Elevation
Tests were performed to determine if there was an association between elevation and mean air soil and water temperature Results from these tests showed a strong association between elevation and mean daily air soil and water temperatures Mean daily air soil and water temperatures increased with each 500-ft drop in elevation
Water Data - August 1999 Example
Barney Stevens Elk
6000-ft temperature + range 51 + 5 F 45 + 2 F 45 + 3 F
4500-ft temperature + range 58 + 8 F 57 + 8 F 50 + 4 F
Thermal Gradient
6000 ft 78 F 104 F 108 F
4500 ft 44 F 39 F 88 F
Exposure Time (hr) 7 11 45
Temperature Change (F) 7 12 5
Findings
Mean daily air soil and water temperature increased with each 500-ft drop in elevation The pattern was similar to the adiabatic rate of air temperature change which is 3 - 5 F (17 ndash 28 C) for every 1000 ft (300 m) drop in elevation
B-9
Two years of water temperature data from the four headwaters streams suggested that streams that lack significant cold-water inputs will exceed the water temperature standard at about the 4500-ft elevation during July and August
The convergence of mean daily air and mean daily water temperature indicated that Barney and Stevens Creeks were approaching equilibrium as they dropped in elevation As an example the mean air and water temperature differences (air temperature minus water temperature) during August 1999 were 77 68 50 and 45oF on Barney Creek and 104 86 76 and 40oF on Stevens Creek at 6000 5500 5000 and 4500-ft elevations respectively
Total exposure time (spring sources to 4500-ft elevation) for Barney and Stevens Creeks were similar and likely accounted for much of the similarity in the average monthly mean and maximum temperatures at 4500-ft elevation Barney (58 and 67 oF Aug 1999) had a total exposure time of 155 hr Stevens (57 and 64 oF Aug 1999) had a total exposure time of 144 hr
Elk Creek was delayed in reaching thermal equilibrium with its thermal environment Cold water from the side channels a shorter exposure time (greater stream velocity) and an apparent input of ground water (not measured but based on observed saturated soils along much of the creek) contributed to this delay Additional data collection would be required to determine if thermal equilibrium is achieved on Elk Creek before it joins the flow of the mainstem of South Fork Burnt River
WEATHER INFLUENCE
Water temperature follows but lags behind air temperature (Stefan and Preudrsquohomme 1993 McRae and Edwards 1994 Walker and Lawson 1977 Larson and Larson 1997 Mosheni and Stephan 1999) The similarity between mean air and water temperatures increases as the equilibrium temperature is approached (Adams and Sullivan 1989) At that point daily mean air temperature will be near daily mean air temperature Local air temperature is identified as the single most important parameter influencing daily mean stream temperature (Sinokrot and Stefan 1994 Lewis et al 2000) The air mass is large and exhibits significant temperature swings that can occur on daily seasonal regional and local bases These two characteristics exert a strong influence on the equilibrium temperature
Study Results ndash Headwaters
Tests were performed to determine if a relationship could be determined between monthly air and water temperatures Monthly air temperature differences were associated with significant changes in water temperature Water temperature patterns followed air temperature patterns and reflected the cumulative effect of annual monthly and daily patterns of atmospheric conditions on the equilibrium temperatures of July and August
Further analysis determined that the pattern of monthly temperature differences was not repeated in 1998 and 1999 The lack of a repeated pattern between the two years suggests that
B-10
monthly atmospheric variation had a greater influence on water temperature than did fixed solar patterns
Year Mean Air Temperature Mean Water Temperatures
1998 July 2-4 F gt August July 04-3 F gt August
1999 August 1 F gt July August 0-3 gt July
An exception occurred at 5500 ft elevation on Stevens Creek where mean water temperature was 02 F cooler in July than in August 1998
Study Results ndash Mainstem
Mean daily air water and soil temperatures were determined during July and August in 1998 and 1999 between Unity Reservoir and Clarks Creek Peak air and water temperatures occurred daily between 3 and 4 pm unless climatic conditions disrupted the daily cycle of heating Peak energy accumulation occurs several hours after peak solar radiation When we divided the daily pattern of heating into three 4 hour units air heated most rapidly (30 F) during the first 8 hours of the day (600 am - 200 pm) Water heated most rapidly between 10 am and 2 pm At that time water temperatures generally increased 7 F Water temperatures continued to heat until 3 or 4 pm but the heat accumulation occurred at a slower rate If air temperature accumulation during the first 4 hrs did not approach 14 F then daily water temperature patterns lacked a strong heating pattern Peak soil heating at 1-ft occurred at midnight
Mean JulyAugust temperatures for 199899
Mean + range (F)
1998 1999
Air 66 + 19 65 + 20
Water 66 + 7 65 + 7
Soil 61 + 2 61 + 2
Findings
Monthly water temperature differences in 1998 and 1999 were strongly associated with air temperature differences Water temperature patterns followed air temperature patterns Air and water temperatures were warmer in July vs August 1998 and conversely air and water temperatures were warmer in August vs July 1999
Water and soil temperatures lagged behind air temperatures Air temperature lagged behind peak solar radiation
B-11
Air heated most rapidly during the first 8 hrs of the day Water heated most rapidly between 1000 am and 200 pm When air temperature accumulation did not approach 14oF during the first 4-hr period of the day alon g the mainstem Burnt River daily water temperature patterns lacked a strong heating pattern
River temperatures between Unity reservoir and Clarks Creek were near thermal equilibrium Mean air and water temperatures were nearly equivalent Mean air and water temperatures during July and August were 66oF (1998) and 65oF (1999) Water temperatures typically ranged 7oF above and below the mean and air temperatures ranged 19-20oF above and below the mean
RIVER SEGMENT COMPARISONS
The influence of land use was evaluated by comparing segments of the mainstem that are managed for a specific land use In this case segments of the river approximately 1 mile (16 km) in length were monitored for changes in temperature accumulation in the air water and soil Replicates (2 in 1998 3 in 1999) were monitored during July and August of land managed for 1) hay production followed by winter grazing and 2) grazing using a summer rotation pattern Data collection within each segment of the river was designed to measure the pattern of energy accumulation that took place during 1 hour flow periods
Differences in stream temperature that can be associated with land use should be detectable in the temperature accumulation that occurs within a treatment and the extension of the daily temperature range of the water The data indicated that the water flowing through these treatments had similar (Plt005) amounts of temperature increase (Table 9) No significant difference could be detected in the amount of energy accumulated at the time of daily maximum water temperature the magnitude of the daily water temperature range nor the daily mean water temperature between the treatments compared The accuracy of thermister technology limits data collection to + 04 F (02 C) This means that although an energy accumulation was detected within each mile segment of the river it is not possible to provide an accurate measure of the energy accumulation because it falls below the level of equipment accuracy
Results from this study indicated that each segment of the river accumulated similar amounts of energy regardless of the treatment It is appropriate to state that since no significant differences were observed between river segments land use had minimal effect (non-significant) on the rate of energy accumulation
Findings
Water flowing through hay meadow and summer grazing treatments had similar (Plt005) amounts of temperature increase
Study results indicate that each segment of the river accumulated similar (non-significant) amounts of energy regardless of the treatment
B-12
Land Use
Hay meadows Grazing Winter grazing Summer Rotation
Maximum Temperature
1998 July 07 05 NS
August 02 03 NS
1999
July 06 06 NS
August 04 04 NS
Temperature Range
1998 July 07 04 NS
August 05 05 NS
1999 July 07 05 NS
August 05 05 NS
Mean Temperature
1998 July 04 03 NS
August 02 01 NS
1999 July 03 02 NS
August 02 03 NS
Table 9 Comparison of differences (F) during approximately 1 hour flow time in maximum temperature temperature range and mean temperature during July and August of 1998 and 1999
Shade potential for most of the mainstem Burnt River ranges between 3 and 6
B-13
LITERATURE CITED
Adams T and K Sullivan 1989 The physics of forest stream heating a simple model Weyerhaeuser Research Report TFW-WQ3-90-007
Crowe E A and R R Clausnitzer 1997 Mid-Montane Wetland Plant Associations of the Malheur Umatilla and Wallowa-Whitman National Forests USDA Forest Service Pacific Northwest Region Technical Paper R6-NR-ECOL-TP-22-97
Edinger J E DW Duttweiler and J C Geyer 1968 The response of water temperatures to meteorological conditions Water Resources Research 41137-1143
Halliday D and R Resnick 1988 Fundamentals of physics 3rd ed John Wiley amp Sons Inc New York
Laird W E M H Fillmore G D Macdonald and D P Christenson 1988 Soil survey of Baker County area Oregon USDA NRCS US Gov Print Office WA DC
Larson L and P A Larson 1997 The natural heating and cooling of water Rangelands 196-8
Lewis T E D W Lamphear D R McCanne A S Webb J P Krieter and W D Conroy 2000 Regional assessment of stream temperatures across Northern California and their relationship to various landscape level and site-specific attributes Forest Science Project Humbolt State University Foundation Arcata CA pp420
McRae G and C J Edwards 1994 Thermal characteristics of Wisconsin headwater streams occupied by beaver implications for brook trout habitat Transactions of the American Fisheries Society 123641-656
Meisner J D J S Rosenfeld and H A Regier 1988 The role of groundwater in the impact of climate warming on stream salmonines Fisheries 132-8
Mosheni O and H G Stefan 1999 Stream temperatureair temperature relationship a physical interpretation Journal of Hydrology 218128-141
NRCS 2000 Ecological Site Descriptions Oregon
Raphael Jerome M 1962 Prediction of temperature in rivers and reservoirs J of the Power Division Proceedings of the American Society of Civil Engineers 88157-181
B-14
Rosgen D 1996 Applied river morphology Pagosa Springs CO Wildland Hydrology p 352
Sinokrat B A and H G Stefan 1994 Stream water-temperature sensitivity to weather and bed parameters J Hydraulic Eng 120722-735
Stefan H G and E B Preudrsquohomme 1993 Stream temperature estimation from air temperature Water Resources Bulletin 2927-45
Walker J H and J D Lawson 1977 Natural stream temperature variations in a catchment Water Research 11373-377
Ward J V 1985 Thermal characteristics of running waters Hydrobiologia 12531shy46
B-15


