106
Bus Rapid Transit Primer OCTOBER 2010 KANE COUNTY RANDALL/ORCHARD ROAD CORRIDOR BUS RAPID TRANSIT FEASIBILITY STUDY DRAFT
Bus Rapid Transit PrimerOCTOBER 2010
KANE COUNTY RANDALL/ORCHARD ROAD CORRIDOR BUS RAPID TRANSIT FEASIBILITY STUDY
DRAFT

Acknowledgment: “This material is based upon work supported by the De-partment of Energy [National Nuclear Security Administration] under Award Number DE-EE0000818.”Disclaimer: “This report was prepared as an account of work sponsored by an agency of the United States Government. Neither the United States Govern-ment nor any agency thereof, nor any of their employees, makes any warranty, express or implied, or assumes any legal liability or responsibility for the ac-curacy, completeness, or usefulness of any information, apparatus, product, or process disclosed, or represents that its use would not infringe privately owned rights. Reference herein to any specific commercial product, process, or service by trade name, trademark, manufacturer, or otherwise does not necessarily constitute or imply its endorsement, recommendation, or favor-ing by the United States Government or any agency thereof. The views and opinions of authors expressed herein do not necessarily state or reflect those of the United States Government or any agency thereof.”

KANE COUNTY RANDALL/ORCHARD ROAD CORRIDOR BRT FEASIBILITY STUDY
CONTENTS
Executive Summary ....................................................................................................................................................ES-1What are the General Characteristics of BRT? ............................................................................................................. ES-2What are Conditions for Successful BRT Projects? .................................................................................................... ES-2Who has built Bus Rapid Transit and why? .................................................................................................................... ES-4What are the benefits of BRT? ............................................................................................................................................. ES-5
Why a BRT Primer? ........................................................................................................................................................... 1
What are the General Characteristics of BRT? .......................................................................................................3Running Way and Right-of-Way Requirements .........................................................................................................................................................4Station Design.......................................................................................................................................................................................6Vehicle Options and Technology................................................................................................................................................. 8Service and Operating Characteristics ....................................................................................................................................11Branding and BRT Image ...............................................................................................................................................................16Summary of BRT Characteristics and Performance.........................................................................................................18Cost to Implement and Operate BRT ......................................................................................................................................18
What are Conditions for Successful BRT Projects? .............................................................................................21Condition #1: Transit-Land Use Connection .......................................................................................................................22Condition #2: Branding and Marketability ...........................................................................................................................30Condition #3: Multimodal Connectivity around Stations ...............................................................................................30Condition #4: BRT Must Compete with Automobile Travel .........................................................................................33
Why focus on BRT and How Does it Compare to Other Modes? .................................................................... 35Summary of Operating Characteristics .................................................................................................................................38Cost Comparisons ............................................................................................................................................................................39Land Use (Density) Requirements by Mode ....................................................................................................................... 40
i RANDALL/ORCHARD ROAD CORRIDOR BRT FEASIBILITY STUDY
ii BRT PRIMER | CONTENTS AND FIGURES
Who has built Bus Rapid Transit and why? ............................................................................................................41West Busway, Pittsburgh ..............................................................................................................................................................42HealthLine, Cleveland .....................................................................................................................................................................43EmX Green Line, Eugene (OR) ...................................................................................................................................................44Ottawa Transitway ..........................................................................................................................................................................45Swift, Community Transit (Snohomish County, WA) .....................................................................................................46Orange Line, Los Angeles .............................................................................................................................................................47Silver Line, Boston ...........................................................................................................................................................................48
What are the benefits of BRT? ...................................................................................................................................51Congestion Mitigation (Ridership) ...........................................................................................................................................52Cost Effectiveness ...........................................................................................................................................................................52Economic Development ................................................................................................................................................................52Environmental/Climate ................................................................................................................................................................. 57Social/Community Benefits ........................................................................................................................................................60Personal Transportation Costs ..................................................................................................................................................60Social Interaction and Livability .................................................................................................................................................60
How are BRT Projects Funded and Implemented? ...............................................................................................61Federal Capital Funding .................................................................................................................................................................62Local Capital and Operations Funding ...................................................................................................................................62Public-Private Partnerships .........................................................................................................................................................62Land Use and Jurisdictional Coordination ...........................................................................................................................63Project Phasing .................................................................................................................................................................................63
References ........................................................................................................................................................................ 65
Appendix A: List of acronyms ................................................................................................................................... A-1
Appendix B: Glossary ................................................................................................................................................... B-1
CONTENTS (CONTINUED)
iii RANDALL/ORCHARD ROAD CORRIDOR BRT FEASIBILITY STUDY
FIGURES
Figure 1 Typical Characteristics of Full BRT and Rapid Bus .......................................................................................4Figure 2 Typical BRT Vehicle Specifications ......................................................................................................................9Figure 3 Station Spacing and Operating Speed .............................................................................................................14Figure 4 Example of Coordinated Branding Features ................................................................................................. 17Figure 5 Elements of BRT and their Effect on System Performance ...................................................................18Figure 6 Sample BRT Operating Cost Measures............................................................................................................19Figure 7 Estimated Capital Costs .........................................................................................................................................20Figure 8 Community Benefits of Rapid Transit .............................................................................................................22Figure 9 Vehicle Miles Traveled vs. Residential Density ............................................................................................24Figure 10 Mode Share by Transit and Land Use Characteristics, Multnomah County, OR ..........................25Figure 11 Minimum Target Corridor Densities for Transit Modes ..........................................................................25Figure 12 How Modes Impact Development .....................................................................................................................26Figure 13 Station Typologies .................................................................................................................................................... 27Figure 14 Station Typologies and their Functional Application ................................................................................28Figure 15 Average Speeds Relative to Stop Spacing .....................................................................................................30Figure 16 Varying Levels of Multimodal Access ...............................................................................................................32Figure 17 Comparison of Transit Modes .............................................................................................................................36Figure 18 BRT in Relation to Rail and Other Bus Modes ............................................................................................. 37Figure 19 Operating Characteristics by Transit Mode ..................................................................................................38Figure 20 Operating and Capital Costs by Mode .............................................................................................................39Figure 21 Capital Cost Summary ...........................................................................................................................................39Figure 22 Comparative Operating Cost Per Service Hour ......................................................................................... 40Figure 23 Comparative Operating Cost Per Trip ............................................................................................................ 40Figure 24 Bus Rapid Transit Case Study System Characteristics ............................................................................49Figure 25 Share of Ridership from Private Vehicles, Select BRT Systems .........................................................52Figure 26 Development Benefits of BRT Systems ......................................................................................................... 53Figure 27 Jobs Generated per $10 Million in Public Transportation Spending, 2007 .................................... 53Figure 28 Tangible and Intangible Service Attributes ...................................................................................................54Figure 29 Factors in Economic Development by Mode ................................................................................................54Figure 30 Land Value Impacts of BR .....................................................................................................................................56Figure 31 Comparative GhG Emissions (grams CO2 by Passenger Miles Traveled)....................................... 57Figure 32 Daily Walking Trips and Transit Use .................................................................................................................58Figure 33 Walk, Bike, and Transit Use vs. Obesity Rates .............................................................................................58Figure 34 Operating Costs by Mode of Transportation ...............................................................................................59Figure 35 New Starts Project Evaluation Criteria ...........................................................................................................62

ES-1
KANE COUNTY RANDALL/ORCHARD ROAD CORRIDOR BRT FEASIBILITY STUDY
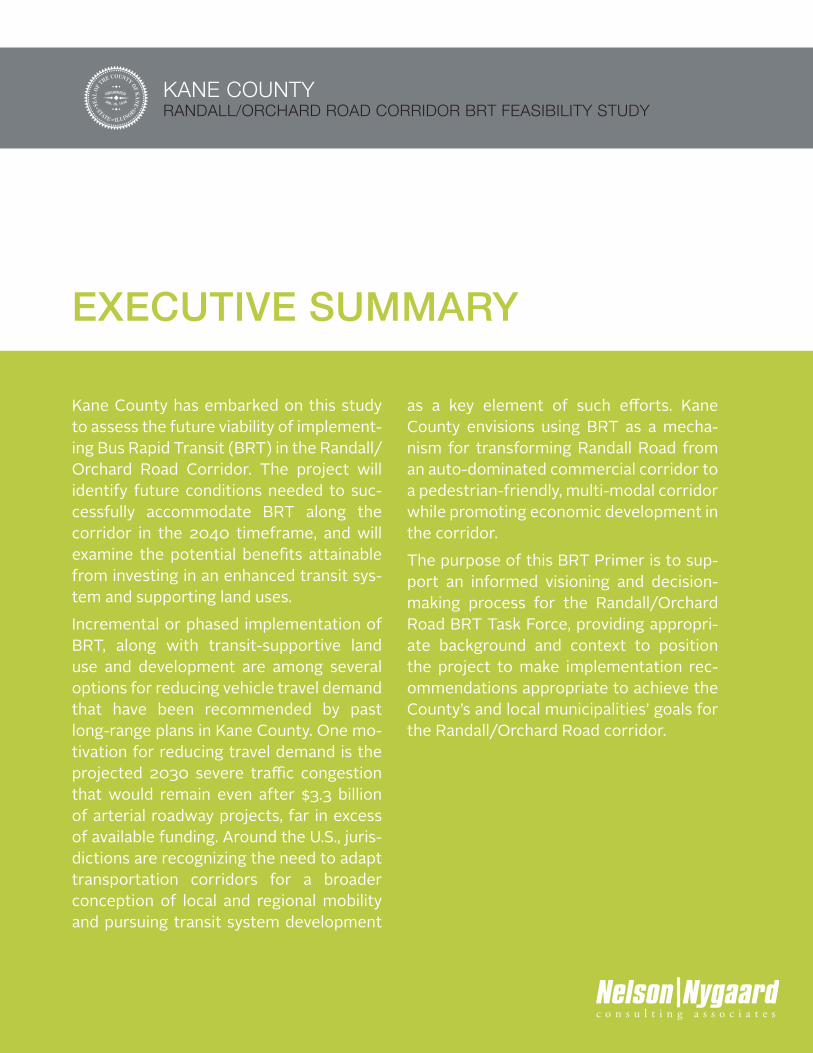
Kane County has embarked on this study to assess the future viability of implement-ing Bus Rapid Transit (BRT) in the Randall/Orchard Road Corridor. The project will identify future conditions needed to suc-cessfully accommodate BRT along the corridor in the 2040 timeframe, and will examine the potential benefits attainable from investing in an enhanced transit sys-tem and supporting land uses.Incremental or phased implementation of BRT, along with transit-supportive land use and development are among several options for reducing vehicle travel demand that have been recommended by past long-range plans in Kane County. One mo-tivation for reducing travel demand is the projected 2030 severe traffic congestion that would remain even after $3.3 billion of arterial roadway projects, far in excess of available funding. Around the U.S., juris-dictions are recognizing the need to adapt transportation corridors for a broader conception of local and regional mobility and pursuing transit system development
EXECUTIVE SUMMARY
as a key element of such efforts. Kane County envisions using BRT as a mecha-nism for transforming Randall Road from an auto-dominated commercial corridor to a pedestrian-friendly, multi-modal corridor while promoting economic development in the corridor. The purpose of this BRT Primer is to sup-port an informed visioning and decision-making process for the Randall/Orchard Road BRT Task Force, providing appropri-ate background and context to position the project to make implementation rec-ommendations appropriate to achieve the County’s and local municipalities’ goals for the Randall/Orchard Road corridor.
ES-2 BRT PRIMER | EXECUTIVE SUMMARY
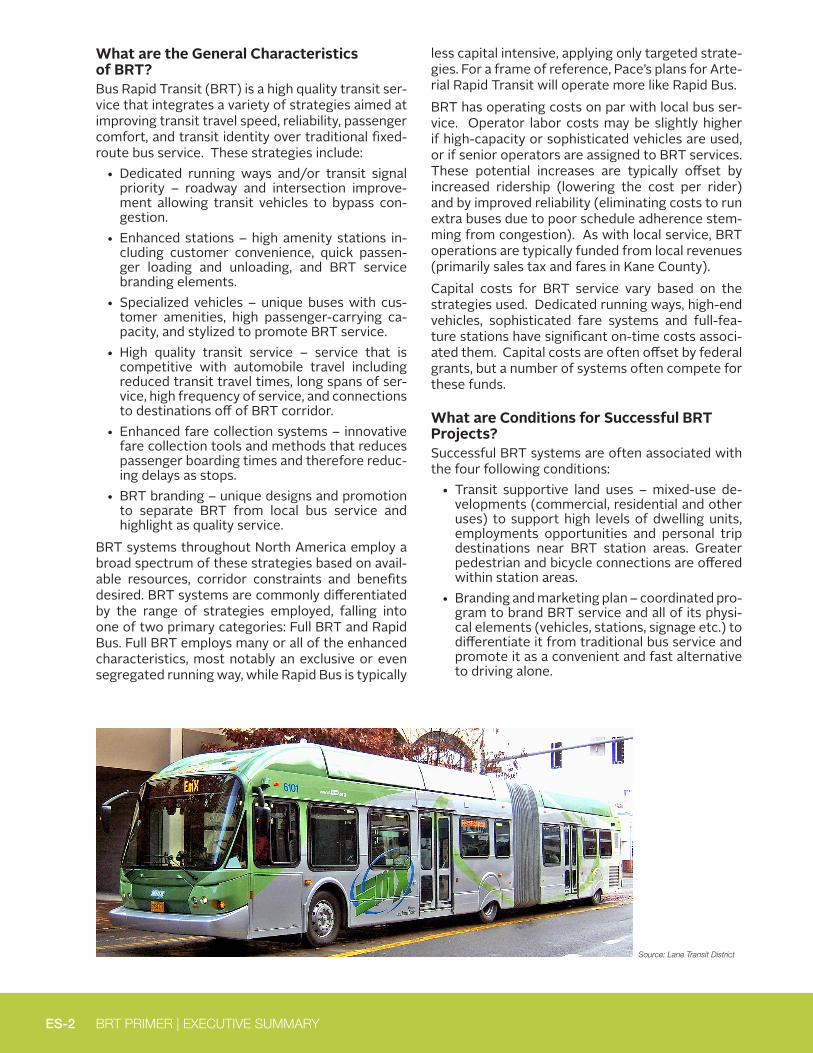
What are the General Characteristics of BRT?Bus Rapid Transit (BRT) is a high quality transit ser-vice that integrates a variety of strategies aimed at improving transit travel speed, reliability, passenger comfort, and transit identity over traditional fixed-route bus service. These strategies include:
• Dedicated running ways and/or transit signal priority – roadway and intersection improve-ment allowing transit vehicles to bypass con-gestion.
• Enhanced stations – high amenity stations in-cluding customer convenience, quick passen-ger loading and unloading, and BRT service branding elements.
• Specialized vehicles – unique buses with cus-tomer amenities, high passenger-carrying ca-pacity, and stylized to promote BRT service.
• High quality transit service – service that is competitive with automobile travel including reduced transit travel times, long spans of ser-vice, high frequency of service, and connections to destinations off of BRT corridor.
• Enhanced fare collection systems – innovative fare collection tools and methods that reduces passenger boarding times and therefore reduc-ing delays as stops.
• BRT branding – unique designs and promotion to separate BRT from local bus service and highlight as quality service.
BRT systems throughout North America employ a broad spectrum of these strategies based on avail-able resources, corridor constraints and benefits desired. BRT systems are commonly differentiated by the range of strategies employed, falling into one of two primary categories: Full BRT and Rapid Bus. Full BRT employs many or all of the enhanced characteristics, most notably an exclusive or even segregated running way, while Rapid Bus is typically
less capital intensive, applying only targeted strate-gies. For a frame of reference, Pace’s plans for Arte-rial Rapid Transit will operate more like Rapid Bus.BRT has operating costs on par with local bus ser-vice. Operator labor costs may be slightly higher if high-capacity or sophisticated vehicles are used, or if senior operators are assigned to BRT services. These potential increases are typically offset by increased ridership (lowering the cost per rider) and by improved reliability (eliminating costs to run extra buses due to poor schedule adherence stem-ming from congestion). As with local service, BRT operations are typically funded from local revenues (primarily sales tax and fares in Kane County).Capital costs for BRT service vary based on the strategies used. Dedicated running ways, high-end vehicles, sophisticated fare systems and full-fea-ture stations have significant on-time costs associ-ated them. Capital costs are often offset by federal grants, but a number of systems often compete for these funds.
What are Conditions for Successful BRT Projects?Successful BRT systems are often associated with the four following conditions:
• Transit supportive land uses – mixed-use de-velopments (commercial, residential and other uses) to support high levels of dwelling units, employments opportunities and personal trip destinations near BRT station areas. Greater pedestrian and bicycle connections are offered within station areas.
• Branding and marketing plan – coordinated pro-gram to brand BRT service and all of its physi-cal elements (vehicles, stations, signage etc.) to differentiate it from traditional bus service and promote it as a convenient and fast alternative to driving alone.
Source: Lane Transit District
ES-3 RANDALL/ORCHARD ROAD CORRIDOR BRT FEASIBILITY STUDY
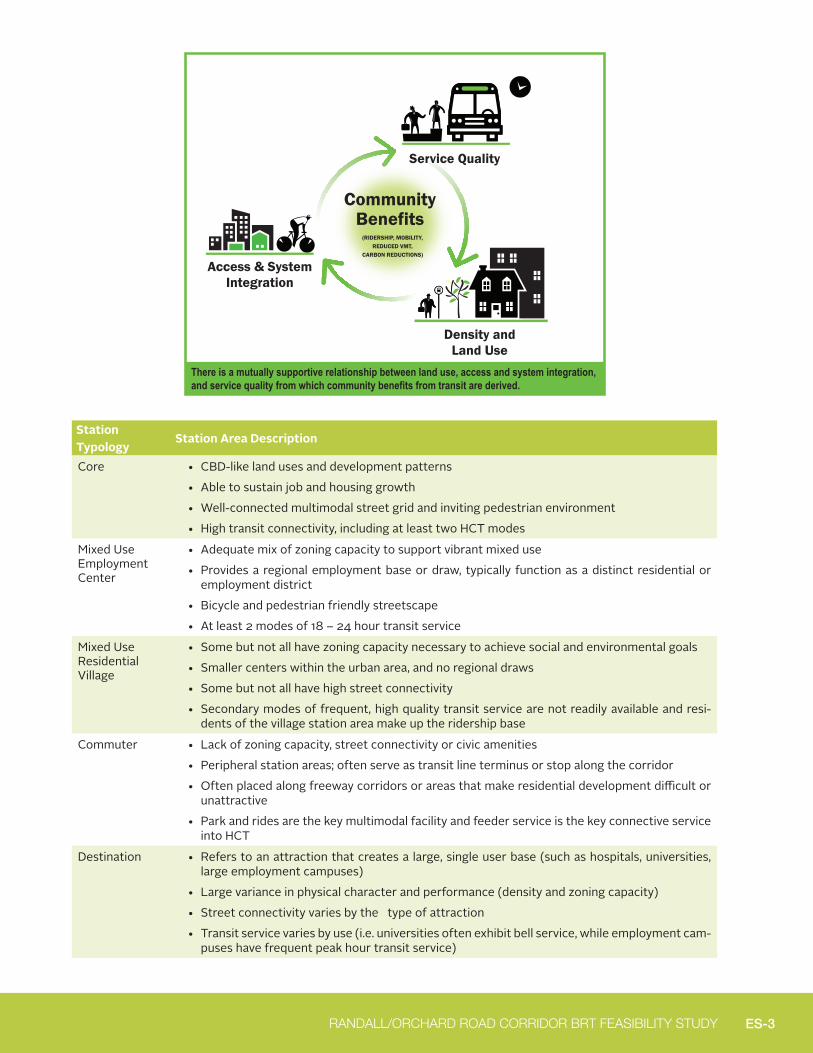
Station Typology
Station Area Description
Core • CBD-like land uses and development patterns• Able to sustain job and housing growth• Well-connected multimodal street grid and inviting pedestrian environment• High transit connectivity, including at least two HCT modes
Mixed Use Employment Center
• Adequate mix of zoning capacity to support vibrant mixed use• Provides a regional employment base or draw, typically function as a distinct residential or
employment district• Bicycle and pedestrian friendly streetscape• At least 2 modes of 18 – 24 hour transit service
Mixed Use Residential Village
• Some but not all have zoning capacity necessary to achieve social and environmental goals• Smaller centers within the urban area, and no regional draws• Some but not all have high street connectivity• Secondary modes of frequent, high quality transit service are not readily available and resi-
dents of the village station area make up the ridership base
Commuter • Lack of zoning capacity, street connectivity or civic amenities • Peripheral station areas; often serve as transit line terminus or stop along the corridor• Often placed along freeway corridors or areas that make residential development difficult or
unattractive• Park and rides are the key multimodal facility and feeder service is the key connective service
into HCT
Destination • Refers to an attraction that creates a large, single user base (such as hospitals, universities, large employment campuses)
• Large variance in physical character and performance (density and zoning capacity)• Street connectivity varies by the type of attraction • Transit service varies by use (i.e. universities often exhibit bell service, while employment cam-
puses have frequent peak hour transit service)
Service Quality
Density and Land Use
Access & System Integration
Community Benefits
(RIDERSHIP, MOBILITY, REDUCED VMT,
CARBON REDUCTIONS)
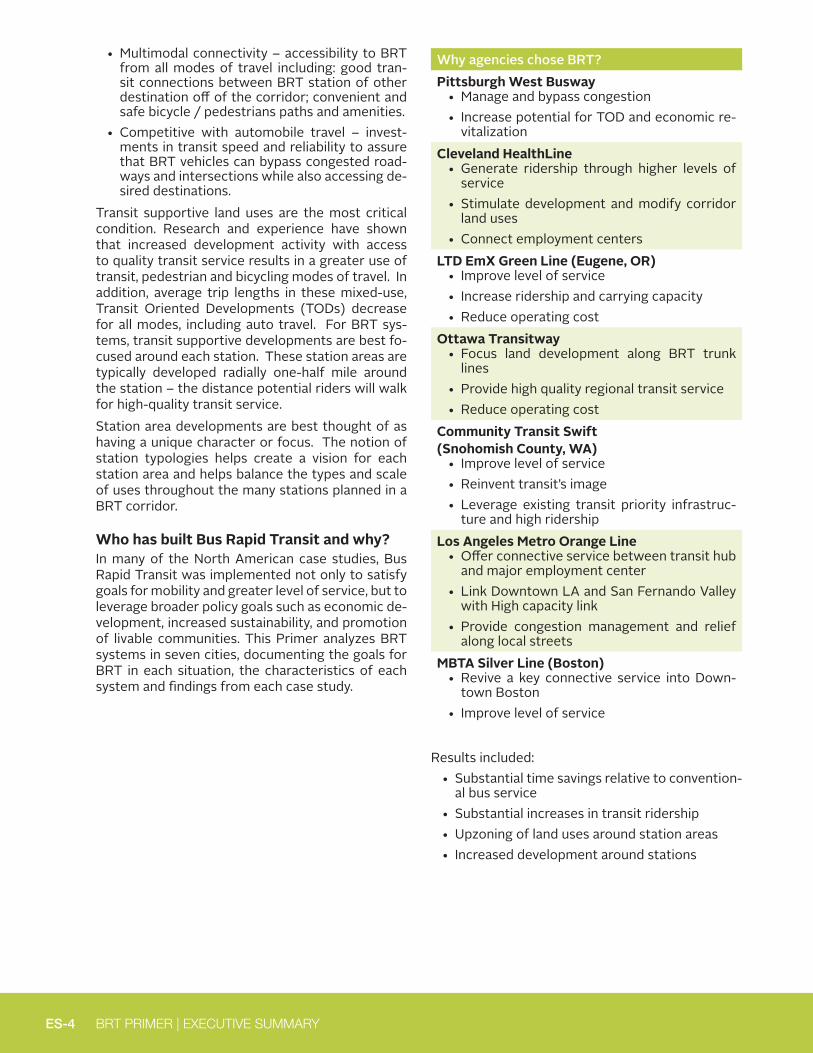
There is a mutually supportive relationship between land use, access and system integration, and service quality from which community benefits from transit are derived.
ES-4 BRT PRIMER | EXECUTIVE SUMMARY
• Multimodal connectivity – accessibility to BRT from all modes of travel including: good tran-sit connections between BRT station of other destination off of the corridor; convenient and safe bicycle / pedestrians paths and amenities.
• Competitive with automobile travel – invest-ments in transit speed and reliability to assure that BRT vehicles can bypass congested road-ways and intersections while also accessing de-sired destinations.
Transit supportive land uses are the most critical condition. Research and experience have shown that increased development activity with access to quality transit service results in a greater use of transit, pedestrian and bicycling modes of travel. In addition, average trip lengths in these mixed-use, Transit Oriented Developments (TODs) decrease for all modes, including auto travel. For BRT sys-tems, transit supportive developments are best fo-cused around each station. These station areas are typically developed radially one-half mile around the station – the distance potential riders will walk for high-quality transit service. Station area developments are best thought of as having a unique character or focus. The notion of station typologies helps create a vision for each station area and helps balance the types and scale of uses throughout the many stations planned in a BRT corridor.
Who has built Bus Rapid Transit and why? In many of the North American case studies, Bus Rapid Transit was implemented not only to satisfy goals for mobility and greater level of service, but to leverage broader policy goals such as economic de-velopment, increased sustainability, and promotion of livable communities. This Primer analyzes BRT systems in seven cities, documenting the goals for BRT in each situation, the characteristics of each system and findings from each case study.
Why agencies chose BRT?Pittsburgh West Busway
• Manage and bypass congestion• Increase potential for TOD and economic re-
vitalizationCleveland HealthLine
• Generate ridership through higher levels of service
• Stimulate development and modify corridor land uses
• Connect employment centersLTD EmX Green Line (Eugene, OR)
• Improve level of service• Increase ridership and carrying capacity• Reduce operating cost
Ottawa Transitway• Focus land development along BRT trunk
lines• Provide high quality regional transit service• Reduce operating cost
Community Transit Swift (Snohomish County, WA)
• Improve level of service• Reinvent transit’s image• Leverage existing transit priority infrastruc-
ture and high ridershipLos Angeles Metro Orange Line
• Offer connective service between transit hub and major employment center
• Link Downtown LA and San Fernando Valley with High capacity link
• Provide congestion management and relief along local streets
MBTA Silver Line (Boston)• Revive a key connective service into Down-
town Boston• Improve level of service
Results included:• Substantial time savings relative to convention-
al bus service• Substantial increases in transit ridership• Upzoning of land uses around station areas• Increased development around stations
ES-5 RANDALL/ORCHARD ROAD CORRIDOR BRT FEASIBILITY STUDY
What are the benefits of BRT?Experience and research highlight a number of community benefits associated with the implemen-tation of BRT service including:
• Congestion mitigation – increased ridership on BRT lines promotes the shifting of some trips from automobile use to transit, freeing up road-way capacity for remaining drivers and for the movement of freight. Similarly, development of transit supportive land uses results in short-er trips for all modes – reducing vehicle miles traveled per capita
• Cost effectiveness – higher capacity BRT ve-hicles lower the operating costs per rider.
• Economic Development – Increased economic productivity – per-
sonal and employee time savings resulting from time not spent idly in traffic.
– Improved economic opportunities – in-creased mobility options expand employ-ment opportunities and reduce commuter transportation costs.
– Revitalization –TOD development around stations can revitalize aging commercial areas creating economic opportunities and enhancing tax revenues for local jurisdic-tions.
– Increased land values - investments in high-capacity transit stations and other infra-structure improve access, attract develop-ment, and increase land values.
– Job creation – capital investments in BRT infrastructure support local construction, planning and design jobs.
• Air quality – by shifting trips to transit of short-ening trip lengths, the combination BRT and transit supportive land uses reduces tail pipe emersions per capita, improving air quality and reducing greenhouse gas emissions
• Community Health – BRT and station areas in-corporating TOD concepts support active living goals by encouraging bicycling and walking to reach transit or for entire trips.
Based on the desired benefits, Bus Rapid Transit can employ a variety of technology and amenity packages ranging from Rapid Bus to Full BRT com-ponents. Whatever transit strategies are employed to serve the Randall/Orchard Road Corridor, BRT, in conjunction with coordinated land use planning, can help build thriving, livable communities.
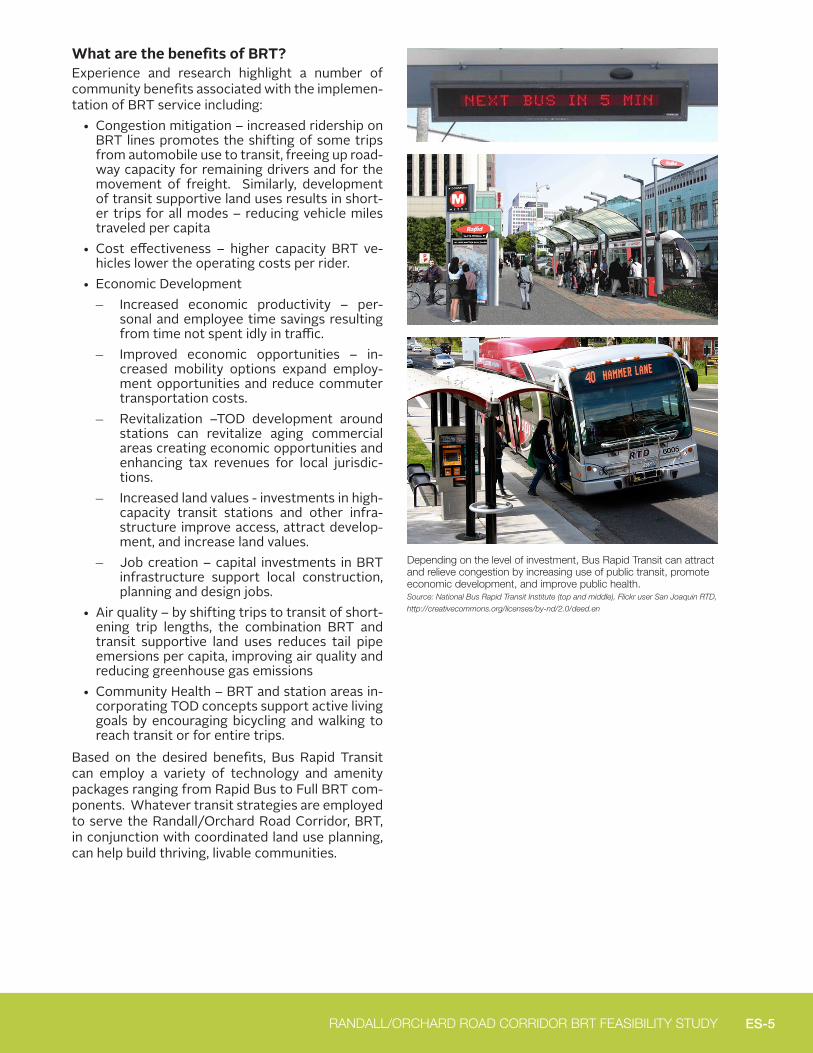
Depending on the level of investment, Bus Rapid Transit can attract and relieve congestion by increasing use of public transit, promote economic development, and improve public health. Source: National Bus Rapid Transit Institute (top and middle), Flickr user San Joaquin RTD,
http://creativecommons.org/licenses/by-nd/2.0/deed.en

1
KANE COUNTY RANDALL/ORCHARD ROAD CORRIDOR BRT FEASIBILITY STUDY
Kane County has embarked on this study to assess the future viability of implementing Bus Rapid Transit (BRT) in the Randall/Orchard Road Corridor. The project will identify future conditions needed to successfully accommo-date BRT along the corridor in the 2040 time-frame, and will examine the potential benefits attainable from investing in an enhanced tran-sit system and supporting land uses.
Incremental or phased implementation of BRT, along with transit-supportive land use and development are among several options for reducing vehicle travel demand that have been recommended by past long-range plans in Kane County. One motivation for reducing travel demand is the projected 2030 severe traffic congestion that would remain even af-ter $3.3 billion of arterial roadway projects, far in excess of available funding. Around the U.S., jurisdictions are recognizing the need to adapt transportation corridors for a broader concep-tion of local and regional mobility and pursuing transit system development as a key element of such efforts. Kane County envisions using BRT as a mechanism for transforming Randall Road from an auto-dominated commercial
WHY A BRT PRIMER?
corridor to a pedestrian-friendly, multi-modal corridor while promoting economic develop-ment in the corridor.
The purpose of this BRT Primer is to provide appropriate background and context to posi-tion the project and to support an informed visioning and decision-making process for the Randall/Orchard Road BRT corridor Study. The BRT primer is organized to answer the fol-lowing questions:
• What are the general characteristics of BRT, including elements, conditions for success, and costs?
• What conditions are associated with a suc-cessful BRT system?
• Who is building BRT and why?
• Why focus on BRT and how does it com-pare to other modes?
• What are the benefits of BRT?
• How is BRT funded and implemented?

3
KANE COUNTY RANDALL/ORCHARD ROAD CORRIDOR BRT FEASIBILITY STUDY
Bus Rapid Transit (BRT) is a high quality transit service that integrates a variety of strategies aimed at improving transit trav-el speed, reliability, passenger comfort, and transit identity over traditional fixed-route bus service. BRT is often designed to mimic light rail transit in look and in some cases travel times and operating speeds, at a fraction of the required infrastructural investment. In fact, BRT is often used as an incremental shift towards other capital intensive modes like light rail transit and commuter rail. However, BRT systems do not necessarily incorporate all the avail-able strategic elements, and numerous combinations of improvement strategies can generate a variety of benefits needed to improve service quality for the transit dependent, attract captive riders, and re-tain high levels of ridership.In general, there are two levels of BRT ser-vice: Full BRT and Rapid Bus. Full BRT is typically considered a higher capital invest-ment with exclusive and often segregated running ways, rail platform-style stations,
WHAT ARE THE GENERAL CHARACTERISTICS OF BRT?
and specialty BRT vehicles (see Figure 1 and the following sections). While some may debate the classification of Rapid Bus as BRT, Rapid Bus seeks to improve tran-sit’s level of service and image using many of the key BRT elements, while forgoing the capital intensive technology and in-frastructure investments. Rapid Bus often operates within mixed traffic and relies on transit priority treatments like queue jump lanes, to reduce delay and increase average travel speeds. For a frame of reference, Pace’s plans for Arterial Rapid Transit will operate more like Rapid Bus.
4 BRT PRIMER | WHAT ARE THE GENERAL CHARACTERISTICS OF BRT?
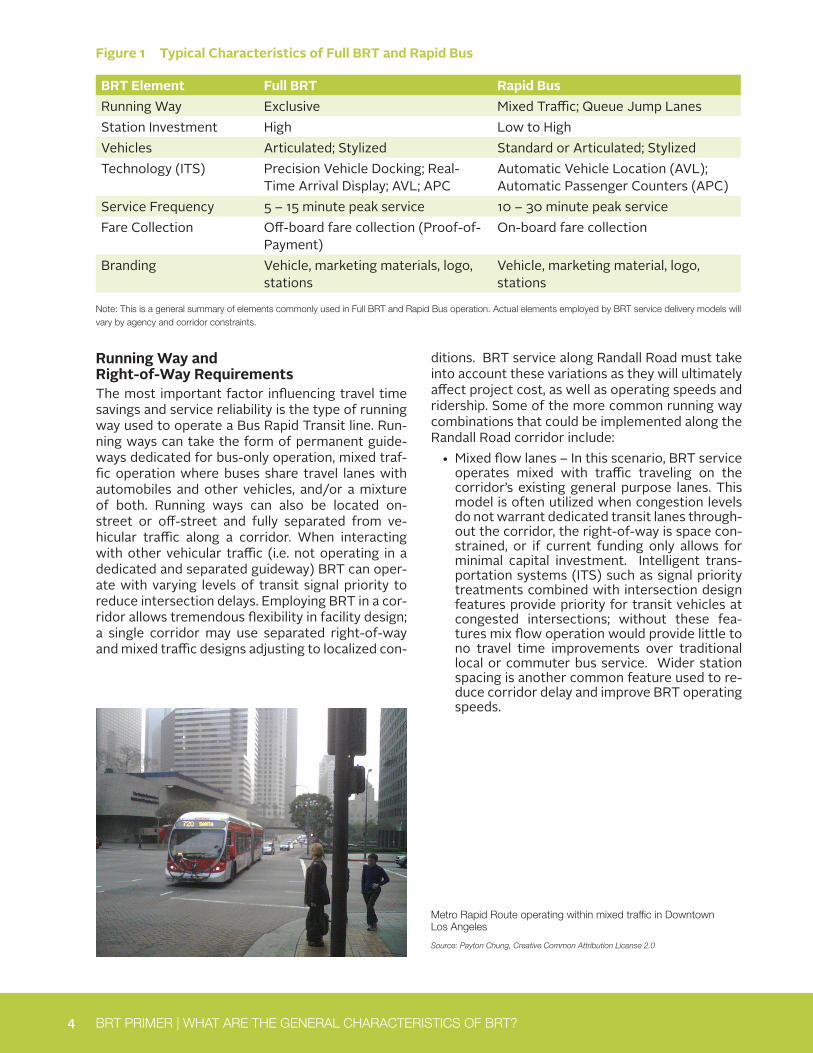
Figure 1 Typical Characteristics of Full BRT and Rapid Bus
BRT Element Full BRT Rapid BusRunning Way Exclusive Mixed Traffic; Queue Jump LanesStation Investment High Low to HighVehicles Articulated; Stylized Standard or Articulated; StylizedTechnology (ITS) Precision Vehicle Docking; Real-
Time Arrival Display; AVL; APCAutomatic Vehicle Location (AVL); Automatic Passenger Counters (APC)
Service Frequency 5 – 15 minute peak service 10 – 30 minute peak serviceFare Collection Off-board fare collection (Proof-of-
Payment)On-board fare collection
Branding Vehicle, marketing materials, logo, stations
Vehicle, marketing material, logo, stations
Note: This is a general summary of elements commonly used in Full BRT and Rapid Bus operation. Actual elements employed by BRT service delivery models will vary by agency and corridor constraints.
Running Way and Right-of-Way Requirements The most important factor influencing travel time savings and service reliability is the type of running way used to operate a Bus Rapid Transit line. Run-ning ways can take the form of permanent guide-ways dedicated for bus-only operation, mixed traf-fic operation where buses share travel lanes with automobiles and other vehicles, and/or a mixture of both. Running ways can also be located on-street or off-street and fully separated from ve-hicular traffic along a corridor. When interacting with other vehicular traffic (i.e. not operating in a dedicated and separated guideway) BRT can oper-ate with varying levels of transit signal priority to reduce intersection delays. Employing BRT in a cor-ridor allows tremendous flexibility in facility design; a single corridor may use separated right-of-way and mixed traffic designs adjusting to localized con-
ditions. BRT service along Randall Road must take into account these variations as they will ultimately affect project cost, as well as operating speeds and ridership. Some of the more common running way combinations that could be implemented along the Randall Road corridor include:
• Mixed flow lanes – In this scenario, BRT service operates mixed with traffic traveling on the corridor’s existing general purpose lanes. This model is often utilized when congestion levels do not warrant dedicated transit lanes through-out the corridor, the right-of-way is space con-strained, or if current funding only allows for minimal capital investment. Intelligent trans-portation systems (ITS) such as signal priority treatments combined with intersection design features provide priority for transit vehicles at congested intersections; without these fea-tures mix flow operation would provide little to no travel time improvements over traditional local or commuter bus service. Wider station spacing is another common feature used to re-duce corridor delay and improve BRT operating speeds.
Metro Rapid Route operating within mixed traffic in Downtown Los Angeles
Source: Payton Chung, Creative Common Attribution License 2.0

5 RANDALL/ORCHARD ROAD CORRIDOR BRT FEASIBILITY STUDY
Queue jump lane along a major arterial in Portland, OR
Source: Nelson\Nygaard
Exclusive transit only lane in Cleveland, OH (left) and typical peak hour bus lane signage (right) seen through the Los Angeles region.
Source: Nelson\Nygaard
• Queue jump lanes –Queue jumping offers a bypass option for BRT vehicles approaching congested intersections. In this type of run-ning way, which is a common priority treatment used in Rapid Bus service, BRT vehicles oper-ate in general purpose lanes until they arrive at an intersection. In order to bypass congested intersections, the vehicle travels along a queue jump lane that is typically supplemented by a dedicated transit signal and a merge lane to re-integrate into mixed traffic. Transit signal prior-ity is given to the transit vehicle offering travel time savings and an opportunity to bypass con-gestion.These lanes can facilitate access to stations and reduce station dwell times if provided in conjunction with transit priority traffic signals. Queue jump lanes are not considered exclusive because they usually allow for right turning vehicles to access the lane to make their turn movement.
• Exclusive transit only lanes – Transit-only lanes are on-street travel lanes to be used exclusively by BRT vehicles except at intersections to al-low for right turn vehicle movements. The pri-mary goals of developing transit only lanes are to establish transit priority along a corridor and to provide uninterrupted travel, except at sta-tions or intersections. These exclusive right-of-ways are typically designated by lane markings, painted buffers, signage, and sometimes curb separation or some other form of physical bar-rier. Transit only lanes can be structured to op-erate only during peak hour travel (typical Rap-id Bus strategy) or function all day (indicative of Full BRT). Curbside transit lanes are frequently shared with right turning vehicles, particularly on corridors where there are business access driveways. These are often called Business Ac-cess Transit (BAT) lanes.
6 BRT PRIMER | WHAT ARE THE GENERAL CHARACTERISTICS OF BRT?
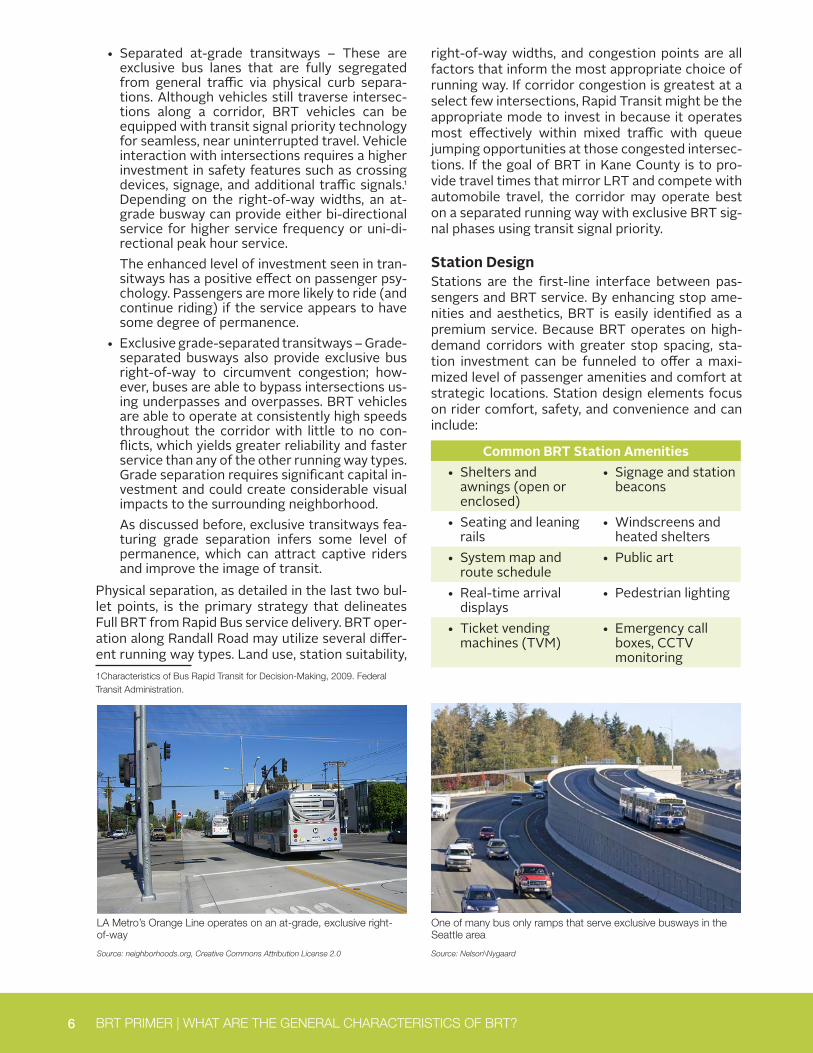
• Separated at-grade transitways – These are exclusive bus lanes that are fully segregated from general traffic via physical curb separa-tions. Although vehicles still traverse intersec-tions along a corridor, BRT vehicles can be equipped with transit signal priority technology for seamless, near uninterrupted travel. Vehicle interaction with intersections requires a higher investment in safety features such as crossing devices, signage, and additional traffic signals.1 Depending on the right-of-way widths, an at-grade busway can provide either bi-directional service for higher service frequency or uni-di-rectional peak hour service. The enhanced level of investment seen in tran-sitways has a positive effect on passenger psy-chology. Passengers are more likely to ride (and continue riding) if the service appears to have some degree of permanence.
• Exclusive grade-separated transitways – Grade-separated busways also provide exclusive bus right-of-way to circumvent congestion; how-ever, buses are able to bypass intersections us-ing underpasses and overpasses. BRT vehicles are able to operate at consistently high speeds throughout the corridor with little to no con-flicts, which yields greater reliability and faster service than any of the other running way types. Grade separation requires significant capital in-vestment and could create considerable visual impacts to the surrounding neighborhood.As discussed before, exclusive transitways fea-turing grade separation infers some level of permanence, which can attract captive riders and improve the image of transit.
Physical separation, as detailed in the last two bul-let points, is the primary strategy that delineates Full BRT from Rapid Bus service delivery. BRT oper-ation along Randall Road may utilize several differ-ent running way types. Land use, station suitability, 1Characteristics of Bus Rapid Transit for Decision-Making, 2009. Federal Transit Administration.
right-of-way widths, and congestion points are all factors that inform the most appropriate choice of running way. If corridor congestion is greatest at a select few intersections, Rapid Transit might be the appropriate mode to invest in because it operates most effectively within mixed traffic with queue jumping opportunities at those congested intersec-tions. If the goal of BRT in Kane County is to pro-vide travel times that mirror LRT and compete with automobile travel, the corridor may operate best on a separated running way with exclusive BRT sig-nal phases using transit signal priority.
Station DesignStations are the first-line interface between pas-sengers and BRT service. By enhancing stop ame-nities and aesthetics, BRT is easily identified as a premium service. Because BRT operates on high-demand corridors with greater stop spacing, sta-tion investment can be funneled to offer a maxi-mized level of passenger amenities and comfort at strategic locations. Station design elements focus on rider comfort, safety, and convenience and can include:
LA Metro’s Orange Line operates on an at-grade, exclusive right-of-way
Source: neighborhoods.org, Creative Commons Attribution License 2.0
One of many bus only ramps that serve exclusive busways in the Seattle area
Source: Nelson\Nygaard
Common BRT Station Amenities• Shelters and
awnings (open or enclosed)
• Signage and station beacons
• Seating and leaning rails
• Windscreens and heated shelters
• System map and route schedule
• Public art
• Real-time arrival displays
• Pedestrian lighting
• Ticket vending machines (TVM)
• Emergency call boxes, CCTV monitoring
7 RANDALL/ORCHARD ROAD CORRIDOR BRT FEASIBILITY STUDY
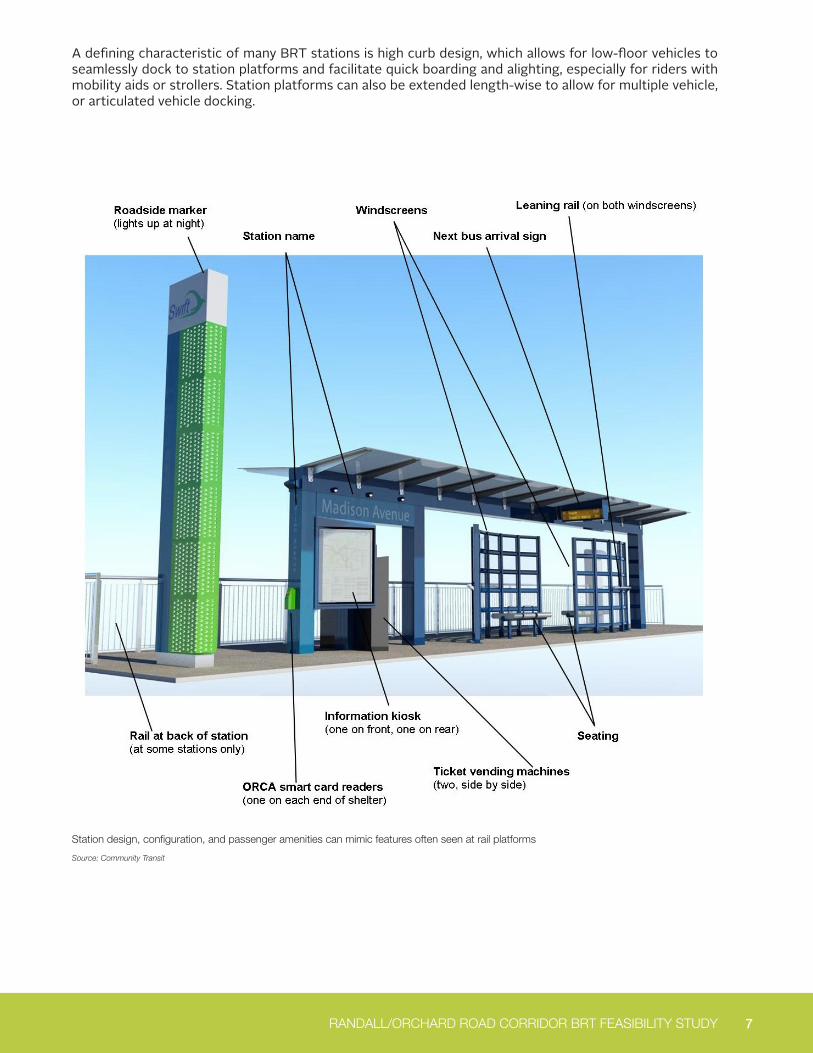
Station design, configuration, and passenger amenities can mimic features often seen at rail platforms
Source: Community Transit
A defining characteristic of many BRT stations is high curb design, which allows for low-floor vehicles to seamlessly dock to station platforms and facilitate quick boarding and alighting, especially for riders with mobility aids or strollers. Station platforms can also be extended length-wise to allow for multiple vehicle, or articulated vehicle docking.
8 BRT PRIMER | WHAT ARE THE GENERAL CHARACTERISTICS OF BRT?
Park and ride access is also an important design consideration because it can extend BRT’s service area. Park and rides provide access to those that would like to use the service, but live outside of a comfortable walking or bicycling distance from a BRT line. Park and ride integration is typically locat-ed in low-density areas that are under developed.
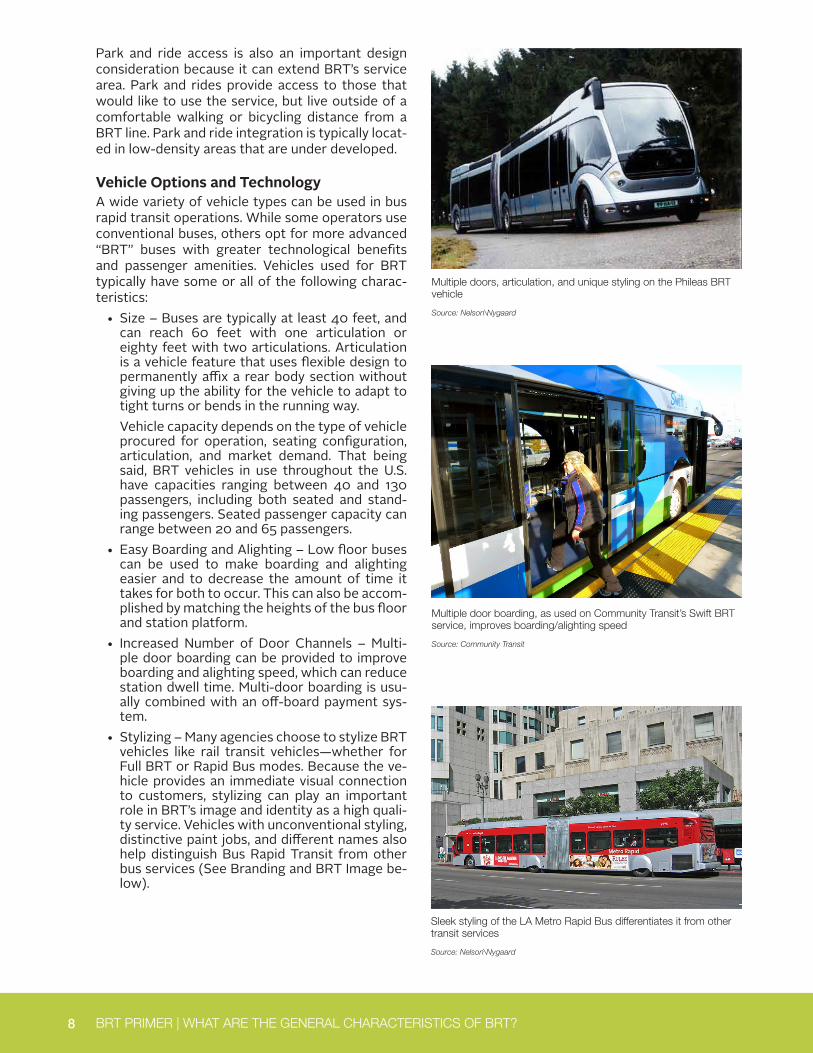
Vehicle Options and TechnologyA wide variety of vehicle types can be used in bus rapid transit operations. While some operators use conventional buses, others opt for more advanced “BRT” buses with greater technological benefits and passenger amenities. Vehicles used for BRT typically have some or all of the following charac-teristics:
• Size – Buses are typically at least 40 feet, and can reach 60 feet with one articulation or eighty feet with two articulations. Articulation is a vehicle feature that uses flexible design to permanently affix a rear body section without giving up the ability for the vehicle to adapt to tight turns or bends in the running way.Vehicle capacity depends on the type of vehicle procured for operation, seating configuration, articulation, and market demand. That being said, BRT vehicles in use throughout the U.S. have capacities ranging between 40 and 130 passengers, including both seated and stand-ing passengers. Seated passenger capacity can range between 20 and 65 passengers.
• Easy Boarding and Alighting – Low floor buses can be used to make boarding and alighting easier and to decrease the amount of time it takes for both to occur. This can also be accom-plished by matching the heights of the bus floor and station platform.
• Increased Number of Door Channels – Multi-ple door boarding can be provided to improve boarding and alighting speed, which can reduce station dwell time. Multi-door boarding is usu-ally combined with an off-board payment sys-tem.
• Stylizing – Many agencies choose to stylize BRT vehicles like rail transit vehicles—whether for Full BRT or Rapid Bus modes. Because the ve-hicle provides an immediate visual connection to customers, stylizing can play an important role in BRT’s image and identity as a high quali-ty service. Vehicles with unconventional styling, distinctive paint jobs, and different names also help distinguish Bus Rapid Transit from other bus services (See Branding and BRT Image be-low).
Sleek styling of the LA Metro Rapid Bus differentiates it from other transit services
Source: Nelson\Nygaard
Multiple door boarding, as used on Community Transit’s Swift BRT service, improves boarding/alighting speed
Source: Community Transit
Multiple doors, articulation, and unique styling on the Phileas BRT vehicle
Source: Nelson\Nygaard
9 RANDALL/ORCHARD ROAD CORRIDOR BRT FEASIBILITY STUDY
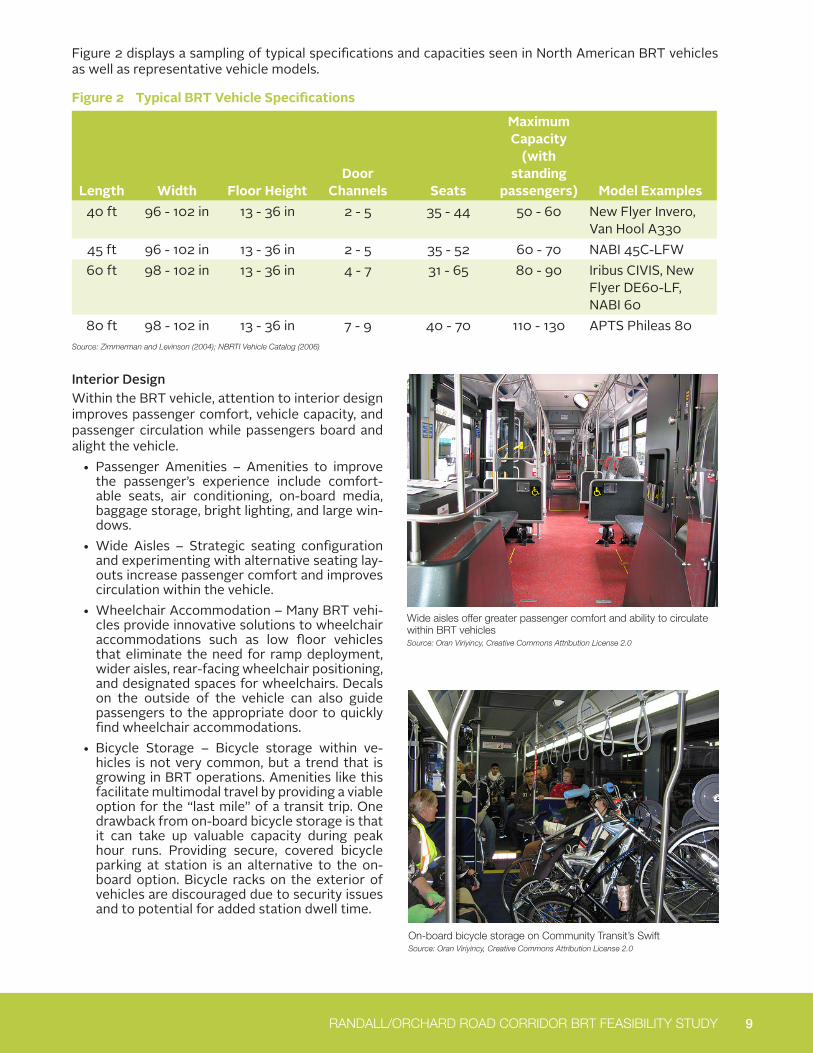
Figure 2 displays a sampling of typical specifications and capacities seen in North American BRT vehicles as well as representative vehicle models.
Figure 2 Typical BRT Vehicle Specifications
Length Width Floor HeightDoor
Channels Seats
Maximum Capacity
(with standing
passengers) Model Examples40 ft 96 - 102 in 13 - 36 in 2 - 5 35 - 44 50 - 60 New Flyer Invero,
Van Hool A33045 ft 96 - 102 in 13 - 36 in 2 - 5 35 - 52 60 - 70 NABI 45C-LFW60 ft 98 - 102 in 13 - 36 in 4 - 7 31 - 65 80 - 90 Iribus CIVIS, New
Flyer DE60-LF, NABI 60
80 ft 98 - 102 in 13 - 36 in 7 - 9 40 - 70 110 - 130 APTS Phileas 80Source: Zimmerman and Levinson (2004); NBRTI Vehicle Catalog (2006)
Interior DesignWithin the BRT vehicle, attention to interior design improves passenger comfort, vehicle capacity, and passenger circulation while passengers board and alight the vehicle.
• Passenger Amenities – Amenities to improve the passenger’s experience include comfort-able seats, air conditioning, on-board media, baggage storage, bright lighting, and large win-dows.
• Wide Aisles – Strategic seating configuration and experimenting with alternative seating lay-outs increase passenger comfort and improves circulation within the vehicle.
• Wheelchair Accommodation – Many BRT vehi-cles provide innovative solutions to wheelchair accommodations such as low floor vehicles that eliminate the need for ramp deployment, wider aisles, rear-facing wheelchair positioning, and designated spaces for wheelchairs. Decals on the outside of the vehicle can also guide passengers to the appropriate door to quickly find wheelchair accommodations.
• Bicycle Storage – Bicycle storage within ve-hicles is not very common, but a trend that is growing in BRT operations. Amenities like this facilitate multimodal travel by providing a viable option for the “last mile” of a transit trip. One drawback from on-board bicycle storage is that it can take up valuable capacity during peak hour runs. Providing secure, covered bicycle parking at station is an alternative to the on-board option. Bicycle racks on the exterior of vehicles are discouraged due to security issues and to potential for added station dwell time.
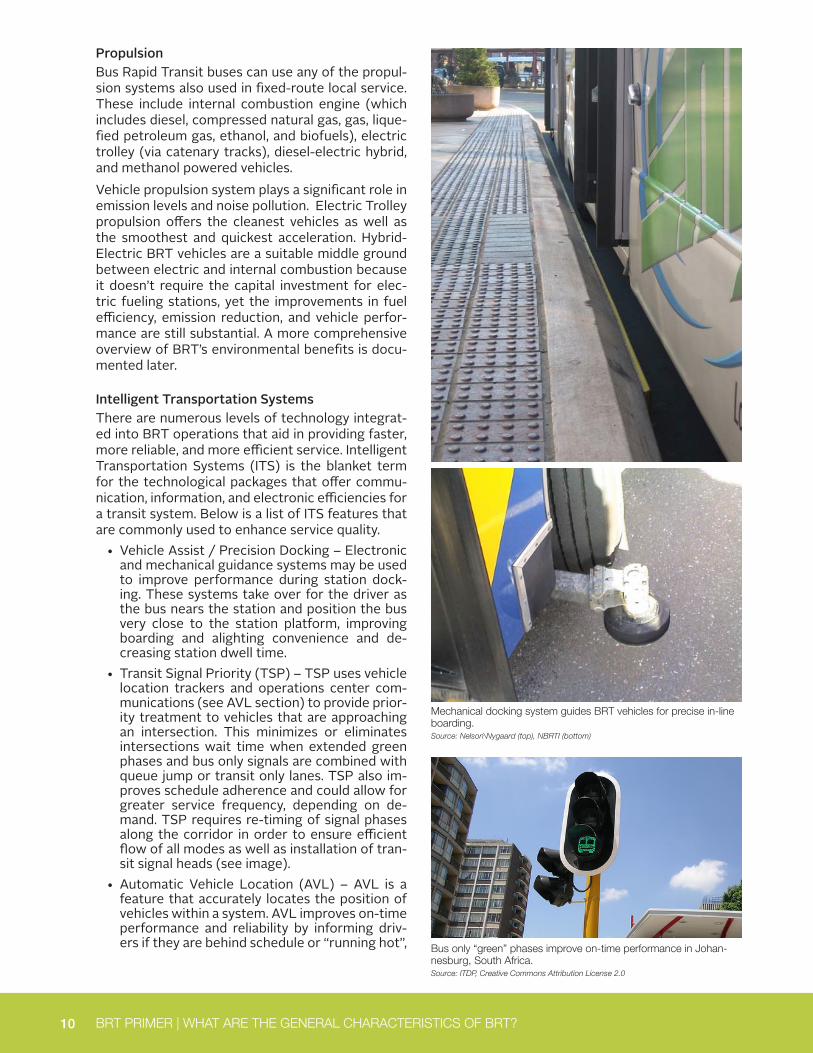
Wide aisles offer greater passenger comfort and ability to circulate within BRT vehicles Source: Oran Viriyincy, Creative Commons Attribution License 2.0
On-board bicycle storage on Community Transit’s Swift Source: Oran Viriyincy, Creative Commons Attribution License 2.0
10 BRT PRIMER | WHAT ARE THE GENERAL CHARACTERISTICS OF BRT?
PropulsionBus Rapid Transit buses can use any of the propul-sion systems also used in fixed-route local service. These include internal combustion engine (which includes diesel, compressed natural gas, gas, lique-fied petroleum gas, ethanol, and biofuels), electric trolley (via catenary tracks), diesel-electric hybrid, and methanol powered vehicles. Vehicle propulsion system plays a significant role in emission levels and noise pollution. Electric Trolley propulsion offers the cleanest vehicles as well as the smoothest and quickest acceleration. Hybrid-Electric BRT vehicles are a suitable middle ground between electric and internal combustion because it doesn’t require the capital investment for elec-tric fueling stations, yet the improvements in fuel efficiency, emission reduction, and vehicle perfor-mance are still substantial. A more comprehensive overview of BRT’s environmental benefits is docu-mented later.
Intelligent Transportation SystemsThere are numerous levels of technology integrat-ed into BRT operations that aid in providing faster, more reliable, and more efficient service. Intelligent Transportation Systems (ITS) is the blanket term for the technological packages that offer commu-nication, information, and electronic efficiencies for a transit system. Below is a list of ITS features that are commonly used to enhance service quality.
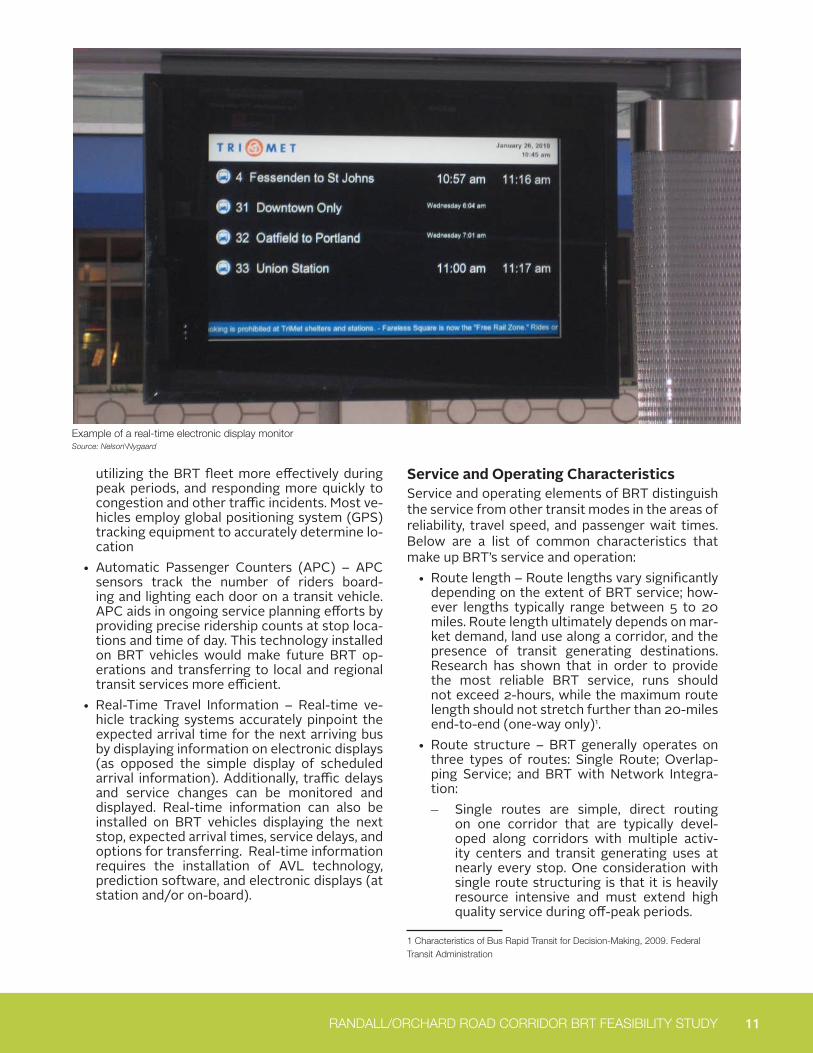
• Vehicle Assist / Precision Docking – Electronic and mechanical guidance systems may be used to improve performance during station dock-ing. These systems take over for the driver as the bus nears the station and position the bus very close to the station platform, improving boarding and alighting convenience and de-creasing station dwell time.
• Transit Signal Priority (TSP) – TSP uses vehicle location trackers and operations center com-munications (see AVL section) to provide prior-ity treatment to vehicles that are approaching an intersection. This minimizes or eliminates intersections wait time when extended green phases and bus only signals are combined with queue jump or transit only lanes. TSP also im-proves schedule adherence and could allow for greater service frequency, depending on de-mand. TSP requires re-timing of signal phases along the corridor in order to ensure efficient flow of all modes as well as installation of tran-sit signal heads (see image).
• Automatic Vehicle Location (AVL) – AVL is a feature that accurately locates the position of vehicles within a system. AVL improves on-time performance and reliability by informing driv-ers if they are behind schedule or “running hot”,
Mechanical docking system guides BRT vehicles for precise in-line boarding. Source: Nelson\Nygaard (top), NBRTI (bottom)
Bus only “green” phases improve on-time performance in Johan-nesburg, South Africa. Source: ITDP, Creative Commons Attribution License 2.0
11 RANDALL/ORCHARD ROAD CORRIDOR BRT FEASIBILITY STUDY
Example of a real-time electronic display monitor Source: Nelson\Nygaard
utilizing the BRT fleet more effectively during peak periods, and responding more quickly to congestion and other traffic incidents. Most ve-hicles employ global positioning system (GPS) tracking equipment to accurately determine lo-cation
• Automatic Passenger Counters (APC) – APC sensors track the number of riders board-ing and lighting each door on a transit vehicle. APC aids in ongoing service planning efforts by providing precise ridership counts at stop loca-tions and time of day. This technology installed on BRT vehicles would make future BRT op-erations and transferring to local and regional transit services more efficient.
• Real-Time Travel Information – Real-time ve-hicle tracking systems accurately pinpoint the expected arrival time for the next arriving bus by displaying information on electronic displays (as opposed the simple display of scheduled arrival information). Additionally, traffic delays and service changes can be monitored and displayed. Real-time information can also be installed on BRT vehicles displaying the next stop, expected arrival times, service delays, and options for transferring. Real-time information requires the installation of AVL technology, prediction software, and electronic displays (at station and/or on-board).
Service and Operating CharacteristicsService and operating elements of BRT distinguish the service from other transit modes in the areas of reliability, travel speed, and passenger wait times. Below are a list of common characteristics that make up BRT’s service and operation:
• Route length – Route lengths vary significantly depending on the extent of BRT service; how-ever lengths typically range between 5 to 20 miles. Route length ultimately depends on mar-ket demand, land use along a corridor, and the presence of transit generating destinations. Research has shown that in order to provide the most reliable BRT service, runs should not exceed 2-hours, while the maximum route length should not stretch further than 20-miles end-to-end (one-way only)1.
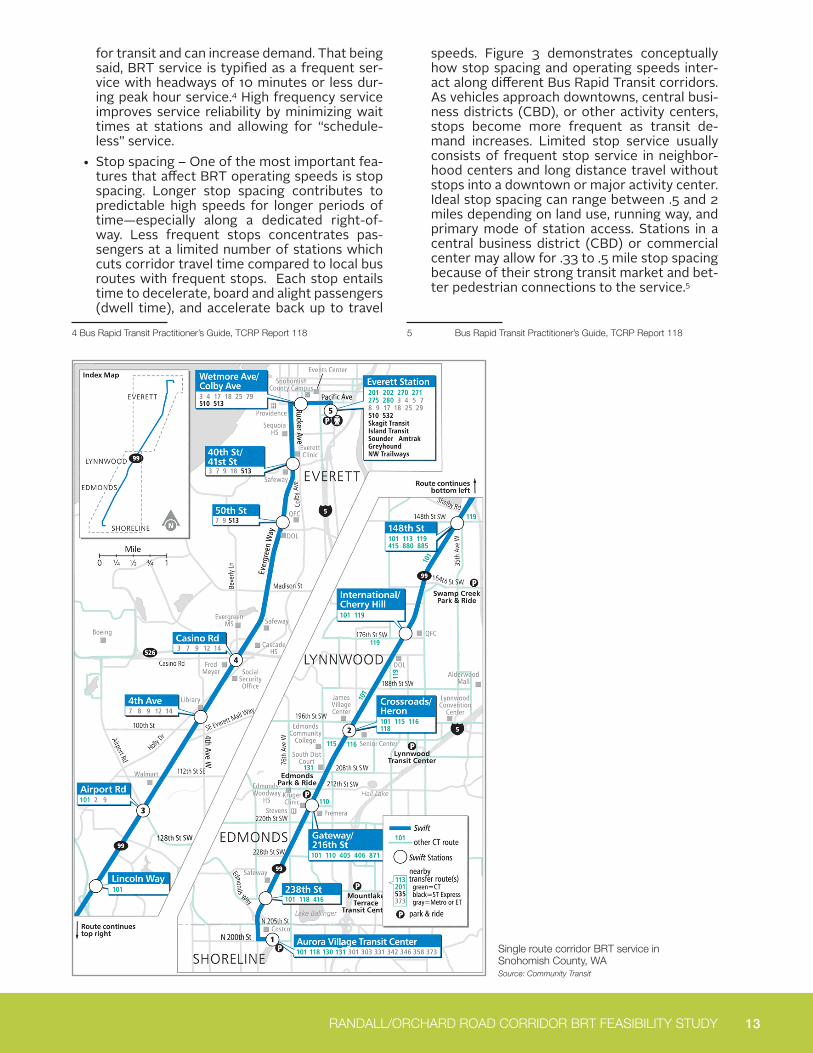
• Route structure – BRT generally operates on three types of routes: Single Route; Overlap-ping Service; and BRT with Network Integra-tion:
– Single routes are simple, direct routing on one corridor that are typically devel-oped along corridors with multiple activ-ity centers and transit generating uses at nearly every stop. One consideration with single route structuring is that it is heavily resource intensive and must extend high quality service during off-peak periods.
1 Characteristics of Bus Rapid Transit for Decision-Making, 2009. Federal Transit Administration
12 BRT PRIMER | WHAT ARE THE GENERAL CHARACTERISTICS OF BRT?
– Overlapping routes are those that offer a base BRT service with variations such as skip stop patterns and express service dur-ing peak hours. This type of routing can bet-ter allocate resources according to the dual goals of providing access to local services, while improving regional mobility. If BRT service runs on dedicated right-of-ways, this type of route structure might work best with transit passing lanes to avoid de-lay and congestion.
– Integrated BRT system considers not only the BRT corridor service, but also the sup-plemental feeder routes that branch from the BRT service or other local fixed route service types that may be overlaid onto the BRT service.
In all, the most important conditions of route struc-ture are that the service patterns are clear and us-er-friendly, yet allow for consumer choice depend-ing on trip purpose.2
• Service span – Service span can range from 18 hours or more to only peak hour service. In gen-eral, BRT service operates all day with consis-tent frequencies during both peak and off-peak
2 Characteristics of Bus Rapid Transit for Decision-Making, 2009. Federal Transit Administration
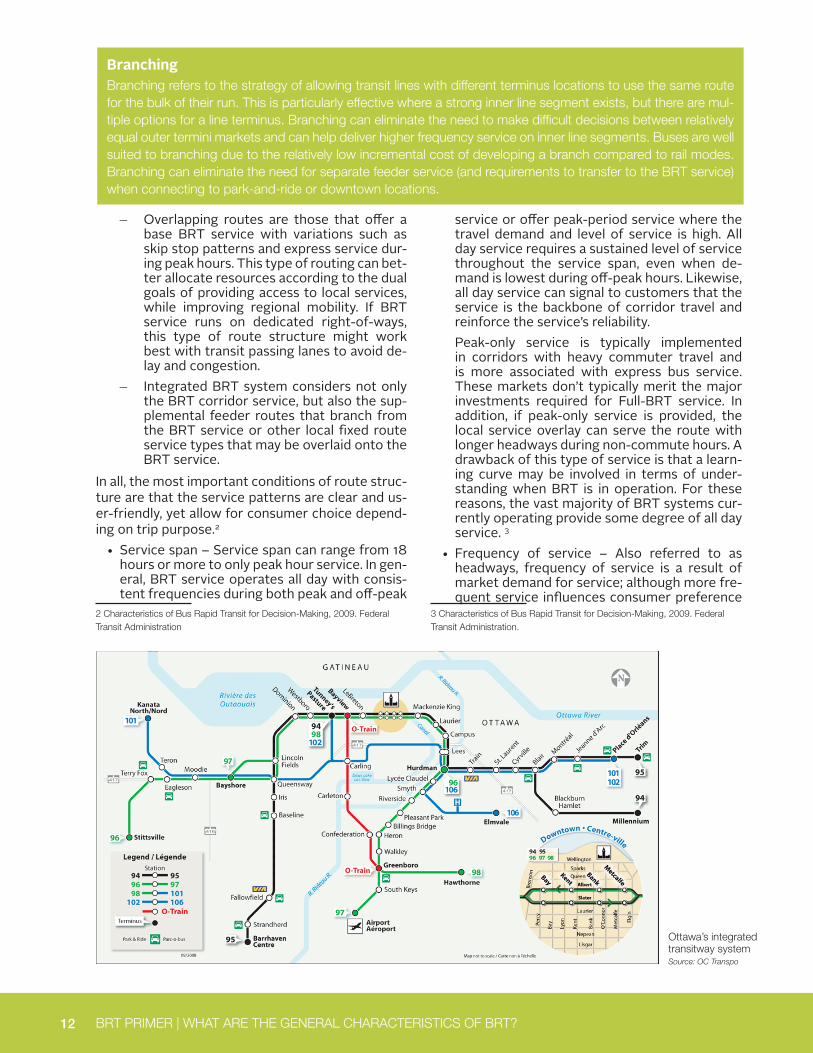
BranchingBranching refers to the strategy of allowing transit lines with different terminus locations to use the same route for the bulk of their run. This is particularly effective where a strong inner line segment exists, but there are mul-tiple options for a line terminus. Branching can eliminate the need to make difficult decisions between relatively equal outer termini markets and can help deliver higher frequency service on inner line segments. Buses are well suited to branching due to the relatively low incremental cost of developing a branch compared to rail modes. Branching can eliminate the need for separate feeder service (and requirements to transfer to the BRT service) when connecting to park-and-ride or downtown locations.
service or offer peak-period service where the travel demand and level of service is high. All day service requires a sustained level of service throughout the service span, even when de-mand is lowest during off-peak hours. Likewise, all day service can signal to customers that the service is the backbone of corridor travel and reinforce the service’s reliability.Peak-only service is typically implemented in corridors with heavy commuter travel and is more associated with express bus service. These markets don’t typically merit the major investments required for Full-BRT service. In addition, if peak-only service is provided, the local service overlay can serve the route with longer headways during non-commute hours. A drawback of this type of service is that a learn-ing curve may be involved in terms of under-standing when BRT is in operation. For these reasons, the vast majority of BRT systems cur-rently operating provide some degree of all day service. 3
• Frequency of service – Also referred to as headways, frequency of service is a result of market demand for service; although more fre-quent service influences consumer preference
3 Characteristics of Bus Rapid Transit for Decision-Making, 2009. Federal Transit Administration.
Ottawa’s integrated transitway system Source: OC Transpo
13 RANDALL/ORCHARD ROAD CORRIDOR BRT FEASIBILITY STUDY
for transit and can increase demand. That being said, BRT service is typified as a frequent ser-vice with headways of 10 minutes or less dur-ing peak hour service.4 High frequency service improves service reliability by minimizing wait times at stations and allowing for “schedule-less” service.
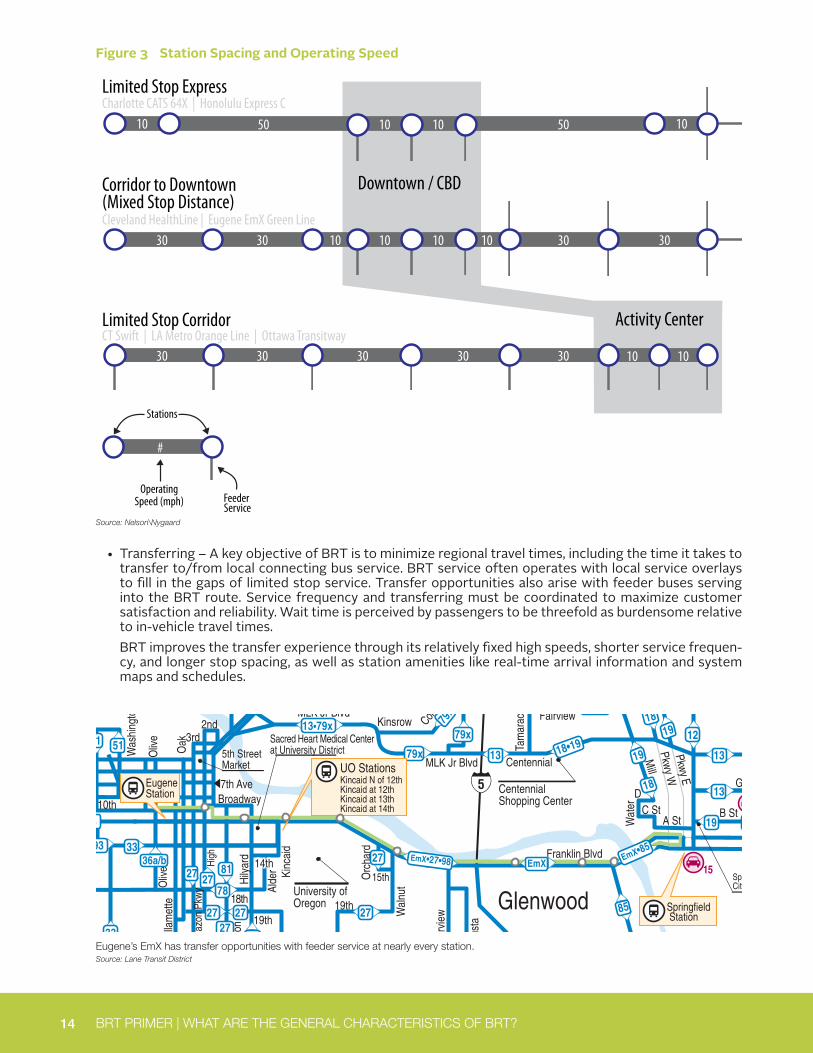
• Stop spacing – One of the most important fea-tures that affect BRT operating speeds is stop spacing. Longer stop spacing contributes to predictable high speeds for longer periods of time—especially along a dedicated right-of-way. Less frequent stops concentrates pas-sengers at a limited number of stations which cuts corridor travel time compared to local bus routes with frequent stops. Each stop entails time to decelerate, board and alight passengers (dwell time), and accelerate back up to travel
4 Bus Rapid Transit Practitioner’s Guide, TCRP Report 118
speeds. Figure 3 demonstrates conceptually how stop spacing and operating speeds inter-act along different Bus Rapid Transit corridors. As vehicles approach downtowns, central busi-ness districts (CBD), or other activity centers, stops become more frequent as transit de-mand increases. Limited stop service usually consists of frequent stop service in neighbor-hood centers and long distance travel without stops into a downtown or major activity center. Ideal stop spacing can range between .5 and 2 miles depending on land use, running way, and primary mode of station access. Stations in a central business district (CBD) or commercial center may allow for .33 to .5 mile stop spacing because of their strong transit market and bet-ter pedestrian connections to the service.5
5 Bus Rapid Transit Practitioner’s Guide, TCRP Report 118
Single route corridor BRT service in Snohomish County, WA Source: Community Transit
14 BRT PRIMER | WHAT ARE THE GENERAL CHARACTERISTICS OF BRT?
• Transferring – A key objective of BRT is to minimize regional travel times, including the time it takes to transfer to/from local connecting bus service. BRT service often operates with local service overlays to fill in the gaps of limited stop service. Transfer opportunities also arise with feeder buses serving into the BRT route. Service frequency and transferring must be coordinated to maximize customer satisfaction and reliability. Wait time is perceived by passengers to be threefold as burdensome relative to in-vehicle travel times.BRT improves the transfer experience through its relatively fixed high speeds, shorter service frequen-cy, and longer stop spacing, as well as station amenities like real-time arrival information and system maps and schedules.
Figure 3 Station Spacing and Operating Speed
Downtown / CBD
Limited Stop Corridor
Corridor to Downtown(Mixed Stop Distance)
Limited Stop Express
Activity Center
30 3030 30 30 30
50 50
30 30 30 3010 10 1010
10 1010 10
10 10
#
OperatingSpeed (mph)
Stations
Feeder Service
Charlotte CATS 64X | Honolulu Express C
Cleveland HealthLine | Eugene EmX Green Line
CT Swift | LA Metro Orange Line | Ottawa Transitway
Source: Nelson\Nygaard
���������������������
�
����������
������������� ��������
����������������
��������������� �������
��������� �������
����
��������
�������������
���������������
�����������������
��
��
��
��
��
��
��
��
��
����
���� ��
��
����
��
��
�� ��
��
��
�� ��
��
��
��
�� ��
����
��
��
������
��
����
��
������
��
����
��
��
��
��
��
��
��
��
��
��
��
��
��
����
����
��
��
��
��
��
����
����
��
��
��
��
��
��
��
����
��
��
����
������
����
������
����
��
��
��������
����
��
����
��
����
�� ��
��
����
��
��
����
��
����
��
��
��
��
��
����
��
���
���
��
��
��
����
��
�����
���
���
������
����������
��
��
����
��
�� �� ����
����
��
��
��
��
�� ��
��
��
��
��
��
��
��
��
��
�� ����
��
��������
���������������
��
��
��
���������� ��
��
�����������
��
�����
��
������
��
��
������
��
�����
�������
�����
�����������
��������������
������
��
��
����������
��
�� ����������
������������� ���
��
�������������������������
��������������������������
������������ ��������
� ����������������
����
�����
����
���
�����
����
������������������������
������
�������
�
��������
����
���
����
���
��������
��
��������
�����
�����
���
������
����
�����
����� ���
���
���
��������������
���������
�������
�������
����
�����
����
�����
����
�����
�����
������
��������
��������
����
����
����
����
�����
�������
�����
��������
�
�����
�������
��������
��������
�
�������
�������������
���
���
��
��
���������
���
���
����
�����
����
���������
������
������
����
��������������������������
����
�����������
�������
�������
��
����
����
����
����
������������
�����
���������������
�����������
������������
��������
�����������
������
����
�������
����
��
� ��
����
���
�
����
������
��������
��������
���������� �������
���
�����
����
������
���
��������
����
����
������������
����������
� ��������
����������������
����������
���������
��������
��������
��
�������
����
�������
��������
������
���������
�������
�������
������
�������������
��������
��������� �����
�����
�����
���
�����
���
����
�������
��
������
����� ��
�����
��������
������
����
�����
�����
���
����
��
���������
������������������
����
����
���������
���������
��������
������
����
����
�������������
����
�������
������
���������
���� ��
����������������
����
�����������
����
����������
����
� �������� �������
����
�����
�
����������������
�����
�����
���
���������
������
����
���
����
�������
�������
���������
������������
�����
��
������������ ����
����
��
�����
����
� �����
��
�����
�
����
����
��
������������� �������
������ ��
����
������
�������������
������������������
�����
��������������
���
�������
�
����������������
����������
�����������
��
�������������
����
�����
����
����������������
������������������������������������������������
���
���
�����������������
��
���
�������������������������������
� ������������������������
����
������������
����
����
�
��������������
��
�� ���
����
� ������
��
��
�������
����
���
�������������
���
��������
��
�������������������������������������������������������������������������
������������
�� ����� ������
����
����
�������������������������������������
��
������
����
��
��
�
��
����
���
�������
��
���
����
�
����
�������
��
��
��
����
��
��
��
��������
�����
�����
�����
������
�����
����
��
�� ��
��
��
��
�����������������������������������������
������������
������������������������������
���������������� �����������
����������
��������������������������������������������������
� ���������������
���������
����������������������
������
��
����
���
������
�
���
��
����� ��
��
��
��
��
����
��
�
��
��
�
�
�
��
�
�
�
�����������
�������������������������� ���
���������������������� ���
�������������������������
�������������������� ���
�����������������
� ���������������
�������������������������
����������
������
������������������������� ��
�� �����������������
������������
�� �����������
������������ ����������������
�������������������
��������������������������������������� ���
������������������������������������������������
� ������������������� ���������
� ����������������������������� ���
�
�
�
�
�
�
�
�
��
��
��
��
��
��
��
��
���������������������
��
��
��
��
������������������������
��������
��
������������������������ ���
�
��
����������
��
Eugene’s EmX has transfer opportunities with feeder service at nearly every station. Source: Lane Transit District
15 RANDALL/ORCHARD ROAD CORRIDOR BRT FEASIBILITY STUDY
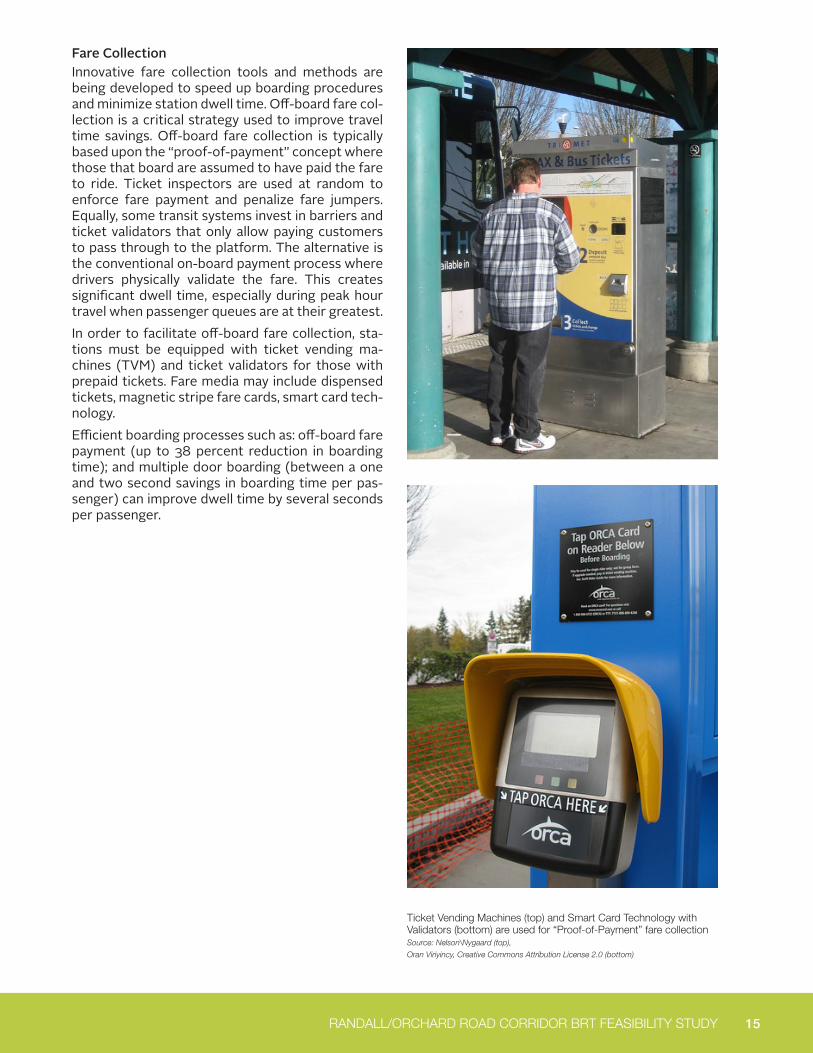
Fare CollectionInnovative fare collection tools and methods are being developed to speed up boarding procedures and minimize station dwell time. Off-board fare col-lection is a critical strategy used to improve travel time savings. Off-board fare collection is typically based upon the “proof-of-payment” concept where those that board are assumed to have paid the fare to ride. Ticket inspectors are used at random to enforce fare payment and penalize fare jumpers. Equally, some transit systems invest in barriers and ticket validators that only allow paying customers to pass through to the platform. The alternative is the conventional on-board payment process where drivers physically validate the fare. This creates significant dwell time, especially during peak hour travel when passenger queues are at their greatest.In order to facilitate off-board fare collection, sta-tions must be equipped with ticket vending ma-chines (TVM) and ticket validators for those with prepaid tickets. Fare media may include dispensed tickets, magnetic stripe fare cards, smart card tech-nology. Efficient boarding processes such as: off-board fare payment (up to 38 percent reduction in boarding time); and multiple door boarding (between a one and two second savings in boarding time per pas-senger) can improve dwell time by several seconds per passenger.
Ticket Vending Machines (top) and Smart Card Technology with Validators (bottom) are used for “Proof-of-Payment” fare collection Source: Nelson\Nygaard (top),
Oran Viriyincy, Creative Commons Attribution License 2.0 (bottom)
16 BRT PRIMER | WHAT ARE THE GENERAL CHARACTERISTICS OF BRT?
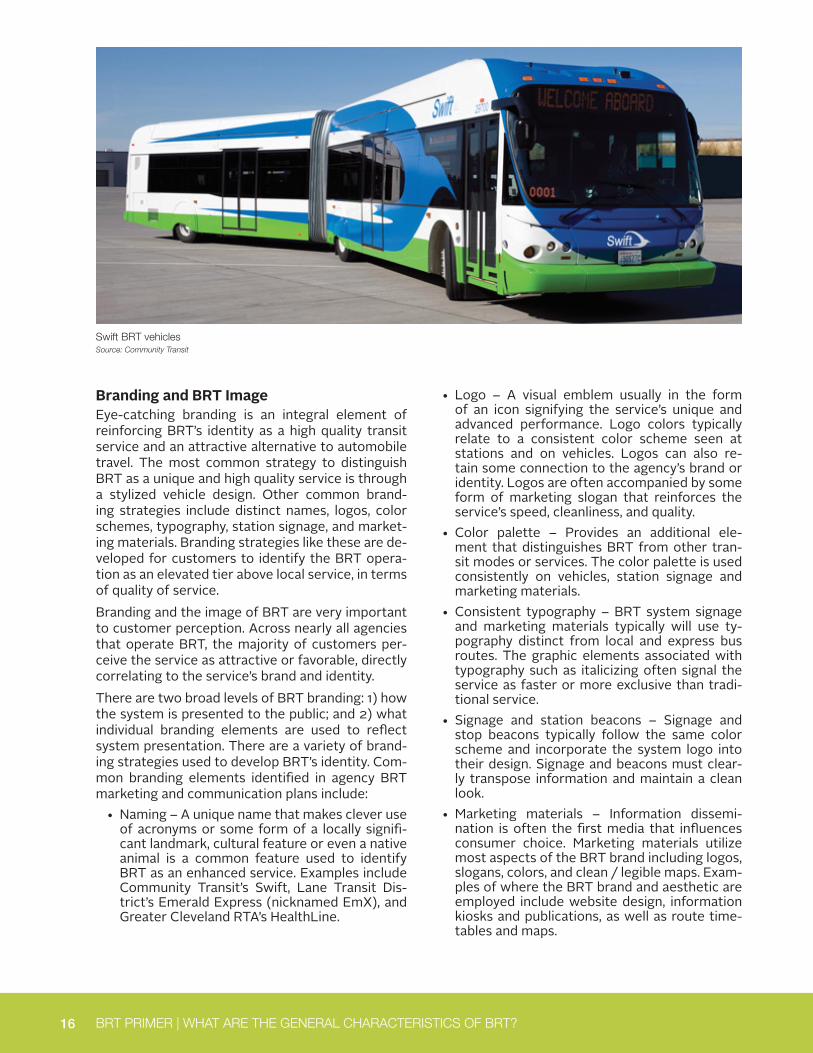
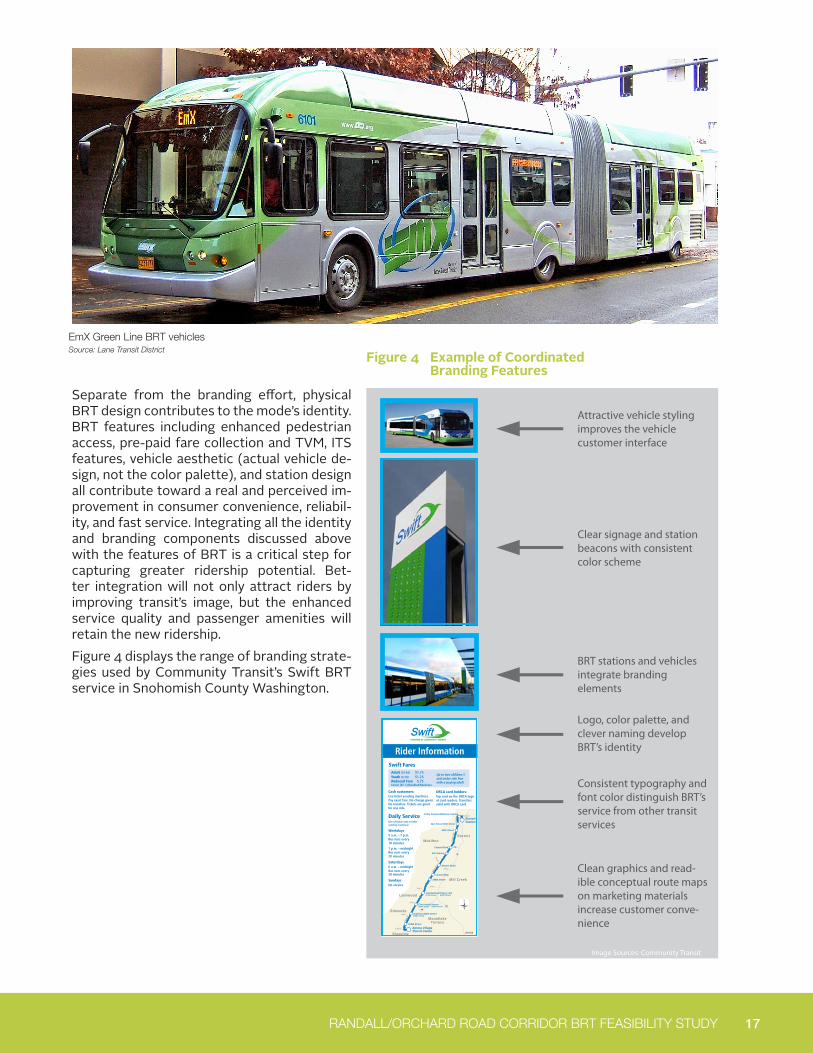
Branding and BRT ImageEye-catching branding is an integral element of reinforcing BRT’s identity as a high quality transit service and an attractive alternative to automobile travel. The most common strategy to distinguish BRT as a unique and high quality service is through a stylized vehicle design. Other common brand-ing strategies include distinct names, logos, color schemes, typography, station signage, and market-ing materials. Branding strategies like these are de-veloped for customers to identify the BRT opera-tion as an elevated tier above local service, in terms of quality of service.Branding and the image of BRT are very important to customer perception. Across nearly all agencies that operate BRT, the majority of customers per-ceive the service as attractive or favorable, directly correlating to the service’s brand and identity. There are two broad levels of BRT branding: 1) how the system is presented to the public; and 2) what individual branding elements are used to reflect system presentation. There are a variety of brand-ing strategies used to develop BRT’s identity. Com-mon branding elements identified in agency BRT marketing and communication plans include:
• Naming – A unique name that makes clever use of acronyms or some form of a locally signifi-cant landmark, cultural feature or even a native animal is a common feature used to identify BRT as an enhanced service. Examples include Community Transit’s Swift, Lane Transit Dis-trict’s Emerald Express (nicknamed EmX), and Greater Cleveland RTA’s HealthLine.
• Logo – A visual emblem usually in the form of an icon signifying the service’s unique and advanced performance. Logo colors typically relate to a consistent color scheme seen at stations and on vehicles. Logos can also re-tain some connection to the agency’s brand or identity. Logos are often accompanied by some form of marketing slogan that reinforces the service’s speed, cleanliness, and quality.
• Color palette – Provides an additional ele-ment that distinguishes BRT from other tran-sit modes or services. The color palette is used consistently on vehicles, station signage and marketing materials.
• Consistent typography – BRT system signage and marketing materials typically will use ty-pography distinct from local and express bus routes. The graphic elements associated with typography such as italicizing often signal the service as faster or more exclusive than tradi-tional service.
• Signage and station beacons – Signage and stop beacons typically follow the same color scheme and incorporate the system logo into their design. Signage and beacons must clear-ly transpose information and maintain a clean look.
• Marketing materials – Information dissemi-nation is often the first media that influences consumer choice. Marketing materials utilize most aspects of the BRT brand including logos, slogans, colors, and clean / legible maps. Exam-ples of where the BRT brand and aesthetic are employed include website design, information kiosks and publications, as well as route time-tables and maps.
Swift BRT vehicles Source: Community Transit
17 RANDALL/ORCHARD ROAD CORRIDOR BRT FEASIBILITY STUDY
Separate from the branding effort, physical BRT design contributes to the mode’s identity. BRT features including enhanced pedestrian access, pre-paid fare collection and TVM, ITS features, vehicle aesthetic (actual vehicle de-sign, not the color palette), and station design all contribute toward a real and perceived im-provement in consumer convenience, reliabil-ity, and fast service. Integrating all the identity and branding components discussed above with the features of BRT is a critical step for capturing greater ridership potential. Bet-ter integration will not only attract riders by improving transit’s image, but the enhanced service quality and passenger amenities will retain the new ridership.Figure 4 displays the range of branding strate-gies used by Community Transit’s Swift BRT service in Snohomish County Washington.
EmX Green Line BRT vehicles Source: Lane Transit District
238th StreetAurora VillageTransit Center
International/Cherry Hill(174th Street) (176th Street)
Crossroads/Heron(196th Street) (200th Street)
Gateway/216th Street(216th Street)
148th Street
Lincoln Way
Airport Road
4th Avenue
Casino Road
50th Street
41st Street /40th Street
Colby Avenue/Wetmore Avenue
EverettStation
Ever
gree
n W
ay
Pacific Ave
Ruck
er A
ve
N 200th St
220th St
196th St
168th St
Airport Rd
128th St
164th St
High
way 9
9
Highw
ay 99
526
EverettMukilteo
Lynnwood
Edmonds
Shoreline
MountlakeTerrace
Mill Creek
Swift Fares Adult (19-64) $1.75 Youth (6-18) $1.25 Reduced Fare $.75 Senior (65+)/Disabled/Medicare Cash customers: Use ticket vending machines. Pay exact fare. No change given.No transfers. Tickets are good for one ride.
Daily Service(see schedule next to ticket vending machines)
Weekdays5 a.m. – 7 p.m.Bus runs every 10 minutes
7 p.m. – midnightBus runs every 20 minutes
Saturdays 6 a.m. – midnightBus runs every 20 minutes
Sundays No service
Rider Information
ORCA card holders: Tap card on the ORCA logo at card readers. Transfers valid with ORCA card.
Up to two children 5 and under ride free with a paying adult.
05105k
Attractive vehicle styling improves the vehicle customer interface
Clear signage and station beacons with consistent color scheme
BRT stations and vehicles integrate branding elements
Logo, color palette, and clever naming develop BRT’s identity
Consistent typography and font color distinguish BRT’s service from other transit services
Clean graphics and read-ible conceptual route maps on marketing materials increase customer conve-nience
Image Sources: Community Transit
Figure 4 Example of Coordinated Branding Features
18 BRT PRIMER | WHAT ARE THE GENERAL CHARACTERISTICS OF BRT?
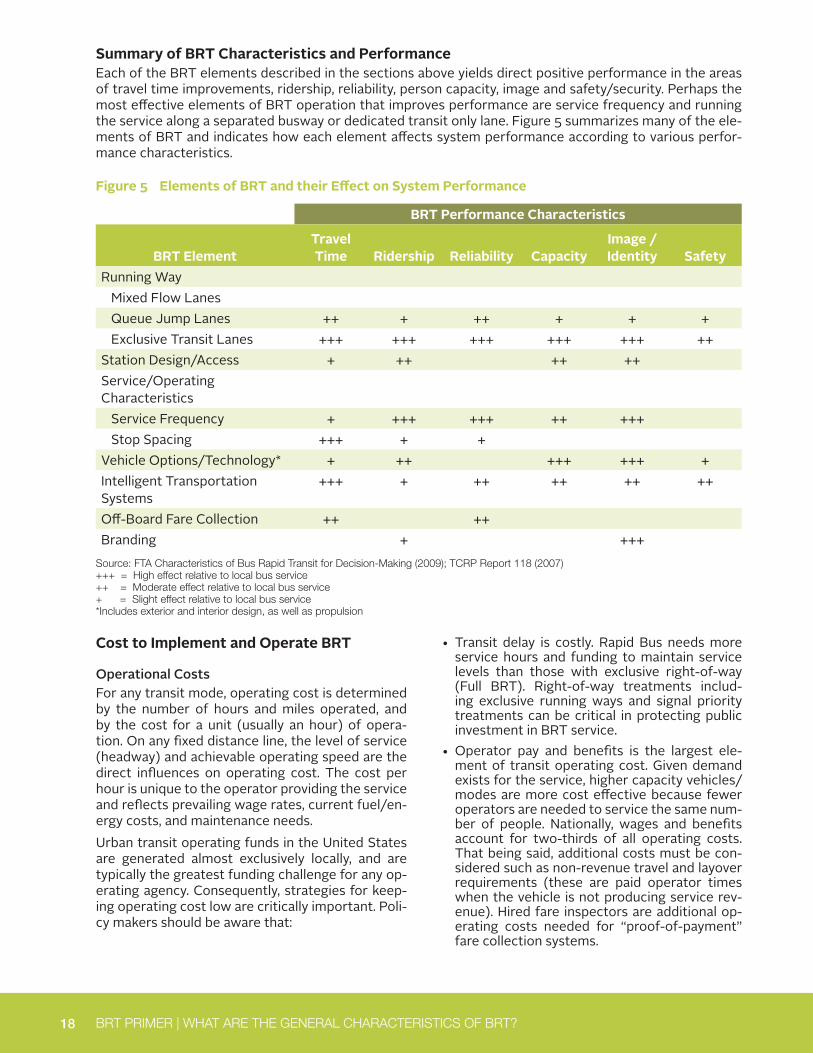
Summary of BRT Characteristics and PerformanceEach of the BRT elements described in the sections above yields direct positive performance in the areas of travel time improvements, ridership, reliability, person capacity, image and safety/security. Perhaps the most effective elements of BRT operation that improves performance are service frequency and running the service along a separated busway or dedicated transit only lane. Figure 5 summarizes many of the ele-ments of BRT and indicates how each element affects system performance according to various perfor-mance characteristics.
BRT Performance Characteristics
BRT ElementTravel Time Ridership Reliability Capacity
Image / Identity Safety
Running Way Mixed Flow Lanes Queue Jump Lanes ++ + ++ + + + Exclusive Transit Lanes +++ +++ +++ +++ +++ ++Station Design/Access + ++ ++ ++Service/Operating Characteristics Service Frequency + +++ +++ ++ +++ Stop Spacing +++ + +Vehicle Options/Technology* + ++ +++ +++ +Intelligent Transportation Systems
+++ + ++ ++ ++ ++
Off-Board Fare Collection ++ ++Branding + +++
Source: FTA Characteristics of Bus Rapid Transit for Decision-Making (2009); TCRP Report 118 (2007) +++ = High effect relative to local bus service ++ = Moderate effect relative to local bus service + = Slight effect relative to local bus service *Includes exterior and interior design, as well as propulsion
Cost to Implement and Operate BRT
Operational Costs For any transit mode, operating cost is determined by the number of hours and miles operated, and by the cost for a unit (usually an hour) of opera-tion. On any fixed distance line, the level of service (headway) and achievable operating speed are the direct influences on operating cost. The cost per hour is unique to the operator providing the service and reflects prevailing wage rates, current fuel/en-ergy costs, and maintenance needs.Urban transit operating funds in the United States are generated almost exclusively locally, and are typically the greatest funding challenge for any op-erating agency. Consequently, strategies for keep-ing operating cost low are critically important. Poli-cy makers should be aware that:
• Transit delay is costly. Rapid Bus needs more service hours and funding to maintain service levels than those with exclusive right-of-way (Full BRT). Right-of-way treatments includ-ing exclusive running ways and signal priority treatments can be critical in protecting public investment in BRT service.
• Operator pay and benefits is the largest ele-ment of transit operating cost. Given demand exists for the service, higher capacity vehicles/modes are more cost effective because fewer operators are needed to service the same num-ber of people. Nationally, wages and benefits account for two-thirds of all operating costs. That being said, additional costs must be con-sidered such as non-revenue travel and layover requirements (these are paid operator times when the vehicle is not producing service rev-enue). Hired fare inspectors are additional op-erating costs needed for “proof-of-payment” fare collection systems.
Figure 5 Elements of BRT and their Effect on System Performance
19 RANDALL/ORCHARD ROAD CORRIDOR BRT FEASIBILITY STUDY
System
Operating Cost per
Hour
Operating Cost Per
MilePittsburgh, West Busway
$81.90 $6.40
MBTA Silver Line, Washington Blvd.
$109 $17
LA Metro Orange Line (2007)
$243.18 $14.53
LA Metro Rapid $117.12 $9.57
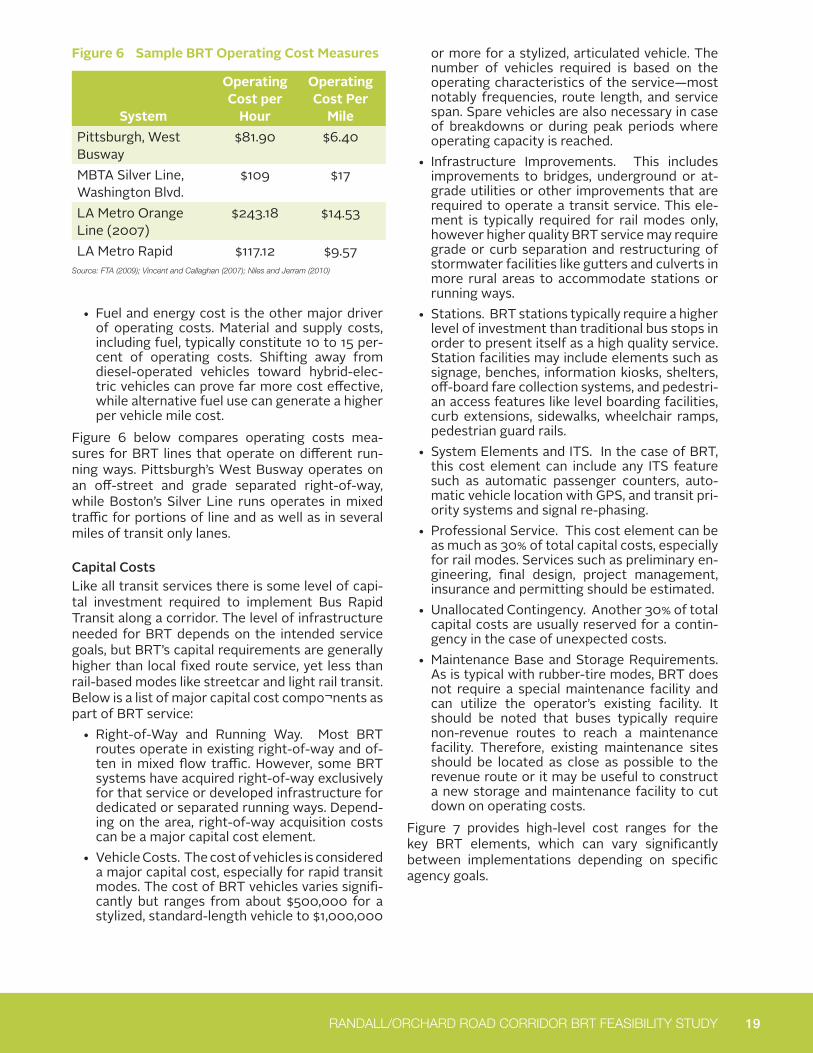
Figure 6 Sample BRT Operating Cost Measures
Source: FTA (2009); Vincent and Callaghan (2007); Niles and Jerram (2010)
• Fuel and energy cost is the other major driver of operating costs. Material and supply costs, including fuel, typically constitute 10 to 15 per-cent of operating costs. Shifting away from diesel-operated vehicles toward hybrid-elec-tric vehicles can prove far more cost effective, while alternative fuel use can generate a higher per vehicle mile cost.
Figure 6 below compares operating costs mea-sures for BRT lines that operate on different run-ning ways. Pittsburgh’s West Busway operates on an off-street and grade separated right-of-way, while Boston’s Silver Line runs operates in mixed traffic for portions of line and as well as in several miles of transit only lanes.
Capital Costs Like all transit services there is some level of capi-tal investment required to implement Bus Rapid Transit along a corridor. The level of infrastructure needed for BRT depends on the intended service goals, but BRT’s capital requirements are generally higher than local fixed route service, yet less than rail-based modes like streetcar and light rail transit. Below is a list of major capital cost compo¬nents as part of BRT service:
• Right-of-Way and Running Way. Most BRT routes operate in existing right-of-way and of-ten in mixed flow traffic. However, some BRT systems have acquired right-of-way exclusively for that service or developed infrastructure for dedicated or separated running ways. Depend-ing on the area, right-of-way acquisition costs can be a major capital cost element.
• Vehicle Costs. The cost of vehicles is considered a major capital cost, especially for rapid transit modes. The cost of BRT vehicles varies signifi-cantly but ranges from about $500,000 for a stylized, standard-length vehicle to $1,000,000
or more for a stylized, articulated vehicle. The number of vehicles required is based on the operating characteristics of the service—most notably frequencies, route length, and service span. Spare vehicles are also necessary in case of breakdowns or during peak periods where operating capacity is reached.
• Infrastructure Improvements. This includes improvements to bridges, underground or at-grade utilities or other improvements that are required to operate a transit service. This ele-ment is typically required for rail modes only, however higher quality BRT service may require grade or curb separation and restructuring of stormwater facilities like gutters and culverts in more rural areas to accommodate stations or running ways.
• Stations. BRT stations typically require a higher level of investment than traditional bus stops in order to present itself as a high quality service. Station facilities may include elements such as signage, benches, information kiosks, shelters, off-board fare collection systems, and pedestri-an access features like level boarding facilities, curb extensions, sidewalks, wheelchair ramps, pedestrian guard rails.
• System Elements and ITS. In the case of BRT, this cost element can include any ITS feature such as automatic passenger counters, auto-matic vehicle location with GPS, and transit pri-ority systems and signal re-phasing.
• Professional Service. This cost element can be as much as 30% of total capital costs, especially for rail modes. Services such as preliminary en-gineering, final design, project management, insurance and permitting should be estimated.
• Unallocated Contingency. Another 30% of total capital costs are usually reserved for a contin-gency in the case of unexpected costs.
• Maintenance Base and Storage Requirements. As is typical with rubber-tire modes, BRT does not require a special maintenance facility and can utilize the operator’s existing facility. It should be noted that buses typically require non-revenue routes to reach a maintenance facility. Therefore, existing maintenance sites should be located as close as possible to the revenue route or it may be useful to construct a new storage and maintenance facility to cut down on operating costs.
Figure 7 provides high-level cost ranges for the key BRT elements, which can vary significantly between implementations depending on specific agency goals.
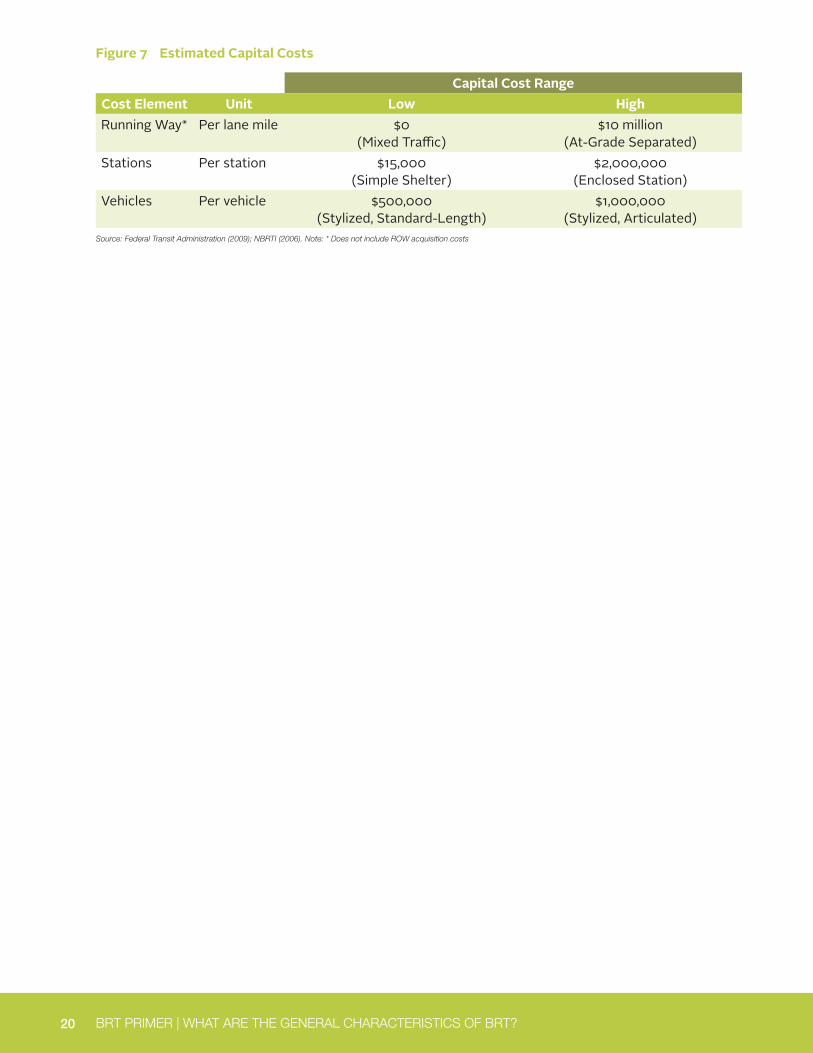
20 BRT PRIMER | WHAT ARE THE GENERAL CHARACTERISTICS OF BRT?
Capital Cost RangeCost Element Unit Low HighRunning Way* Per lane mile $0
(Mixed Traffic)$10 million
(At-Grade Separated)Stations Per station $15,000
(Simple Shelter)$2,000,000
(Enclosed Station)Vehicles Per vehicle $500,000
(Stylized, Standard-Length)$1,000,000
(Stylized, Articulated)
Figure 7 Estimated Capital Costs
Source: Federal Transit Administration (2009); NBRTI (2006). Note: * Does not include ROW acquisition costs
21
KANE COUNTY RANDALL/ORCHARD ROAD CORRIDOR BRT FEASIBILITY STUDY
Although there is no definitive standard characterizing the perimeters for BRT implementation and performance, there are several conditions that drive success-ful BRT projects around the world. The following sections provide detail on four common conditions of implementing and operating a thriving BRT corridor.
WHAT ARE CONDITIONS FOR SUCCESSFUL BRT PROJECTS?
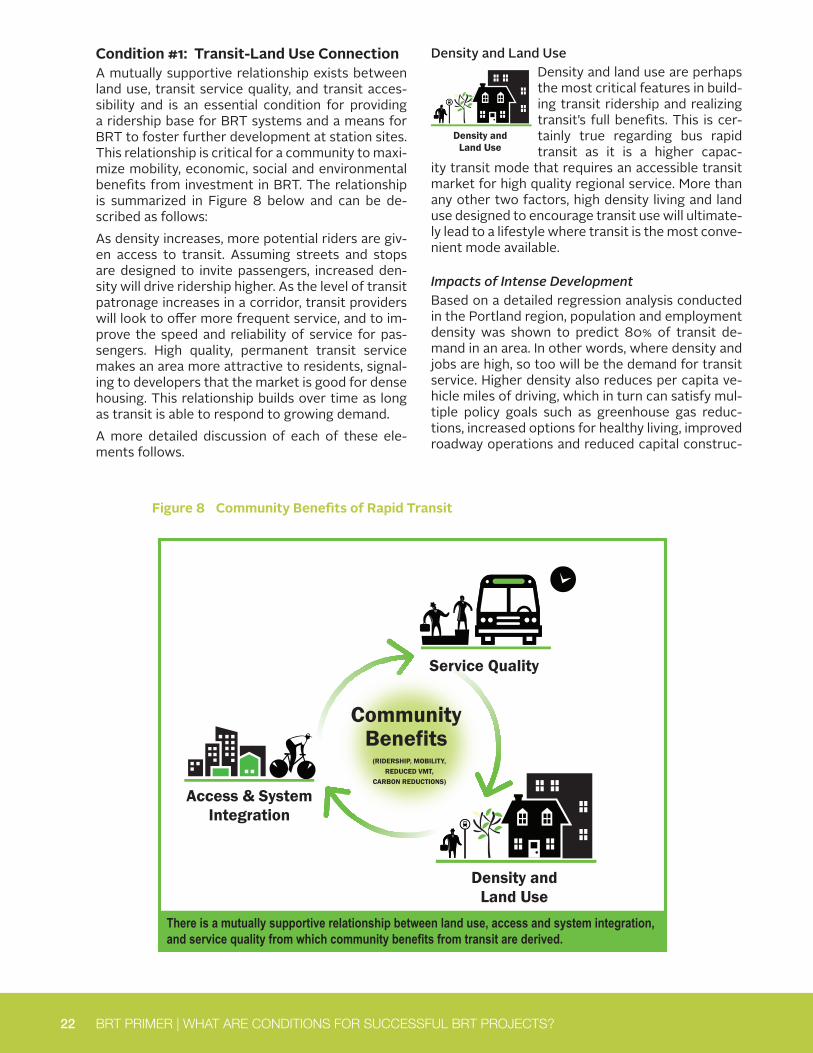
22 BRT PRIMER | WHAT ARE CONDITIONS FOR SUCCESSFUL BRT PROJECTS?
Condition #1: Transit-Land Use ConnectionA mutually supportive relationship exists between land use, transit service quality, and transit acces-sibility and is an essential condition for providing a ridership base for BRT systems and a means for BRT to foster further development at station sites. This relationship is critical for a community to maxi-mize mobility, economic, social and environmental benefits from investment in BRT. The relationship is summarized in Figure 8 below and can be de-scribed as follows: As density increases, more potential riders are giv-en access to transit. Assuming streets and stops are designed to invite passengers, increased den-sity will drive ridership higher. As the level of transit patronage increases in a corridor, transit providers will look to offer more frequent service, and to im-prove the speed and reliability of service for pas-sengers. High quality, permanent transit service makes an area more attractive to residents, signal-ing to developers that the market is good for dense housing. This relationship builds over time as long as transit is able to respond to growing demand. A more detailed discussion of each of these ele-ments follows.
Figure 8 Community Benefits of Rapid Transit
Density and Land UseDensity and land use are perhaps the most critical features in build-ing transit ridership and realizing transit’s full benefits. This is cer-tainly true regarding bus rapid transit as it is a higher capac-
ity transit mode that requires an accessible transit market for high quality regional service. More than any other two factors, high density living and land use designed to encourage transit use will ultimate-ly lead to a lifestyle where transit is the most conve-nient mode available.
Impacts of Intense DevelopmentBased on a detailed regression analysis conducted in the Portland region, population and employment density was shown to predict 80% of transit de-mand in an area. In other words, where density and jobs are high, so too will be the demand for transit service. Higher density also reduces per capita ve-hicle miles of driving, which in turn can satisfy mul-tiple policy goals such as greenhouse gas reduc-tions, increased options for healthy living, improved roadway operations and reduced capital construc-
Density and Land Use
Service Quality
Density and Land Use
Access & System Integration
Community Benefits
(RIDERSHIP, MOBILITY, REDUCED VMT,
CARBON REDUCTIONS)
There is a mutually supportive relationship between land use, access and system integration, and service quality from which community benefits from transit are derived.
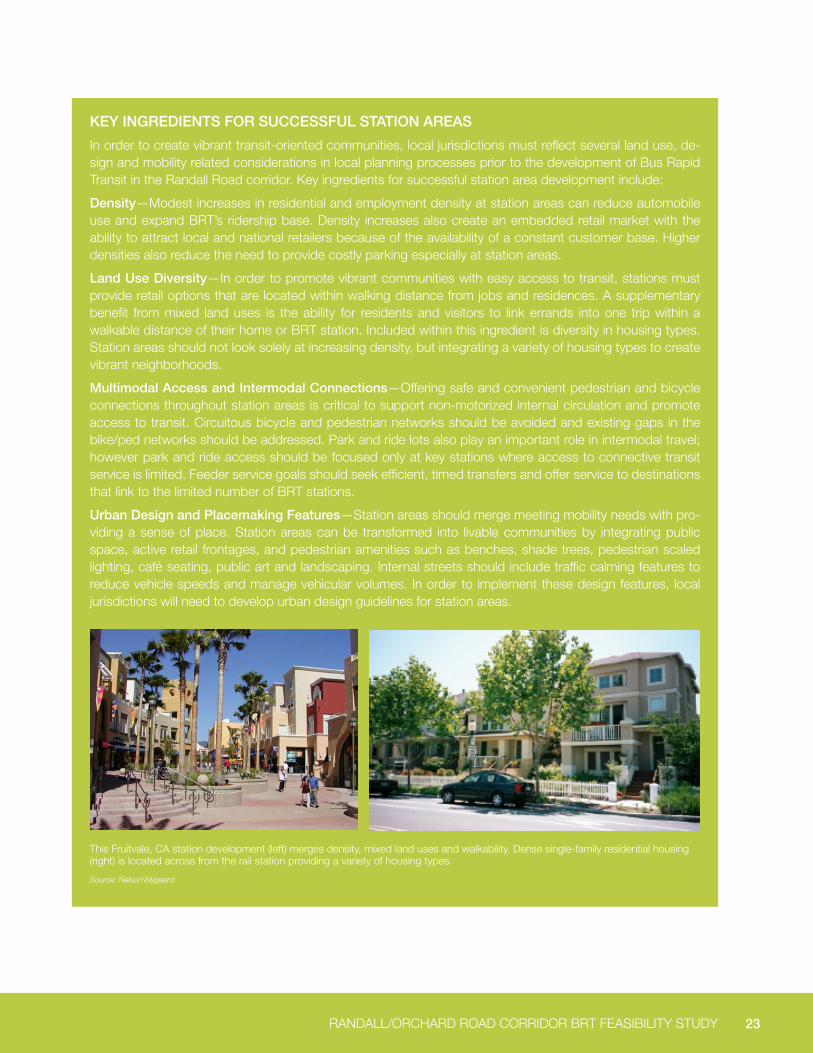
23 RANDALL/ORCHARD ROAD CORRIDOR BRT FEASIBILITY STUDY
KEY INGREDIENTS FOR SUCCESSFUL STATION AREAS
In order to create vibrant transit-oriented communities, local jurisdictions must reflect several land use, de-sign and mobility related considerations in local planning processes prior to the development of Bus Rapid Transit in the Randall Road corridor. Key ingredients for successful station area development include:
Density—Modest increases in residential and employment density at station areas can reduce automobile use and expand BRT’s ridership base. Density increases also create an embedded retail market with the ability to attract local and national retailers because of the availability of a constant customer base. Higher densities also reduce the need to provide costly parking especially at station areas.
Land Use Diversity—In order to promote vibrant communities with easy access to transit, stations must provide retail options that are located within walking distance from jobs and residences. A supplementary benefit from mixed land uses is the ability for residents and visitors to link errands into one trip within a walkable distance of their home or BRT station. Included within this ingredient is diversity in housing types. Station areas should not look solely at increasing density, but integrating a variety of housing types to create vibrant neighborhoods.
Multimodal Access and Intermodal Connections—Offering safe and convenient pedestrian and bicycle connections throughout station areas is critical to support non-motorized internal circulation and promote access to transit. Circuitous bicycle and pedestrian networks should be avoided and existing gaps in the bike/ped networks should be addressed. Park and ride lots also play an important role in intermodal travel; however park and ride access should be focused only at key stations where access to connective transit service is limited. Feeder service goals should seek efficient, timed transfers and offer service to destinations that link to the limited number of BRT stations.
Urban Design and Placemaking Features—Station areas should merge meeting mobility needs with pro-viding a sense of place. Station areas can be transformed into livable communities by integrating public space, active retail frontages, and pedestrian amenities such as benches, shade trees, pedestrian scaled lighting, café seating, public art and landscaping. Internal streets should include traffic calming features to reduce vehicle speeds and manage vehicular volumes. In order to implement these design features, local jurisdictions will need to develop urban design guidelines for station areas.
This Fruitvale, CA station development (left) merges density, mixed land uses and walkability. Dense single-family residential housing (right) is located across from the rail station providing a variety of housing types.
Source: Nelson\Nygaard
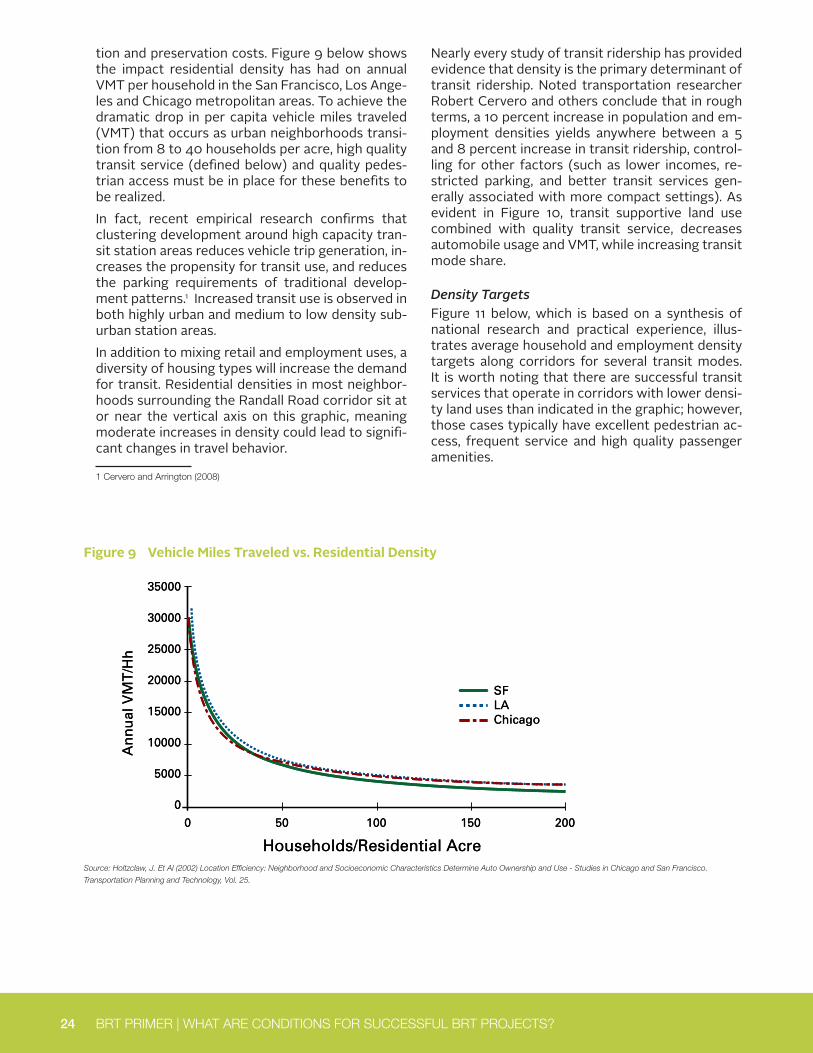
24 BRT PRIMER | WHAT ARE CONDITIONS FOR SUCCESSFUL BRT PROJECTS?
tion and preservation costs. Figure 9 below shows the impact residential density has had on annual VMT per household in the San Francisco, Los Ange-les and Chicago metropolitan areas. To achieve the dramatic drop in per capita vehicle miles traveled (VMT) that occurs as urban neighborhoods transi-tion from 8 to 40 households per acre, high quality transit service (defined below) and quality pedes-trian access must be in place for these benefits to be realized.In fact, recent empirical research confirms that clustering development around high capacity tran-sit station areas reduces vehicle trip generation, in-creases the propensity for transit use, and reduces the parking requirements of traditional develop-ment patterns.1 Increased transit use is observed in both highly urban and medium to low density sub-urban station areas.In addition to mixing retail and employment uses, a diversity of housing types will increase the demand for transit. Residential densities in most neighbor-hoods surrounding the Randall Road corridor sit at or near the vertical axis on this graphic, meaning moderate increases in density could lead to signifi-cant changes in travel behavior.
1 Cervero and Arrington (2008)
Figure 9 Vehicle Miles Traveled vs. Residential Density
Es-4 | sEATTLE cITy cOuncIL
tRANSIt mODAL ANALYSIS Executive summary
Density and land use are perhaps the most critical features in building transit rider-ship and realizing transit’s full benefits. High density living and land use designed to encourage easy access to transit will lead to a lifestyle where transit is the most convenient mode available. Based on a detailed regression analysis conducted in the Portland region,1 population and employment density can predict 80 percent of the variance in transit demand in an area. In other words, where density and jobs are high, so too will be the demand for transit service.
Higher density also reduces vehicle miles traveled (VMT), which in turn satifies mul-tiple policy goals such as greenhouse gas reductions, improved roadway operations and reduced capital construction. Figure ES-1 below shows the impact increased residential density has had on annual VMT per household in San Francisco, Los Angeles and Chicago. To achieve the dramatic drop in per capita VMT that occurs as urban neighborhoods transition from 10 to 50 households per acre, high quality transit service (defined below) and quality pedestrian access must be in place. The transit systems that support the great cities of the world (London, New York, Tokyo, etc.) are emblematic of the essential role transit plays in dense, vital neighborhoods with great, pedestrian-friendly streets.
FigURE ES-1 VEhicLE miLES TRaVELEd VS. RESidEnTiaL dEnSiTy
Source: Holtzclaw, J. Et Al (2002) Location Efficiency: Neighborhood And Socioeconomic Characteristics Determine Auto Ownership And Use – Studies In Chicago, Los Angeles And San Francisco. Transportation Planning and Technology, Vol. 25.
� Nelson\Nygaard Consulting Associates, “Portland Primary Transit Network Study.” Metro. �997.
35000
0
5000
10000
15000
20000
25000
30000
200150100500
Households/Residential Acre
An
nu
al V
MT
/Hh
SFLAChicago
3.00
0.00
0.50
1.00
1.50
2.00
2.50
200150100500
SFLAChicago
Households/Residential Acre
Veh
icle
s/H
ou
seh
old
35000
0
5000
10000
15000
20000
25000
30000
200150100500
Households/Residential Acre
An
nu
al V
MT
/Hh
SFLAChicago
3.00
0.00
0.50
1.00
1.50
2.00
2.50
200150100500
SFLAChicago
Households/Residential Acre
Veh
icle
s/H
ou
seh
old
Density and Land Use
Nearly every study of transit ridership has provided evidence that density is the primary determinant of transit ridership. Noted transportation researcher Robert Cervero and others conclude that in rough terms, a 10 percent increase in population and em-ployment densities yields anywhere between a 5 and 8 percent increase in transit ridership, control-ling for other factors (such as lower incomes, re-stricted parking, and better transit services gen-erally associated with more compact settings). As evident in Figure 10, transit supportive land use combined with quality transit service, decreases automobile usage and VMT, while increasing transit mode share.
Density TargetsFigure 11 below, which is based on a synthesis of national research and practical experience, illus-trates average household and employment density targets along corridors for several transit modes. It is worth noting that there are successful transit services that operate in corridors with lower densi-ty land uses than indicated in the graphic; however, those cases typically have excellent pedestrian ac-cess, frequent service and high quality passenger amenities.
Source: Holtzclaw, J. Et Al (2002) Location Efficiency: Neighborhood and Socioeconomic Characteristics Determine Auto Ownership and Use - Studies in Chicago and San Francisco.
Transportation Planning and Technology, Vol. 25.
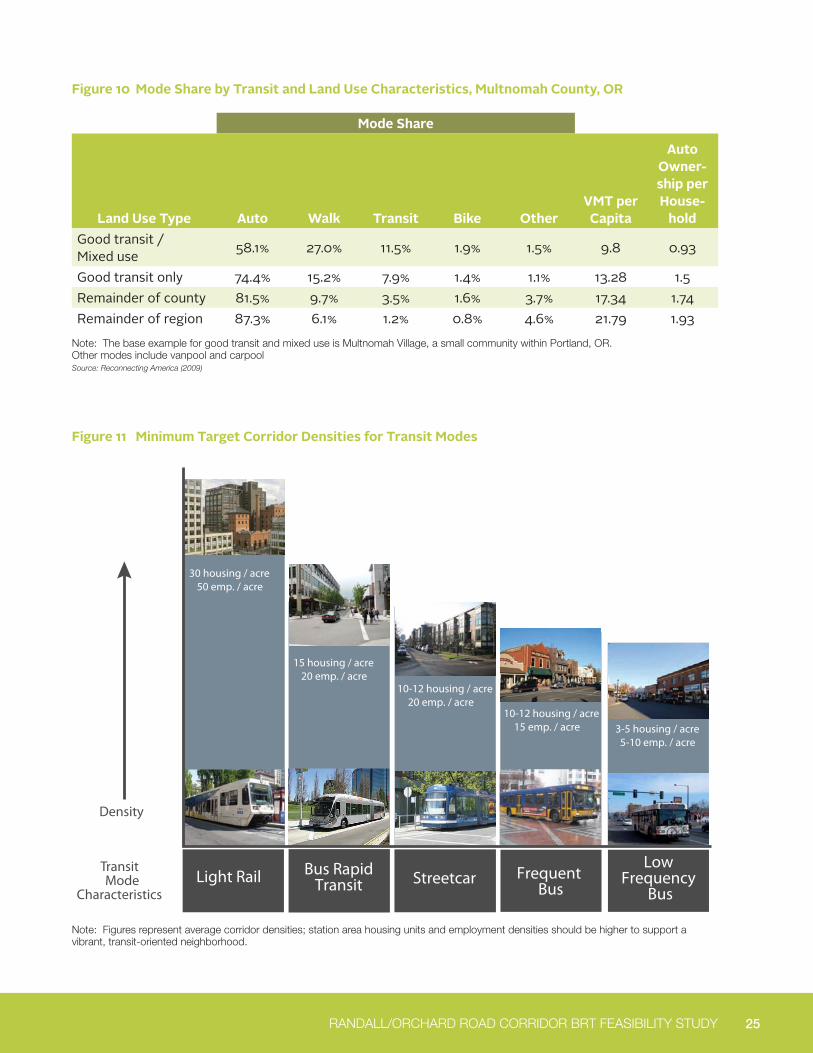
25 RANDALL/ORCHARD ROAD CORRIDOR BRT FEASIBILITY STUDY
Figure 10 Mode Share by Transit and Land Use Characteristics, Multnomah County, OR
Mode Share
Land Use Type Auto Walk Transit Bike OtherVMT per
Capita
Auto Owner-ship per House-
holdGood transit / Mixed use 58.1% 27.0% 11.5% 1.9% 1.5% 9.8 0.93
Good transit only 74.4% 15.2% 7.9% 1.4% 1.1% 13.28 1.5Remainder of county 81.5% 9.7% 3.5% 1.6% 3.7% 17.34 1.74Remainder of region 87.3% 6.1% 1.2% 0.8% 4.6% 21.79 1.93
Note: The base example for good transit and mixed use is Multnomah Village, a small community within Portland, OR. Other modes include vanpool and carpool Source: Reconnecting America (2009)
3-5 housing / acre5-10 emp. / acre
Density
Light Rail Bus RapidTransit Streetcar Frequent
Bus
30 housing / acre50 emp. / acre
15 housing / acre20 emp. / acre
10-12 housing / acre20 emp. / acre
10-12 housing / acre15 emp. / acre
Low Frequency
Bus
Transit Mode
Characteristics
Figure 11 Minimum Target Corridor Densities for Transit Modes
Note: Figures represent average corridor densities; station area housing units and employment densities should be higher to support a vibrant, transit-oriented neighborhood.
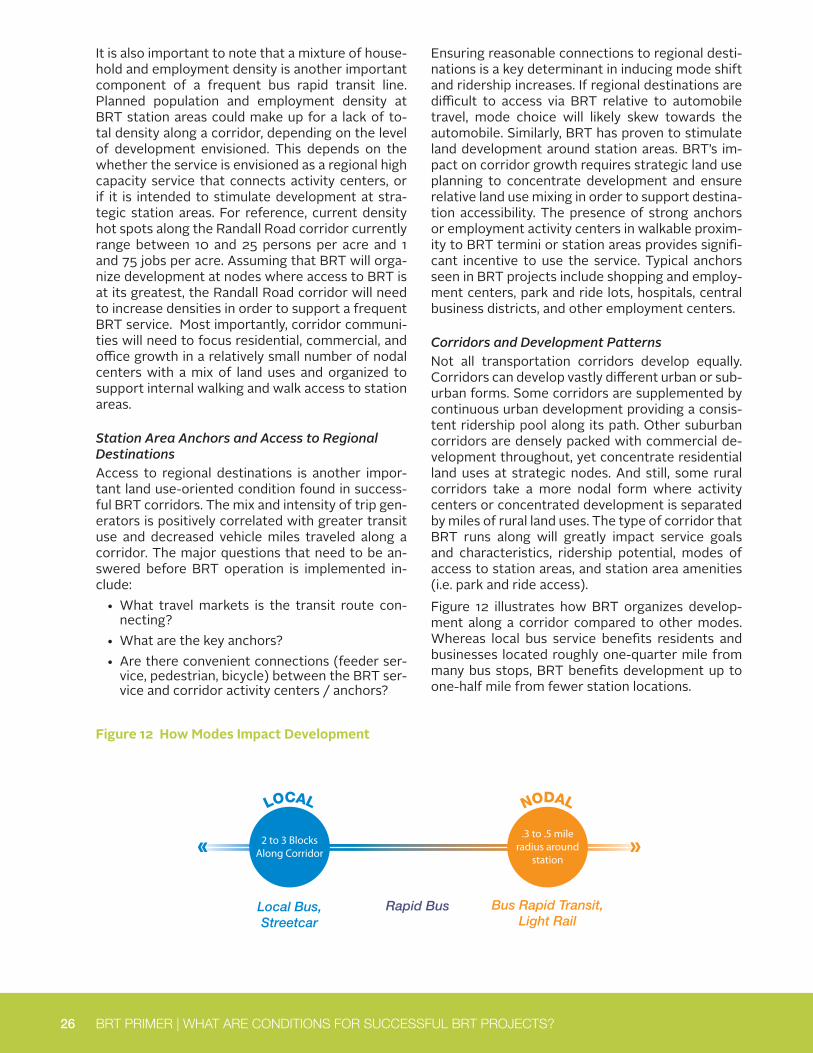
26 BRT PRIMER | WHAT ARE CONDITIONS FOR SUCCESSFUL BRT PROJECTS?
It is also important to note that a mixture of house-hold and employment density is another important component of a frequent bus rapid transit line. Planned population and employment density at BRT station areas could make up for a lack of to-tal density along a corridor, depending on the level of development envisioned. This depends on the whether the service is envisioned as a regional high capacity service that connects activity centers, or if it is intended to stimulate development at stra-tegic station areas. For reference, current density hot spots along the Randall Road corridor currently range between 10 and 25 persons per acre and 1 and 75 jobs per acre. Assuming that BRT will orga-nize development at nodes where access to BRT is at its greatest, the Randall Road corridor will need to increase densities in order to support a frequent BRT service. Most importantly, corridor communi-ties will need to focus residential, commercial, and office growth in a relatively small number of nodal centers with a mix of land uses and organized to support internal walking and walk access to station areas.
Station Area Anchors and Access to Regional DestinationsAccess to regional destinations is another impor-tant land use-oriented condition found in success-ful BRT corridors. The mix and intensity of trip gen-erators is positively correlated with greater transit use and decreased vehicle miles traveled along a corridor. The major questions that need to be an-swered before BRT operation is implemented in-clude:
• What travel markets is the transit route con-necting?
• What are the key anchors?• Are there convenient connections (feeder ser-
vice, pedestrian, bicycle) between the BRT ser-vice and corridor activity centers / anchors?
Ensuring reasonable connections to regional desti-nations is a key determinant in inducing mode shift and ridership increases. If regional destinations are difficult to access via BRT relative to automobile travel, mode choice will likely skew towards the automobile. Similarly, BRT has proven to stimulate land development around station areas. BRT’s im-pact on corridor growth requires strategic land use planning to concentrate development and ensure relative land use mixing in order to support destina-tion accessibility. The presence of strong anchors or employment activity centers in walkable proxim-ity to BRT termini or station areas provides signifi-cant incentive to use the service. Typical anchors seen in BRT projects include shopping and employ-ment centers, park and ride lots, hospitals, central business districts, and other employment centers.
Corridors and Development PatternsNot all transportation corridors develop equally. Corridors can develop vastly different urban or sub-urban forms. Some corridors are supplemented by continuous urban development providing a consis-tent ridership pool along its path. Other suburban corridors are densely packed with commercial de-velopment throughout, yet concentrate residential land uses at strategic nodes. And still, some rural corridors take a more nodal form where activity centers or concentrated development is separated by miles of rural land uses. The type of corridor that BRT runs along will greatly impact service goals and characteristics, ridership potential, modes of access to station areas, and station area amenities (i.e. park and ride access). Figure 12 illustrates how BRT organizes develop-ment along a corridor compared to other modes. Whereas local bus service benefits residents and businesses located roughly one-quarter mile from many bus stops, BRT benefits development up to one-half mile from fewer station locations.
Local Bus, Streetcar
Rapid Bus Bus Rapid Transit, Light Rail
Streetscape doubles as storage/access
Primary access by walk/bike
High investment in station access
Transit feeder service
2 to 3 BlocksAlong Corridor
LOCAL
.3 to .5 mileradius around
station
NODAL
Figure 12 How Modes Impact Development
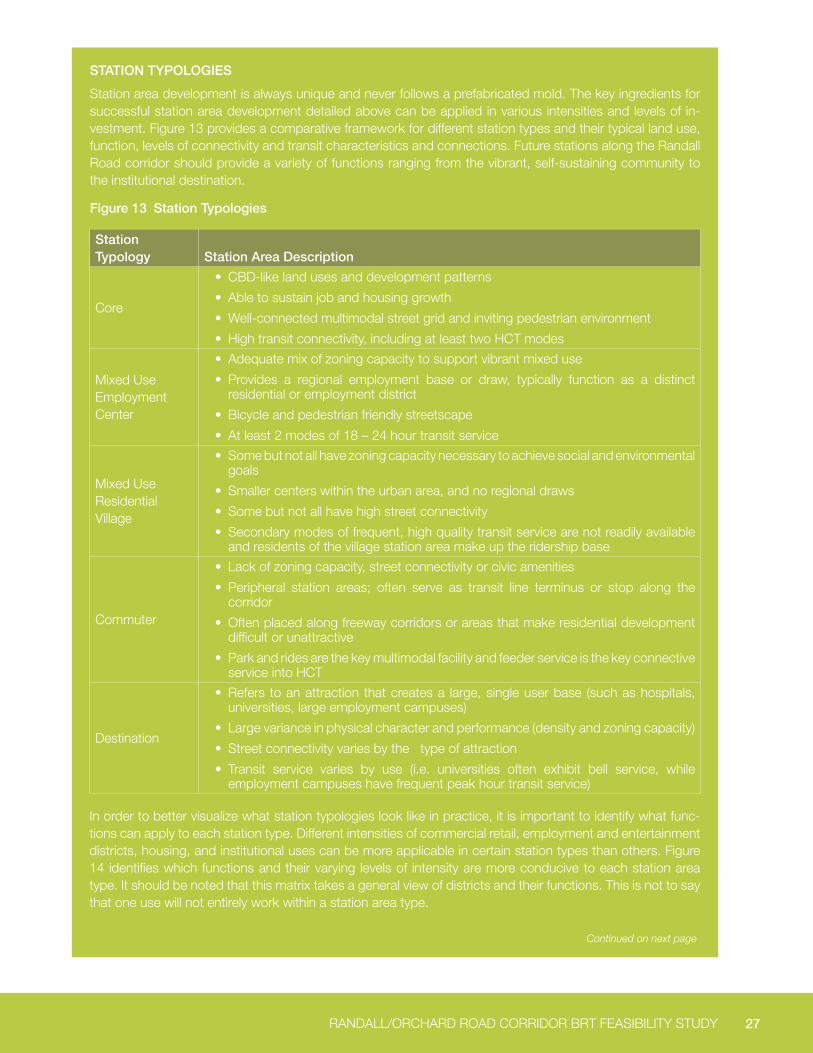
27 RANDALL/ORCHARD ROAD CORRIDOR BRT FEASIBILITY STUDY
STATION TYPOLOGIES
Station area development is always unique and never follows a prefabricated mold. The key ingredients for successful station area development detailed above can be applied in various intensities and levels of in-vestment. Figure 13 provides a comparative framework for different station types and their typical land use, function, levels of connectivity and transit characteristics and connections. Future stations along the Randall Road corridor should provide a variety of functions ranging from the vibrant, self-sustaining community to the institutional destination.
Station Typology Station Area Description
Core
• CBD-like land uses and development patterns
• Able to sustain job and housing growth
• Well-connected multimodal street grid and inviting pedestrian environment
• High transit connectivity, including at least two HCT modes
Mixed Use Employment Center
• Adequate mix of zoning capacity to support vibrant mixed use
• Provides a regional employment base or draw, typically function as a distinct residential or employment district
• Bicycle and pedestrian friendly streetscape
• At least 2 modes of 18 – 24 hour transit service
Mixed Use Residential Village
• Some but not all have zoning capacity necessary to achieve social and environmental goals
• Smaller centers within the urban area, and no regional draws
• Some but not all have high street connectivity
• Secondary modes of frequent, high quality transit service are not readily available and residents of the village station area make up the ridership base
Commuter
• Lack of zoning capacity, street connectivity or civic amenities
• Peripheral station areas; often serve as transit line terminus or stop along the corridor
• Often placed along freeway corridors or areas that make residential development difficult or unattractive
• Park and rides are the key multimodal facility and feeder service is the key connective service into HCT
Destination
• Refers to an attraction that creates a large, single user base (such as hospitals, universities, large employment campuses)
• Large variance in physical character and performance (density and zoning capacity)
• Street connectivity varies by the type of attraction
• Transit service varies by use (i.e. universities often exhibit bell service, while employment campuses have frequent peak hour transit service)
In order to better visualize what station typologies look like in practice, it is important to identify what func-tions can apply to each station type. Different intensities of commercial retail, employment and entertainment districts, housing, and institutional uses can be more applicable in certain station types than others. Figure 14 identifies which functions and their varying levels of intensity are more conducive to each station area type. It should be noted that this matrix takes a general view of districts and their functions. This is not to say that one use will not entirely work within a station area type.
Figure 13 Station Typologies
Continued on next page

28 BRT PRIMER | WHAT ARE CONDITIONS FOR SUCCESSFUL BRT PROJECTS?
STA
TIO
N T
YP
OLO
GIE
S (c
ont
inue
d)
Fig
ure
14 S
tatio
n Ty
po
log
ies
and
the
ir F
unct
iona
l Ap
plic
atio
n
Fun
ctio
nC
om
mer
cial
Ent
erta
inm
ent
Res
iden
tial
Em
plo
ymen
t C
ente
rs
Ho
spita
l (E
mp
. su
bse
t)In
stitu
tiona
l
Inte
nsity
Typo
logy
Larg
e S
cale
Sm
all S
cale
Att
ract
ion
(i.e.
Lar
ger
reta
ilers
, th
eate
rs,
etc.
)
Caf
es /
C
offe
e S
hops
Trad
ition
al
Nei
ghbo
r-ho
od D
evel
-op
men
t
Com
pact
D
evel
op-
men
t (c
ondo
s,
tow
nhou
ses)
Inte
nsity
(Cam
pus,
C
lust
ers,
Min
imal
)In
tens
ityG
ov’t
Offi
ces,
P
ost O
ffice
, S
choo
ls
Cor
eXX
XXXX
XX-
XXJo
b C
lust
erXX
XX
Mix
ed U
se
Em
ploy
men
t
Cen
ter
XXXX
XXX
XXX
Job
Clu
ster
XXX
Mix
ed U
se
Res
iden
tial
Villa
ge
-XX
-XX
XXXX
Loca
l Ret
ail/O
ffice
Clu
ster
-X*
Com
mut
erX
XX
--
-M
inim
alXX
-
Des
tinat
ion*
*X
-XX
X-
-C
ampu
sXX
XX
++
= H
ighl
y ap
plic
able
to ty
polo
gy
+
= M
oder
ate
appl
icab
le to
typo
logy
-
= N
ot a
pplic
able
to ty
polo
gy
* V
illage
sta
tion
type
s ar
e hi
ghly
con
duci
ve to
sm
all s
cale
sch
ool d
evel
opm
ent.
** D
ue to
the
prim
ary
use
natu
re o
f the
Des
tinat
ion
stat
ion
type
s, th
ere
is u
sual
ly o
nly
one
high
ly a
pplic
able
func
tion
type
.
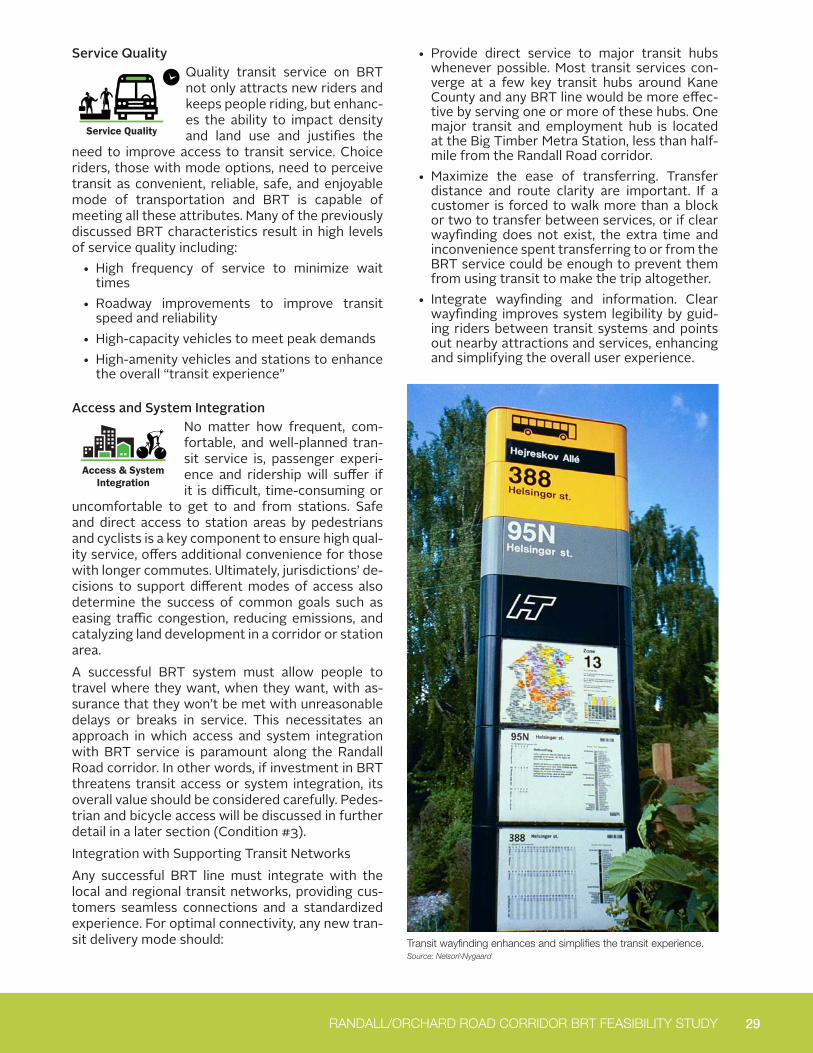
29 RANDALL/ORCHARD ROAD CORRIDOR BRT FEASIBILITY STUDY
Service Quality Quality transit service on BRT not only attracts new riders and keeps people riding, but enhanc-es the ability to impact density and land use and justifies the
need to improve access to transit service. Choice riders, those with mode options, need to perceive transit as convenient, reliable, safe, and enjoyable mode of transportation and BRT is capable of meeting all these attributes. Many of the previously discussed BRT characteristics result in high levels of service quality including:
• High frequency of service to minimize wait times
• Roadway improvements to improve transit speed and reliability
• High-capacity vehicles to meet peak demands• High-amenity vehicles and stations to enhance
the overall “transit experience”
Access and System IntegrationNo matter how frequent, com-fortable, and well-planned tran-sit service is, passenger experi-ence and ridership will suffer if it is difficult, time-consuming or
uncomfortable to get to and from stations. Safe and direct access to station areas by pedestrians and cyclists is a key component to ensure high qual-ity service, offers additional convenience for those with longer commutes. Ultimately, jurisdictions’ de-cisions to support different modes of access also determine the success of common goals such as easing traffic congestion, reducing emissions, and catalyzing land development in a corridor or station area. A successful BRT system must allow people to travel where they want, when they want, with as-surance that they won’t be met with unreasonable delays or breaks in service. This necessitates an approach in which access and system integration with BRT service is paramount along the Randall Road corridor. In other words, if investment in BRT threatens transit access or system integration, its overall value should be considered carefully. Pedes-trian and bicycle access will be discussed in further detail in a later section (Condition #3).Integration with Supporting Transit NetworksAny successful BRT line must integrate with the local and regional transit networks, providing cus-tomers seamless connections and a standardized experience. For optimal connectivity, any new tran-sit delivery mode should:
• Provide direct service to major transit hubs whenever possible. Most transit services con-verge at a few key transit hubs around Kane County and any BRT line would be more effec-tive by serving one or more of these hubs. One major transit and employment hub is located at the Big Timber Metra Station, less than half-mile from the Randall Road corridor.
• Maximize the ease of transferring. Transfer distance and route clarity are important. If a customer is forced to walk more than a block or two to transfer between services, or if clear wayfinding does not exist, the extra time and inconvenience spent transferring to or from the BRT service could be enough to prevent them from using transit to make the trip altogether.
• Integrate wayfinding and information. Clear wayfinding improves system legibility by guid-ing riders between transit systems and points out nearby attractions and services, enhancing and simplifying the overall user experience.
Service Quality
Access & System Integration
Transit wayfinding enhances and simplifies the transit experience. Source: Nelson\Nygaard
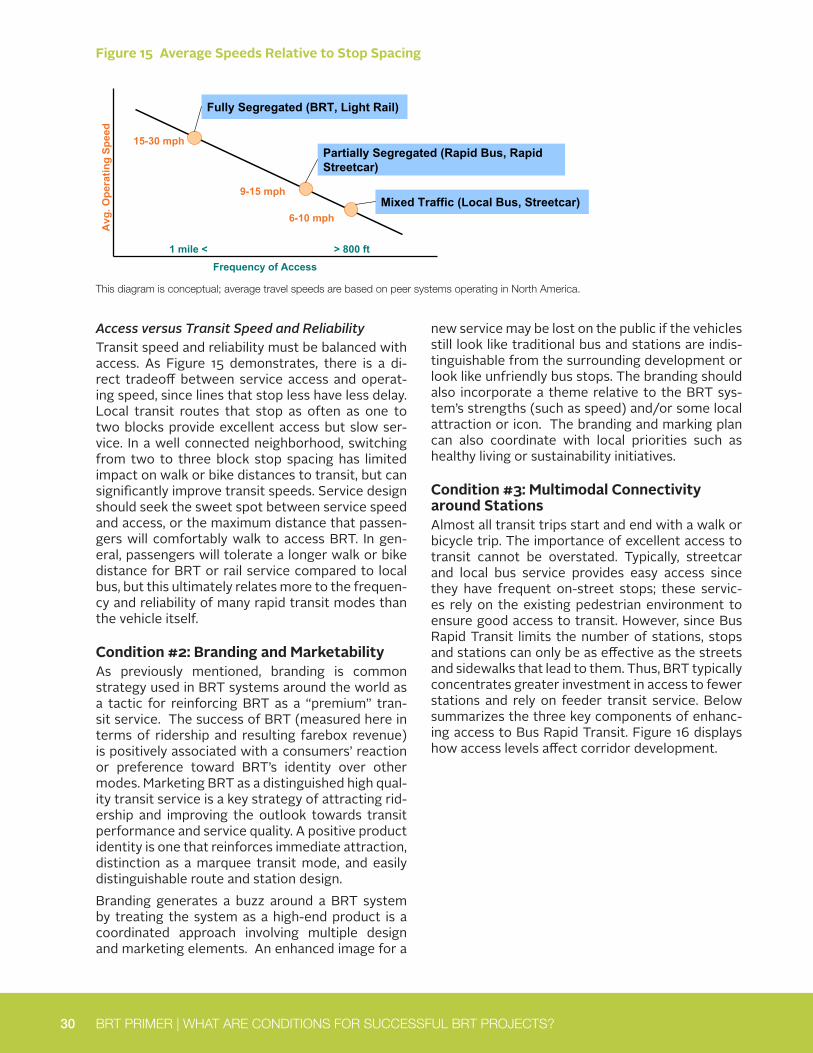
30 BRT PRIMER | WHAT ARE CONDITIONS FOR SUCCESSFUL BRT PROJECTS?
Access versus Transit Speed and ReliabilityTransit speed and reliability must be balanced with access. As Figure 15 demonstrates, there is a di-rect tradeoff between service access and operat-ing speed, since lines that stop less have less delay. Local transit routes that stop as often as one to two blocks provide excellent access but slow ser-vice. In a well connected neighborhood, switching from two to three block stop spacing has limited impact on walk or bike distances to transit, but can significantly improve transit speeds. Service design should seek the sweet spot between service speed and access, or the maximum distance that passen-gers will comfortably walk to access BRT. In gen-eral, passengers will tolerate a longer walk or bike distance for BRT or rail service compared to local bus, but this ultimately relates more to the frequen-cy and reliability of many rapid transit modes than the vehicle itself.
Condition #2: Branding and Marketability As previously mentioned, branding is common strategy used in BRT systems around the world as a tactic for reinforcing BRT as a “premium” tran-sit service. The success of BRT (measured here in terms of ridership and resulting farebox revenue) is positively associated with a consumers’ reaction or preference toward BRT’s identity over other modes. Marketing BRT as a distinguished high qual-ity transit service is a key strategy of attracting rid-ership and improving the outlook towards transit performance and service quality. A positive product identity is one that reinforces immediate attraction, distinction as a marquee transit mode, and easily distinguishable route and station design. Branding generates a buzz around a BRT system by treating the system as a high-end product is a coordinated approach involving multiple design and marketing elements. An enhanced image for a
Es-8 | sEATTLE cITy cOuncIL
tRANSIt mODAL ANALYSIS Executive summary
Station SpacingTransit speed and reliability must be balanced with access. As Figure ES-2 demon-strates, there is a direct tradeoff between transit access and operating speed, since lines that stop less have less delay. Many existing trolleybus routes stop as often as every one to two blocks, providing excellent access but slow service. Many exist-ing lines could be made faster and more reliable by increasing stop spacing, service that passengers may be willing to walk farther to access. The City of Seattle should consider partnering with King County Metro Transit to enhance travel speeds on trolley routes where ridership is high and is concentrated at certain stops.
FigURE ES-2 aVERagE SpEEdS RELaTiVE To STop Spacing
15-30 mph
Frequency of Access
Avg
. Ope
ratin
g Sp
eed
Fully Segregated (BRT, Light Rail)
Partially Segregated (Rapid Bus, Rapid Streetcar)
Mixed Traffic (Local Bus, Streetcar)6-10 mph
9-15 mph
1 mile < > 800 ft
This diagram is conceptual; average travel speeds are based on peer systems operating in North America.”This diagram is conceptual; average travel speeds are based on peer systems operating in North America.
Figure 15 Average Speeds Relative to Stop Spacing
new service may be lost on the public if the vehicles still look like traditional bus and stations are indis-tinguishable from the surrounding development or look like unfriendly bus stops. The branding should also incorporate a theme relative to the BRT sys-tem’s strengths (such as speed) and/or some local attraction or icon. The branding and marking plan can also coordinate with local priorities such as healthy living or sustainability initiatives.
Condition #3: Multimodal Connectivity around StationsAlmost all transit trips start and end with a walk or bicycle trip. The importance of excellent access to transit cannot be overstated. Typically, streetcar and local bus service provides easy access since they have frequent on-street stops; these servic-es rely on the existing pedestrian environment to ensure good access to transit. However, since Bus Rapid Transit limits the number of stations, stops and stations can only be as effective as the streets and sidewalks that lead to them. Thus, BRT typically concentrates greater investment in access to fewer stations and rely on feeder transit service. Below summarizes the three key components of enhanc-ing access to Bus Rapid Transit. Figure 16 displays how access levels affect corridor development.
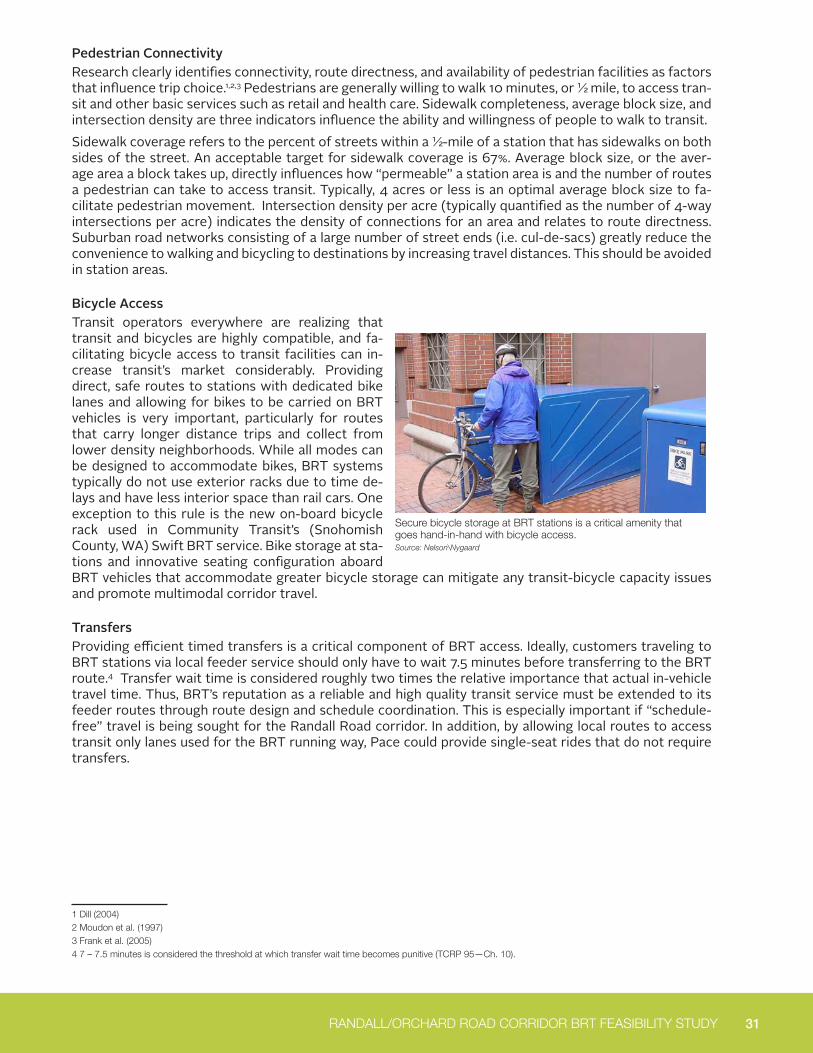
31 RANDALL/ORCHARD ROAD CORRIDOR BRT FEASIBILITY STUDY
Pedestrian Connectivity Research clearly identifies connectivity, route directness, and availability of pedestrian facilities as factors that influence trip choice.1,2,3 Pedestrians are generally willing to walk 10 minutes, or ½ mile, to access tran-sit and other basic services such as retail and health care. Sidewalk completeness, average block size, and intersection density are three indicators influence the ability and willingness of people to walk to transit. Sidewalk coverage refers to the percent of streets within a ½-mile of a station that has sidewalks on both sides of the street. An acceptable target for sidewalk coverage is 67%. Average block size, or the aver-age area a block takes up, directly influences how “permeable” a station area is and the number of routes a pedestrian can take to access transit. Typically, 4 acres or less is an optimal average block size to fa-cilitate pedestrian movement. Intersection density per acre (typically quantified as the number of 4-way intersections per acre) indicates the density of connections for an area and relates to route directness. Suburban road networks consisting of a large number of street ends (i.e. cul-de-sacs) greatly reduce the convenience to walking and bicycling to destinations by increasing travel distances. This should be avoided in station areas.
Bicycle AccessTransit operators everywhere are realizing that transit and bicycles are highly compatible, and fa-cilitating bicycle access to transit facilities can in-crease transit’s market considerably. Providing direct, safe routes to stations with dedicated bike lanes and allowing for bikes to be carried on BRT vehicles is very important, particularly for routes that carry longer distance trips and collect from lower density neighborhoods. While all modes can be designed to accommodate bikes, BRT systems typically do not use exterior racks due to time de-lays and have less interior space than rail cars. One exception to this rule is the new on-board bicycle rack used in Community Transit’s (Snohomish County, WA) Swift BRT service. Bike storage at sta-tions and innovative seating configuration aboard BRT vehicles that accommodate greater bicycle storage can mitigate any transit-bicycle capacity issues and promote multimodal corridor travel.
TransfersProviding efficient timed transfers is a critical component of BRT access. Ideally, customers traveling to BRT stations via local feeder service should only have to wait 7.5 minutes before transferring to the BRT route.4 Transfer wait time is considered roughly two times the relative importance that actual in-vehicle travel time. Thus, BRT’s reputation as a reliable and high quality transit service must be extended to its feeder routes through route design and schedule coordination. This is especially important if “schedule-free” travel is being sought for the Randall Road corridor. In addition, by allowing local routes to access transit only lanes used for the BRT running way, Pace could provide single-seat rides that do not require transfers.
1 Dill (2004) 2 Moudon et al. (1997)3 Frank et al. (2005)4 7 – 7.5 minutes is considered the threshold at which transfer wait time becomes punitive (TCRP 95—Ch. 10).
Secure bicycle storage at BRT stations is a critical amenity that goes hand-in-hand with bicycle access. Source: Nelson\Nygaard
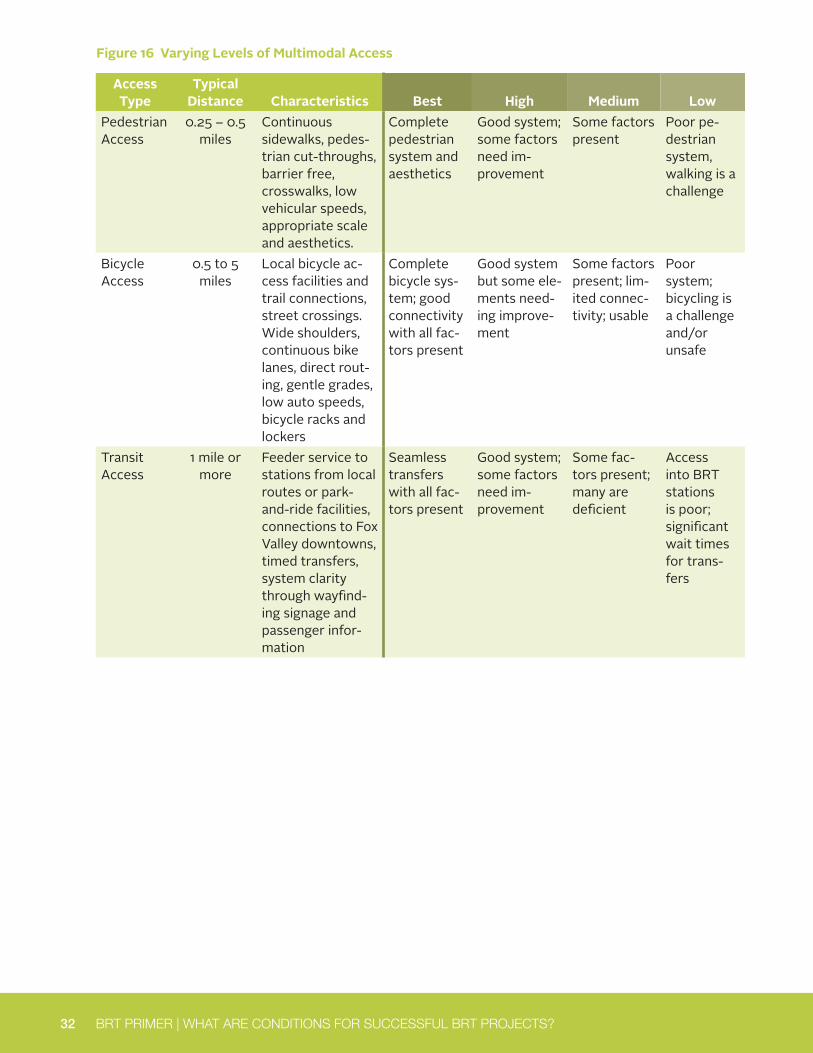
32 BRT PRIMER | WHAT ARE CONDITIONS FOR SUCCESSFUL BRT PROJECTS?
Figure 16 Varying Levels of Multimodal Access
Access Type
Typical Distance Characteristics Best High Medium Low
Pedestrian Access
0.25 – 0.5 miles
Continuous sidewalks, pedes-trian cut-throughs, barrier free, crosswalks, low vehicular speeds, appropriate scale and aesthetics.
Complete pedestrian system and aesthetics
Good system; some factors need im-provement
Some factors present
Poor pe-destrian system, walking is a challenge
Bicycle Access
0.5 to 5 miles
Local bicycle ac-cess facilities and trail connections, street crossings. Wide shoulders, continuous bike lanes, direct rout-ing, gentle grades, low auto speeds, bicycle racks and lockers
Complete bicycle sys-tem; good connectivity with all fac-tors present
Good system but some ele-ments need-ing improve-ment
Some factors present; lim-ited connec-tivity; usable
Poor system; bicycling is a challenge and/or unsafe
Transit Access
1 mile or more
Feeder service to stations from local routes or park-and-ride facilities, connections to Fox Valley downtowns, timed transfers, system clarity through wayfind-ing signage and passenger infor-mation
Seamless transfers with all fac-tors present
Good system; some factors need im-provement
Some fac-tors present; many are deficient
Access into BRT stations is poor; significant wait times for trans-fers
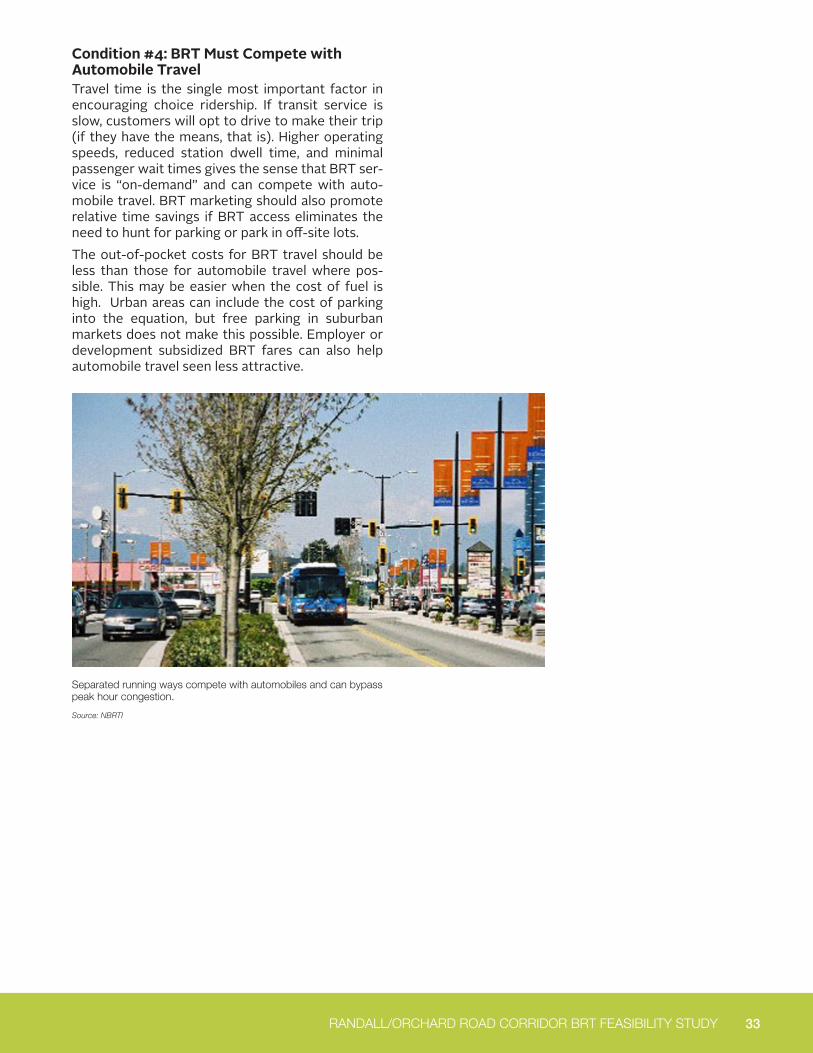
33 RANDALL/ORCHARD ROAD CORRIDOR BRT FEASIBILITY STUDY
Condition #4: BRT Must Compete with Automobile TravelTravel time is the single most important factor in encouraging choice ridership. If transit service is slow, customers will opt to drive to make their trip (if they have the means, that is). Higher operating speeds, reduced station dwell time, and minimal passenger wait times gives the sense that BRT ser-vice is “on-demand” and can compete with auto-mobile travel. BRT marketing should also promote relative time savings if BRT access eliminates the need to hunt for parking or park in off-site lots.The out-of-pocket costs for BRT travel should be less than those for automobile travel where pos-sible. This may be easier when the cost of fuel is high. Urban areas can include the cost of parking into the equation, but free parking in suburban markets does not make this possible. Employer or development subsidized BRT fares can also help automobile travel seen less attractive.
Separated running ways compete with automobiles and can bypass peak hour congestion.
Source: NBRTI

35
KANE COUNTY RANDALL/ORCHARD ROAD CORRIDOR BRT FEASIBILITY STUDY
The working premise of this study is that the quality and flexibility aspects of BRT make it the appropriate mode to meet the County’s goals given the challenges of transforming the Randall/Orchard corri-dor to make it possible to provide a high quality transit service for the use of Coun-ty residents, employees, and visitors.Today, fixed-route transit service in Kane County today is primarily provided by Metra Commuter Rail and Pace buses. Augmenting these services, the Federal Transit Administration defines bus rapid transit as a “rapid mode of transportation that can provide the quality of rail transit and the flexibility of buses.” The table be-low summarizes the advantages of BRT in comparison to both rail and traditional bus service.
WHY FOCUS ON BRT AND HOW DOES IT COMPARE TO OTHER MODES?
This section places BRT in the context of other common transit modes. Figure 17 identifies the three modes that will be discussed in this section: fixed-route lo-cal bus, BRT, streetcar, and light rail. Three other high capacity transit modes are not considered, commuter rail (e.g., Metra) because the corridor lacks existing rail in-frastructure, rapid or heavy rail (e.g., CTA trains) because of the high cost and den-sity requirements and streetcar because of the length of the corridor and unlikelihood for high-density development along most of the corridor (as opposed to at specific nodal developments). Neither of these modes would integrate easily with the land use environment along Randall Road and thereby help achieve the land use goals for the corridor.
Compared to rail, BRT: Compared to traditional bus, BRT:• Is a more cost-effective means of improving
transit service and performance
• Can be built in stages, with shorter planning and construction time frames
• Can be structured to provide feeder service from lower density areas
• Can provide a higher quality transit experience competitive with the automobile
• Can enhance the image of bus transit
• Provides potential for redevelopment
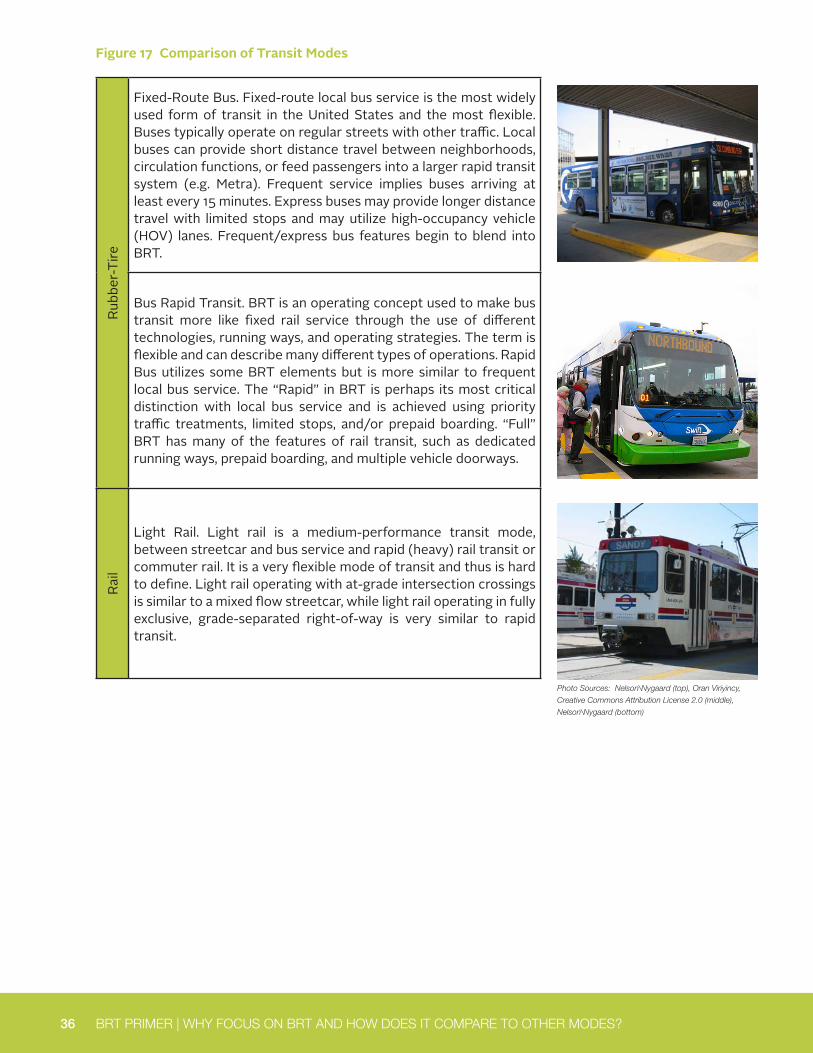
36 BRT PRIMER | WHY FOCUS ON BRT AND HOW DOES IT COMPARE TO OTHER MODES?
Figure 17 Comparison of Transit Modes
Rubb
er-T
ireFixed-Route Bus. Fixed-route local bus service is the most widely used form of transit in the United States and the most flexible. Buses typically operate on regular streets with other traffic. Local buses can provide short distance travel between neighborhoods, circulation functions, or feed passengers into a larger rapid transit system (e.g. Metra). Frequent service implies buses arriving at least every 15 minutes. Express buses may provide longer distance travel with limited stops and may utilize high-occupancy vehicle (HOV) lanes. Frequent/express bus features begin to blend into BRT.
Bus Rapid Transit. BRT is an operating concept used to make bus transit more like fixed rail service through the use of different technologies, running ways, and operating strategies. The term is flexible and can describe many different types of operations. Rapid Bus utilizes some BRT elements but is more similar to frequent local bus service. The “Rapid” in BRT is perhaps its most critical distinction with local bus service and is achieved using priority traffic treatments, limited stops, and/or prepaid boarding. “Full” BRT has many of the features of rail transit, such as dedicated running ways, prepaid boarding, and multiple vehicle doorways.
Rail
Light Rail. Light rail is a medium-performance transit mode, between streetcar and bus service and rapid (heavy) rail transit or commuter rail. It is a very flexible mode of transit and thus is hard to define. Light rail operating with at-grade intersection crossings is similar to a mixed flow streetcar, while light rail operating in fully exclusive, grade-separated right-of-way is very similar to rapid transit.
Photo Sources: Nelson\Nygaard (top), Oran Viriyincy,
Creative Commons Attribution License 2.0 (middle),
Nelson\Nygaard (bottom)
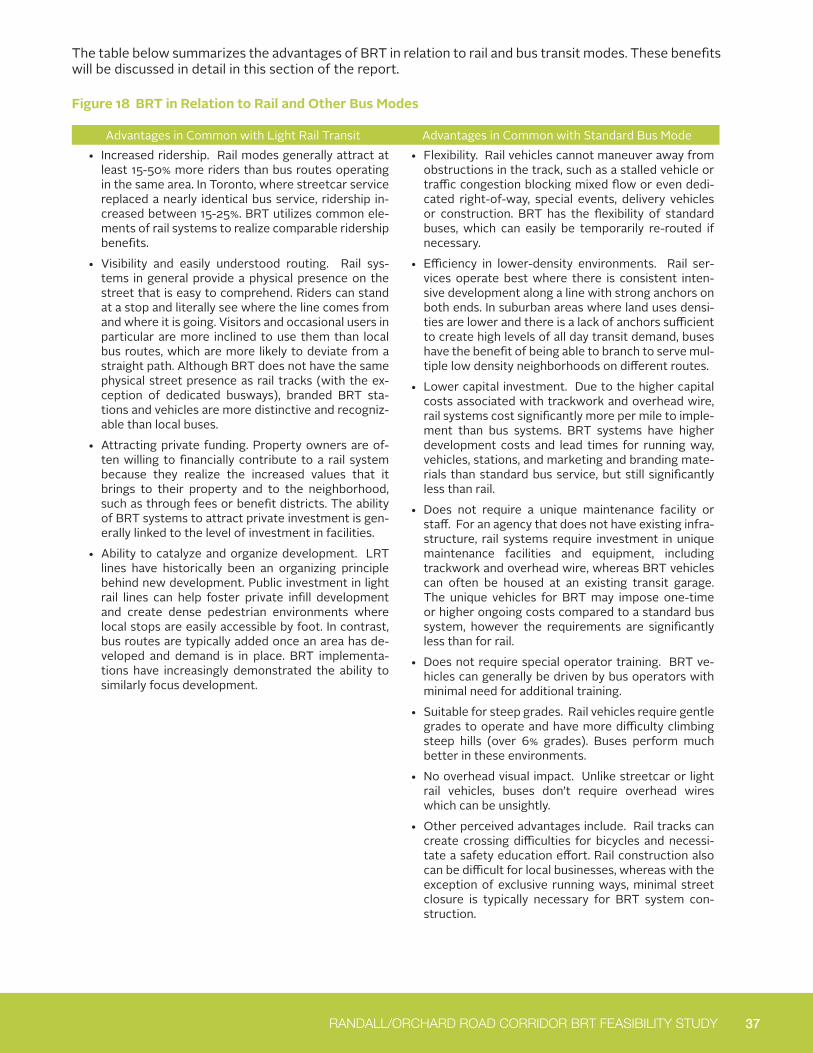
37 RANDALL/ORCHARD ROAD CORRIDOR BRT FEASIBILITY STUDY
The table below summarizes the advantages of BRT in relation to rail and bus transit modes. These benefits will be discussed in detail in this section of the report.
Figure 18 BRT in Relation to Rail and Other Bus Modes
Advantages in Common with Light Rail Transit Advantages in Common with Standard Bus Mode• Increased ridership. Rail modes generally attract at
least 15-50% more riders than bus routes operating in the same area. In Toronto, where streetcar service replaced a nearly identical bus service, ridership in-creased between 15-25%. BRT utilizes common ele-ments of rail systems to realize comparable ridership benefits.
• Visibility and easily understood routing. Rail sys-tems in general provide a physical presence on the street that is easy to comprehend. Riders can stand at a stop and literally see where the line comes from and where it is going. Visitors and occasional users in particular are more inclined to use them than local bus routes, which are more likely to deviate from a straight path. Although BRT does not have the same physical street presence as rail tracks (with the ex-ception of dedicated busways), branded BRT sta-tions and vehicles are more distinctive and recogniz-able than local buses.
• Attracting private funding. Property owners are of-ten willing to financially contribute to a rail system because they realize the increased values that it brings to their property and to the neighborhood, such as through fees or benefit districts. The ability of BRT systems to attract private investment is gen-erally linked to the level of investment in facilities.
• Ability to catalyze and organize development. LRT lines have historically been an organizing principle behind new development. Public investment in light rail lines can help foster private infill development and create dense pedestrian environments where local stops are easily accessible by foot. In contrast, bus routes are typically added once an area has de-veloped and demand is in place. BRT implementa-tions have increasingly demonstrated the ability to similarly focus development.
• Flexibility. Rail vehicles cannot maneuver away from obstructions in the track, such as a stalled vehicle or traffic congestion blocking mixed flow or even dedi-cated right-of-way, special events, delivery vehicles or construction. BRT has the flexibility of standard buses, which can easily be temporarily re-routed if necessary.
• Efficiency in lower-density environments. Rail ser-vices operate best where there is consistent inten-sive development along a line with strong anchors on both ends. In suburban areas where land uses densi-ties are lower and there is a lack of anchors sufficient to create high levels of all day transit demand, buses have the benefit of being able to branch to serve mul-tiple low density neighborhoods on different routes.
• Lower capital investment. Due to the higher capital costs associated with trackwork and overhead wire, rail systems cost significantly more per mile to imple-ment than bus systems. BRT systems have higher development costs and lead times for running way, vehicles, stations, and marketing and branding mate-rials than standard bus service, but still significantly less than rail.
• Does not require a unique maintenance facility or staff. For an agency that does not have existing infra-structure, rail systems require investment in unique maintenance facilities and equipment, including trackwork and overhead wire, whereas BRT vehicles can often be housed at an existing transit garage. The unique vehicles for BRT may impose one-time or higher ongoing costs compared to a standard bus system, however the requirements are significantly less than for rail.
• Does not require special operator training. BRT ve-hicles can generally be driven by bus operators with minimal need for additional training.
• Suitable for steep grades. Rail vehicles require gentle grades to operate and have more difficulty climbing steep hills (over 6% grades). Buses perform much better in these environments.
• No overhead visual impact. Unlike streetcar or light rail vehicles, buses don’t require overhead wires which can be unsightly.
• Other perceived advantages include. Rail tracks can create crossing difficulties for bicycles and necessi-tate a safety education effort. Rail construction also can be difficult for local businesses, whereas with the exception of exclusive running ways, minimal street closure is typically necessary for BRT system con-struction.

38 BRT PRIMER | WHY FOCUS ON BRT AND HOW DOES IT COMPARE TO OTHER MODES?
Summary of Operating CharacteristicsFigure 19 below compares the operating characteristics of BRT and similar travel modes. Several of these characteristics are contrasted in more detail in subsequent sections.
Figure 19 Operating Characteristics by Transit Mode
Local Bus BRT Light RailVehicle Capacity
Low-medium capacity, depending on size of bus. Includes small shuttles, standard 40-foot bus (35-42 seats) and articulated 60-foot bus (60-64 seats).
Medium capacity, with most systems using at least some articulated buses. Up to 160 passengers in dual-articulated buses
Medium-to-High Capacity
Flexibility Most flexible, can easily move around obstructions.
Same flexibility as bus, but may have additional station infrastructure (e.g., fare collection)
Less flexible than bus. Cannot go around temporary obstructions and track/overhead wires are expensive to move.
Right-of-Way Generally operates in shared ROW, but can utilize exclusive ROW.
Can operate in either shared on exclusive ROW, depending on implementation.
Typically operates in exclusive ROW but can also utilize non-exclusive ROW.
Station or Stop Spacing
3 blocks is typical; 600-foot minimum spacing recommended
Typically ½ to 1 mile, in some cases as little as ¼ mile and longer for some express services
Comparable to BRT
Fare Collection
Typically on-board vehicles May be on or off-board vehicles, often with proof-of-payment. Some systems, mostly outside U.S., have enclosed stations to enforce off-board fare purchase.
Generally off-board vehicles, often with proof-of-payment
Operating Speed
Low Medium to high; depends on right-of-way and stop spacing
Medium to high; depends on right-of-way and stop spacing
Optimal Markets
Suited to diverse markets, including local trips and circulation, feeding higher-capacity transit, and longer -distance commuter trips. Suited to areas without well-established travel demand patterns.
Short, local trips for service in CBDs and as well as limited stop corridor service.
Service connecting and serving major nodes in a city and region
* Listed for comparison purposes but is not considered
ROW = Right-of-Way

39 RANDALL/ORCHARD ROAD CORRIDOR BRT FEASIBILITY STUDY
Cost ComparisonsThis section compares the capital and operating costs of BRT to other similar transit modes. Figure 20 provides a summary. Figure 21 shows typical BRT capital costs relative to those for other modes.
Figure 20 Operating and Capital Costs by Mode
Bus BRT Light RailCapital Cost Lowest capital cost.
Typically basic and enhanced stops along routes and transit centers at key nodes. Typically does not have major investments in running way improvements
Medium capital cost, generally between local bus and light rail modes. Can have significant running way improvement, station and vehicle costs based on specific applications.
Highest cost, with most developed stations, expensive vehicles and running way investments..
Operating Cost
Lowest operating cost; Pace averages $100/Hour, typical of large operators.
Comparable to bus on a per-hour basis, but may have a lower per-passenger cost due to higher capacity vehicles.
Slightly higher than other modes due to need for specialized personnel, but a large system can have scale efficiencies and lowest per-passenger cost due to highest capacity vehicles.
Figure 21 Capital Cost Summary
Running WayInfrastructure
Investment BRTLight Rail
VehiclesLocal Bus
Local Bus
BRTLight Rail
Stations andAmenities
Local Bus
BRTLight Rail
Maintenance / Storage Facility BRT
Light Rail
LOW HIGH
Local Bus
$500,000 - $1M per vehicle
$50,000 - $1M
Can typically utilize existing facilities
$10M / Lane Mile
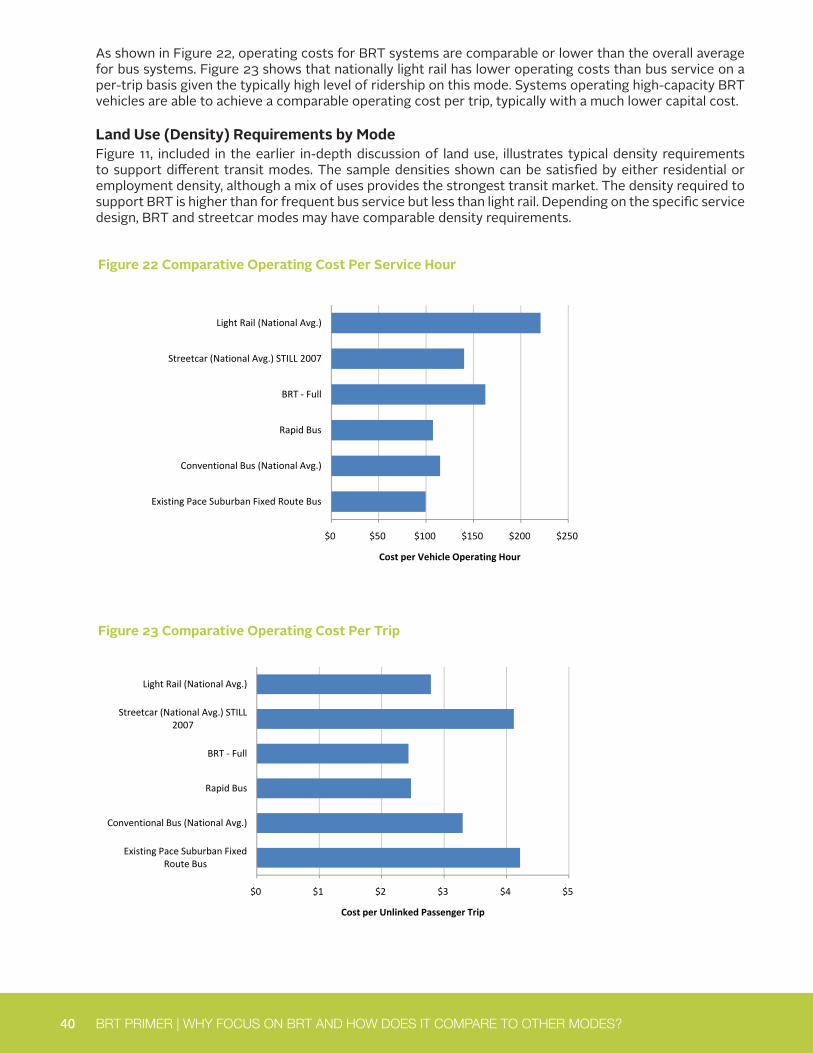
40 BRT PRIMER | WHY FOCUS ON BRT AND HOW DOES IT COMPARE TO OTHER MODES?
As shown in Figure 22, operating costs for BRT systems are comparable or lower than the overall average for bus systems. Figure 23 shows that nationally light rail has lower operating costs than bus service on a per-trip basis given the typically high level of ridership on this mode. Systems operating high-capacity BRT vehicles are able to achieve a comparable operating cost per trip, typically with a much lower capital cost.
Land Use (Density) Requirements by ModeFigure 11, included in the earlier in-depth discussion of land use, illustrates typical density requirements to support different transit modes. The sample densities shown can be satisfied by either residential or employment density, although a mix of uses provides the strongest transit market. The density required to support BRT is higher than for frequent bus service but less than light rail. Depending on the specific service design, BRT and streetcar modes may have comparable density requirements.
Figure 22 Comparative Operating Cost Per Service Hour
Figure 23 Comparative Operating Cost Per Trip
$0 $50 $100 $150 $200 $250
Existing Pace Suburban Fixed Route Bus
Conventional Bus (National Avg.)
Rapid Bus
BRT ‐ Full
Streetcar (National Avg.) STILL 2007
Light Rail (National Avg.)
Cost per Vehicle Operating Hour
$0 $1 $2 $3 $4 $5
Existing Pace Suburban Fixed Route Bus
Conventional Bus (National Avg.)
Rapid Bus
BRT ‐ Full
Streetcar (National Avg.) STILL 2007
Light Rail (National Avg.)
Cost per Unlinked Passenger Trip
41
KANE COUNTY RANDALL/ORCHARD ROAD CORRIDOR BRT FEASIBILITY STUDY
In many of the North American case stud-ies, Bus Rapid Transit was implemented not only to satisfy goals for mobility and greater level of service, but to leverage broader policy goals such as economic de-velopment, increased sustainability, and promotion of livable communities (See Callout).The following series of case studies high-light successful BRT investments and de-tail each of their project goals (i.e. eco-nomic development, stimulate ridership, congestion mitigation, etc.), current and planned land use and development pat-terns, visioning aspirations, funding strat-egies, and how local transit service adapt-ed to the new service. Some key lessons learned are described as well. Figure 24 compares service characteristics and ba-sic performance data to better understand how different agencies structure BRT op-erations.
WHO HAS BUILT BUS RAPID TRANSIT AND WHY?
WHY AGENCIES CHOSE BRT?
Pittsburgh West Busway• Manage and bypass congestion• Increase potential for TOD and economic revitalization
Cleveland HealthLine• Generate ridership through higher levels of service• Stimulate development and modify corridor land uses• Connect employment centers
LTD EmX Green Line (Eugene, OR)• Improve level of service• Increase ridership and carrying capacity• Reduce operating cost
Ottawa Transitway• Focus land development along BRT trunk lines• Provide high quality regional transit service• Reduce operating cost
Community Transit Swift (Snohomish County, WA)• Improve level of service• Reinvent transit’s image• Build upon existing transit priority infrastructure and high
ridershipLos Angeles Metro Orange Line
• Offer connective service between a transit hub and major employment center
• Link Downtown LA and San Fernando Valley with High capacity transit service.
• Provide congestion management and relief along local streets
MBTA Silver Line (Boston)• Revive a key connective service to Downtown Boston• Improve level of service
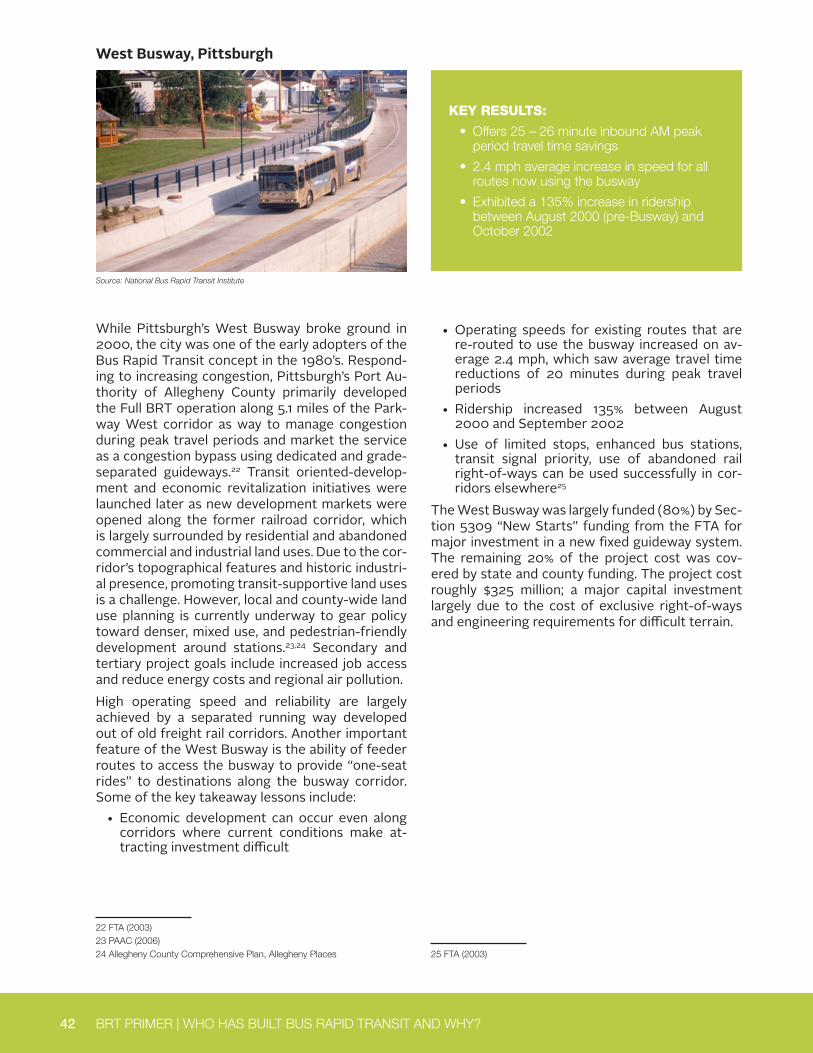
42 BRT PRIMER | WHO HAS BUILT BUS RAPID TRANSIT AND WHY?
West Busway, Pittsburgh
While Pittsburgh’s West Busway broke ground in 2000, the city was one of the early adopters of the Bus Rapid Transit concept in the 1980’s. Respond-ing to increasing congestion, Pittsburgh’s Port Au-thority of Allegheny County primarily developed the Full BRT operation along 5.1 miles of the Park-way West corridor as way to manage congestion during peak travel periods and market the service as a congestion bypass using dedicated and grade-separated guideways.22 Transit oriented-develop-ment and economic revitalization initiatives were launched later as new development markets were opened along the former railroad corridor, which is largely surrounded by residential and abandoned commercial and industrial land uses. Due to the cor-ridor’s topographical features and historic industri-al presence, promoting transit-supportive land uses is a challenge. However, local and county-wide land use planning is currently underway to gear policy toward denser, mixed use, and pedestrian-friendly development around stations.23,24 Secondary and tertiary project goals include increased job access and reduce energy costs and regional air pollution.High operating speed and reliability are largely achieved by a separated running way developed out of old freight rail corridors. Another important feature of the West Busway is the ability of feeder routes to access the busway to provide “one-seat rides” to destinations along the busway corridor. Some of the key takeaway lessons include:
• Economic development can occur even along corridors where current conditions make at-tracting investment difficult
22 FTA (2003) 23 PAAC (2006) 24 Allegheny County Comprehensive Plan, Allegheny Places
KEY RESULTS:
• Offers 25 – 26 minute inbound AM peak period travel time savings
• 2.4 mph average increase in speed for all routes now using the busway
• Exhibited a 135% increase in ridership between August 2000 (pre-Busway) and October 2002
Source: National Bus Rapid Transit Institute
• Operating speeds for existing routes that are re-routed to use the busway increased on av-erage 2.4 mph, which saw average travel time reductions of 20 minutes during peak travel periods
• Ridership increased 135% between August 2000 and September 2002
• Use of limited stops, enhanced bus stations, transit signal priority, use of abandoned rail right-of-ways can be used successfully in cor-ridors elsewhere25
The West Busway was largely funded (80%) by Sec-tion 5309 “New Starts” funding from the FTA for major investment in a new fixed guideway system. The remaining 20% of the project cost was cov-ered by state and county funding. The project cost roughly $325 million; a major capital investment largely due to the cost of exclusive right-of-ways and engineering requirements for difficult terrain.
25 FTA (2003)
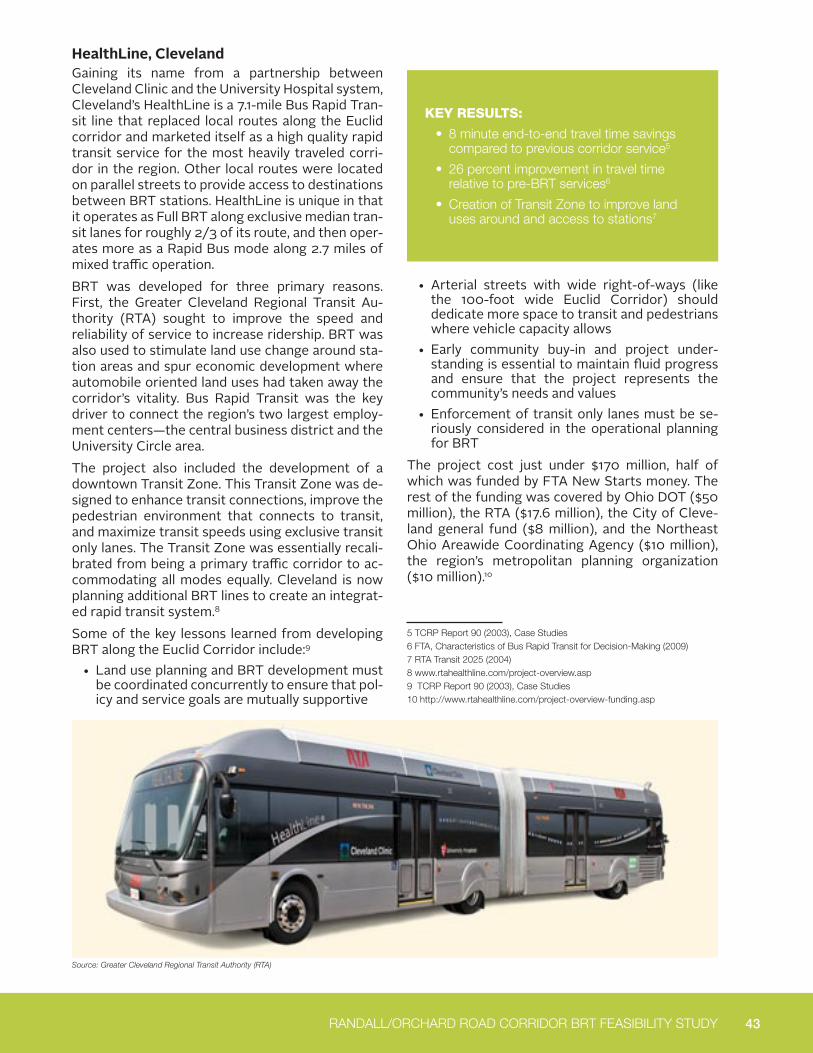
43 RANDALL/ORCHARD ROAD CORRIDOR BRT FEASIBILITY STUDY
KEY RESULTS:
• 8 minute end-to-end travel time savings compared to previous corridor service5
• 26 percent improvement in travel time relative to pre-BRT services6
• Creation of Transit Zone to improve land uses around and access to stations7
HealthLine, ClevelandGaining its name from a partnership between Cleveland Clinic and the University Hospital system, Cleveland’s HealthLine is a 7.1-mile Bus Rapid Tran-sit line that replaced local routes along the Euclid corridor and marketed itself as a high quality rapid transit service for the most heavily traveled corri-dor in the region. Other local routes were located on parallel streets to provide access to destinations between BRT stations. HealthLine is unique in that it operates as Full BRT along exclusive median tran-sit lanes for roughly 2/3 of its route, and then oper-ates more as a Rapid Bus mode along 2.7 miles of mixed traffic operation. BRT was developed for three primary reasons. First, the Greater Cleveland Regional Transit Au-thority (RTA) sought to improve the speed and reliability of service to increase ridership. BRT was also used to stimulate land use change around sta-tion areas and spur economic development where automobile oriented land uses had taken away the corridor’s vitality. Bus Rapid Transit was the key driver to connect the region’s two largest employ-ment centers—the central business district and the University Circle area. The project also included the development of a downtown Transit Zone. This Transit Zone was de-signed to enhance transit connections, improve the pedestrian environment that connects to transit, and maximize transit speeds using exclusive transit only lanes. The Transit Zone was essentially recali-brated from being a primary traffic corridor to ac-commodating all modes equally. Cleveland is now planning additional BRT lines to create an integrat-ed rapid transit system.8 Some of the key lessons learned from developing BRT along the Euclid Corridor include:9
• Land use planning and BRT development must be coordinated concurrently to ensure that pol-icy and service goals are mutually supportive
• Arterial streets with wide right-of-ways (like the 100-foot wide Euclid Corridor) should dedicate more space to transit and pedestrians where vehicle capacity allows
• Early community buy-in and project under-standing is essential to maintain fluid progress and ensure that the project represents the community’s needs and values
• Enforcement of transit only lanes must be se-riously considered in the operational planning for BRT
The project cost just under $170 million, half of which was funded by FTA New Starts money. The rest of the funding was covered by Ohio DOT ($50 million), the RTA ($17.6 million), the City of Cleve-land general fund ($8 million), and the Northeast Ohio Areawide Coordinating Agency ($10 million), the region’s metropolitan planning organization ($10 million).10
Source: Greater Cleveland Regional Transit Authority (RTA)
5 TCRP Report 90 (2003), Case Studies6 FTA, Characteristics of Bus Rapid Transit for Decision-Making (2009)7 RTA Transit 2025 (2004)8 www.rtahealthline.com/project-overview.asp9 TCRP Report 90 (2003), Case Studies10 http://www.rtahealthline.com/project-overview-funding.asp
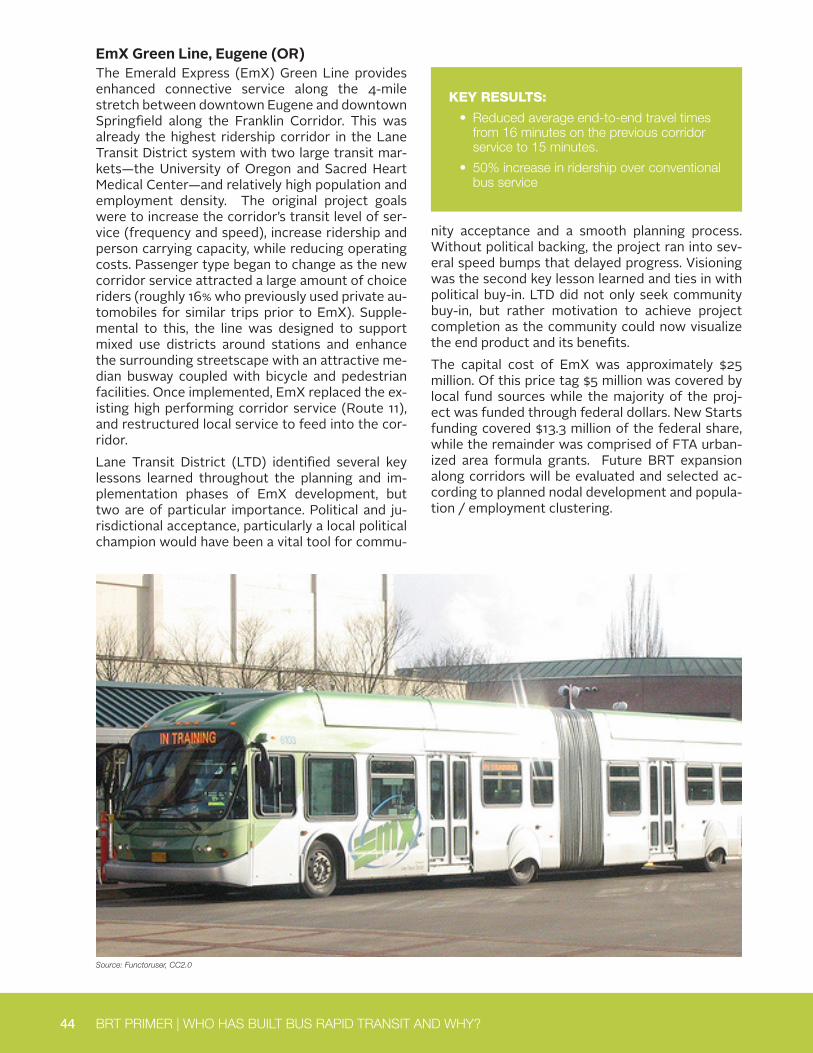
44 BRT PRIMER | WHO HAS BUILT BUS RAPID TRANSIT AND WHY?
EmX Green Line, Eugene (OR)The Emerald Express (EmX) Green Line provides enhanced connective service along the 4-mile stretch between downtown Eugene and downtown Springfield along the Franklin Corridor. This was already the highest ridership corridor in the Lane Transit District system with two large transit mar-kets—the University of Oregon and Sacred Heart Medical Center—and relatively high population and employment density. The original project goals were to increase the corridor’s transit level of ser-vice (frequency and speed), increase ridership and person carrying capacity, while reducing operating costs. Passenger type began to change as the new corridor service attracted a large amount of choice riders (roughly 16% who previously used private au-tomobiles for similar trips prior to EmX). Supple-mental to this, the line was designed to support mixed use districts around stations and enhance the surrounding streetscape with an attractive me-dian busway coupled with bicycle and pedestrian facilities. Once implemented, EmX replaced the ex-isting high performing corridor service (Route 11), and restructured local service to feed into the cor-ridor.Lane Transit District (LTD) identified several key lessons learned throughout the planning and im-plementation phases of EmX development, but two are of particular importance. Political and ju-risdictional acceptance, particularly a local political champion would have been a vital tool for commu-
KEY RESULTS:
• Reduced average end-to-end travel times from 16 minutes on the previous corridor service to 15 minutes.
• 50% increase in ridership over conventional bus service
Source: Functoruser, CC2.0
nity acceptance and a smooth planning process. Without political backing, the project ran into sev-eral speed bumps that delayed progress. Visioning was the second key lesson learned and ties in with political buy-in. LTD did not only seek community buy-in, but rather motivation to achieve project completion as the community could now visualize the end product and its benefits.The capital cost of EmX was approximately $25 million. Of this price tag $5 million was covered by local fund sources while the majority of the proj-ect was funded through federal dollars. New Starts funding covered $13.3 million of the federal share, while the remainder was comprised of FTA urban-ized area formula grants. Future BRT expansion along corridors will be evaluated and selected ac-cording to planned nodal development and popula-tion / employment clustering.
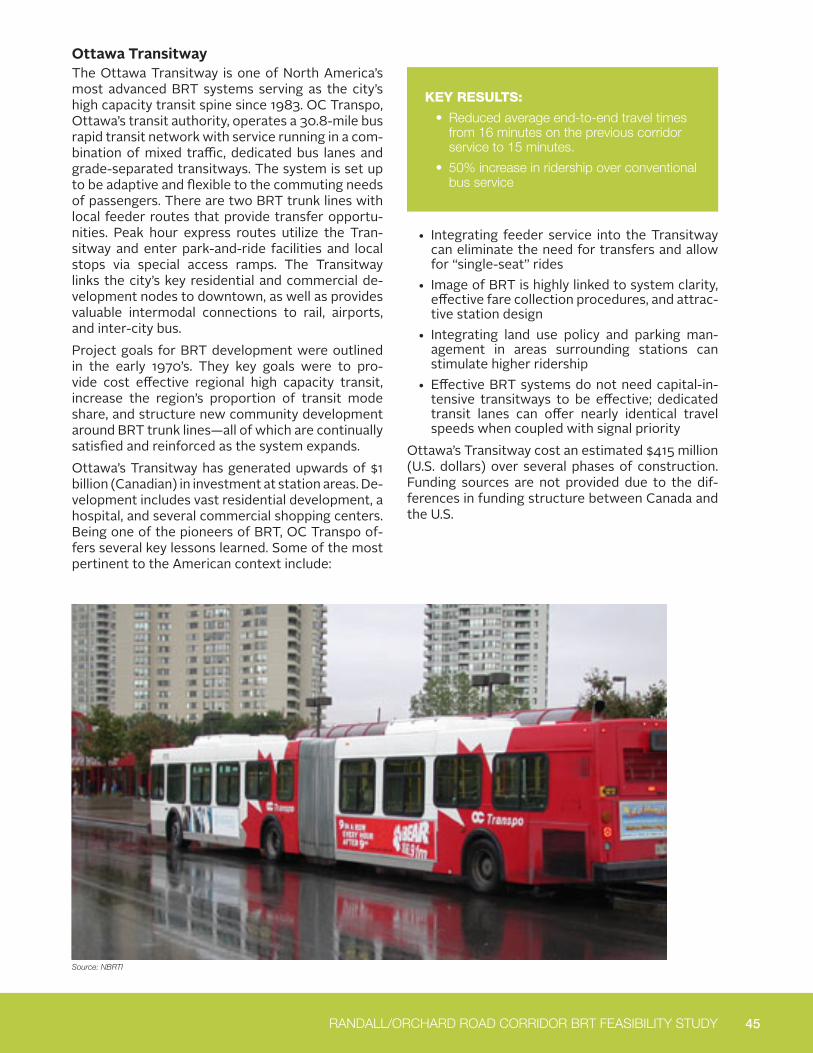
45 RANDALL/ORCHARD ROAD CORRIDOR BRT FEASIBILITY STUDY
KEY RESULTS:
• Reduced average end-to-end travel times from 16 minutes on the previous corridor service to 15 minutes.
• 50% increase in ridership over conventional bus service
Ottawa TransitwayThe Ottawa Transitway is one of North America’s most advanced BRT systems serving as the city’s high capacity transit spine since 1983. OC Transpo, Ottawa’s transit authority, operates a 30.8-mile bus rapid transit network with service running in a com-bination of mixed traffic, dedicated bus lanes and grade-separated transitways. The system is set up to be adaptive and flexible to the commuting needs of passengers. There are two BRT trunk lines with local feeder routes that provide transfer opportu-nities. Peak hour express routes utilize the Tran-sitway and enter park-and-ride facilities and local stops via special access ramps. The Transitway links the city’s key residential and commercial de-velopment nodes to downtown, as well as provides valuable intermodal connections to rail, airports, and inter-city bus. Project goals for BRT development were outlined in the early 1970’s. They key goals were to pro-vide cost effective regional high capacity transit, increase the region’s proportion of transit mode share, and structure new community development around BRT trunk lines—all of which are continually satisfied and reinforced as the system expands. Ottawa’s Transitway has generated upwards of $1 billion (Canadian) in investment at station areas. De-velopment includes vast residential development, a hospital, and several commercial shopping centers. Being one of the pioneers of BRT, OC Transpo of-fers several key lessons learned. Some of the most pertinent to the American context include:
• Integrating feeder service into the Transitway can eliminate the need for transfers and allow for “single-seat” rides
• Image of BRT is highly linked to system clarity, effective fare collection procedures, and attrac-tive station design
• Integrating land use policy and parking man-agement in areas surrounding stations can stimulate higher ridership
• Effective BRT systems do not need capital-in-tensive transitways to be effective; dedicated transit lanes can offer nearly identical travel speeds when coupled with signal priority
Ottawa’s Transitway cost an estimated $415 million (U.S. dollars) over several phases of construction. Funding sources are not provided due to the dif-ferences in funding structure between Canada and the U.S.
Source: NBRTI
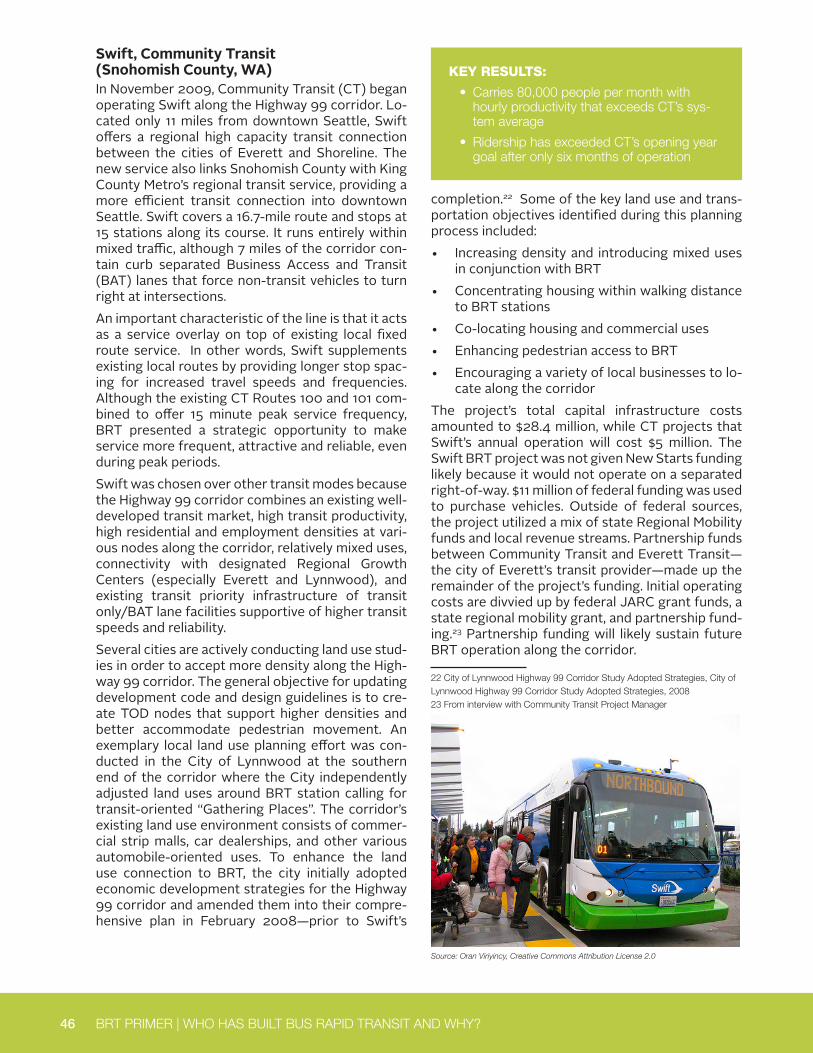
46 BRT PRIMER | WHO HAS BUILT BUS RAPID TRANSIT AND WHY?
Swift, Community Transit (Snohomish County, WA) In November 2009, Community Transit (CT) began operating Swift along the Highway 99 corridor. Lo-cated only 11 miles from downtown Seattle, Swift offers a regional high capacity transit connection between the cities of Everett and Shoreline. The new service also links Snohomish County with King County Metro’s regional transit service, providing a more efficient transit connection into downtown Seattle. Swift covers a 16.7-mile route and stops at 15 stations along its course. It runs entirely within mixed traffic, although 7 miles of the corridor con-tain curb separated Business Access and Transit (BAT) lanes that force non-transit vehicles to turn right at intersections.An important characteristic of the line is that it acts as a service overlay on top of existing local fixed route service. In other words, Swift supplements existing local routes by providing longer stop spac-ing for increased travel speeds and frequencies. Although the existing CT Routes 100 and 101 com-bined to offer 15 minute peak service frequency, BRT presented a strategic opportunity to make service more frequent, attractive and reliable, even during peak periods. Swift was chosen over other transit modes because the Highway 99 corridor combines an existing well-developed transit market, high transit productivity, high residential and employment densities at vari-ous nodes along the corridor, relatively mixed uses, connectivity with designated Regional Growth Centers (especially Everett and Lynnwood), and existing transit priority infrastructure of transit only/BAT lane facilities supportive of higher transit speeds and reliability. Several cities are actively conducting land use stud-ies in order to accept more density along the High-way 99 corridor. The general objective for updating development code and design guidelines is to cre-ate TOD nodes that support higher densities and better accommodate pedestrian movement. An exemplary local land use planning effort was con-ducted in the City of Lynnwood at the southern end of the corridor where the City independently adjusted land uses around BRT station calling for transit-oriented “Gathering Places”. The corridor’s existing land use environment consists of commer-cial strip malls, car dealerships, and other various automobile-oriented uses. To enhance the land use connection to BRT, the city initially adopted economic development strategies for the Highway 99 corridor and amended them into their compre-hensive plan in February 2008—prior to Swift’s
KEY RESULTS:
• Carries 80,000 people per month with hourly productivity that exceeds CT’s sys-tem average
• Ridership has exceeded CT’s opening year goal after only six months of operation
completion.22 Some of the key land use and trans-portation objectives identified during this planning process included: • Increasing density and introducing mixed uses
in conjunction with BRT• Concentrating housing within walking distance
to BRT stations• Co-locating housing and commercial uses• Enhancing pedestrian access to BRT• Encouraging a variety of local businesses to lo-
cate along the corridorThe project’s total capital infrastructure costs amounted to $28.4 million, while CT projects that Swift’s annual operation will cost $5 million. The Swift BRT project was not given New Starts funding likely because it would not operate on a separated right-of-way. $11 million of federal funding was used to purchase vehicles. Outside of federal sources, the project utilized a mix of state Regional Mobility funds and local revenue streams. Partnership funds between Community Transit and Everett Transit—the city of Everett’s transit provider—made up the remainder of the project’s funding. Initial operating costs are divvied up by federal JARC grant funds, a state regional mobility grant, and partnership fund-ing.23 Partnership funding will likely sustain future BRT operation along the corridor.
22 City of Lynnwood Highway 99 Corridor Study Adopted Strategies, City of Lynnwood Highway 99 Corridor Study Adopted Strategies, 200823 From interview with Community Transit Project Manager
Source: Oran Viriyincy, Creative Commons Attribution License 2.0
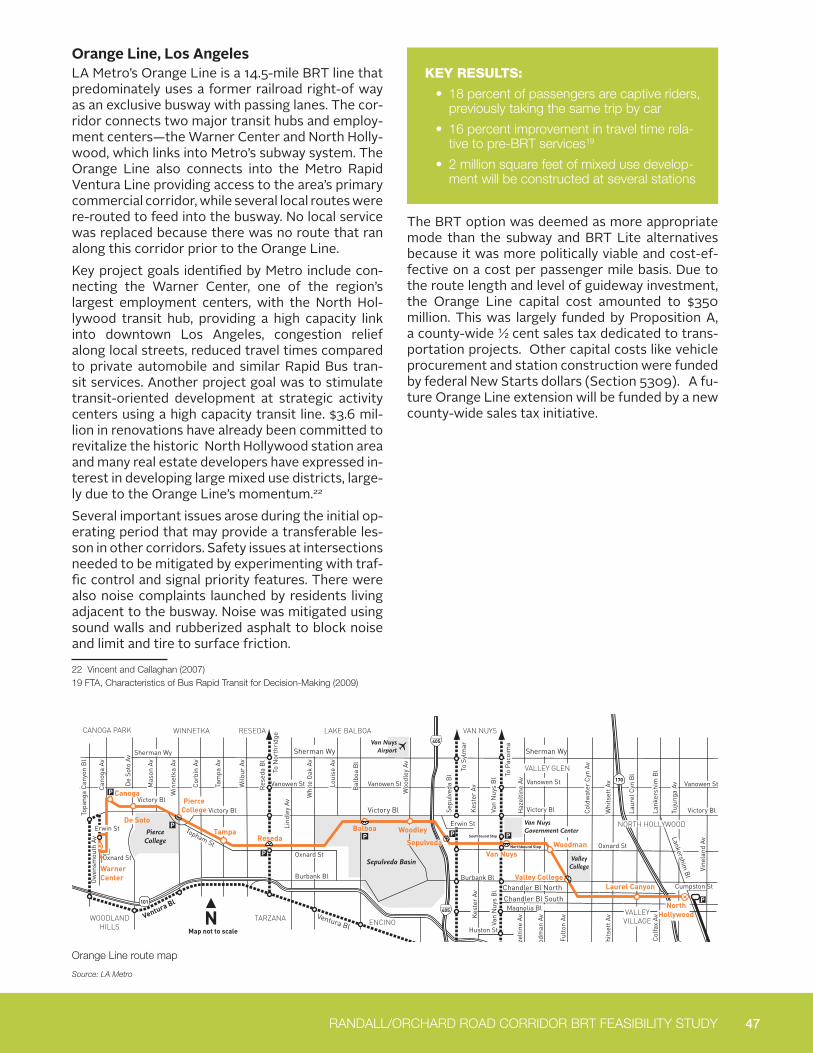
47 RANDALL/ORCHARD ROAD CORRIDOR BRT FEASIBILITY STUDY
KEY RESULTS:
• 18 percent of passengers are captive riders, previously taking the same trip by car
• 16 percent improvement in travel time rela-tive to pre-BRT services19
• 2 million square feet of mixed use develop-ment will be constructed at several stations
Orange Line, Los AngelesLA Metro’s Orange Line is a 14.5-mile BRT line that predominately uses a former railroad right-of way as an exclusive busway with passing lanes. The cor-ridor connects two major transit hubs and employ-ment centers—the Warner Center and North Holly-wood, which links into Metro’s subway system. The Orange Line also connects into the Metro Rapid Ventura Line providing access to the area’s primary commercial corridor, while several local routes were re-routed to feed into the busway. No local service was replaced because there was no route that ran along this corridor prior to the Orange Line.Key project goals identified by Metro include con-necting the Warner Center, one of the region’s largest employment centers, with the North Hol-lywood transit hub, providing a high capacity link into downtown Los Angeles, congestion relief along local streets, reduced travel times compared to private automobile and similar Rapid Bus tran-sit services. Another project goal was to stimulate transit-oriented development at strategic activity centers using a high capacity transit line. $3.6 mil-lion in renovations have already been committed to revitalize the historic North Hollywood station area and many real estate developers have expressed in-terest in developing large mixed use districts, large-ly due to the Orange Line’s momentum.22 Several important issues arose during the initial op-erating period that may provide a transferable les-son in other corridors. Safety issues at intersections needed to be mitigated by experimenting with traf-fic control and signal priority features. There were also noise complaints launched by residents living adjacent to the busway. Noise was mitigated using sound walls and rubberized asphalt to block noise and limit and tire to surface friction.
22 Vincent and Callaghan (2007)19 FTA, Characteristics of Bus Rapid Transit for Decision-Making (2009)
The BRT option was deemed as more appropriate mode than the subway and BRT Lite alternatives because it was more politically viable and cost-ef-fective on a cost per passenger mile basis. Due to the route length and level of guideway investment, the Orange Line capital cost amounted to $350 million. This was largely funded by Proposition A, a county-wide ½ cent sales tax dedicated to trans-portation projects. Other capital costs like vehicle procurement and station construction were funded by federal New Starts dollars (Section 5309). A fu-ture Orange Line extension will be funded by a new county-wide sales tax initiative.
178524
Metro Orange Line (Route Map)
Legend
BB
CE
SCVISTA
LD
Metro Orange LineMetro Red Line (To Union Station)Metro Rapid LinesMetro Rapid StopsMetro Orange Line StationWestbound only TimepointEastbound only TimepointTerminal TimepointParkingAntelope Valley Transit AuthorityBurbank BusLADOT Commuter ExpressLADOT DashSanta Clarita TransitVentura Intercity Service Transit Authority
AVTA
Map not to scale
Sepulveda Basin
PierceCollege
ValleyCollege
Van NuysAirport
Van NuysGovernment Center
170
170
405
405
101
101
Bus and Rail Lines Serving Metro StationsNorth Hollywood Metro Red Line, 152, 154, 156, 183, 224, 353, 363, 656 Owl, 902; BB Media District, Airport/Empire, CE549; SC757Laurel Canyon 156, 230, 656Valley College 156, 167, CE549, 656, 902, LDVANWoodman 154, 158Van Nuys 154, 156, 233, 237, 656, 761, 902, LDVANSepulveda 234, 734Woodley 164, 237Balboa 164, 236, 237, CE573, CE574
Reseda 240, 741Tampa 242Pierce College 164, 243De Soto 164, 244, SC796Canoga 164, 150, AVTA 787Warner Center 150, 161, 164, 245, 645, 750, CE422, LD Warner Center, VISTA Highway 101/Conejo Connection
To Westwood To Universal City
De Soto
Canoga
TampaReseda
Woodman
Laurel Canyon
Sepulveda
NorthHollywood
Valley College
PierceCollege
Warner Center
WoodleyBalboa
Van Nuys
Victory Bl
Victory Bl Victory BlVictory Bl
Erwin St
Victory Bl
Vanowen StVanowen StVanowen StVanowen St
Oxnard St
Ventura BlVentura Bl
Burbank Bl
Sherman Wy
Lind
ley
Av
Kes
ter
Av
Van
Nuy
s B
l
Haz
eltin
e Av
Lankershim B
l
Woo
dman
Av
Fult
on A
v
Whi
tset
t Av
Col
fax
Av
Sherman Wy Sherman Wy
To N
orth
ridg
e
To S
ylm
ar
To P
acoi
ma
Oxnard St
Burbank Bl
Chandler Bl North
Chandler Bl SouthMagnolia Bl
Huston St
Topham St
Ow
ensm
outh
Av
Mas
on A
v
Win
netk
a Av
Cor
bin
Av
Tam
pa A
v
Wilb
ur A
v
Res
eda
Bl
Whi
te O
ak A
v
Loui
se A
v
Bal
boa
Bl
Sepu
lved
a B
l
Kes
ter
Av
Van
Nuy
s B
l
Haz
eltin
e Av
Col
dwat
er C
yn A
v
Laur
el C
yn B
l
Lank
ersh
im B
l
Tuju
nga
Av
Whi
tset
t Av
Woo
dley
Av
De
Soto
Av
Can
oga
Av
Topa
nga
Can
yon
Bl
Oxnard St
Vine
land
Av
Erwin StSouthbound Stop
Northbound Stop
CANOGA PARK WINNETKA RESEDA LAKE BALBOA VAN NUYS
VALLEYVILLAGE
SHERMAN
TARZANAWOODLANDHILLS
VALLEY GLEN
ENCINO
OAKS
NORTH HOLLYWOOD
Cumpston St
Sunday and Holiday ScheduleEffective Jun 27 2010
Metro Orange LineEastbound (Approximate Times)
WARNER CENTER WINNETKA VAN NUYS NORTH HOLLYWOOD
Warner Center Station Pierce College Station Balboa Station Van Nuys Station North Hollywood Station
3:43A 3:50A 4:00A 4:07A 4:20A4:00 4:07 4:17 4:24 4:374:19 4:26 4:36 4:43 4:574:34 4:41 4:51 4:58 5:124:49 4:56 5:06 5:13 5:275:04 5:11 5:21 5:28 5:425:17 5:24 5:34 5:41 5:555:30 5:37 5:47 5:54 6:085:44 5:51 6:01 6:08 6:225:56 6:03 6:13 6:20 6:346:09 6:16 6:26 6:33 6:476:22 6:29 6:39 6:46 7:006:34 6:41 6:51 6:58 7:136:46 6:53 7:03 7:11 7:266:58 7:05 7:15 7:23 7:387:09 7:16 7:26 7:34 7:497:21 7:28 7:38 7:46 8:017:32 7:39 7:49 7:57 8:127:44 7:51 8:01 8:09 8:247:55 8:02 8:12 8:20 8:358:06 8:13 8:23 8:31 8:468:16 8:23 8:33 8:41 8:568:26 8:33 8:44 8:52 9:078:36 8:43 8:54 9:02 9:178:46 8:53 9:04 9:13 9:288:56 9:03 9:15 9:24 9:399:06 9:13 9:25 9:34 9:499:16 9:23 9:35 9:44 9:599:26 9:33 9:45 9:54 10:099:36 9:43 9:55 10:04 10:199:46 9:53 10:05 10:14 10:299:56 10:03 10:15 10:24 10:3910:06 10:13 10:25 10:34 10:4910:16 10:23 10:35 10:44 10:5910:26 10:33 10:45 10:54 11:0910:36 10:43 10:55 11:04 11:1910:46 10:53 11:05 11:14 11:2910:56 11:03 11:15 11:24 11:3911:06 11:13 11:25 11:34 11:4911:16 11:23 11:35 11:44 11:5911:26 11:33 11:45 11:54 12:09P11:36 11:43 11:55 12:04P 12:1911:46 11:53 12:05P 12:14 12:2911:56 12:03P 12:15 12:24 12:3912:06P 12:13 12:25 12:34 12:4912:16 12:23 12:35 12:44 12:5912:26 12:33 12:45 12:54 1:0912:36 12:43 12:55 1:04 1:1912:46 12:53 1:05 1:14 1:2912:56 1:03 1:15 1:24 1:391:06 1:13 1:25 1:34 1:491:16 1:23 1:35 1:44 1:591:26 1:33 1:45 1:54 2:091:36 1:43 1:55 2:04 2:191:46 1:53 2:05 2:14 2:291:56 2:03 2:15 2:24 2:392:06 2:13 2:25 2:34 2:492:16 2:23 2:35 2:44 2:592:26 2:33 2:45 2:54 3:092:36 2:43 2:55 3:04 3:192:46 2:53 3:05 3:14 3:292:56 3:03 3:15 3:24 3:393:05 3:13 3:25 3:34 3:493:15 3:23 3:35 3:44 3:593:25 3:33 3:45 3:54 4:093:35 3:43 3:55 4:04 4:193:45 3:53 4:05 4:14 4:293:55 4:03 4:15 4:24 4:394:05 4:13 4:25 4:34 4:494:15 4:23 4:35 4:44 4:594:25 4:33 4:45 4:54 5:094:35 4:43 4:55 5:04 5:194:45 4:53 5:05 5:14 5:294:55 5:03 5:15 5:24 5:395:05 5:13 5:25 5:34 5:495:15 5:23 5:35 5:44 5:595:25 5:33 5:45 5:54 6:095:37 5:45 5:57 6:06 6:215:49 5:57 6:09 6:18 6:336:01 6:09 6:21 6:30 6:456:13 6:21 6:33 6:42 6:576:25 6:33 6:45 6:54 7:096:37 6:45 6:57 7:06 7:216:51 6:58 7:10 7:19 7:347:05 7:12 7:24 7:33 7:487:19 7:26 7:38 7:47 8:027:33 7:40 7:52 8:01 8:167:46 7:53 8:05 8:14 8:298:01 8:08 8:20 8:28 8:438:23 8:30 8:42 8:50 9:058:43 8:50 9:02 9:10 9:259:03 9:10 9:21 9:29 9:449:24 9:31 9:42 9:50 10:059:44 9:51 10:02 10:09 10:2410:04 10:11 10:21 10:28 10:4310:24 10:31 10:41 10:48 11:0310:44 10:51 11:01 11:08 11:2311:05 11:12 11:22 11:29 11:4411:25 11:32 11:42 11:49 12:04A11:46 11:53 12:03A 12:10A 12:2412:06A 12:12A 12:22 12:29 12:43
Sunday and Holiday Schedule Metro Orange LineWestbound (Approximate Times)
NORTH HOLLYWOOD VALLEY GLEN VAN NUYS TARZANA WARNER CENTER
North Hollywood Station Valley College Station Sepulveda Station Reseda Station Warner Center Station
4:38A 4:45A 4:53A 5:02A 5:16A4:52 4:59 5:08 5:18 5:325:07 5:14 5:23 5:33 5:475:24 5:31 5:40 5:50 6:045:41 5:48 5:57 6:07 6:215:55 6:02 6:11 6:21 6:356:08 6:15 6:24 6:34 6:486:23 6:30 6:39 6:49 7:036:37 6:44 6:53 7:03 7:176:50 6:57 7:06 7:16 7:307:02 7:09 7:18 7:28 7:427:15 7:22 7:31 7:41 7:557:27 7:34 7:43 7:53 8:077:40 7:47 7:56 8:06 8:207:52 7:59 8:08 8:18 8:328:04 8:11 8:20 8:30 8:448:16 8:23 8:32 8:42 8:568:28 8:35 8:44 8:54 9:088:39 8:46 8:55 9:06 9:218:50 8:57 9:07 9:18 9:339:01 9:09 9:19 9:30 9:459:12 9:20 9:30 9:41 9:569:22 9:30 9:40 9:51 10:069:32 9:40 9:50 10:01 10:169:42 9:50 10:00 10:11 10:269:52 10:00 10:10 10:21 10:3610:02 10:10 10:20 10:31 10:4610:12 10:20 10:30 10:41 10:5610:22 10:30 10:40 10:51 11:0610:32 10:40 10:50 11:01 11:1610:42 10:50 11:00 11:11 11:2610:52 11:00 11:10 11:21 11:3611:02 11:10 11:20 11:31 11:4611:12 11:20 11:30 11:41 11:5611:22 11:30 11:40 11:51 12:06P11:32 11:40 11:50 12:01P 12:1611:42 11:50 11:59 12:11 12:2611:52 11:59 12:10P 12:21 12:3612:02P 12:10P 12:20 12:31 12:4612:12 12:20 12:30 12:41 12:5612:22 12:30 12:40 12:51 1:0612:32 12:40 12:50 1:01 1:1612:42 12:50 1:00 1:11 1:2612:52 1:00 1:10 1:21 1:361:02 1:10 1:20 1:31 1:461:12 1:20 1:30 1:41 1:561:22 1:30 1:40 1:51 2:061:32 1:40 1:50 2:01 2:161:42 1:50 2:00 2:11 2:261:52 2:00 2:10 2:21 2:362:02 2:10 2:20 2:31 2:462:12 2:20 2:30 2:41 2:562:22 2:30 2:40 2:51 3:062:32 2:40 2:50 3:01 3:162:42 2:50 3:00 3:11 3:262:52 3:00 3:10 3:21 3:363:02 3:10 3:20 3:31 3:463:12 3:20 3:30 3:41 3:563:22 3:30 3:40 3:51 4:063:32 3:40 3:50 4:01 4:163:42 3:50 4:00 4:11 4:263:51 3:59 4:09 4:20 4:354:02 4:10 4:20 4:31 4:464:12 4:20 4:30 4:41 4:564:22 4:30 4:40 4:51 5:064:32 4:40 4:50 5:01 5:164:43 4:51 5:01 5:12 5:274:53 5:01 5:11 5:22 5:375:03 5:11 5:21 5:32 5:475:13 5:21 5:31 5:42 5:575:23 5:31 5:41 5:52 6:075:33 5:41 5:51 6:02 6:175:43 5:51 6:01 6:12 6:275:53 6:01 6:11 6:22 6:376:03 6:11 6:21 6:32 6:476:13 6:21 6:31 6:42 6:576:23 6:31 6:41 6:52 7:076:33 6:41 6:51 7:02 7:176:44 6:52 7:02 7:13 7:286:56 7:04 7:14 7:25 7:397:08 7:16 7:26 7:37 7:517:20 7:28 7:38 7:49 8:037:32 7:40 7:50 8:01 8:157:45 7:53 8:03 8:14 8:287:59 8:07 8:17 8:28 8:428:13 8:21 8:31 8:42 8:568:28 8:36 8:46 8:57 9:118:42 8:50 9:00 9:09 9:238:57 9:05 9:14 9:23 9:379:14 9:22 9:31 9:40 9:549:34 9:42 9:51 10:00 10:149:54 10:02 10:11 10:20 10:3410:14 10:22 10:31 10:40 10:5310:34 10:42 10:51 11:00 11:1310:54 11:02 11:11 11:20 11:3311:14 11:22 11:31 11:40 11:5311:34 11:41 11:50 11:59 12:12A11:54 12:01A 12:10A 12:19A 12:3212:14A 12:21 12:29 12:38 12:5112:34 12:41 12:49 12:58 1:1112:54 1:01 1:09 1:18 1:31
Orange Line route map
Source: LA Metro
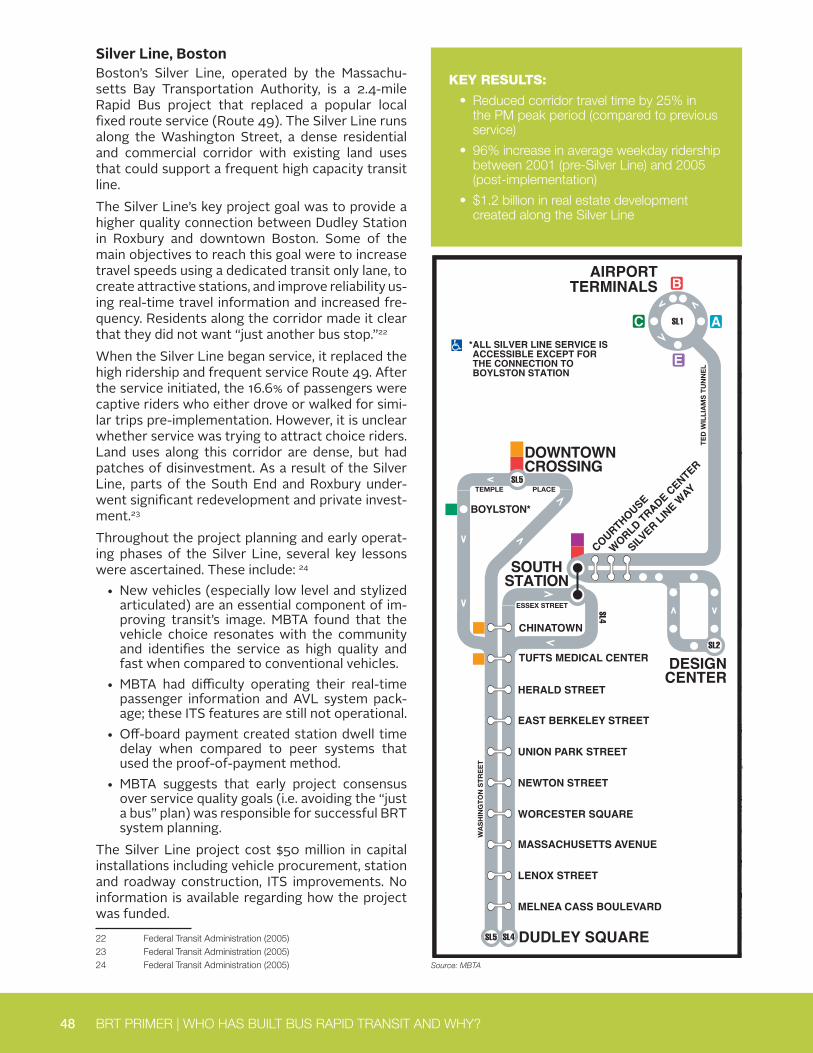
48 BRT PRIMER | WHO HAS BUILT BUS RAPID TRANSIT AND WHY? 49 RANDALL/ORCHARD ROAD CORRIDOR BRT FEASIBILITY STUDY
Silver Line, BostonBoston’s Silver Line, operated by the Massachu-setts Bay Transportation Authority, is a 2.4-mile Rapid Bus project that replaced a popular local fixed route service (Route 49). The Silver Line runs along the Washington Street, a dense residential and commercial corridor with existing land uses that could support a frequent high capacity transit line.The Silver Line’s key project goal was to provide a higher quality connection between Dudley Station in Roxbury and downtown Boston. Some of the main objectives to reach this goal were to increase travel speeds using a dedicated transit only lane, to create attractive stations, and improve reliability us-ing real-time travel information and increased fre-quency. Residents along the corridor made it clear that they did not want “just another bus stop.”22 When the Silver Line began service, it replaced the high ridership and frequent service Route 49. After the service initiated, the 16.6% of passengers were captive riders who either drove or walked for simi-lar trips pre-implementation. However, it is unclear whether service was trying to attract choice riders. Land uses along this corridor are dense, but had patches of disinvestment. As a result of the Silver Line, parts of the South End and Roxbury under-went significant redevelopment and private invest-ment.23 Throughout the project planning and early operat-ing phases of the Silver Line, several key lessons were ascertained. These include: 24
• New vehicles (especially low level and stylized articulated) are an essential component of im-proving transit’s image. MBTA found that the vehicle choice resonates with the community and identifies the service as high quality and fast when compared to conventional vehicles.
• MBTA had difficulty operating their real-time passenger information and AVL system pack-age; these ITS features are still not operational.
• Off-board payment created station dwell time delay when compared to peer systems that used the proof-of-payment method.
• MBTA suggests that early project consensus over service quality goals (i.e. avoiding the “just a bus” plan) was responsible for successful BRT system planning.
The Silver Line project cost $50 million in capital installations including vehicle procurement, station and roadway construction, ITS improvements. No information is available regarding how the project was funded.
22 Federal Transit Administration (2005)23 Federal Transit Administration (2005)24 Federal Transit Administration (2005)
KEY RESULTS:
• Reduced corridor travel time by 25% in the PM peak period (compared to previous service)
• 96% increase in average weekday ridership between 2001 (pre-Silver Line) and 2005 (post-implementation)
• $1.2 billion in real estate development created along the Silver Line
������
�����������
�������������������������������������������� ���
������������������������� ����������������������������������������������������������������������� ��������������� �������������������
���������������������������� ����������������������������
�������������������������������������������������������������
�������������������� ��������� ����������
����� ���� ���������������������������������������������� ��������������� �������������� ����������������� ���� ����� �������������� �
���������������������������������
���� �����
�� �����������������������������
��� ��������������������������������� �����������
��� ������������������������������������������������
������������ ��
� �����������������������������������������
����
���
������������ ������
������
������������������
�������
����������
������������
����������������
���������������������
��
��
��
��
��
��
��
��
��
��
�
�
�
����������
������������
���������
������������
�����������
��
��
��
��
��
��
��
������
���
��
����
��
���
� ��
���
���
����
�
��
�
��
��
� ��
��
��
��
���
��
������
���
���
��
������
�
������
������
����
����
��������
���
����
��
���
�
����
�
����
�� ���
�� �
��
����
��
���
� ����
�� ��
��� ��
����
��
����������
������������
��
���
��
��
���
������
��
�
���
��
���
��������
�
�
�
��
���
����
��
���
����
��
����
���
�
�
�
��
���
�
��
��
�
��
��
��
��
�
�
��
��
�
�
�������
���
����
�
�� ��
��
�
��
��
��
��
��
���
��
��
���
��
��
��
��
��
��
��
��
����
��
��
�
�
���
�
��
��
�
��
���
���
���
���
���
���
���
���
���
���
��
�
��
���
���
���
���
��
��
���
���
���
���
���
���
���
�
���
���
���
�
��
�
��
�
���
��
�
�
��
��
��
��
��
��
��
��
���
���
��
���
���
���
�
�
����
���
����
���
�����
��
��
���
�
�
�
�
�
�
�
�����
���
�����������
������������������
�������������
�������������������
� �������
���� �� ����
��������� ����� ��
� ������
� �� ���������
��������������������������
������ ����� �� �
���������������
���������������
�������� � �� �
������ ����� �� ���� �
���� ������ �� �
����� �
�������������� ��������
��� ����
�������������
����
���������
���� �
��� �����
���������������
��� ����
���� �
������
��� ��� ��� �� �
������������
�������
��������
�������������������
�������������� ��������
���� �
��� �����
��������� ����� ��
���������������
� ����
��� �
�������
����� �����
��� �� �����
�������������
��� ��������� �����
�������� ������� �
���
������
��
����
�������
�����������
���������
���
����
�
���
�����
��������
���
� ������
���� �� � ����
� �� ���������
�� ������
���� �� ����
��������� ���������
�������� � �� �
���� ���� ���
� ��������
�������
�� ���������������
�������������������
���������������������
����������
�����������
�����������
���
����
�
�
��
�
�������������������������������������������������
�������������������������������������������������
�������
�������
�������
������������������������
���
��������
������������������������ ��������������������
����
� ���
���
���
���
������������������
��� �����������
������ ���������
���������
�����
������������������������ ���������� ��������������������������
�
��
����
��
�
���
�����
�
���� �����
����������
���
������
��
��������� �
�����
� ��������
� ���������
���
������
��
���������
�������� ������
��
������
���
���
����
����
�
����������
�����������
�� �
���� ��
�����
�����
���
����
�����
�����
��
������
��
���
������ ��
��
�� �������
����
�����
��
��������������
����������
���
��
���
����
�����
����
����
� ���
���������� �������
������
��
��������
��
���������������
�����
�����
���
� ���
�����������������
���
���
�����
��
���
����
��
��������������������������
� �����
��
����
����
����
���� �����
���������
������������������
�� ���������
���
��
���������� �����
���������
� �������
����� �
��
���
��
�������������
������������
���������
� ������
������ ����
��
�������������
�� ��
����
���
���
��������
�� �����
��
� �����
���������
���
�����������
��� ������
���������
�����
�������������
������������
������
�����
�����������������������
� ����� �����
�������
�����
���
�� ����������
��� �����
��
� ������������
��������� ������������
�����
���
����
������ ���
������������
����� �������
������� �������
������������
���������
���
�����������
��� ��
�����
��� �������
�������������
���
������
��
�������������
��������������
�������������
�� ��
��������
���
������������
��
�������
�����
������������
�����
�������
������������
������������� ��������
��������
��������
������
�����
� ���������
��
�����
�������
������
�������������
������� �����
� ���������
��
����������
��
��������
��
����
�����
��
� ���������
��
����� ����
��
�� ��������
��
���� �����
����������
���
����������
����� ����
��
�� ��������
��
���
���
��
���������
�� ����
�������
����������
�� �������
����
�
���������
�����
�� �������
���
��������
������������
�����
����
�� �������
��������������
����� ����
������� ����
�����
��������
� ���
� ��������
����� ����
�����
����������
���
����������
���� �����
� ������ ��
��������
���������
�����
��������
��������
����� ������
��������
� ���
���������� ����
�����
����
�������
�� ����������
���� ������������
������
����
�����
���������
���������
������
�����
����
�����
��
����������
��� ���
��
�
���
�������
����
�����
��
���
����
����
���
����
��
�������
�������
����������
������
����
���������
��
����������
��������������
� ���
����
����
����
����
�������������
���� �����
�������
��
��������
��
� �����
��
������������
����������
���������
��
��������
��������
��
���
���
���
���� �������
���
����
�� ���
�������
���
����
��
� �����������
���
��
�����
��
���� ����
���������
��������
����������������
� ��������
�����
������
�� �����
���� ����
���������
����
����
�����
��
��
��
����������
���������
��������
�� ������� ����������
���������
���������
�� �����
�� �������
��������
��������� ���������
�����
�����
��
��������
�����
�� ��������
�����
���
��
���������
�����
�����
��
����������
��������
���������
����������
�� �������
��
�����
�����������
�����������
�����
��������
��������
�����
����������
�����
���
��
�����
���
�����
��
��������� ����
����������
���
���
��
�������� ���
������������
� ��
����
��
��� ���
���
�
����������
�����������
���������
� �������
����������
�� ����
����������
��������� ����
� ������������������ �������
���
������ ��
��
���
��
���������
�����������
����������
���
��
���
��
���
�����
��
��� ������
���
�����
��
����������
��
����������
���������
���������
���������
� ������ ��������
����
����
���������
�����
������� ��
�������������
�������
��
�����
�������
����
���
���� ����
����� �
��
����
����������
�� �������� ���
�����������
�����
�����
����� �
������� ������
�����������
�� �� ����
����������
��� �����
��
���������
���� �����
��������
�
������
����
��� ������
�����
�����
��
�� ���
����
� ���
� ���
�����
����� ����
� �������
����������
� ���������
���
����
���
�������
����
��
���� �����
��
���
������
����������
�������
������������
��������
�����������
�������� ��
������
����������� ��
��������
������
��� �����
������
������
�������
��
����
� ���
����
�
���������
�� �
����������
���������
������
���� �����
�������
������
��
����������
����
��
��
������
��������
��� �����
��
��������������
���
�����
����
���������
�� ��������
�����������
����������
������� ���
��
��
� ��
����
��
���
������
��
�� ��
����
���
������������
����������
���� �����
����� ���
��
�������
��
�������� ������
�� � �
��
��
���
� ���
����
��
�����
��
������� ����
������� ��
���
�����
�������
���������
��������
��
����
���
�����
�� ��������� ��������
������
�� ���
�����
��������
�� ��
���
����
�����������
����������
���
����
��
��������
�� ��
���
���� ����
�����
���
��
�������
���
�� ���
��� �
����
�����������
���
����
����
��������� �������������� ����
����� ����
����������
�����
����
� �����
��
������������
����������
��������
���
���
���
���
������
�
���������
��� �����
��� ������
���������
���
���
���
���
���
���
������� ��
�������
������������
����
���
����
���
����������
������������� ��
����
�� ��
���
�������
����
��
����
��
�����������������
����������
����
����
��� ���
����
������� ����
���
����
�� ��������
�����������
�� �
�����
�
�������
����
����������
����
������
�����
������
���������
�����������
����������
�
����
������
������������
������������
���
���
��
��� ���
��
�����������
�������
������
� ���
�
�������������������
������� �������
������������
��������� � ��
� �������
���
� ������
���
��� ���
���
����������
����
�
�����
� �
������
����
������
����
�����������������
�����������
��������
�
��� ���� �
�� ��������
��
��� ���� �
�� ���
�������
��������� ��
�����
����
����
�������
�������¡
���
�����
�
���������
�������
������������
��
����
����
�
���
����
���
������� ���
���
� ���
����
� ����
����
���
���
���
� ���
������� �������� �
��
�
��
�
�
��
�
��
���
���������
������
������
���
��������
������������������
��
����
�� ������������ ��
������������
��������
�������������
����� ��� ��
��������
�
�
�
�����
����
����
���
����
���
���������
��
���������
���
���������
����
�����
����
����
�������
���
����
�������
������������
�����������������������������
��������������������������������
��������������������������� ������������ �
�
�
�
�
�
�
��
�
����
����
��
����
��
����
����
����
����
����
��
��
��
��
��
������������� �����������������
�
�
�
� � �
���������
����������������������������������������������������������
�������������������������
���������������������������
��������� ����� �� ���� ������ ����� � �� �������� ����� ������������������������
������������
��
Source: MBTA
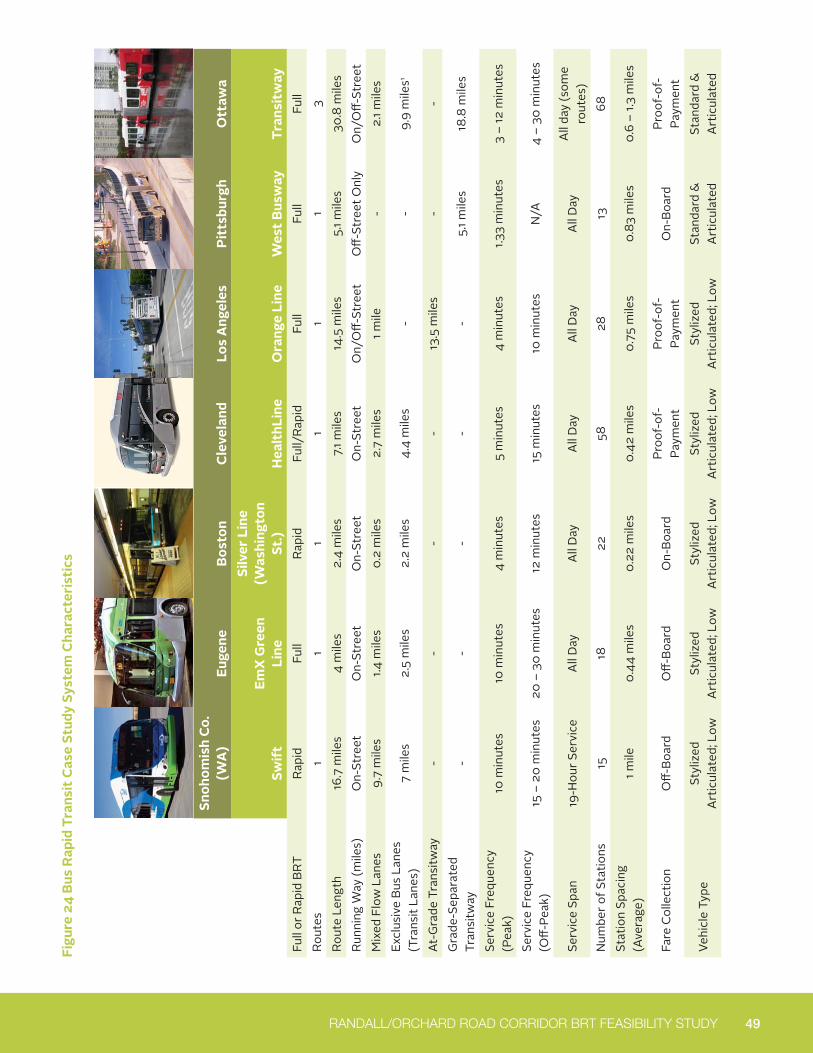
48 BRT PRIMER | WHO HAS BUILT BUS RAPID TRANSIT AND WHY? 49 RANDALL/ORCHARD ROAD CORRIDOR BRT FEASIBILITY STUDY
Figu
re 2
4 Bu
s Ra
pid
Tran
sit C
ase
Stud
y Sy
stem
Cha
ract
eris
tics
Snoh
omis
h Co
. (W
A)
Euge
neBo
ston
Cle
vela
ndLo
s A
ngel
esPi
ttsb
urgh
Ott
awa
Swift
EmX
Gre
en
Line
Silv
er L
ine
(Was
hing
ton
St.)
Hea
lthL
ine
Ora
nge
Line
Wes
t Bus
way
Tran
sitw
ayFu
ll or
Rap
id B
RTRa
pid
Full
Rapi
dFu
ll/Ra
pid
Full
Full
Full
Rout
es1
11
11
13
Rout
e Le
ngth
16.7
mile
s4
mile
s2.
4 m
iles
7.1 m
iles
14.5
mile
s5.
1 mile
s30
.8 m
iles
Runn
ing
Way
(mile
s)O
n-St
reet
On-
Stre
etO
n-St
reet
On-
Stre
etO
n/O
ff-St
reet
Off-
Stre
et O
nly
On/
Off-
Stre
etM
ixed
Flo
w L
anes
9.7
mile
s1.4
mile
s0.
2 m
iles
2.7
mile
s1 m
ile-
2.1 m
iles
Excl
usiv
e Bu
s La
nes
(Tra
nsit
Lane
s)7
mile
s2.
5 m
iles
2.2
mile
s4.
4 m
iles
--
9.9
mile
s1
At-G
rade
Tra
nsitw
ay-
--
-13
.5 m
iles
--
Gra
de-S
epar
ated
Tr
ansi
tway
--
--
-5.
1 mile
s18
.8 m
iles
Serv
ice
Freq
uenc
y (P
eak)
10 m
inut
es10
min
utes
4 m
inut
es5
min
utes
4 m
inut
es1.3
3 m
inut
es3
– 12
min
utes
Serv
ice
Freq
uenc
y (O
ff-Pe
ak)
15 –
20
min
utes
20 –
30
min
utes
12 m
inut
es15
min
utes
10 m
inut
esN
/A4
– 30
min
utes
Serv
ice
Span
19-H
our S
ervi
ceAl
l Day
All D
ayAl
l Day
All D
ayAl
l Day
All d
ay (s
ome
rout
es)
Num
ber o
f Sta
tions
1518
2258
2813
68St
atio
n Sp
acin
g (A
vera
ge)
1 mile
0.44
mile
s0.
22 m
iles
0.42
mile
s0.
75 m
iles
0.83
mile
s0.
6 –
1.3 m
iles
Fare
Col
lect
ion
Off-
Boar
dO
ff-Bo
ard
On-
Boar
dPr
oof-
of-
Paym
ent
Proo
f-of
-Pa
ymen
tO
n-Bo
ard
Proo
f-of
-Pa
ymen
t
Vehi
cle
Type
Styl
ized
Ar
ticul
ated
; Low
Styl
ized
Ar
ticul
ated
; Low
Styl
ized
Ar
ticul
ated
; Low
Styl
ized
Ar
ticul
ated
; Low
Styl
ized
Ar
ticul
ated
; Low
Stan
dard
&
Artic
ulat
edSt
anda
rd &
Ar
ticul
ated
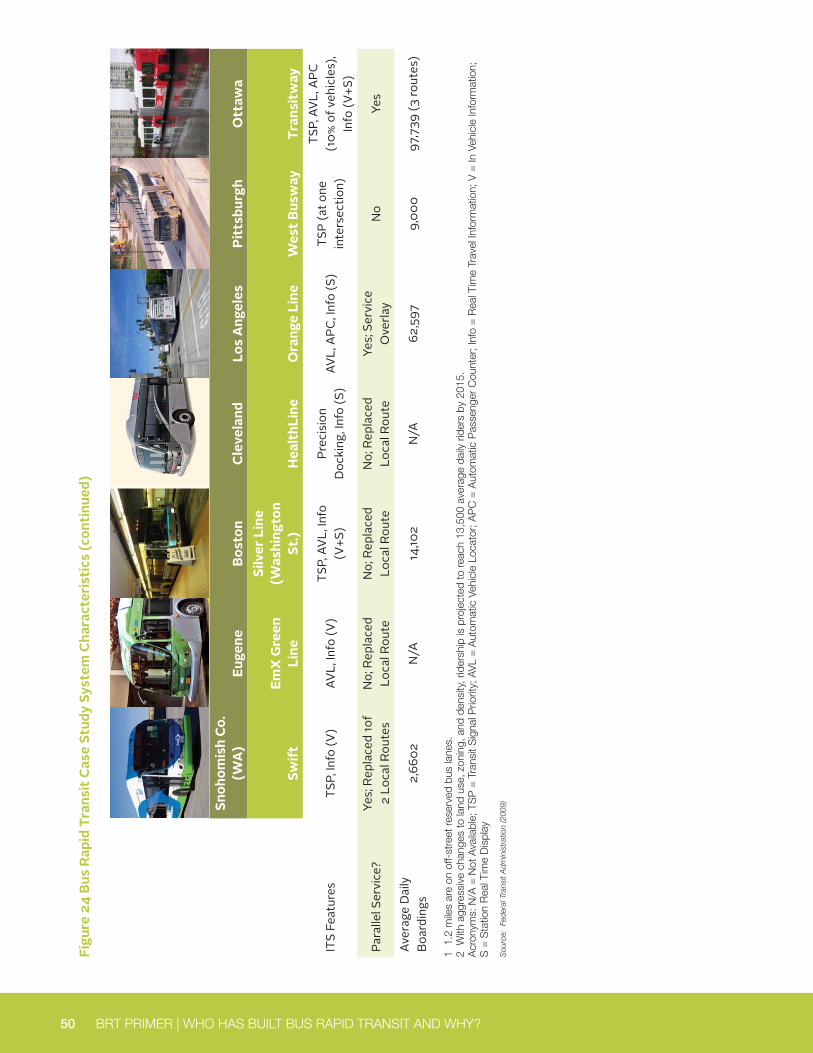
50 BRT PRIMER | WHO HAS BUILT BUS RAPID TRANSIT AND WHY?
Snoh
omis
h Co
. (W
A)
Euge
neBo
ston
Cle
vela
ndLo
s A
ngel
esPi
ttsb
urgh
Ott
awa
Swift
EmX
Gre
en
Line
Silv
er L
ine
(Was
hing
ton
St.)
Hea
lthL
ine
Ora
nge
Line
Wes
t Bus
way
Tran
sitw
ay
ITS
Feat
ures
TSP,
Info
(V)
AVL,
Info
(V)
TSP,
AVL
, Inf
o (V
+S)
Prec
isio
n D
ocki
ng, I
nfo
(S)
AVL,
APC
, Inf
o (S
)TS
P (a
t one
in
ters
ectio
n)
TSP,
AVL
, APC
(1
0% o
f veh
icle
s),
Info
(V+S
)
Para
llel S
ervi
ce?
Yes;
Repl
aced
1of
2 Lo
cal R
oute
sN
o; R
epla
ced
Loca
l Rou
teN
o; R
epla
ced
Loca
l Rou
teN
o; R
epla
ced
Loca
l Rou
teYe
s; Se
rvic
e O
verla
yN
oYe
s
Aver
age
Dai
ly
Boar
ding
s2,
6602
N/A
14,10
2N
/A62
,597
9,00
097
,739
(3 ro
utes
)
1 1
.2 m
iles
are
on o
ff-st
reet
rese
rved
bus
lane
s.
2 W
ith a
ggre
ssiv
e ch
ange
s to
land
use
, zon
ing,
and
den
sity
, rid
ersh
ip is
pro
ject
ed to
reac
h 13
,500
ave
rage
dai
ly r
ider
s by
201
5.
Acr
onym
s: N
/A =
Not
Ava
ilabl
e; T
SP
= T
rans
it S
igna
l Prio
rity;
AV
L =
Aut
omat
ic V
ehic
le L
ocat
or; A
PC
= A
utom
atic
Pas
seng
er C
ount
er; I
nfo
= R
eal T
ime
Trav
el In
form
atio
n; V
= In
Veh
icle
Info
rmat
ion;
S
= S
tatio
n R
eal T
ime
Dis
play
Sou
rce:
Fed
eral
Tra
nsit
Adm
inis
trat
ion
(200
9)
Figu
re 2
4 Bu
s Ra
pid
Tran
sit C
ase
Stud
y Sy
stem
Cha
ract
eris
tics
(con
tinu
ed)
51
KANE COUNTY RANDALL/ORCHARD ROAD CORRIDOR BRT FEASIBILITY STUDY
This section highlights a number of the benefits of Bus Rapid Transit, including research documenting these benefits and comparisons with other modes as applica-ble. These benefits include: increased rid-ership (and an associated mode shift away from driving alone); the fostering of livable communities; and expanded economic development including job creation. The Randall Road BRT feasibility study will de-velop methodologies for quantifying these benefits for the envisioned BRT service in Kane County.
WHAT ARE THE BENEFITS OF BRT?
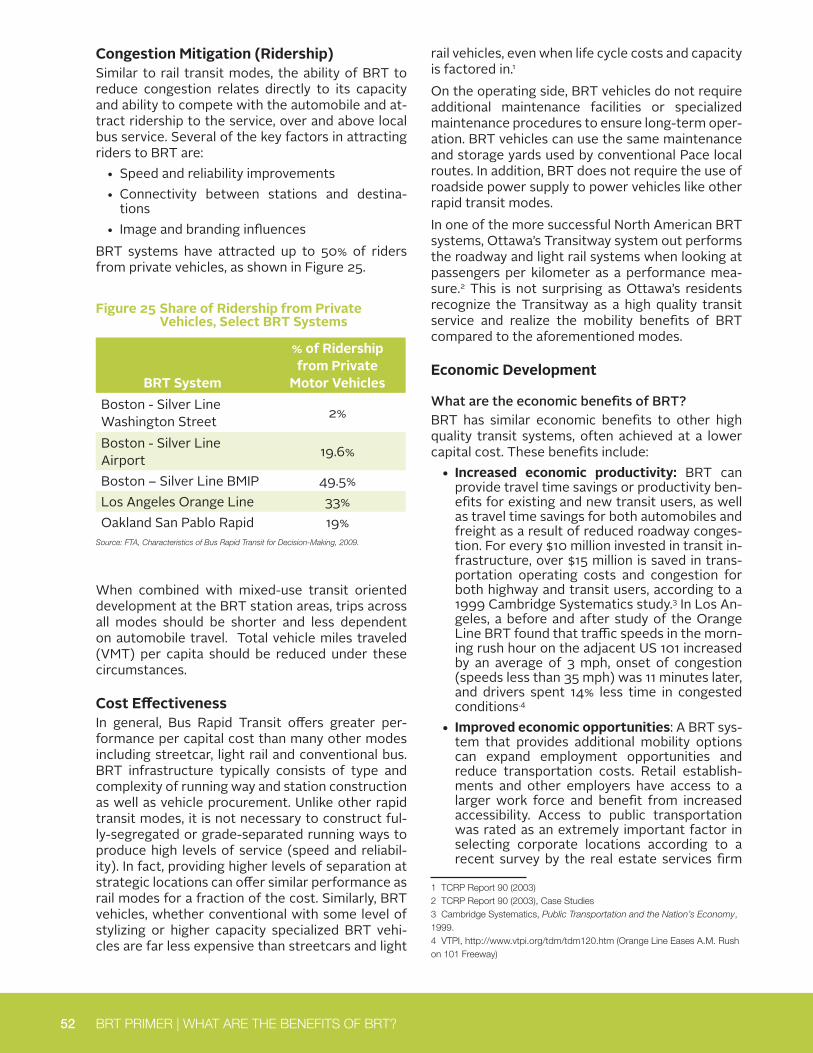
52 BRT PRIMER | WHAT ARE THE BENEFITS OF BRT?
Congestion Mitigation (Ridership)Similar to rail transit modes, the ability of BRT to reduce congestion relates directly to its capacity and ability to compete with the automobile and at-tract ridership to the service, over and above local bus service. Several of the key factors in attracting riders to BRT are:
• Speed and reliability improvements• Connectivity between stations and destina-
tions• Image and branding influences
BRT systems have attracted up to 50% of riders from private vehicles, as shown in Figure 25.
Figure 25 Share of Ridership from Private Vehicles, Select BRT Systems
BRT System
% of Ridership from Private
Motor VehiclesBoston - Silver Line Washington Street 2%
Boston - Silver Line Airport 19.6%
Boston – Silver Line BMIP 49.5%Los Angeles Orange Line 33%Oakland San Pablo Rapid 19%
Source: FTA, Characteristics of Bus Rapid Transit for Decision-Making, 2009.
When combined with mixed-use transit oriented development at the BRT station areas, trips across all modes should be shorter and less dependent on automobile travel. Total vehicle miles traveled (VMT) per capita should be reduced under these circumstances.
Cost EffectivenessIn general, Bus Rapid Transit offers greater per-formance per capital cost than many other modes including streetcar, light rail and conventional bus. BRT infrastructure typically consists of type and complexity of running way and station construction as well as vehicle procurement. Unlike other rapid transit modes, it is not necessary to construct ful-ly-segregated or grade-separated running ways to produce high levels of service (speed and reliabil-ity). In fact, providing higher levels of separation at strategic locations can offer similar performance as rail modes for a fraction of the cost. Similarly, BRT vehicles, whether conventional with some level of stylizing or higher capacity specialized BRT vehi-cles are far less expensive than streetcars and light
rail vehicles, even when life cycle costs and capacity is factored in.1
On the operating side, BRT vehicles do not require additional maintenance facilities or specialized maintenance procedures to ensure long-term oper-ation. BRT vehicles can use the same maintenance and storage yards used by conventional Pace local routes. In addition, BRT does not require the use of roadside power supply to power vehicles like other rapid transit modes.In one of the more successful North American BRT systems, Ottawa’s Transitway system out performs the roadway and light rail systems when looking at passengers per kilometer as a performance mea-sure.2 This is not surprising as Ottawa’s residents recognize the Transitway as a high quality transit service and realize the mobility benefits of BRT compared to the aforementioned modes.
Economic Development
What are the economic benefits of BRT?BRT has similar economic benefits to other high quality transit systems, often achieved at a lower capital cost. These benefits include:
• Increased economic productivity: BRT can provide travel time savings or productivity ben-efits for existing and new transit users, as well as travel time savings for both automobiles and freight as a result of reduced roadway conges-tion. For every $10 million invested in transit in-frastructure, over $15 million is saved in trans-portation operating costs and congestion for both highway and transit users, according to a 1999 Cambridge Systematics study.3 In Los An-geles, a before and after study of the Orange Line BRT found that traffic speeds in the morn-ing rush hour on the adjacent US 101 increased by an average of 3 mph, onset of congestion (speeds less than 35 mph) was 11 minutes later, and drivers spent 14% less time in congested conditions.4
• Improved economic opportunities: A BRT sys-tem that provides additional mobility options can expand employment opportunities and reduce transportation costs. Retail establish-ments and other employers have access to a larger work force and benefit from increased accessibility. Access to public transportation was rated as an extremely important factor in selecting corporate locations according to a recent survey by the real estate services firm
1 TCRP Report 90 (2003)2 TCRP Report 90 (2003), Case Studies3 Cambridge Systematics, Public Transportation and the Nation’s Economy, 1999.4 VTPI, http://www.vtpi.org/tdm/tdm120.htm (Orange Line Eases A.M. Rush on 101 Freeway)
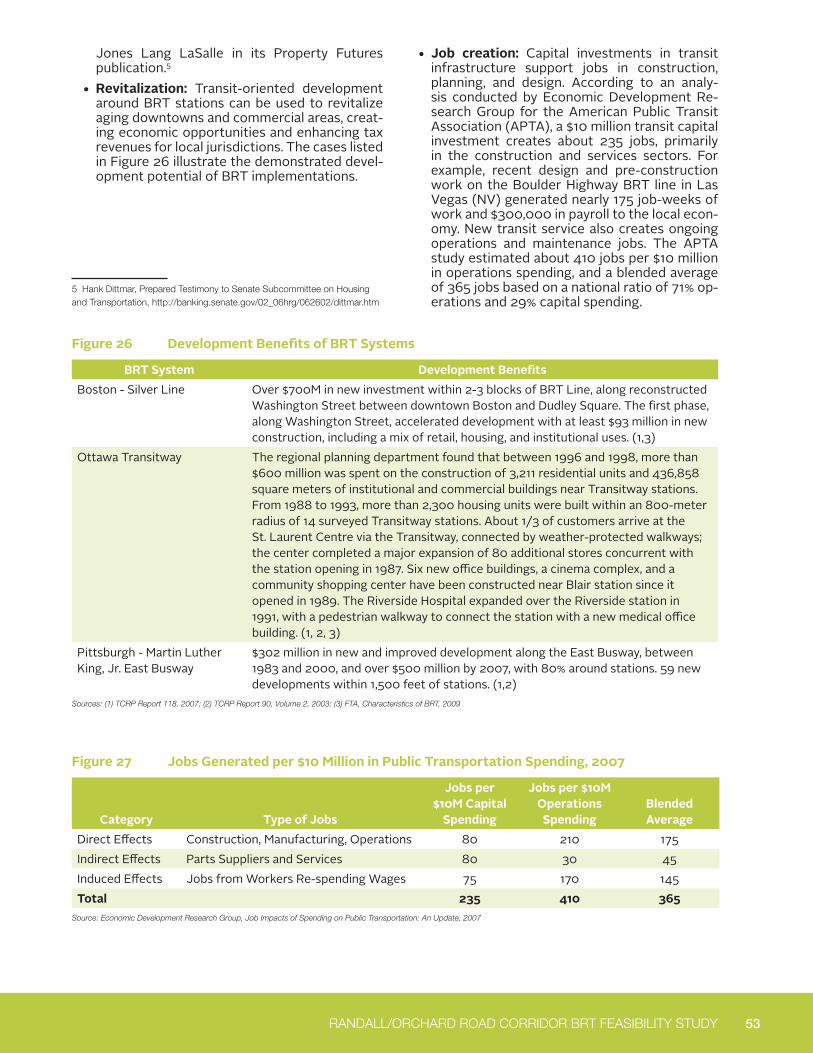
53 RANDALL/ORCHARD ROAD CORRIDOR BRT FEASIBILITY STUDY
Jones Lang LaSalle in its Property Futures publication.5
• Revitalization: Transit-oriented development around BRT stations can be used to revitalize aging downtowns and commercial areas, creat-ing economic opportunities and enhancing tax revenues for local jurisdictions. The cases listed in Figure 26 illustrate the demonstrated devel-opment potential of BRT implementations.
5 Hank Dittmar, Prepared Testimony to Senate Subcommittee on Housing and Transportation, http://banking.senate.gov/02_06hrg/062602/dittmar.htm
Figure 26 Development Benefits of BRT Systems
BRT System Development BenefitsBoston - Silver Line Over $700M in new investment within 2-3 blocks of BRT Line, along reconstructed
Washington Street between downtown Boston and Dudley Square. The first phase, along Washington Street, accelerated development with at least $93 million in new construction, including a mix of retail, housing, and institutional uses. (1,3)
Ottawa Transitway The regional planning department found that between 1996 and 1998, more than $600 million was spent on the construction of 3,211 residential units and 436,858 square meters of institutional and commercial buildings near Transitway stations. From 1988 to 1993, more than 2,300 housing units were built within an 800-meter radius of 14 surveyed Transitway stations. About 1/3 of customers arrive at the St. Laurent Centre via the Transitway, connected by weather-protected walkways; the center completed a major expansion of 80 additional stores concurrent with the station opening in 1987. Six new office buildings, a cinema complex, and a community shopping center have been constructed near Blair station since it opened in 1989. The Riverside Hospital expanded over the Riverside station in 1991, with a pedestrian walkway to connect the station with a new medical office building. (1, 2, 3)
Pittsburgh - Martin Luther King, Jr. East Busway
$302 million in new and improved development along the East Busway, between 1983 and 2000, and over $500 million by 2007, with 80% around stations. 59 new developments within 1,500 feet of stations. (1,2)
Sources: (1) TCRP Report 118, 2007; (2) TCRP Report 90, Volume 2, 2003; (3) FTA, Characteristics of BRT, 2009
Figure 27 Jobs Generated per $10 Million in Public Transportation Spending, 2007
Category Type of Jobs
Jobs per $10M Capital
Spending
Jobs per $10M Operations Spending
Blended Average
Direct Effects Construction, Manufacturing, Operations 80 210 175Indirect Effects Parts Suppliers and Services 80 30 45Induced Effects Jobs from Workers Re-spending Wages 75 170 145Total 235 410 365
Source: Economic Development Research Group, Job Impacts of Spending on Public Transportation: An Update, 2007
• Job creation: Capital investments in transit infrastructure support jobs in construction, planning, and design. According to an analy-sis conducted by Economic Development Re-search Group for the American Public Transit Association (APTA), a $10 million transit capital investment creates about 235 jobs, primarily in the construction and services sectors. For example, recent design and pre-construction work on the Boulder Highway BRT line in Las Vegas (NV) generated nearly 175 job-weeks of work and $300,000 in payroll to the local econ-omy. New transit service also creates ongoing operations and maintenance jobs. The APTA study estimated about 410 jobs per $10 million in operations spending, and a blended average of 365 jobs based on a national ratio of 71% op-erations and 29% capital spending.
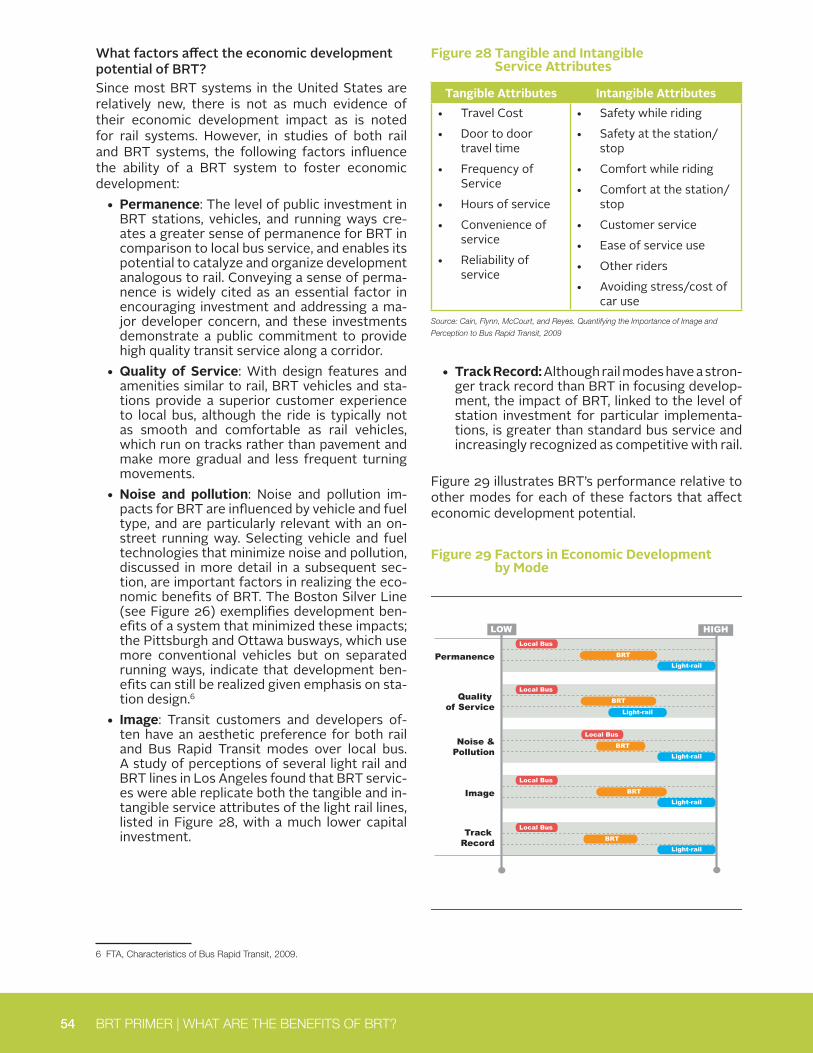
54 BRT PRIMER | WHAT ARE THE BENEFITS OF BRT?
What factors affect the economic development potential of BRT?Since most BRT systems in the United States are relatively new, there is not as much evidence of their economic development impact as is noted for rail systems. However, in studies of both rail and BRT systems, the following factors influence the ability of a BRT system to foster economic development:
• Permanence: The level of public investment in BRT stations, vehicles, and running ways cre-ates a greater sense of permanence for BRT in comparison to local bus service, and enables its potential to catalyze and organize development analogous to rail. Conveying a sense of perma-nence is widely cited as an essential factor in encouraging investment and addressing a ma-jor developer concern, and these investments demonstrate a public commitment to provide high quality transit service along a corridor.
• Quality of Service: With design features and amenities similar to rail, BRT vehicles and sta-tions provide a superior customer experience to local bus, although the ride is typically not as smooth and comfortable as rail vehicles, which run on tracks rather than pavement and make more gradual and less frequent turning movements.
• Noise and pollution: Noise and pollution im-pacts for BRT are influenced by vehicle and fuel type, and are particularly relevant with an on-street running way. Selecting vehicle and fuel technologies that minimize noise and pollution, discussed in more detail in a subsequent sec-tion, are important factors in realizing the eco-nomic benefits of BRT. The Boston Silver Line (see Figure 26) exemplifies development ben-efits of a system that minimized these impacts; the Pittsburgh and Ottawa busways, which use more conventional vehicles but on separated running ways, indicate that development ben-efits can still be realized given emphasis on sta-tion design.6
• Image: Transit customers and developers of-ten have an aesthetic preference for both rail and Bus Rapid Transit modes over local bus. A study of perceptions of several light rail and BRT lines in Los Angeles found that BRT servic-es were able replicate both the tangible and in-tangible service attributes of the light rail lines, listed in Figure 28, with a much lower capital investment.
6 FTA, Characteristics of Bus Rapid Transit, 2009.
Figure 28 Tangible and Intangible Service Attributes
Tangible Attributes Intangible Attributes• Travel Cost• Door to door
travel time• Frequency of
Service• Hours of service• Convenience of
service• Reliability of
service
• Safety while riding• Safety at the station/
stop• Comfort while riding• Comfort at the station/
stop• Customer service• Ease of service use• Other riders• Avoiding stress/cost of
car useSource: Cain, Flynn, McCourt, and Reyes. Quantifying the Importance of Image and
Perception to Bus Rapid Transit, 2009
• Track Record: Although rail modes have a stron-ger track record than BRT in focusing develop-ment, the impact of BRT, linked to the level of station investment for particular implementa-tions, is greater than standard bus service and increasingly recognized as competitive with rail.
Figure 29 illustrates BRT’s performance relative to other modes for each of these factors that affect economic development potential.
Figure 29 Factors in Economic Development by Mode
PermanenceLocal Bus
BRTLight-rail
LOW HIGH
Quality of Service
Local Bus
BRT
Light-rail
Noise &Pollution
Local Bus
BRTLight-rail
ImageLocal Bus
BRTLight-rail
Track Record
Local Bus
BRTLight-rail
OVERALL Local Bus
BRT
Streetcar
Light-rail
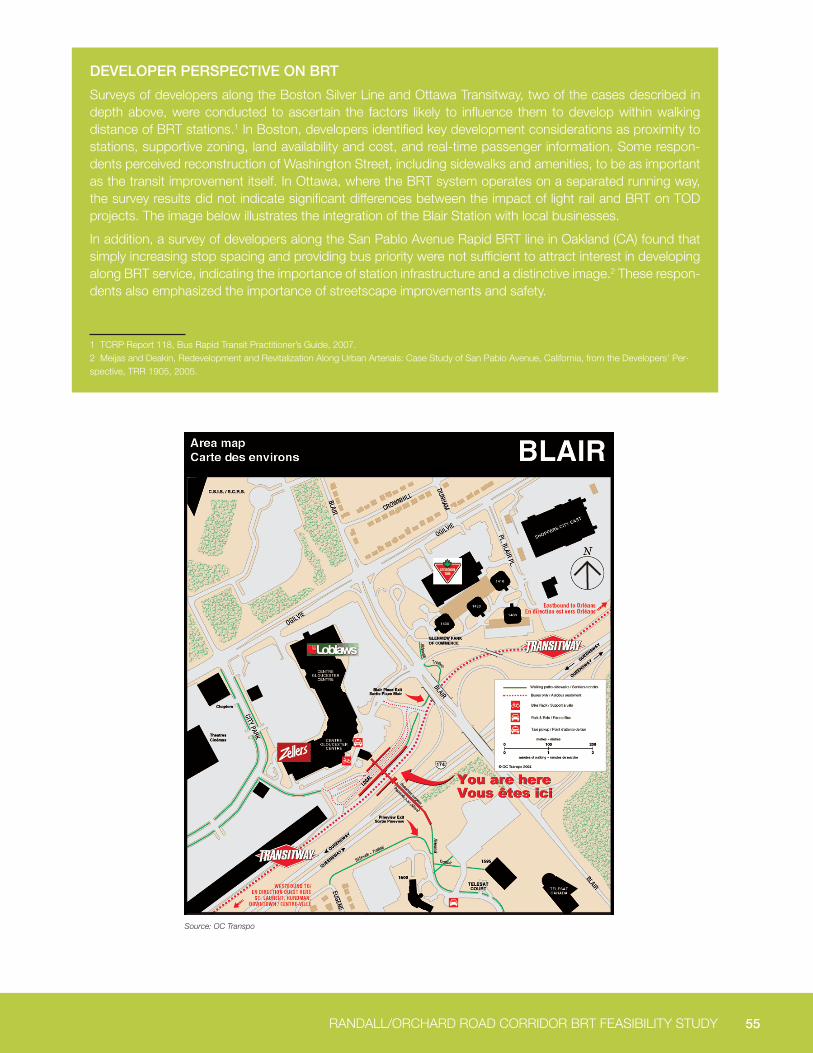
55 RANDALL/ORCHARD ROAD CORRIDOR BRT FEASIBILITY STUDY
Source: OC Transpo
DEVELOPER PERSPECTIVE ON BRT
Surveys of developers along the Boston Silver Line and Ottawa Transitway, two of the cases described in depth above, were conducted to ascertain the factors likely to influence them to develop within walking distance of BRT stations.1 In Boston, developers identified key development considerations as proximity to stations, supportive zoning, land availability and cost, and real-time passenger information. Some respon-dents perceived reconstruction of Washington Street, including sidewalks and amenities, to be as important as the transit improvement itself. In Ottawa, where the BRT system operates on a separated running way, the survey results did not indicate significant differences between the impact of light rail and BRT on TOD projects. The image below illustrates the integration of the Blair Station with local businesses.
In addition, a survey of developers along the San Pablo Avenue Rapid BRT line in Oakland (CA) found that simply increasing stop spacing and providing bus priority were not sufficient to attract interest in developing along BRT service, indicating the importance of station infrastructure and a distinctive image.2 These respon-dents also emphasized the importance of streetscape improvements and safety.
1 TCRP Report 118, Bus Rapid Transit Practitioner’s Guide, 2007.2 Meijas and Deakin, Redevelopment and Revitalization Along Urban Arterials: Case Study of San Pablo Avenue, California, from the Developers’ Per-spective, TRR 1905, 2005.
Bus Rapid Transit Practitioner’s Guide
Bus Rapid Transit Practitioner’s Guide Page 6-13 Land Development Guidelines
their insights. Developer contacts were identified from the initial local jurisdiction contacts and, in the case of Ottawa, from station area walking maps such as the one in Exhibit 6-7. For developers, the focus was on the hard or design elements of BRT, including stations, running ways, and vehicles. The questions revolved around the factors that influence why developers might be inclined to locate different types of development (i.e., residential, commercial, or mixed-use) within walking distance of BRT stations in different types of environments (i.e., CBD, central city, or suburban) and different features.
SOURCE: OC Transpo
EXHIBIT 6-7 Transitway Station Area Map - Blair Station
Boston
TOD Overview The first phase of Boston’s first BRT project, the Silver Line, opened in July
2002 on Washington Street between the Dudley Square/Roxbury neighborhoods, traveling through the South End and ending at the Downtown Crossing station.
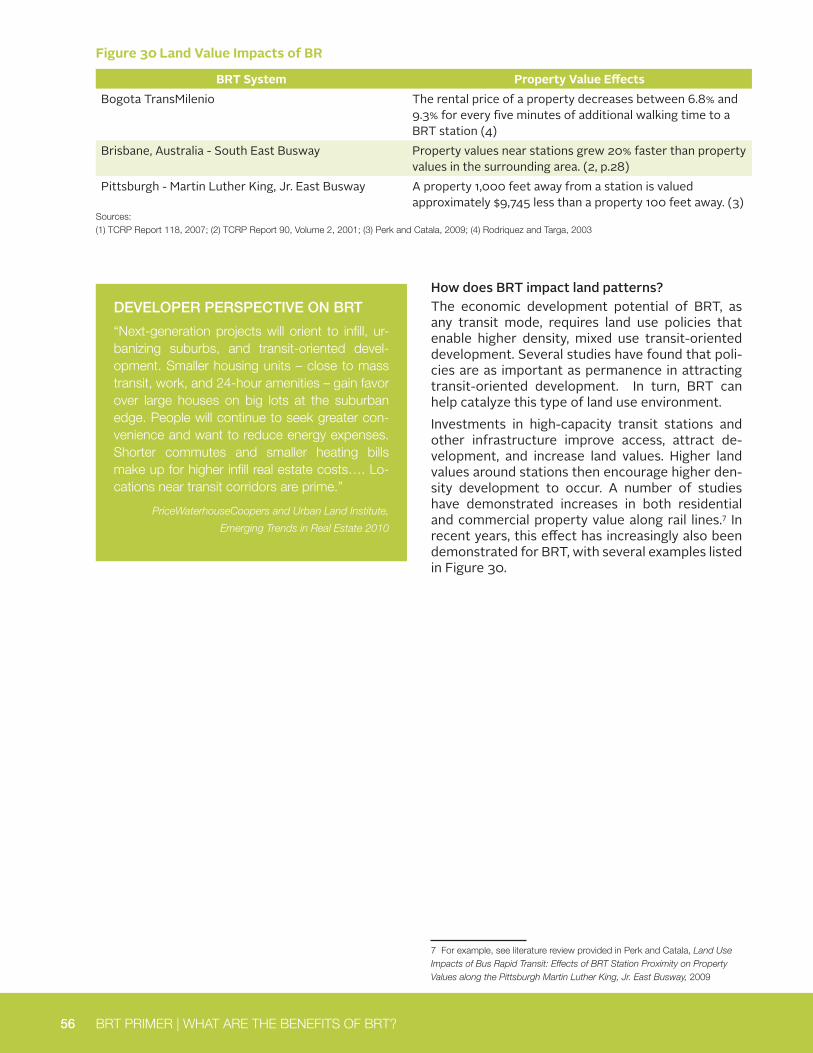
56 BRT PRIMER | WHAT ARE THE BENEFITS OF BRT?
DEVELOPER PERSPECTIVE ON BRT
“Next-generation projects will orient to infill, ur-banizing suburbs, and transit-oriented devel-opment. Smaller housing units – close to mass transit, work, and 24-hour amenities – gain favor over large houses on big lots at the suburban edge. People will continue to seek greater con-venience and want to reduce energy expenses. Shorter commutes and smaller heating bills make up for higher infill real estate costs…. Lo-cations near transit corridors are prime.”
PriceWaterhouseCoopers and Urban Land Institute,
Emerging Trends in Real Estate 2010
Figure 30 Land Value Impacts of BR
BRT System Property Value EffectsBogota TransMilenio The rental price of a property decreases between 6.8% and
9.3% for every five minutes of additional walking time to a BRT station (4)
Brisbane, Australia - South East Busway Property values near stations grew 20% faster than property values in the surrounding area. (2, p.28)
Pittsburgh - Martin Luther King, Jr. East Busway A property 1,000 feet away from a station is valued approximately $9,745 less than a property 100 feet away. (3)
Sources: (1) TCRP Report 118, 2007; (2) TCRP Report 90, Volume 2, 2001; (3) Perk and Catala, 2009; (4) Rodriquez and Targa, 2003
How does BRT impact land patterns?The economic development potential of BRT, as any transit mode, requires land use policies that enable higher density, mixed use transit-oriented development. Several studies have found that poli-cies are as important as permanence in attracting transit-oriented development. In turn, BRT can help catalyze this type of land use environment.Investments in high-capacity transit stations and other infrastructure improve access, attract de-velopment, and increase land values. Higher land values around stations then encourage higher den-sity development to occur. A number of studies have demonstrated increases in both residential and commercial property value along rail lines.7 In recent years, this effect has increasingly also been demonstrated for BRT, with several examples listed in Figure 30.
7 For example, see literature review provided in Perk and Catala, Land Use Impacts of Bus Rapid Transit: Effects of BRT Station Proximity on Property Values along the Pittsburgh Martin Luther King, Jr. East Busway, 2009
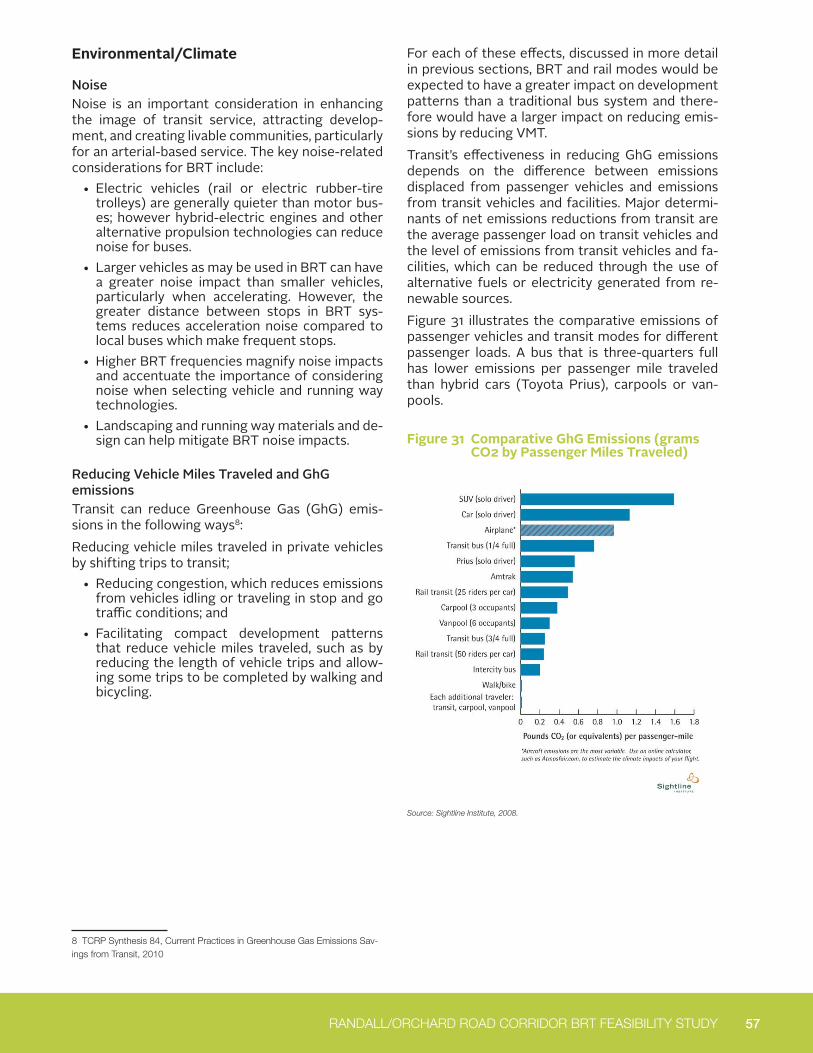
57 RANDALL/ORCHARD ROAD CORRIDOR BRT FEASIBILITY STUDY
Environmental/Climate
Noise Noise is an important consideration in enhancing the image of transit service, attracting develop-ment, and creating livable communities, particularly for an arterial-based service. The key noise-related considerations for BRT include:
• Electric vehicles (rail or electric rubber-tire trolleys) are generally quieter than motor bus-es; however hybrid-electric engines and other alternative propulsion technologies can reduce noise for buses.
• Larger vehicles as may be used in BRT can have a greater noise impact than smaller vehicles, particularly when accelerating. However, the greater distance between stops in BRT sys-tems reduces acceleration noise compared to local buses which make frequent stops.
• Higher BRT frequencies magnify noise impacts and accentuate the importance of considering noise when selecting vehicle and running way technologies.
• Landscaping and running way materials and de-sign can help mitigate BRT noise impacts.
Reducing Vehicle Miles Traveled and GhG emissionsTransit can reduce Greenhouse Gas (GhG) emis-sions in the following ways8:Reducing vehicle miles traveled in private vehicles by shifting trips to transit;
• Reducing congestion, which reduces emissions from vehicles idling or traveling in stop and go traffic conditions; and
• Facilitating compact development patterns that reduce vehicle miles traveled, such as by reducing the length of vehicle trips and allow-ing some trips to be completed by walking and bicycling.
8 TCRP Synthesis 84, Current Practices in Greenhouse Gas Emissions Sav-ings from Transit, 2010
For each of these effects, discussed in more detail in previous sections, BRT and rail modes would be expected to have a greater impact on development patterns than a traditional bus system and there-fore would have a larger impact on reducing emis-sions by reducing VMT.Transit’s effectiveness in reducing GhG emissions depends on the difference between emissions displaced from passenger vehicles and emissions from transit vehicles and facilities. Major determi-nants of net emissions reductions from transit are the average passenger load on transit vehicles and the level of emissions from transit vehicles and fa-cilities, which can be reduced through the use of alternative fuels or electricity generated from re-newable sources. Figure 31 illustrates the comparative emissions of passenger vehicles and transit modes for different passenger loads. A bus that is three-quarters full has lower emissions per passenger mile traveled than hybrid cars (Toyota Prius), carpools or van-pools.
Figure 31 Comparative GhG Emissions (grams CO2 by Passenger Miles Traveled)
Source: Sightline Institute, 2008.
Figure 30 Land Value Impacts of BR
BRT System Property Value EffectsBogota TransMilenio The rental price of a property decreases between 6.8% and
9.3% for every five minutes of additional walking time to a BRT station (4)
Brisbane, Australia - South East Busway Property values near stations grew 20% faster than property values in the surrounding area. (2, p.28)
Pittsburgh - Martin Luther King, Jr. East Busway A property 1,000 feet away from a station is valued approximately $9,745 less than a property 100 feet away. (3)
Sources: (1) TCRP Report 118, 2007; (2) TCRP Report 90, Volume 2, 2001; (3) Perk and Catala, 2009; (4) Rodriquez and Targa, 2003
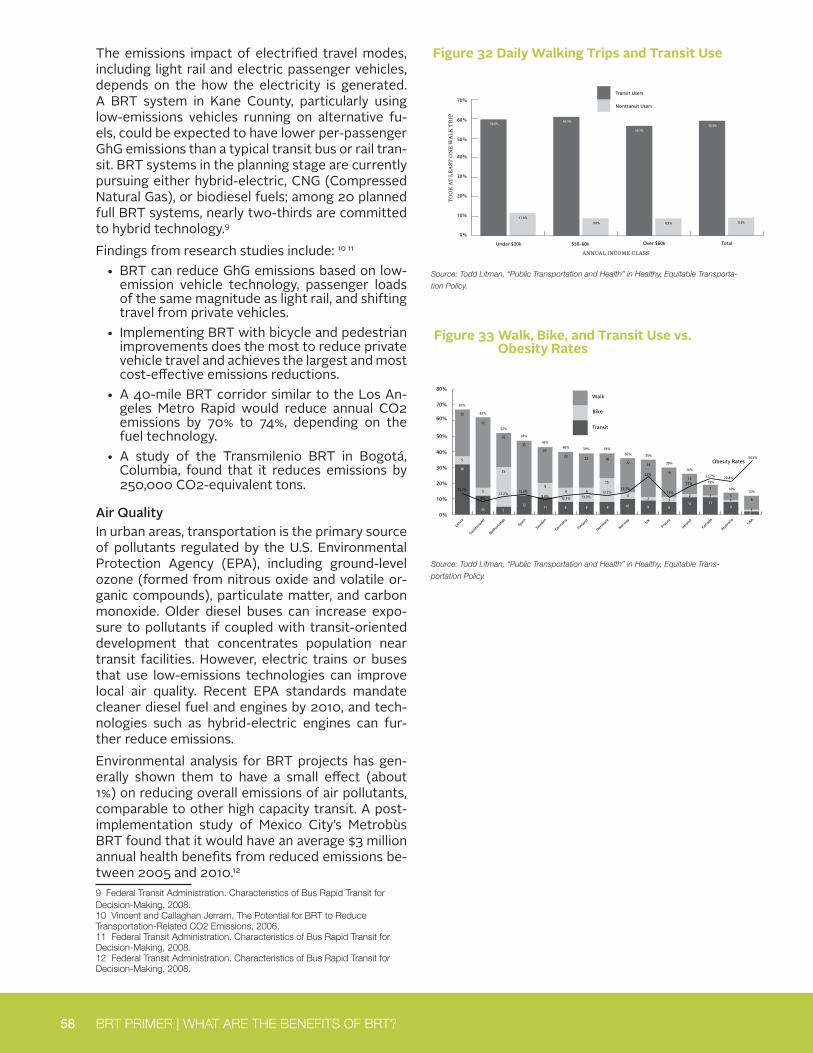
58 BRT PRIMER | WHAT ARE THE BENEFITS OF BRT?
The emissions impact of electrified travel modes, including light rail and electric passenger vehicles, depends on the how the electricity is generated. A BRT system in Kane County, particularly using low-emissions vehicles running on alternative fu-els, could be expected to have lower per-passenger GhG emissions than a typical transit bus or rail tran-sit. BRT systems in the planning stage are currently pursuing either hybrid-electric, CNG (Compressed Natural Gas), or biodiesel fuels; among 20 planned full BRT systems, nearly two-thirds are committed to hybrid technology.9
Findings from research studies include: 10 11
• BRT can reduce GhG emissions based on low-emission vehicle technology, passenger loads of the same magnitude as light rail, and shifting travel from private vehicles.
• Implementing BRT with bicycle and pedestrian improvements does the most to reduce private vehicle travel and achieves the largest and most cost-effective emissions reductions.
• A 40-mile BRT corridor similar to the Los An-geles Metro Rapid would reduce annual CO2 emissions by 70% to 74%, depending on the fuel technology.
• A study of the Transmilenio BRT in Bogotá, Columbia, found that it reduces emissions by 250,000 CO2-equivalent tons.
Air QualityIn urban areas, transportation is the primary source of pollutants regulated by the U.S. Environmental Protection Agency (EPA), including ground-level ozone (formed from nitrous oxide and volatile or-ganic compounds), particulate matter, and carbon monoxide. Older diesel buses can increase expo-sure to pollutants if coupled with transit-oriented development that concentrates population near transit facilities. However, electric trains or buses that use low-emissions technologies can improve local air quality. Recent EPA standards mandate cleaner diesel fuel and engines by 2010, and tech-nologies such as hybrid-electric engines can fur-ther reduce emissions.Environmental analysis for BRT projects has gen-erally shown them to have a small effect (about 1%) on reducing overall emissions of air pollutants, comparable to other high capacity transit. A post-implementation study of Mexico City’s Metrobùs BRT found that it would have an average $3 million annual health benefits from reduced emissions be-tween 2005 and 2010.12
9 Federal Transit Administration. Characteristics of Bus Rapid Transit for Decision-Making, 2008.10 Vincent and Callaghan Jerram, The Potential for BRT to Reduce Transportation-Related CO2 Emissions, 2006.11 Federal Transit Administration. Characteristics of Bus Rapid Transit for Decision-Making, 2008.12 Federal Transit Administration. Characteristics of Bus Rapid Transit for Decision-Making, 2008.
Figure 32 Daily Walking Trips and Transit Use
Figure 33 Walk, Bike, and Transit Use vs. Obesity Rates
Source: Todd Litman, “Public Transportation and Health” in Healthy, Equitable Transporta-
tion Policy.
Source: Todd Litman, “Public Transportation and Health” in Healthy, Equitable Trans-
portation Policy.
He
alt
hy,
Eq
uit
ab
le T
ran
sp
ort
ati
on
Po
lic
y
pg
. 50
>
>
Ch
ap
ter
3
kilometers walked daily) increases by 3.87 for each transit trip taken and is 2.23 times greater for commuters who use an employer-sponsored public transportation pass. Public transportation travel increased walking activity for all income classes, as illustrated in figure 8, indicating that encouraging transit travel can support public health for a variety of demographic groups.
Residents of transit oriented communities tend to walk more and have lower rates of obesity and hypertension than residents in sprawled areas. A recent study collected transportation mode split and obesity rate data for various economically developed countries, as summarized in table 2 and figure 9. Two important points are illustrated: travel
patterns are highly variable, even among similar countries, and national obesity rates tend to be inversely related to rates of active transportation (walking and biking), suggesting that transport policy affects public fitness and health.
As a result, policies and planning practices that support public transportation tend to increase public fitness and health. Sturm estimates that shifting from a sprawled area such as San Bernardino, CA, to a areas which reflect smart growth principles such as Boston, MA, reduces chronic medical conditions about 16 percent, with greater reductions for older adults and low-income people because they tend to be most sedentary.30
Public Transportation and Health
Public transportation users are much more likely to take walking trips and walk much farther than nontransit users.
Transit Users
Nontransit Users
0%
10%
20%
30%
40%
50%
60%
70%
80%
59.6%
11.6%
60.9%
9.0%
56.3%
8.9%
58.9%
9.3%
Figure 8. Daily Walking Trips and Transit Travel
3-8
TO
OK
AT
LE
AST
ON
E W
ALK
TR
IP
ANNUAL INCOME CLASS
Under $30k $30–60k Over $60k Total
Figure 8. Daily Walking Trips and Transit Travel 27
He
alt
hy,
Eq
uit
ab
le T
ran
sp
ort
ati
on
Po
lic
y
pg
. 52
>
>
Ch
ap
ter
3
development can increase community cohesion by creating opportunities for residents to interact while walking, waiting at transit stops, and riding on transit vehicles. Further, they reduce total automobile traffic, which improves the public realm, for example, by reducing traffic noise on sidewalks and front yards.35 This can increase connections and contacts among dissimilar groups, helping to bridge social distance and widening opportunities by introducing disadvantaged children to more affluent families and broadening the pool of role models and mentors available to low-income youths.36 Long-term social and economic benefits can result by increasing educational and
employment opportunities and reducing crime and dependence on social assistance.
Mental Health Impacts
Public transportation improvements such as increased service, improved climate control, more comfortable waiting conditions, and improved service reliability can improve mental health by reducing physical and emotional stresses (crowding, fear, and frustration), increasing affordability (and therefore reduced financial stress), influencing access to education and employment activities (and therefore long-term economic opportunities), and helping
Public Transportation and Health
Figure 9. Mode Split vs. National Obesity Rates29
This data set indicates that transportation mode split is highly variable, even among economically developed countries, and national obesity rates are inversely related to rates of active transportation (walking and bicycling).
Walk
Obesity Rates
Bike
Transit
0%
10%
20%
30%
40%
50%
60%
70%
80%
43%
32
67%
12
62%
22
52%
25
512
35
47%
5
8%11.2%
12.8%9.4%
12.1% 13.3%12.2%
14.3%
24%
11%
18%
22.7%
34.3%
45
5
30
13.7%9
11
23
40% 39% 39%36% 35%
30%
26%
19%
14%12%
23
9
8
22
9
8
16
15
8
22
4
10
24
2
9
19
3
8
13
2
11
7
1
11
5
20.8%
1
8
9
1
USA
Australi
a
Canad
a
Irelan
d
Fran
ceUK
Norway
Denm
ark
Finlan
d
Germ
any
Swed
enSp
ain
Nether
lands
Switz
erla
nd
Latv
ia
Figure 9. Mode Split vs. National Obesity Rates29
3-9
2
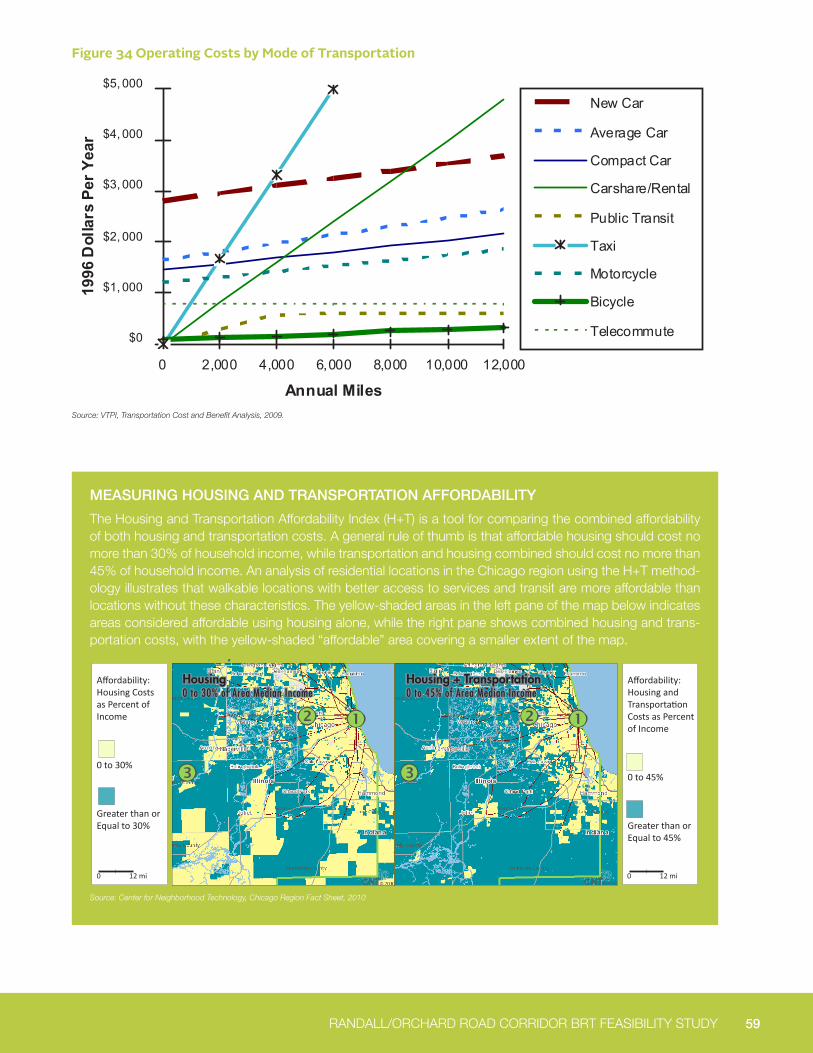
59 RANDALL/ORCHARD ROAD CORRIDOR BRT FEASIBILITY STUDY
MEASURING HOUSING AND TRANSPORTATION AFFORDABILITY
The Housing and Transportation Affordability Index (H+T) is a tool for comparing the combined affordability of both housing and transportation costs. A general rule of thumb is that affordable housing should cost no more than 30% of household income, while transportation and housing combined should cost no more than 45% of household income. An analysis of residential locations in the Chicago region using the H+T method-ology illustrates that walkable locations with better access to services and transit are more affordable than locations without these characteristics. The yellow-shaded areas in the left pane of the map below indicates areas considered affordable using housing alone, while the right pane shows combined housing and trans-portation costs, with the yellow-shaded “affordable” area covering a smaller extent of the map.
Figure 34 Operating Costs by Mode of Transportation
Source: VTPI, Transportation Cost and Benefit Analysis, 2009.
Source: Center for Neighborhood Technology, Chicago Region Fact Sheet, 2010
Transportation Cost and Benefit Analysis II – Vehicle Costs Victoria Transport Policy Institute (www.vtpi.org)
9 February 2009 www.vtpi.org/tca/tca0501.pdfPage 5.1-11
5.1.10 Comparison of Vehicle CostsFigure 5.1.10-1 illustrates the differences in vehicle costs for various modes. It shows how some modes (such as automobile) have relatively high fixed costs and relatively low variable costs, as least as they are normally perceived (as described above, a portion of depreciation costs are actually variable, but this is not always recognized by users), while other modes such as taxi and carsharing have minimal fixed costs but higher variable costs. Walking, cycling and transit have relatively low vehicle costs.
Figure 5.1.10-1 User Expenses for Various Modes23
$0
$1, 000
$2, 000
$3, 000
$4, 000
$5, 000
0 2,000 4,000 6,000 8,000 10,000 12,000
Annual Miles
1996
Dol
lars
Per
Yea
rNew Car
Average Car
Compact Car
Carshare/Rental
Public Transit
Taxi
Motorcycle
Bicycle
Telecommute
Automobile travel has high fixed costs and low variable costs, taxi and carshare have low fixed costs and high variable costs, while transit and cycling have low financial costs.
There is considerable variation in vehicle costs depending on the vehicle and its use. An old but reliable, uninsured automobile may cost only a few hundred dollars a year, while an expensive vehicle can cost ten times as much. Walking, cycling and transit incremental costs also vary depending on the situation and perspective.
5.1.11 Equity and Efficiency Issues Vehicle costs are internal (paid directly by users). The main equity issue is Transportation Affordability, the ability of lower-income people to afford basic mobility (travel to medical services, school, work, etc.). Higher vehicle costs and transit fares are often considered regressive. Many vehicle costs are inefficiently priced. For example, insurance claims and road wear tend to increase with annual vehicle mileage, but this is not reflected in insurance premiums or vehicle registration fees. This results in cross-subsidies from lower-annual-mileage to higher-annual-mile motorists.
23 Based on estimates in this chapter; $50 monthly transit pass; $1.25 per mile average taxi fares; $0.40 per mile average rental car charges; “New Car” from Your Driving Costs, AAA.
Da te : 3/2010© 2010 Center for Neighborhood Technology • 2125 W. North Ave., Chicago, IL 60647 • p: 773-278-4800 • f: 773-278-3840 • www.cnt.org
Neighborhood Profiles 0% 10% 20% 30% 40% 50% 60%
Housing Costs as a Percent of AMI
Transportation Costs as a Percent of AMI
Affordability: Housing Costs as Percent ofIncome
0 to 30%
Greater than or Equal to 30%
Affordability: Housing and Transportation Costs as Percent of Income
0 to 45%
Greater than or Equal to 45%
H+TSM Affordability IndexTrue Affordability and Location Efficiency
Two Views of Affordability
The Housing + Transportation (H+T) Affordability Index is a new and more comprehensive way of thinking about the cost of housing and true affordability by exploring the impact that transportation costs associated with location have on a household’s economic bottom line. The H+T Index is an innovative tool that measures the true affordability of housing.The traditional measure of affordability used by planners, lenders, and most consumers recommends that housing should be less than 30% of income. The H+T Index, in contrast, takes into account not just the cost of housing, but the costs of housing and transportation.
The Index has received much attention from policy makers for its benefits to planners and TOD advocates and is already being used for additional research. This work represents the development the H+T Index for 337 metropolitan areas.
H+T Affordability Index = (Housing Costs + Transportation Costs) Income
South Loop, Chicago
Brookfield, Cook County
Yorkville, Kendall County
28.76% 11.43%
28.14% 19.62%
27.53% 22.54%
0 12 mi 0 12 mi
Chicago, IL
68%
52%
percentage of communities in the Chicago metro area considered affordable using the standard measure of 30% of income
percentage of communities in the Chicago metro area considered affordable using the H+T measure of 45% of income
Housing + Transportation0 to 45% of Area Median Income
Housing0 to 30% of Area Median Income
60 BRT PRIMER | WHAT ARE THE BENEFITS OF BRT?
Social/Community Benefits
Health ImpactsIn addition to health benefits from improved air quality as discussed in the previous section, BRT can create health benefits by encouraging bicy-cling and walking, known as “active transporta-tion.” Public transit and active transportation are complementary, since most public transit trips in-volve walking on one or both ends of the trip, and an average transit trip involves 5-10 times more walking than an automobile trip, according to travel surveys.13 Transit facilities at BRT stations can en-courage bicycle use by providing facilities such as bicycle racks on buses and secure lockers at sta-tions. Mixed-use, transit-oriented development around BRT stations encourages active transpor-tation for even non-transit trips. Transit users are likely to walk longer distances than non-transit us-ers, and as shown in Figure 32, transit users of all income levels are more likely to make at least one daily walking trip. Figure 33 illustrates that obesity rates are inversely related to the level of walking, biking, and transit use across a range of developed nations.And as the population ages14, the region will see increased demand for transit and other non-auto-mobile-based trips increase. BRT is more attrac-tive than local bus service, especially for safety-conscious senior and those who did not previously use transit. Development at BRT station areas also creates opportunities for seniors to meet their mo-bility needs without traveling long distances.
13 VTPI, Transportation Cost and Benefit Analysis: Safety and Health Costs, 2009. 14 The Census Bureau has projected that the number of individuals 65 and older will grow by 36% in the next 10 years and by 79% in the next 20 years. Looking 20 years ahead, the most rapid growth will be in the age 75 to 84 group, which will grow by 89%. The old-old age group of people 85 and older will grow more than the general population in the next ten years, but will not see really rapid growth until the period after 2020.
Personal Transportation CostsFigure 34 compares the cost of driving to other modes. Owning a car has high fixed costs (e.g., ve-hicle and insurance) depending on the type and age of the vehicle, but driving has relatively low incre-mental costs (e.g., gas, maintenance, parking and tolls). Modes such as public transit and bicycles have low fixed and incremental costs for individu-als. Compact development patterns, quality transit service and other transportation options can save households money by allowing them to reduce the number of vehicles they own and/or the amount of travel. According to one study, the average po-tential savings per vehicle can be up to $3500 per year, the average annual cost of an additional ve-hicle.15 Household savings on transportation costs translates into money they can spend in the local economy.
Social Interaction and LivabilityThe redevelopment potential of BRT, comparable to other high quality transit, provides it with the ability to foster the following benefits16:
• Creating places for community life;• Acting as a catalyst for the renewal and revital-
ization of neighborhoods and downtowns;• Creating opportunities for entrepreneurship
and local economic development;• Making communities safer and more comfort-
able;• Making connections between neighborhoods,
downtowns, and community destinations more accessible and convenient; and
• Shaping community growth.
15 Center for Urban Transportation Research, University of South Florida, Exploration of a Shift in Household Transportation Spending from Vehicles to Public Transportation, 200816 TCRP Report 22, The Role of Transit in Creating Livable Metropolitan Communities, 1997.
61
KANE COUNTY RANDALL/ORCHARD ROAD CORRIDOR BRT FEASIBILITY STUDY
Funding for transit projects consists of both capital and ongoing operating and maintenance costs. Capital costs are typi-cally provided through a combination of federal and local sources, while operating costs are primarily a local responsibility. There is significant competition among projects for both federal and local capital funds, underscoring the importance of de-veloping a project design that maximizes benefits and fostering corridor land use patterns with strong ridership potential. There are opportunities for public-private partnerships, particularly for infrastruc-ture improvements supporting a transit project.
HOW ARE BRT PROJECTS FUNDED AND IMPLEMENTED?
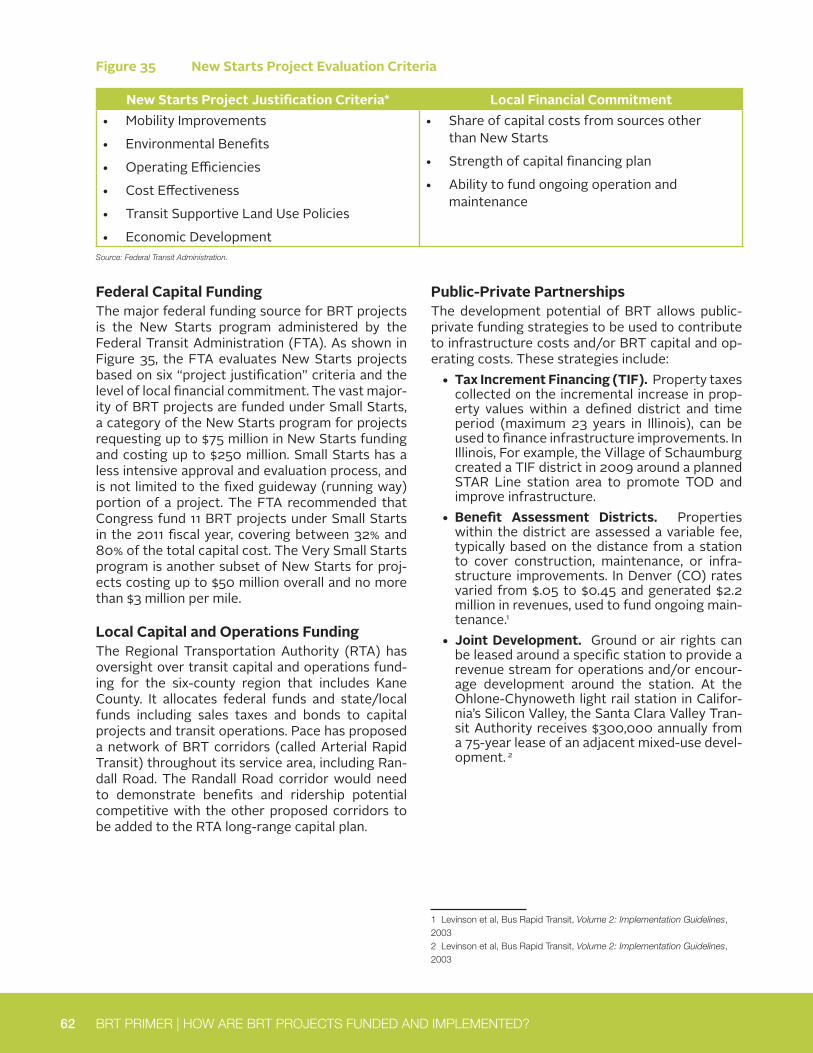
62 BRT PRIMER | HOW ARE BRT PROJECTS FUNDED AND IMPLEMENTED?
Federal Capital FundingThe major federal funding source for BRT projects is the New Starts program administered by the Federal Transit Administration (FTA). As shown in Figure 35, the FTA evaluates New Starts projects based on six “project justification” criteria and the level of local financial commitment. The vast major-ity of BRT projects are funded under Small Starts, a category of the New Starts program for projects requesting up to $75 million in New Starts funding and costing up to $250 million. Small Starts has a less intensive approval and evaluation process, and is not limited to the fixed guideway (running way) portion of a project. The FTA recommended that Congress fund 11 BRT projects under Small Starts in the 2011 fiscal year, covering between 32% and 80% of the total capital cost. The Very Small Starts program is another subset of New Starts for proj-ects costing up to $50 million overall and no more than $3 million per mile.
Local Capital and Operations FundingThe Regional Transportation Authority (RTA) has oversight over transit capital and operations fund-ing for the six-county region that includes Kane County. It allocates federal funds and state/local funds including sales taxes and bonds to capital projects and transit operations. Pace has proposed a network of BRT corridors (called Arterial Rapid Transit) throughout its service area, including Ran-dall Road. The Randall Road corridor would need to demonstrate benefits and ridership potential competitive with the other proposed corridors to be added to the RTA long-range capital plan.
Public-Private PartnershipsThe development potential of BRT allows public-private funding strategies to be used to contribute to infrastructure costs and/or BRT capital and op-erating costs. These strategies include:
• Tax Increment Financing (TIF). Property taxes collected on the incremental increase in prop-erty values within a defined district and time period (maximum 23 years in Illinois), can be used to finance infrastructure improvements. In Illinois, For example, the Village of Schaumburg created a TIF district in 2009 around a planned STAR Line station area to promote TOD and improve infrastructure.
• Benefit Assessment Districts. Properties within the district are assessed a variable fee, typically based on the distance from a station to cover construction, maintenance, or infra-structure improvements. In Denver (CO) rates varied from $.05 to $0.45 and generated $2.2 million in revenues, used to fund ongoing main-tenance.1
• Joint Development. Ground or air rights can be leased around a specific station to provide a revenue stream for operations and/or encour-age development around the station. At the Ohlone-Chynoweth light rail station in Califor-nia’s Silicon Valley, the Santa Clara Valley Tran-sit Authority receives $300,000 annually from a 75-year lease of an adjacent mixed-use devel-opment. 2
1 Levinson et al, Bus Rapid Transit, Volume 2: Implementation Guidelines, 20032 Levinson et al, Bus Rapid Transit, Volume 2: Implementation Guidelines, 2003
Figure 35 New Starts Project Evaluation Criteria
New Starts Project Justification Criteria* Local Financial Commitment• Mobility Improvements
• Environmental Benefits
• Operating Efficiencies
• Cost Effectiveness
• Transit Supportive Land Use Policies
• Economic Development
• Share of capital costs from sources other than New Starts
• Strength of capital financing plan
• Ability to fund ongoing operation and maintenance
Source: Federal Transit Administration.
63 RANDALL/ORCHARD ROAD CORRIDOR BRT FEASIBILITY STUDY
Land Use and Jurisdictional CoordinationLand use policy and economic incentives are need-ed to encourage the most intensive development around BRT station areas to assure successful implementation of a BRT project. Given the many jurisdictions along the Randall Road Corridor, all stakeholders must collaboratively identify shared land use and operating goals for the service. Station area land use planning must be consistent through-out the corridor as gaps in transit-supportive land uses at agreed upon development nodes can im-pact ridership and service quality. A key challenge that must be negotiated is the autonomous willing-ness to change zoning to allow for denser mixed use districts at station area nodes. Station area density and land use diversity are primary ridership generators and key strategies for ensuring success-ful BRT implementation. Land developers could be included in the process to identify opportunities for nodal development along the corridor.Applicable jurisdictions must develop a shared understanding regarding the land use policy and economic incentives to encourage the most inten-sive development around BRT station areas. Such incentives can be implemented through a transit overlay zoning district. Inter-jurisdictional agree-ments regarding a comprehensive transit overlay zoning district could facilitate the necessary land use and zoning changes to promote dense, mixed use station area development. This type of over-lay zoning district would expand upon land use and zoning regulation by stipulating parking man-agement strategies that promote transit-oriented development (i.e. eliminating minimum parking requirement), urban design guidelines (i.e. site de-sign, streetscape), and policies make the pedestri-an and bicycle environment more safe and inviting. All parties need to ensure that future development of commercial and residential centers and major employment hubs are located along the BRT line per an agreed upon vision for the corridor.
Project PhasingThe flexibility of BRT systems allows them to be built in phases. The following are several possible phasing approaches that can be employed in BRT projects generally Because there is no existing transit service on a large portion of the Randall/Or-chard corridor, not all phasing options make sense in this case (e.g. vehicles)3: Project phases can add specific BRT elements as needed or afforded in-cluding:
• Changing from a mixed to dedicated running way in parts of the corridor
• Extending the transit corridor• Providing transit signal priority at congested in-
tersections• Adding branches to both extend the corridor
and increase service frequency along the core of the corridor
• Increasing the hours of service and/or the days of service
• Providing specialized BRT vehicles
3 Levinson et al, Bus Rapid Transit, Volume 2: Implementation Guidelines, 2003

65
KANE COUNTY RANDALL/ORCHARD ROAD CORRIDOR BRT FEASIBILITY STUDY
REFERENCES
66 BRT PRIMER | REFERENCES
References
Behee, Roland (2010). Interview with Community Transit Project Manager.
Bus Rapid Transit Policy Center Website, Accessed August 11, 2010, http://www.gobrt.org/funding3.html
Cambridge Systematics (1999). Public Transportation and the Nation’s Economy: A Quantitative Analysis of Public Transportation’s Economic Impact. Retrieved from http://www.camsys.com/pubs/publictransp_nationseconomy.pdf
Cervero, Robert and GB Arrington (2008), Effects of TOD on Housing, Parking, and Travel. Transportation Research Board, TCRP Report 128.
Chester, M. Life-cycle Environmental Inventory of Passenger Transportation in the United States. Disserta-tion, 8/1/2008.
City of Lynnwood (2008). Highway 99 Corridor Study Adopted Strategies.
Dill, Jennifer (2004). Measuring Network Connectivity for Bicycling and Walking. Presented at Transporta-tion Research Board Annual Meeting, 2004.
Federal Transit Administration (2003). Evaluation of Port Authority of Allegheny County’s West Busway Bus Rapid Transit Project. National Bus Rapid Transit Institute, Project No. FTA-PA-26-7010-03.1.
Federal Transit Administration (2005). Boston Silver Line Washington Street Bus Rapid Transit (BRT) Dem-onstration Project Evaluation. National Bus Rapid Transit Institute, Project No: FTA-VA-26-7222-2005.2.
Federal Transit Administration (2009). Characteristics of Bus Rapid Transit for Decision-Making. Project No. FTA-FL-26-7109.2009.1.
Federal Transit Administration (2009). The EmX Franklin Corridor BRT Project Evaluation. National Bus Rapid Transit Institute, FTA-FL-26-7109.2009.2
Frank, Lawrence D., James Chapman, Mark Bradley, and T. Keith Lawton (2005). Travel Behavior, Emissions & Land Use Correlation Analysis in the Central Puget Sound. Prepared for the Washington State Transpor-tation Commission, http://www.wsdot.wa.gov/research/reports/fullreports/625.1.pdf
Greater Cleveland Regional Transit Authority (2004). Transit 2025 Long Range Plan. http://www.riderta.com/pdf/transit2025/Transit_2025_March_2006_Final_contents_exec.pdf
Greater Cleveland Regional Transit Authority HealthLine Website. Accessed August 5, 2010, http://www.rtahealthline.com/project-overview.asp
Henke, Chris (2007) BRT Branding and Image. APTA Bus and Paratransit Conference presentation.
Hess, Daniel Baldwin and Alex Bitterman (2008). “Bus Rapid Transit Identity: An Overview of Current “Branding” Practice”. Journal of Public Transportation 11(2), pp. 19 – 42.
Litman, Todd (2007). Transit Price Elasticities and Cross-Elasticities. Victoria Transport Policy Institute, http://www.vtpi.org/tranelas.pdf
Litman, Todd (2009). “Public Transportation and Health” in Healthy, Equitable Transportation Policy, Poli-cyLink, Prevention Institute, and Convergence Partnership.
67 RANDALL/ORCHARD ROAD CORRIDOR BRT FEASIBILITY STUDY
Los Angeles County Metropolitan Transportation Authority Website, Accessed August 11, 2010, http://www.metro.net/project/measurer/measurer_funding/
Mejias, L., & Deakin, E. (2005). Redevelopment and Revitalization Along Urban Arterials: Case Study of San Pablo Avenue, California, from the Developers’ Perspective. Transportation Research Record: Journal of the Transportation Research Board No. 1902 , pp. 26-34.
Moudon, Anne Vernez, Paul Hess, Mary Catherine Snyder, and Kiril Stanilov (1997). “Effects of Site Design on Pedestrian Travel in Mixed-Use, Medium-Density Environments.” Transportation Research Record. Vol. 1578, pp. 48–55, http://www.wsdot.wa.gov/research/reports/fullreports/432.1.pdf.
National Bus Rapid Transit Institute (2006). Vehicle Catalog: A Compendium of Vehicles and Powertrain Systems for Bus Rapid Transit Service. http://www.nbrti.org/docs/pdf/2006_brt_compendium.pdf
Nikolic, Sara, Dan Bertolet, Peter Dane, David Cutler, Don Vehige, Time Trohimovich, and Bill LaBorde (2009). Transit-Oritented Communities: A Blueprint for Washington State. Futurewise, October 2009.
Niles, John and Lisa Callaghan Jerram (2010). From Buses to BRT: Case Studies of Incremental BRT Proj-ects in North America. Mineta Transportation Institute, San Jose State University.
Perk, V. A., & Catalá, M. (2009). Land Use Impacts of Bus Rapid Transit: Effects of BRT Station Proximity on Property Values along the Pittsburgh Martin Luther King, Jr. East Busway. National BRT Institute. Federal Transit Administration.
Port Authority of Allegheny County (2006). 20/20 Regional Strategic Transit Visioning Study: TOD Toolbox.
Reconnecting America (2009). Street Smart: Streetcars and Cities in the Twenty-First Century.
Rodriquez, D., & Targa, F. (2003). The Value of Accessibility to Bogotá’s Bus Rapid Transit System. Chapel Hill: Department of Civil and Environmental Engineering, University of North Carolina.
Transportation Research Board (2007). Bus Rapid Transit Practitioner’s Guide, TCRP Report 118.
Transportation Research Board (2003). Bus Rapid Transit Volume 1: Case Studies in Bus Rapid Transit, TCRP Report 90.
Transportation Research Board (2003). Bus Rapid Transit Volume 2: Implementation Guidelines, TCRP Report 90.
Transportation Research Board (2009). Transit Capacity and Quality of Service Manual, 2nd Edition. TCRP Report 100.
Vincent, William and Lisa Callaghan Jerram (2006). “The Potential for BRT to Reduce Transportation-Related CO2 Emissions”, Journal of Public Transportation, 2006 BRT Special Edition.
Vincent, William and Lisa Callaghan (2007). A Preliminary Evaluation of the Metro Orange Line Bus Rapid Transit Project. Breakthrough Technologies Institute.
Zimmerman, Samuel L. and Herbert Levinson (2004). “Vehicle Selection for BRT: Issues snd Options”. Journal of Public Transportation 7(1), pp. 83 – 103.

A-1
KANE COUNTY LONG RANGE TRANSIT PLAN
APPENDIX A:LIST OF ACRONYMS
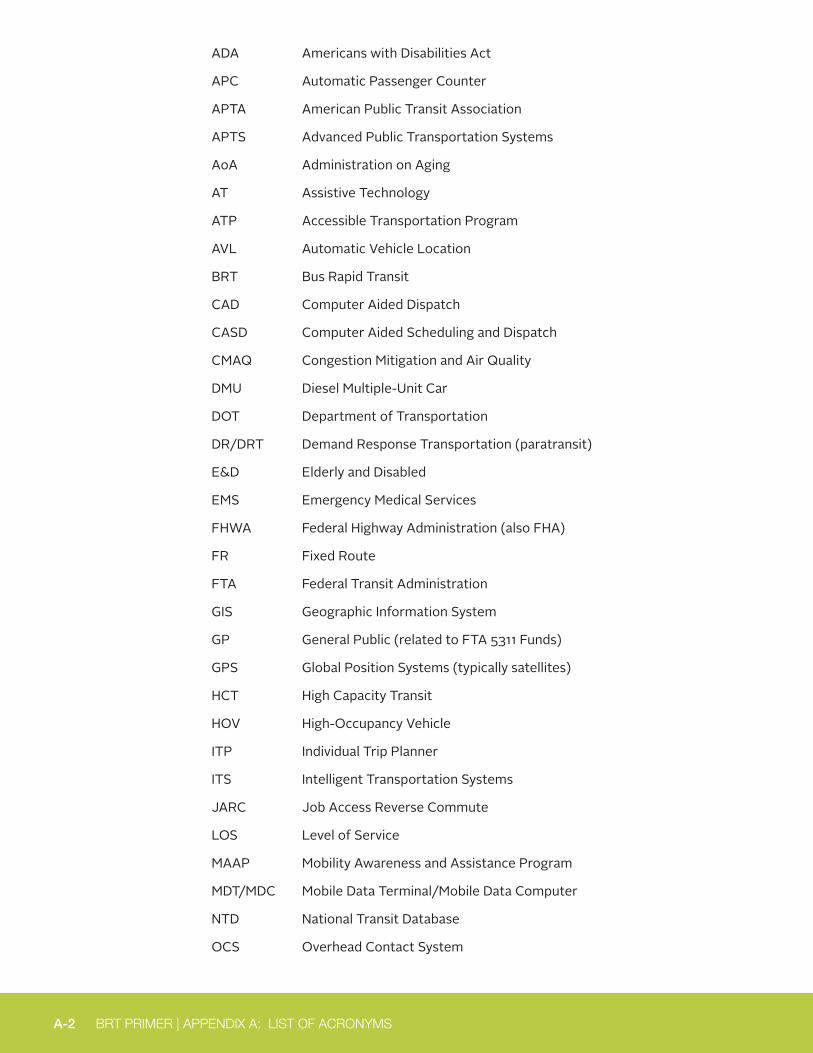
A-2 BRT PRIMER | APPENDIX A: LIST OF ACRONYMS
ADA Americans with Disabilities Act
APC Automatic Passenger Counter
APTA American Public Transit Association
APTS Advanced Public Transportation Systems
AoA Administration on Aging
AT Assistive Technology
ATP Accessible Transportation Program
AVL Automatic Vehicle Location
BRT Bus Rapid Transit
CAD Computer Aided Dispatch
CASD Computer Aided Scheduling and Dispatch
CMAQ Congestion Mitigation and Air Quality
DMU Diesel Multiple-Unit Car
DOT Department of Transportation
DR/DRT Demand Response Transportation (paratransit)
E&D Elderly and Disabled
EMS Emergency Medical Services
FHWA Federal Highway Administration (also FHA)
FR Fixed Route
FTA Federal Transit Administration
GIS Geographic Information System
GP General Public (related to FTA 5311 Funds)
GPS Global Position Systems (typically satellites)
HCT High Capacity Transit
HOV High-Occupancy Vehicle
ITP Individual Trip Planner
ITS Intelligent Transportation Systems
JARC Job Access Reverse Commute
LOS Level of Service
MAAP Mobility Awareness and Assistance Program
MDT/MDC Mobile Data Terminal/Mobile Data Computer
NTD National Transit Database
OCS Overhead Contact System
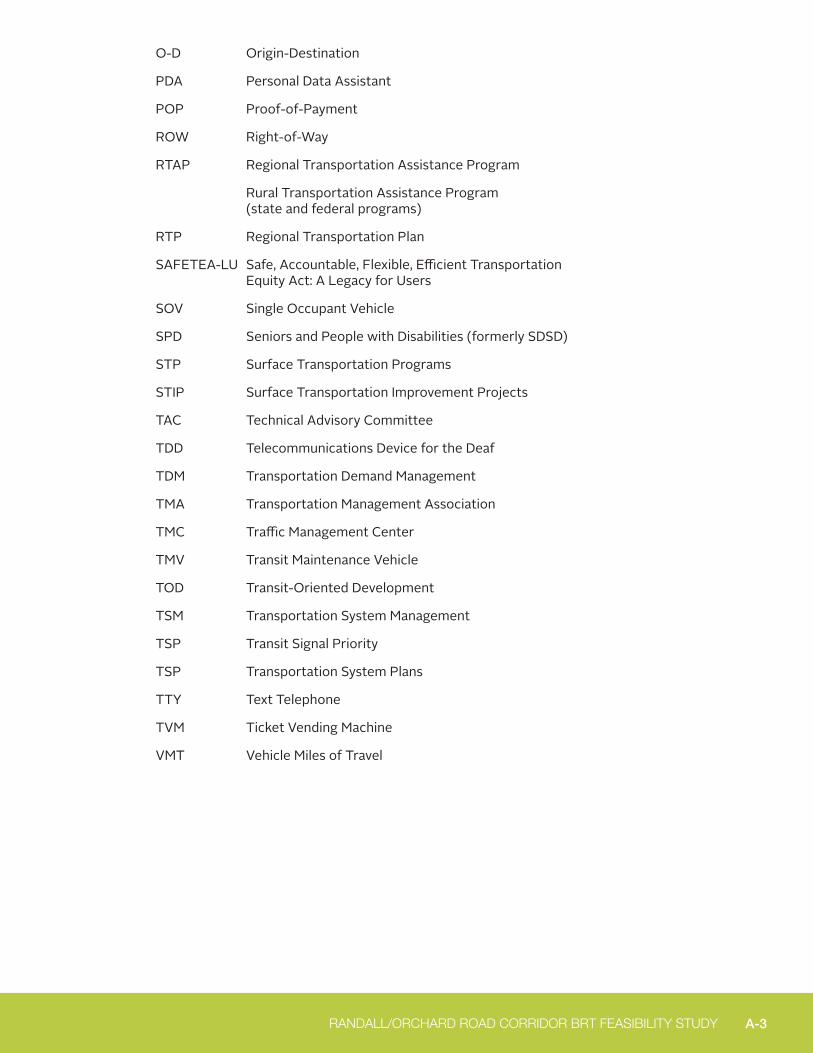
A-3 RANDALL/ORCHARD ROAD CORRIDOR BRT FEASIBILITY STUDY
ADA Americans with Disabilities Act
APC Automatic Passenger Counter
APTA American Public Transit Association
APTS Advanced Public Transportation Systems
AoA Administration on Aging
AT Assistive Technology
ATP Accessible Transportation Program
AVL Automatic Vehicle Location
BRT Bus Rapid Transit
CAD Computer Aided Dispatch
CASD Computer Aided Scheduling and Dispatch
CMAQ Congestion Mitigation and Air Quality
DMU Diesel Multiple-Unit Car
DOT Department of Transportation
DR/DRT Demand Response Transportation (paratransit)
E&D Elderly and Disabled
EMS Emergency Medical Services
FHWA Federal Highway Administration (also FHA)
FR Fixed Route
FTA Federal Transit Administration
GIS Geographic Information System
GP General Public (related to FTA 5311 Funds)
GPS Global Position Systems (typically satellites)
HCT High Capacity Transit
HOV High-Occupancy Vehicle
ITP Individual Trip Planner
ITS Intelligent Transportation Systems
JARC Job Access Reverse Commute
LOS Level of Service
MAAP Mobility Awareness and Assistance Program
MDT/MDC Mobile Data Terminal/Mobile Data Computer
NTD National Transit Database
OCS Overhead Contact System
O-D Origin-Destination
PDA Personal Data Assistant
POP Proof-of-Payment
ROW Right-of-Way
RTAP Regional Transportation Assistance Program
Rural Transportation Assistance Program (state and federal programs)
RTP Regional Transportation Plan
SAFETEA-LU Safe, Accountable, Flexible, Efficient Transportation Equity Act: A Legacy for Users
SOV Single Occupant Vehicle
SPD Seniors and People with Disabilities (formerly SDSD)
STP Surface Transportation Programs
STIP Surface Transportation Improvement Projects
TAC Technical Advisory Committee
TDD Telecommunications Device for the Deaf
TDM Transportation Demand Management
TMA Transportation Management Association
TMC Traffic Management Center
TMV Transit Maintenance Vehicle
TOD Transit-Oriented Development
TSM Transportation System Management
TSP Transit Signal Priority
TSP Transportation System Plans
TTY Text Telephone
TVM Ticket Vending Machine
VMT Vehicle Miles of Travel

B-1
KANE COUNTY LONG RANGE TRANSIT PLAN
APPENDIX B:GLOSSARY
B-2 BRT PRIMER | APPENDIX B: GLOSSARY
Accessibility The extent to which facilities, including transit vehicles, are barrier-free and can be used by people who have disabilities, including wheelchair users.
Accessible Vehicle Public transportation revenue vehicles which do not restrict access, are usable, and provide allocated space and/or priority seating for individuals who use wheelchairs.
Administrative assistance Funding that supports the administrative costs related to a program activity, such as office expenses, insurance, legal expenses, bookkeeping, and administrative staff expenses.
ADA Americans with Disabilities Act: Passed by the Congress in 1990, this act mandates equal opportunities for persons with disabilities in the areas of employment, transportation, communications and public accommodations. Under this Act, most transportation providers are obliged to purchase lift-equipped vehicles for their fixed-route services and must assure system-wide accessibility of their demand-responsive services to persons with disabilities. Public transit providers also must supplement their fixed-route services with paratransit services for those persons unable to use fixed-route service because of their disability.
ADA Eligible ADA Eligible refers to eligibility for complementary fixed route paratransit. Individuals who qualify must be unable to used fixed route due to a disability.
AoA Administration on Aging. The agency within the U.S. Department of Health and Human Services that oversees the implementation of the Older Americans Act, including senior nutrition programs, senior centers and supportive services for elders.
Ad-hoc Trips The total number of trip requests received by an organization that go beyond the organization’s normal transportation program design and fulfilled by a different agency, company, or organization (i.e., by a private taxi service).
Advanced Public Transportation Systems
Collection of technologies to increase efficiency of public transportation systems and offer users greater access to information on system operation. This is a subset of Intelligent Transportation Systems.
Advanced Traveler Information Systems
Technologies that provide travelers and transportation professionals with the information they need to make decisions, from daily individual travel decisions to larger-scale decisions that affect the entire system, such as those concerning incident management.
Alight To get off or out of a transportation vehicle. Alternative Fuel A non-petroleum fuel with lower pollution than traditional diesel;
includes electricity, alcohol fuels, mineral fuels, biofuels, methanol, propane, hydrogen, compressed and liquefied natural gas.
Annual Average Daily Traffic (AADT)
Daily traffic that is averaged over a calendar or fiscal year.
B-3 RANDALL/ORCHARD ROAD CORRIDOR BRT FEASIBILITY STUDY
Articulated Bus An extra-long, high-capacity bus that has the rear body section or sections flexibly but permanently connected to the forward section. The arrangement allows the vehicle to bend in curves and yet have no interior barrier to movement between the two parts. The puller type features a powered center axle while the pusher type features a powered rear axle. Articulated buses with powered center and rear axles exist but are not common. Typically, an articulated bus is 54-60 ft (16-18 m) long with a passenger seating capacity of 60 to 80 and a total capacity of 100 to 140.
Automatic Passenger Counter
An automated system that counts the number of passengers boarding and alighting a transit vehicle. The information may be used for later data analysis, or for real-time activities, such as providing signal priority only to buses that are at least half full.
Automatic Vehicle Location System
A system that determines the location of vehicles carrying special electronic equipment that communicates a signal back to a central control facility. AVLs are used for detecting irregularity in service and are often combined with a computer-aided dispatch system.
Average Daily Traffic (ADT) The average number of vehicles that pass a specified point during a 24-hour period.
Average Fare The arithmetic average of all fares paid by all revenue passengers, including those who received special or reduced fares. It is usually derived by or generally equivalent to dividing total fare revenue by total origin-to-destination trips, although it may be based on unlinked trips.
Average Trip Length The average distance ridden for an unlinked passenger trip by time period (weekday, Saturday, Sunday) computed as passenger miles divided by unlinked passenger trips.
Base Fare The price charged to one adult for one transit ride; excludes transfer charges, zone charges, express service charges, peak period surcharges, and reduced fares
Base Period In transit, the time of day during which vehicle requirements and schedules are not influenced by peak-period passenger volume demands (e.g., between morning and afternoon peak periods). At this time, transit riding is fairly constant and usually moderate in volume when compared with peak-period travel. Also known as off peak.
Bicycle-Friendly Characterized by features and elements that makes bicycling safe and convenient. A bicycle-friendly environment at a transit stop might include bicycle parking that is well-lit, sheltered, secure, and easily accessed.
Bicycle Locker A lockable, enclosed container used for storing a bicycle. Typically provided at major transit stops and stations and rented on a monthly basis.
Bicycle Rack A fixed post or framework to which bicycles may be secured and locked, typically provided on a first-come, first-served basis. It is also a device mounted to a transit vehicle that allows bicycles to be transported outside the passenger compartment.
Boarding Rides Boarding rides are counted each time a person enters a vehicle. Boardings and rides all refer to boarding rides.
Boarding Rides per Vehicle Hour
The number of boardings divided by the vehicle hours of service. Describes a route’s productivity.
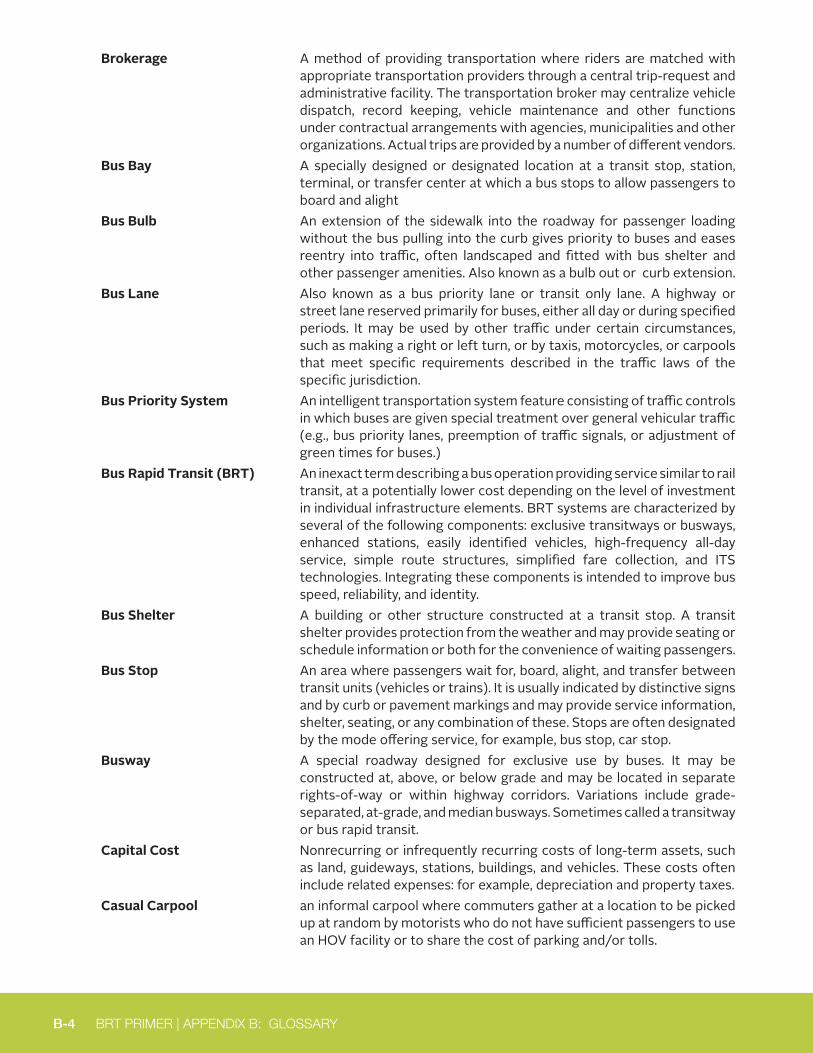
B-4 BRT PRIMER | APPENDIX B: GLOSSARY
Brokerage A method of providing transportation where riders are matched with appropriate transportation providers through a central trip-request and administrative facility. The transportation broker may centralize vehicle dispatch, record keeping, vehicle maintenance and other functions under contractual arrangements with agencies, municipalities and other organizations. Actual trips are provided by a number of different vendors.
Bus Bay A specially designed or designated location at a transit stop, station, terminal, or transfer center at which a bus stops to allow passengers to board and alight
Bus Bulb An extension of the sidewalk into the roadway for passenger loading without the bus pulling into the curb gives priority to buses and eases reentry into traffic, often landscaped and fitted with bus shelter and other passenger amenities. Also known as a bulb out or curb extension.
Bus Lane Also known as a bus priority lane or transit only lane. A highway or street lane reserved primarily for buses, either all day or during specified periods. It may be used by other traffic under certain circumstances, such as making a right or left turn, or by taxis, motorcycles, or carpools that meet specific requirements described in the traffic laws of the specific jurisdiction.
Bus Priority System An intelligent transportation system feature consisting of traffic controls in which buses are given special treatment over general vehicular traffic (e.g., bus priority lanes, preemption of traffic signals, or adjustment of green times for buses.)
Bus Rapid Transit (BRT) An inexact term describing a bus operation providing service similar to rail transit, at a potentially lower cost depending on the level of investment in individual infrastructure elements. BRT systems are characterized by several of the following components: exclusive transitways or busways, enhanced stations, easily identified vehicles, high-frequency all-day service, simple route structures, simplified fare collection, and ITS technologies. Integrating these components is intended to improve bus speed, reliability, and identity.
Bus Shelter A building or other structure constructed at a transit stop. A transit shelter provides protection from the weather and may provide seating or schedule information or both for the convenience of waiting passengers.
Bus Stop An area where passengers wait for, board, alight, and transfer between transit units (vehicles or trains). It is usually indicated by distinctive signs and by curb or pavement markings and may provide service information, shelter, seating, or any combination of these. Stops are often designated by the mode offering service, for example, bus stop, car stop.
Busway A special roadway designed for exclusive use by buses. It may be constructed at, above, or below grade and may be located in separate rights-of-way or within highway corridors. Variations include grade-separated, at-grade, and median busways. Sometimes called a transitway or bus rapid transit.
Capital Cost Nonrecurring or infrequently recurring costs of long-term assets, such as land, guideways, stations, buildings, and vehicles. These costs often include related expenses: for example, depreciation and property taxes.
Casual Carpool an informal carpool where commuters gather at a location to be picked up at random by motorists who do not have sufficient passengers to use an HOV facility or to share the cost of parking and/or tolls.
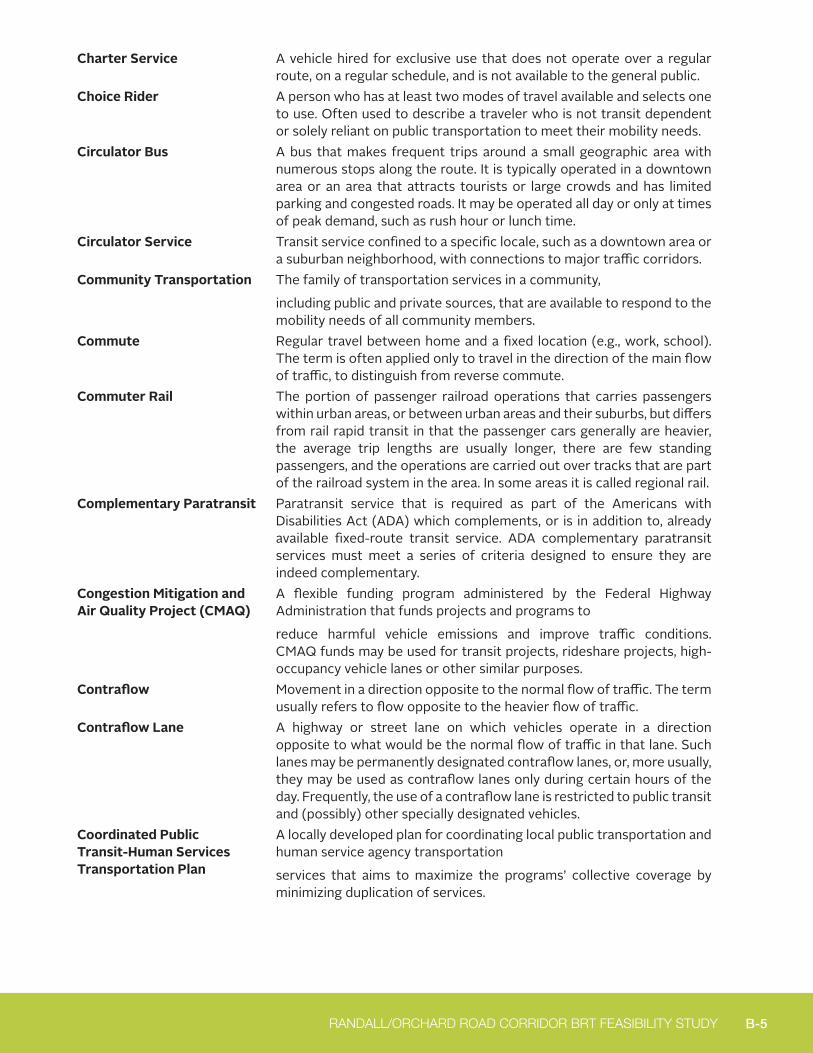
B-5 RANDALL/ORCHARD ROAD CORRIDOR BRT FEASIBILITY STUDY
Charter Service A vehicle hired for exclusive use that does not operate over a regular route, on a regular schedule, and is not available to the general public.
Choice Rider A person who has at least two modes of travel available and selects one to use. Often used to describe a traveler who is not transit dependent or solely reliant on public transportation to meet their mobility needs.
Circulator Bus A bus that makes frequent trips around a small geographic area with numerous stops along the route. It is typically operated in a downtown area or an area that attracts tourists or large crowds and has limited parking and congested roads. It may be operated all day or only at times of peak demand, such as rush hour or lunch time.
Circulator Service Transit service confined to a specific locale, such as a downtown area or a suburban neighborhood, with connections to major traffic corridors.
Community Transportation The family of transportation services in a community,
including public and private sources, that are available to respond to the mobility needs of all community members.
Commute Regular travel between home and a fixed location (e.g., work, school). The term is often applied only to travel in the direction of the main flow of traffic, to distinguish from reverse commute.
Commuter Rail The portion of passenger railroad operations that carries passengers within urban areas, or between urban areas and their suburbs, but differs from rail rapid transit in that the passenger cars generally are heavier, the average trip lengths are usually longer, there are few standing passengers, and the operations are carried out over tracks that are part of the railroad system in the area. In some areas it is called regional rail.
Complementary Paratransit Paratransit service that is required as part of the Americans with Disabilities Act (ADA) which complements, or is in addition to, already available fixed-route transit service. ADA complementary paratransit services must meet a series of criteria designed to ensure they are indeed complementary.
Congestion Mitigation and Air Quality Project (CMAQ)
A flexible funding program administered by the Federal Highway Administration that funds projects and programs to
reduce harmful vehicle emissions and improve traffic conditions. CMAQ funds may be used for transit projects, rideshare projects, high-occupancy vehicle lanes or other similar purposes.
Contraflow Movement in a direction opposite to the normal flow of traffic. The term usually refers to flow opposite to the heavier flow of traffic.
Contraflow Lane A highway or street lane on which vehicles operate in a direction opposite to what would be the normal flow of traffic in that lane. Such lanes may be permanently designated contraflow lanes, or, more usually, they may be used as contraflow lanes only during certain hours of the day. Frequently, the use of a contraflow lane is restricted to public transit and (possibly) other specially designated vehicles.
Coordinated Public Transit-Human Services Transportation Plan
A locally developed plan for coordinating local public transportation and human service agency transportation
services that aims to maximize the programs’ collective coverage by minimizing duplication of services.
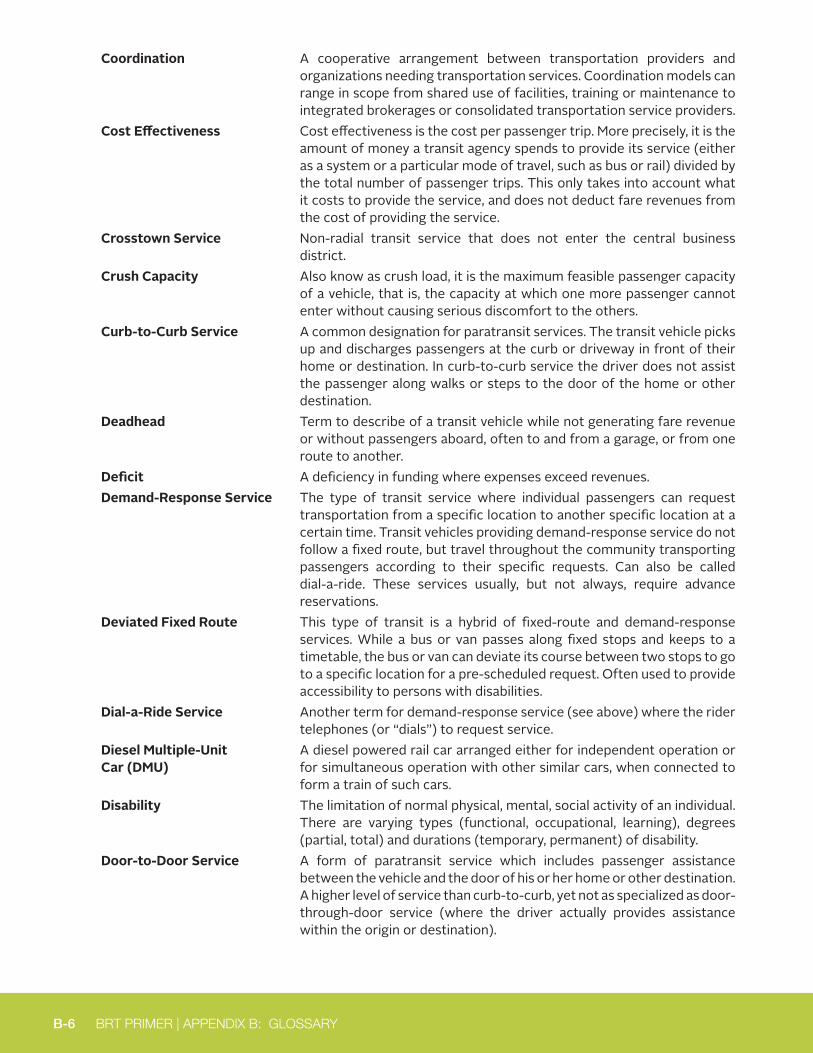
B-6 BRT PRIMER | APPENDIX B: GLOSSARY
Coordination A cooperative arrangement between transportation providers and organizations needing transportation services. Coordination models can range in scope from shared use of facilities, training or maintenance to integrated brokerages or consolidated transportation service providers.
Cost Effectiveness Cost effectiveness is the cost per passenger trip. More precisely, it is the amount of money a transit agency spends to provide its service (either as a system or a particular mode of travel, such as bus or rail) divided by the total number of passenger trips. This only takes into account what it costs to provide the service, and does not deduct fare revenues from the cost of providing the service.
Crosstown Service Non-radial transit service that does not enter the central business district.
Crush Capacity Also know as crush load, it is the maximum feasible passenger capacity of a vehicle, that is, the capacity at which one more passenger cannot enter without causing serious discomfort to the others.
Curb-to-Curb Service A common designation for paratransit services. The transit vehicle picks up and discharges passengers at the curb or driveway in front of their home or destination. In curb-to-curb service the driver does not assist the passenger along walks or steps to the door of the home or other destination.
Deadhead Term to describe of a transit vehicle while not generating fare revenue or without passengers aboard, often to and from a garage, or from one route to another.
Deficit A deficiency in funding where expenses exceed revenues.Demand-Response Service The type of transit service where individual passengers can request
transportation from a specific location to another specific location at a certain time. Transit vehicles providing demand-response service do not follow a fixed route, but travel throughout the community transporting passengers according to their specific requests. Can also be called dial-a-ride. These services usually, but not always, require advance reservations.
Deviated Fixed Route This type of transit is a hybrid of fixed-route and demand-response services. While a bus or van passes along fixed stops and keeps to a timetable, the bus or van can deviate its course between two stops to go to a specific location for a pre-scheduled request. Often used to provide accessibility to persons with disabilities.
Dial-a-Ride Service Another term for demand-response service (see above) where the rider telephones (or “dials”) to request service.
Diesel Multiple-Unit Car (DMU)
A diesel powered rail car arranged either for independent operation or for simultaneous operation with other similar cars, when connected to form a train of such cars.
Disability The limitation of normal physical, mental, social activity of an individual. There are varying types (functional, occupational, learning), degrees (partial, total) and durations (temporary, permanent) of disability.
Door-to-Door Service A form of paratransit service which includes passenger assistance between the vehicle and the door of his or her home or other destination. A higher level of service than curb-to-curb, yet not as specialized as door-through-door service (where the driver actually provides assistance within the origin or destination).

B-7 RANDALL/ORCHARD ROAD CORRIDOR BRT FEASIBILITY STUDY
Dwell Time The time a transit unit (vehicle or train) spends at a station or stop, measured as the interval between its stopping and starting.
Elasticity The percentage change in demand for service (demand) for each 1% change in another factor. Often used to characterize sensitivities to changes in fares or level of service (i.e. frequency, service span).
Exclusive Right-of-Way Roadway or other right-of-way reserved at all times for transit use and/or other high occupancy vehicles.
Express Bus Service Bus service with a limited number of stops, either from a collector area directly to a specific destination or in a particular corridor with stops en route at major transfer points or activity centers. Express bus service usually uses freeways or busways where they are available.
Express Service Service that has fewer stops and a higher operating speed than regular service. Often used an alternative term for limited-stop service; when agencies provide both types of service, the express service tends to have much longer sections of non-stop running.
Farebox A device that accepts coins, bills, tickets, tokens, or other fare media given by passengers as payment for rides.
Farebox Recovery Ratio The ratio of fare revenue to direct operating expenses. Farebox Revenue A public transportation term for the monies or tickets collected as
payments for rides. Can be cash, tickets, tokens, transfers and pass receipts. Fare box revenues rarely cover even half of a transit system’s operating expenses.
Far-side Stop A transit stop located beyond an intersection. It requires that transit units (vehicles or trains) cross the intersection before stopping to serve passengers.
Federal Highway Administration (FHWA)
A component of the U.S. Department of Transportation that is responsible for ensuring that America’s roads and highways are safe and technologically up-to-date. Although State, local, and tribal governments own most of the Nation’s highways, the FHWA provides financial and technical support to them for constructing, improving, and preserving America’s highway system. The FHWA’s annual
budget of more than $30 billion is funded by fuel and motor vehicle excise taxes. FWHA is the lead agency in federal intelligent transportation (ITS) activities and regulated interstate transportation. In addition to ITS, funds under FHWA’s Congestion Mitigation and Air Quality Improvement (CMAQ) Program, Surface Transportation Program (STP), and Federal Lands Highways Program can be used for a variety of transit activities.
Federal Transit Administration
A component of the U.S. Department of Transportation that administers federal funding to support a variety of locally planned, constructed, and operated public transportation systems throughout the U.S., including buses, subways, light rail, commuter rail, streetcars, monorail, passenger ferry boats, inclined railways, and people movers. FTA provides financial assistance for capital, operating and planning costs of these public transportation systems. It also sponsors research, training, technical assistance and demonstration programs. Up to 1991 the FTA was known as the Urban Mass Transportation Administration.
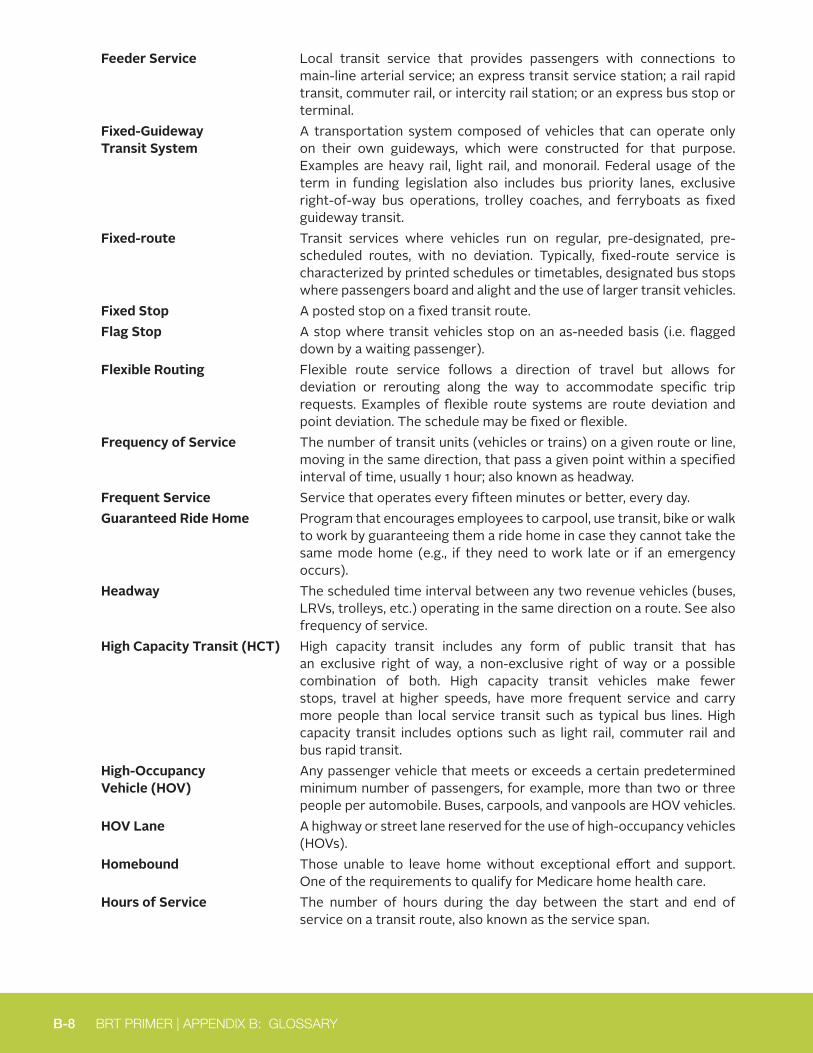
B-8 BRT PRIMER | APPENDIX B: GLOSSARY
Feeder Service Local transit service that provides passengers with connections to main-line arterial service; an express transit service station; a rail rapid transit, commuter rail, or intercity rail station; or an express bus stop or terminal.
Fixed-Guideway Transit System
A transportation system composed of vehicles that can operate only on their own guideways, which were constructed for that purpose. Examples are heavy rail, light rail, and monorail. Federal usage of the term in funding legislation also includes bus priority lanes, exclusive right-of-way bus operations, trolley coaches, and ferryboats as fixed guideway transit.
Fixed-route Transit services where vehicles run on regular, pre-designated, pre-scheduled routes, with no deviation. Typically, fixed-route service is characterized by printed schedules or timetables, designated bus stops where passengers board and alight and the use of larger transit vehicles.
Fixed Stop A posted stop on a fixed transit route.Flag Stop A stop where transit vehicles stop on an as-needed basis (i.e. flagged
down by a waiting passenger). Flexible Routing Flexible route service follows a direction of travel but allows for
deviation or rerouting along the way to accommodate specific trip requests. Examples of flexible route systems are route deviation and point deviation. The schedule may be fixed or flexible.
Frequency of Service The number of transit units (vehicles or trains) on a given route or line, moving in the same direction, that pass a given point within a specified interval of time, usually 1 hour; also known as headway.
Frequent Service Service that operates every fifteen minutes or better, every day. Guaranteed Ride Home Program that encourages employees to carpool, use transit, bike or walk
to work by guaranteeing them a ride home in case they cannot take the same mode home (e.g., if they need to work late or if an emergency occurs).
Headway The scheduled time interval between any two revenue vehicles (buses, LRVs, trolleys, etc.) operating in the same direction on a route. See also frequency of service.
High Capacity Transit (HCT) High capacity transit includes any form of public transit that has an exclusive right of way, a non-exclusive right of way or a possible combination of both. High capacity transit vehicles make fewer stops, travel at higher speeds, have more frequent service and carry more people than local service transit such as typical bus lines. High capacity transit includes options such as light rail, commuter rail and bus rapid transit.
High-Occupancy Vehicle (HOV)
Any passenger vehicle that meets or exceeds a certain predetermined minimum number of passengers, for example, more than two or three people per automobile. Buses, carpools, and vanpools are HOV vehicles.
HOV Lane A highway or street lane reserved for the use of high-occupancy vehicles (HOVs).
Homebound Those unable to leave home without exceptional effort and support. One of the requirements to qualify for Medicare home health care.
Hours of Service The number of hours during the day between the start and end of service on a transit route, also known as the service span.
B-9 RANDALL/ORCHARD ROAD CORRIDOR BRT FEASIBILITY STUDY
HOV Lane Management National ITS Architecture Market Package that manages HOV lanes by coordinating freeway ramp meters and connector signals with HOV lane usage signals. Preferential treatment is given to HOV lanes using special bypasses, reserved lanes, and exclusive rights-of-way that may vary by time of day.
Hub-and Spoke System Type of route structure based on timed connections that increases connectivity and productivity. Usually consists of a central transfer node with routes that radiate from it. See also Timed Transfer System.
Human Services Transportation
Transportation for clients of a specific human or social
service agency that is usually limited to a specific trip purpose. Human service agency trips are often provided under contract to a human service agency and may be provided exclusively or rideshared with other human service agencies or general public service.
Independent Living Facility Rental units in which services are not included as part of the rent, although services may available on site and purchased by residents for a fee.
Inspector See Route Supervisor.Intelligent Transportation Systems (ITS)
Technology, information management and communications systems that improve the efficiency or safety of a surface transportation system.
Intercity Bus A large bus with luggage space, used primarily for transportation between cities. It usually has reclining seats and restroom facilities.
Intercity Transportation Long distance service provided between cities, often as part of a large network of intercity bus operators. Both express and local bus service may be provided.
Interline Transfer of transit vehicles or trains between routes during a day to improve staff or vehicle assignment efficiency.
Intermodal The ability to connect, and make connections between, modes of transportation.
Intermodal Transfer Facility A transit stop or station at the meeting point of several routes or lines or of different modes of transportation. It is located on or off the street and is designed to handle the movement of transit units (vehicles or trains) and the boarding, alighting, and transferring of passengers between different modes (also known as a modal interchange center).
JARC (Jobs Access Reverse Commute)
Federal formula funds available to provide transportation to assist low income individuals get to work. See Section 5316.
Jitney A transit mode comprising passenger cars or vans operating on fixed routes (sometimes with minor deviations) as demand warrants without fixed schedules or fixed stops.
Jitney Service A route deviation service in which small or medium-sized vehicles, such as large automobiles, vans, or minibuses, are used. The vehicles are usually owned by the drivers and the service is often independently operated.
Kiss-and-Ride An access mode to transit whereby passengers (usually commuters) are driven to a transit stop and left to board a transit unit and then met after their return trip. Transit stations, usually rail, often provide a designated area for dropping off and picking up such passengers.
Layover Time built into a schedule between arrivals and departures, used for the recovery of delays and preparation for the return trip. The term may refer to transit units (also known as vehicle layover) or operators.
B-10 BRT PRIMER | APPENDIX B: GLOSSARY
Level of Assistance Level of assistance given to passengers who need help boarding or exiting transit or agency vehicles, especially paratransit vehicles. Assistance can be curb-to-curb, meaning the passenger is not given assistance to and from the door of their destination; door-to-door, meaning the passenger is assisted from the door of their residence to the door of their destination; or door-through-door, meaning the passenger is assisted out of their home to the vehicle, and from the vehicle into their destination.
Level of Service (LOS) A designated range of values for a particular transit service measure (e.g., “A” through “F” or “1” through “8”), based on users’ perceptions of the quality and amount of service.
Light Rail (LRT) A metropolitan electric railway system characterized by its ability to operate single cars or short trains along exclusive rights-of-way at ground level, on aerial structures, in subways, or occasionally, in streets, and to board and discharge passengers at track or car floor level.
Linked Trip A trip from the point of origin to the final destination, regardless of the number of modes or vehicles (transfers) used.
Load Factor The ratio of passengers actually carried versus the total passenger capacity of a vehicle; also known as a utilization coefficient.
Loading Island A protected spot for the loading and unloading of passengers. It may be located within a rail transit or bus station.
Local Bus Service Transit service that involves frequent stops and consequent low average speeds, the purpose of which is to deliver and pick up transit passengers close to their destinations or origins.
Low-Floor Bus A bus without steps at entrances and exit. The low floor may extend throughout the bus or may use a ramp or steps to access the raised rear portion over a conventional axle and drive train. Wheelchair access is provided by a retracting ramp.
Match State or local funds required by various federal or state programs to complement funds for a project. A match may also be required by states in funding projects, which are joint state/local efforts. Some funding sources allow services, such as the work of volunteers, to be counted as an in-kind funding match. Federal programs normally require that match funds come from other than federal sources.
Medicaid Also known as Medical Assistance, this is a health care program for low-income and other medically needy persons. It is jointly funded by state and federal governments. The Medicaid program pays for transportation to non-emergency medical appointments if the recipient has no other means to travel to the appointment.
Missed Trip A missed trip occurs when a paratransit driver fails to pick up a scheduled trip at the assigned pick-up location and time.
Mode A transport category characterized by specific right-of-way, technological and operational features. A particular form of travel, for example, walking, traveling by automobile, traveling by bus, traveling by train.
Mode Split The proportion of total person trips that uses each of various specified modes of transportation.
Multi-modal The availability of transportation options using different modes within a system or corridor.
B-11 RANDALL/ORCHARD ROAD CORRIDOR BRT FEASIBILITY STUDY
Near-side Stop A transit stop located on the approach side of an intersection. The transit units (vehicles or trains) stop to serve passengers before crossing the intersection.
New Freedom The federal formula program to fund new services for people with disabilities that are above and beyond what the ADA requires. See Section 5317.
Non-home Based Trip A trip that has neither its origin nor its destination at a residence. On-time Performance For fixed-route service, the percentage of on-time arrivals at stops along
the route. For demand response service, the percentage of scheduled trips that are picked-up within the assigned on-time window (typically 30 minutes).
Operating Characteristics The type of service provided, the size and geographical location of the service area, the miles and hours of service provided, etc.
Operating Cost The sum of all recurring costs (e.g., labor, fuel) that can be associated with the operation and maintenance of the system during the period under consideration. Operating costs usually exclude such fixed costs as depreciation on plant and equipment, interest paid for loans on capital equipment, and property taxes on capital items.
Operating Expense The total of all expenses associated with operation of an individual mode by a given operator.
Operator An employee of a transit system whose workday is spent in the operation of a transit unit (vehicle or train), such as a bus driver or train operator. Also refers to the organization that runs a transportation system on a day-to-day basis.
Owl Service Transit service provided late at night, usually from midnight to between 3:00 AM and start of service the next day.
Paratransit Types of passenger transportation that are more flexible than conventional fixed-route transit but more structured than the use of private automobiles. Paratransit includes demand-response transportation services, subscription bus services, shared-ride taxis, car pooling and vanpooling, jitney services and so on. Most often refers to wheelchair-accessible, demand-response van service.
Park-and-Ride An access mode to transit in which patrons drive private automobiles or ride bicycles to a transit station, stop, or carpool/vanpool waiting area and park the vehicle in the area provided for that purpose (park-and-ride lot, park-and-pool lot, commuter parking lot, bicycle rack or locker). They then ride the transit system or take a car or vanpool to their destinations.
Parking Facility An area, which may be enclosed or open, attended or unattended, in which automobiles may be left, with or without payment of a fee, while the occupants of the automobiles are using other facilities or services.
Passenger Miles The total number of passengers carried by a transit system for a unit of time multiplied by the number of miles (kilometers) they travel. The ratio of passenger miles (kilometers) and seat or place miles (kilometers) provides a measure of efficiency.
Passenger Platform That portion of a transit facility directly adjacent to the tracks or roadway at which transit units (vehicles or trains) stop to load and unload passengers. Within stations, it is often called a station platform.
B-12 BRT PRIMER | APPENDIX B: GLOSSARY
Peak/Base Ratio The ratio between the number of passengers carried or transit vehicles deployed during the peak hours and during the base period. Also known as peak/off-peak ratio.
Peak Period The period during which demand for transportation service is heaviest. It may be specified as the morning (AM) or afternoon or evening (PM) peak.
Pedestrian-Friendly Characterized by features and elements that make walking safe and convenient. A pedestrian-friendly environment near a transit stop might have pedestrian pushbuttons at street crossings and direct, paved access to adjacent development.
Productivity The ratio of units of transportation output to units of input (consumed resource); for example, vehicle miles per operator hour, or passenger miles per unit cost of operation.
Propulsion System The motors, driving mechanism, controls, and other devices that propel a vehicle; frequently assumes electric operation.
Proof-of-Payment An open fare collection system that has no turnstiles or fare gates. It requires that the passenger display proof of payment (e.g., validated ticket, prepaid pass, valid transfer) while on board the transit vehicle or in other designated fare paid areas. Enforced through random checking by specific transit employees, security staff or police with the power to collect premium “on-board” fares (more common in Europe) or issue tickets or citations, typically resulting in revenue loss below 2-3%. Erroneously called an “honor” system, a name that applies only to systems without enforcement.
Public Transit Passenger transportation service, usually local in scope, that is available to any person who pays a prescribed fare. It operates on established schedules along designated routes or lines with specific stops and is designed to move relatively large numbers of people at one time. Examples include bus, light rail, rapid transit.
Public Transportation Transportation service to the public on a regular basis using vehicles that transport more than one person for compensation, usually but not exclusively over a set route or routes from one fixed point to another. Routes and schedules of this service may be predetermined by the operator or may be determined through a cooperative arrangement. Subcategories include public transit service and paratransit services that are available to the general public.
Pulsed Hub A transit hub serving two or more services, where service is timed to allow efficient timed transfers. These are typically used for transit systems that have relatively low service frequency. See also timed transfer system.
Quality of Service The overall measured or perceived quality of transportation service from the user’s or passenger’s point of view, rather than from the operating agency’s point of view. Defined for transit systems, route segments, and stops by level of service.
Queue A line of vehicles or people waiting to be served by the system in which the rate of flow from the front of the line determines the average speed within the line. Slowly moving vehicles or people joining the rear of the queue are usually considered a part of the queue.
B-13 RANDALL/ORCHARD ROAD CORRIDOR BRT FEASIBILITY STUDY
Queue Jump A short section of exclusive or preferential lane that enables specified vehicles to bypass an automobile queue or a congested section of traffic. A queue jump is often used at signal-controlled freeway on-ramps in congested urban areas to allow high-occupancy vehicles preference. It is also known as a bypass lane or queue bypass.
Rapid Transit System Transit service which is operated completely separate from all other modes of transportation.
Reduced Fare A special fare for children, students, senior citizens, or others that is less than the regular fare.
Reliability How often transit service is provided as promised; affects waiting time, consistency of passenger arrivals from day to day, total trip time, and loading levels. See also schedule adherence.
Replica Streetcar A rubber-tired bus with an exterior (and usually an interior) designed to look like a vintage streetcar. Also known as a trolley replica.
Revenue Miles Miles operated by vehicles available for passenger service. Revenue Service Transit service excluding deadheading or layovers or any service
scheduled for passenger trips. Also known as service hours.Revenue Vehicle A vehicle used to provide passenger transit service for which remuneration
is normally required. It is distinct from non-revenue equipment, which is used to build or maintain facilities, provide supervision, and so on.
Reverse Commute A commute in the direction opposite to the main flow of traffic, for example, from the central city to a suburb during the morning peak. Increasingly common with growth in suburban employment. Valuable to operator as provides additional passengers and revenue at little or no marginal cost.
Rider A passenger on any revenue service vehicle or making an unlinked trip; also known as a patron.
Rideshare/ Ridematch Program
A program that facilitates the formation of carpools and vanpools, usually for work trips. A database is maintained for the ride times, origins, destinations and driver/rider preferences of users and potential users. Those requesting to join an existing pool or looking for riders are matched by program staff with other appropriate people.
Ridesharing A form of transportation, other than public transit, in which more than one person shares in the use of the vehicle, such as a bus, van, or automobile, to make a trip.
Right-of-Way (ROW) A general term denoting land, property, or interest therein, usually in a strip, acquired for or devoted to transportation purposes. For transit, rights-of-way may be categorized by degree of their separation: fully controlled without grade crossings, also known as grade-separated, exclusive, or private ROW; longitudinally physically separated from other traffic (by curbs, barriers, grade separation, etc.) but with grade crossings; or surface streets with mixed traffic, although transit may have preferential treatment.
B-14 BRT PRIMER | APPENDIX B: GLOSSARY
Route Deviation A type of transit service that operates as conventional fixed route bus service along a fixed alignment or path with scheduled time, points at each terminal point, and key intermediate locations. Route deviation service is different from conventional fixed route bus service in that the bus may deviate from the route alignment to service destinations within a prescribed distance of the route. Following an off-route deviation, the bus must return to the point on the route it left.
Round Trip The movement of a person or a vehicle from a point of origin to a destination and then back to the same point of origin.
Route Structure A network or pattern of transit routes, such as grid or radial networks.Route Supervisor A transit employee who evaluates performance, enforces safety and
work rules, and attempts to solve problems; an inspector may be mobile (covering several districts in a radio-equipped vehicle) or fixed (assigned to a post at a designated intersection).
Run The movement of a transit unit (vehicle or train) in one direction from the beginning of a route to the end of it; also known as a trip.
Run Cutting The process of organizing all scheduled trips operated by the transit system into runs for the assignment of operating personnel and vehicles.
Run Number A two- or three-digit number displayed on a hand set or flip-dot display in the lower windscreen displaying the run or schedule slot the vehicle is in; primarily used as information to inspectors, street supervisors, or checkers.
Running Hot Running ahead of schedule. Unacceptable practice on most systems. Also known as running sharp.
Running Time The actual, expected, or scheduled time required for a transit unit (vehicle or train) to move from one point to another, excluding time for stops.
Safe, Accountable, Flexible, Efficient, Transportation Act—A Legacy for Users (SAFETEA-LU)
An Act passed by Congress in 2005 that authorizes federal surface transportation programs, including highways, highway safety, and transit for the years 2005–2009. SAFETEA-LU provided $286.4 billion for transportation, including $52.6 billion for transit, through fiscal year 2009.
Section 5307 The section of the Federal Transit Act that authorizes grants to public transit systems in all urban areas. Funds authorized through Section 5307 are awarded to states to provide capital and operating assistance to transit systems in urban areas with populations between 50,000 and 200,000. Transit systems in urban areas with populations greater than 200,000 receive their funds directly from the Federal Transit Administration.
Section 5309 The section of the Federal Transit Act that authorizes discretionary grants to public transit agencies for capital projects such as buses, bus facilities and rail projects.
Section 5310 A formula program that provides capital assistance to states for transportation programs that serve the elderly and people with disabilities. States distribute Section 5310 funds to local operators in rural and urban settings who are either nonprofit organizations or the lead agencies in coordinated transportation programs. Allocation of funding to states is made on the basis of the number of elderly and persons with disabilities in that state.
B-15 RANDALL/ORCHARD ROAD CORRIDOR BRT FEASIBILITY STUDY
Section 5311 The formula program that provides capital and operating assistance grants to public transit systems in rural and small urban areas with populations of less than 50,000. Funding is apportioned by a statutory formula that is based on the latest U.S. Census figures of areas with a population less than 50,000.
Section 5916 Federal formula funds available to provide transportation to assist low income individuals get to work. Also known as JARC (Jobs Access Reverse Commute).
Section 5917 The federal formula program to fund new services for people with disabilities that are above and beyond what the ADA requires. See New Freedom.
Segregated Right-of-Way (ROW)
Roadway or right-of-way reserved for transit use, but which permits other modes to cross the right-of-way at defined locations such as grade crossings.
Service Route Another hybrid between fixed-route and demand-response service. Service routes are established between targeted neighborhoods and service areas riders want to reach. Similar to deviated fixed routes, service routes are characterized by flexibility and deviation from fixed-route intervals. However, while deviated fixed routes require advanced reservations, service routes do not. A service route can include both regular, predetermined bus stops and/or allow riders to hail the vehicle and request a drop-off anywhere along the route.
Service Span See Hours of Service.Shared Right-of-Way (ROW) Roadway or right-of-way which permits other traffic to mix with transit
vehicles, as is the case with most streetcar and bus lines. Schedule A listing or diagrammatic presentation in time sequence of every trip
and every time point of each trip, from start to finish of service, on a transit line or route.
Schedule Adherence The ability of a route or transit vehicle to maintain its schedule. See Reliability.
Scheduling In transit operations, the process of preparing the operating plan (schedule) for a transit line or network on the basis of passenger demand, policy or level of service, and operating elements (travel times, etc.).
Scratch Ticket A ticket on which the user can scratch overprinting off to indicate, zone, and/or month, day (and time) of validity. Commonly used on day passes.
Seating Capacity The number of passenger seats in a vehicle. Service Area A measure of access to transit service in terms of population served
and area coverage (square miles). For fixed-route service, service areas are typically arranged in corridors. Complementary ADA paratransit services are required by ADA law to extend ¾ mile beyond the fixed-route corridors. As demand response serves a broad area and does not operate over a fixed route, the “service area” encompasses the origin to destination points wherever people can be picked up and dropped off.
Shared Ride A trip, other than by conventional public transit, on which the passengers enter at one or more points of origin and disembark at one or more destinations and for which each passenger is charged an individual fare. Shared ride taxi service is a way of using taxicabs for paratransit.

B-16 BRT PRIMER | APPENDIX B: GLOSSARY
Signal Preemption In highway operations, an automatic or manual device for altering the normal signal phasing or the sequence of a traffic signal to provide preferential treatment for specific types of vehicles, such as buses or trains. This is a type of Advanced Public Transportation System.
Single-Occupant Vehicle (SOV)
A vehicle occupied by the driver only.
Slack The amount of time that a train can run behind schedule without interfering with following trains. Also known as operating margin.
Smart Card A stored-value ticket with built-in semiconductor chip, often used to improve boarding efficiency. The card can be loaded with a monetary value which is decremented for each ride or can be valid for unlimited rides during over a specified period. Early variants required insertion or contact with farebox or fare gate and were time consuming. Most versions in transit are proximity cards and require only to be held close to the farebox or fare gate inductive detector plate.
Standard Urban Bus A bus for use in frequent-stop service with front and (usually) center doors, normally with a rear-mounted engine and low-back seating. Typically 35-40 ft (10-12 m) long. Buses that are less than 20 ft long are typically considered small buses.
Standing Capacity The number of standing passengers that can be accommodated in a vehicle under specified comfort standards, expressed in area per standee.
Station An off-street facility (typically) where passengers wait for, board, alight, or transfer between transit units (vehicles or trains). A station usually provides information and a waiting area and may have boarding and alighting platforms, ticket or farecard sales, fare collection, and other related facilities; also known as a passenger station.
Streetcar An electrically powered rail car that is operated singly or in short trains in mixed traffic on track in city streets. In some areas, it is also known as a trolley car.
Subscription Bus Service A bus service in which routes and schedules are prearranged to meet the travel needs of riders who sign up for the service in advance. The level of service is generally higher than that of regular passenger service (fewer stops, shorter travel time, and greater comfort), and the buses are usually obtained through charter or contractual arrangements.
Subscription Van Service Service similar to that provided by a subscription bus, except that the van may be privately owned, leased from a public or private company, or provided by the employer. The driver is usually a member of the group.
Subsidized Taxi Service A taxicab service in which the fares are lower than actual taxi fares and the taxi company is reimbursed the difference. The service may be provided to the general public or to special groups, such as elderly people. Funds for the subsidy can come from a variety of sources, including local taxes or social service agency program funds. Often an economical way to provide better off-peak service in low-density areas that cannot support fixed routes.
Telecommuting A transportation demand management strategy that substitutes, either partially or completely, transportation to a conventional office through the use of computer and telecommunications technologies (e.g., telephones, personal computers, modems, facsimile machines, electronic mail).
B-17 RANDALL/ORCHARD ROAD CORRIDOR BRT FEASIBILITY STUDY
Termini The “terminating” or end nodes of a line, link, or route.Through Routing The efficient practice of joining the ends of radial transit routes, with
similar demand, to travel through downtown instead of having each route turn back in the downtown and return to its origin.
Ticket Vending Machine A fare collection device that dispenses tickets for entry onto transit vehicles. Often used to increase boarding efficiency.
Time-of-Day Fare A fare that varies by time of day. It is usually higher during peak travel periods (peak fare) and lower during non-peak travel periods (off-peak fare).
Timed Transfer The scheduling of intersecting transit routes so that they are due to arrive at a transfer point simultaneously, eliminating waiting time for transfer passengers.
Timed Transfer System A transit network consisting of one or more nodes (transit centers) and routes or lines radiating from them. The system is designed so that transit vehicles on all or most of the routes or lines are scheduled to arrive at a transit center simultaneously and “pulse” a few minutes later; thus transfers among all the routes and lines involve virtually no waiting. Typically used in suburban areas and for night service where headways are long. See also hub-and-spoke system and pulsed hub.
Transfer A passenger’s change from one transit unit (vehicle or train) or mode to another transit unit or mode.
Transfer Cluster A group of stoppoints within an agency-designated area that are used for transfers. A simple example would be a group of stoppoints at an intersection where two routes cross. A more complex example would be a transit center of bus terminal.
Transit Accessibility In common usage, often used to mean the ability of persons with disabilities to use transit. It also is a measure of the ability of all people to get to and from the nearest transit stop or station and their actual origin or destination.
Transit Bus A self-propelled, rubber-tired road vehicle designed to carry a substantial number of passengers (at least 16, various legal definitions may differ slightly as to minimum capacity), commonly operated on streets and highways. A bus has enough headroom to allow passengers to stand upright after entering. Propulsion may be by internal combustion engine, electric motors or hybrid.
Transit Center A transit stop or station at the meeting point of several routes or lines or of different modes of transportation. It is located on or off the street and is designed to handle the movement of transit units (vehicles or trains) and the boarding, alighting, and transferring of passengers between routes or lines (in which case it is also known as a transfer center).
Transit Corridor Corridors located along or supportive of good quality transit lines. They include higher population and employment densities and feature a high quality pedestrian environment and convenient access to transit.
Transit Dependent Those having to rely on transit services instead of the private automobile to meet one’s travel needs; also known as a captive rider.
B-18 BRT PRIMER | APPENDIX B: GLOSSARY
Transit District A geographical or political division created specifically for the single purpose of providing transportation services. It is a separate legal entity and usually possesses the authority to impose a property tax. Transit agencies can directly operate transit service or contract out for all or part of the total transit service provided.
Transit Maintenance Vehicle A vehicle that is part of a transit fleet, but whose primary function is to support maintenance, and/or supervisory functions rather than to transport transit customers.
Transit Mode A category of transit systems characterized by common characteristics of technology, right-of-way, and type of operation. Examples of different transit modes are regular bus service, express bus service, light rail transit, rail rapid transit, and commuter rail.
Transit Orientation An umbrella term used to define variables that make transit use more attractive. Variables that characterize transit orientation include density, mixed land uses, pedestrian design and accessibility.
Transit-Oriented Development
Transit-Oriented Development (TOD) refers to residential and commercial development designed to maximize access by transit and non-motorized transportation, and with other features to encourage transit ridership. A typical TOD has a rail or bus station at its center, surrounded by relatively high-density development, with progressively lower-density spreading outwards one-quarter to one-half mile, representing pedestrian scale distances.
Transit Shelter A building or other structure constructed at a transit stop. It may be designated by the mode offering service, for example, bus shelter. A transit shelter provides protection from the weather and may provide seating or schedule information or both for the convenience of waiting passengers.
Transit Signal Priority The preferential treatment of transit vehicles at signalized intersections.Transit Supportive Land Use A land use environment that encourages transit use. Typically involves
some level of land use mixing and higher intensity uses.Transit System The facilities, equipment, personnel, and procedures needed to provide
and maintain public transit service. Transitway A dedicated right-of-way or roadway used by transit vehicles (buses or
trains). Transportation Demand Management (TDM)
The concept of managing or reducing travel demand rather than increasing the supply of transportation facilities. It may include programs to shift demand from single-occupant vehicles to other modes such as transit and ridesharing, to shift demand to off-peak periods, or to eliminate demand for some trips.
Transportation Disadvantaged
A term used to describe those people who have little or no access to meaningful jobs, services, and recreation because a transportation system does not meet their needs. Often refers to those individuals who cannot drive a private automobile because of age, disability, or lack of resources.
Transportation Management Association (TMA)
A voluntary association of public and private agencies and firms joined to cooperatively develop transportation-enhancing programs in a given area. TMAs are appropriate organizations to better manage transportation demand in congested suburban communities.
B-19 RANDALL/ORCHARD ROAD CORRIDOR BRT FEASIBILITY STUDY
Transportation System A coordinated system made up of one or several modes serving a common purpose, the movement of people, goods, or both.
Transportation System Management (TSM)
That part of the urban transportation planning process undertaken to improve the efficiency of the existing transportation system. The intent is to make better use of the existing transportation system by using short-term, low-capital transportation improvements that generally cost less and can be implemented more quickly than other system development actions.
Trip A one-way movement of a person or vehicle between two points. Many transit statistics are based on unlinked passenger trips, which refer to individual one-way trips made by individual riders in individual vehicles. A person who leaves home on one vehicle, transfers to a second vehicle to arrive at a destination, leaves the destination on a third vehicle and has to transfer to yet another vehicle to complete the journey home has made four unlinked passenger trips.
Trip Distribution In planning, the process of estimating movement of trips between zones by using surveys or models
Trip End A trip origin or a trip destination. Trip Generator A land use from which trips are produced, such as a dwelling unit, a
store, a factory, or an office. Trip Purpose The primary reason for making a trip, for example, work, shopping,
medical appointment, recreation. Trip Request Any request for transportation made to a paratransit service or
organization providing transportation, whether taken through a centralized call center or on an ad hoc basis by staff.
Trolley An apparatus, such as a grooved wheel or shoe, at the end of a pole, used for collecting electric current from an overhead wire and transmitting it to a motor of a streetcar, trolleybus, or similar vehicle, where it is used for traction and other purposes.
Trolleybus An electrically propelled bus that obtains power via two trolley poles from a dual (positive and negative) overhead wire system along routes. It may be able to travel a limited distance using battery power or an auxiliary internal combustion engine. The power-collecting apparatus is designed to allow the bus to maneuver in mixed traffic over several lanes.
Trolley Replica Bus A bus with an exterior (and usually an interior) designed to look like a vintage streetcar.
Unlinked Trip The boarding of one transit vehicle in revenue service; also known as an unlinked passenger trip, or any segment of a linked trip.
Vanpool A prearranged ridesharing service in which a number of people travel together on a regular basis in a van. Vanpools may be publicly operated, employer operated, individually owned or leased.
Vehicle Capacity The maximum number of passengers that the vehicle is designed to accommodate comfortably, seated and standing.
Vehicle Hours Vehicle hours include revenue hours plus the time it takes a vehicle to travel from the garage to the end of the line. Also see platform hours.
Vehicle Occupancy The number of people aboard a vehicle at a given time.

B-20 BRT PRIMER | APPENDIX B: GLOSSARY
Vintage Streetcar An old streetcar or streetcar built to resemble an older vehicle, electrically operated on rail tracks, generally in downtown areas, for local distribution and tourists. Not to be confused with rubber-tired replica streetcars (also known as trolley replicas). Also known as a vintage trolley.
Volunteer Network A volunteer network matches requests for transportation with a volunteer driver who is typically reimbursed on a per-mile basis for providing the trip. Persons requesting service call the network; the network calls the driver and schedules the trip. Volunteer networks are frequently used in rural areas where resources are scarce, persons needing transportation may live in remote areas, and a sense of community is not uncommon.
Zoned Fare A method of transit pricing that is based on the geographical partitioning of the service area. The price is determined by the location and number of zones traversed. Zone fares are frequently used as a method of charging graduated or distance-based fares but may also be used to provide for differential fares for certain markets.


