5The concept of agility originated at the end of the eighties and in the early nineties
in the manufacturing area in the United States. Agile Manufacturing was first intro-duced with the publication of a report entitled 21st Century Manufacturing EnterpriseStrategy (Goldman et al., 1991). This was followed by a series of publications on agilemanufacturing and agile corporations (Kidd, 1994; Kidd, 1995; Goldman, Nagel, andPreiss, 1995; Dove, 2001). The concept was extended to supply chains and businessnetworks (Christopher, 1992; Mason-Jones and Towill, 1999; Van Hoek, Harrison,and Christopher, 2001; Swafford, 2003; Yusuf, Gunasekaran, Adeleye, andSivayoganathan, 2004).
Despite the history of the concept, there is by far no consensus yet as to what ex-actly agility is. Nor is there a consensus on how one could assess and achieve agility(Schrage, 2004). Very few studies have attempted to empirically study the need foragility. What are the contributing factors requiring organizations to be agile, and whatis the relative importance of these factors? Furthermore, which of these factors arerelated to Information Technology (IT) and how does IT enable or hinder the requiredlevel of agility?
The central question of this chapter is: What are the contributing factors thatrequire business agility, and what IT strategies can be implemented for enhancing business agility? The sub-questions are:
• How can we define the concept of business agility?• Do change factors that create a high business agility need to be generic or
sector-specific?• Is there a difference between various industry sectors on the perceived business
agility readiness?
Business Agility:Need, Readinessand Alignment withIT Strategies1
Marcel van Oosterhout, Eric Waarts, Eric van Heck, and Jos van Hillegersberg
1 The authors gratefully acknowledge the financial support of Hewlett Packard for fundingthis research. Furthermore, we thank Professor Peter Vervest, Professor Kenneth Preiss, and Dr.Otto Koppius for their comments and feedback, all of the companies for their participation, andour research assistants Roger Carvalho, Rinske Verwaal, Roelof Valkenier, Barbara Hertogs, and Stijn van den Bout for their support in the field research.
Ch005-H8235.qxd 25/7/06 11:53 AM Page 52
• Are there differences between three domains of business agility (operational, customer, and network) with regard to the need for business agility and the perceived readiness of organizations?
• Which IT strategies can be defined for enhancing business agility, depending onthe business agility need and business agility readiness level?
Business Agility
Even though much has been said and written on agility, a consensus on a definitionof agility has not yet emerged. Wadhwa and Rao (2003) describe the differences andoverlap between flexibility and agility. Flexibility is defined as a predeterminedresponse to a predictable change, while agility entails an innovative response to anunpredictable change. Flexibility is focused on single systems for low to medium ratesof change, while agility is focused on groups of systems to deal with high rates ofchange. A variety of views on business agility can be found in the literature (Goldmanet al., 1995; Sharifi and Zhang, 1999; Dove, 2001; Hooper et al., 2001; Ramasesh et al., 2001; Conboy and Fitzgerald, 2004). The definitions provide some commonaspects.
Agility is a way to cope with external and internal changes, which are highly uncer-tain. Three types of perceived uncertainty can be distinguished: state uncertainty, effectuncertainty, and response uncertainty (Milliken, 1987). State uncertainty relates tounpredictability about whether or when a certain change will happen. Effect uncer-tainty relates to the inability to predict what the nature of the impact (i.e., effects) ofa change will be on the organization. Some changes are quite predictable (e.g., dereg-ulation in the telecom and energy sector); however, often the speed and exact require-ments to the organization and processes are quite uncertain. Response uncertainty isdefined as a lack of knowledge of response options and/or an inability to predict thelikely consequences of a response choice.
Business agility can be implemented either proactively (leading or initiating achange—placing organizations in a leadership position) or reactively (responding to change, either opportunistic or degenerative, in order to retain competitiveness)(Canter, 2000). Dove (2001) highlights the importance of both sensing capabilities(detecting, anticipating) and responding capabilities (physical ability to act rapidly andwith relative ease) (Dove, 2001). The concept of quickness and therefore speed is atthe heart of agility—it is the capability of an organization to rapidly execute decision-making and operational cycles (Canter, 2000). Speed can be required in various areas,like time to market new products, time to process an order or service request, time toassemble a virtual business network for collaboration, time to reconfigure organiza-tional processes and systems to react to certain changes, and so on.
Sambamurthy, Bharadwaj, and Grover (2003) distinguish three interrelated capa-bilities of agility: operational agility, customer agility, and partnering agility. For eachcapability, they describe the role and impact of IT. This distinction is in line with typesof strategic agility as defined by Weill, Subramani, and Broadbent (2002), who makea distinction between business initiatives aimed at increasing strategic agility based ontheir position on the value net: demand-side initiatives (customer agility), supply-sideinitiatives (partnering agility) and internally focused initiatives (operational agility).
Taking all of the above considerations into account, the definition of business agility in this study will be:
Business agility is the ability to sense highly uncertain external and internalchanges, and respond to them reactively or proactively, based on innovation of the
Business Agility: Need, Readiness and Alignment with IT Strategies 53
Ch005-H8235.qxd 25/7/06 11:53 AM Page 53
internal operational processes, involving the customer in exploration and exploita-tion activities, while leveraging the capabilities of partners in the business network.
An Agility Framework
Building on the work by Sharifi and Zhang (1999) we constructed a framework toanalyze business agility in detail (Figure 5.1).
The starting point of our model is the contributing factors, which are external andinternal changes that can create a need for business agility (based on Sharifi andZhang, 1999). In this chapter, we focus on the analyses of change factors, where arequired response of the organization is related, directly or indirectly, to the organiza-tion’s IT capability.
An organization’s business agility readiness is determined by its business agilitycapabilities. Business agility capabilities are the means or barriers for a business toenhance its business agility. Business agility capabilities can be categorized based onthe work of Sambamurthy, Bharadwaj, and Grover (2003) and Weill, Subramani, andBroadbent (2002). The business agility capabilities are the reasons behind the exis-tence or nonexistence of agility gaps. If there is a mismatch between the businessesagility need and the business agility readiness, there is a business agility gap. This hasimplications for the business agility IT strategy.
In this chapter, we will report on the perceived business agility need (BAN) and theperceived business agility readiness (BAR) for external and internal change factors thatare directly or indirectly related to the organization’s IT. We will also discuss implica-tions for business agility IT strategies to close the business agility gap (BAG).
Methodology
Based on the literature review, we constructed a questionnaire. We used feedbackfrom experts and two workshops to test and improve the questionnaire. We chose touse multiple methods for data gathering in order to provide a rich description on the
Agile Information Systems54
ChangeFactors
BusinessAgilityNeed(BAN)
BusinessAgility
Readiness(BAR)
BusinessAgility
Capabilities
BusinessAgility
Gap (BAG)
BusinessAgility
IT Strategy
IndustrySector
Characteristics
Relationship and measured
(Expected) relationshipbut not measured
BAR was only measuredfor change factors scoring 4 or 5 on BAN
Figure 5.1
Conceptual Framework*
* Adapted from Sharifi and Zhang, 1999.
Ch005-H8235.qxd 25/7/06 11:53 AM Page 54
topic. We gathered quantitative data via an online questionnaire (110 respondents).This was complemented with in-depth qualitative data, gathered via interviews with50 managers and workshop discussions. The results were validated by interviews with14 sector experts.
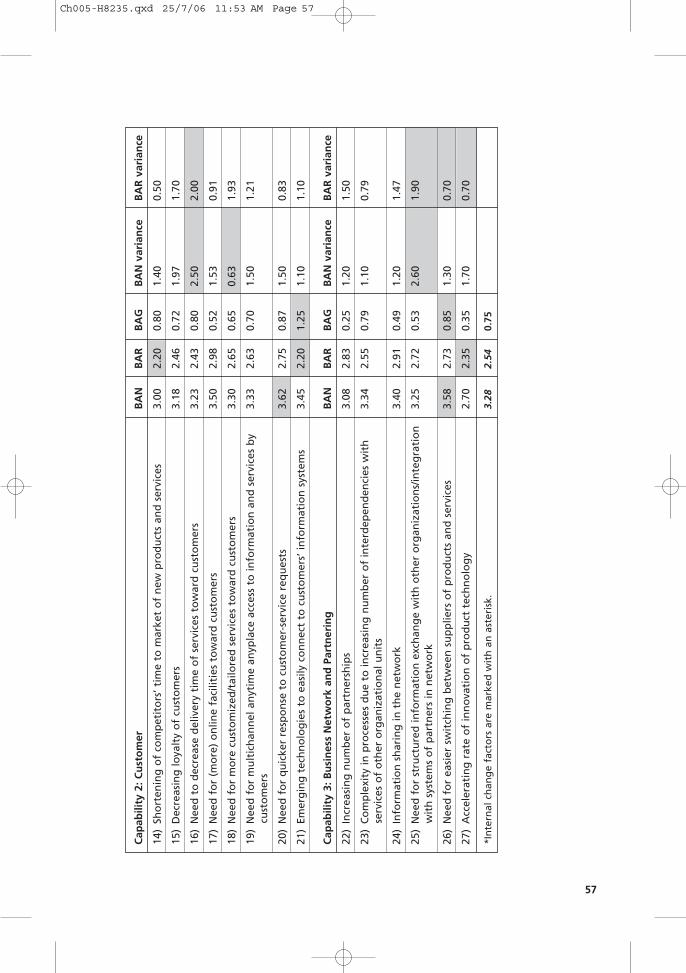
Based on literature research and workshops with experts, we constructed a ques-tionnaire containing 27 change factors, covering the three agility capabilities of ourframework: factors requiring operational agility, factors requiring customer agility,and factors requiring business network and partnering agility. An overview of thesechange factors can be found in Table 5.1.2
Each change factor in the survey had to be scored on a Likert-5 scale. If the per-ceived BAN due to a certain change factor was high (score 4 or 5), a second questionwas posed regarding the perceived BAR (also on a Likert-5 scale). The BAG was mea-sured as BAN minus BAR. In the next part of the questionnaire for the 10 change fac-tors with the highest BAG score of the respondent, open questions were generated. Foreach BAG, the respondent was asked to elaborate on the bottleneck(s) and measuresin the required business agility capabilities to deal with the BAG. This way, the ques-tionnaire generated both quantitative as well as qualitative data on agility capabilitiesas enablers or disablers. We did a cross-check on possible survey fatigue which mightbias our results. We found no difference in the variance of answers between the firsthalf of the survey with the second half. Furthermore, we checked the number ofresponses to individual items in the second half of the questionnaire and compared itwith the first half.
For the interviews with managers within each sector, a sample of organizations was selected. Criteria to select organizations were their position in the market (in the business sectors top market share players with considerable size). Within each organization, at least two managers were asked to fill out the survey, as a basisfor the in-depth interviews. One interview was held to cover the general business orpolicy perspective (mainly with CEOs, marketing executives, and general managers)and one to cover the operations and IT perspective (mainly with COOs, CIOs, and CTOs). The average duration of the interview was 90 to 120 minutes. Basis forthe interviews were the perceived agility gaps identified by the respondents in the survey. From each interview, minutes were taken and checked for accuracy with the interviewee.
We chose to study four business sectors and three public sectors in the Netherlands:
• Logistics (logistics service providers)• Finance (retail banking)• Utilities (distribution and sales of energy)• Mobile telecom (mobile telecom operators)• Central government (Dutch ministries)• Higher education institutes• Other public sectors (operational authorities such as tax authorities, local
authorities, etc.)
These sectors constitute an important segment of the total Dutch business and pub-lic sector. Furthermore, these sectors are confronted with a wide variety of externaland internal change factors, such as regulations, shifts in customer demands, reorga-nizations, and changes in IT.
Business Agility: Need, Readiness and Alignment with IT Strategies 55
2 A copy of the full questionnaire can be obtained from the researchers.
Ch005-H8235.qxd 25/7/06 11:53 AM Page 55
56
Bu
sin
ess
Ag
ility
Ch
ang
e Fa
cto
r Sc
ore
s
Ch
ang
e Fa
cto
rsA
bso
lute
sco
res
Var
ian
ce(S
cale
fro
m 1
to
5)
(Max
-min
sco
re o
ver
7 se
cto
rs)
Cap
abili
ty 1
: Op
erat
ion
alB
AN
BA
RB
AG
BA
N v
aria
nce
BA
R v
aria
nce
1)G
row
ing
dem
and
fo
r fi
nan
cial
tra
nsp
aren
cy a
nd
acc
ou
nta
bili
ty (
Bas
el-2
, IA
S et
c.)
3.40
2.93
0.47
1.80
0.72
2)N
ew r
egu
lati
on
at
the
nat
ion
al le
vel
3.49
3.00
0.49
1.30
2.00
3)N
ew s
ecu
rity
mea
sure
s/IS
sec
uri
ty3.
352.
420.
931.
101.
00
4)In
crea
sed
ou
tso
urc
ing
of
no
nco
re b
usi
nes
s ac
tivi
ties
*3.
052.
790.
260.
502.
33
5)In
crea
sed
ou
tso
urc
ing
of
IT-r
elat
ed s
yste
ms
and
per
son
nel
*3.
282.
830.
450.
801.
10
6)Em
erg
ing
pri
ce w
ar (
mar
ket
focu
sed
on
pri
ce)/
shri
nki
ng
mar
gin
s4.
061.
942.
121.
451.
20
7)N
eed
fo
r lo
wer
-pri
ced
ser
vice
s3.
322.
430.
891.
501.
33
8)C
han
gin
g r
equ
irem
ents
tak
e to
o lo
ng
to
imp
lem
ent
into
th
e o
rgan
izat
ion
an
d
3.30
2.01
1.29
1.26
1.62
syst
ems*
9)M
ajo
r o
rgan
izat
ion
al c
han
ge
(e.g
., m
erg
er, a
cqu
isit
ion
)*3.
342.
341.
001.
311.
00
10)
Dig
ital
izat
ion
of
do
cum
ents
an
d e
-sig
nat
ure
s*2.
792.
490.
301.
091.
25
11)
Incr
easi
ng
tim
e an
d m
on
ey s
pen
t o
n m
ain
ten
ance
an
d s
up
po
rt o
f ex
isti
ng
IT
3.25
2.17
1.08
0.70
1.90
infr
astr
uct
ure
*
12)
Des
ire
to in
crea
se t
he
leve
ls o
f ex
per
tise
of
emp
loye
es*
2.59
2.12
0.47
0.67
1.17
13)
Reo
rgan
izat
ion
of
inte
rnal
pro
cess
es*
3.49
2.65
0.84
0.48
0.04
Tab
le 5
.1
Ch005-H8235.qxd 25/7/06 11:53 AM Page 56
57
Cap
abili
ty 2
: Cu
sto
mer
BA
NB
AR
BA
GB
AN
var
ian
ceB
AR
var
ian
ce
14)
Sho
rten
ing
of
com
pet
ito
rs’ t
ime
to m
arke
t o
f n
ew p
rod
uct
s an
d s
ervi
ces
3.00
2.20
0.80
1.40
0.50
15)
Dec
reas
ing
loya
lty
of
cust
om
ers
3.18
2.46
0.72
1.97
1.70
16)
Nee
d t
o d
ecre
ase
del
iver
y ti
me
of
serv
ices
to
war
d c
ust
om
ers
3.23
2.43
0.80
2.50
2.00
17)
Nee
d f
or
(mo
re)
on
line
faci
litie
s to
war
d c
ust
om
ers
3.50
2.98
0.52
1.53
0.91
18)
Nee
d f
or
mo
re c
ust
om
ized
/tai
lore
d s
ervi
ces
tow
ard
cu
sto
mer
s3.
302.
650.
650.
631.
93
19)
Nee
d f
or
mu
ltic
han
nel
an
ytim
e an
ypla
ce a
cces
s to
info
rmat
ion
an
d s
ervi
ces
by
3.33
2.63
0.70
1.50
1.21
cust
om
ers
20)
Nee
d f
or
qu
icke
r re
spo
nse
to
cu
sto
mer
-ser
vice
req
ues
ts3.
622.
750.
871.
500.
83
21)
Emer
gin
g t
ech
no
log
ies
to e
asily
co
nn
ect
to c
ust
om
ers’
info
rmat
ion
sys
tem
s3.
452.
201.
251.
101.
10
Cap
abili
ty 3
: Bu
sin
ess
Net
wo
rk a
nd
Par
tner
ing
BA
NB
AR
BA
GB
AN
var
ian
ceB
AR
var
ian
ce
22)
Incr
easi
ng
nu
mb
er o
f p
artn
ersh
ips
3.08
2.83
0.25
1.20
1.50
23)
Co
mp
lexi
ty in
pro
cess
es d
ue
to in
crea
sin
g n
um
ber
of
inte
rdep
end
enci
es w
ith
3.
342.
550.
791.
100.
79se
rvic
es o
f o
ther
org
aniz
atio
nal
un
its
24)
Info
rmat
ion
sh
arin
g in
th
e n
etw
ork
3.40
2.91
0.49
1.20
1.47
25)
Nee
d f
or
stru
ctu
red
info
rmat
ion
exc
han
ge
wit
h o
ther
org
aniz
atio
ns/
inte
gra
tio
n
3.25
2.72
0.53
2.60
1.90
wit
h s
yste
ms
of
par
tner
s in
net
wo
rk
26)
Nee
d f
or
easi
er s
wit
chin
g b
etw
een
su
pp
liers
of
pro
du
cts
and
ser
vice
s3.
582.
730.
851.
300.
70
27)
Acc
eler
atin
g r
ate
of
inn
ova
tio
n o
f p
rod
uct
tec
hn
olo
gy
2.70
2.35
0.35
1.70
0.70
*In
tern
al c
han
ge
fact
ors
are
mar
ked
wit
h a
n a
ster
isk.
3.28
2.54
0.75
Ch005-H8235.qxd 25/7/06 11:53 AM Page 57
Findings
We will present three types of findings. First, we will present an overview of theaverage scores on BAN, BAR, and BAG per sector and per dimension of business agility. Next, we will compare the public sectors with the business sectors on BAN,BAR, and BAG. Finally, we will analyze the importance of individual change factorsper dimension of business agility.
Overall Differences between Sectors
Table 5.2 compares the seven sectors on BAN, BAR, and BAG per dimension ofbusiness agility. When we look at the overall BAN scores, logistics has the highestBAN (3.63) on all three dimensions. The lowest BAN is found in the education sectorfor the operational dimension (3.17), in the energy sector on the customer dimension(2.91), and in the finance sector on the network dimension (2.85).
When we look at the overall BAR scores, the energy sector has the lowest BAR onthe operational dimension (2.08) and the customer dimension (1.91), while the lowestBAR is found in the other public sector on the network dimension (2.42). The highestBAR is found in the telecom sector on the operational dimension (2.91), in the government sector on the customer dimension (3.15), and in the logistics sector on the network dimension (3.07).
When we look at the overall BAG scores, the highest scores are found in the logis-tics (1.08) and energy (0.96) sectors, and on the operational (0.81) and customer(0.79) dimensions. On the operational dimension, the highest BAG scores are foundwithin the logistics (1.33) and energy (1.21) sectors, on the customer dimension in theenergy (1.00) and finance (0.96) sectors, and on the network dimension in the otherpublic sector (1.15).
Public versus Business
When we compare the three public sectors with the four business sectors on BAN,BAR, and BAG, we find a few differences. BAN is about the same within public andbusiness, only BAN on the business network dimension scores higher in public (3.41)compared to business (3.19). BAR is higher in public on the operational and customerdimensions, but slightly lower on the business network dimension. These differencesare also found when we compare the BAG scores. Overall BAG scores within publicare lower compared to business, with the exception of the average BAG score on the business network dimension, which is considerably larger within public (0.81)compared to business (0.51).
Importance of Individual Change Factors and the Role of IT
An analysis of the individual change factors will further clarify the differencesbetween the seven sectors on changes which are related to the three dimensions ofbusiness agility. Table 5.1 presents the average scores on the 27 IT-related change fac-tors on BAN, BAR, and BAG. Furthermore, we have included the variance betweenthe seven sectors analyzed on BAN and BAR. The change factors have been groupedinto the three major business agility capabilities: factors affecting operational agility,factors affecting customer agility, and factors affecting business network and partner-ing agility. We will now discuss the largest BAGs per agility capability category andthe effects of IT on BAR, as found in our survey and discussed during the interviews.We will use examples from the different sectors to illustrate our findings.
Agile Information Systems58
Ch005-H8235.qxd 25/7/06 11:53 AM Page 58
59
Sect
or
Co
mp
aris
on
on
BA
N, B
AR
, an
d B
AG
fo
r th
e Th
ree
Bu
sin
ess
Ag
ility
Dim
ensi
on
s
go
vern
men
ted
uca
tio
no
ther
pu
blic
fin
ance
tele
com
log
isti
csen
erg
yav
erag
e
BA
Nav
erag
e3.
293.
253.
403.
293.
363.
633.
10
Op
erat
ion
al3.
283.
173.
303.
423.
383.
723.
293.
29
Cu
sto
mer
3.26
3.38
3.48
3.43
3.40
3.54
2.91
3.33
Net
wo
rk3.
363.
303.
572.
853.
283.
623.
023.
22
BA
Rav
erag
e2.
842.
622.
632.
632.
792.
642.
17
Op
erat
ion
al2.
682.
552.
692.
502.
912.
382.
082.
47
Cu
sto
mer
3.15
2.79
2.63
2.46
2.64
2.69
1.91
2.54
Net
wo
rk2.
822.
562.
422.
482.
783.
072.
762.
68
BA
Gav
erag
e0.
450.
630.
770.
800.
581.
080.
96
Op
erat
ion
al0.
600.
620.
610.
920.
471.
331.
210.
80
Cu
sto
mer
0.11
0.59
0.85
0.96
0.76
0.92
1.00
0.79
Net
wo
rk0.
540.
741.
150.
370.
500.
810.
380.
60
Tab
le 5
.2
Ch005-H8235.qxd 25/7/06 11:53 AM Page 59
Operational Business Agility
The change factor with the highest BAG (overall and within the operational dimension; BAG = 2.12) is the emerging price war and shrinking margins (#6).This change factor influences all the business sectors analyzed and, to a lower degree,the public sectors. Companies have a lot of difficulties coping with the requiredchanges in their internal processes. Lowering the prices requires changes in operationalprocesses to cut costs as it influences the way companies are structured and operate.This is an important driver for re-organizing the internal processes (#13) and major organizational change (#9). Many respondents mentioned the case of mergersand acquisitions as an example of major organizational change, where merging andintegrating the various IT infrastructures was most time-consuming and caused thehighest gaps.
Some of the deeper reasons behind the agility gaps in the operational agility capa-bility can be found in the fact that implementing changing requirements into the orga-nization and IT systems takes too long (#8). Many respondents indicated that in manylegacy systems business rules are embedded. There is no distinction between, data,applications, and business rules, which hampers BAR. Since increasingly time andmoney is spent on maintenance and support of the existing IT infrastructure (#11),insufficient budget remains for investing in innovation and creating options for a moreagility-enhancing architecture.
As a solution to the problems described, many organizations are considering or arealready active in the outsourcing of IT resources and personnel (#4 and #5). In ourresearch, we saw a large variance between the sectors in the perceived BAR to dealwith outsourcing (#4 BAR variance = 2.33). Lowest BAR was found in the other pub-lic sector segment (#4 BAR = 1.67), followed by the finance sector (#5 BAR = 2.10).Main reasons for outsourcing are reduction of costs, standardization of the IT in-frastructure, and a focus on core competences. Respondents mentioned a number ofdifficulties involved in outsourcing. Strategic decisions need to be made on the degreeof outsourcing. Furthermore, governance of the outsourcing provider creates newtransaction costs. If part of the outsourcing deal is based on off-shoring, governancerequires dealing with cultural issues and very clear and detailed specifications ofchange requests. In general, respondents provided both pros and cons for the propo-sition that outsourcing enhances BAR.
Another important change factor leading to a high BAN is new regulation onnational level (#2) (BAN = 3.49) and specifically, increasing demands from trans-parency and accountability regulation (#1) (BAN = 3.40). Financial transparency andaccountability causes the highest gap in the finance sector (BAG = 2.20). Examples ofaccountability regulation directly impacting organizations within finance are Basel 2,International Financial Reporting Standards (IFRS), International AccountingStandards (IAS), and Sarbanes Oxley. A lot of organizations within finance have ITsystems, organized per product (group). This makes it difficult to comply with thetransparency requirements from the new regulations, which are needed on a horizon-tal level crossing the various products groups.
Executives in all sectors that we studied perceive a high effect-and-response uncer-tainty with regard to government regulation measures. This leads to high BAN scores.The amount of new regulation, the problem of lack of implementation details, and thetiming make it necessary to implement the required changes in a short time frame. Thisis causing BAGs within the energy (2.00), finance (1.20), and education (1.05) sectors.It is interesting to note that telecom organizations feel that they are overprepared
Agile Information Systems60
Ch005-H8235.qxd 25/7/06 11:53 AM Page 60
(#2 BAG = −1.3). Apparently, telecom organizations have found ways to deal withuncertainty in regulation.
Some change factors are dependent on the domain (business or public). Within the public sectors, we find two change factors that cause relatively large BAGs.Digitization of documents and the usage of e-signatures (#10) create BAGs within cen-tral government (1.26) and the other public sector (0.96). Digitalization of documentsand signatures plays an important role to streamline policy decision making and trans-actions between citizens and government agencies, but has far-reaching impacts on thewhole workflow throughout and between organizations, which explains the low BARscores. Another BAG we found in all three public sectors (with average BAG = 0.97)is increasing the levels of expertise of employees (#12). The information society andchanging role of the public sector requires other types of expertise. Main factors hindering agility as found during our interviews were the aging workforce, insufficientchange-oriented people, and a loss of expertise due to the usage of temporary externalexpertise, which insufficiently remains anchored in the organization.
Customer Business Agility
The change factor requiring customer business agility capability with the highestBAG (1.25) is connecting to customers’ information systems (#21). Connecting to customer information systems requires an IT architecture with quick-connect capabil-ities on the basis of open standards and the usage of middleware. A lot of organiza-tions in our sample were insufficiently ready to handle these required quick-connectcapabilities.
The second highest BAG is found for responding quicker to customer servicerequests (#20) (BAG = 0.87). Especially the logistics (BAG = 1.37), energy (BAG =1.30), and other public (BAG = 1.04) sectors are insufficiently ready to deal with thisagility need. For many organizations, these are large-scale processes, with many cus-tomer service requests. Especially public sector organizations and respondents in theenergy sector (former public) need a redesign of their internal processes to becomemore customer-oriented.
Dealing with shortening of competitors’ time to market of new products and ser-vices (#14) causes a BAG within the telecom sector (BAG = 1.30). There is a high pres-sure to bring new products and services onto the market within a short time frame.For instance, the introduction of new mobile payment models, data services, new con-tent concepts based on increased bandwidth, and new location-based services requirefundamental changes in the organization’s procedures, systems, and partnerships.
Customization of services toward customers (#18) scores relatively equal on BANover the seven sectors analyzed. Especially within energy there is a low BAR (BAR =1.50). This is related to decreasing loyalty of customers (#15) in the energy sector,which scores high on BAN (4.30) and very low on BAR (1.30). Energy companies havebeen formed by mergers of various previously state-owned energy companies, whicheach had their own systems and procedures. Furthermore, inherited systems werenever designed with a customer or service customization perspective. However, theopen market requires customization to attract new customers or preserve existing cus-tomers. In the past, these companies did not have to worry about customers, since theydid not have the possibility to switch to a competitor. Now this has changed, and fundamental changes are required into culture, processes, and IT systems.
The highest BAG within the finance sector on the customer dimension is caused by the need for multi-channel any time any place access to information and services
Business Agility: Need, Readiness and Alignment with IT Strategies 61
Ch005-H8235.qxd 25/7/06 11:53 AM Page 61
by customers (#19) (BAG = 1.70). The original IT architectures of large financial insti-tutes insufficiently support adding new channels for communication and transactions.Given the increasing importance of Internet banking and the opportunities of mobilepayment, there is a high urgency to change IT architecture and systems to support theInternet and mobile devices as channels for communication and transactions.
Business Network and Partnering Agility
The highest BAG in the business network dimension is found in the need for easier switching between suppliers of products and services (#26) (BAG = 0.85).Especially within logistics (BAG = 1.5) and energy (BAG = 1.1), BAR is insufficient. Todeal with this need, arrangements need to be made on business network level within the industry sector. In the energy sector, the energy clearinghouse has been setup by a number of energy companies to arrange information exchange on a standard-ized way to facilitate the switching of customers from one supplier to another. Definingthe standards and connecting the different systems caused the most difficulties.
The second highest BAG is the complexity in processes due to increasing numberof interdependencies in the business network (#23). This change factor scores rela-tively high on BAN (3.34) and low on BAR (1.55). Especially respondents within theeducation (BAG = 1.30), other public (BAG = 1.34), and energy (BAG = 1.10) sectorsfind themselves insufficiently ready for this business network integration. This factoris closely related to information sharing in the network (#24). Increasingly, public ser-vices are interdependent, and information needs to be shared between different orga-nizations in the public sector. Public services more and more will make use of authenticregisters, whereby distributed databases need to be coupled to provide a completeinformation profile on citizens for various types of services. Furthermore, governmentis working on a single portal for governmental services, a single window between cit-izens and the government for information exchange, information access, and services.In the back office, this means a lot of distributed databases need to be connected,which creates a lot of interdependencies.
The need for structured information exchange (#25)—think about EDI andXML—causes a high variety in BAN and BAR between the seven sectors analyzed.Highest BAG scores are found in logistics (BAG = 2.03) and other public (BAG = 0.94)sectors. In the logistics sector, the need for chain-wide tracking and tracing requiresintegration to partner information systems. Given the diversity in type of companiesand size (a lot of Small-to-Medium Sized Enterprises (SMEs)), it is difficult to achievechain-wide structured information exchange.
The lowest BAR is found in managing the accelerating of innovation of producttechnology (#27) (BAR = 1.35). Telecom companies are highly dependent on theirmobile device and content partners to use this change factor as a way to innovate anddistinguish from competitors. Especially within telecom, this causes a BAG (BAG =1.2). New technologies in mobile devices; voice-over IP; emerging data services; andthe merging of phone, Internet, and TV have resulted in a series of innovations inproduct technology. Customized products and services need to be put on the telecommarket in ever shorter time.
Analyses
Figure 5.2 shows a plot of the relative scores on perceived BAN and perceived BARfor the 27 change factors analyzed. First, we calculated the overall average scores onBAN (3.28) and BAR (2.54). We then related the individual scores of the 27 change
Agile Information Systems62
Ch005-H8235.qxd 25/7/06 11:53 AM Page 62
factors to this overall average score by subtracting the overall average score from theindividual score. This way, we made the relative importance and relative scores of the 27 change factors on BAN and BAR explicit.
Based on their relative position on the Business Agility Matrix, factors can lead to a BAG. If BAN scores above average, and BAR below average, organizations are insufficiently agile and need immediate action to deal with the change factor. Most important change factors requiring immediate action as found in our researchwere emerging price war and shrinking margins (#6), followed by connecting to customers’ information systems (#21) and dealing with major organizational change (#9). A number of change factors need a careful watch. If the level of changeincreases, they also require immediate action. If BAN is below average and BAR is above average, organizations are more or less overprepared to deal with a changefactor.
It is interesting to note that respondents find that their BAR to deal with changefactors related to business network agility is relatively sufficient, compared to otherfactors. This can be explained by the fact that more attention is given to the internaloperational business agility. Either there is yet insufficient awareness on the im-portance of the business network perspective, or solving internal problems still has priority over business network opportunities, or the business network is not found to be important.
Business Agility: Need, Readiness and Alignment with IT Strategies 63
Perceived Business Agility Need (BAN)
Per
ceiv
ed B
usin
ess
Agi
lity
Rea
dine
ss (B
AR
) Business Agility Matrix
–1Low
1.0High
0Average
Low –1
High 1
Average 0
0.5
0.5–0.5
–0.5
1
22
2
45
10
12
17
1819
20
24
25 26
14
3
6
7
8
9
11
13
1516
21
23
27
x
x
x
Operational
Network
Customer
0.75
0.75
0.25
0.25–0.25
–0.25
–0.75
–0.75Sufficiently Agile
be careful Insufficiently Agile
Sufficiently AgileOver Prepared
Figure 5.2
Business Agility Change Factors Matrix
Ch005-H8235.qxd 25/7/06 11:53 AM Page 63
Since Figure 5.2 only provides an overview of average scores over the total sample, the business agility matrix will look different per sector analyzed. As an exam-ple, we will show the business agility matrices for central government and finance(Figure 5.3).
Relative importance of change factors on a sector level becomes more explicit, witha wider range of scores on BAN and BAR. Given the differences between different sec-tors on the relative scores for change factors on BAN and BAR, sector-specific bench-marks are needed for organizations to assess and compare their BAN and BAR scoreson various change factors.
This study shows that some change factors are generic, but some are dependent onpublic or private domains. These factors have a relatively similar type of BAN for allbusiness sectors (e.g., #6) or for all public sectors (e.g., #10, #12, and #24).Furthermore, various change factors are sector-specific (e.g., #17 and #27). BAR ingeneral is organization-specific, although the same types of challenges in increasingbusiness agility IT capabilities are found in all organizations analyzed. Depending onthe position of a change factor in the Business Agility Matrix, several IT strategies canbe defined (Figure 5.4).
If an organization finds itself in the Insufficiently Agile quadrant for a certainchange factor, two possible IT strategies can be used. In the first strategy, IT is used to increase the BAR. This includes increasing both the sensing and respond capabili-ties (Dove, 2001). A few general guidelines for increasing BAR were extracted from our interviews and confirmed in the literature. Respondents believe that IT archi-tecture and standards should be managed centrally at enterprise level on the basis ofa broadly enforced set of technology standards, while keeping room for local responsiveness. To some degree, the same accounts for security and risk and IT facili-ties management. This was also recommended by Weill, Subramani, and Broadbent(2002). Secondly, an infrastructure that is modular, service-based, and tailored to theenterprise’s strategy (close alignment between business and IT) is expected to enhancebusiness agility. Such an architecture is loosely coupled, based on modular reusablecomponents in a scalable framework (Dove, 2001). A distinction between data, ap-plications, and business rules creates the basis for more agility. Compatibility and inte-gration can be achieved via standardized interfaces and connections, usage ofstandardized technology to store data (such as XML), and usage of interoperabilityand integration supporting standards and open protocols (e.g., XML and Web ser-vices) (Vervest and Dunn, 2000; Brown and Bessant, 2003). These are enablers forincreasing the business network agility capability (van Hillegersberg, et al., 2005) aswell as the internal operational business agility capability. A final guideline we foundin the literature (Weill, Subramani, and Broadbent, 2002) is that the organization’sinfrastructure should be created via a series of incremental investments. Staged invest-ment means partitioning a larger IT investment into stand-alone increments that buildon the preceding ones, thereby creating strategic real options (Konsynski and Tiwana,2004).
In the second strategy, IT is used to decrease the BAN. As an example, we take theneed to respond more quickly to customer service requests (#20). An IT strategy tolower BAN might be to create self-service environments where customers can helpthemselves or each other, based on access to their data, transactions, and intelligentdecision support tools for solving problems. This can be extended to self-service envi-ronments, where customers are offered personalized products and services based onreal-time product configurators and historic databases that match profiles to offers(like Amazon). By creating self-service environments, there will be less customer
Agile Information Systems64
Ch005-H8235.qxd 25/7/06 11:53 AM Page 64
Business Agility: Need, Readiness and Alignment with IT Strategies 65
Per
ceiv
ed B
usin
ess
Agi
lity
Rea
dine
ss (B
AR
)
Business Agility Matrix: Central Government
1
2
4
10
12
17
18
19
20
24
25
3
7
8
9
11
13
15 16
23
x
x
x
Operational
Network
Customer
–1Low
1.0High
0Average
Low –1
High 1
Average 0
0.5
0.5–0.5
–0.5
0.75
0.75
0.25
0.25–0.25
–0.25
–0.75
–0.75
Perceived Business Agility Need (BAN)
Perceived Business Agility Need (BAN)
Per
ceiv
ed B
usin
ess
Agi
lity
Rea
dine
ss (B
AR
) Business Agility Matrix: Finance
1
22
2
4
5
1012
17
18
19
20
24
25
26
143
6
7
8
911
15
16
21
23
27
x
x
x
Operational
Network
Customer
–1Low
1.0High
0Average
Low –1
High 1
Average 0
0.5
0.5–0.5
–0.5
0.75
0.75
0.25
0.25–0.25
–0.25
–0.75
–0.75
Sufficiently AgileOver Prepared
Sufficiently Agilebe careful Insufficiently Agile
Sufficiently AgileOver Prepared
Sufficiently Agilebe careful Insufficiently Agile
Figure 5.3
Business Agility Change Factors Matrices: Central Government and Finance
Ch005-H8235.qxd 25/7/06 11:53 AM Page 65
service requests and therefore the BAN score of the need to quickly respond to cus-tomer service requests will decrease.
If an organization finds itself in the Sufficiently Agile, Be Careful quadrant for acertain change factor, the IT strategy should focus on increasing the sensing capabili-ties. Sensing can be achieved by early detection systems, which alert at the first signsof a new threat or opportunity with procedures to determine a proper response (Daftet al., 1988; Conner, 2000). The involvement of customers in product development—so-called customer sensitivity—can also be an important basis for sensing (Maskell,2001; Van Hoek et al, 2001). Available, complete, pertinent, and easy-to-access infor-mation on customer needs, anxieties, and service requirements via IT is a key enablerfor agility (Christopher, 1992).
Conclusion
The central research question of this chapter was: What are the contributing factors that require business agility, and what IT strategies can be implemented forenhancing business agility? First we defined the concept of business agility. Our defini-tion is “Business agility is the ability to sense highly uncertain external and internalchanges and respond reactively or proactively, based on innovation of the internaloperational processes, involving the customer in exploration and exploitation whileleveraging the capabilities of partners in the business network.”
Agile Information Systems66
Perceived Business Agility Need (BAN)
Per
ceiv
ed B
usin
ess
Agi
lity
Rea
dine
ss (
BA
R)
1
22
2
45
10
12
17
1819
20
24
25 26
14
3
6
7
8
9
11
13
1516
21
23
27
x
x
x
Operational
Network
Customer
Business Agility IT Strategy Matrix
Strategy 2
Strategy1
Strategy3
–1Low
1.0High
0Average
Low –1
High 1
Average 0
0.5
0.5–0.5
–0.5
0.75
0.75
0.25
0.25–0.25
–0.25
–0.75
–0.75
Over Prepared Sufficiently Agile
Insufficiently AgileSufficiently Agile
be careful
Figure 5.4
Business Agility IT Strategy Matrix
Ch005-H8235.qxd 25/7/06 11:53 AM Page 66
This study shows that some change factors are generic, but some are dependent on public or private domains. The emerging price war and the need for lower pricedproducts and services combined with fast-changing customer requests dramaticallyinfluence all business sectors analyzed. Companies face severe difficulties in coping with the required changes. In many cases, this requires a totally different way of organizing the company and its business network. Additionally, new regulationis causing high BAN in almost all sectors analyzed. Furthermore, various change factors are sector-specific. Given the differences between different sectors on the relative scores for change factors on BAN and BAR, sector-specific benchmarks areneeded for organizations to assess and compare their BAN and BAR scores on various change factors.
The results also indicate that BAN is not just created by uncertainty about externalchanges. Many internal changes (such as mergers and acquisitions, changes in systemsand procedures, digitalization of documents, and e-signatures) require organizationsto increase their BAR scores. This is reflected in the BAG scores we found for variouschange factors with a more internal origin in different sectors.
BAR in general is organization-specific, although the same types of challenges inincreasing business agility IT capabilities are found in all organizations analyzed.Respondents are very worried about the pace at which responses to the changes canbe implemented. To a large degree, this can be explained by the existing organiza-tional structures, cultures, and legacy infrastructures.
The highest BAG scores were found in logistics and energy, while changes requir-ing agility on the operational and the customer dimension caused larger gaps than thebusiness network dimension. The highest BAG scores on the operational dimensionwere found within logistics and energy, on the customer dimension in energy andfinance, and on the business network dimension in other public arenas.
Depending on the position of a change factor in the Business Agility Matrix, threegeneric IT strategies were defined. If an organization finds itself in the InsufficientlyAgile quadrant for a certain change factor, two possible IT strategies can be used. In the first strategy, IT is used to increase the BAR. This includes increasing both thesensing and respond capabilities (Dove, 2001). In the second strategy, IT is used todecrease the BAN. If an organization finds itself in the Sufficiently Agile, Be Carefulquadrant for a certain change factor, the IT strategy should focus on increasing thesensing capabilities.
References
Brown, S. and Bessant, J. (2003). The manufacturing strategy-capabilities links in mass customization and agile manufacturing: An exploratory study. International Journal ofOperations & Production Management, 23 (7–8), 707–730.
Canter, J. (2000). An agility-based OODA model for the e-commerce/e-business enterprise.Retrieved from: http://www.belisarius.com/modern_business_strategy/canter/canter.htm.
Christopher, M. (1992). Logistics & Supply Chain Management: Strategies for Reducing Costand Improving Service. London, UK: Pitman.
Conner, D. R. (2000). How to create a nimble organization. National Productivity Review, 19 (4), 69–74.
Conboy, K. B., Fitzgerald. (2004). Towards a conceptual framework of agile methods: A study of agility in different disciplines. In Proceedings of the 2004 ACM workshop on inter-disciplinary software engineering research. Newport Beach, CA, pp. 37–44.
D’aveni, R., Richard A., Gunther, R. E. (1994). Hypercompetition: Managing the Dynamics ofStrategic Maneuvering. New York: The Free Press.
Business Agility: Need, Readiness and Alignment with IT Strategies 67
Ch005-H8235.qxd 25/7/06 11:53 AM Page 67
Daft, R. L., Sormunen, J., and Parks, D. (1988). Chief executive scanning, environmental char-acteristics, and company performance: An empirical study. Strategic Management Journal, 9(2), 123–139.
Dove, R. (2001). Response Ability: The Language, Structure and Culture of the Agile Enterprise.New York: Wiley.
Goldman, S., et al. (1991). 21st Century Manufacturing Enterprise Strategy. Bethlehem, PA:Iacocca Institute, Lehigh University.
Goldman, S., Nagel, R., and Preiss, K. (1995). Agile Competitors and Virtual Organizations.New York: Van Nostrand Reinhold.
Hooper, M. J., Steeple, D., and Winters, C. N. (2001). Costing customer value: An approach forthe agile enterprise. International Journal of Operations and Production Management, 21 (5),630–644.
Kidd, P. T. (1994). Agile Manufacturing: Forging New Frontiers. Wokingham, UK: Addison-Wesley.
Kidd, P. T. (1995). Agile Corporations: Business Enterprises in the 21st Century—An ExecutiveGuide. Macclesfield, UK: Cheshire Henbury.
Konsynski, B. and Tiwana, A. (2004). The improvisation-efficiency paradox in inter-firm elec-tronic networks: Governance and architecture considerations. Journal of InformationTechnology, 19 (4), 234–243.
Maskell, B. (2001). The age of agile manufacturing. Supply Chain Management: An InternationalJournal, 6 (1), 5–11.
Mason-Jones, R. and Towill, D. R. (1999). Total cycle time compression and the agile supply chain. International Journal of Production Economics, Special Issue 62 (1–2), 61–73.
Milliken, F. J. (1987). Three types of perceived uncertainty about environment: State, effect, andresponse uncertainty. Academy of Management Review. 12 (1), 133–143.
Preiss, K., Goldman, S. L., and Nagel, R. N. (1996). Cooperate to compete: Building agile busi-ness relationships. New York: Van Nostrand Reinhold.
Ramasesh, R., Kulkarni, S., and Jayakumar, M. (2001). Agility in manufacturing systems: Anexploratory modeling framework and simulation. Integrated Manufacturing Systems, 12 (7),534–548.
Sambamurthy, V., Bharadwaj, A., and Grover, V. (2003). Shaping agility through digital options:Reconceptualizing the role of information technology in contemporary firms. MIS Quarterly,27(2), 237–263.
Schrage, M. (2004). The struggle to define agility: It’s all about the Execution. CIO Magazine, Aug. 15th, 2004. Retrieved from: http://www.cio.com/archive/081504/schrage.html.
Sharifi, H. and Zhang, Z. (1999). A methodology for achieving agility in manufacturing organizations: An introduction. International Journal of Production Economics, 62 (1–2),7–22.
Swafford, P. M. (2003). Theoretical development and empirical investigation of supply chainagility. Dissertation, Georgia Institute of Technology, Atlanta, April, pp. 1–138.
van Hillegersberg, J., Boeke, R., and Van den Heuvel, W. J. (2005). The potential of web servicesto enable Smart Business Networks. In Smart Business Networks (P. H. M. Vervest, E. V.Heck, K. Preiss, L. F. Pau, eds.). Berlin-Heidelberg: Springer-Verlag, pp. 349–362.
van Hoek, R. I., Harrison, A., and Christopher, M. (2001). Measuring agile capabilities in thesupply chain. International Journal of Operations & Production Management, 21 (1/2),126–147.
Vervest, P. and Dunn, A. (2000). How to Win Customers in the Digital World: Total Action orFatal Inaction. Berlin-Heidelberg: Springer-Verlag.
Vervest, P. H. M., Heck, E. V., Preiss, K., and Pau, L. F. (eds.) (2005). Smart Business Networks.Berlin-Heidelberg: Springer-Verlag.
Wadhwa, S. and Rao, K. S. (2003). Flexibility and agility for enterprise synchronization:Knowledge and innovation management towards flexagility. Studies in Informatics andControl, 12 (2), 111–128.
Agile Information Systems68
Ch005-H8235.qxd 25/7/06 11:53 AM Page 68
Weill, P., Subramani, M., and Broadbent, M. (2002). IT Infrastructure for Strategic Agility. MITCISR Working Paper, No. 329, Center for Information Systems Research, Sloan School ofManagement.
Yusuf, Y. Y., et al. (2004). Agile supply chain capabilities: Determinants of competitive objectives.European Journal of Operational Research, 159 (2), 379–392.
Zhang, Z. and Sharifi, H. (2000). A methodology for achieving agility in manufacturing organizations. International Journal of Operations & Production Management, 20 (4),496–513.
Business Agility: Need, Readiness and Alignment with IT Strategies 69