36
The Promise of Collective Impact Business Aligning for Students: Allen S. Grossman Ann B. Lombard
| Date post: | 09-Apr-2018 |
| Category: |
Documents |
| Upload: | trinhthuan |
| View: | 217 times |
| Download: | 1 times |

The Promise of Collective ImpactBusiness Aligning for Students:
Allen S. GrossmanAnn B. Lombard

Conflict of interest disclosure Allen Grossman serves on the board of directors of an organization mentioned in this report, the Aspen Community Foundation. He receives no compensation for this work.
Cover photo Preschool students on Gus the Bus, a mobile preschool serving rural neighborhoods for the Aspen Community Foundation’s Collective Impact initiative.
Photo credit: ©Pat Sudmeier
Executive Summary 2
The National Problem 4
Launching Collective Impact 6
Business Leader Engagement in Collective Impact 11
Collective Impact in the Salt Lake Region 16
Conclusion 19
Appendix I: Interview List 20
Appendix II: Survey Methodology 22
Appendix III: Harvard Business School’s U.S. Competitiveness Project 23
Appendix IV: StrivePartnership Results (Cincinnati, Ohio) 24
Appendix V: Aspen to Parachute Cradle to Career Initiative Results (Roaring Fork Valley, Colorado) 25
Appendix VI: Commit! Dallas Results (Dallas, Texas) 26
Appendix VII: The Road Map Project Results (South Seattle and South King County, Washington) 27
Appendix VIII: Resources 28
1

This report calls on business leaders across America to take stock of their efforts to improve pre-kindergarten through 12 (pre-K–12) public education and commit to an innovative approach called “Collective Impact.” Collective Impact (CI) is a community endeavor that addresses fundamental weaknesses in the U.S. education ecosystem* and, by extension, the limitations of most business involvement in the field.
American businesses already contribute billions of dollars and countless volunteer hours each year to public education. Yet business leaders are often frustrated by the slow progress in improving outcomes.
Ironically, the way the business community commonly supports education can contribute to the slow progress. Much of business’s support is directed to nonprofit organizations that serve students outside the classroom. The tutoring, nutrition, counseling, mentoring, and other services that these nonprofits provide are crucial for the success of students affected by poverty. But in the typical town or city, each nonprofit addresses only one part of a highly interrelated education system. The nonprofits seldom collaborate with each other, rarely share common goals, and measure outcomes inconsistently. The result is service delivery chaos: Some services are duplicated, others are missing, and great providers do not displace poor ones.
Collective Impact aims to change this picture. In 145 communities across the country, CI is emerging as a new process and structure that shift the service delivery system from chaos to coherence. It brings community leaders together from the school district, nonprofit organizations, government, parent groups, businesses, and religious organizations. It keeps these diverse stakeholders working together as they move from planning to implementation and beyond. CI focuses on developing a common set of goals for pre-K–12 youngsters, improving the quality and coverage of services, identifying best practices, and measuring results. These four elements are mostly absent in today’s education ecosystem but are critical for high performance. They make systemic change possible.
In many promising CI efforts, business leaders and their employees play key roles. In the Cincinnati and Salt Lake
regions, for example, business leaders have been involved since early discussions of CI and have helped move the needle for tens of thousands of students.
Collective Impact has the long-term potential to be a game changer in American education. To realize its potential, however, CI needs the skills and resources of many more business leaders. And to contribute fully to CI, business leaders will have to modify how they think about systemic change and how they allocate their philanthropic time and money.
This report is based on interviews with 70 business and CI leaders and the first national survey of CI initiative leaders and business participants.** It makes the case for business leaders to get involved in Collective Impact and provides a roadmap for engagement.
A Dysfunctional SystemIn every community in America, a host of government programs and nonprofit organizations provide a range of services—from tutoring to mentoring to psychological counseling that young people need for learning but that schools are unable to furnish. Despite the magnitude of resources, there is scant evidence that the needs of the majority of young people affected by poverty are adequately met. As reported in The Washington Post on May 19, 2015, “The greatest barriers to school success for K–12 students have little to do with anything that goes on in the classroom, according to the nation’s top teachers: It is family stress, followed by poverty, and learning and psychological problems.”1 Even if you consider this an overstatement, the reality is that the system for delivering services to meet these needs has changed little over the years. Most government programs and nonprofit organizations operate in isolation and have little or no outcome data available to prove effectiveness or to compare one program’s results with those of another.2
This lack of data makes it extremely difficult, if not impossible, for business leaders and others to know how to allocate their resources efficiently. Money can go just as easily to organizations with “good stories” but little impact as to highly effective organizations.
Executive Summary
*The education ecosystem is the community of stakeholders that affect a student’s development, either directly or indirectly. This includes the school district, nonprofit organizations, and government agencies that provide the programs—from nutrition to tutoring—that enable young people to learn. It also includes parents, the business community, and faith-based and political leaders. Please see The Brink of Renewal: A Business Leader’s Guide to Progress in America’s Schools at www.hbs.edu/competitiveness for more information.
**See Appendix I for a list of people interviewed for this report. Harvard Business School surveyed initiative leaders involved in education-related Collective Impact organizations and the business leaders who served on their leadership councils in March 2015. See Appendix II for a description of the survey methodology.
2

Complicating the issue, most communities suffer from an overabundance of nonprofit service providers. There may be multiple programs to address one need, but none to address others. In 2013 alone, the number of nonprofit organizations providing services to young people—from cradle to career—increased by 7%, to over 89,000.3
As noted by Keith Burwell, president of the Toledo Community Foundation and one of the founders of Toledo’s Collective Impact initiative,
Toledo had a nonprofit infrastructure that rivaled many other Midwestern cities, but our city had only half the population of most of the others. For example, there were over 60 different tutoring programs across the county, many bumping into each other in the same school, and one didn’t even know the other existed. We were adamant that we didn’t need more organizations providing more programs, but instead we needed to determine what was working and align these programs to produce even better results.
The same situation exists in communities across America—too many government programs and nonprofit organizations working independently, with few if any shared goals, service redundancies existing alongside service gaps, and inadequate means to measure effectiveness. What results is a form of service delivery chaos. This disarray has prevailed for decades. Viable ideas for ameliorating it were few and far between before the advent of Collective Impact.
Collective Impact: A Response to Service Delivery ChaosCollective Impact fundamentally changes the way essential services are delivered to young people living in poverty.
Collective Impact began in the early 2000s and was formally described and named by John Kania and Mark Kramer in their 2011 Stanford Social Innovation Review article, “Collective Impact.” As applied to education, the idea is relatively simple: The rate of educational improvement will accelerate, particularly for students living in poverty, if the numerous service providers in a community delivering programs from “cradle to career” work together and in partnership with the school district to align their activities around a set of agreed-upon goals, use metrics to make decisions and determine progress, and identify and implement best practices.
CI in education is relatively new to the scene, but it is in various stages of development in 145 communities. In a number of communities where Collective Impact has made impressive gains, business leaders have been engaged in virtually every step of the journey, from planning CI to implementing it.
Business engagement with education-related nonprofits is not new. For decades business has supported education nonprofits with significant time and money. However, despite this support and the contributions of philanthropy and government at all levels, a large number of American youth are not making adequate progress. Business leaders have joined others in voicing deep frustration and have called for more fundamental systemic changes. Over the years, there have been many attempts to transform the education ecosystem, but in the end, little has changed. Collective Impact has the potential to rewrite this narrative.
Perhaps for the first time, business leaders have valid reasons to believe that the education ecosystem in their communities can be transformed and that they can play an important role. Business leaders we interviewed commit to CI because they feel:
• satisfaction that they are involved with a well-organized approach for changing the education ecosystem, rather than the frustration of treating the symptoms of the problem;
• pride that they are giving opportunities for a large number of young people to succeed in life;
• gratification that they are helping to create a skilled workforce well into the future;
• comfort that they are not acting in isolation but are part of a broad-based and sustainable community effort.
For example, eight years ago, leading members of the corporate community in greater Cincinnati, concerned with the lack of improvement in their community’s public education system, helped launch one of the first Collective Impact initiatives and they remain active members of the initiative’s leadership team today. Cincinnati’s results in five key education indicators are encouraging and are receiving a great deal of national attention: The number of children ready for kindergarten is up 13 percentage points; reading proficiency in 4th grade has increased by 21 percentage points; 8th grade math proficiency has improved by 24 percentage points; high school graduation rates are up by 14 percentage points; and post-secondary enrollment has increased by 11 percentage points.* (See Appendix IV.)
This report is designed for business leaders who want to understand better:
• why education ecosystem change is essential;
• what Collective Impact is and what it might achieve; and
• how they can get involved in existing Collective Impact initiatives or start new ones in their communities.
3Aligning for Students: Business and the Promise of Collective Impact
*While the trajectory is up for most indicators, gains are not consistent across all indicators and may even show a decline in any given year or over time.

4
R² = 0.6023
0
100
200
300
400
500
600
0% 10% 20% 30% 40% 50% 60% 70% 80% 90% 100%
Stud
ent p
erfo
rman
ce o
n st
ate
stan
dard
ized
test
s
Percentage of children receiving free or reduced-price lunch(a measure of poverty)
FIGURE 1: RELATIONSHIP BETWEEN POVERTY AND STUDENT OUTCOMES
Students in NeedWhile national high school graduation rates have reached 81%, many cities where poverty is prevalent lag far behind: Rochester, NY, has a graduation rate of 43%,4 and Minneapolis, MN, 59%.5 The Alliance for Excellent Education estimates that the almost 12 million students likely to drop out of school during the next decade will cost the country $1.5 trillion in lost income.6 While estimates vary, somewhere between one-third and more than half of those who do graduate from high school require remedial programs in order to participate in college courses.7
These data are accompanied by a persistent achievement gap among racial groups that has existed for decades but was masked by a lack of accurate or publicly available data. Since the enactment of No Child Left Behind legislation in 2002, schools have been required to collect student data in a uniform way, thus highlighting the disparities in achievement between children living in poverty and their more affluent peers. While some progress has been made over the past 30 years in closing the gap, the rate of change has been extremely slow. For example, in 1982,
on average, black students scored 34 points below their white counterparts on the math portion of the National Assessment of Educational Progress (NAEP); thirty years later, the gap was 28 points.8
Exacerbating this problem is the number of students living in or near poverty. Between 1994 and 2013 the number of U.S. public-school students eligible for free or reduced-price lunch* rose from one-third of all students to more than half.9 Many impoverished students begin kindergarten with a deficit that often cannot be overcome during their lives. For example, a three-year-old working-class child has a vocabulary of 749 words, while her counterpart living in poverty has a vocabulary of 525 words, a deficit of 30%.10
As shown by the regression analysis in Figure 1 from one representative school district, the relationship between poverty and low academic achievement is strong.
The National Problem
Source: United Way of Salt Lake, based on data from the Utah Comprehensive Accountability System (UCAS) Report, 2013–14 for 79 elementary and middle schools in one Utah school district.
*Students living in households earning 130% or less of the poverty level according to Federal policy guidelines are eligible for free lunch under the National School Lunch Program. Students living in households earning between 130% and 185% of the poverty level are eligible for reduced-price lunch.
5Aligning for Students: Business and the Promise of Collective Impact
A report by the Southern Education Foundation captures the gravity of the problem:
No longer can we consider the problems and needs of low-income students simply a matter of fairness…Their success or failure in public schools will determine the entire body of human capital and educational potential the nation will possess in the future. Without improving the educational support that the nation provides its low-income students—students with the largest needs and usually with the least support—the trends of the last decade will be a prologue for a nation not at risk, but a nation in decline.11
American CompetitivenessThe ability of this country to prepare young people for college or career will dramatically affect how well America will compete in a global economy.
The U.S. Competitiveness Project at Harvard Business School (HBS)* defines competitiveness in the following way:
The United States is competitive to the extent that firms operating in the U.S. can compete successfully in the global economy while supporting high and rising living standards for the average American.
But how can the United States increase living standards without improving its public education system and preparing enough students for college or career?
Research used for the U.S. Competitiveness work revealed that countries are outpacing the United States, causing American students to fall further behind. For example, in 2012 on the Program for International Student Assessment (PISA) tests of 15-year-olds, 23 of 65 countries scored higher than the U.S. in reading, up from 16 countries when the test was previously administered in 2009, and 35 countries outperformed the U.S. in math, up from 30.12 Also the U.S. no longer holds the lead in high school graduation rates. For citizens 55—64, the U.S. has the highest high school graduation rate of the 34 countries of the Organisation for Economic Co-operation and Development (OECD). However, for citizens 25–34 years old, a third of OECD countries have high school graduation rates as high as or higher than that of the U.S.13
It is difficult to make the case that the U.S.’s slow progress is due to a lack of resources. America spends more than $600 billion annually on public education, almost twice the amount in inflation-adjusted dollars as it did 30 years ago. Per student, it spends more than 27 of the 32 OECD countries for which data are available.14
Business leaders recognize that U.S.-based firms cannot compete without an educated populace and a skilled workforce. Partly for that reason, businesses contribute
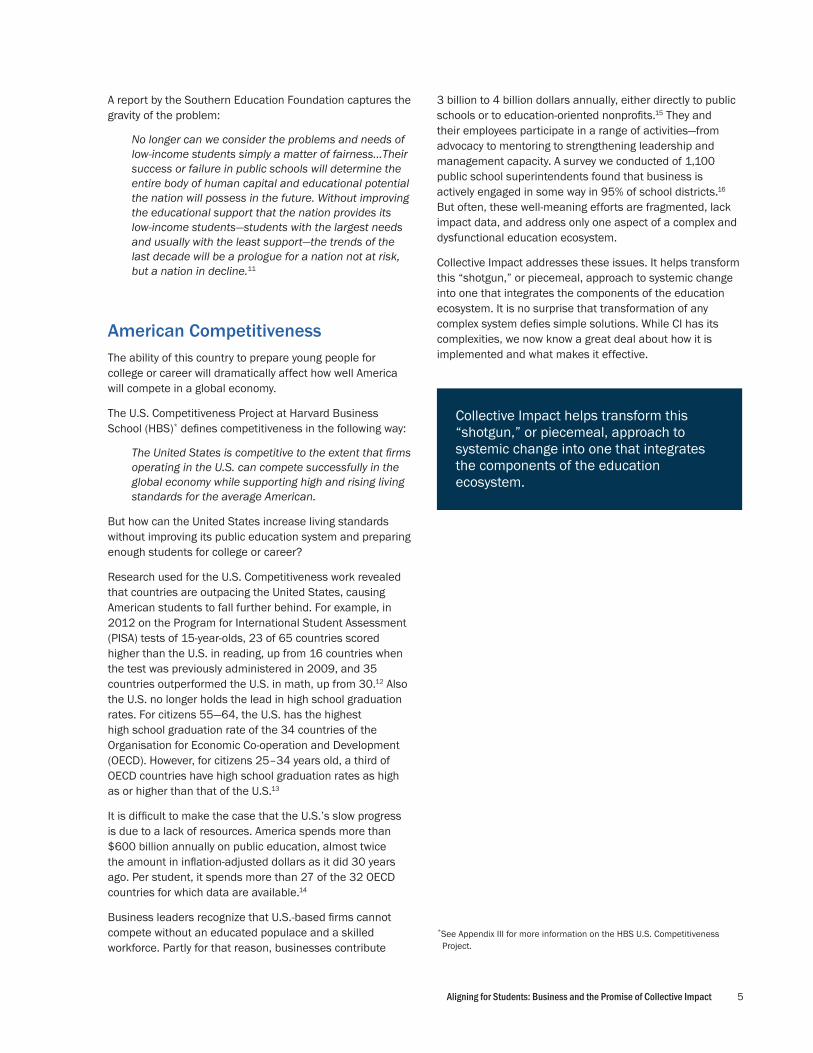
3 billion to 4 billion dollars annually, either directly to public schools or to education-oriented nonprofits.15 They and their employees participate in a range of activities—from advocacy to mentoring to strengthening leadership and management capacity. A survey we conducted of 1,100 public school superintendents found that business is actively engaged in some way in 95% of school districts.16 But often, these well-meaning efforts are fragmented, lack impact data, and address only one aspect of a complex and dysfunctional education ecosystem.
Collective Impact addresses these issues. It helps transform this “shotgun,” or piecemeal, approach to systemic change into one that integrates the components of the education ecosystem. It is no surprise that transformation of any complex system defies simple solutions. While CI has its complexities, we now know a great deal about how it is implemented and what makes it effective.
Collective Impact helps transform this “shotgun,” or piecemeal, approach to systemic change into one that integrates the components of the education ecosystem.
*See Appendix III for more information on the HBS U.S. Competitiveness Project.
6
The Stakeholders’ CommitmentSince the education ecosystem is different in every community, perhaps the easiest way to understand Collective Impact is to follow a hypothetical example of how it might evolve in a typical American community. This description is culled from an analysis of CI initiatives as well as from interviews with CI leaders around the country. (We have combined elements that emerged from multiple sites in order to paint a composite picture.)
Imagine a business leader in Smithtown, USA, who has become familiar with the state of public education in her area and is frustrated by a lack of sustained improvement. This leader is active on a number of nonprofit boards, including the United Way. She broaches the idea of introducing CI into the community with the United Way CEO, and the idea resonates with him. The United Way then convenes a meeting of community leaders to discuss how they might work together to finally achieve meaningful progress in their public education ecosystem. Everyone at the table acknowledges that the current stagnation is not for lack of trying and that the community has been striving for decades, if not generations, to improve public education. Collectively, they have funded what feels like an endless number of requests from new or existing education nonprofits. Yet they have seen an array of heralded “silver bullet” solutions fade away, failing to deliver on their “promise” of lasting change. The conversation may include the following laments:
I support tutoring in our high schools, but there are more than a dozen organizations in our city providing these services. How do I know which of these to support?
When we fail to get the promised results from tutoring, we are told by “experts” that mentoring has more potential for impact.
Year after year, I hear that conditions for our young people would improve more rapidly if service providers worked together. The following year, nothing has changed; they are still working alone, and yet they still acknowledge that working together would be more effective.
I support summer programs that have delivered measurable gains in reading and math. I get so frustrated when the kids go back to school and the gains disappear during the school year.
We have to change the education ecosystem for lasting results, but no one seems to have a roadmap for how to do it.
The conversation continues and begins to focus on the potential of the new model for systemic change called Collective Impact. The business leader describes the five key elements of any CI initiative identified in John Kania and Mark Kramer’s article on Collective Impact:
Common Agenda—All stakeholders have a shared vision for change, including a common understanding of the problem and a joint approach for solving it through agreed-upon activities.
Shared Measurement—All service-providing participants (schools, nonprofits, and government agencies) consistently collect data and measure results to ensure efforts remain aligned and accountable.
Mutually Reinforcing Activities—Service activities are aligned through a mutually reinforcing action plan.
Continuous Communication—All stakeholders agree to consistent and open communication to build trust, articulate mutual objectives, and foster cooperation.
Backbone Support—A separate organization, called a backbone, is created to manage Collective Impact and is staffed with personnel to serve the initiative and coordinate participating organizations and agencies.
The key components make intuitive sense, and the group decides to pursue the idea. Fortunately, the CI field is rich with resources for the emerging leadership team of Smithtown. They reach out to existing CI initiatives and consultants, and they refer to websites and articles to help build a strategy for moving forward. (See the sidebar on page 10.) The launch process might unfold in the following way:
The first task is to bring other influential community leaders to the table to discuss the lack of educational progress and this new approach for fundamentally changing the educational ecosystem. The assembled stakeholders include nonprofit service providers, philanthropists, parents, businesses, faith-based organizations, government officials, and others. The mix will vary from community to community.
The United Way leader realizes that their initiative will require deliberate and systematic planning and an ongoing commitment from engaged leaders. The bedrock of this collaboration is agreement that:
• improved public education requires the commitment of a diverse range of community leaders;
• quality education is critical for developing the skilled workers needed to attract well-paying jobs to their community;
Launching Collective Impact

7Aligning for Students: Business and the Promise of Collective Impact
• quality education is a means for reducing poverty and giving all children the opportunity to fulfill their potential;
• the current pre-K–12 public education ecosystem is not achieving these objectives; and
• a new approach is needed that will transform the education ecosystem.
The next step is to establish a facilitating entity, usually called a backbone. The leadership team learns that, of the 48 CI initiatives responding to a survey question on this subject, 21 established a new nonprofit to serve as a backbone and 27 lodged it in an existing entity.* In the case of the Salt Lake, Utah, region, the backbone is part of the local United Way. In the Roaring Fork Valley of Colorado, it is part of the Aspen Community Foundation. In Cincinnati, Ohio, it is part of the KnowledgeWorks Foundation. In Toledo, Ohio, a new nonprofit organization was created.
In each of these cases, local stakeholders signed on knowing that CI’s systemic approach would require a long-term commitment. Owens Corning’s chief executive Michael Thaman, who is engaged in the Toledo CI initiative, said,
Over the next 3 years, we will see movement in a few metrics, but we are looking at a 5– to 10–year horizon before we expect to have a self-sustaining culture change in our education institutions and widespread improved educational outcomes.
The Backbone’s Critical RoleIt becomes apparent to the leaders in Smithtown that the key to success for all CI initiatives is the effectiveness of the backbone entity. It is responsible for initiating and continuously managing implementation. Major tasks within its purview include:
• convening stakeholders to:
○ determine students’ most pressing needs,
○ establish overall initiative goals,
○ identify populations not receiving needed services or receiving lower quality services,
○ help service providers through the tough conversations about the dearth of progress, and
○ identify ways programs can build on and reinforce one another’s work;
• ensuring an infrastructure exists to develop baseline data, continually collect data, and create a common measurement system that monitors progress and identifies best practices;
• mobilizing the required human and financial resources to sustain itself and help support new programs;
• establishing a representative governance structure
that provides guidance, counsel, and credibility to the initiative; and
• communicating to the public all aspects of the CI initiative—from the need for CI, to its unique characteristics, to the progress being made toward its goals.
Smithtown’s leadership team realizes that the challenge of creating and sustaining an effective backbone entity is substantial. Adequate monetary resources must be raised and could represent the most substantial incremental annual cost of an initiative. A backbone entity must be led by an individual who has a host of attributes, including communication skills, political and financial acumen, respect in the community, patience, empathy, tenacity, and an understanding of the educational landscape. Perhaps the most challenging leadership attribute is the ability to get things done without formal or line authority over the nonprofit organizations, government agencies, and school districts she works with. A leader in this role cannot “order” but must persuade all the stakeholders to embrace the tenets of CI. These backbone leaders are difficult to find, recruit, and retain. But community stakeholders, working together, have done just that for initiatives from Seattle to Toledo.
The Pathway from Organizing to ImplementingLike virtually all CI initiatives, Smithtown’s United Way leader gains the insight that getting service providers to agree to the appealing principles of CI turns out to be a good bit easier than effectively implementing CI’s disruptive approach. A successful CI initiative fundamentally changes the go-it-alone culture of the old education ecosystem to one of partnership. This cooperation requires deliberate behavioral shifts that help promote trust among disparate community stakeholders who may not have known each other, much less worked together on a common objective. As Jeff Edmondson, managing director of StriveTogether, often states, “Collective Impact moves at the speed of trust.”
Despite this challenge, 69% of business leaders who responded to our survey identified the “potential to change how educators and the community work together toward a shared goal” as an extremely important reason for their involvement.**
To implement CI, Smithtown, like most initiatives, will divide into action teams focused on similar populations or specialties. One team focuses on 4th-grade reading, while another focuses on post-secondary enrollment. Each
*HBS CI survey conducted March, 2015.**An additional 26% rated it a 4 on a 5-point scale, for a combined total of
95%. See Figure 7 on page 13 for the full range of responses.
8
team identifies specific objectives and evidence-based interventions to achieve them. Nonprofit service providers and schools with the appropriate capacity are selected to deliver the interventions. The action teams measure intervention results against a baseline to determine whether they are having the desired effect and if improvements are needed. Action teams report regularly to the executive committee and receive analytical support and other resources from the backbone organization.
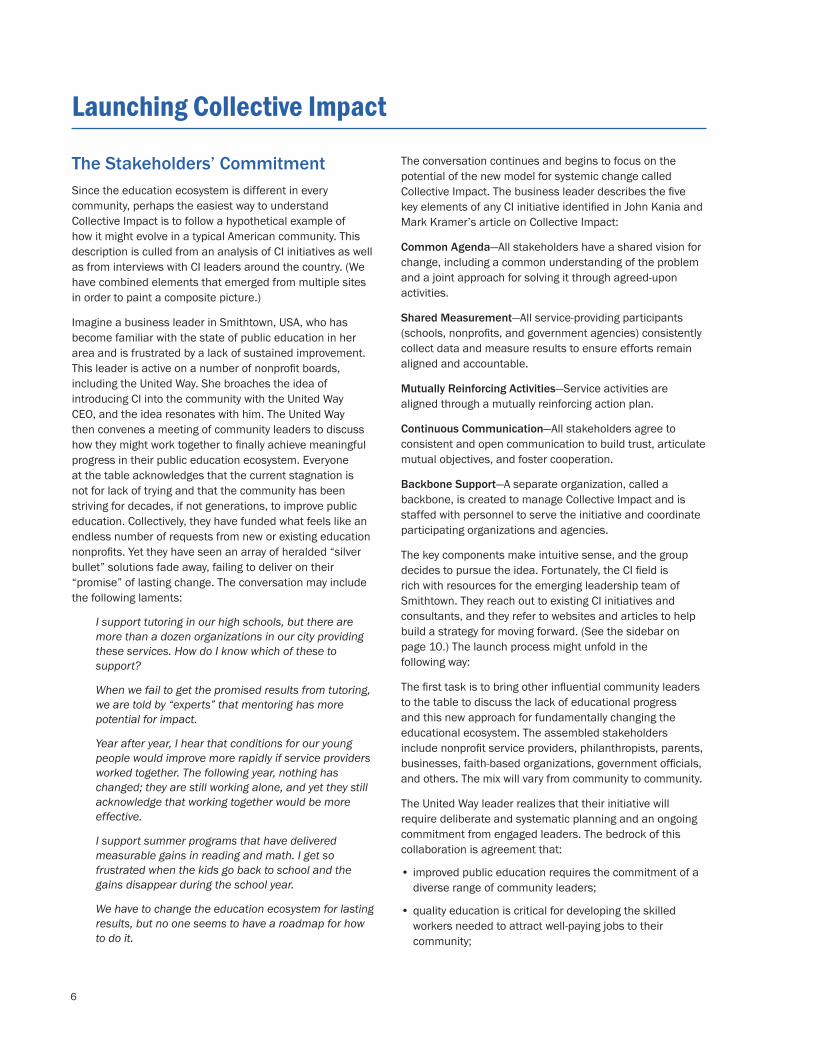
Smithtown’s CI leadership team must continually remind the community that it often takes two or more years for the components of CI to mesh effectively and to begin to realize systemic change. Although there can be some early gains with CI, initiative and business leaders agreed that stakeholders must be in for the long haul and willing to tolerate bumpy results along the way. Of those initiative leaders responding to the survey, only 4% thought that organizational goals would be achieved in one or two years, while a large majority expected it to take six or more years. The responses to this question from business leaders closely mirrors the responses of initiative leaders. (See Figure 2.)
It was encouraging to discover that two-thirds of the business leaders surveyed also expected to remain involved in their respective CI initiatives for three years or longer. (See Figure 3 on page 9.)
Smithtown has moved a long way in establishing a vibrant CI initiative. But in many ways, the work is just beginning. However, as the initiative moves forward, all the stakeholders take heart in knowing that CI is making a difference in other communities around America and has the potential to enable profound change in Smithtown.
The Benefits RealizedThe essence of CI is to spend existing money more effectively and create a more productive education ecosystem. With the exception of new resources required to establish and support a backbone entity, additional investment needs will depend on the quality and coverage of existing services.
When service providers communicate and work together, they develop a greater appreciation for the interconnectedness of issues facing young people. For example, when a social worker coordinates with a reading specialist to develop an approach that aligns with students’ individualized needs, the bottom line is that children have a better chance of succeeding. Karen Nelson, a 2nd grade teacher in Salt Lake observed:
The multidisciplinary team approach helps us ensure that no students fall through the cracks. By working together, we maximize resources for students and their families and have increased staff morale. Our collaborative efforts make a significant difference in outcomes for kids.
Over time, service providers are able to demonstrate their effectiveness with outcome measures, and backbone entities can provide comparative information across similar programs. With access to these data, business leaders and other funders are able to direct their support to where it would have the greatest impact. While this process may cause distress among service providers who are doing business as usual and are not part of an initiative, it helps to ensure that resources reward the most effective programs and organizations.
4%
21%
44%
31%
1–2 years
3–5 years
6–10 years
More than 10 years
3%
29%
42%
25%
Initiative Leaders Business Leaders
FIGURE 2: EXPECTED LENGTH OF TIME TO ACHIEVE CI INITIATIVE’S OVERALL OBJECTIVES
Source: HBS survey of business and initiative leaders involved in education-related Collective Impact initiatives, conducted March, 2015.

9Aligning for Students: Business and the Promise of Collective Impact
With access to outcome data and a deeper appreciation for how to use it, nonprofit and government service providers begin to understand the value of measurement. They shift from making decisions based on outputs—in other words, how many students received services—to data-driven decision making that identifies what programs are effective and why. They use data to improve programs, develop new programs, decide which programs to discontinue, and identify and fill service gaps.
This process unfolded in western Colorado. At the confluence of the Roaring Fork and Colorado Rivers, a variety of pre–K services existed alongside yawning service gaps. Only 7% of low-income youngsters were enrolled in preschool programs. These children, mostly English Language Learners, resided in two rural school districts, and because their parents often commuted long distances to work, many typically spent their days in the home of a friend, relative, or neighbor. They may have been well cared for, but for the most part, they were not being prepared for kindergarten. Both school districts were aware that gaps in service existed, but each was already stretched to its limits addressing the needs of children already in school. Private and nonprofit organizations were delivering pre-K programs in other parts of the region but were unable to address these gaps. No entity was responsible for ensuring that quality preschool was available to all children.
This was true until the Aspen Community Foundation started a Collective Impact initiative in 2012.
The CI initiative helped facilitate collaboration between school officials and parents, and the result was to retrofit a school bus into a mobile preschool with the amiable name
“Gus the Bus.” Staffed with bilingual teachers, the bus spends two hours, two days per week for ten months in each of six rural neighborhoods, delivering high-quality preschool programs to 60 youngsters.18
To address additional unmet needs, another bus, “The Sunshine Bus,” was launched in 2013. “Gus” and “Sunshine” students consistently show substantial growth in cognitive, social-emotional, language, and literary skills—on par with children who attend quality brick-and-mortar preschools. In addition to benefitting children directly, the program also builds parenting skills and fosters parent engagement with their children and their communities.
Based on the outstanding results of the program, the State of Colorado created a special licensing category in 2015 to support and encourage mobile preschools in other areas with, in the state’s words, “preschool deserts.”
Most communities would have declared victory. However, the CI leaders realized the bus program did not completely fill the region’s preschool gaps. In 2014, the CI initiative tested a five-week intensive summer preschool program, Jumpstart, for children who lived outside the areas served by the two buses. The results exceeded the most optimistic projections and plans are in the works to extend this summer program to other communities. (See Appendix V for results.) The CI initiative is working with the school districts and service providers to ensure these pre-school gains are built upon once students enter kindergarten and continue through school.
John Bennett, the Aspen Community Foundation’s Cradle to Career director reflected:
5%12%
41%
24%
2%
17%
Less than 1 year1–2 years3–5 years6–10 yearsMore than 10 yearsDon't know
FIGURE 3: BUSINESS LEADERS’ EXPECTATIONS FOR LENGTH OF INVOLVEMENT
Source: HBS survey of business and initiative leaders involved in education-related Collective Impact initiatives, conducted March, 2015.
10
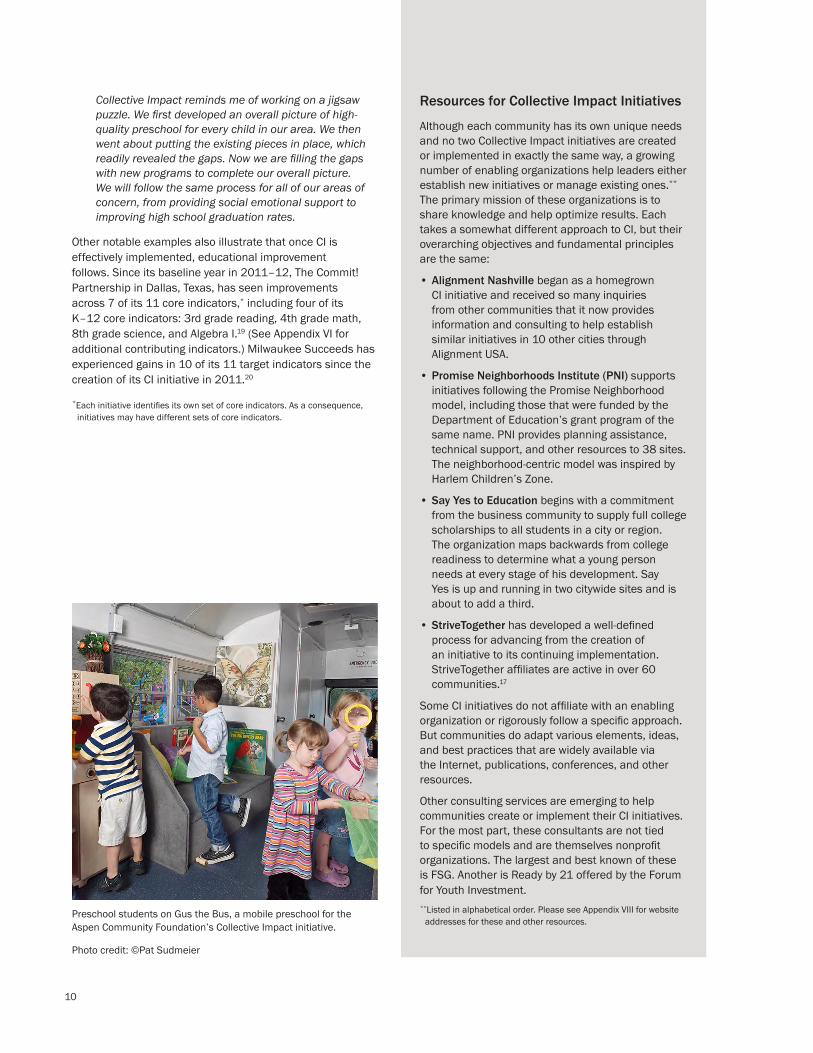
Collective Impact reminds me of working on a jigsaw puzzle. We first developed an overall picture of high-quality preschool for every child in our area. We then went about putting the existing pieces in place, which readily revealed the gaps. Now we are filling the gaps with new programs to complete our overall picture. We will follow the same process for all of our areas of concern, from providing social emotional support to improving high school graduation rates.
Other notable examples also illustrate that once CI is effectively implemented, educational improvement follows. Since its baseline year in 2011–12, The Commit! Partnership in Dallas, Texas, has seen improvements across 7 of its 11 core indicators,* including four of its K–12 core indicators: 3rd grade reading, 4th grade math, 8th grade science, and Algebra I.19 (See Appendix VI for additional contributing indicators.) Milwaukee Succeeds has experienced gains in 10 of its 11 target indicators since the creation of its CI initiative in 2011.20
*Each initiative identifies its own set of core indicators. As a consequence, initiatives may have different sets of core indicators.
Resources for Collective Impact Initiatives
Although each community has its own unique needs and no two Collective Impact initiatives are created or implemented in exactly the same way, a growing number of enabling organizations help leaders either establish new initiatives or manage existing ones.** The primary mission of these organizations is to share knowledge and help optimize results. Each takes a somewhat different approach to CI, but their overarching objectives and fundamental principles are the same:
• Alignment Nashville began as a homegrown CI initiative and received so many inquiries from other communities that it now provides information and consulting to help establish similar initiatives in 10 other cities through Alignment USA.
• Promise Neighborhoods Institute (PNI) supports initiatives following the Promise Neighborhood model, including those that were funded by the Department of Education’s grant program of the same name. PNI provides planning assistance, technical support, and other resources to 38 sites. The neighborhood-centric model was inspired by Harlem Children’s Zone.
• Say Yes to Education begins with a commitment from the business community to supply full college scholarships to all students in a city or region. The organization maps backwards from college readiness to determine what a young person needs at every stage of his development. Say Yes is up and running in two citywide sites and is about to add a third.
• StriveTogether has developed a well-defined process for advancing from the creation of an initiative to its continuing implementation. StriveTogether affiliates are active in over 60 communities.17
Some CI initiatives do not affiliate with an enabling organization or rigorously follow a specific approach. But communities do adapt various elements, ideas, and best practices that are widely available via the Internet, publications, conferences, and other resources.
Other consulting services are emerging to help communities create or implement their CI initiatives. For the most part, these consultants are not tied to specific models and are themselves nonprofit organizations. The largest and best known of these is FSG. Another is Ready by 21 offered by the Forum for Youth Investment.**Listed in alphabetical order. Please see Appendix VIII for website
addresses for these and other resources.Preschool students on Gus the Bus, a mobile preschool for the Aspen Community Foundation’s Collective Impact initiative.
Photo credit: ©Pat Sudmeier
11Aligning for Students: Business and the Promise of Collective Impact
What They Do and Why They Do ItStrivePartnership in Cincinnati and northern Kentucky highlights how business leaders engage in a CI initiative. As the StrivePartnership was being created in 2006, the chair of Procter & Gamble became an early champion of the work and joined the original leadership council. He used his organizational skills to help develop focused and easy-to-understand objectives for the initiative. Jeff Edmondson observed,
Just having business leaders show up was valuable. They brought a fresh approach and asked blunt questions that needed to be asked to move the conversation beyond the typical education-speak.
Also in Cincinnati, service providers and the local unit of GE decided that GE’s proven Six Sigma approach* to quality control and continuous learning would be a valuable tool for the school district and nonprofit organizations. GE allocated employee time to help train stakeholders to adapt and implement Six Sigma in the initiative. Six Sigma became the guiding framework for StrivePartnership’s action teams.21 Each team adopted a specific goal that would contribute to achieving the Partnership’s priorities. It then followed a data-driven process for execution, including establishing a baseline level of performance, identifying and testing the
strategies to see what worked, then modifying strategies to improve performance. More recently, business helped the StrivePartnership build a data system that for the first time collects school and service provider data into a single database, making it easier for schools and nonprofits to use data to serve students more effectively.
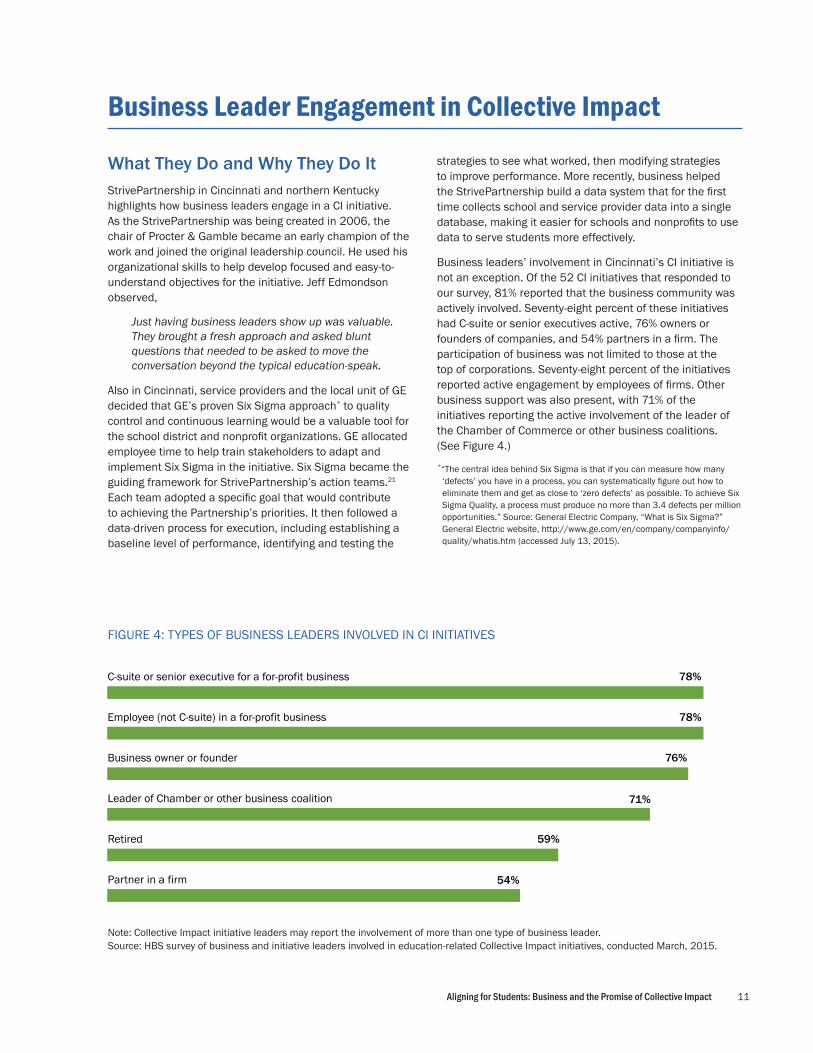
Business leaders’ involvement in Cincinnati’s CI initiative is not an exception. Of the 52 CI initiatives that responded to our survey, 81% reported that the business community was actively involved. Seventy-eight percent of these initiatives had C-suite or senior executives active, 76% owners or founders of companies, and 54% partners in a firm. The participation of business was not limited to those at the top of corporations. Seventy-eight percent of the initiatives reported active engagement by employees of firms. Other business support was also present, with 71% of the initiatives reporting the active involvement of the leader of the Chamber of Commerce or other business coalitions. (See Figure 4.)*“The central idea behind Six Sigma is that if you can measure how many
‘defects’ you have in a process, you can systematically figure out how to eliminate them and get as close to ‘zero defects’ as possible. To achieve Six Sigma Quality, a process must produce no more than 3.4 defects per million opportunities.” Source: General Electric Company, “What is Six Sigma?” General Electric website, http://www.ge.com/en/company/companyinfo/quality/whatis.htm (accessed July 13, 2015).
Business Leader Engagement in Collective Impact
78%C-suite or senior executive for a for-profit business
Employee (not C-suite) in a for-profit business
Business owner or founder
Leader of Chamber or other business coalition
Retired
Partner in a firm
78%
76%
71%
59%
54%
FIGURE 4: TYPES OF BUSINESS LEADERS INVOLVED IN CI INITIATIVES
Note: Collective Impact initiative leaders may report the involvement of more than one type of business leader. Source: HBS survey of business and initiative leaders involved in education-related Collective Impact initiatives, conducted March, 2015.
12
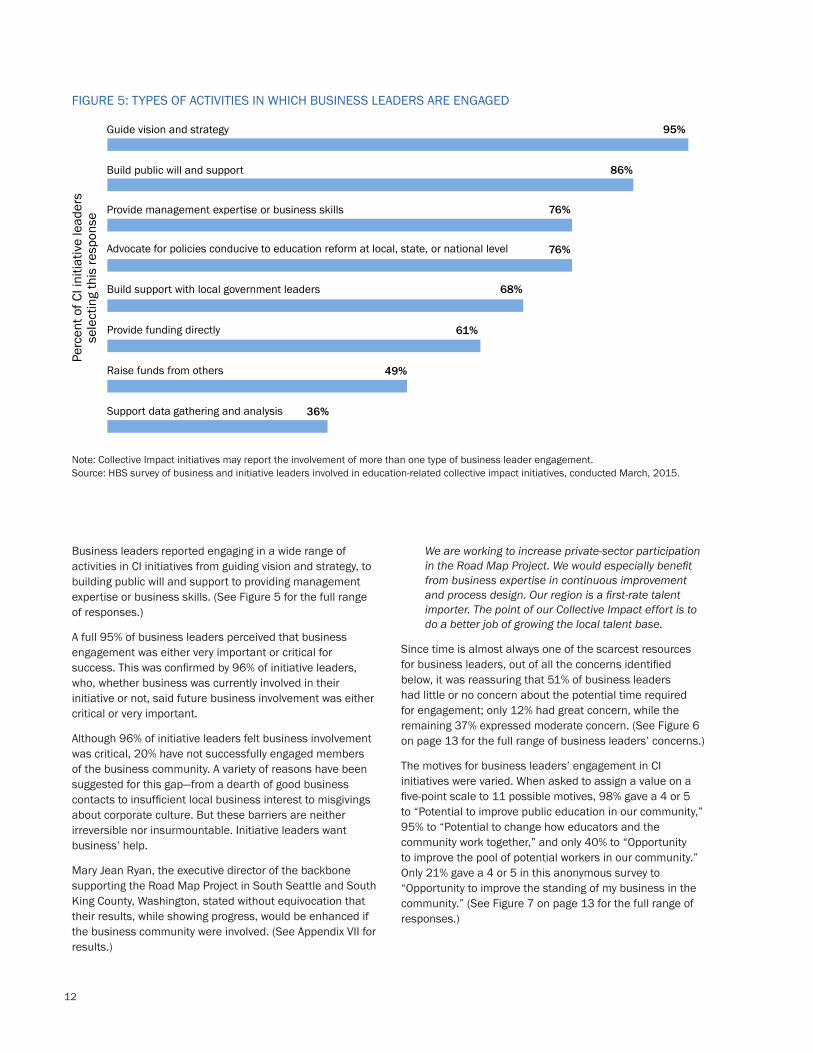
Business leaders reported engaging in a wide range of activities in CI initiatives from guiding vision and strategy, to building public will and support to providing management expertise or business skills. (See Figure 5 for the full range of responses.)
A full 95% of business leaders perceived that business engagement was either very important or critical for success. This was confirmed by 96% of initiative leaders, who, whether business was currently involved in their initiative or not, said future business involvement was either critical or very important.
Although 96% of initiative leaders felt business involvement was critical, 20% have not successfully engaged members of the business community. A variety of reasons have been suggested for this gap—from a dearth of good business contacts to insufficient local business interest to misgivings about corporate culture. But these barriers are neither irreversible nor insurmountable. Initiative leaders want business’ help.
Mary Jean Ryan, the executive director of the backbone supporting the Road Map Project in South Seattle and South King County, Washington, stated without equivocation that their results, while showing progress, would be enhanced if the business community were involved. (See Appendix VII for results.)
We are working to increase private-sector participation in the Road Map Project. We would especially benefit from business expertise in continuous improvement and process design. Our region is a first-rate talent importer. The point of our Collective Impact effort is to do a better job of growing the local talent base.
Since time is almost always one of the scarcest resources for business leaders, out of all the concerns identified below, it was reassuring that 51% of business leaders had little or no concern about the potential time required for engagement; only 12% had great concern, while the remaining 37% expressed moderate concern. (See Figure 6 on page 13 for the full range of business leaders’ concerns.)
The motives for business leaders’ engagement in CI initiatives were varied. When asked to assign a value on a five-point scale to 11 possible motives, 98% gave a 4 or 5 to “Potential to improve public education in our community,” 95% to “Potential to change how educators and the community work together,” and only 40% to “Opportunity to improve the pool of potential workers in our community.” Only 21% gave a 4 or 5 in this anonymous survey to “Opportunity to improve the standing of my business in the community.” (See Figure 7 on page 13 for the full range of responses.)
95%Guide vision and strategy
Build public will and support
Provide management expertise or business skills
Advocate for policies conducive to education reform at local, state, or national level
Build support with local government leaders
Provide funding directly
86%
76%
76%
68%
61%
Raise funds from others 49%
Support data gathering and analysis 36%
Perc
ent o
f CI i
nitia
tive
lead
ers
sele
ctin
g th
is re
spon
seFIGURE 5: TYPES OF ACTIVITIES IN WHICH BUSINESS LEADERS ARE ENGAGED
Note: Collective Impact initiatives may report the involvement of more than one type of business leader engagement. Source: HBS survey of business and initiative leaders involved in education-related collective impact initiatives, conducted March, 2015.

13Aligning for Students: Business and the Promise of Collective Impact
69%Concern about the challenges of improving the education system
Concern that the pace of change would be too slow
Concern about how time-consuming the work would be
Concern that the collective impact process would be frustrating
Concern about financial commitment
Concern about the absence of otherbusinesses in the initiative
61%
49%
47%
32%
29%
Concern about how controversial or contentious improving public education is in the community 25%
Concern about the initiative’sorganizational structure or leadership style 29%
Perc
ent o
f bus
ines
s le
ader
s se
lect
ing
“gre
at c
once
rn” o
r “m
oder
ate
conc
ern”
FIGURE 6: CONCERNS REPORTED BY BUSINESS LEADERS BEFORE JOINING A CI INITIATIVE
98%Potential to improve public education in our community
Initiative’s ability to show tangible progress against measurable outcomes
Potential to change how educators and the community work together toward a shared goal
Initiative’s ability to align previously uncoordinated efforts
Interest in collective impact as a way to bring about change to complex social problems
Quality of the leadership of the initiative
95%
93%
93%
90%
82%
Opportunity to improve the standing of my business in the community 21%
Opportunity to improve the pool of potential employees for my business 40%
41%I was asked to join
95%
97%
Initiative’s ability to deploy community resources more efficiently
Initiative’s emphasis on using data to drive decision making
Perc
ent o
f bus
ines
s le
ader
s re
spon
ding
4 o
r 5 o
n a
5-po
int s
cale
whe
re 1
is “
not i
mpo
rtant
” and
5 is
“ext
rem
ely
impo
rtant
”
FIGURE 7: REASONS FOR BUSINESS INVOLVEMENT
Note: Other choices were “little concern,” “no concern,”or “not applicable.” Business leaders may report more than one type of concern.
Source: HBS survey of business and initiative leaders involved in education-related Collective Impact initiatives, conducted March, 2015.
Note: Business leaders may report more than one reason for joining a Collective Impact initiative.
Source: HBS survey of business and initiative leaders involved in education-related Collective Impact initiatives, conducted March, 2015.
14
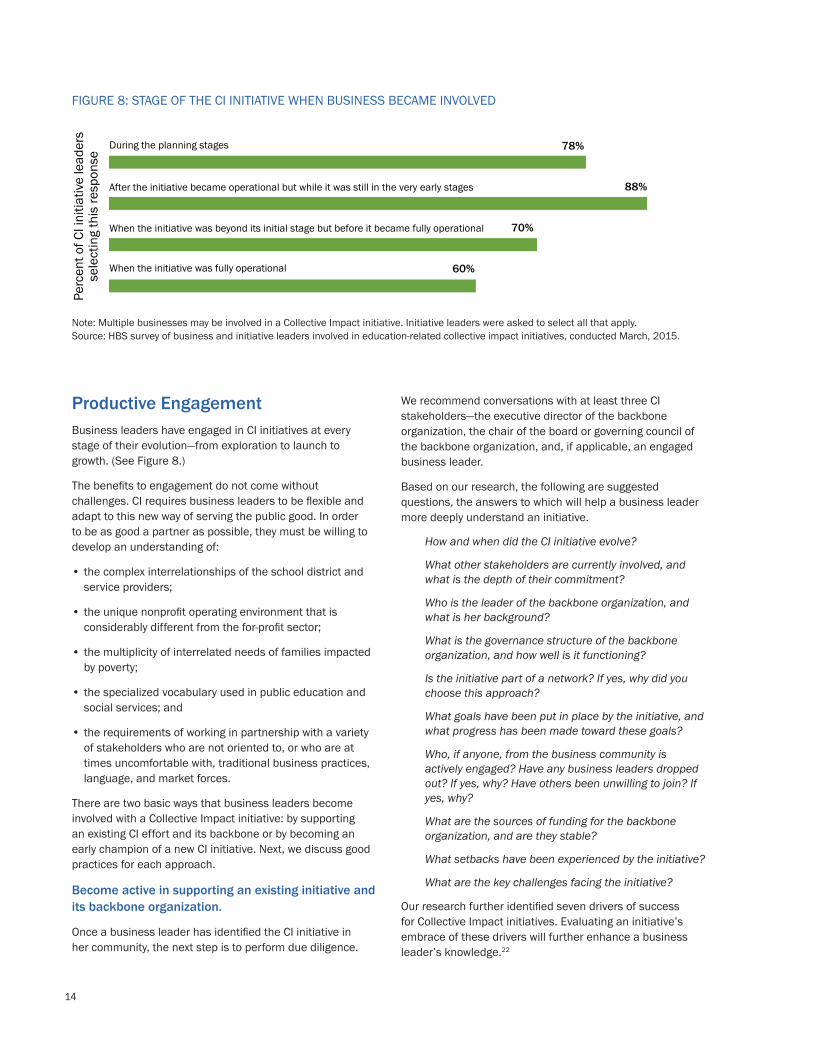
Productive Engagement Business leaders have engaged in CI initiatives at every stage of their evolution—from exploration to launch to growth. (See Figure 8.)
The benefits to engagement do not come without challenges. CI requires business leaders to be flexible and adapt to this new way of serving the public good. In order to be as good a partner as possible, they must be willing to develop an understanding of:
• the complex interrelationships of the school district and service providers;
• the unique nonprofit operating environment that is considerably different from the for-profit sector;
• the multiplicity of interrelated needs of families impacted by poverty;
• the specialized vocabulary used in public education and social services; and
• the requirements of working in partnership with a variety of stakeholders who are not oriented to, or who are at times uncomfortable with, traditional business practices, language, and market forces.
There are two basic ways that business leaders become involved with a Collective Impact initiative: by supporting an existing CI effort and its backbone or by becoming an early champion of a new CI initiative. Next, we discuss good practices for each approach.
Become active in supporting an existing initiative and its backbone organization.
Once a business leader has identified the CI initiative in her community, the next step is to perform due diligence.
We recommend conversations with at least three CI stakeholders—the executive director of the backbone organization, the chair of the board or governing council of the backbone organization, and, if applicable, an engaged business leader.
Based on our research, the following are suggested questions, the answers to which will help a business leader more deeply understand an initiative.
How and when did the CI initiative evolve?
What other stakeholders are currently involved, and what is the depth of their commitment?
Who is the leader of the backbone organization, and what is her background?
What is the governance structure of the backbone organization, and how well is it functioning?
Is the initiative part of a network? If yes, why did you choose this approach?
What goals have been put in place by the initiative, and what progress has been made toward these goals?
Who, if anyone, from the business community is actively engaged? Have any business leaders dropped out? If yes, why? Have others been unwilling to join? If yes, why?
What are the sources of funding for the backbone organization, and are they stable?
What setbacks have been experienced by the initiative?
What are the key challenges facing the initiative?
Our research further identified seven drivers of success for Collective Impact initiatives. Evaluating an initiative’s embrace of these drivers will further enhance a business leader’s knowledge.22
78%
After the initiative became operational but while it was still in the very early stages
During the planning stages
When the initiative was beyond its initial stage but before it became fully operational 70%
88%
60%
Perc
ent o
f CI i
nitia
tive
lead
ers
sele
ctin
g th
is re
spon
se
When the initiative was fully operational
FIGURE 8: STAGE OF THE CI INITIATIVE WHEN BUSINESS BECAME INVOLVED
Note: Multiple businesses may be involved in a Collective Impact initiative. Initiative leaders were asked to select all that apply. Source: HBS survey of business and initiative leaders involved in education-related collective impact initiatives, conducted March, 2015.
15Aligning for Students: Business and the Promise of Collective Impact
• An unrelenting focus on measurement and results. Measurement is at the core of conversations about which programs are effective and how to improve them.
• Educator leadership. Top public education leaders are involved; without their buy-in, deep change is highly unlikely.
• No one best way. The initiative is adapted to local circumstances, and the components of the local ecosystem fit with each other and align with the needs of the community.
• Questions before answers. Business and other leaders listen carefully, ask questions, and know the issues before advocating for approaches.
• Humility in the face of complexity. Business leaders develop an understanding that solving problems in the social sector—with multiple stakeholders, no central control, and multifaceted goals—is often more complex than tackling business issues.
• Harnessing diversity. Sensitivity to inequality and issues of race and class is present in initiative discussions.
• Building management capacity. Ecosystem leaders have the management capacity to design, implement, and sustain change.
The answers to the questions above and the status of an initiative’s drivers of success will help make it clear to a business leader how to become most productively engaged. Some of the ways businesses often engage are listed in Figure 5 on page 12.
Become an early champion and work with key community stakeholders to launch a CI initiative
Of the two ways to get involved with CI, starting an initiative is by far the heavier lift. If you refer to the Launching Collective Impact section of this report on page 6, it is easy to see why. Just getting the “right” people in the community to the table requires time and commitment. Moving from organizing and planning to building a CI initiative is also a notable challenge. That being said, some CI initiatives are now in place because business leaders led the charge.
An impressive example in which business leadership was key to creating a CI initiative lies in Utah’s Salt Lake region. There, business leaders who served on the board of the local United Way worked with its CEO and key staff to launch and sustain their CI initiative. These business leaders appreciated from the outset that systemic ecosystem change was critical and would be a long-term proposition. They became and remain the “champions” of CI in the Salt Lake region. The United Way of Salt Lake now directs 70% of the resources it invests in the community to support its CI work. Strong results across seven communities are being realized. (See the sidebar for the Salt Lake region Collective Impact story on page 16.)
At the Very Least—How to Support CIWhile we strongly advocate for business leaders to embrace CI as the most impactful and effective use of their time and resources, we appreciate that some business leaders may prefer to focus exclusively on specific education programs or nonprofit organizations. For a combination of personal reasons or corporate commitments, these business leaders may not be ready, willing, or able to commit to joining or starting a CI initiative.
However, they can still support a CI initiative in a meaningful way while staying involved in their specific programs or nonprofit organizations. Benefits can be realized if they require the organization(s) they support to participate in a CI initiative. Business pressure of this kind helps shift the nonprofit culture from one that relies mostly on anecdotal evidence to one of proven results. It helps assure that a service is delivered where it is most needed, results are measured, and best practices are employed. In addition, directing resources to participating nonprofits saves a business leader the need to perform his or her own due diligence because it has already been done as part of CI. It helps address often-heard concerns discussed in this report that include:
I am not sure whether my donations are well spent.
How can I ensure nonprofits work together?
How do I select the best nonprofits in my community to support?
How do I ensure that if my employees volunteer in an organization we support, it is a good use of their time?
Nonprofits claim that they cannot measure outcomes.
While this kind of indirect involvement in a CI initiative is less powerful than direct engagement, it does leverage contributions made directly to nonprofit organizations and helps drive ecosystem change.
16
30% 40% 50% 60% 70% 80%
54% 61%Kindergarten readiness
3rd-grade reading proficiency 60% 65%
High school graduation (All) 68% 70%
High school graduation (ELL) 41% 53%
2012–13 2013–142011–12
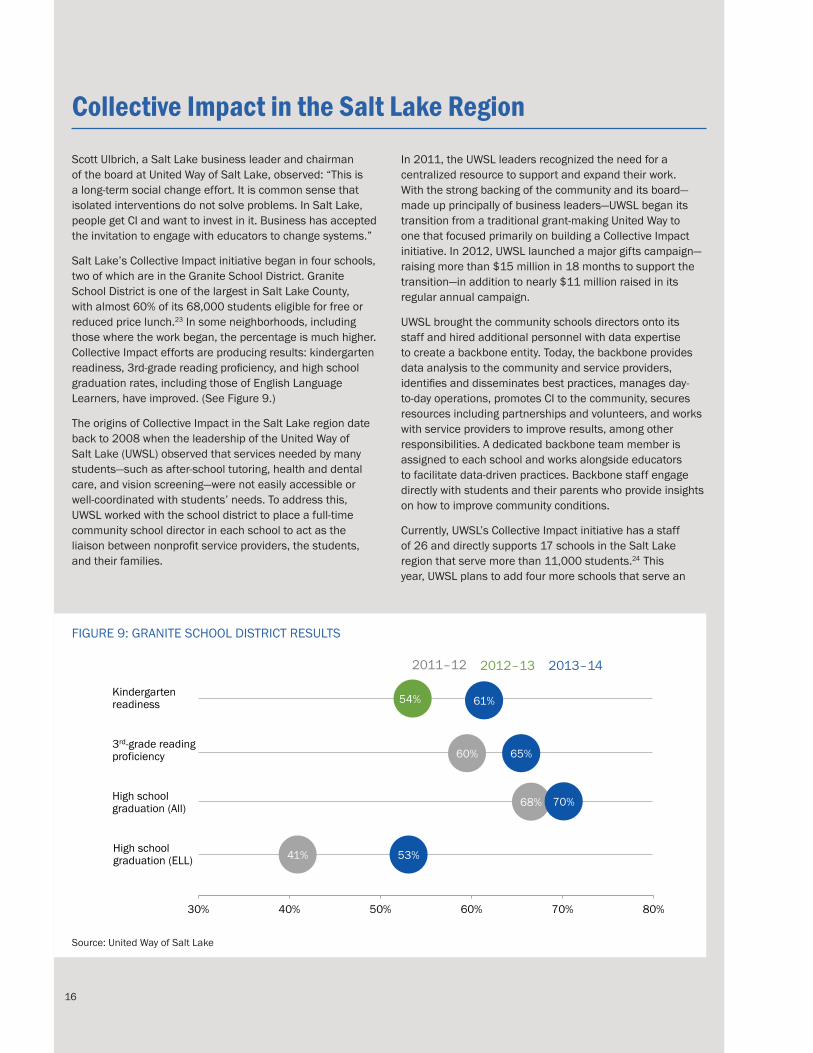
FIGURE 9: GRANITE SCHOOL DISTRICT RESULTS
Source: United Way of Salt Lake
Scott Ulbrich, a Salt Lake business leader and chairman of the board at United Way of Salt Lake, observed: “This is a long-term social change effort. It is common sense that isolated interventions do not solve problems. In Salt Lake, people get CI and want to invest in it. Business has accepted the invitation to engage with educators to change systems.”
Salt Lake’s Collective Impact initiative began in four schools, two of which are in the Granite School District. Granite School District is one of the largest in Salt Lake County, with almost 60% of its 68,000 students eligible for free or reduced price lunch.23 In some neighborhoods, including those where the work began, the percentage is much higher. Collective Impact efforts are producing results: kindergarten readiness, 3rd-grade reading proficiency, and high school graduation rates, including those of English Language Learners, have improved. (See Figure 9.)
The origins of Collective Impact in the Salt Lake region date back to 2008 when the leadership of the United Way of Salt Lake (UWSL) observed that services needed by many students—such as after-school tutoring, health and dental care, and vision screening—were not easily accessible or well-coordinated with students’ needs. To address this, UWSL worked with the school district to place a full-time community school director in each school to act as the liaison between nonprofit service providers, the students, and their families.
In 2011, the UWSL leaders recognized the need for a centralized resource to support and expand their work. With the strong backing of the community and its board— made up principally of business leaders—UWSL began its transition from a traditional grant-making United Way to one that focused primarily on building a Collective Impact initiative. In 2012, UWSL launched a major gifts campaign—raising more than $15 million in 18 months to support the transition—in addition to nearly $11 million raised in its regular annual campaign.
UWSL brought the community schools directors onto its staff and hired additional personnel with data expertise to create a backbone entity. Today, the backbone provides data analysis to the community and service providers, identifies and disseminates best practices, manages day-to-day operations, promotes CI to the community, secures resources including partnerships and volunteers, and works with service providers to improve results, among other responsibilities. A dedicated backbone team member is assigned to each school and works alongside educators to facilitate data-driven practices. Backbone staff engage directly with students and their parents who provide insights on how to improve community conditions.
Currently, UWSL’s Collective Impact initiative has a staff of 26 and directly supports 17 schools in the Salt Lake region that serve more than 11,000 students.24 This year, UWSL plans to add four more schools that serve an
Collective Impact in the Salt Lake Region
16
17Aligning for Students: Business and the Promise of Collective Impact
additional 1,200 students and over time it would like to expand to approximately 40 more schools. The extent and pace of expansion will depend on whether and how quickly community resolve and resources are garnered.
In late 2013, the CI initiative expanded its purview and provided backbone support that included convening school districts, state and county agencies, businesses, community organizations, and others to address the unmet needs of tens of thousands of additional children across the wider region. The resulting organization, the Promise Partnership Regional Council, has published a baseline report of eight core indicators and will measure future outcomes annually against this baseline.25
The school-based supports of the CI initiative fall into three categories: expanding learning opportunities, improving core instruction, and providing comprehensive health-related services.
Expanding learning opportunities
The initiative has enabled after-school programing to closely align with the academic curriculum in the classroom. At least once a week, after-school program staff observe students in their classroom during the regular school day and communicate frequently with teachers about what they should be working on with their tutees. Parents vouch for the program’s results. According to a survey conducted by the City of South Salt Lake, 93% of parents indicate that their child’s schoolwork has “improved” or “greatly improved.”26
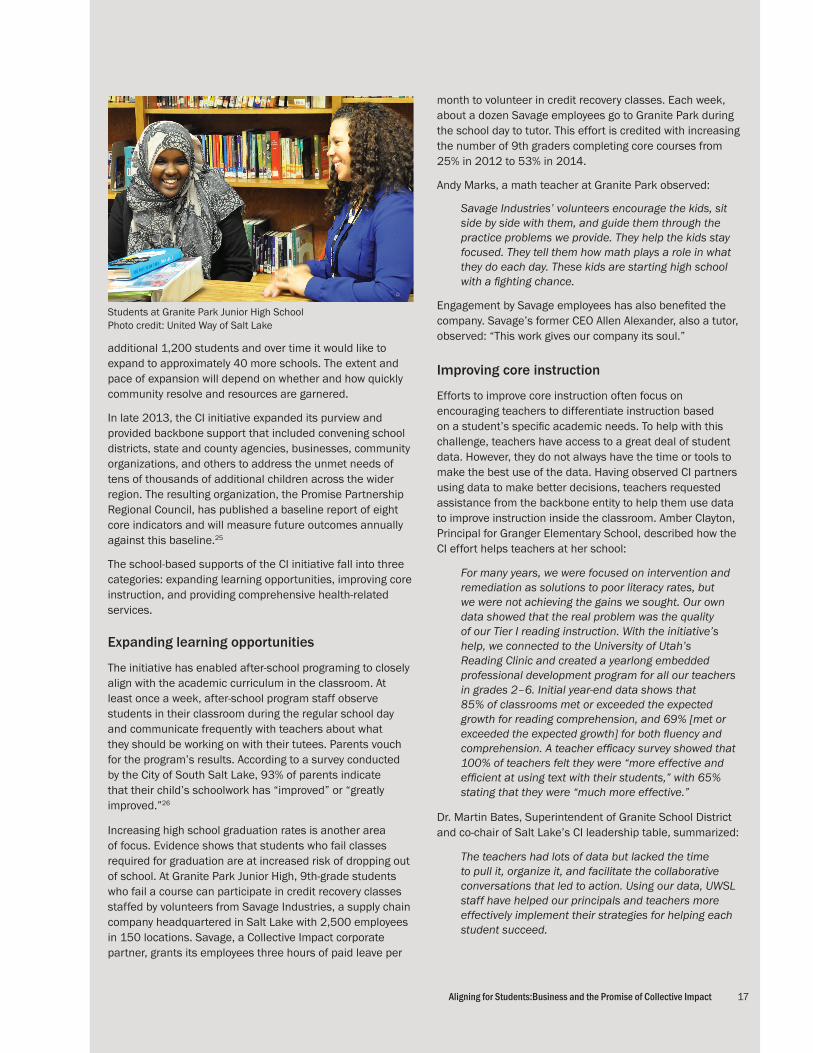
Increasing high school graduation rates is another area of focus. Evidence shows that students who fail classes required for graduation are at increased risk of dropping out of school. At Granite Park Junior High, 9th-grade students who fail a course can participate in credit recovery classes staffed by volunteers from Savage Industries, a supply chain company headquartered in Salt Lake with 2,500 employees in 150 locations. Savage, a Collective Impact corporate partner, grants its employees three hours of paid leave per
month to volunteer in credit recovery classes. Each week, about a dozen Savage employees go to Granite Park during the school day to tutor. This effort is credited with increasing the number of 9th graders completing core courses from 25% in 2012 to 53% in 2014.
Andy Marks, a math teacher at Granite Park observed:
Savage Industries’ volunteers encourage the kids, sit side by side with them, and guide them through the practice problems we provide. They help the kids stay focused. They tell them how math plays a role in what they do each day. These kids are starting high school with a fighting chance.
Engagement by Savage employees has also benefited the company. Savage’s former CEO Allen Alexander, also a tutor, observed: “This work gives our company its soul.”
Improving core instruction
Efforts to improve core instruction often focus on encouraging teachers to differentiate instruction based on a student’s specific academic needs. To help with this challenge, teachers have access to a great deal of student data. However, they do not always have the time or tools to make the best use of the data. Having observed CI partners using data to make better decisions, teachers requested assistance from the backbone entity to help them use data to improve instruction inside the classroom. Amber Clayton, Principal for Granger Elementary School, described how the CI effort helps teachers at her school:
For many years, we were focused on intervention and remediation as solutions to poor literacy rates, but we were not achieving the gains we sought. Our own data showed that the real problem was the quality of our Tier I reading instruction. With the initiative’s help, we connected to the University of Utah’s Reading Clinic and created a yearlong embedded professional development program for all our teachers in grades 2–6. Initial year-end data shows that 85% of classrooms met or exceeded the expected growth for reading comprehension, and 69% [met or exceeded the expected growth] for both fluency and comprehension. A teacher efficacy survey showed that 100% of teachers felt they were “more effective and efficient at using text with their students,” with 65% stating that they were “much more effective.”
Dr. Martin Bates, Superintendent of Granite School District and co-chair of Salt Lake’s CI leadership table, summarized:
The teachers had lots of data but lacked the time to pull it, organize it, and facilitate the collaborative conversations that led to action. Using our data, UWSL staff have helped our principals and teachers more effectively implement their strategies for helping each student succeed.
17Aligning for Students:Business and the Promise of Collective Impact
Students at Granite Park Junior High School Photo credit: United Way of Salt Lake
18
Providing comprehensive health-related services
Educators in Salt Lake were well aware of the connection among poor health, absenteeism, and reduced school performance. The Collective Impact partnership coordinated with the nonprofit community to eliminate logistical barriers that prevented many students from accessing health care services. For example, Community Nursing Services began offering students immunizations at school. Also, since children with poor dental health are about three times more likely to miss school, a mobile dental clinic visits elementary schools monthly. Children have their teeth checked and cavities filled, and dentists seal students’ teeth to prevent future problems. Untreated vision problems also contribute to poor school performance. While many schools across the country screen for vision problems, few follow up when a problem is detected. Working with a local health service provider, the Promise Partnership enables elementary school students to have their vision checked at school and have glasses delivered to them at school if they are needed.
As Amber Clayton summarized:
What happens here is magic. Since engaging in Collective Impact, we have moved beyond the standard excuses that plague public education and carved new collaborative pathways to develop solutions to
our problems. We have broken down the traditional schoolhouse silos, and our committees and teams now work productively with an outcomes focus. We have renewed hope. We have become social entrepreneurs; we dream out loud together for our students and our community—and together we are making those dreams reality. We really are doing great things and it’s all because of this partnership.
Bill Crim, president and CEO of the United Way of Salt Lake, captures the essence of the Salt Lake region’s Collective Impact initiative:
Our collaborative effort is beginning to transform the complex ecosystem in which we live. We know that there is no single individual or system or program that is responsible for the gains or for the progress that we still have to make. It is truly the aligned action of multiple stakeholders from multiple sectors that is enabling more students to reach their potential. We are forging a path together and creating the results.
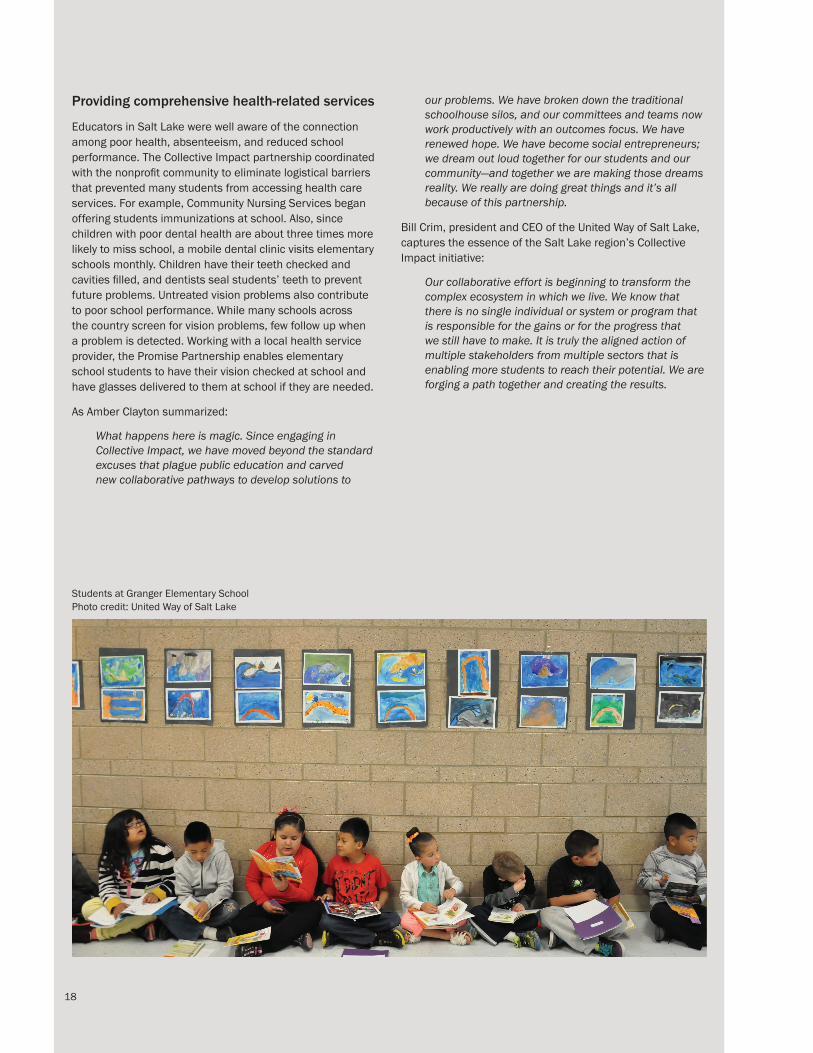
Students at Granger Elementary School Photo credit: United Way of Salt Lake
18
19Aligning for Students: Business and the Promise of Collective Impact
Collective Impact is an innovative process that provides a clearly articulated structure for achieving education ecosystem change. In addition to providing a powerful mechanism for coordinating and improving programs outside the classroom, CI helps the changes in teaching and curriculum occurring inside the classroom realize their full potential. Collective Impact could be the game changer we have sought for so long in American public education.
CI is not an easy or quick fix. But we now know that CI initiative leaders from a range of communities are reporting progress in key education indicators such as rates of kindergarten readiness and high school graduation. Based on our research, we are very optimistic that these gains will continue and accelerate.
If transformation of the education ecosystem is the key to sustained improvement in education outcomes—and we believe it is—then Collective Impact is a good bet. It may succeed in some places without business being involved, but we have learned that if the business community lends its support and expertise the odds of success are greatly enhanced.
We know that business leaders care about improved educational outcomes. We hope this report serves as their call to action.
Conclusion
If transformation of the education ecosystem is the key to sustained improvement in education outcomes—and we believe it is—then Collective Impact is a good bet. If the business community lends its support and expertise the odds of success are greatly enhanced.
20
National OrganizationsAlignment USA
Sydney Rogers, Executive Director
Forum for Youth Investment
Karen Pittman, Co-founder and President
Bryce Jones, Manager, Community Evaluation
FSG
John Kania, Managing Director
Living Cities
Tynesia Boyea, Director of Collective Impact
Alison Gold, Assistant Director of Knowledge and Impact
Brittany Ramos, Program Assistant
Promise Neighborhoods Institute
Michael McAfee, Director of the Promise Neighborhoods Institute at PolicyLink
Say Yes to Education
Mary Anne Schmidt Carey, President
Eugene Chasin, Chief Operating Officer
StriveTogether
Jeff Edmondson, Managing Director
Pranav Kothari, Senior Director, Strategy and Innovation
Colin Groth, Strategic Assistance Director
U.S. Department of Education
Greg Darnieder, Senior Advisor to the Secretary on College Access Initiative
Suzanne Immerman, Senior Advisor to the Secretary/Director of Strategic Partnerships
Nadya Dabby, Assistant Deputy Secretary for Innovation and Improvement
United Way
Stacey Stewart, U.S. President
Eric Glaser, Director of Field Capacity Building
Evan Hochberg, Chief Strategy Officer
Collective Impact Initiatives
Achieve Brown County (Green Bay, WI)
Tim Weyenberg, Board member and former CEO, Foth & Van Dyke
Alignment Nashville (Nashville, TN)
Jesse Register, Superintendent (former), Metro Nashville Public Schools
Kent Fourman, CIO, Permanent General Insurance
Marcy Melvin, Centerstone
Orrin Ingram, Chairman, Orrin Industries
Aimee Wyatt, Metro Nashville Public Schools, Executive Director of High Schools Leadership and Learning
Ann Henderson, Director of Education and Outreach, Frist Center for the Visual Arts
Aspire (Toledo, OH)
Keith Burwell, President, Toledo Community Foundation
Aaron Baker, Executive Director (former), Aspire
Michael Thaman, CEO, Owens Corning
Buffalo Promise Neighborhood (Buffalo, NY)
Mark Czarnecki, President, M&T Bank
Ezra Staley, Director of Finance and Information Systems (former), Buffalo Promise Neighborhood
David Chamberlain, CEO, Buffalo Promise Neighborhood
Tanya Staples, Community Affairs Director, Buffalo Promise Neighborhood
City Heights Partnership (San Diego, CA)
Cindy Marten, Superintendent
Tad Seth Parzen, Executive Director (former)
Mark Cafferty, President, San Diego Regional Economic Development Corporation
Chula Vista Promise Neighborhood (San Diego, CA)
Mauricio Torre, Director, Youth and Family Development, South Bay Community Services
Indianola Promise Neighborhood (Mississippi Delta)
Josh Davis, VP, External Affairs, Delta Health Alliance (backbone)
Appendix I: Interview List

21Aligning for Students: Business and the Promise of Collective Impact
Los Angeles Chamber of Commerce/UNITE-LA (Los Angeles, CA)
David Rattray, President of UNITE-LA
Bridget Netter, Director of Business-Education Partnerships
Carrie Shapton, Senior Manager, L.A. Compact
Alysia Bell, Education Business Coalition Director
Northside Achievement Zone (Minneapolis, MN)
John Mauriel, Board member
Say Yes, Buffalo and Buffalo Promise Neighborhood (Buffalo, NY)
Amber Dixon, Executive Director, Buffalo Center for Arts & Technology and former interim superintendent, Buffalo
Ellen Grant, Deputy Mayor, City of Buffalo
Blythe Merrill, SVP of Programs, Oishei Foundation
Anne Ryan, Executive Director, Read to Succeed Buffalo
Say Yes, Buffalo (Buffalo, NY)
David Rust, Executive Director, Say Yes Buffalo
Clotilde Perez-Bode Dedecker, President and CEO, Community Foundation for Greater Buffalo
Road Map Project (South Seattle and South King County, WA)
Mary Jean Ryan, Executive Director, Community Center for Education Results
Salt Lake Promise Partnership (Salt Lake region, UT)
Allen Alexander, Chairman and former CEO, Savage Industries
Martin Bates, Superintendent, Granite School District
Deborah Bayle, President and CEO (former), United Way of Salt Lake
Amber Clayton, Principal, Granger Elementary School
Tim Coray, Granger Elementary Community School Director
Bill Crim, President and CEO, United Way of Salt Lake
Kari Cutler, Director, Promise South Salt Lake, and CEO, Social Marketing Consultants
Rebecca Dutson, EVP and Chief Operating Officer, United Way of Salt Lake
Lindsey Edwards, Senior Director, Community School Partnerships, United Way of Salt Lake
Jeremy Keele, Senior Advisor and Director (former), Government Relations, Salt Lake County
Korey Klein, Director, Data Operations, United Way of Salt Lake
Ben McAdams, Mayor, Salt Lake County
Scott McLeod, Associate Vice President, Collective Impact, United Way of Salt Lake
Danya Pastuszek, Senior Director, Analytics and Learning, United Way of Salt Lake
Danny Stirland, Principal, Granite Park Junior High School
Jaydee Talbot, Principal, Woodrow Wilson Elementary
Scott Ulbrich, Chair, United Way of Salt Lake
Cherie Wood, Mayor, South Salt Lake
StrivePartnership (Cincinnati, OH)
Jeff Heslop, General Electric, Lean Six Sigma Manager
Paula Kollstedt, GE Aviation, former manager, Community and Public Relations
Additional Conversations with:
John Bennett, Director, Aspen Community Foundation’s Cradle to Career Initiative
Bridget French, Executive Director, Alignment Rockford
Melissa Jaggers, consultant for Alignment USA
Anthony Johnson, Interim Executive Director, Alignment Jackson (MS)
Laurie Preece, Alignment USA
Gerry Weast, Founder and President, Partnership for Deliberate Excellence
22
The Harvard Business School Collective Impact Survey was designed and conducted by Harvard Business School (HBS) faculty and researchers in conjunction with Abt SRBI, a leading survey research firm.
As there was no available comprehensive list of Collective Impact initiatives operating in the United States, researchers at HBS developed an inventory of 145 Collective Impact initiatives focused on public education. Backbone leaders from these initiatives were contacted by email and asked to supply names and contact information for business leaders serving on their leadership councils. For initiatives that did not respond to the request, HBS staff used publically available sources to identify those business leaders. In nine cases, backbone leaders asked to be excluded from the survey, asked for business leaders serving on their leadership councils to be excluded, or both. We honored those requests.
InstrumentThe survey instrument was designed and vetted by HBS faculty in collaboration with survey methodologists. The first section of the survey identified whether the respondent was a business leader or a backbone leader and the name of the initiative with which the respondent was affiliated. Initiative leaders were then asked a series of questions about the initiative and business involvement. Business leaders were asked about their perceptions of the initiative in which they were involved and their roles and attitudes. All respondents were offered the opportunity to make open-ended comments.
In order to ensure that the survey was understood by respondents as intended by the survey designers, Abt SRBI conducted cognitive testing interviews by telephone before the survey was launched.
The field period for the survey was March 2, 2015, to April 3, 2015. One hundred thirty-six Collective Impact initiative leaders and 441 business leaders from CI leadership councils were invited to participate in the survey via email. In the following weeks, three email reminders encouraged them to respond. At the completion of the survey, the response rate for initiative leaders was 36.9%, with 52 responses fully or partially competed; the response rate for business leaders was 14.0%, with 59 responses fully completed and no responses partially completed. The overall response rate was 19.4%, with 107 fully completed responses and 4 partially completed. The results for initiative leaders and business leaders were tabulated separately..*
Sampling error and weightingAs we attempted to reach all known individuals in the targeted population, there was no sampling error, so we do not report margins of error. Other sources of error, including coverage error and non-response error may be present. We also note the relatively small size of the target population and the number of responses received, which were not weighted.
Appendix II: Survey Methodology
*Response rates were calculated according to American Association for Public Opinion Research standards (RRI).
23Aligning for Students: Business and the Promise of Collective Impact
Harvard Business School (HBS) launched the U.S. Competitiveness Project in 2011 to understand and improve the competitiveness of the United States, focusing especially on the roles that business leaders can and do play in promoting U.S. competitiveness.
In late 2013 and early 2014, approximately 2,000 HBS alumni responded to a survey asking them to rank 18 elements of the business environment and categorize them from “strength and improving” to “weakness and deteriorating.” Only the “Political System” and the “Tax Code” ranked slightly lower than the “K-12 Education System.” (See “An Economy Doing Half Its Job: Findings of Harvard Business School’s 2013-14 Survey on U.S. Competitiveness” at the U.S. Competitiveness Project website: http://www.hbs.edu/competitiveness/.)
This distressing perception of public education was a concern to those involved in the Competitiveness Project. Since the objective of the project was to be action-oriented, a collaboration of leaders from The Boston Consulting Group, the Bill & Melinda Gates Foundation and Harvard Business School set out to determine:
• Is the state of public education as dire as the perception of the respondents? What are the data that would support or contradict those perceptions? (See “The Brink of Renewal: A Business Leader’s Guide to Progress in America’s Schools.”)
• To what degree and in what ways were businesses involved in public education? Was the involvement effective, and what could be done to enhance effectiveness? (See “Lasting Impact: A Business Leader’s Playbook for Supporting America’s Schools.”)
• Did America’s school superintendents share HBS graduates’ perception of the state of public education? How much was business involved in their work, and did they desire more or less engagement from business leaders? (See “Partial Credit: How America’s School Superintendents See Business as a Partner.”)
(The title for the report that outlines our findings is in parentheses. Reports may be found at the U.S. Competitiveness Project website.)
A two-day conference of about 60 business and 30 education leaders was held in November 2013 to discuss the research findings.
Appendix III: Harvard Business School’s U.S. Competitiveness Project
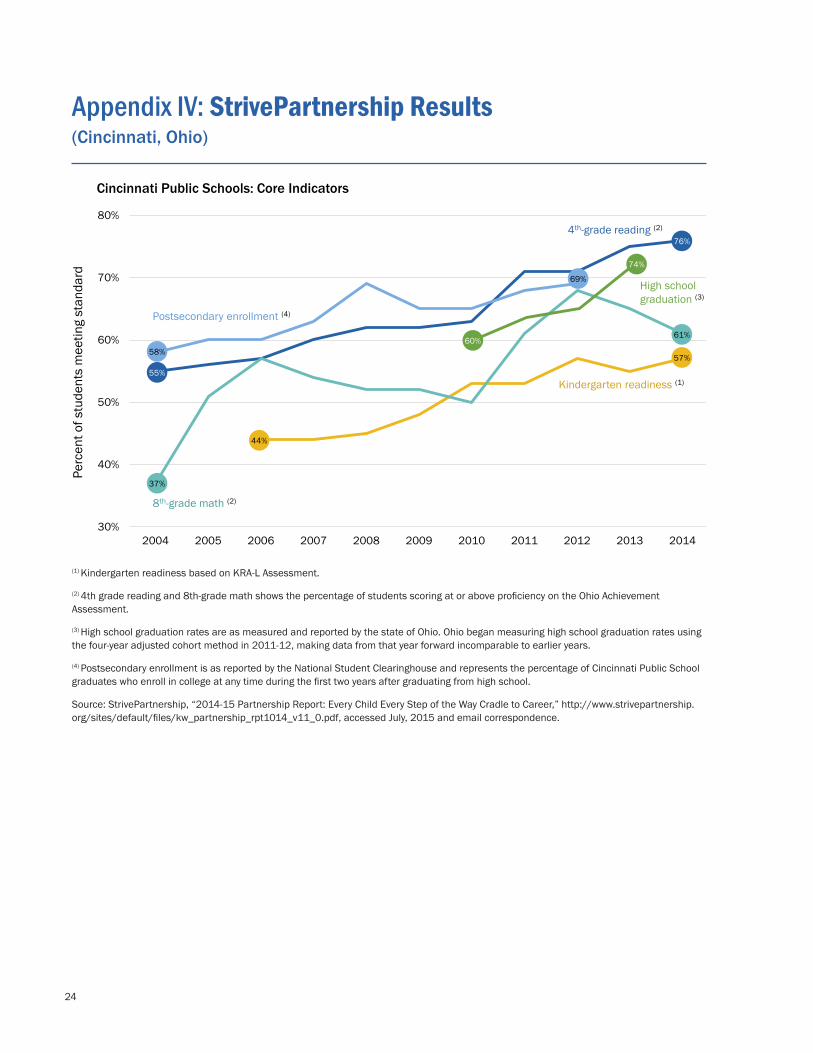
24
30%
40%
50%
60%
70%
80%
2004 2005 2006 2007 2008 2009 2010 2011 2012 2013 2014
Cincinnati Public Schools: Core Indicators
Kindergarten readiness (1)
4th-grade reading (2)
8th-grade math (2)
High schoolgraduation (3)
Postsecondary enrollment (4)
44%
57%
76%
55%
37%
61%
74%
60%
69%
58%
Perc
ent o
f stu
dent
s m
eetin
g st
anda
rd
(1) Kindergarten readiness based on KRA-L Assessment.
(2) 4th grade reading and 8th-grade math shows the percentage of students scoring at or above proficiency on the Ohio Achievement Assessment.
(3) High school graduation rates are as measured and reported by the state of Ohio. Ohio began measuring high school graduation rates using the four-year adjusted cohort method in 2011-12, making data from that year forward incomparable to earlier years.
(4) Postsecondary enrollment is as reported by the National Student Clearinghouse and represents the percentage of Cincinnati Public School graduates who enroll in college at any time during the first two years after graduating from high school.
Source: StrivePartnership, “2014-15 Partnership Report: Every Child Every Step of the Way Cradle to Career,” http://www.strivepartnership.org/sites/default/files/kw_partnership_rpt1014_v11_0.pdf, accessed July, 2015 and email correspondence.
Appendix IV: StrivePartnership Results (Cincinnati, Ohio)
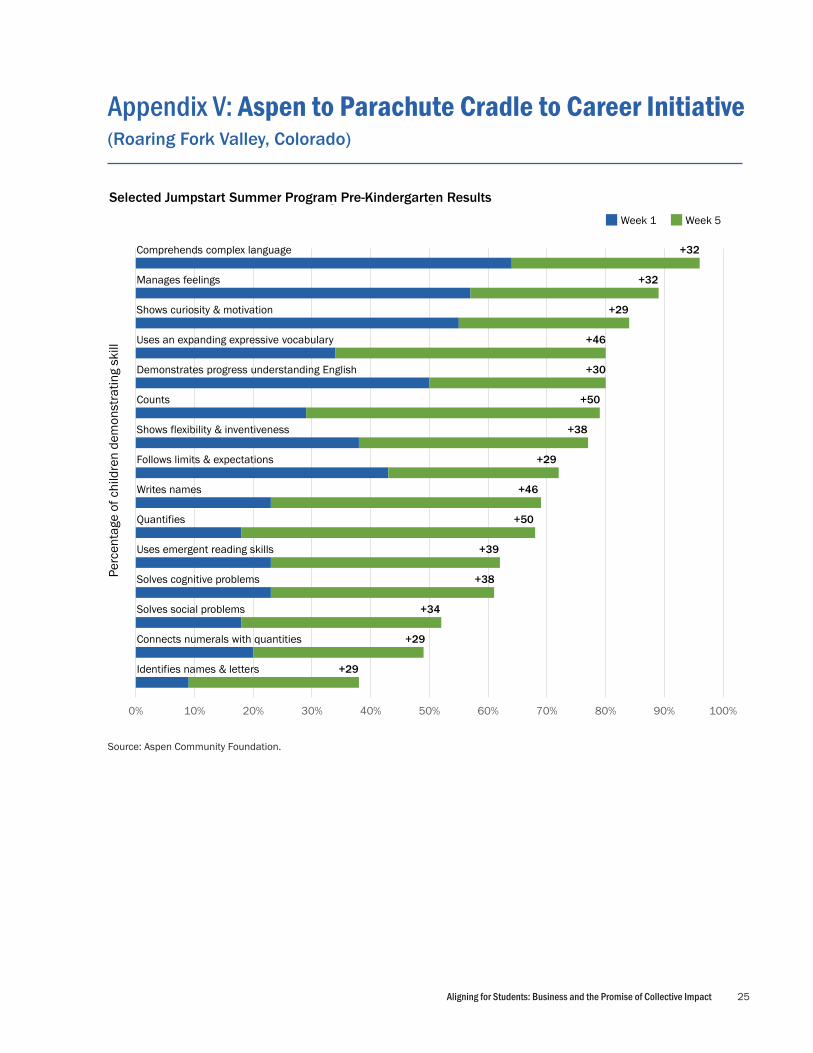
25Aligning for Students: Business and the Promise of Collective Impact
0% 10% 20% 30% 40% 50% 60% 70% 80% 90% 100%
Selected Jumpstart Summer Program Pre-Kindergarten ResultsWeek 1 Week 5
Perc
enta
ge o
f chi
ldre
n de
mon
stra
ting
skill
+32
+32
+29
+46
+30
+50
+38
+29
+46
+50
+39
+38
+34
+29
+29
Comprehends complex language
Manages feelings
Shows curiosity & motivation
Uses an expanding expressive vocabulary
Demonstrates progress understanding English
Counts
Shows flexibility & inventiveness
Follows limits & expectations
Writes names
Quantifies
Uses emergent reading skills
Solves cognitive problems
Solves social problems
Connects numerals with quantities
Identifies names & letters
Source: Aspen Community Foundation.
Appendix V: Aspen to Parachute Cradle to Career Initiative(Roaring Fork Valley, Colorado)
0% 10% 20% 30% 40% 50% 60% 70% 80% 90% 100%
Selected Jumpstart Summer Program Pre-Kindergarten ResultsWeek 1 Week 5
Perc
enta
ge o
f chi
ldre
n de
mon
stra
ting
skill
+32
+32
+29
+46
+30
+50
+38
+29
+46
+50
+39
+38
+34
+29
+29
Comprehends complex language
Manages feelings
Shows curiosity & motivation
Uses an expanding expressive vocabulary
Demonstrates progress understanding English
Counts
Shows flexibility & inventiveness
Follows limits & expectations
Writes names
Quantifies
Uses emergent reading skills
Solves cognitive problems
Solves social problems
Connects numerals with quantities
Identifies names & letters
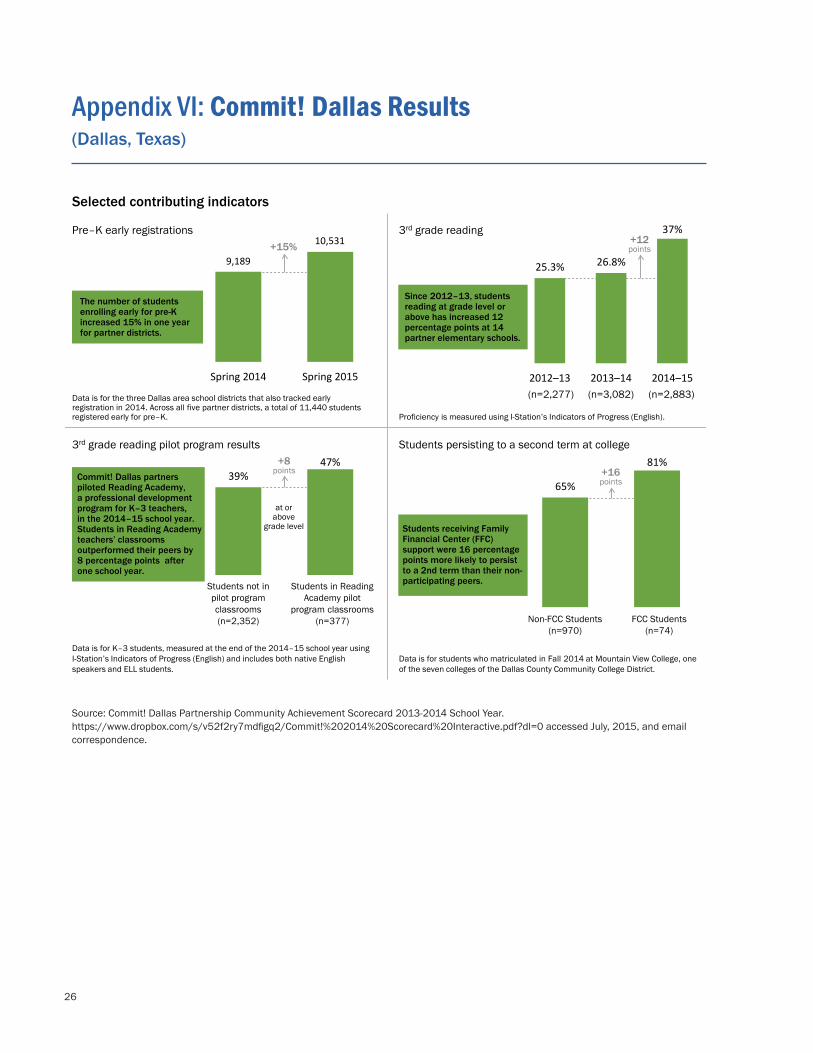
26
Selected contributing indicators
9,189
10,531
Spring 2014 Spring 2015
Pre–K early registrations
The number of students enrolling early for pre-K increased 15% in one year for partner districts.
25.3% 26.8%
37%
2012–13 2013–14 2014–15
3rd grade reading
Since 2012–13, students reading at grade level or above has increased 12 percentage points at 14 partner elementary schools.
(n=2,277) (n=3,082) (n=2,883)
Proficiency is measured using I-Station’s Indicators of Progress (English).
Data is for the three Dallas area school districts that also tracked early registration in 2014. Across all five partner districts, a total of 11,440 students registered early for pre–K.
39%47%
3rd grade reading pilot program results
Commit! Dallas partners piloted Reading Academy, a professional development program for K–3 teachers, in the 2014–15 school year. Students in Reading Academy teachers’ classrooms outperformed their peers by 8 percentage points after one school year.
Data is for K–3 students, measured at the end of the 2014–15 school year using I-Station’s Indicators of Progress (English) and includes both native English speakers and ELL students.
Students in Reading Academy pilot
program classrooms(n=377)
Students not in pilot program classrooms(n=2,352)
at or above
grade level
65%
81%Students persisting to a second term at college
Students receiving Family Financial Center (FFC) support were 16 percentage points more likely to persist to a 2nd term than their non-participating peers.
Data is for students who matriculated in Fall 2014 at Mountain View College, one of the seven colleges of the Dallas County Community College District.
FCC Students(n=74)
Non-FCC Students(n=970)
+15%+12points
+8points +16
points
Source: Commit! Dallas Partnership Community Achievement Scorecard 2013-2014 School Year. https://www.dropbox.com/s/v52f2ry7mdfigq2/Commit!%202014%20Scorecard%20Interactive.pdf?dl=0 accessed July, 2015, and email correspondence.
Appendix VI: Commit! Dallas Results(Dallas, Texas)
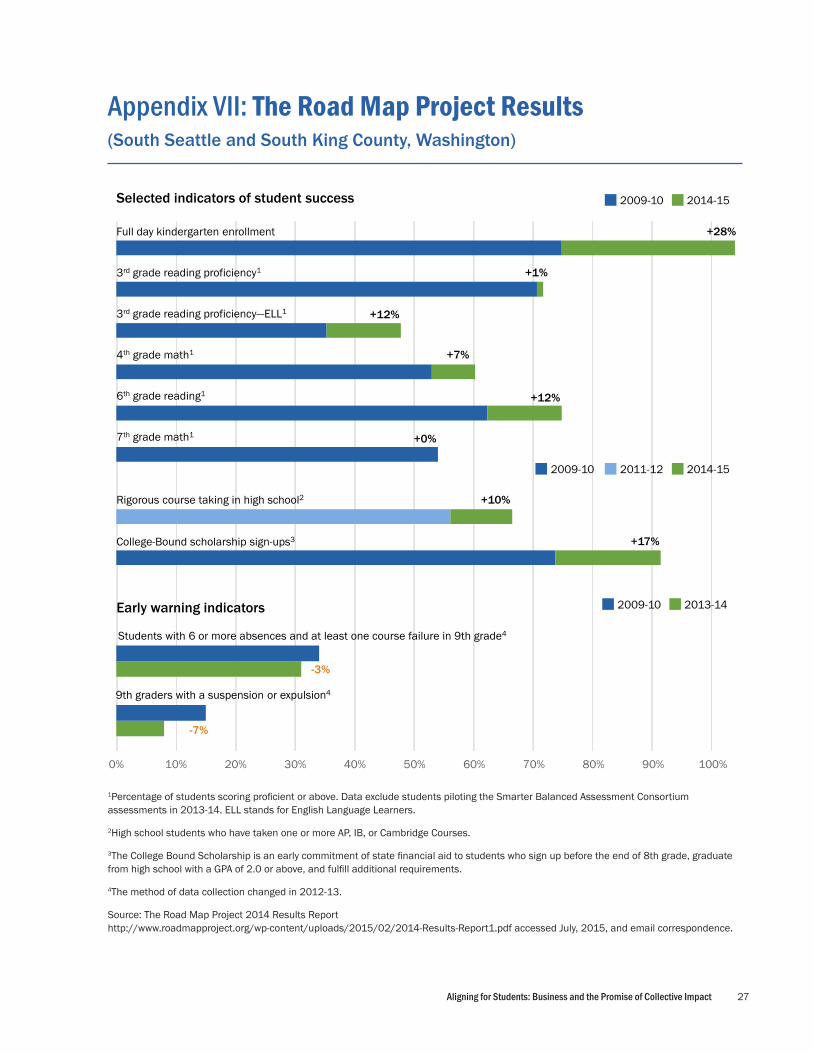
27Aligning for Students: Business and the Promise of Collective Impact
1Percentage of students scoring proficient or above. Data exclude students piloting the Smarter Balanced Assessment Consortium assessments in 2013-14. ELL stands for English Language Learners.
2High school students who have taken one or more AP, IB, or Cambridge Courses.
3The College Bound Scholarship is an early commitment of state financial aid to students who sign up before the end of 8th grade, graduate from high school with a GPA of 2.0 or above, and fulfill additional requirements.
4The method of data collection changed in 2012-13.
Source: The Road Map Project 2014 Results Report http://www.roadmapproject.org/wp-content/uploads/2015/02/2014-Results-Report1.pdf accessed July, 2015, and email correspondence.
Appendix VII: The Road Map Project Results
Selected indicators of student success 2009-10 2014-15
+28%Full day kindergarten enrollment
3rd grade reading proficiency1
3rd grade reading proficiency—ELL1
4th grade math1
6th grade reading1
7th grade math1
+1%
+12%
+7%
+12%
+0%
2011-12 2014-15
+17%
+10%
2009-10
Early warning indicators
0% 10% 20% 30% 40% 50% 60% 70% 80% 90% 100%
-3%
Students with 6 or more absences and at least one course failure in 9th grade4
9th graders with a suspension or expulsion4
-7%
2009-10 2013-14
College-Bound scholarship sign-ups3
Rigorous course taking in high school2
(South Seattle and South King County, Washington)
28
Appendix VIII: Resources
National OrganizationsAlignment USA/Alignment Nashville
portal.alignmentnashville.org
The Forum for Youth Investment www.forumfyi.org
FSGwww.fsg.org
Promise Neighborhoods Institutewww.promiseneighborhoodsinstitute.org
Say Yes To Educationwww.sayyestoeducation.org
StriveTogetherwww.strivetogether.org
Collective Impact InitiativesAspen Community Foundation
www.aspencommunityfoundation.org
Aspirewww.aspiretoledo.org
Commit! Dallaswww.commit2dallas.org
Milwaukee Succeedswww.milwaukeesucceeds.org
Road Map Project www.roadmapproject.org
StrivePartnershipwww.strivepartnership.org
United Way of Salt Lakewww.uw.org
Other ResourcesCollective Impact Forum
www.collectiveimpactforum.org
Harvard Business School U.S. Competitiveness Projectwww.hbs.edu/competitiveness
Stanford Social Innovation Review www.ssireview.org
29Aligning for Students: Business and the Promise of Collective Impact
Endnotes1Lyndsey Layton, “Poverty, family stress are thwarting student success, top teachers say,” Washington Post, May 19, 2015, http://www.washingtonpost.com/local/education/poverty-family-stress-are-thwarting-student-success-top-teachers-say/2015/05/19/17f2e35a-fe3c-11e4-833c-a2de05b6b2a4_story.html (accessed June 9, 2015).
2Jan W. Rivkin, “Partial Credit: How America’s School Superintendents See Business as a Partner,” http://www.hbs.edu/competitiveness/research/Pages/research-details.aspx?rid=4, p. 10 (accessed June 9, 2015).
3National Center for Charitable Statistics, Public Charities Table Wizard, http://nccsweb.urban.org/tablewiz/pc.php (accessed June 9, 2015). Only the following categories were included in the totals: B01, B02, B03, B05, B11, B12, B19, B80, B82, B90, B92, B94 and B 99 Subcategories for schools, libraries and other similar nonprofits were excluded.
4New York State Department of Education website, http://data.nysed.gov/gradrate.php?year=2014&instid=800000050065 (accessed June 29, 2015).
5Minneapolis Public Schools, “Graduation rates on the rise for Minneapolis students,” http://www.mpls.k12.mn.us/graduation_rates_on_the_rise_for_Minneapolis_students (accessed June 29, 2015).
6The Alliance for Excellent Education website, http://impact.all4ed.org/#potential/income/united-states/all-students/ (accessed June 18, 2015).
7Judith Scott-Clayton and Olga Rodriguez, “Development, Discouragement, or Diversion? New Evidence on the Effects of College Remediation,” National Bureau of Economic Research Working Paper No. 18328, August 2012, p. 1, http://www.nber.org/papers/w18328.pdf and National Center for Education Statistics, Digest of Education Statistics, Table 311.40, https://nces.ed.gov/programs/digest/d14/tables/dt14_311.40.asp (both accessed June 15, 2015).
8National Center for Education Statistics, “NAEP 2012 Trends in Academic Progress: Reading 1971-2012 Mathematics 1973-2012,” Figure 25, http://nces.ed.gov/nationsreportcard/subject/publications/main2012/pdf/2013456.pdf (accessed June 18, 2015).
9Southern Education Research Foundation, “A New Majority: Low Income Students Now a Majority in the Nation’s Public Schools,” Research Bulletin,” January 2015, http://www.southerneducation.org/getattachment/4ac62e27-5260-47a5-9d02-14896ec3a531/A-New-Majority-2015-Update-Low-Income-Students-Now.aspx; National Center for Education Statistics, Digest of Education Statistics, Table 204.10, http://nces.ed.gov/programs/digest/d14/tables/dt14_204.10.asp?current=yes and Motoko Rich, “Percentage of Poor Students in Public School Rises,” New York Times, January 16, 2015, http://www.nytimes.com/2015/01/17/us/school-poverty-study-southern-education-foundation.html?_r=0 (all accessed June 18, 2015).
10Betty Hart and Todd R. Risley, “The Early Catastrophe: The 30 Million Word Gap by Age 3” excerpted in the American Educator, Spring 2003, p. 7, http://www.aft.org//sites/default/files/periodicals/TheEarlyCatastrophe.pdf (accessed June 18, 2015).
11Southern Education Foundation Research Report Update, “A New Majority: Low Income Students in the South and Nation,” October 2013, p. 13, http://www.southerneducation.org/getattachment/817a35f1-abb9-4d6a-8c2e-5514d4a6d7d9/Test-Publication-4.aspx (accessed June 25, 2015).
12Organisation for Economic Co-operation and Development, “PISA 2012 Results: What Students Know and Can Do: Student Performance in Mathematics, Reading and Science, Volume I,” Figure 1.2.13 on p. 47 and Figure 1.4.1 on p. 177, http://www.oecd.org/pisa/keyfindings/pisa-2012-results-volume-I.pdf, and “PISA 2009 Results: What Students Know and Can Do: Student Performance in Reading, Mathematics and Science, Volume 1,” Table 1.A on p. 15 and Figure 1.3.10 on p. 134, http://www.oecd.org/pisa/pisaproducts/48852548.pdf (all accessed June 25, 2015).
13Organisation for Economic Co-operation and Development, “Education at a Glance 2014: OECD Indicators,” http://www.oecd.org/edu/Education-at-a-Glance-2014.pdf, Table A1.2 on p. 43 (accessed June 25, 2015) and authors’ calculations.
14National Center for Education Statistics, Digest of Education Statistics, Table 236.10, http://nces.ed.gov/programs/digest/d13/tables/dt13_236.10.asp Organisation for Economic Co-operation and Development, “Education at a Glance 2014 OECD Indicators,” Table B1.1a http://www.oecd.org/edu/Education-at-a-Glance-2014.pdf (accessed June 25, 2015) and authors’ calculations. Per pupil spending is for “primary” and “all secondary” education for 2011, the latest year available. Data for aggregate spending on U.S. education are for 2010-11, the latest year available.
15CECP in association with The Conference Board, Giving in Numbers: 2013 Edition.
16Harvard Business School U.S. Competitiveness Project, “Partial Credit: How America’s School Superintendents See Business as a Partner,” pp. 6-8, http://www.hbs.edu/competitiveness/Documents/partial-credit.pdf (accessed June 25, 2015).
17StriveTogether website, http://www.strivetogether.org/cradle-career-network (accessed June 18, 2015).
18Garfield School District Re-2 website http://www.garfieldre2.k12.co.us/education/components/scrapbook/default.php?sectiondetailid=17436& (accessed July 2, 2015).
19Commit! Partnership Community Achievement Scorecard 2013-14 School Year, page 11 https://www.dropbox.com/s/v52f2ry7mdfigq2/Commit!%202014%20Scorecard%20Interactive.pdf?dl=0 (accessed July 2, 2015).
30
20Milwaukee Succeeds website http://milwaukeesucceeds.org/goals-and-data/milestone-report/milestone-report-2015/ (accessed August 18, 2015).
21Mark Kramer, Marcie Parkhurst, Lalitha Vaidyanathan, “Breakthroughs in Shared Measurement and Social Impact,” Appendix, FSG Social Impact Advisors, July 2009, pp. 17-23, http://www.fsg.org/Portals/0/Uploads/Documents/PDF/Breakthroughs_in_Shared_Measurement_Appendix.pdf?cpgn=WP%20DL%20-%20Breakthroughs%20in%20Measurement%20APPENDIX (accessed July 2, 2015) and email correspondence with the StrivePartnership executive director.
22Harvard Business School U.S. Competitiveness Project, “Lasting Impact: A Business Leader’s Playbook for Supporting America’s Schools,” p. 23 http://www.hbs.edu/competitiveness/Documents/lasting-impact.pdf (accessed July 2, 2015).
23Utah State Office of Education, National School Lunch Program Report, October 2014.
24Utah State Office of Education, Fall Enrollment Report, October 2014.
25The Promise of Partnership: Aligning Action for Results, 2014 Baseline Report of the Promise Partnership Regional Council, http://www.uw.org/our-work/reports-pdfs/2014-promise-partnership-brochure-vfmr.pdf (accessed July 2, 2015).
26South Salt Lake website, http://www.southsaltlakecity.com/department-listings/promise-ssl/developmental-youth-outcomes (accessed July 6, 2015).

32
About the research:
This report is part of Harvard Business School’s U.S. Competitiveness Project, a research-based initiative focused on understanding and improving the competitiveness of the United States. For this report, the authors identified 145 Collective Impact initiatives around the United States that focused on public education. A national survey of their executive directors and engaged business leaders as well 70 interviews with practitioners, business leaders, and others involved with CI initiatives informed this report. (See Appendix II for the survey methodology and Appendix I for a list of interviewees.)
This Collective Impact work is an outgrowth of an earlier effort in which the authors were engaged: Business and Education Leaders Together, a collaboration of The Boston Consulting Group, the Bill & Melinda Gates Foundation, and Harvard Business School. (See Appendix III for more information on the U.S. Competitiveness Project and the research resulting from the collaboration with BCG and the Gates Foundation).
This report is an independent research effort by Harvard Business School, generously supported by the School’s Division of Research and Faculty Development. No outside funding was provided.
About the authors:
Allen Grossman is a Senior Fellow and retired Professor of Management Practice at Harvard Business School. He was co-founder in 2003 and co-chair until 2013 of the Public Education Leadership Project, a joint initiative of the Harvard Graduate School of Education and Harvard Business School to help leadership teams from public school districts improve student performance. He is the co-author of a number of articles on public education, as well as three books on the topic including Managing School Districts for High Performance.
Ann Lombard is a Senior Researcher for the U.S. Competitiveness Project.
Acknowledgments
The authors would like to gratefully acknowledge the support of Nitin Nohria, Dean of the Faculty, and the faculty team members of the HBS U.S. Competitiveness Project, who helped lay the foundation of this important research topic and without whom this research effort would not have been possible.
The authors are also very grateful to:
• Jan Rivkin, Bruce V. Ravner Professor of Business Administration, Senior Associate Dean for Research, and co-chair of the U.S. Competitiveness Project for his valuable contributions to the content of this report and his unwavering support of this research project.
• The Boston Consulting Group and the Bill & Melinda Gates Foundation with whom we partnered on a precursor project, Business and Education Leaders Together.
• Manjari Raman, Program Director and Senior Researcher, U.S. Competitiveness Project and Gabriel P. Ellsworth, Ilyes Kamoun and Marie Mekosh, Research Associates for the U.S. Competitiveness Project.
Published: September 2015. Report design: Terberg Design, LLC.
Please direct inquiries to Ann Lombard at Harvard Business School ([email protected]).


![From Aligning Boxes To Aligning Visions - A Journey Through Prototyping [UX Ghent]](https://static.documents.pub/doc/80x56/589a63da1a28abc3438b64f1/from-aligning-boxes-to-aligning-visions-a-journey-through-prototyping-ux.jpg)


