Page 1
DAYALBAGH EDUCATIONAL INSTITUTE
(Deemed University)
DEPARTMENT OF SOCIAL SCIENCES
MBM 104
INTERNAL TOPIC REPORT ON
BUSINESS ANALYTICS THE 21st CENTURY WAY OF DECISION MAKING
ANHAD KASHYAP &
SUBHASH BHARADWAJ MBA 1st SEMESTER
Gurgaon Distance Education Center
Page 2
BUSINESS ANALYTICS
“What gets measured gets managed.”
- Peter Drucker
Management Consultant
And Educator
INTRODUCTION
Business analytics (BA) is the practice of
iterative, methodical exploration of an
organization’s data with emphasis on
statistical analysis. Business analytics is
used by companies committed to data-
driven decision making.
Examples of BA uses include:
Exploring data to find new patterns and
relationships (data mining)
Explaining why a certain result occurred
(statistical analysis, quantitative
analysis)
Experimenting to test previous decisions
(A/B testing, multivariate testing)
Forecasting future results (predictive
modeling, predictive analytics)
Once the business goal of the analysis is
determined, an analysis methodology is
selected and data is acquired to support the
analysis. Data acquisition often involves
extraction from one or more business
systems, cleansing, and integration into a
single repository such as a data warehouse
or data mart. The analysis is typically
performed against a smaller sample set of
data. Analytic tools range from
spreadsheets with statistical functions to
complex data mining and predictive
modeling applications. As patterns and
relationships in the data are uncovered,
new questions are asked and the analytic
process iterates until the business goal is
met. Deployment of predictive models
involves scoring data records (typically in a
database) and using the scores to optimize
real-time decisions within applications and
business processes. BA also supports
tactical decision making in response to
unforeseen events, and in many cases the
decision making is automated to support
real-time responses.
While the terms business intelligence and
business analytics are often used
interchangeably, there are some key
differences:
BI vs BA Business Intelligence Business Analytics
Answers
the questions
What happened? When? Who? How many?
Why did it happen? Will it happen again? What will happen if we change x? What else does the data tell us that never thought to ask?
Includes:
Reporting (KPIs, metrics) Automated Monitoring/Alerting (thresholds) Dashboards Scorecards OLAP (Cubes, Slice & Dice, Drilling) Ad hoc query
Statistical/Quantitative Analysis Data Mining Predictive Modeling Multivariate Testing
Recognizing the growing popularity of
business analytics, business intelligence
application vendors are including some BA
functionality in their products. More
recently, data warehouse appliance vendors
Page 3
have started to embed BA functionality
within the appliance. Major enterprise
system vendors are also embedding
analytics, and the trend towards putting
more analytics into memory is expected to
shorten the time between a business event
and decision/response.
BA is used to gain insights that inform
business decisions and can be used to
automate and optimize business processes.
Data-driven companies treat their data as a
corporate asset and leverage it for
competitive advantage. Successful business
analytics depends on data quality, skilled
analysts who understand the technologies
and the business and an organizational
commitment to data-driven decision
making.
Business analytics (BA) refers to the skills,
technologies, applications and practices for
continuous iterative exploration and
investigation of past business performance
to gain insight and drive business planning.
Business analytics focuses on developing
new insights and understanding of business
performance based on data and statistical
methods. In contrast, business intelligence
traditionally focuses on using a consistent
set of metrics to both measure past
performance and guide business planning,
which is also based on data and statistical
methods.
Business analytics makes extensive use of
data, statistical and quantitative analysis,
explanatory and predictive modeling, and
fact-based management to drive decision
making. It is therefore closely related to
management science. Analytics may be
used as input for human decisions or may
drive fully automated decisions. Business
intelligence is querying, reporting, OLAP,
and "alerts."
In other words, querying, reporting, OLAP,
and alert tools can answer questions such
as what happened, how many, how often,
where the problem is, and what actions are
needed. Business analytics can answer
questions like why is this happening, what if
these trends continue, what will happen
next (that is, predict), what is the best that
can happen (that is, optimize).
Banks, such as Capital One, use data
analysis (or analytics, as it is also called in
the business setting), to differentiate
among customers based on credit risk,
usage and other characteristics and then to
match customer characteristics with
appropriate product offerings. Harrah’s, the
gaming firm, uses analytics in its customer
loyalty programs. E & J Gallo Winery
quantitatively analyzes and predicts the
appeal of its wines. Between 2002 and
2005, Deere & Company saved more than
$1 billion by employing a new analytical
tool to better optimize inventory.
TYPES OF ANALYTICS
Descriptive Analytics: Gain insight from
historical data with reporting,
scorecards, clustering etc.
Predictive analytics (predictive modeling
using statistical and machine learning
techniques)
Page 4
Prescriptive analytics recommend
decisions using optimization, simulation
etc.
Decisive analytics: supports human
decisions with visual analytics the user
models to reflect reasoning.
BASIC DOMAINS WITHIN ANALYTICS
Retail sales analytics
Financial services analytics
Risk & Credit analytics
Talent analytics
Marketing analytics
Behavioral analytics
Cohort Analysis
Collections analytics
Fraud analytics
Pricing analytics
Telecommunications
Supply Chain analytics
Transportation analytics
Contextual data modeling - supports the
human reasoning that occurs after
viewing "executive dashboards" or any
other visual analytics
HISTORY
Analytics have been used in business since
the time management exercises that were
initiated by Frederick Winslow Taylor in the
late 19th century. Henry Ford measured
pacing of assembly line. But analytics began
to command more attention in the late
1960s when computers were used in
decision support systems. Since then,
analytics have evolved with the
development of enterprise resource
planning (ERP) systems, data warehouses,
and a wide variety of other hardware and
software tools and applications.
With the recent explosion of big data and
intuitive BI tools, data is more accessible to
business professionals and managers than
ever before. Thus there is a big opportunity
to make better decisions using that data to
drive incremental revenue, decrease cost
and loss by building better products,
improving customer experience, catching
fraud before it happens, improving
customer engagement through targeting
and customization- all with the power of
data. More and more companies are now
equipping their employees with the know-
how of Business Analytics to drive efficiency
in day-to-day decision making.
CHALLENGES
Business analytics depends on sufficient
volumes of high quality data. The difficulty
in ensuring data quality is, integrating and
reconciling data across different systems,
and then deciding what subsets of data to
be made available.
Previously, analytics was considered a type
of after-the-fact method of forecasting
consumer behavior by examining the
number of units sold in the last quarter or
the last year. This type of data warehousing
required a lot more storage space than it
did speed. Now business analytics is
becoming a tool that can influence the
outcome of customer interactions. When a
specific customer type is considering a
purchase, an analytics-enabled enterprise
can modify the sales pitch to appeal to that
Page 5
consumer. This means the storage space for
all that data must react extremely fast to
provide the necessary data in real-time.
COMPETING ON ANALYTICS
Davenport argues that businesses can
optimize a distinct business capability via
analytics and thus better compete. He
identifies these characteristics of an
organization that are apt to compete on
analytics:
One or more senior executives who
strongly advocate fact-based decision
making and, specifically, analytics
Widespread use of not only descriptive
statistics, but also predictive modeling
and complex optimization techniques
Substantial use of analytics across
multiple business functions or processes
Movement toward an enterprise level
approach to managing analytical tools,
data, and organizational skills and
capabilities
BUSINESS INTELLIGENCE
Business intelligence (BI) is a set of theories,
methodologies, architectures, and
technologies that transform raw data into
meaningful and useful information for
business purposes. BI can handle large
amounts of unstructured data to help
identify and develop new opportunities.
Making use of new opportunities and
implementing an effective strategy can
provide a competitive market advantage
and long-term stability.
Generally, Business Intelligence is increasing
number of components, these are:
Multidimensional aggregation and
allocation
Denormalization, tagging and
standardization
Reporting with analytical alert
Interface with unstructured data source
Group consolidation, budgeting and
rolling forecast
Statistical inference and probabilistic
simulation
Key performance indicators
optimization
Version control and process
management
Open item management
BI technologies provide historical, current
and predictive views of business operations.
Common functions of business intelligence
technologies are reporting, online analytical
processing, analytics, data mining, process
mining, complex event processing, business
performance management, benchmarking,
text mining, predictive analytics and
prescriptive analytics.
Though the term business intelligence is
sometimes a synonym for competitive
intelligence (because they both support
Page 6
decision making), BI uses technologies,
processes, and applications to analyze
mostly internal, structured data and
business processes while competitive
intelligence gathers, analyzes and
disseminates information with a topical
focus on company competitors. If
understood broadly, business intelligence
can include the subset of competitive
intelligence.
HISTORY OF BUSINESS INTELLIGENCE
In a 1958 article, IBM researcher Hans Peter
Luhn used the term business intelligence.
He employed the Webster's dictionary
definition of intelligence: "the ability to
apprehend the interrelationships of
presented facts in such a way as to guide
action towards a desired goal."
Business intelligence as it is understood
today is said to have evolved from the
decision support systems that began in the
1960s and developed throughout the mid-
1980s. DSS originated in the computer-
aided models created to assist with decision
making and planning. From DSS, data
warehouses, Executive Information
Systems, OLAP and business intelligence
came into focus beginning in the late 80s.
In 1988, an Italian-Dutch-French-English
consortium organized an international
meeting on the Multiway Data Analysis in
Rome. The ultimate goal is to reduce the
multiple dimensions down to one or two
(by detecting the patterns within the data)
that can then be presented to human
decision-makers.
In 1989, Howard Dresner (later a Gartner
Group analyst) proposed "business
intelligence" as an umbrella term to
describe "concepts and methods to improve
business decision making by using fact-
based support systems." It was not until the
late 1990s that this usage was widespread.
BUSINESS INTELLIGENCE AND DATA
WAREHOUSING
Often BI applications use data gathered
from a data warehouse or a data mart. A
data warehouse is a copy of analytical data
that facilitates decision support. However,
not all data warehouses are used for
business intelligence, nor do all business
intelligence applications require a data
warehouse.
To distinguish between the concepts of
business intelligence and data warehouses,
Forrester Research often defines business
intelligence in one of two ways:
"Business Intelligence is a set of
methodologies, processes, architectures,
and technologies that transform raw data
into meaningful and useful information
used to enable more effective strategic,
tactical, and operational insights and
decision-making." When using this
definition, business intelligence also
includes technologies such as data
integration, data quality, data warehousing,
master data management, text and content
analytics, and many others that the market
sometimes lumps into the Information
Management segment. Therefore, Forrester
refers to data preparation and data usage
Page 7
as two separate, but closely linked
segments of the business intelligence
architectural stack.
Forrester defines the latter, narrower
business intelligence market as, "...referring
to just the top layers of the BI architectural
stack such as reporting, analytics and
dashboards."
BUSINESS INTELLIGENCE AND BUSINESS
ANALYTICS
Thomas Davenport argues that business
intelligence should be divided into querying,
reporting, OLAP, an "alerts" tool, and
business analytics. In this definition,
business analytics is the subset of BI based
on statistics, prediction, and optimization.
APPLICATIONS IN AN ENTERPRISE
Business intelligence can be applied to the
following business purposes, in order to
drive business value.
1. Measurement – program that creates a
hierarchy of performance metrics (see
also Metrics Reference Model) and
benchmarking that informs business
leaders about progress towards
business goals (business process
management).
2. Analytics – program that builds
quantitative processes for a business to
arrive at optimal decisions and to
perform business knowledge discovery.
Frequently involves: data mining,
process mining, statistical analysis,
predictive analytics, predictive
modeling, business process modeling,
complex event processing and
prescriptive analytics.
3. Reporting/enterprise reporting –
program that builds infrastructure for
strategic reporting to serve the strategic
management of a business, not
operational reporting. Frequently
involves data visualization, executive
information system and OLAP.
4. Collaboration/collaboration platform –
program that gets different areas (both
inside and outside the business) to work
together through data sharing and
electronic data interchange.
5. Knowledge management – program to
make the company data driven through
strategies and practices to identify,
create, represent, distribute, and enable
adoption of insights and experiences
that are true business knowledge.
Knowledge management leads to
learning management and regulatory
compliance.
In addition to above, business intelligence
also can provide a pro-active approach,
such as ALARM function to alert
immediately to end-user. There are many
types of alerts, for example if some
business value exceeds the threshold value
the color of that amount in the report will
turn RED and the business analyst is
alerted. Sometimes an alert mail will be
sent to the user as well. This end to end
process requires data governance, which
should be handled by the expert.
Page 8
PRIORITIZATION OF BUSINESS
INTELLIGENCE PROJECTS
It is often difficult to provide a positive
business case for business intelligence
initiatives and often the projects must be
prioritized through strategic initiatives.
Here are some hints and advantages to
increase the benefits for a BI project.
As described by Kimball you must
determine the tangible benefits such as
eliminated cost of producing legacy
reports.
Enforce access to data for the entire
organization. In this way even a small
benefit, such as a few minutes saved,
makes a difference when multiplied by
the number of employees in the entire
organization.
As described by Ross, Weil & Roberson
for Enterprise Architecture, consider
letting the BI project be driven by other
business initiatives with excellent
business cases. To support this
approach, the organization must have
enterprise architects who can identify
suitable business projects.
Use a structured and quantitative
methodology to create defensible
prioritization in line with the actual
needs of the organization, such as a
weighted decision matrix.
SUCCESS FACTORS OF IMPLEMENTATION
Before implementing a BI solution, it is
worth taking different factors into
consideration before proceeding. According
to Kimball et al., these are the three critical
areas that you need to assess within your
organization before getting ready to do a BI
project:
1. The level of commitment and
sponsorship of the project from senior
management
2. The level of business need for creating a
BI implementation
3. The amount and quality of business data
available.
BUSINESS SPONSORSHIP
The commitment and sponsorship of senior
management is according to Kimball et al.,
the most important criteria for assessment.
This is because having strong management
backing helps overcome shortcomings
elsewhere in the project. However, as
Kimball et al. state: “even the most
elegantly designed DW/BI system cannot
overcome a lack of business [management]
sponsorship”.
It is important that personnel who
participate in the project have a vision and
an idea of the benefits and drawbacks of
implementing a BI system. The best
business sponsor should have
organizational clout and should be well
connected within the organization. It is
ideal that the business sponsor is
demanding but also able to be realistic and
supportive if the implementation runs into
delays or drawbacks. The management
sponsor also needs to be able to assume
accountability and to take responsibility for
failures and setbacks on the project.
Support from multiple members of the
management ensures the project does not
fail if one person leaves the steering group.
Page 9
However, having many managers work
together on the project can also mean that
there are several different interests that
attempt to pull the project in different
directions, such as if different departments
want to put more emphasis on their usage.
This issue can be countered by an early and
specific analysis of the business areas that
benefit the most from the implementation.
All stakeholders in project should
participate in this analysis in order for them
to feel ownership of the project and to find
common ground.
Another management problem that should
be encountered before start of
implementation is if the business sponsor is
overly aggressive and gets carried away by
the possibilities of using BI and starts
wanting the DW or BI implementation to
include several different sets of data that
were not included in the original planning
phase. However, since extra
implementations of extra data may add
many months to the original plan, it's wise
to make sure the person from management
is aware of his actions.
BUSINESS NEEDS
Because of the close relationship with
senior management, another critical thing
that must be assessed before the project
begins is whether or not there is a business
need and whether there is a clear business
benefit by doing the implementation. The
needs and benefits of the implementation
are sometimes driven by competition and
the need to gain an advantage in the
market. Another reason for a business-
driven approach to implementation of BI is
the acquisition of other organizations that
enlarge the original organization it can
sometimes be beneficial to implement DW
or BI in order to create more oversight.
Companies that implement BI are often
large, multinational organizations with
diverse subsidiaries. A well-designed BI
solution provides a consolidated view of key
business data not available anywhere else
in the organization, giving management
visibility and control over measures that
otherwise would not exist.
AMOUNT AND QUALITY OF AVAILABLE
DATA
Without good data, it does not matter how
good the management sponsorship or
business-driven motivation is. Without
proper data, or with too little quality data,
any BI implementation fails. Before
implementation it is a good idea to do data
profiling. This analysis identifies the
“content, consistency and structure [..]” of
the data. This should be done as early as
possible in the process and if the analysis
shows that data is lacking, put the project
on the shelf temporarily while the IT
department figures out how to properly
collect data.
When planning for business data and
business intelligence requirements, it is
always advisable to consider specific
scenarios that apply to a particular
organization, and then select the business
intelligence features best suited for the
scenario.
Page 10
Often, scenarios revolve around distinct
business processes, each built on one or
more data sources. These sources are used
by features that present that data as
information to knowledge workers, who
subsequently act on that information. The
business needs of the organization for each
business process adopted correspond to the
essential steps of business intelligence.
These essential steps of business
intelligence include but are not limited to:
1. Go through business data sources in
order to collect needed data
2. Convert business data to information
and present appropriately
3. Query and analyze data
4. Act on those data collected
The quality aspect in business intelligence
should cover all the process from the
source data to the final reporting. At each
step, the quality gates are different:
1. Source Data:
Data Standardization: make data
comparable (same unit, same
pattern..)
Master Data Management: unique
referential
2. Operational Data Store (ODS):
Data Cleansing: detect & correct
inaccurate data
Data Profiling: check inappropriate
value, null/empty
3. Data warehouse:
Completeness: check that all
expected data are loaded
Referential integrity: unique and
existing referential over all sources
Consistency between sources: check
consolidated data vs sources
4. Reporting:
Uniqueness of indicators: only one
share dictionary of indicators
Formula accurateness: local
reporting formula should be avoid or
checked
USER ASPECT
Some considerations must be made in order
to successfully integrate the usage of
business intelligence systems in a company.
Ultimately the BI system must be accepted
and utilized by the users in order for it to
add value to the organization. If the
usability of the system is poor, the users
may become frustrated and spend a
considerable amount of time figuring out
how to use the system or may not be able
to really use the system. If the system does
not add value to the users´ mission, they
simply don't use it.
To increase user acceptance of a BI system,
it can be advisable to consult business users
at an early stage of the DW/BI lifecycle, for
example at the requirements gathering
phase. This can provide an insight into the
business process and what the users need
from the BI system. There are several
methods for gathering this information,
such as questionnaires and interview
sessions.
When gathering the requirements from the
business users, the local IT department
should also be consulted in order to
Page 11
determine to which degree it is possible to
fulfill the business's needs based on the
available data.
Taking on a user-centered approach
throughout the design and development
stage may further increase the chance of
rapid user adoption of the BI system.
Besides focusing on the user experience
offered by the BI applications, it may also
possibly motivate the users to utilize the
system by adding an element of
competition. Kimball suggests
implementing a function on the Business
Intelligence portal website where reports
on system usage can be found. By doing so,
managers can see how well their
departments are doing and compare
themselves to others and this may spur
them to encourage their staff to utilize the
BI system even more.
In a 2007 article, H. J. Watson gives an
example of how the competitive element
can act as an incentive. Watson describes
how a large call centre implemented
performance dashboards for all call agents,
with monthly incentive bonuses tied to
performance metrics. Also, agents could
compare their performance to other team
members. The implementation of this type
of performance measurement and
competition significantly improved agent
performance.
BI chances of success can be improved by
involving senior management to help make
BI a part of the organizational culture, and
by providing the users with necessary tools,
training, and support. Training encourages
more people to use the BI application.
Providing user support is necessary to
maintain the BI system and resolve user
problems. User support can be
incorporated in many ways, for example by
creating a website. The website should
contain great content and tools for finding
the necessary information. Furthermore,
helpdesk support can be used. The help
desk can be manned by power users or the
DW/BI project team.
BI PORTALS
A Business Intelligence portal (BI portal) is
the primary access interface for Data
Warehouse (DW) and Business Intelligence
(BI) applications. The BI portal is the users
first impression of the DW/BI system. It is
typically a browser application, from which
the user has access to all the individual
services of the DW/BI system, reports and
other analytical functionality. The BI portal
must be implemented in such a way that it
is easy for the users of the DW/BI
application to call on the functionality of
the application.
Page 12
The BI portal's main functionality is to
provide a navigation system of the DW/BI
application. This means that the portal has
to be implemented in a way that the user
has access to all the functions of the DW/BI
application.
The most common way to design the portal
is to custom fit it to the business processes
of the organization for which the DW/BI
application is designed, in that way the
portal can best fit the needs and
requirements of its users.
The BI portal needs to be easy to use and
understand, and if possible have a look and
feel similar to other applications or web
content of the organization the DW/BI
application is designed for (consistency).
The following is a list of desirable features
for web portals in general and BI portals in
particular:
Usable
User should easily find what they need in
the BI tool.
Content Rich
The portal is not just a report printing tool,
it should contain more functionality such as
advice, help, support information and
documentation.
Clean
The portal should be designed so it is easily
understandable and not over complex as to
confuse the users
Current
The portal should be updated regularly.
Interactive
The portal should be implemented in a way
that makes it easy for the user to use its
functionality and encourage them to use
the portal. Scalability and customization
give the user the means to fit the portal to
each user.
Value Oriented
It is important that the user has the feeling
that the DW/BI application is a valuable
resource that is worth working on.
Marketplace
There are a number of business intelligence
vendors, often categorized into the
remaining independent "pure-play" vendors
and consolidated "mega vendors" that have
entered the market through a recent trend
of acquisitions in the BI industry.
Some companies adopting BI software
decide to pick and choose from different
product offerings (best-of-breed) rather
than purchase one comprehensive
integrated solution (full-service).
Industry-specific
Specific considerations for business
intelligence systems have to be taken in
some sectors such as governmental banking
regulations. The information collected by
banking institutions and analyzed with BI
software must be protected from some
groups or individuals, while being fully
available to other groups or individuals.
Therefore BI solutions must be sensitive to
those needs and be flexible enough to
Page 13
adapt to new regulations and changes to
existing law.
SEMI-STRUCTURED OR UNSTRUC-TURED
DATA
Businesses create a huge amount of
valuable information in the form of e-mails,
memos, notes from call-centers, news, user
groups, chats, reports, web-pages,
presentations, image-files, video-files, and
marketing material and news. According to
Merrill Lynch, more than 85% of all business
information exists in these forms. These
information types are called either semi-
structured or unstructured data. However,
organizations often only use these
documents once.
The management of semi-structured data is
recognized as a major unsolved problem in
the information technology industry.
According to projections from Gartner
(2003), white collar workers spend
anywhere from 30 to 40 percent of their
time searching, finding and assessing
unstructured data. BI uses both structured
and unstructured data, but the former is
easy to search, and the latter contains a
large quantity of the information needed
for analysis and decision making. Because of
the difficulty of properly searching, finding
and assessing unstructured or semi-
structured data, organizations may not
draw upon these vast reservoirs of
information, which could influence a
particular decision, task or project. This can
ultimately lead to poorly informed decision
making.
Therefore, when designing a business
intelligence/DW-solution, the specific
problems associated with semi-structured
and unstructured data must be
accommodated for as well as those for the
structured data.
UNSTRUCTURED DATA V/S SEMI-
STRUCTURED DATA
Unstructured and semi-structured data
have different meanings depending on their
context. In the context of relational
database systems, unstructured data
cannot be stored in predictably ordered
columns and rows. One type of
unstructured data is typically stored in a
BLOB (binary large object), a catch-all data
type available in most relational database
management systems. Unstructured data
may also refer to irregularly or randomly
repeated column patterns that vary from
row to row within each file or document.
Many of these data types, however, like e-
mails, word processing text files, PPTs,
image-files, and video-files conform to a
standard that offers the possibility of
metadata. Metadata can include
information such as author and time of
creation, and this can be stored in a
relational database. Therefore it may be
more accurate to talk about this as semi-
structured documents or data, but no
specific consensus seems to have been
reached.
Unstructured data can also simply be the
knowledge that business users have about
future business trends. Business forecasting
Page 14
naturally aligns with the BI system because
business users think of their business in
aggregate terms. Capturing the business
knowledge that may only exist in the minds
of business users provides some of the most
important data points for a complete BI
solution.
PROBLEMS WITH SEMI-STRUCTURED OR
UNSTRUCTURED DATA
There are several challenges to developing
BI with semi-structured data. According to
Inmon & Nesavich, some of those are:
1. Physically accessing unstructured
textual data – unstructured data is
stored in a huge variety of formats.
2. Terminology – Among researchers and
analysts, there is a need to develop a
standardized terminology.
3. Volume of data – As stated earlier, up to
85% of all data exists as semi-structured
data. Couple that with the need for
word-to-word and semantic analysis.
4. Searchability of unstructured textual
data – A simple search on some data,
e.g. apple, results in links where there is
a reference to that precise search term.
(Inmon & Nesavich, 2008) gives an
example: “a search is made on the term
felony. In a simple search, the term
felony is used, and everywhere there is
a reference to felony, a hit to an
unstructured document is made. But a
simple search is crude. It does not find
references to crime, arson, murder,
embezzlement, vehicular homicide, and
such, even though these crimes are
types of felonies.”
THE USE OF METADATA
To solve problems with searchability and
assessment of data, it is necessary to know
something about the content. This can be
done by adding context through the use of
metadata. Many systems already capture
some metadata (e.g. filename, author, size,
etc.), but more useful would be metadata
about the actual content – e.g. summaries,
topics, people or companies mentioned.
Two technologies designed for generating
metadata about content are automatic
categorization and information extraction.
FUTURE
A 2009 Gartner paper predicted these
developments in the business intelligence
market:
Because of lack of information,
processes, and tools, through 2012,
more than 35 percent of the top 5,000
global companies regularly fail to make
insightful decisions about significant
changes in their business and markets.
By 2012, business units will control at
least 40 percent of the total budget for
business intelligence.
By 2012, one-third of analytic
applications applied to business
processes will be delivered through
coarse-grained application mashups.
A 2009 Information Management special
report predicted the top BI trends: "green
computing, social networking, data
visualization, mobile BI, predictive analytics,
composite applications, cloud computing
and multi touch."
Page 15
Other business intelligence trends include
the following:
Third party SOA-BI products increasingly
address ETL issues of volume and
throughput.
Companies embrace in-memory
processing, 64-bit processing, and pre-
packaged analytic BI applications.
Operational applications have callable BI
components, with improvements in
response time, scaling, and
concurrency.
Near or real time BI analytics is a
baseline expectation.
Open source BI software replaces
vendor offerings.
Other lines of research include the
combined study of business intelligence and
uncertain data. In this context, the data
used is not assumed to be precise, accurate
and complete. Instead, data is considered
uncertain and therefore this uncertainty is
propagated to the results produced by BI.
According to a study by the Aberdeen
Group, there has been increasing interest in
Software-as-a-Service (SaaS) business
intelligence over the past years, with twice
as many organizations using this
deployment approach as one year ago –
15% in 2009 compared to 7% in 2008.
An article by InfoWorld’s Chris Kanaracus
points out similar growth data from
research firm IDC, which predicts the SaaS
BI market will grow 22 percent each year
through 2013 thanks to increased product
sophistication, strained IT budgets, and
other factors.
ANALYTIC APPLICATIONS
Analytic applications are a type of business
application software, used to measure and
improve the performance of business
operations. More specifically, analytic
applications are a type of business
intelligence solution. As such they use
collections of historical data about business
operations to provide business users with
information and tools that allow them to
make improvements in business functions.
The maturity levels for business intelligence
solutions are as follows:
operational reporting
analytic reporting
business dashboards
analytic applications
It may extend further to predictive
analytics, or predictive analysis may form
part of the analytic application - depending
on both the subject matter under analysis,
and the nature of the analysis required.
Analytic applications are typically described
as a subset of performance management.
Page 16
They specifically relate to the analysis of a
business process (such as sales pipeline
analysis, accounts payable analytics, or risk
adjusted profitability analysis) in support of
decision making.
To qualify as an application (rather than
simply as a data warehousing tool), these
tools should promote some form of
automation. The maturity level of this
automation is as follows:
reading data from a nominated
operational system (ERP, CRM, SCM,
etc.) into a data warehouse optimized
for analysis (data led automation),
reports, dashboards and scorecards
based on that data structure (reporting
led automation),
what-if analysis and scenario-modeling
(predictive or analytic led automation).
In most cases, these three levels are
discrete functions, loosely banded together
as a single product, and there is little
automation of the process from end to end.
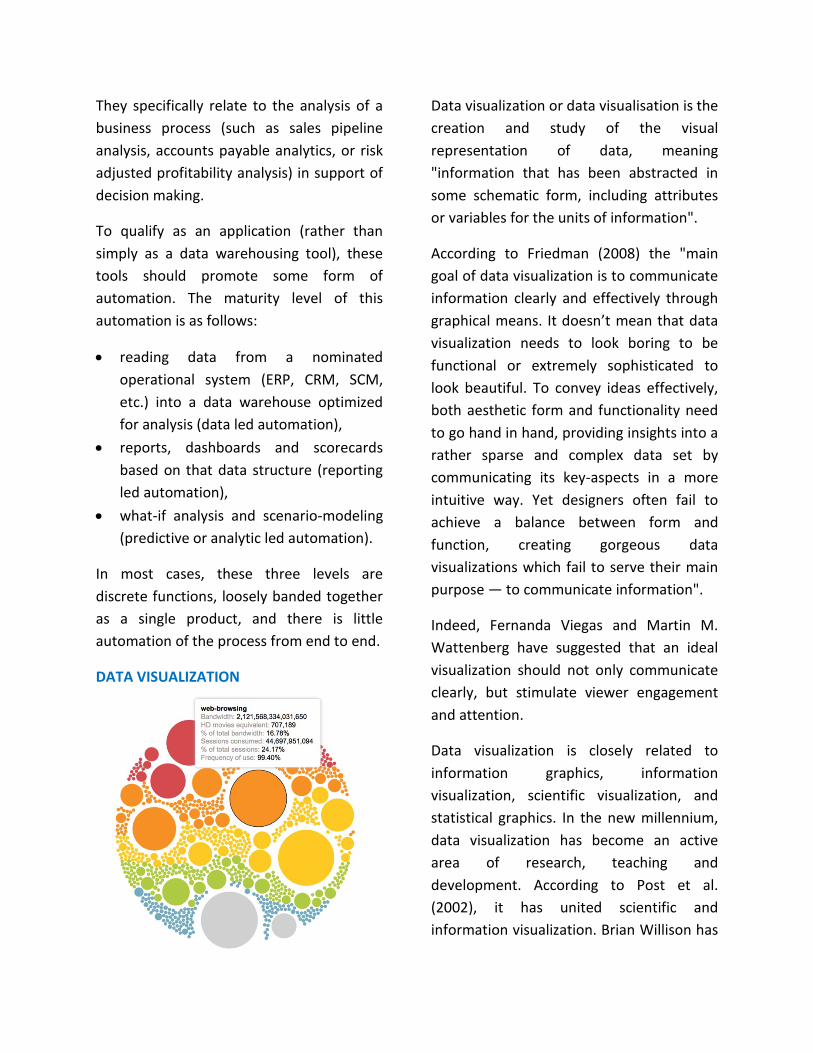
DATA VISUALIZATION
Data visualization or data visualisation is the
creation and study of the visual
representation of data, meaning
"information that has been abstracted in
some schematic form, including attributes
or variables for the units of information".
According to Friedman (2008) the "main
goal of data visualization is to communicate
information clearly and effectively through
graphical means. It doesn’t mean that data
visualization needs to look boring to be
functional or extremely sophisticated to
look beautiful. To convey ideas effectively,
both aesthetic form and functionality need
to go hand in hand, providing insights into a
rather sparse and complex data set by
communicating its key-aspects in a more
intuitive way. Yet designers often fail to
achieve a balance between form and
function, creating gorgeous data
visualizations which fail to serve their main
purpose — to communicate information".
Indeed, Fernanda Viegas and Martin M.
Wattenberg have suggested that an ideal
visualization should not only communicate
clearly, but stimulate viewer engagement
and attention.
Data visualization is closely related to
information graphics, information
visualization, scientific visualization, and
statistical graphics. In the new millennium,
data visualization has become an active
area of research, teaching and
development. According to Post et al.
(2002), it has united scientific and
information visualization. Brian Willison has
Page 17
demonstrated that data visualization has
also been linked to enhancing agile
software development and customer
engagement.
KPI Library has developed the “Periodic
Table of Visualization Methods,” an
interactive chart displaying various data
visualization methods. It includes six types
of data visualization methods: data,
information, concept, strategy, metaphor
and compound.
DATA VISUALIZATION SCOPE
There are different approaches on the
scope of data visualization. One common
focus is on information presentation, such
as Friedman (2008) presented it. In this way
Friendly (2008) presumes two main parts of
data visualization: statistical graphics, and
thematic cartography. In this line the "Data
Visualization: Modern Approaches" (2007)
article gives an overview of seven subjects
of data visualization:
Articles & resources
Displaying connections
Displaying data
Displaying news
Displaying websites
Mind maps
Tools and services
All these subjects are closely related to
graphic design and information
representation.
On the other hand, from a computer
science perspective, Frits H. Post (2002)
categorized the field into a number of sub-
fields:
Information visualization
Interaction techniques and
architectures
Modelling techniques
Multiresolution methods
Visualization algorithms and techniques
Volume visualization
For different types of visualizations and
their connection to infographics, see
infographics.
DATA ACQUISITION
Data acquisition is the sampling of the real
world to generate data that can be
manipulated by a computer. Sometimes
abbreviated DAQ or DAS, data acquisition
typically involves acquisition of signals and
waveforms and processing the signals to
obtain desired information. The
components of data acquisition systems
include appropriate sensors that convert
any measurement parameter to an
electrical signal, which is acquired by data
acquisition hardware.
DATA ANALYSIS
Data analysis is the process of studying and
summarizing data with the intent to extract
useful information and develop conclusions.
Data analysis is closely related to data
mining, but data mining tends to focus on
larger data sets with less emphasis on
making inference, and often uses data that
was originally collected for a different
purpose. In statistical applications, some
Page 18
people divide data analysis into descriptive
statistics, exploratory data analysis, and
inferential statistics (or confirmatory data
analysis), where the EDA focuses on
discovering new features in the data, and
CDA on confirming or falsifying existing
hypotheses.
Types of data analysis are:
Exploratory data analysis (EDA): an
approach to analyzing data for the
purpose of formulating hypotheses
worth testing, complementing the tools
of conventional statistics for testing
hypotheses. It was so named by John
Tukey.
Qualitative data analysis (QDA) or
qualitative research is the analysis of
non-numerical data, for example words,
photographs, observations, etc
DATA GOVERNANCE
Data governance encompasses the people,
processes and technology required to
create a consistent, enterprise view of an
organization’s data in order to:
Decrease the risk of regulatory fines
Designate accountability for information
quality
Improve data security
Increase consistency & confidence in
decision making
Maximize the income generation
potential of data
DATA MANAGEMENT
Data management comprises all the
academic disciplines related to managing
data as a valuable resource. The official
definition provided by DAMA is that "Data
Resource Management is the development
and execution of architectures, policies,
practices, and procedures that properly
manage the full data lifecycle needs of an
enterprise." This definition is fairly broad
and encompasses a number of professions
that may not have direct technical contact
with lower-level aspects of data
management, such as relational database
management.
DATA MINING
Data mining is the process of sorting
through large amounts of data and picking
out relevant information. It is usually used
by business intelligence organizations, and
financial analysts, but is increasingly being
used in the sciences to extract information
from the enormous data sets generated by
modern experimental and observational
methods.
It has been described as "the nontrivial
extraction of implicit, previously unknown,
and potentially useful information from
data" and "the science of extracting useful
information from large data sets or
databases." In relation to enterprise
resource planning, according to Monk
(2006), data mining is "the statistical and
logical analysis of large sets of transaction
data, looking for patterns that can aid
decision making".
Page 19
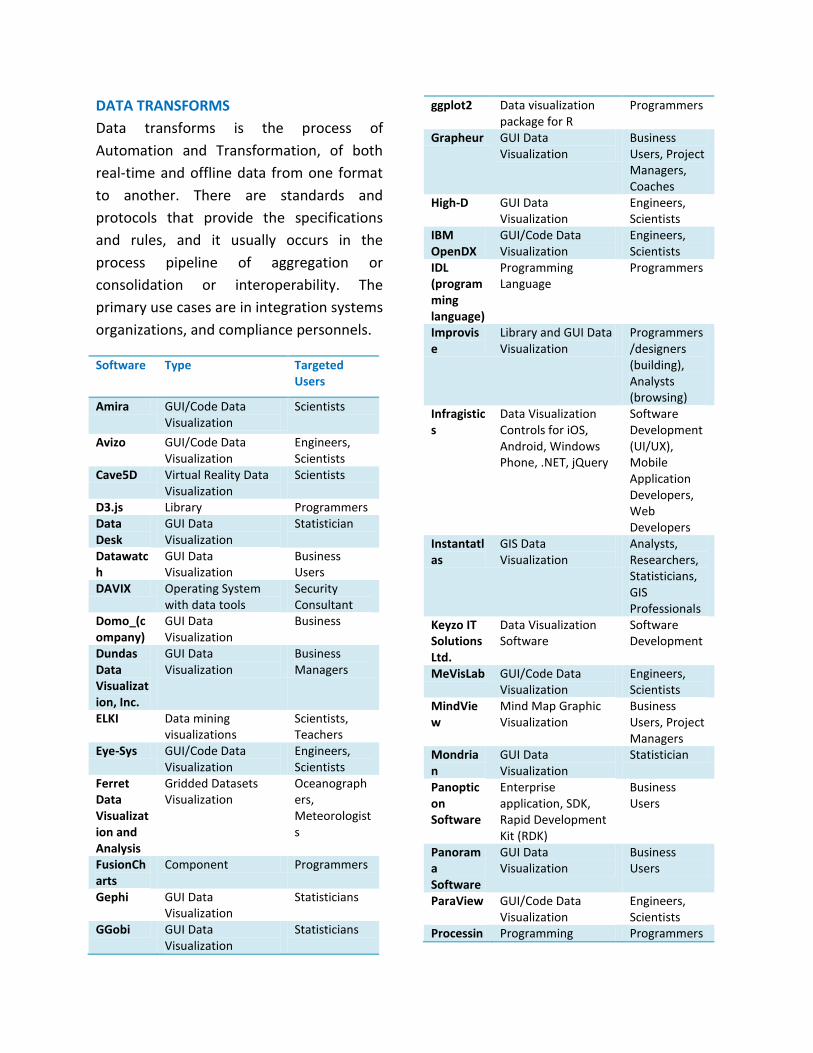
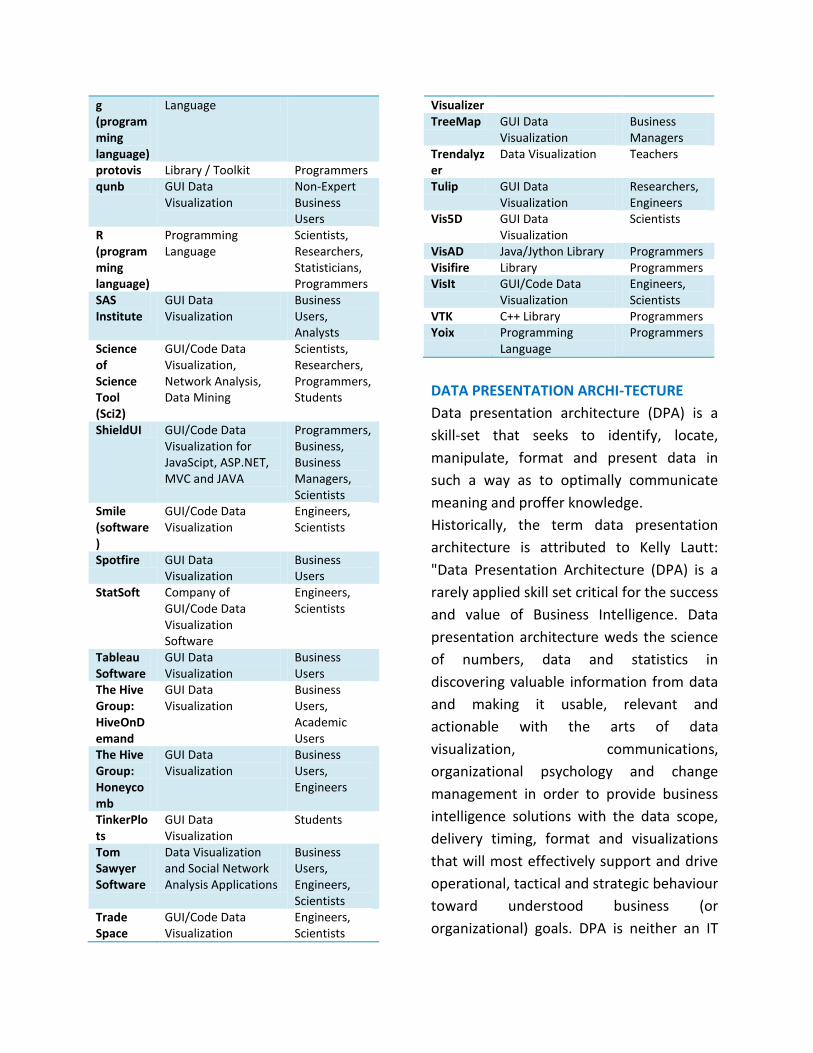
DATA TRANSFORMS
Data transforms is the process of
Automation and Transformation, of both
real-time and offline data from one format
to another. There are standards and
protocols that provide the specifications
and rules, and it usually occurs in the
process pipeline of aggregation or
consolidation or interoperability. The
primary use cases are in integration systems
organizations, and compliance personnels.
Software Type Targeted Users
Amira GUI/Code Data Visualization
Scientists
Avizo GUI/Code Data Visualization
Engineers, Scientists
Cave5D Virtual Reality Data Visualization
Scientists
D3.js Library Programmers Data Desk
GUI Data Visualization
Statistician
Datawatch
GUI Data Visualization
Business Users
DAVIX Operating System with data tools
Security Consultant
Domo_(company)
GUI Data Visualization
Business
Dundas Data Visualization, Inc.
GUI Data Visualization
Business Managers
ELKI Data mining visualizations
Scientists, Teachers
Eye-Sys GUI/Code Data Visualization
Engineers, Scientists
Ferret Data Visualization and Analysis
Gridded Datasets Visualization
Oceanographers, Meteorologists
FusionCharts
Component Programmers
Gephi GUI Data Visualization
Statisticians
GGobi GUI Data Visualization
Statisticians
ggplot2 Data visualization package for R
Programmers
Grapheur GUI Data Visualization
Business Users, Project Managers, Coaches
High-D GUI Data Visualization
Engineers, Scientists
IBM OpenDX
GUI/Code Data Visualization
Engineers, Scientists
IDL (programming language)
Programming Language
Programmers
Improvise
Library and GUI Data Visualization
Programmers/designers (building), Analysts (browsing)
Infragistics
Data Visualization Controls for iOS, Android, Windows Phone, .NET, jQuery
Software Development (UI/UX), Mobile Application Developers, Web Developers
Instantatlas
GIS Data Visualization
Analysts, Researchers, Statisticians, GIS Professionals
Keyzo IT Solutions Ltd.
Data Visualization Software
Software Development
MeVisLab GUI/Code Data Visualization
Engineers, Scientists
MindView
Mind Map Graphic Visualization
Business Users, Project Managers
Mondrian
GUI Data Visualization
Statistician
Panopticon Software
Enterprise application, SDK, Rapid Development Kit (RDK)
Business Users
Panorama Software
GUI Data Visualization
Business Users
ParaView GUI/Code Data Visualization
Engineers, Scientists
Processin Programming Programmers
Page 20
g (programming language)
Language
protovis Library / Toolkit Programmers qunb GUI Data
Visualization Non-Expert Business Users
R (programming language)
Programming Language
Scientists, Researchers, Statisticians, Programmers
SAS Institute
GUI Data Visualization
Business Users, Analysts
Science of Science Tool (Sci2)
GUI/Code Data Visualization, Network Analysis, Data Mining
Scientists, Researchers, Programmers, Students
ShieldUI GUI/Code Data Visualization for JavaScipt, ASP.NET, MVC and JAVA
Programmers, Business, Business Managers, Scientists
Smile (software)
GUI/Code Data Visualization
Engineers, Scientists
Spotfire GUI Data Visualization
Business Users
StatSoft Company of GUI/Code Data Visualization Software
Engineers, Scientists
Tableau Software
GUI Data Visualization
Business Users
The Hive Group: HiveOnDemand
GUI Data Visualization
Business Users, Academic Users
The Hive Group: Honeycomb
GUI Data Visualization
Business Users, Engineers
TinkerPlots
GUI Data Visualization
Students
Tom Sawyer Software
Data Visualization and Social Network Analysis Applications
Business Users, Engineers, Scientists
Trade Space
GUI/Code Data Visualization
Engineers, Scientists
Visualizer
TreeMap GUI Data Visualization
Business Managers
Trendalyzer
Data Visualization Teachers
Tulip GUI Data Visualization
Researchers, Engineers
Vis5D GUI Data Visualization
Scientists
VisAD Java/Jython Library Programmers Visifire Library Programmers VisIt GUI/Code Data
Visualization Engineers, Scientists
VTK C++ Library Programmers Yoix Programming
Language Programmers
DATA PRESENTATION ARCHI-TECTURE
Data presentation architecture (DPA) is a
skill-set that seeks to identify, locate,
manipulate, format and present data in
such a way as to optimally communicate
meaning and proffer knowledge.
Historically, the term data presentation
architecture is attributed to Kelly Lautt:
"Data Presentation Architecture (DPA) is a
rarely applied skill set critical for the success
and value of Business Intelligence. Data
presentation architecture weds the science
of numbers, data and statistics in
discovering valuable information from data
and making it usable, relevant and
actionable with the arts of data
visualization, communications,
organizational psychology and change
management in order to provide business
intelligence solutions with the data scope,
delivery timing, format and visualizations
that will most effectively support and drive
operational, tactical and strategic behaviour
toward understood business (or
organizational) goals. DPA is neither an IT
Page 21
nor a business skill set but exists as a
separate field of expertise. Often confused
with data visualization, data presentation
architecture is a much broader skill set that
includes determining what data on what
schedule and in what exact format is to be
presented, not just the best way to present
data that has already been chosen (which is
data visualization). Data visualization skills
are one element of DPA."
OBJECTIVES
DPA has two main objectives:
To use data to provide knowledge in the
most efficient manner possible
(minimize noise, complexity, and
unnecessary data or detail given each
audience's needs and roles)
To use data to provide knowledge in the
most effective manner possible (provide
relevant, timely and complete data to
each audience member in a clear and
understandable manner that conveys
important meaning, is actionable and
can affect understanding, behavior and
decisions)
Scope
With the above objectives in mind, the
actual work of data presentation
architecture consists of:
Creating effective delivery mechanisms
for each audience member depending
on their role, tasks, locations and access
to technology
Defining important meaning (relevant
knowledge) that is needed by each
audience member in each context
Determining the required periodicity of
data updates (the currency of the data)
Determining the right timing for data
presentation (when and how often the
user needs to see the data)
Finding the right data (subject area,
historical reach, breadth, level of detail,
etc.)
Utilizing appropriate analysis, grouping,
visualization, and other presentation
formats
RELATED FIELDS
DPA work has some commonalities with
several other fields, including:
Business analysis in determining
business goals, collecting requirements,
mapping processes.
Business process improvement in that
its goal is to improve and streamline
actions and decisions in furtherance of
business goals
Data visualization in that it uses well-
established theories of visualization to
add or highlight meaning or importance
in data presentation.
Graphic or user design: As the term DPA
is used, it falls just short of design in
that it does not consider such detail as
colour palates, styling, branding and
other aesthetic concerns, unless these
design elements are specifically
required or beneficial for
communication of meaning, impact,
severity or other information of
business value. For example:
choosing locations for various data
presentation elements on a
Page 22
presentation page (such as in a
company portal, in a report or on a web
page) in order to convey hierarchy,
priority, importance or a rational
progression for the user is part of the
DPA skill-set.
choosing to provide a specific colour in
graphical elements that represent data
of specific meaning or concern is part of
the DPA skill-set
Information architecture, but
information architecture's focus is on
unstructured data and therefore
excludes both analysis (in the
statistical/data sense) and direct
transformation of the actual content
(data, for DPA) into new entities and
combinations.
Solution architecture in determining the
optimal detailed solution, including the
scope of data to include, given the
business goals
Statistical analysis or data analysis in
that it creates information and
knowledge out of data
CONCLUSION
Benefits of Business Analytics are:
• Improving the decision making process
(quality & relevance)
• Speeding up of decision making process
• Better alignment with strategy
• Realizing cost efficiency
• Responding to user needs for availability
of data on timely basis
• Improving competitiveness
• Producing a single , unified view of
enterprise information
• Synchronizing financial and operational
strategy
• Increase revenues
• Sharing information with a wider audience
REFERENCES
1. Beller, Michael J.; Alan Barnett (2009-06-
18). "Next Generation Business Analytics".
Lightship Partners LLC. Retrieved 2009-06-
20.
2. Galit Schmueli and Otto Koppius. "Predictive
vs. Explanatory Modeling in IS Research".
3. a b c d e Davenport, Thomas H.; Harris,
Jeanne G. (2007). Competing on analytics :
the new science of winning. Boston, Mass.:
Harvard Business School Press. ISBN 978-1-
4221-0332-6.
4. Jain, Piyanka. "Analytics is Fast Becoming a
Core Competency for Business
Professionals". Forbes. Forbes. Retrieved 10
May 2013.
5. "Choosing the Best Storage for Business
Analytics". Dell.com. Retrieved 06-25-12.