Business Analytics Business Analytics Training Guide for ExponentHR This guide provides detailed information on the ExponentHR Business Analytics utility. The tools described in this guide allow managers with Business Analytics rights to create, modify, and generate custom reports and dashboards in ExponentHR. Exponent Technologies 4970 Landmark Place Dallas, TX 75254 (214) 987-4567
Transcript
Business Analytics
Business Analytics Training Guide for ExponentHR This guide provides detailed information on the ExponentHR Business Analytics utility. The tools described in this guide allow managers with Business Analytics rights to create, modify, and generate custom reports and dashboards in ExponentHR.
Exponent Technologies 4970 Landmark Place Dallas, TX 75254 (214) 987-4567
ExponentHR Business Analytics Training Guide
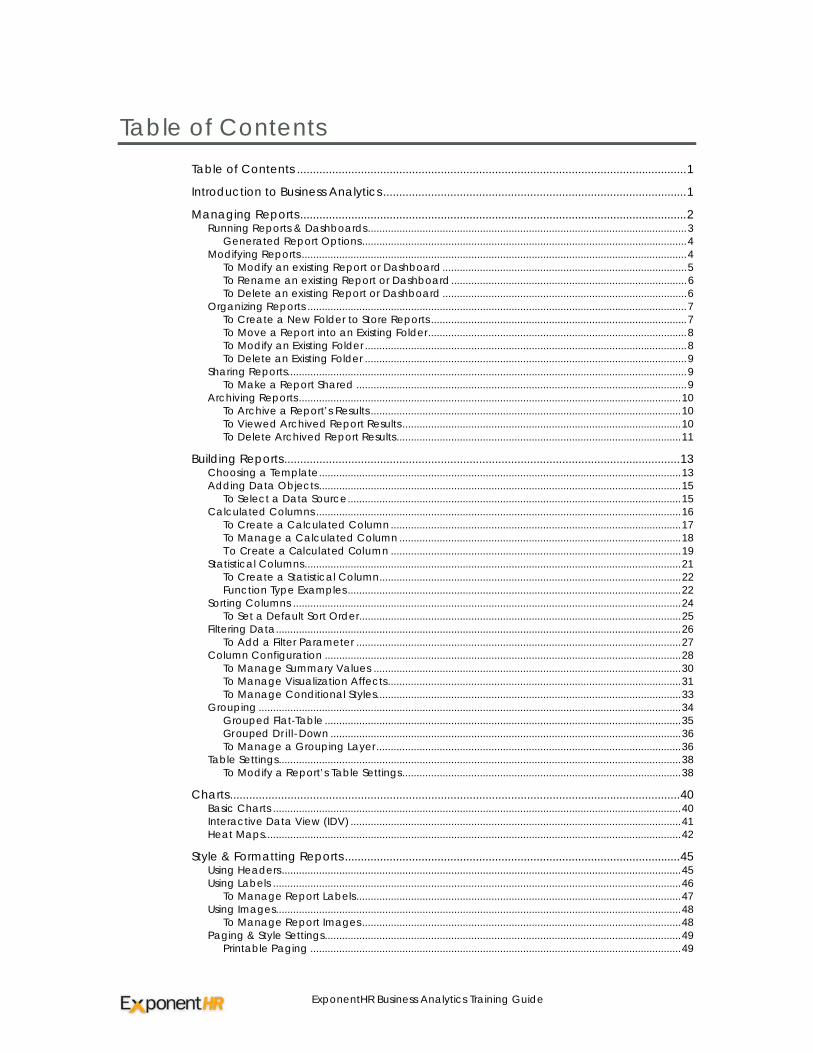
Table of Contents Table of Contents .......................................................................................................................... 1 Introduction to Business Analytics ............................................................................................... 1 Managing Reports ......................................................................................................................... 2
Modifying Reports ...................................................................................................................................... 4 To Modify an existing Report or Dashboard ..................................................................................... 5 To Rename an existing Report or Dashboard .................................................................................. 6 To Delete an existing Report or Dashboard ..................................................................................... 6
Organizing Reports .................................................................................................................................... 7 To Create a New Folder to Store Reports ......................................................................................... 7 To Move a Report into an Existing Folder .......................................................................................... 8 To Modify an Existing Folder ................................................................................................................ 8 To Delete an Existing Folder ................................................................................................................ 9
Sharing Reports........................................................................................................................................... 9 To Make a Report Shared ................................................................................................................... 9
Archiving Reports ..................................................................................................................................... 10 To Archive a Report’s Results ............................................................................................................ 10 To Viewed Archived Report Results ................................................................................................. 10 To Delete Archived Report Results ................................................................................................... 11
Building Reports ............................................................................................................................ 13 Choosing a Template .............................................................................................................................. 13 Adding Data Objects .............................................................................................................................. 15
To Select a Data Source .................................................................................................................... 15 Calculated Columns ............................................................................................................................... 16
To Create a Calculated Column ..................................................................................................... 17 To Manage a Calculated Column .................................................................................................. 18 To Create a Calculated Column ..................................................................................................... 19
Statistical Columns ................................................................................................................................... 21 To Create a Statistical Column ......................................................................................................... 22 Function Type Examples .................................................................................................................... 22
Sorting Columns ....................................................................................................................................... 24 To Set a Default Sort Order ................................................................................................................ 25
Filtering Data ............................................................................................................................................. 26 To Add a Filter Parameter ................................................................................................................. 27
Column Configuration ............................................................................................................................ 28 To Manage Summary Values ........................................................................................................... 30 To Manage Visualization Affects ...................................................................................................... 31 To Manage Conditional Styles .......................................................................................................... 33
Grouping ................................................................................................................................................... 34 Grouped Flat-Table ............................................................................................................................ 35 Grouped Drill-Down .......................................................................................................................... 36 To Manage a Grouping Layer .......................................................................................................... 36
Table Settings ............................................................................................................................................ 38 To Modify a Report’s Table Settings ................................................................................................. 38
Style & Formatting Reports ......................................................................................................... 45 Using Headers ........................................................................................................................................... 45 Using Labels .............................................................................................................................................. 46
To Manage Report Labels ................................................................................................................. 47 Using Images ............................................................................................................................................. 48
To Manage Export Options ............................................................................................................... 51 Building a Dashboard ................................................................................................................. 53
To Create a Dashboard .................................................................................................................... 53 Dashboard Settings ................................................................................................................................. 54 Dashboard Panels ................................................................................................................................... 54
To Manage Dashboard Panels ........................................................................................................ 55
ExponentHR Business Analytics Training Guide 1 of 56
Introduction to Business Analytics
Business Analytics is a web-based reporting utility provided as an additional reporting tool that will offer the ability to make building, sharing, and analyzing business intelligence reports a quick and customizable process. With Business Analytics, there is no need for downloadable report viewers, and no time or assistance is required from technical developers to easily create professional, informative reports.
Business Analytics delivers a user-friendly interface and full-featured reporting tools. You can create interactive charts and graphs, as well as publish comprehensive reports to share with others. An easy-to-use Report Builder walks you through all the steps required to create comprehensive and interactive reports. Here are just a few of the many features found in Business Analytics:
• Select fields and columns to use for custom reports
• Add graphing elements to reports
• Subscribe to receive automated report results via e-mail
• Build database queries
• Add parameters to filter report data
• Include interactive paging, search functionality and printing options
• Share reports with other users
• Edit existing reports
• Export results CSV format
• Interactively sort columns of data in a generated report results
• Use drill-down reports to organize columns and data
ExponentHR Business Analytics Training Guide 2 of 56
Managing Reports
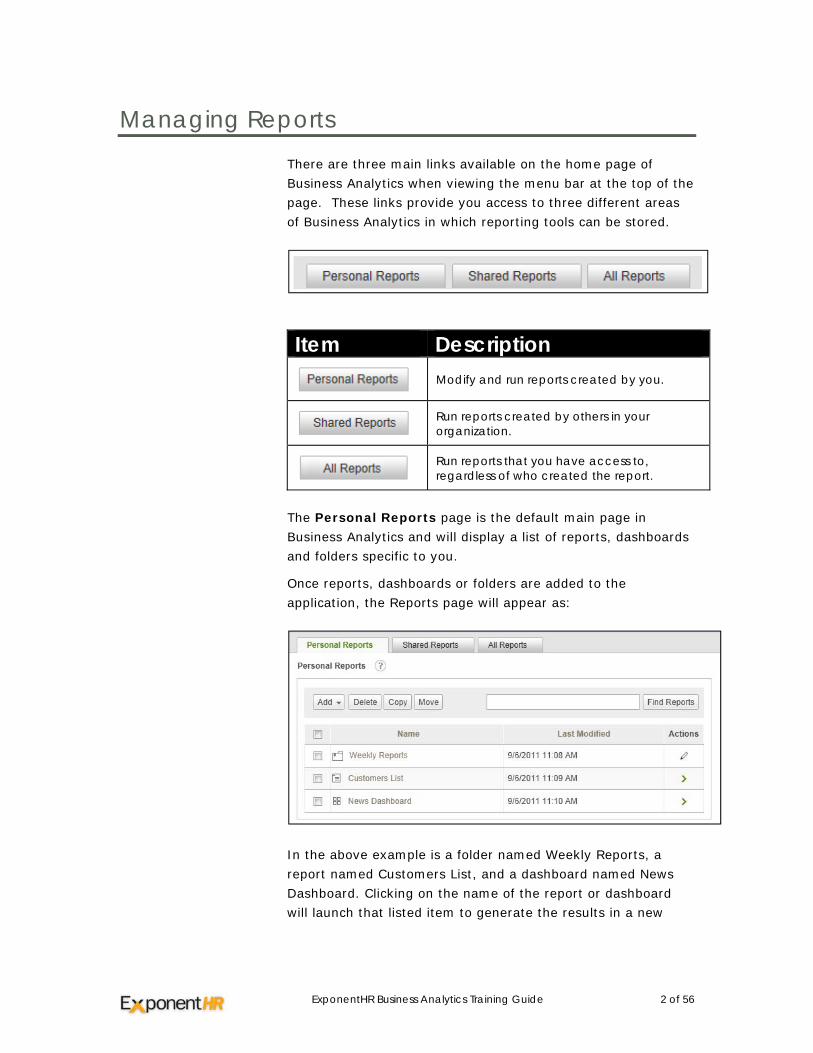
There are three main links available on the home page of Business Analytics when viewing the menu bar at the top of the page. These links provide you access to three different areas of Business Analytics in which reporting tools can be stored.
Item Description
Modify and run reports created by you.
Run reports created by others in your organization.
Run reports that you have access to, regardless of who created the report.
The Personal Reports page is the default main page in Business Analytics and will display a list of reports, dashboards and folders specific to you.
Once reports, dashboards or folders are added to the application, the Reports page will appear as:
In the above example is a folder named Weekly Reports, a report named Customers List, and a dashboard named News Dashboard. Clicking on the name of the report or dashboard will launch that listed item to generate the results in a new
ExponentHR Business Analytics Training Guide 3 of 56
browser window based on the configuration of that report(s) in the Report Builder.
The following icons are used to signify a report's status or type:
Item Description Single Report
Will generate the results for a single report based on the set parameters.
Single Report - Scheduled
A report that is set to be generated automatically per the defined schedule.
Single Report - Subscribed
A report that you will receive generated results for when the report is run.
Dashboard A single page view made up of multiple panels that each contains a separate report’s generated results.
Running Reports & Dashboards
Clicking on the name of the report or dashboard will launch that listed item to generate the results in a new browser window based on the configuration of that report(s) in the Report Builder. By clicking on a folder, the contents of that folder will be displayed providing the ability to run any reports or dashboards located in that folder.
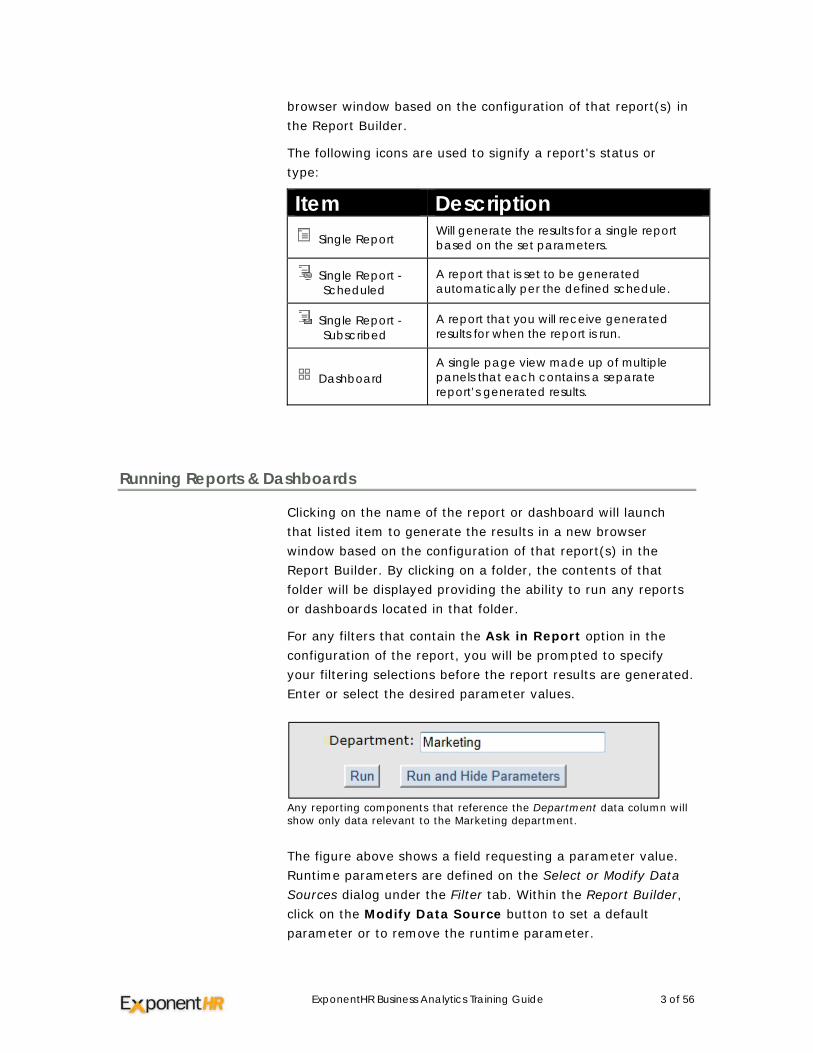
For any filters that contain the Ask in Report option in the configuration of the report, you will be prompted to specify your filtering selections before the report results are generated. Enter or select the desired parameter values.
Any reporting components that reference the Department data column will show only data relevant to the Marketing department.
The figure above shows a field requesting a parameter value. Runtime parameters are defined on the Select or Modify Data Sources dialog under the Filter tab. Within the Report Builder, click on the Modify Data Source button to set a default parameter or to remove the runtime parameter.
ExponentHR Business Analytics Training Guide 4 of 56
There are two options for running the report:
• Run and Hide Parameters - Run the report and hide parameter input box.
• Run - Run the report and leave parameter input box visible to provide option to modify parameters again and generate new results.
Run and Run and Hide Parameters affect the parameters for the report. Any additional settings specified in the Report Builder are left intact.
Generated Report Options
If the columns were specified to be sortable through the Report Builder, you may click on the column header in the generated report results to sort the data within that column.
If the report has been set up using the Drill-Down grouping option, the viewer of the generated results will be presented with a link on each row of the report. Clicking on that Details link will expand that section of the report allowing the viewer to see additional information that combine together to make up the information displayed on the summary row with the link.
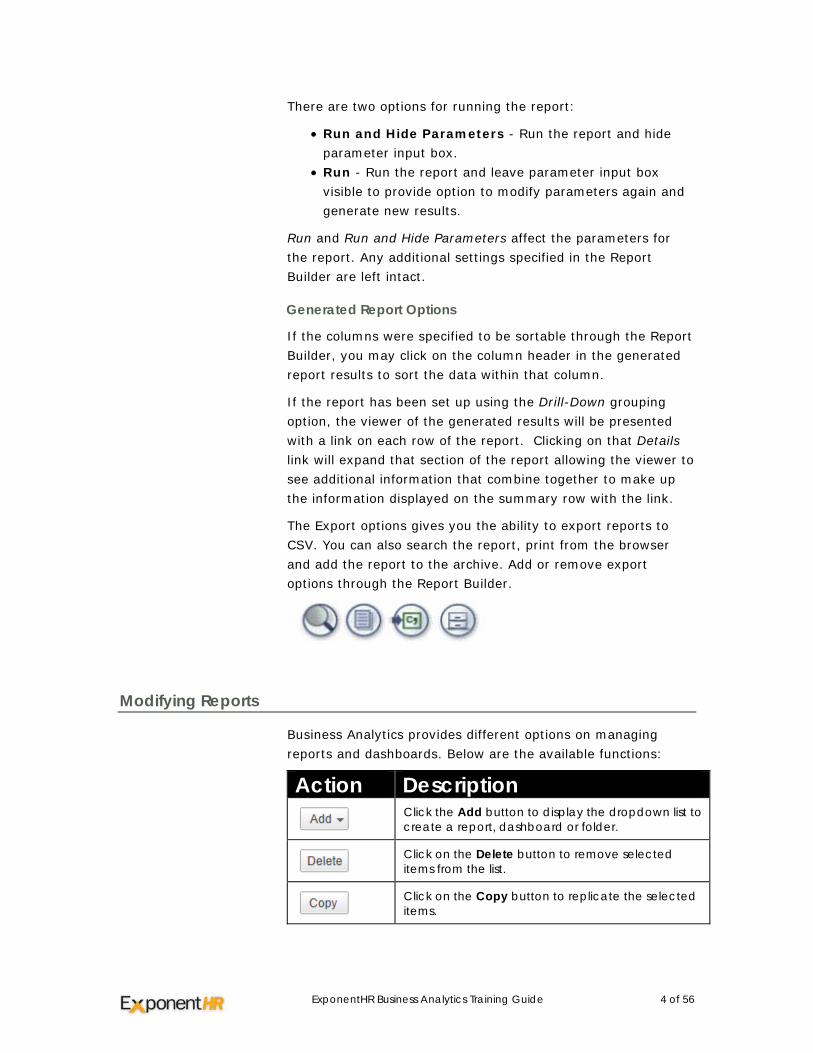
The Export options gives you the ability to export reports to CSV. You can also search the report, print from the browser and add the report to the archive. Add or remove export options through the Report Builder.
Modifying Reports
Business Analytics provides different options on managing reports and dashboards. Below are the available functions:
Action Description
Click the Add button to display the dropdown list to create a report, dashboard or folder.
Click on the Delete button to remove selected items from the list.
Click on the Copy button to replicate the selected items.
ExponentHR Business Analytics Training Guide 5 of 56
Action Description
Click on the Move button to move the selected items to another location.
Click on the Find Reports button to do a contains search of the Name column for the associated text. The Find Reports criteria will be retained for all subsequent visits to the page until it has been cleared out.
Run Reports and Dashboards
Click on the name or the report or dashboard you would like to view to generate the selected item.
View Folders Click on the folder name in the list to open the folder and view the reports is contains.
Edit Folder Click the icon next to an existing folder to modify the name and description of the folder.
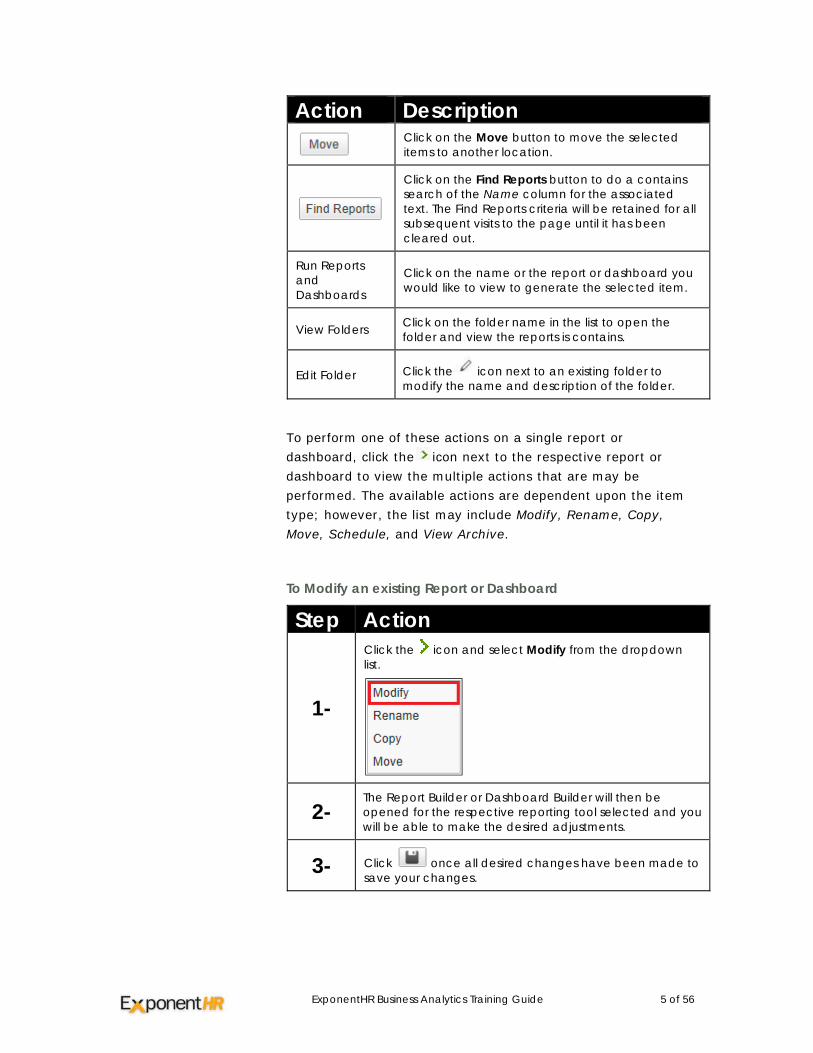
To perform one of these actions on a single report or dashboard, click the icon next to the respective report or dashboard to view the multiple actions that are may be performed. The available actions are dependent upon the item type; however, the list may include Modify, Rename, Copy, Move, Schedule, and View Archive.
To Modify an existing Report or Dashboard
Step Action
1-
Click the icon and select Modify from the dropdown list.
2- The Report Builder or Dashboard Builder will then be opened for the respective reporting tool selected and you will be able to make the desired adjustments.
3- Click once all desired changes have been made to save your changes.
ExponentHR Business Analytics Training Guide 6 of 56
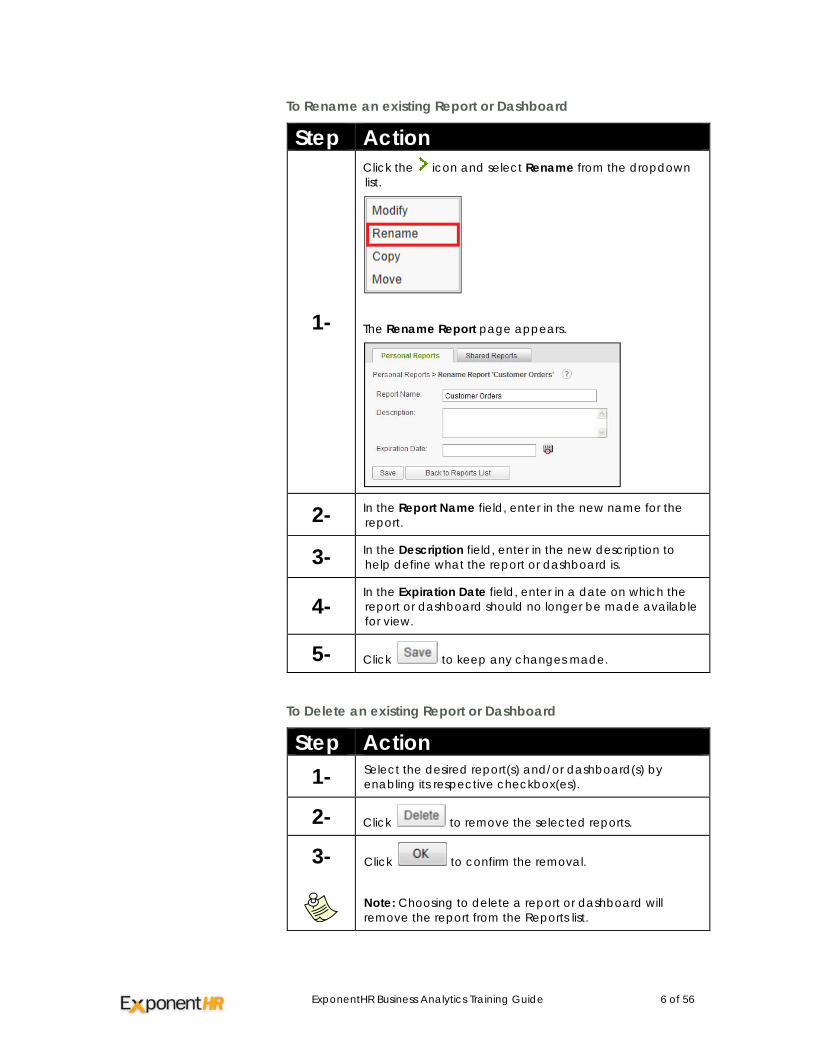
To Rename an existing Report or Dashboard
Step Action
1-
Click the icon and select Rename from the dropdown list.
The Rename Report page appears.
2- In the Report Name field, enter in the new name for the report.
3- In the Description field, enter in the new description to help define what the report or dashboard is.
4- In the Expiration Date field, enter in a date on which the report or dashboard should no longer be made available for view.
5- Click to keep any changes made.
To Delete an existing Report or Dashboard
Step Action 1- Select the desired report(s) and/or dashboard(s) by
enabling its respective checkbox(es).
2- Click to remove the selected reports.
3-
Click to confirm the removal.
Note: Choosing to delete a report or dashboard will remove the report from the Reports list.
ExponentHR Business Analytics Training Guide 7 of 56
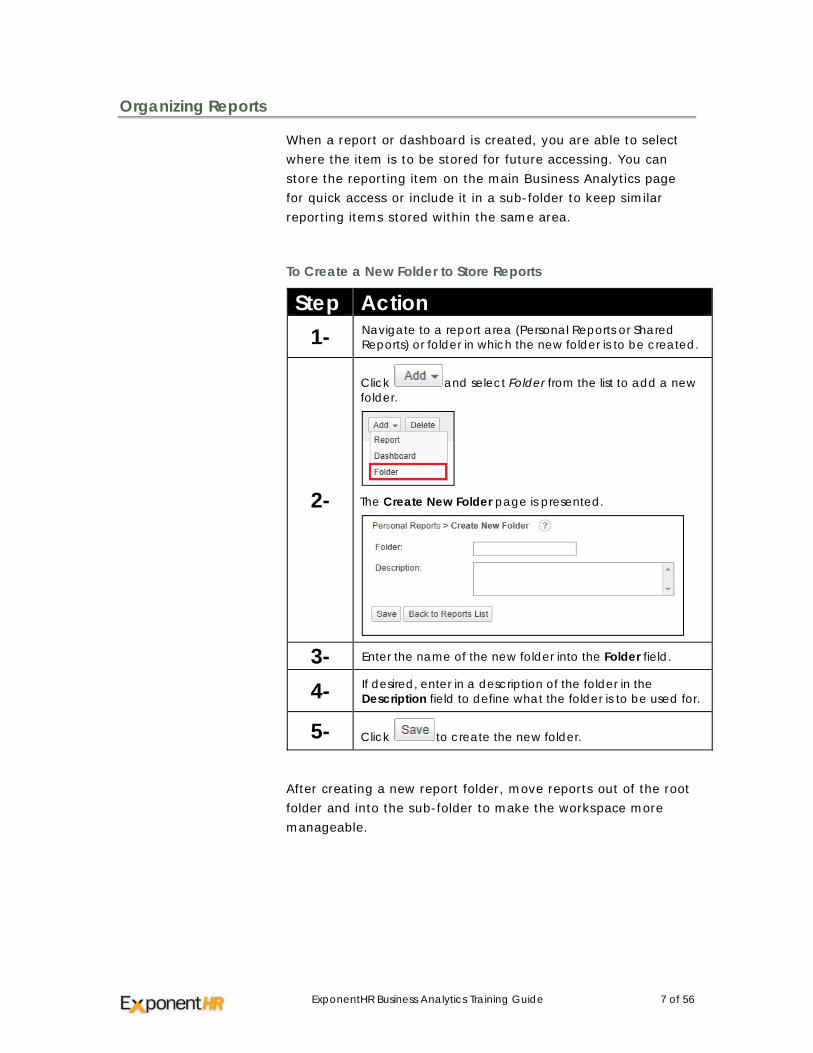
Organizing Reports
When a report or dashboard is created, you are able to select where the item is to be stored for future accessing. You can store the reporting item on the main Business Analytics page for quick access or include it in a sub-folder to keep similar reporting items stored within the same area.
To Create a New Folder to Store Reports
Step Action 1- Navigate to a report area (Personal Reports or Shared
Reports) or folder in which the new folder is to be created.
2-
Click and select Folder from the list to add a new folder.
The Create New Folder page is presented.
3- Enter the name of the new folder into the Folder field.
4- If desired, enter in a description of the folder in the Description field to define what the folder is to be used for.
5- Click to create the new folder.
After creating a new report folder, move reports out of the root folder and into the sub-folder to make the workspace more manageable.
ExponentHR Business Analytics Training Guide 8 of 56
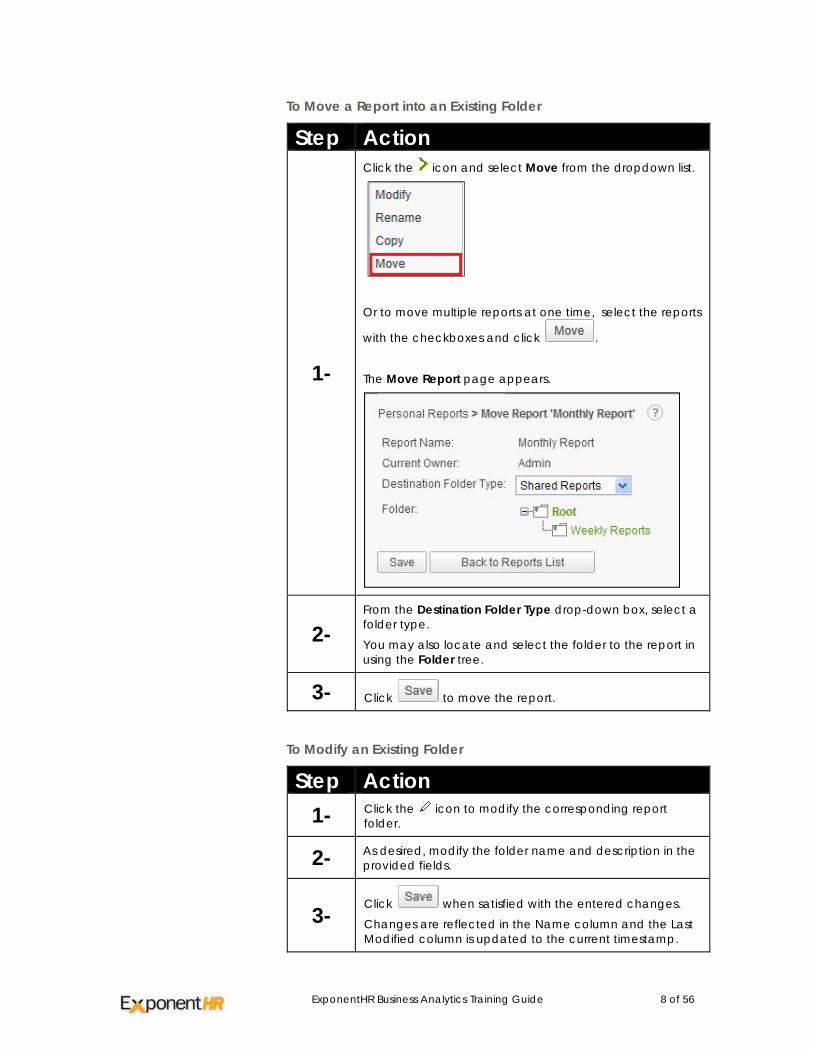
To Move a Report into an Existing Folder
Step Action
1-
Click the icon and select Move from the dropdown list.
Or to move multiple reports at one time, select the reports
with the checkboxes and click .
The Move Report page appears.
2- From the Destination Folder Type drop-down box, select a folder type. You may also locate and select the folder to the report in using the Folder tree.
3- Click to move the report.
To Modify an Existing Folder
Step Action 1- Click the icon to modify the corresponding report
folder.
2- As desired, modify the folder name and description in the provided fields.
3- Click when satisfied with the entered changes. Changes are reflected in the Name column and the Last Modified column is updated to the current timestamp.
ExponentHR Business Analytics Training Guide 9 of 56
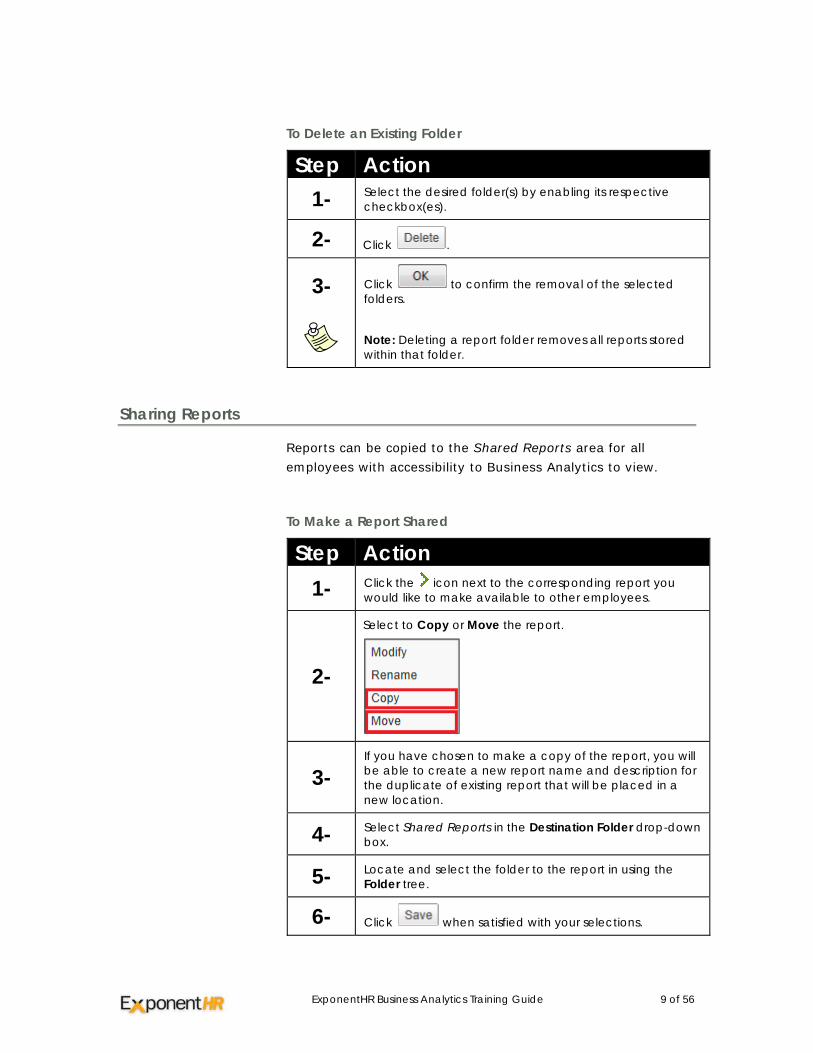
To Delete an Existing Folder
Step Action 1- Select the desired folder(s) by enabling its respective
checkbox(es).
2- Click .
3-
Click to confirm the removal of the selected folders.
Note: Deleting a report folder removes all reports stored within that folder.
Sharing Reports
Reports can be copied to the Shared Reports area for all employees with accessibility to Business Analytics to view.
To Make a Report Shared
Step Action 1- Click the icon next to the corresponding report you
would like to make available to other employees.
2-
Select to Copy or Move the report.
3- If you have chosen to make a copy of the report, you will be able to create a new report name and description for the duplicate of existing report that will be placed in a new location.
4- Select Shared Reports in the Destination Folder drop-down box.
5- Locate and select the folder to the report in using the Folder tree.
6- Click when satisfied with your selections.
ExponentHR Business Analytics Training Guide 10 of 56
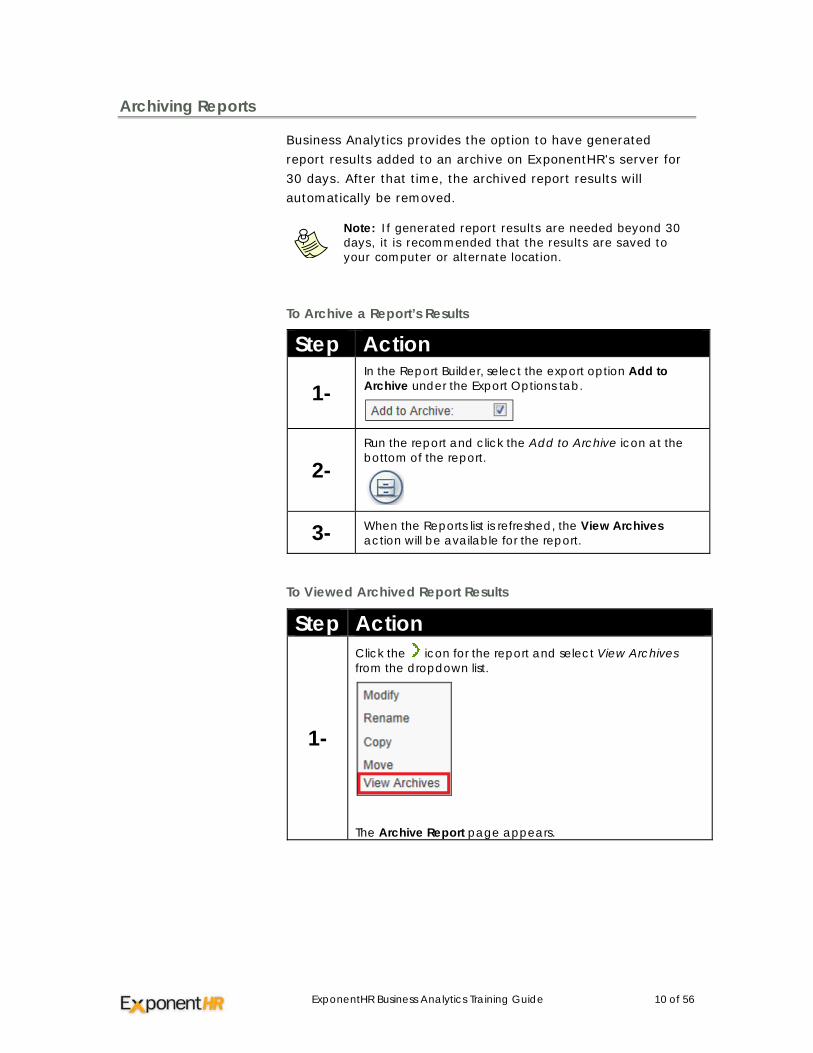
Archiving Reports
Business Analytics provides the option to have generated report results added to an archive on ExponentHR's server for 30 days. After that time, the archived report results will automatically be removed.
Note: If generated report results are needed beyond 30 days, it is recommended that the results are saved to your computer or alternate location.
To Archive a Report’s Results
Step Action
1- In the Report Builder, select the export option Add to Archive under the Export Options tab.
2- Run the report and click the Add to Archive icon at the bottom of the report.
3- When the Reports list is refreshed, the View Archives action will be available for the report.
To Viewed Archived Report Results
Step Action
1-
Click the icon for the report and select View Archives from the dropdown list.
The Archive Report page appears.
ExponentHR Business Analytics Training Guide 11 of 56
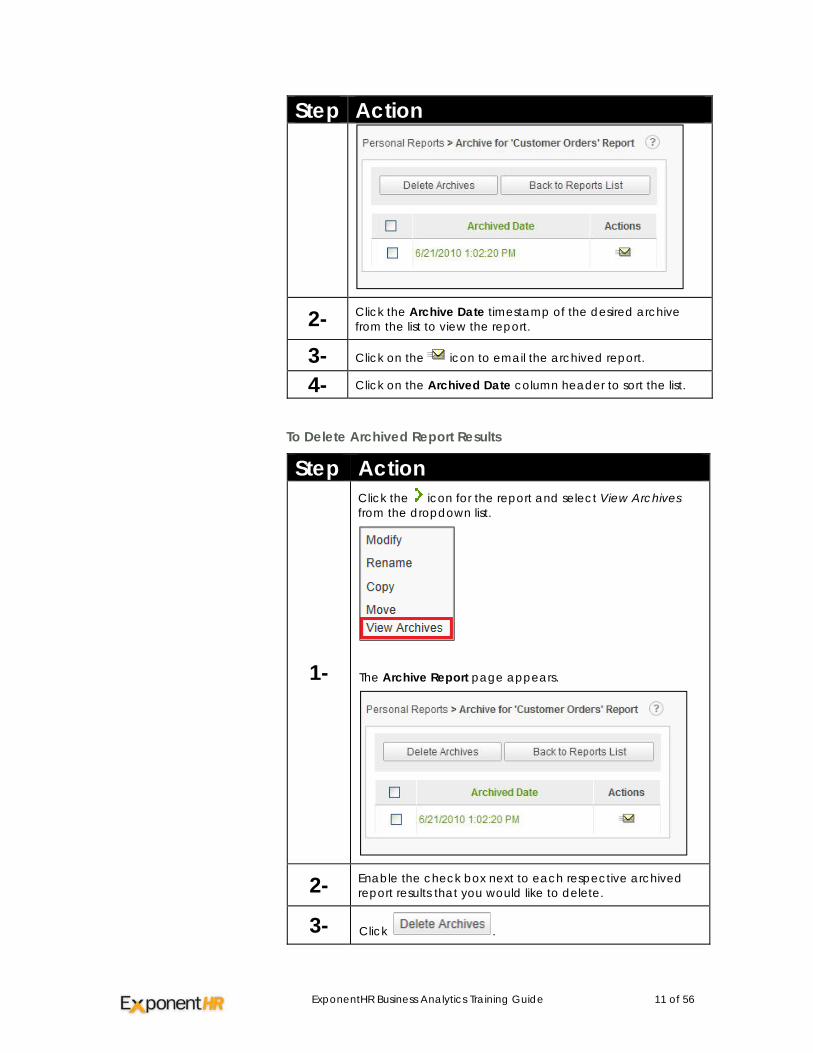
Step Action
2- Click the Archive Date timestamp of the desired archive from the list to view the report.
3- Click on the icon to email the archived report.
4- Click on the Archived Date column header to sort the list.
To Delete Archived Report Results
Step Action
1-
Click the icon for the report and select View Archives from the dropdown list.
The Archive Report page appears.
2- Enable the check box next to each respective archived report results that you would like to delete.
3- Click .
ExponentHR Business Analytics Training Guide 12 of 56
Step Action
4-
Click to confirm the deletion of the selected archived results.
Note: Archived results are automatically deleted after 30 days from when the results were generated and archived.
ExponentHR Business Analytics Training Guide 13 of 56
Building Reports
The Report Builder is a comprehensive and flexible interface that is used to build customized, full-featured reports.
If desired, the reports built through the Report Builder may then be used when creating a Dashboard. However, the report will continue to be modified through the Report Builder, even if it is used in a Dashboard.
The main steps in the building of a report involve:
• Selecting a blank or pre-built report template
• Selecting a source of the data for the report (Date Objects)
• Selecting the display elements (Fields)
• Configuring the display elements
• Reviewing the output
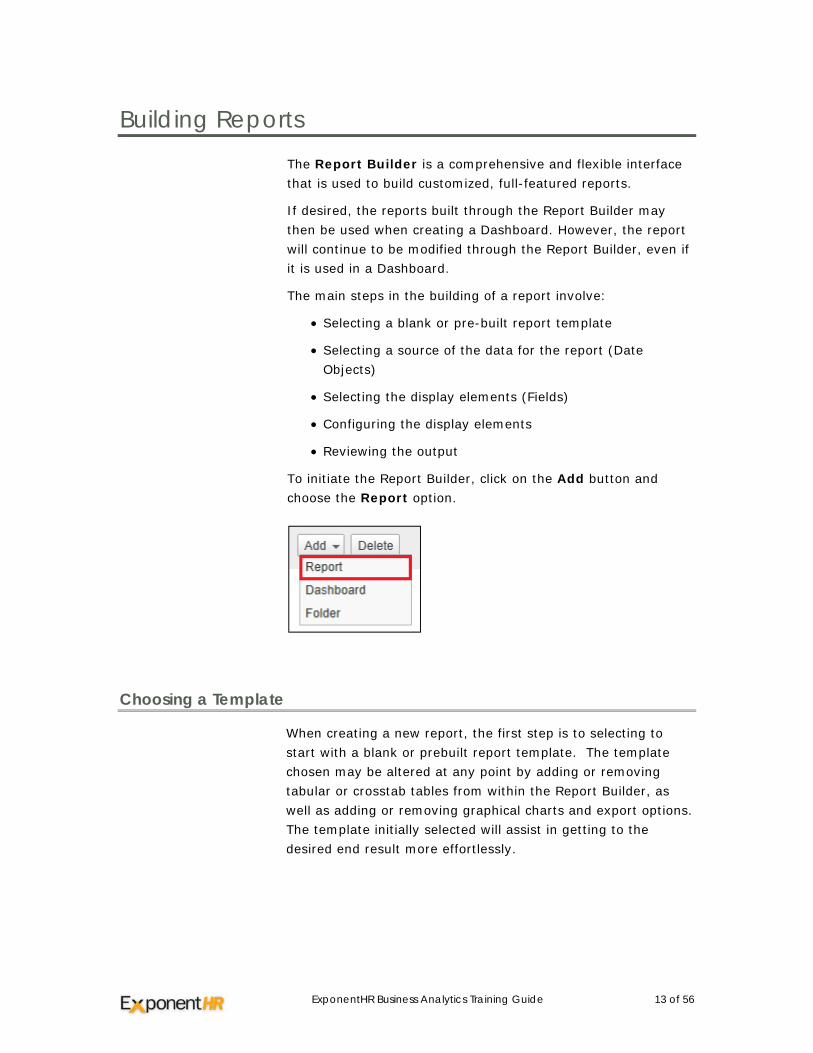
To initiate the Report Builder, click on the Add button and choose the Report option.
Choosing a Template
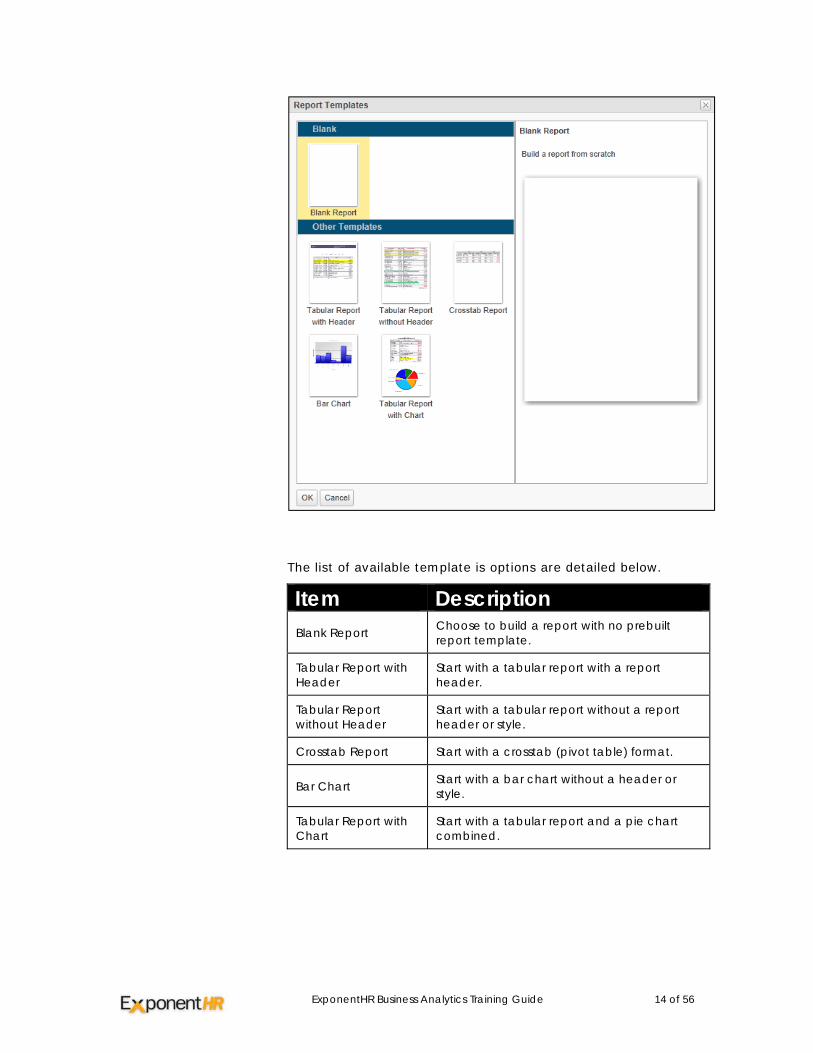
When creating a new report, the first step is to selecting to start with a blank or prebuilt report template. The template chosen may be altered at any point by adding or removing tabular or crosstab tables from within the Report Builder, as well as adding or removing graphical charts and export options. The template initially selected will assist in getting to the desired end result more effortlessly.
ExponentHR Business Analytics Training Guide 14 of 56
The list of available template is options are detailed below.
Item Description Blank Report Choose to build a report with no prebuilt
report template.
Tabular Report with Header
Start with a tabular report with a report header.
Tabular Report without Header
Start with a tabular report without a report header or style.
Crosstab Report Start with a crosstab (pivot table) format.
Bar Chart Start with a bar chart without a header or style.
Tabular Report with Chart
Start with a tabular report and a pie chart combined.
ExponentHR Business Analytics Training Guide 15 of 56
Adding Data Objects
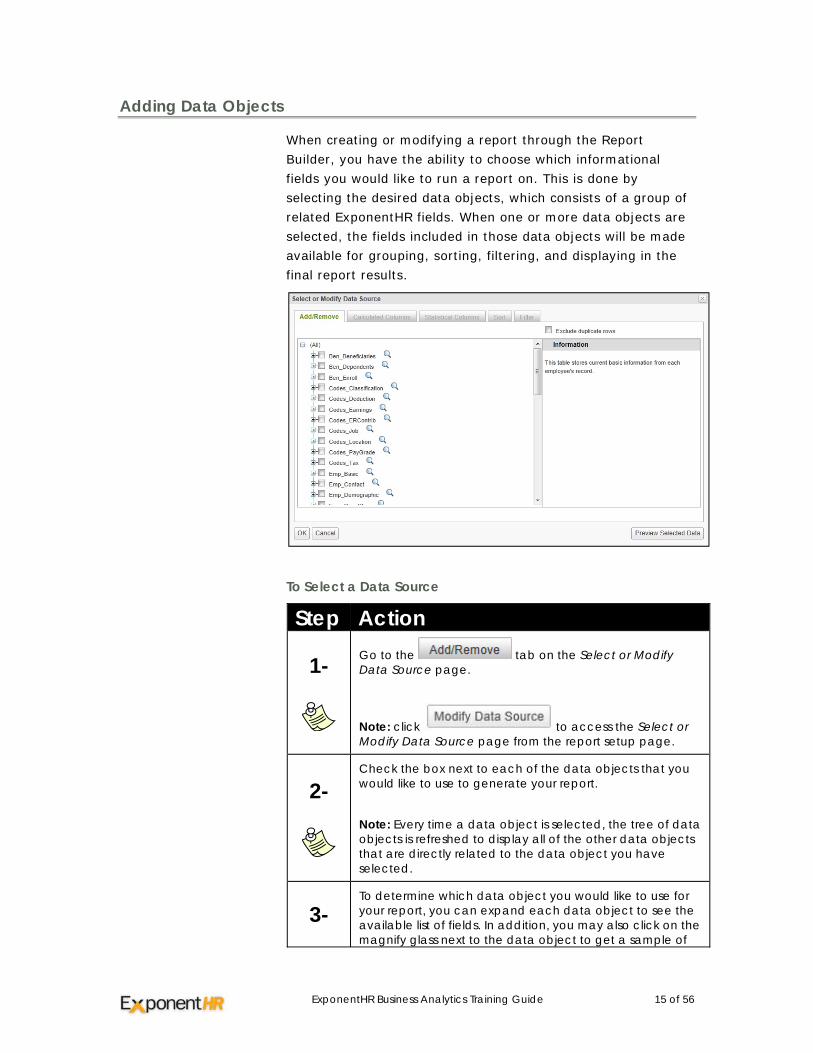
When creating or modifying a report through the Report Builder, you have the ability to choose which informational fields you would like to run a report on. This is done by selecting the desired data objects, which consists of a group of related ExponentHR fields. When one or more data objects are selected, the fields included in those data objects will be made available for grouping, sorting, filtering, and displaying in the final report results.
To Select a Data Source
Step Action
1-
Go to the tab on the Select or Modify Data Source page.
Note: click to access the Select or Modify Data Source page from the report setup page.
2-
Check the box next to each of the data objects that you would like to use to generate your report.
Note: Every time a data object is selected, the tree of data objects is refreshed to display all of the other data objects that are directly related to the data object you have selected.
3- To determine which data object you would like to use for your report, you can expand each data object to see the available list of fields. In addition, you may also click on the magnify glass next to the data object to get a sample of
ExponentHR Business Analytics Training Guide 16 of 56
Step Action data that the selected data object would generate without any applied filters.
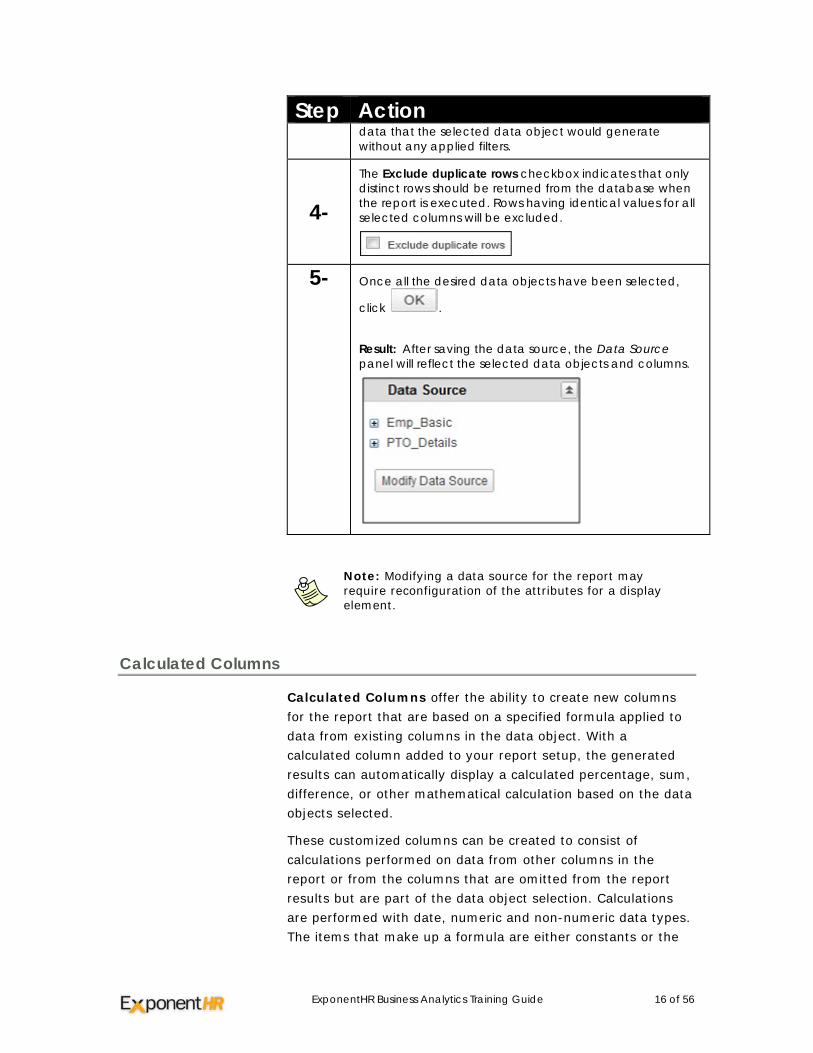
4-
The Exclude duplicate rows checkbox indicates that only distinct rows should be returned from the database when the report is executed. Rows having identical values for all selected columns will be excluded.
5-
Once all the desired data objects have been selected,
click .
Result: After saving the data source, the Data Source panel will reflect the selected data objects and columns.
Note: Modifying a data source for the report may require reconfiguration of the attributes for a display element.
Calculated Columns
Calculated Columns offer the ability to create new columns for the report that are based on a specified formula applied to data from existing columns in the data object. With a calculated column added to your report setup, the generated results can automatically display a calculated percentage, sum, difference, or other mathematical calculation based on the data objects selected.
These customized columns can be created to consist of calculations performed on data from other columns in the report or from the columns that are omitted from the report results but are part of the data object selection. Calculations are performed with date, numeric and non-numeric data types. The items that make up a formula are either constants or the
ExponentHR Business Analytics Training Guide 17 of 56
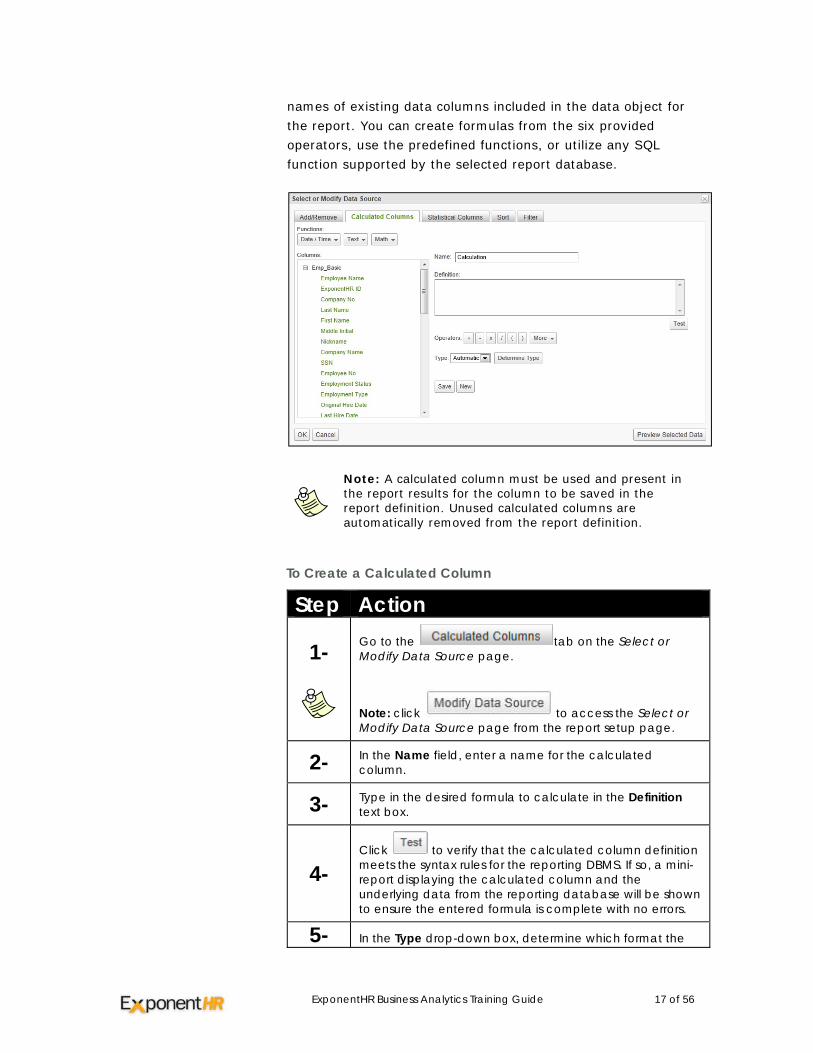
names of existing data columns included in the data object for the report. You can create formulas from the six provided operators, use the predefined functions, or utilize any SQL function supported by the selected report database.
Note: A calculated column must be used and present in the report results for the column to be saved in the report definition. Unused calculated columns are automatically removed from the report definition.
To Create a Calculated Column
Step Action
1-
Go to the tab on the Select or Modify Data Source page.
Note: click to access the Select or Modify Data Source page from the report setup page.
2- In the Name field, enter a name for the calculated column.
3- Type in the desired formula to calculate in the Definition text box.
4- Click to verify that the calculated column definition meets the syntax rules for the reporting DBMS. If so, a mini-report displaying the calculated column and the underlying data from the reporting database will be shown to ensure the entered formula is complete with no errors.
5- In the Type drop-down box, determine which format the
ExponentHR Business Analytics Training Guide 18 of 56
Step Action
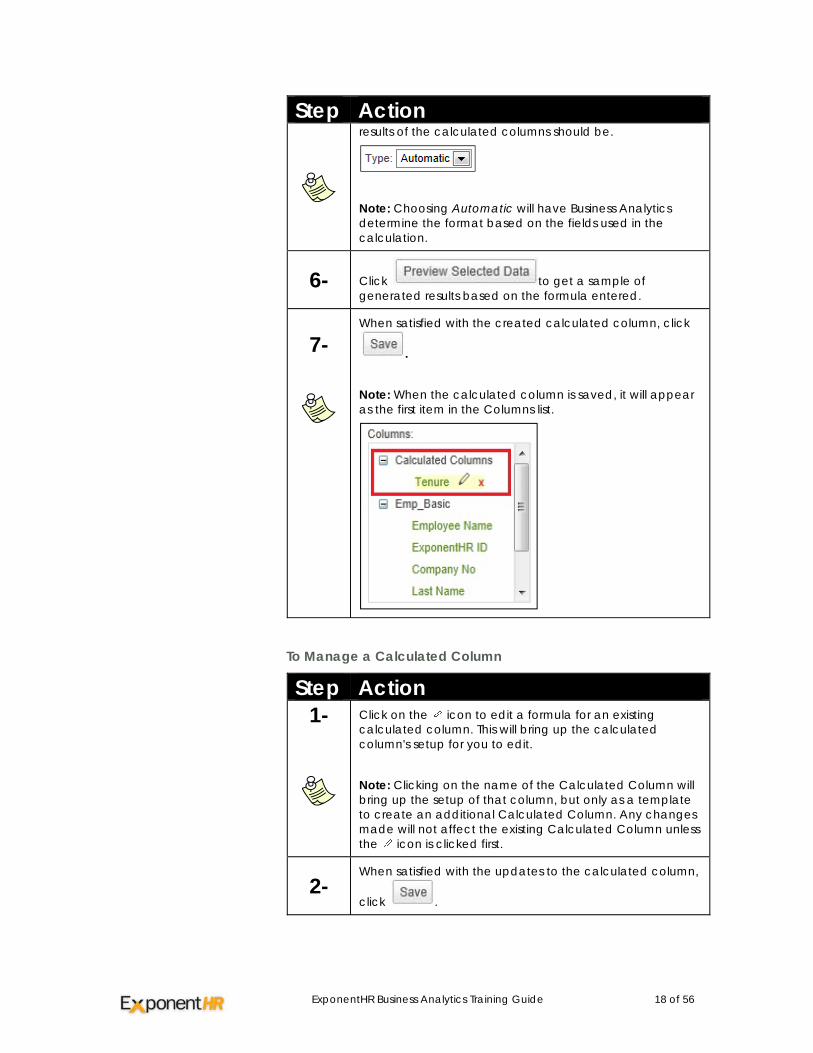
results of the calculated columns should be.
Note: Choosing Automatic will have Business Analytics determine the format based on the fields used in the calculation.
6- Click to get a sample of generated results based on the formula entered.
7-
When satisfied with the created calculated column, click
. Note: When the calculated column is saved, it will appear as the first item in the Columns list.
To Manage a Calculated Column
Step Action 1-
Click on the icon to edit a formula for an existing calculated column. This will bring up the calculated column's setup for you to edit.
Note: Clicking on the name of the Calculated Column will bring up the setup of that column, but only as a template to create an additional Calculated Column. Any changes made will not affect the existing Calculated Column unless the icon is clicked first.
2- When satisfied with the updates to the calculated column,
click .
ExponentHR Business Analytics Training Guide 19 of 56
Step Action 3- Click to create an additional calculated column.
4- To delete an existing column, click the icon next to the appropriate calculated column.
To Create a Calculated Column
The Definition text box is the actual work area where a formula is entered. It may be populated from the functions, columns and operators available or the user can enter the calculated column definition directly by typing in the textbox.
It is not required that any of the helpful controls are used to create the Definition as you can simply type in formula definition in the text box. It is highly recommended, however, that when referencing a field column in your formula that you insert the column name into the Definition by clicking on the column from the data object/column tree. The column reference will be placed at the last cursor position in the Definition textbox.
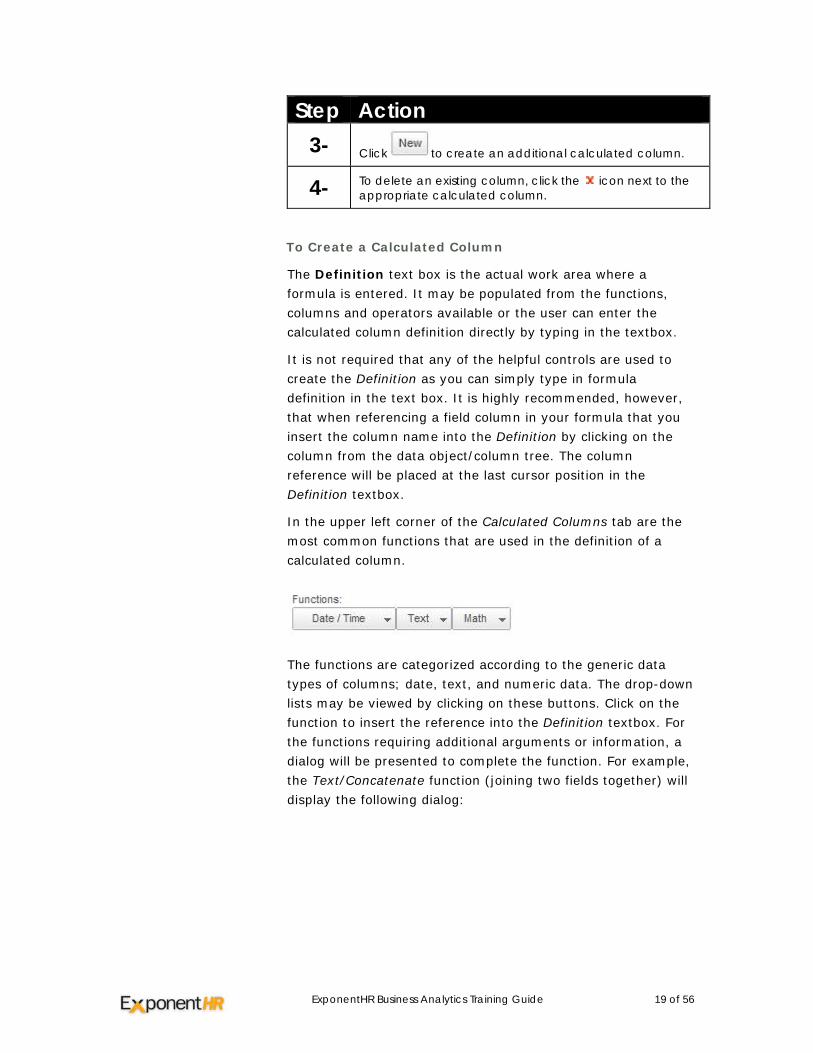
In the upper left corner of the Calculated Columns tab are the most common functions that are used in the definition of a calculated column.
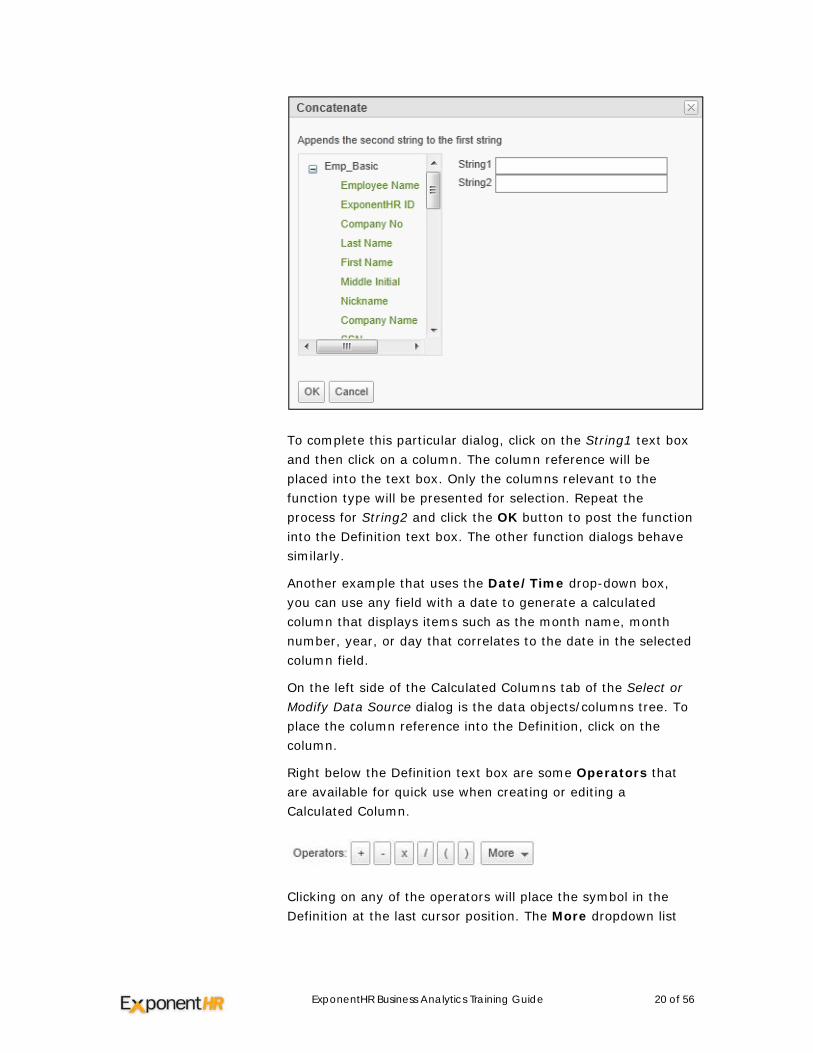
The functions are categorized according to the generic data types of columns; date, text, and numeric data. The drop-down lists may be viewed by clicking on these buttons. Click on the function to insert the reference into the Definition textbox. For the functions requiring additional arguments or information, a dialog will be presented to complete the function. For example, the Text/Concatenate function (joining two fields together) will display the following dialog:
ExponentHR Business Analytics Training Guide 20 of 56
To complete this particular dialog, click on the String1 text box and then click on a column. The column reference will be placed into the text box. Only the columns relevant to the function type will be presented for selection. Repeat the process for String2 and click the OK button to post the function into the Definition text box. The other function dialogs behave similarly.
Another example that uses the Date/Time drop-down box, you can use any field with a date to generate a calculated column that displays items such as the month name, month number, year, or day that correlates to the date in the selected column field.
On the left side of the Calculated Columns tab of the Select or Modify Data Source dialog is the data objects/columns tree. To place the column reference into the Definition, click on the column.
Right below the Definition text box are some Operators that are available for quick use when creating or editing a Calculated Column.
Clicking on any of the operators will place the symbol in the Definition at the last cursor position. The More dropdown list
Stati
stical Colu
conto
umns
Stacolin osup
ExponentHR B
ntains the ANthe Definitio
Scenario:employeesfields in thThis formuhours accrof hours ta
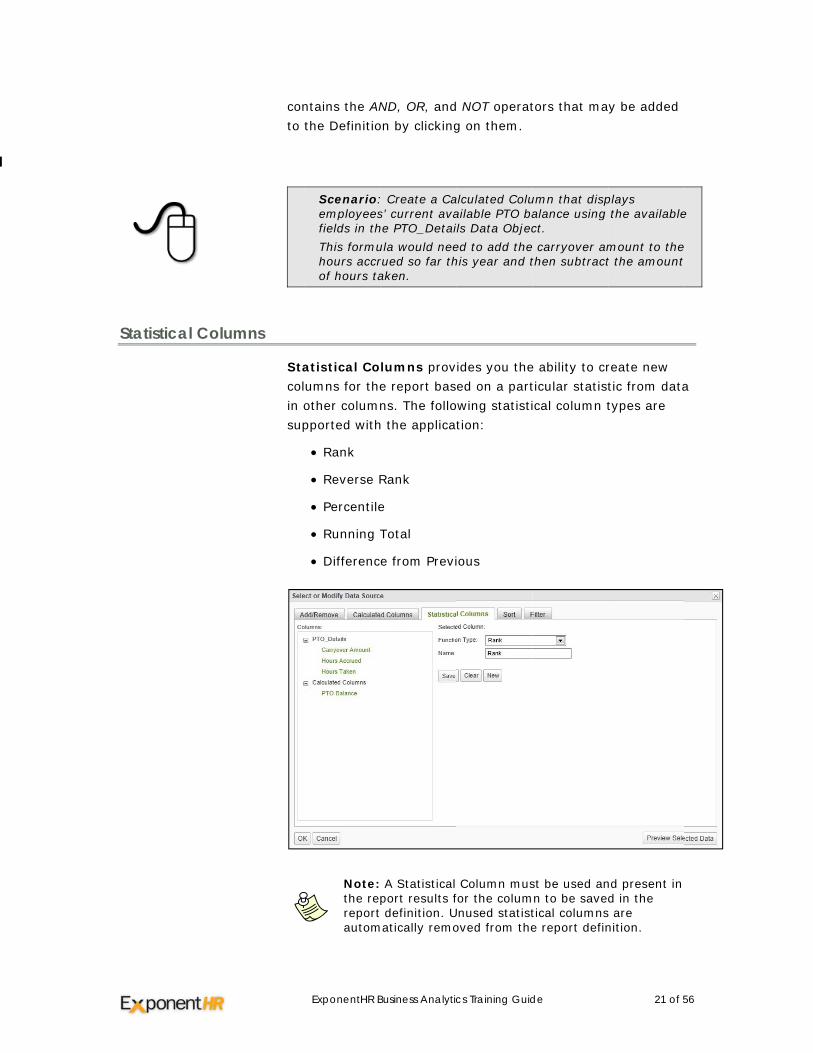
atistical Coumns for theother columpported with
• Rank
• Reverse R
• Percentile
• Running T
• Differenc
Note:the rereportautom
Business Analytic
ND, OR, andon by clicking
: Create a Cas’ current avahe PTO_Detaiula would neerued so far thaken.
lumns prove report basns. The follo
h the applica
Rank
e
Total
e from Previ
A Statistical port results f definition. U
matically remo
cs Training Guid
d NOT operatg on them.
alculated Coluailable PTO bails Data Objeced to add thehis year and t
ides you theed on a part
owing statistition:
ious
Column musfor the columUnused statistoved from the
de
tors that ma
umn that dispalance using ct.
e carryover amthen subtract
e ability to crticular statistical column t
st be used ann to be savedtical columnse report defin
21 of 5
y be added
plays the available
mount to thet the amount
reate new tic from datatypes are
nd present in d in the
s are nition.
56
e
a
ExponentHR Business Analytics Training Guide 22 of 56
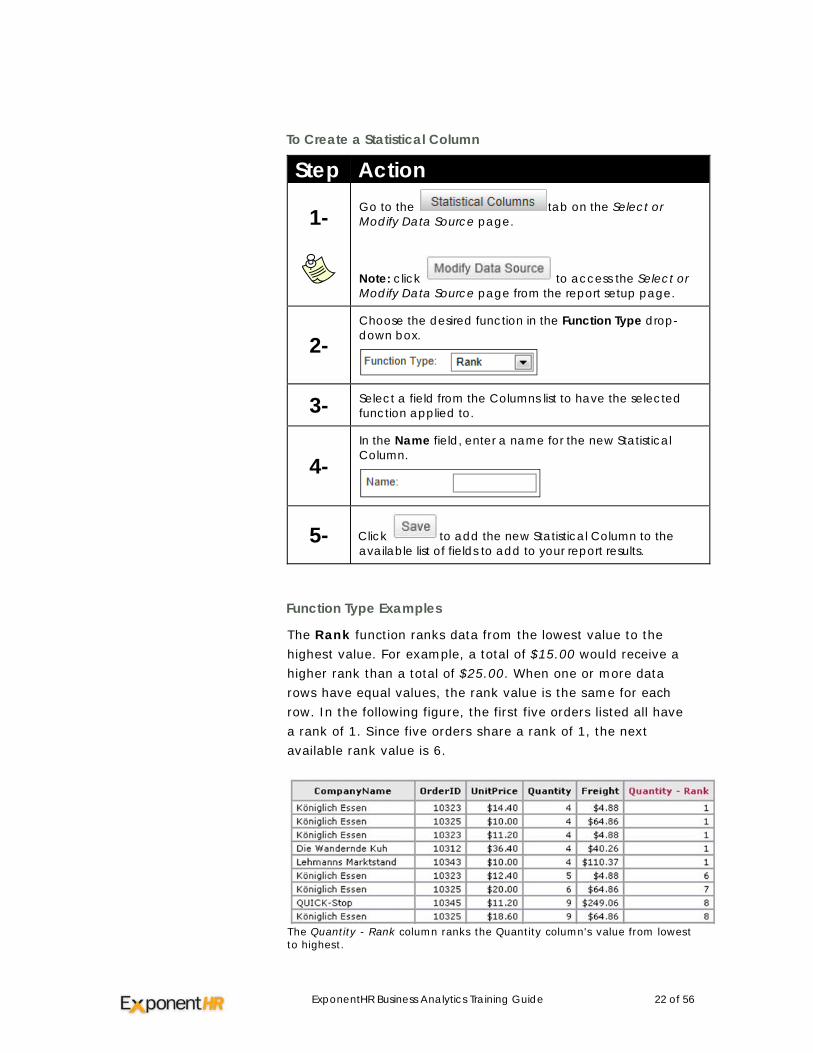
To Create a Statistical Column
Step Action
1-
Go to the tab on the Select or Modify Data Source page.
Note: click to access the Select or Modify Data Source page from the report setup page.
2- Choose the desired function in the Function Type drop-down box.
3- Select a field from the Columns list to have the selected function applied to.
4- In the Name field, enter a name for the new Statistical Column.
5- Click to add the new Statistical Column to the available list of fields to add to your report results.
Function Type Examples
The Rank function ranks data from the lowest value to the highest value. For example, a total of $15.00 would receive a higher rank than a total of $25.00. When one or more data rows have equal values, the rank value is the same for each row. In the following figure, the first five orders listed all have a rank of 1. Since five orders share a rank of 1, the next available rank value is 6.
The Quantity - Rank column ranks the Quantity column's value from lowest to highest.
ExponentHR Business Analytics Training Guide 23 of 56
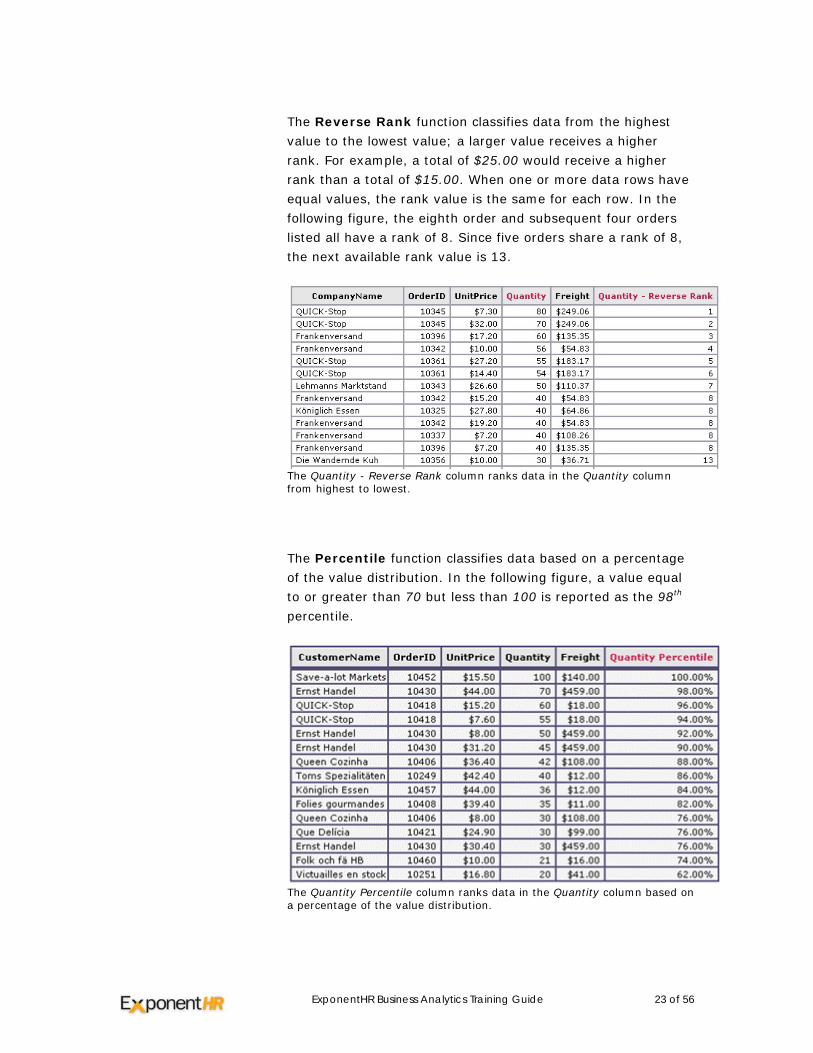
The Reverse Rank function classifies data from the highest value to the lowest value; a larger value receives a higher rank. For example, a total of $25.00 would receive a higher rank than a total of $15.00. When one or more data rows have equal values, the rank value is the same for each row. In the following figure, the eighth order and subsequent four orders listed all have a rank of 8. Since five orders share a rank of 8, the next available rank value is 13.
The Quantity - Reverse Rank column ranks data in the Quantity column from highest to lowest.
The Percentile function classifies data based on a percentage of the value distribution. In the following figure, a value equal to or greater than 70 but less than 100 is reported as the 98th percentile.
The Quantity Percentile column ranks data in the Quantity column based on a percentage of the value distribution.
ExponentHR Business Analytics Training Guide 24 of 56
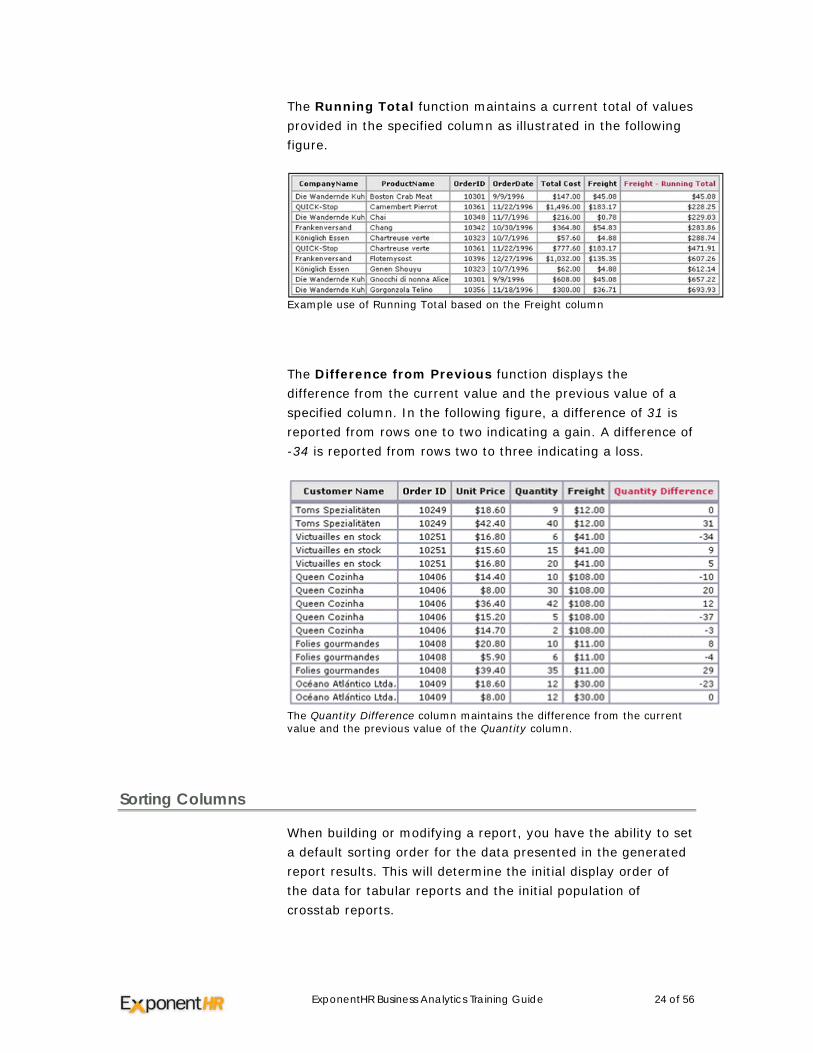
The Running Total function maintains a current total of values provided in the specified column as illustrated in the following figure.
Example use of Running Total based on the Freight column
The Difference from Previous function displays the difference from the current value and the previous value of a specified column. In the following figure, a difference of 31 is reported from rows one to two indicating a gain. A difference of -34 is reported from rows two to three indicating a loss.
The Quantity Difference column maintains the difference from the current value and the previous value of the Quantity column.
Sorting Columns
When building or modifying a report, you have the ability to set a default sorting order for the data presented in the generated report results. This will determine the initial display order of the data for tabular reports and the initial population of crosstab reports.
ExponentHR Business Analytics Training Guide 25 of 56
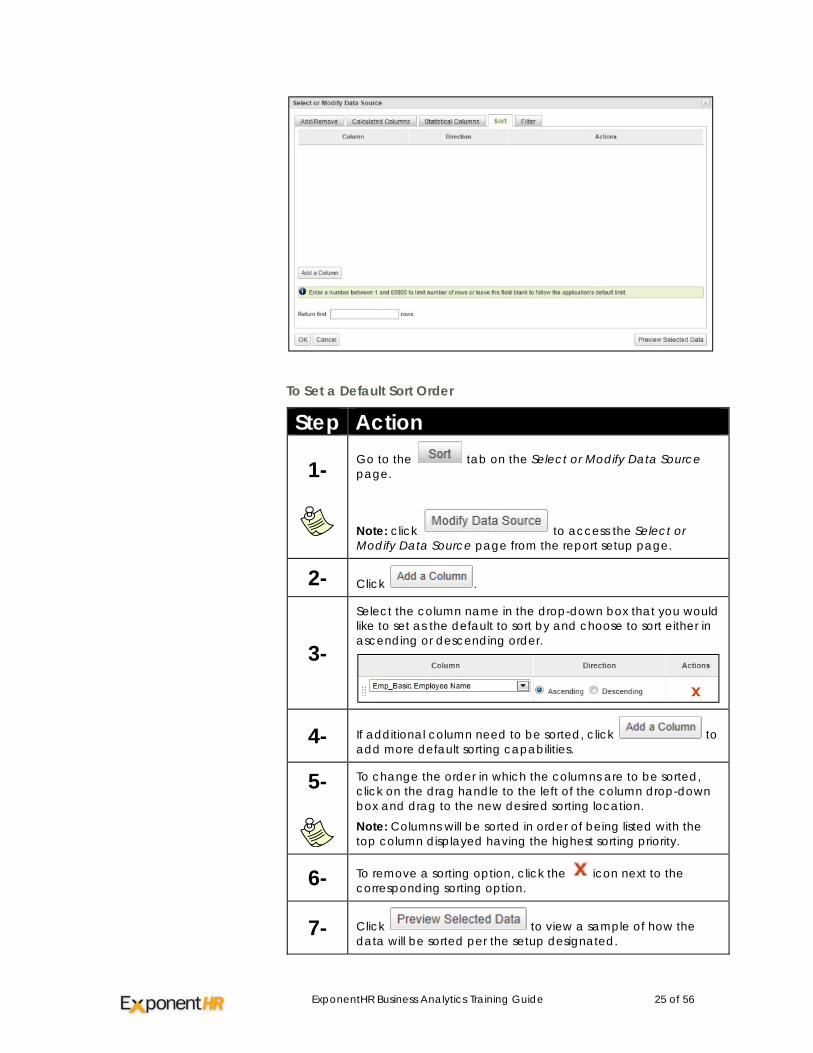
To Set a Default Sort Order
Step Action
1-
Go to the tab on the Select or Modify Data Source page.
Note: click to access the Select or Modify Data Source page from the report setup page.
2- Click .
3-
Select the column name in the drop-down box that you would like to set as the default to sort by and choose to sort either in ascending or descending order.
4- If additional column need to be sorted, click to add more default sorting capabilities.
5-
To change the order in which the columns are to be sorted, click on the drag handle to the left of the column drop-down box and drag to the new desired sorting location. Note: Columns will be sorted in order of being listed with the top column displayed having the highest sorting priority.
6- To remove a sorting option, click the icon next to the corresponding sorting option.
7- Click to view a sample of how the data will be sorted per the setup designated.
ExponentHR Business Analytics Training Guide 26 of 56
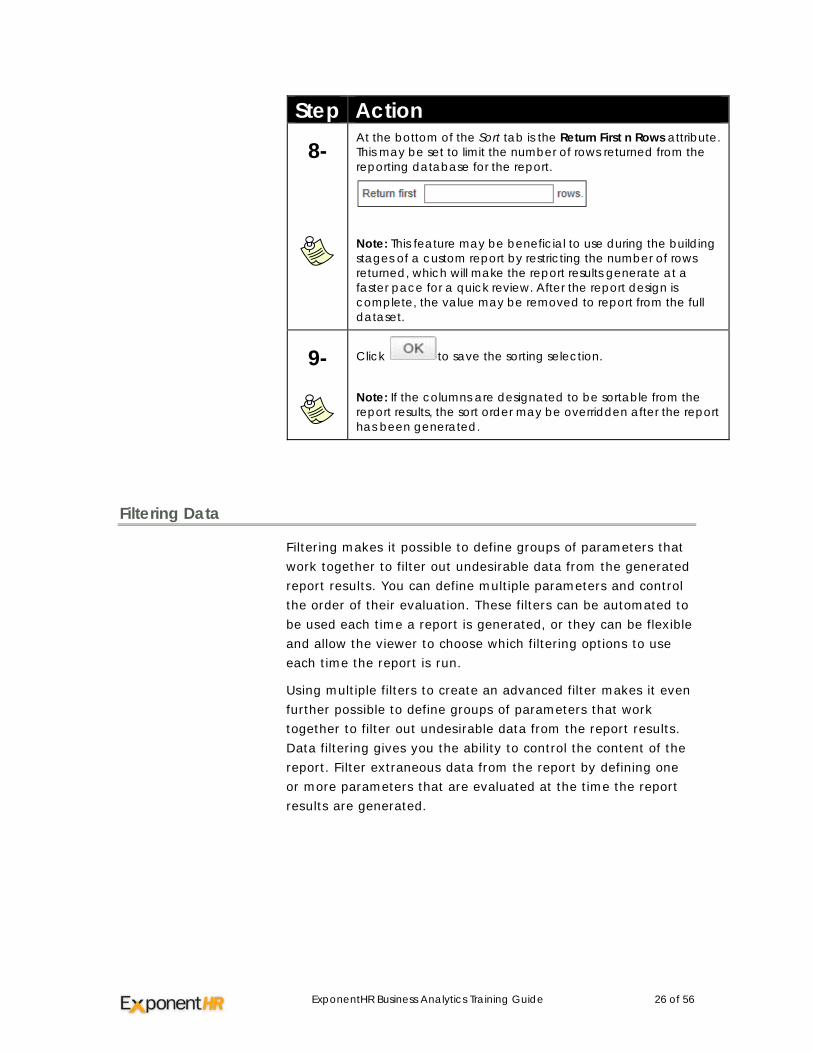
Step Action
8-
At the bottom of the Sort tab is the Return First n Rows attribute. This may be set to limit the number of rows returned from the reporting database for the report.
Note: This feature may be beneficial to use during the building stages of a custom report by restricting the number of rows returned, which will make the report results generate at a faster pace for a quick review. After the report design is complete, the value may be removed to report from the full dataset.
9-
Click to save the sorting selection. Note: If the columns are designated to be sortable from the report results, the sort order may be overridden after the report has been generated.
Filtering Data
Filtering makes it possible to define groups of parameters that work together to filter out undesirable data from the generated report results. You can define multiple parameters and control the order of their evaluation. These filters can be automated to be used each time a report is generated, or they can be flexible and allow the viewer to choose which filtering options to use each time the report is run.
Using multiple filters to create an advanced filter makes it even further possible to define groups of parameters that work together to filter out undesirable data from the report results. Data filtering gives you the ability to control the content of the report. Filter extraneous data from the report by defining one or more parameters that are evaluated at the time the report results are generated.
ExponentHR Business Analytics Training Guide 27 of 56
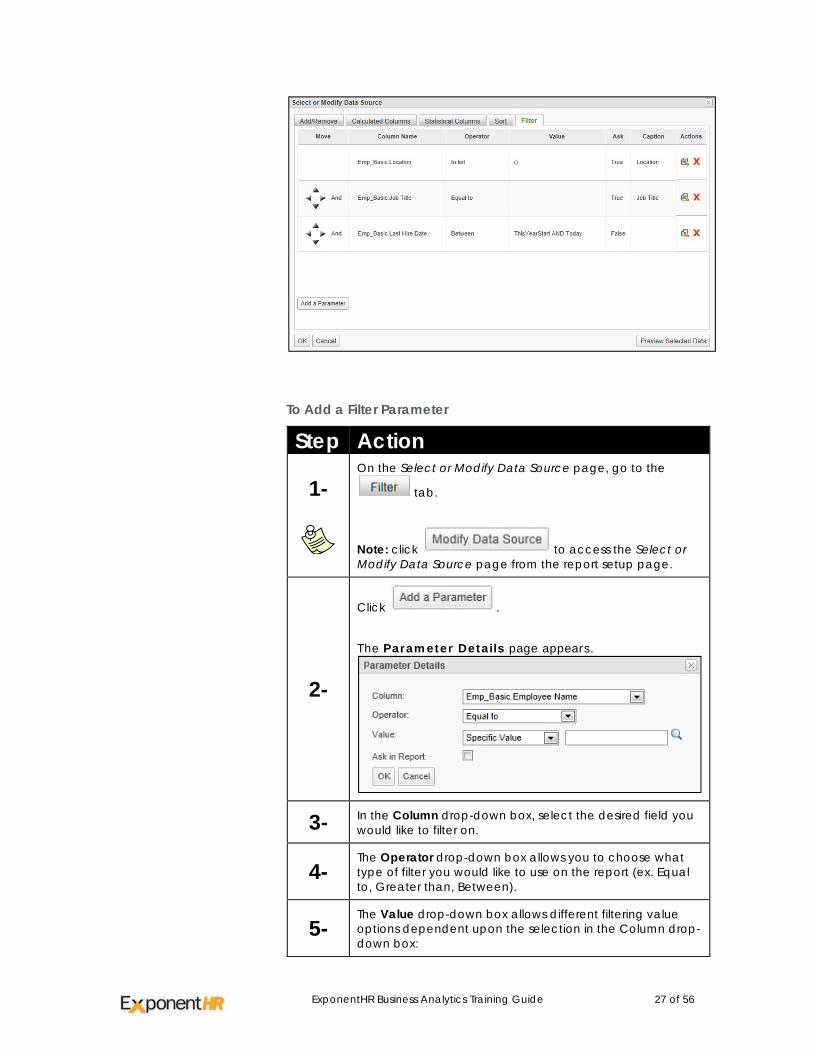
To Add a Filter Parameter
Step Action
1-
On the Select or Modify Data Source page, go to the
tab.
Note: click to access the Select or Modify Data Source page from the report setup page.
2-
Click .
The Parameter Details page appears.
3- In the Column drop-down box, select the desired field you would like to filter on.
4- The Operator drop-down box allows you to choose what type of filter you would like to use on the report (ex. Equal to, Greater than, Between).
5- The Value drop-down box allows different filtering value options dependent upon the selection in the Column drop-down box:
ExponentHR Business Analytics Training Guide 28 of 56
Step Action • Specific Value - Type in the exact value you would
like the filter to search for. You may also click on the magnify glass to locate an exact value that is in your data set.
• Pre-defined Date - When filtering on a date, you can choose a dynamic date that updates based on the date the report is being run (ex. Today, 90 Days Ago, This Quarter Start).
• Other Date Column - You can select to have the filter based on the value of another column/field value.
6-
Chose the appropriate designation in the Ask in Report check box.
• Activating this option will allow the user to decide which filters to use each time the report is generated
• Not activating this option will mandate the results of the report to always use the filter parameters being set
7- Click .
If the report contains two or more parameters, the icon appears for each additional parameter. The directional pad gives you the ability to create levels for each parameter. Control the order of evaluation for multiple parameters using the directional pad.
The individual arrows of the control perform the following functions:
Shifts a parameter one position higher in the list (retains indentation)
Shifts a parameter one position lower in the list (retains indentation)
Indents a parameter one position left
Indents a parameter one position right
Note: As parameters are indented to the right, enclosing parentheses appear to indicate the order of evaluation.
Column Configuration
In addition to selecting which columns to appear in the generated report results, a column's order of appearance,
ExponentHR Business Analytics Training Guide 29 of 56
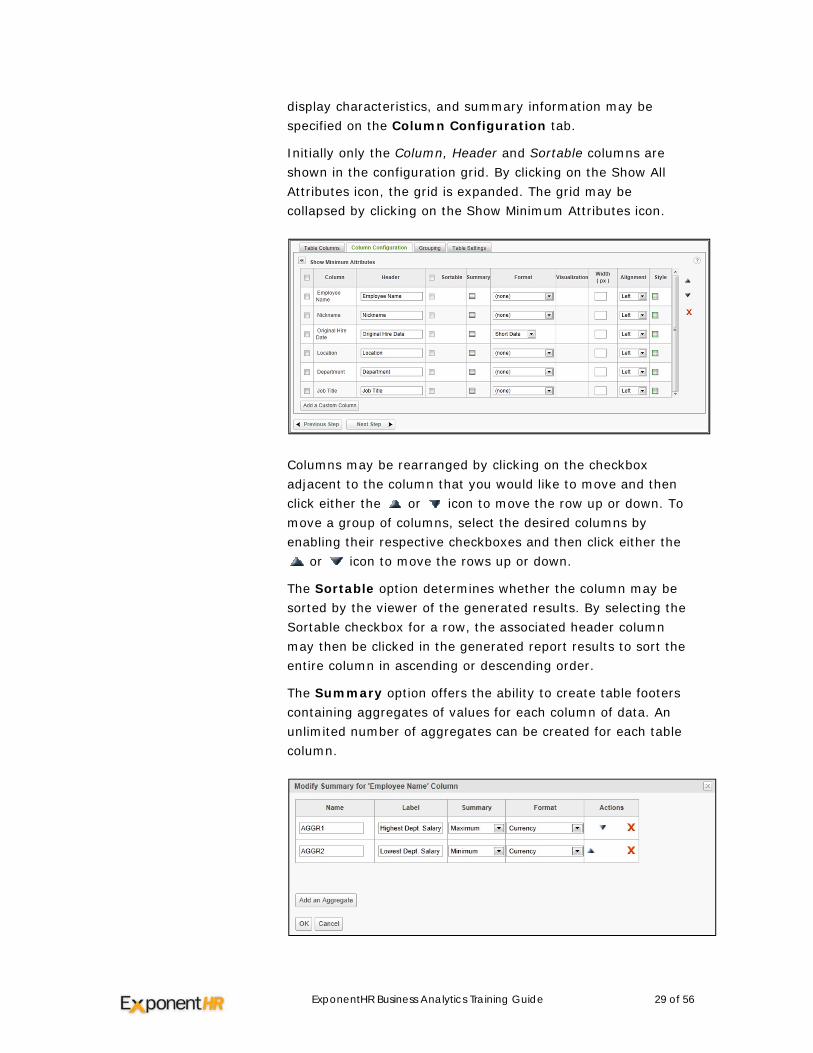
display characteristics, and summary information may be specified on the Column Configuration tab.
Initially only the Column, Header and Sortable columns are shown in the configuration grid. By clicking on the Show All Attributes icon, the grid is expanded. The grid may be collapsed by clicking on the Show Minimum Attributes icon.
Columns may be rearranged by clicking on the checkbox adjacent to the column that you would like to move and then click either the or icon to move the row up or down. To move a group of columns, select the desired columns by enabling their respective checkboxes and then click either the
or icon to move the rows up or down.
The Sortable option determines whether the column may be sorted by the viewer of the generated results. By selecting the Sortable checkbox for a row, the associated header column may then be clicked in the generated report results to sort the entire column in ascending or descending order.
The Summary option offers the ability to create table footers containing aggregates of values for each column of data. An unlimited number of aggregates can be created for each table column.
ExponentHR Business Analytics Training Guide 30 of 56
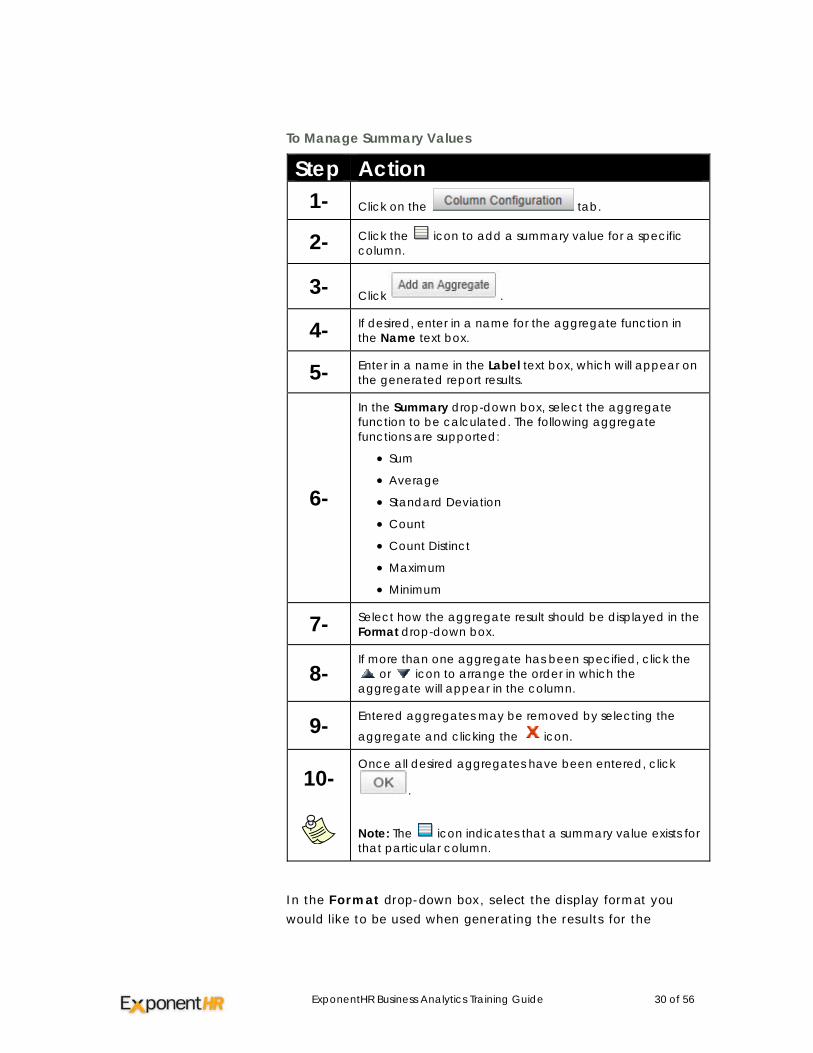
To Manage Summary Values
Step Action 1- Click on the tab.
2- Click the icon to add a summary value for a specific column.
3- Click .
4- If desired, enter in a name for the aggregate function in the Name text box.
5- Enter in a name in the Label text box, which will appear on the generated report results.
6-
In the Summary drop-down box, select the aggregate function to be calculated. The following aggregate functions are supported:
• Sum
• Average
• Standard Deviation
• Count
• Count Distinct
• Maximum
• Minimum
7- Select how the aggregate result should be displayed in the Format drop-down box.
8- If more than one aggregate has been specified, click the
or icon to arrange the order in which the aggregate will appear in the column.
9- Entered aggregates may be removed by selecting the
aggregate and clicking the icon.
10-
Once all desired aggregates have been entered, click
.
Note: The icon indicates that a summary value exists for that particular column.
In the Format drop-down box, select the display format you would like to be used when generating the results for the
ExponentHR Business Analytics Training Guide 31 of 56
column. The available formats include options such as Currency, Percent, and General Date.
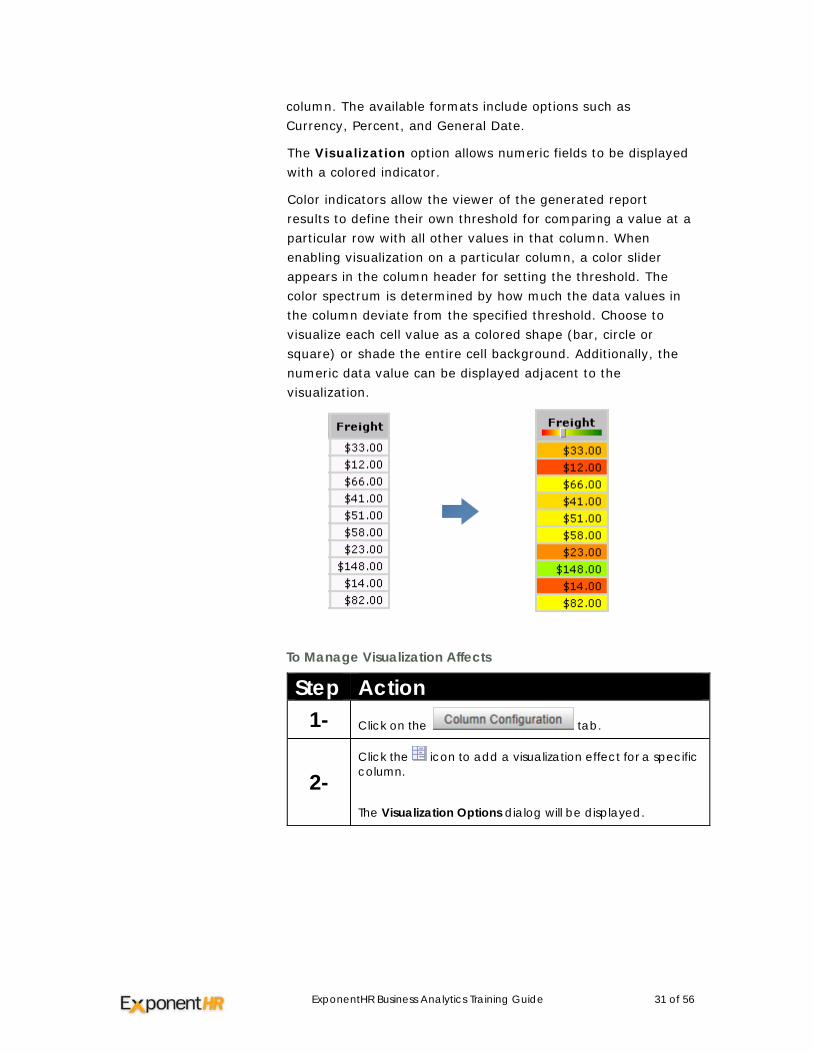
The Visualization option allows numeric fields to be displayed with a colored indicator.
Color indicators allow the viewer of the generated report results to define their own threshold for comparing a value at a particular row with all other values in that column. When enabling visualization on a particular column, a color slider appears in the column header for setting the threshold. The color spectrum is determined by how much the data values in the column deviate from the specified threshold. Choose to visualize each cell value as a colored shape (bar, circle or square) or shade the entire cell background. Additionally, the numeric data value can be displayed adjacent to the visualization.
To Manage Visualization Affects
Step Action 1- Click on the tab.
2- Click the icon to add a visualization effect for a specific column.
The Visualization Options dialog will be displayed.
ExponentHR Business Analytics Training Guide 32 of 56
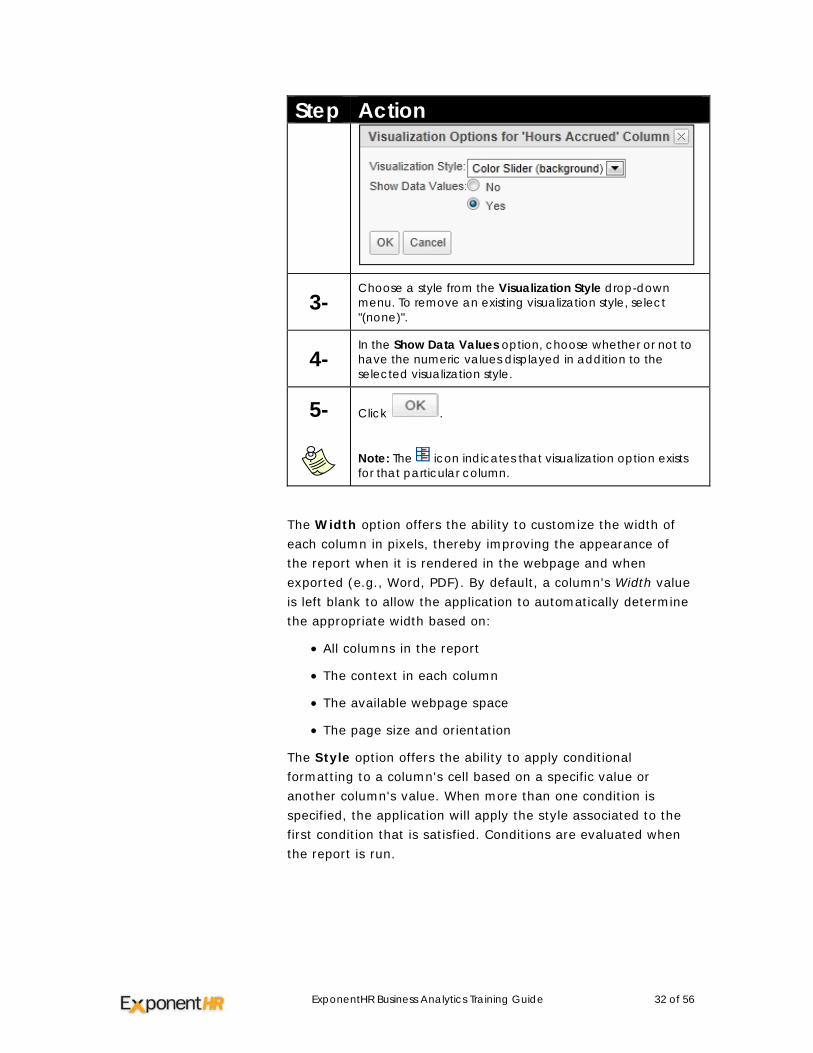
Step Action
3- Choose a style from the Visualization Style drop-down menu. To remove an existing visualization style, select "(none)".
4- In the Show Data Values option, choose whether or not to have the numeric values displayed in addition to the selected visualization style.
5-
Click .
Note: The icon indicates that visualization option exists for that particular column.
The Width option offers the ability to customize the width of each column in pixels, thereby improving the appearance of the report when it is rendered in the webpage and when exported (e.g., Word, PDF). By default, a column's Width value is left blank to allow the application to automatically determine the appropriate width based on:
• All columns in the report
• The context in each column
• The available webpage space
• The page size and orientation
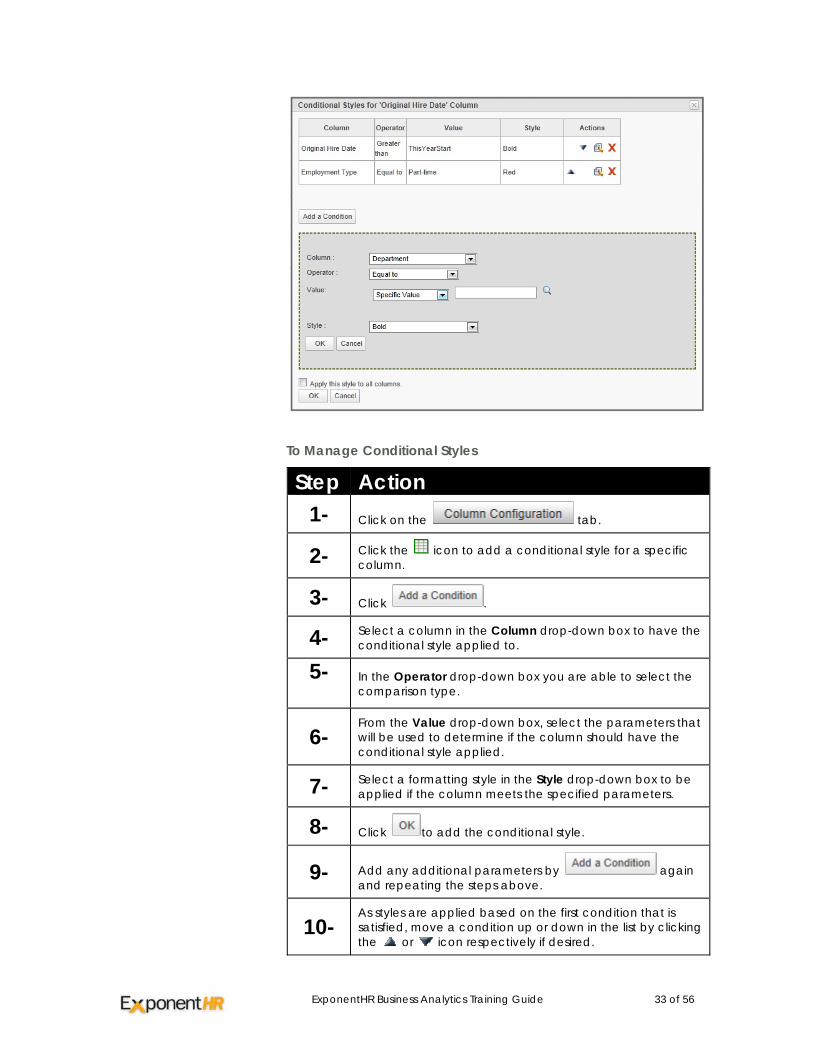
The Style option offers the ability to apply conditional formatting to a column's cell based on a specific value or another column's value. When more than one condition is specified, the application will apply the style associated to the first condition that is satisfied. Conditions are evaluated when the report is run.
ExponentHR Business Analytics Training Guide 33 of 56
To Manage Conditional Styles
Step Action 1- Click on the tab.
2- Click the icon to add a conditional style for a specific column.
3- Click .
4- Select a column in the Column drop-down box to have the conditional style applied to.
5-
In the Operator drop-down box you are able to select the comparison type.
6- From the Value drop-down box, select the parameters that will be used to determine if the column should have the conditional style applied.
7- Select a formatting style in the Style drop-down box to be applied if the column meets the specified parameters.
8- Click to add the conditional style.
9- Add any additional parameters by again and repeating the steps above.
10- As styles are applied based on the first condition that is satisfied, move a condition up or down in the list by clicking the or icon respectively if desired.
ExponentHR Business Analytics Training Guide 34 of 56
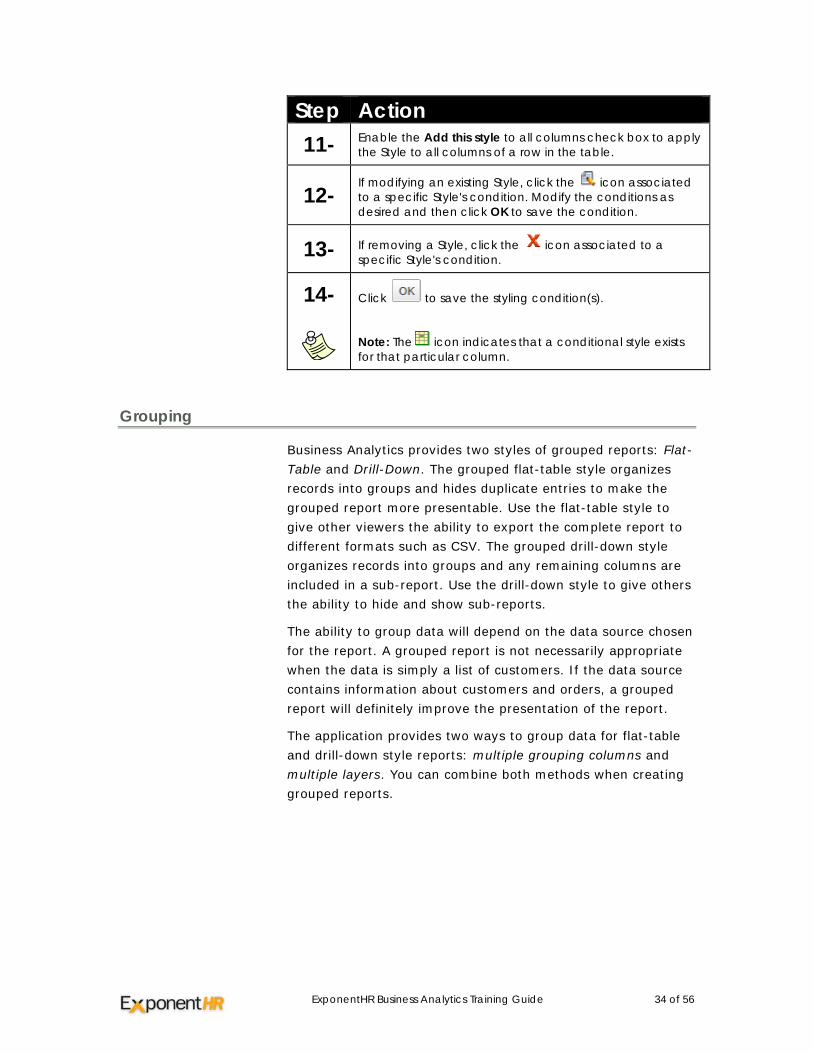
Step Action 11- Enable the Add this style to all columns check box to apply
the Style to all columns of a row in the table.
12- If modifying an existing Style, click the icon associated to a specific Style's condition. Modify the conditions as desired and then click OK to save the condition.
13- If removing a Style, click the icon associated to a specific Style's condition.
14-
Click to save the styling condition(s).
Note: The icon indicates that a conditional style exists for that particular column.
Grouping
Business Analytics provides two styles of grouped reports: Flat-Table and Drill-Down. The grouped flat-table style organizes records into groups and hides duplicate entries to make the grouped report more presentable. Use the flat-table style to give other viewers the ability to export the complete report to different formats such as CSV. The grouped drill-down style organizes records into groups and any remaining columns are included in a sub-report. Use the drill-down style to give others the ability to hide and show sub-reports.
The ability to group data will depend on the data source chosen for the report. A grouped report is not necessarily appropriate when the data is simply a list of customers. If the data source contains information about customers and orders, a grouped report will definitely improve the presentation of the report.
The application provides two ways to group data for flat-table and drill-down style reports: multiple grouping columns and multiple layers. You can combine both methods when creating grouped reports.
ExponentHR Business Analytics Training Guide 35 of 56
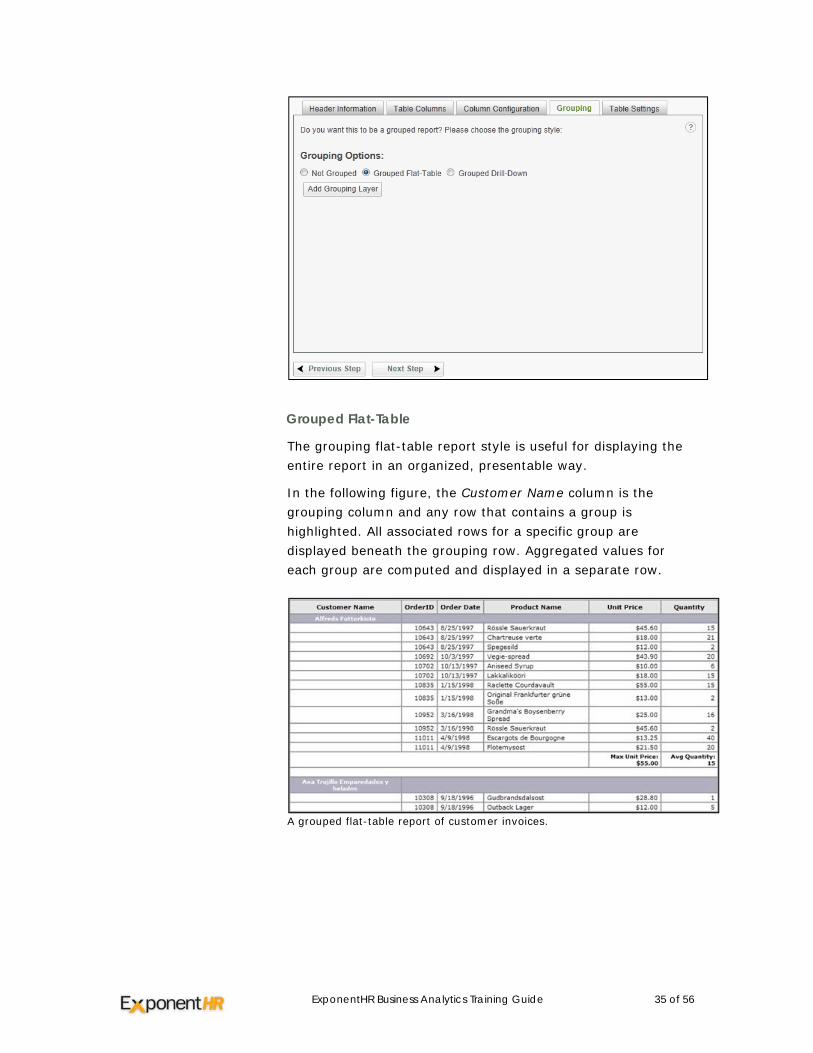
Grouped Flat-Table
The grouping flat-table report style is useful for displaying the entire report in an organized, presentable way.
In the following figure, the Customer Name column is the grouping column and any row that contains a group is highlighted. All associated rows for a specific group are displayed beneath the grouping row. Aggregated values for each group are computed and displayed in a separate row.
A grouped flat-table report of customer invoices.
ExponentHR Business Analytics Training Guide 36 of 56
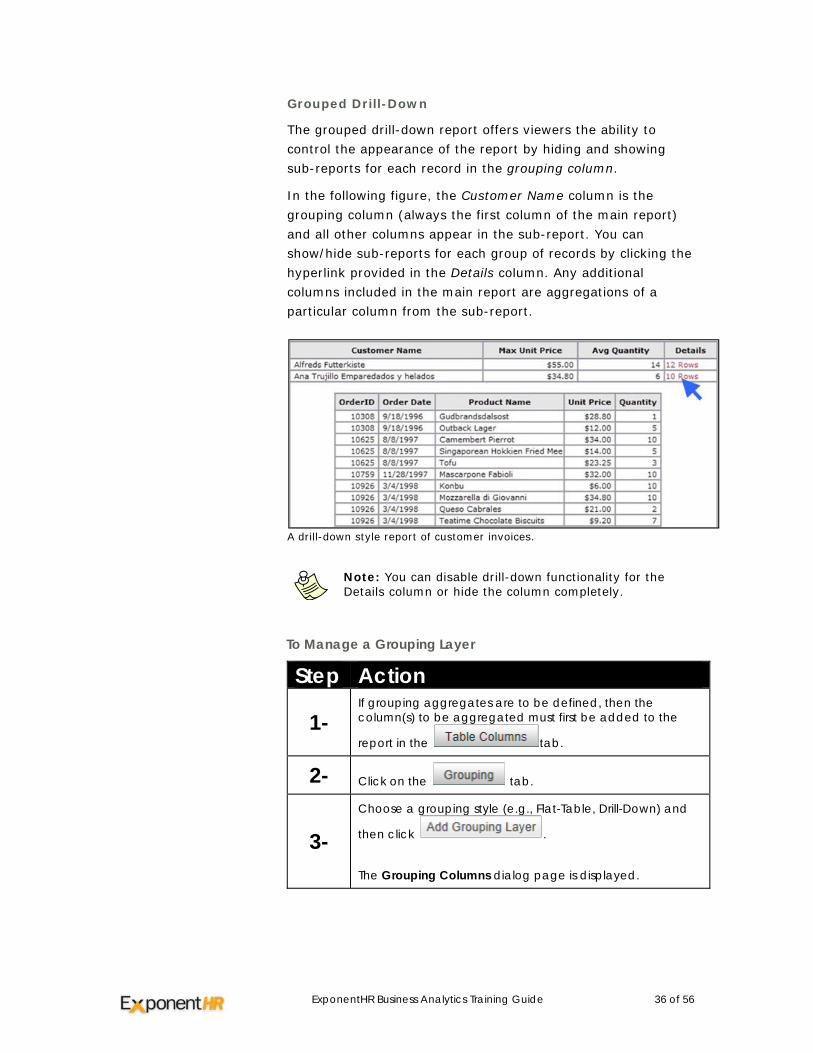
Grouped Drill-Down
The grouped drill-down report offers viewers the ability to control the appearance of the report by hiding and showing sub-reports for each record in the grouping column.
In the following figure, the Customer Name column is the grouping column (always the first column of the main report) and all other columns appear in the sub-report. You can show/hide sub-reports for each group of records by clicking the hyperlink provided in the Details column. Any additional columns included in the main report are aggregations of a particular column from the sub-report.
A drill-down style report of customer invoices.
Note: You can disable drill-down functionality for the Details column or hide the column completely.
To Manage a Grouping Layer
Step Action
1- If grouping aggregates are to be defined, then the column(s) to be aggregated must first be added to the
report in the tab.
2- Click on the tab.
3- Choose a grouping style (e.g., Flat-Table, Drill-Down) and
then click .
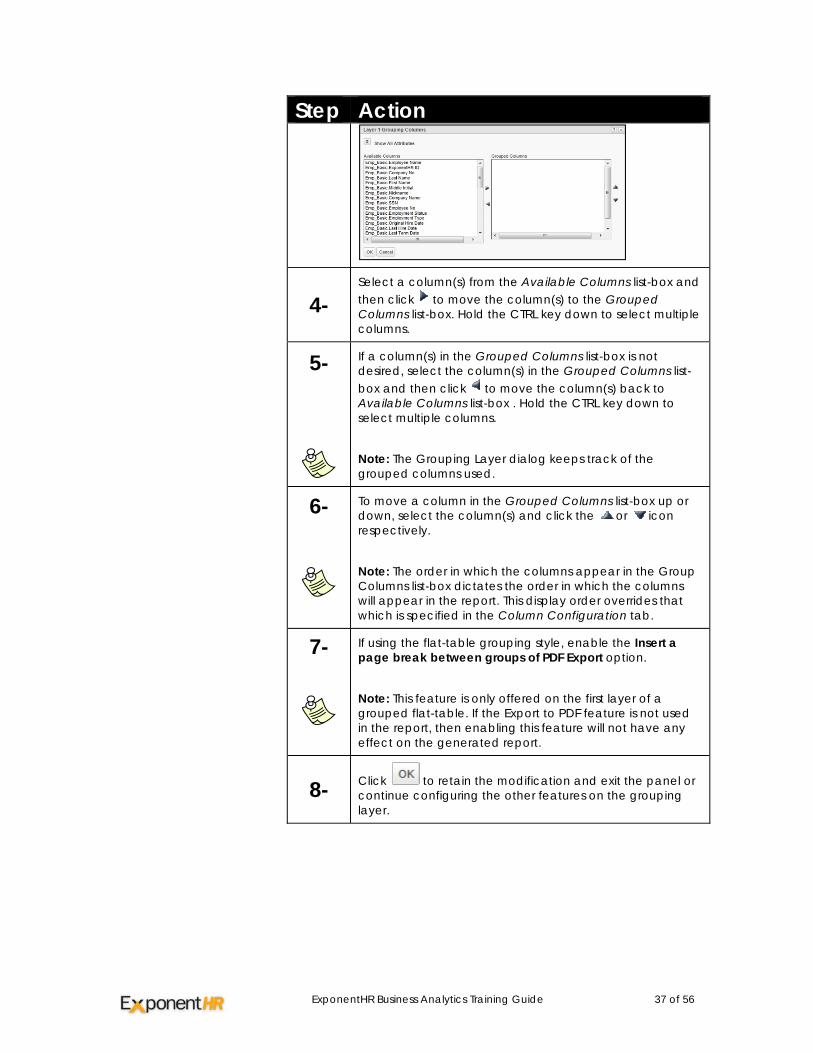
The Grouping Columns dialog page is displayed.
ExponentHR Business Analytics Training Guide 37 of 56
Step Action
4- Select a column(s) from the Available Columns list-box and then click to move the column(s) to the Grouped Columns list-box. Hold the CTRL key down to select multiple columns.
5-
If a column(s) in the Grouped Columns list-box is not desired, select the column(s) in the Grouped Columns list-box and then click to move the column(s) back to Available Columns list-box . Hold the CTRL key down to select multiple columns.
Note: The Grouping Layer dialog keeps track of the grouped columns used.
6-
To move a column in the Grouped Columns list-box up or down, select the column(s) and click the or icon respectively.
Note: The order in which the columns appear in the Group Columns list-box dictates the order in which the columns will appear in the report. This display order overrides that which is specified in the Column Configuration tab.
7-
If using the flat-table grouping style, enable the Insert a page break between groups of PDF Export option.
Note: This feature is only offered on the first layer of a grouped flat-table. If the Export to PDF feature is not used in the report, then enabling this feature will not have any effect on the generated report.
8- Click to retain the modification and exit the panel or continue configuring the other features on the grouping layer.
ExponentHR Business Analytics Training Guide 38 of 56
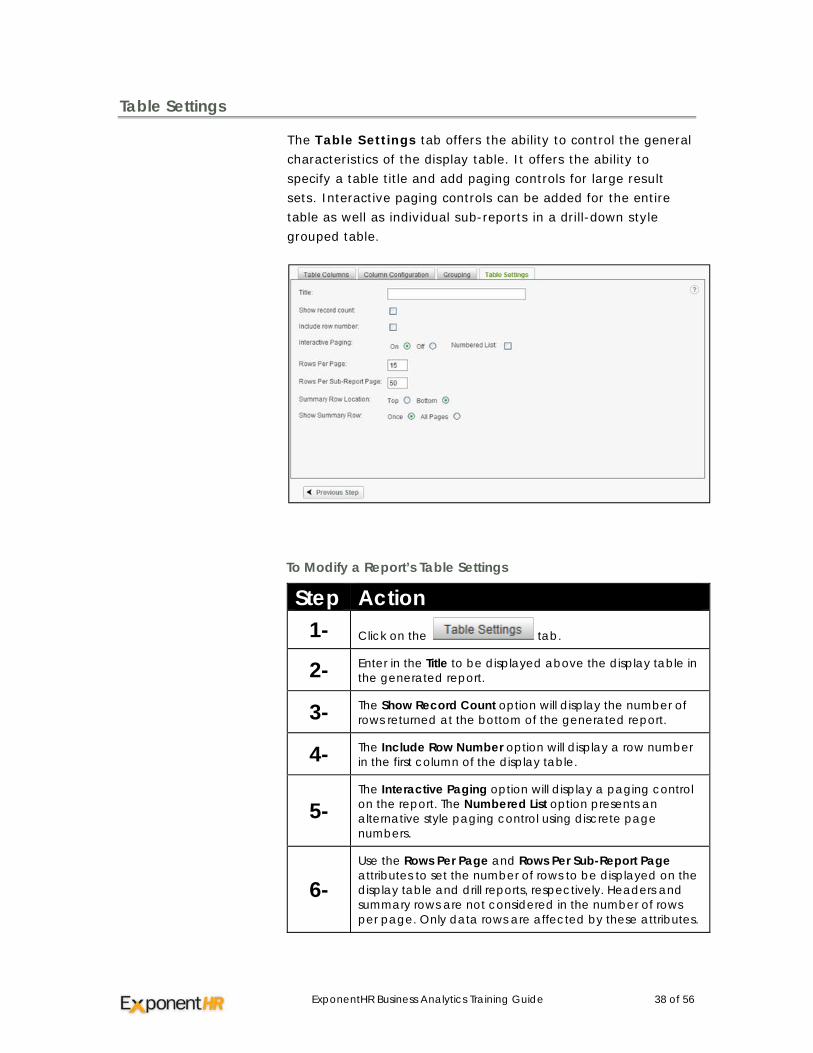
Table Settings
The Table Settings tab offers the ability to control the general characteristics of the display table. It offers the ability to specify a table title and add paging controls for large result sets. Interactive paging controls can be added for the entire table as well as individual sub-reports in a drill-down style grouped table.
To Modify a Report’s Table Settings
Step Action 1- Click on the tab.
2- Enter in the Title to be displayed above the display table in the generated report.
3- The Show Record Count option will display the number of rows returned at the bottom of the generated report.
4- The Include Row Number option will display a row number in the first column of the display table.
5- The Interactive Paging option will display a paging control on the report. The Numbered List option presents an alternative style paging control using discrete page numbers.
6- Use the Rows Per Page and Rows Per Sub-Report Page attributes to set the number of rows to be displayed on the display table and drill reports, respectively. Headers and summary rows are not considered in the number of rows per page. Only data rows are affected by these attributes.
ExponentHR Business Analytics Training Guide 39 of 56
Step Action
7- For selected reports, a summary row will be present with totals for that report. The Summary Row Location option allows you to choose to have the summary row appear at the top or the bottom of the generated report.
8- The Show Summary Row option will allow you to choose to have the total summary row appear just once at the end of the report or to appear at the end of each page of the report.
ExponentHR Business Analytics Training Guide 40 of 56
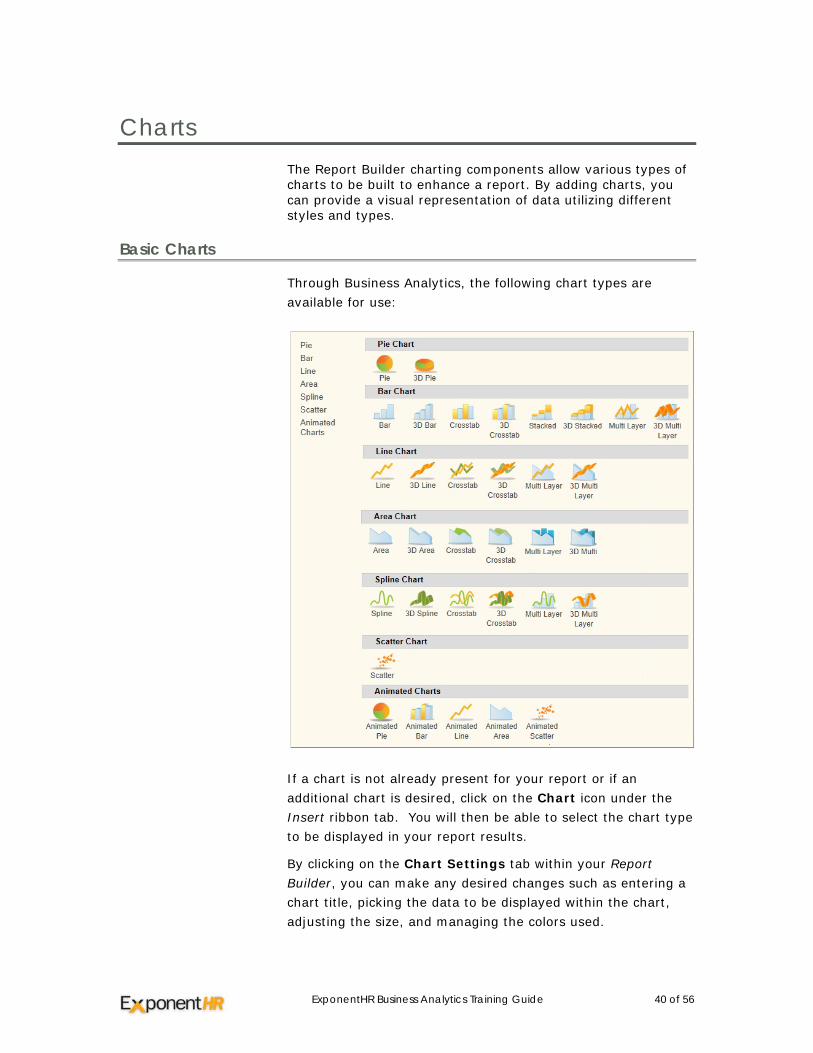
Charts The Report Builder charting components allow various types of charts to be built to enhance a report. By adding charts, you can provide a visual representation of data utilizing different styles and types.
Basic Charts
Through Business Analytics, the following chart types are available for use:
If a chart is not already present for your report or if an additional chart is desired, click on the Chart icon under the Insert ribbon tab. You will then be able to select the chart type to be displayed in your report results.
By clicking on the Chart Settings tab within your Report Builder, you can make any desired changes such as entering a chart title, picking the data to be displayed within the chart, adjusting the size, and managing the colors used.
ExponentHR Business Analytics Training Guide 41 of 56
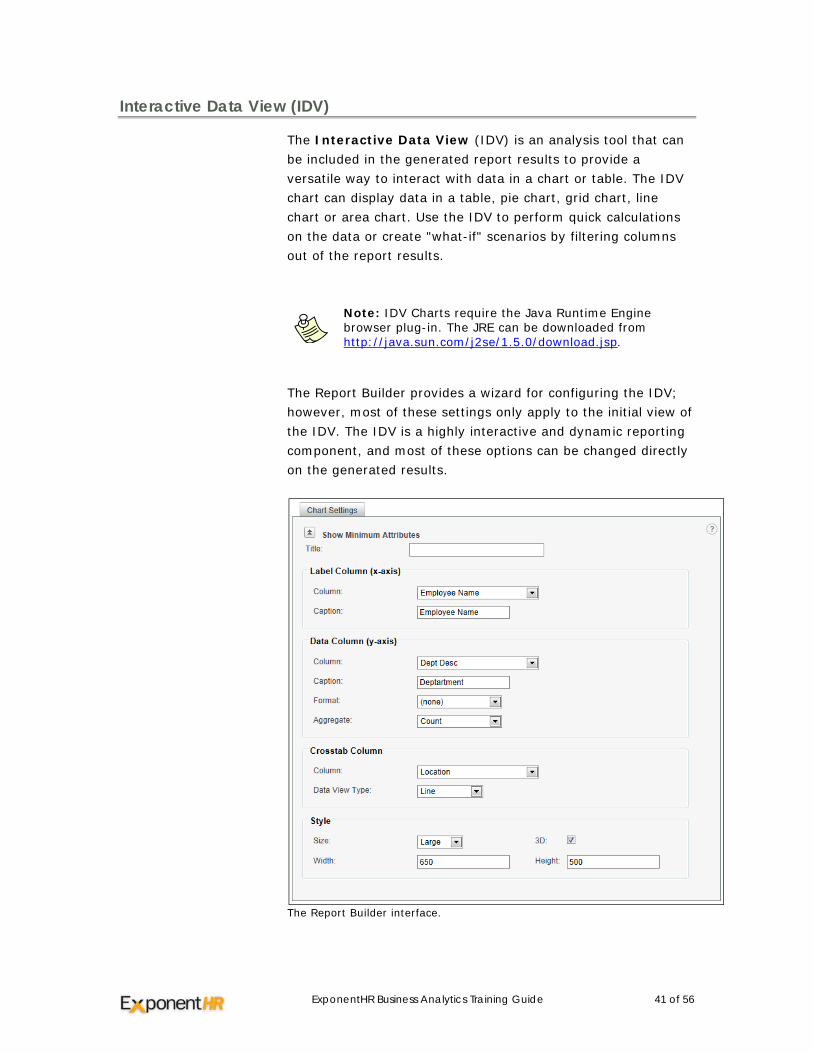
Interactive Data View (IDV)
The Interactive Data View (IDV) is an analysis tool that can be included in the generated report results to provide a versatile way to interact with data in a chart or table. The IDV chart can display data in a table, pie chart, grid chart, line chart or area chart. Use the IDV to perform quick calculations on the data or create "what-if" scenarios by filtering columns out of the report results.
Note: IDV Charts require the Java Runtime Engine browser plug-in. The JRE can be downloaded from http://java.sun.com/j2se/1.5.0/download.jsp.
The Report Builder provides a wizard for configuring the IDV; however, most of these settings only apply to the initial view of the IDV. The IDV is a highly interactive and dynamic reporting component, and most of these options can be changed directly on the generated results.
The Report Builder interface.
ExponentHR Business Analytics Training Guide 42 of 56
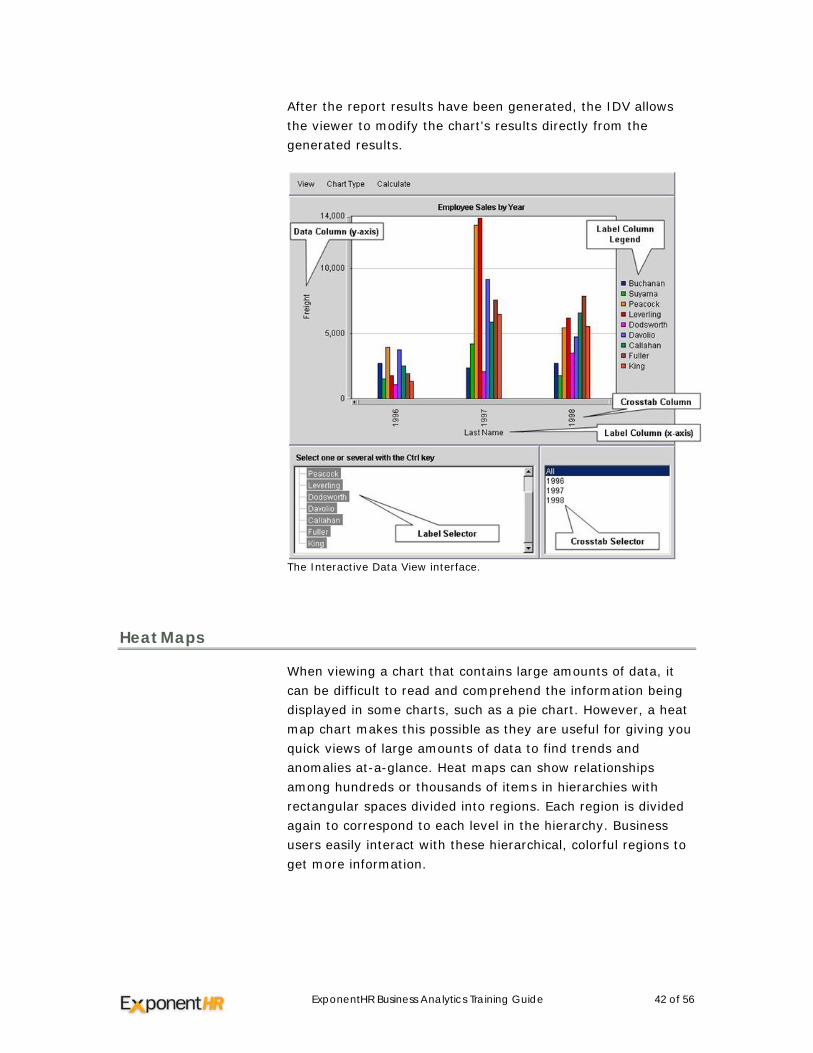
After the report results have been generated, the IDV allows the viewer to modify the chart's results directly from the generated results.
The Interactive Data View interface.
Heat Maps
When viewing a chart that contains large amounts of data, it can be difficult to read and comprehend the information being displayed in some charts, such as a pie chart. However, a heat map chart makes this possible as they are useful for giving you quick views of large amounts of data to find trends and anomalies at-a-glance. Heat maps can show relationships among hundreds or thousands of items in hierarchies with rectangular spaces divided into regions. Each region is divided again to correspond to each level in the hierarchy. Business users easily interact with these hierarchical, colorful regions to get more information.
ExponentHR Business Analytics Training Guide 43 of 56
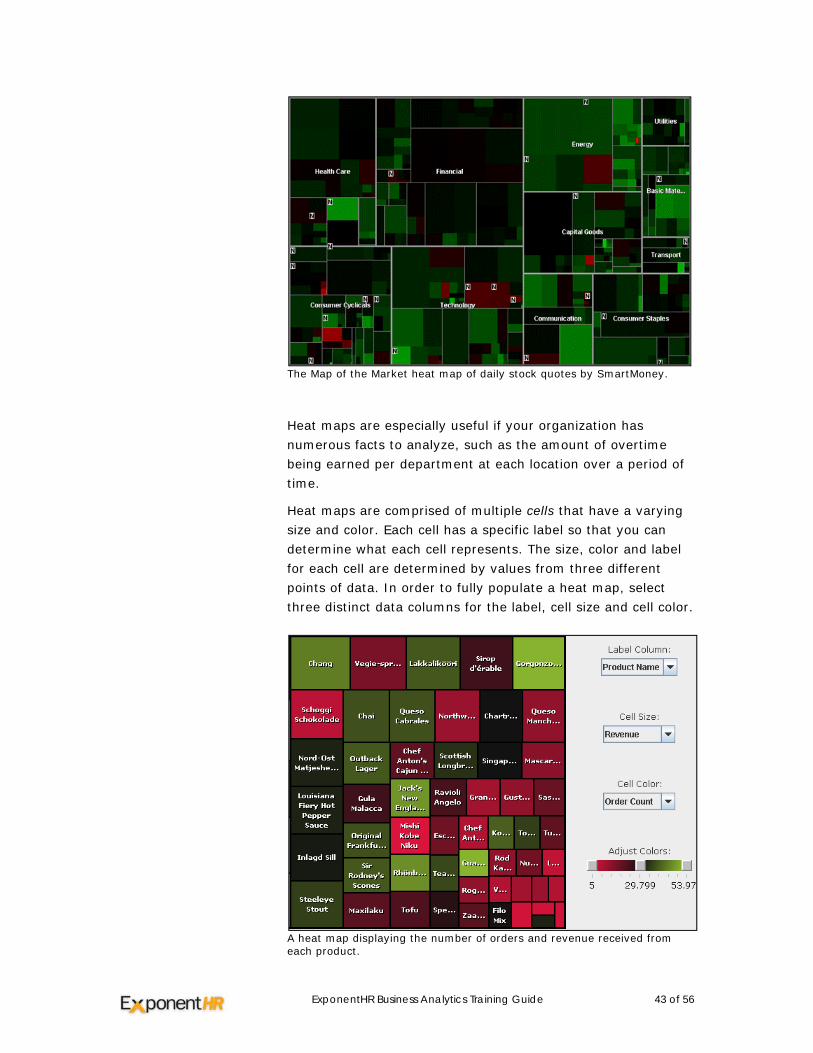
The Map of the Market heat map of daily stock quotes by SmartMoney.
Heat maps are especially useful if your organization has numerous facts to analyze, such as the amount of overtime being earned per department at each location over a period of time.
Heat maps are comprised of multiple cells that have a varying size and color. Each cell has a specific label so that you can determine what each cell represents. The size, color and label for each cell are determined by values from three different points of data. In order to fully populate a heat map, select three distinct data columns for the label, cell size and cell color.
A heat map displaying the number of orders and revenue received from each product.
ExponentHR Business Analytics Training Guide 44 of 56
A cell is created for each distinct product name in the Product Name column. The size of the cell is determined by the corresponding value from the Revenue column; larger values produce larger cells. The color of the cell is determined by the value of the Order Count column.
Note: Numeric data columns must be selected for the Cell Size and Cell Color columns.
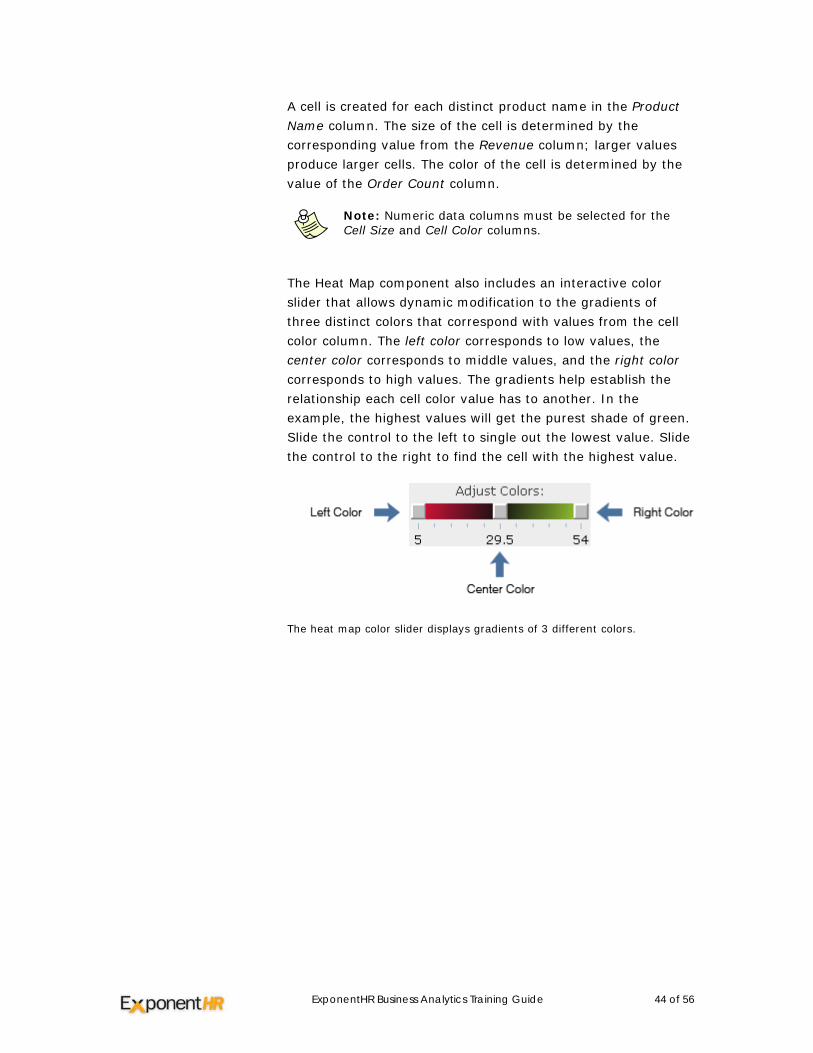
The Heat Map component also includes an interactive color slider that allows dynamic modification to the gradients of three distinct colors that correspond with values from the cell color column. The left color corresponds to low values, the center color corresponds to middle values, and the right color corresponds to high values. The gradients help establish the relationship each cell color value has to another. In the example, the highest values will get the purest shade of green. Slide the control to the left to single out the lowest value. Slide the control to the right to find the cell with the highest value.
The heat map color slider displays gradients of 3 different colors.
ExponentHR Business Analytics Training Guide 45 of 56
Style & Formatting Reports Business Analytics provides you the option to select a style and format for each generated report results. These additional options may help communicate information to the viewer of the results through report headers, labels, and images. In addition, you are also able to designate the paper format in the event the generated report results are printed.
Using Headers
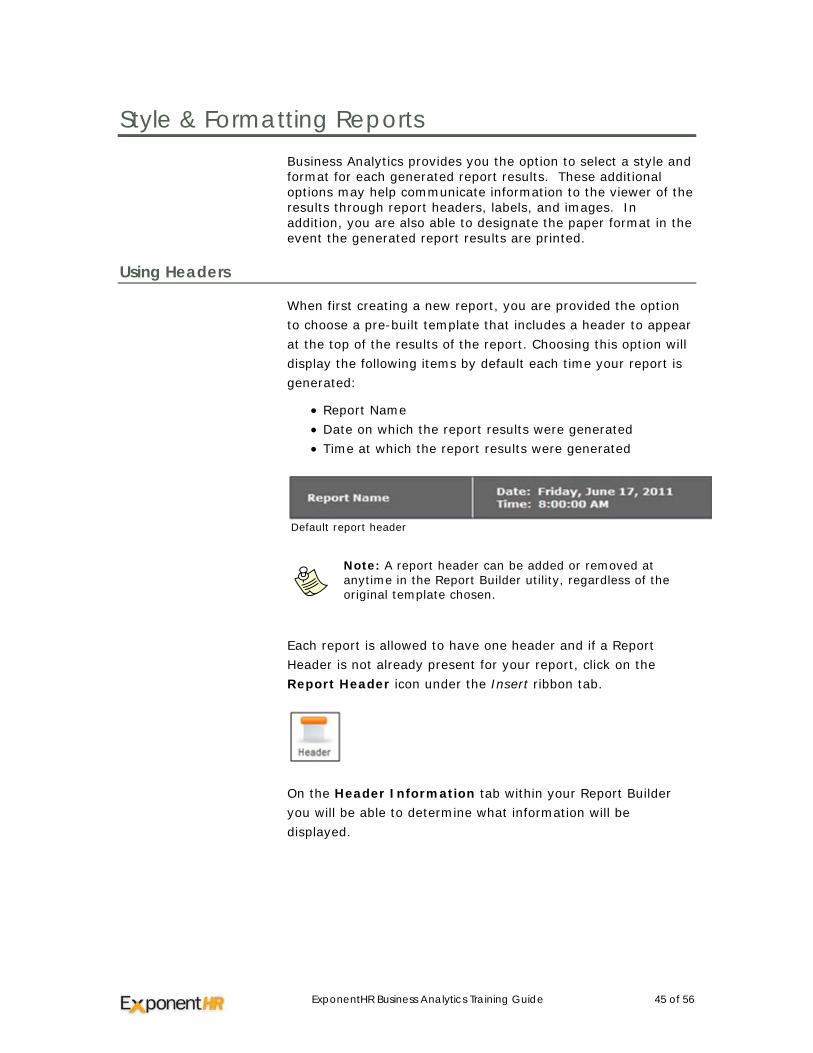
When first creating a new report, you are provided the option to choose a pre-built template that includes a header to appear at the top of the results of the report. Choosing this option will display the following items by default each time your report is generated:
• Report Name • Date on which the report results were generated • Time at which the report results were generated
Default report header
Note: A report header can be added or removed at anytime in the Report Builder utility, regardless of the original template chosen.
Each report is allowed to have one header and if a Report Header is not already present for your report, click on the Report Header icon under the Insert ribbon tab.
On the Header Information tab within your Report Builder you will be able to determine what information will be displayed.
ExponentHR Business Analytics Training Guide 46 of 56
Note: The font and background colors of the header may be altered through the Report Style selected in the Report Settings.
Using Labels
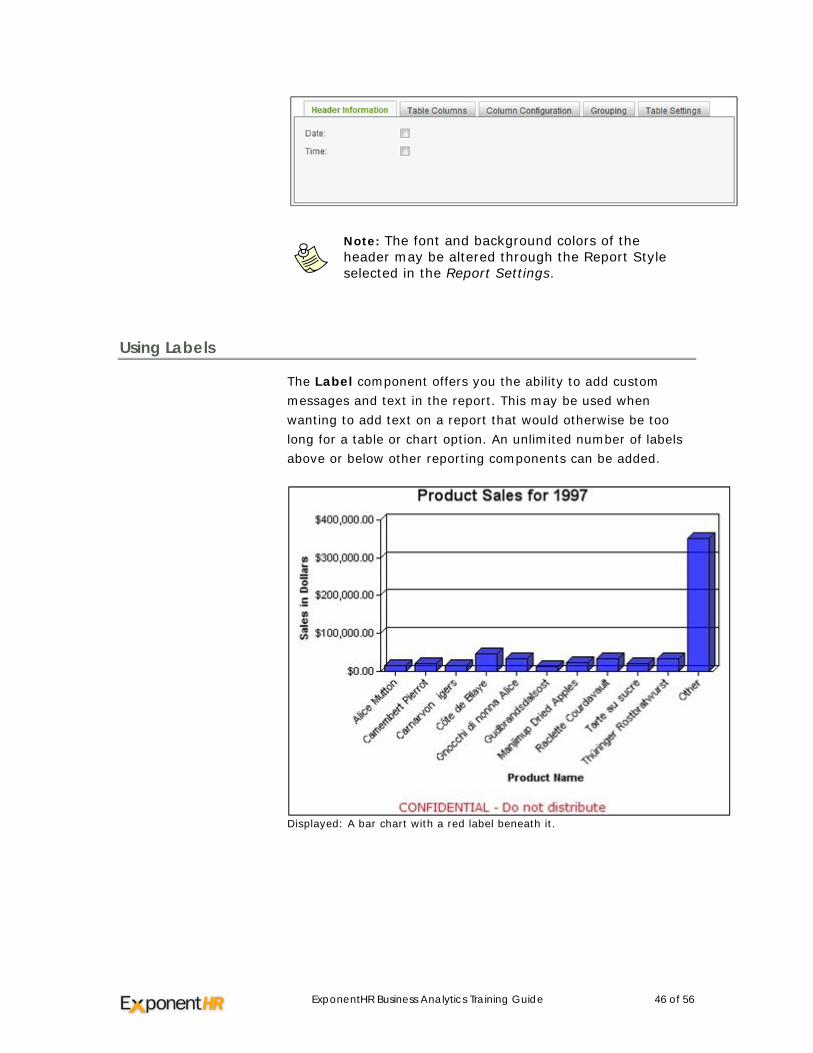
The Label component offers you the ability to add custom messages and text in the report. This may be used when wanting to add text on a report that would otherwise be too long for a table or chart option. An unlimited number of labels above or below other reporting components can be added.
Displayed: A bar chart with a red label beneath it.
ExponentHR Business Analytics Training Guide 47 of 56
To Manage Report Labels
Step Action
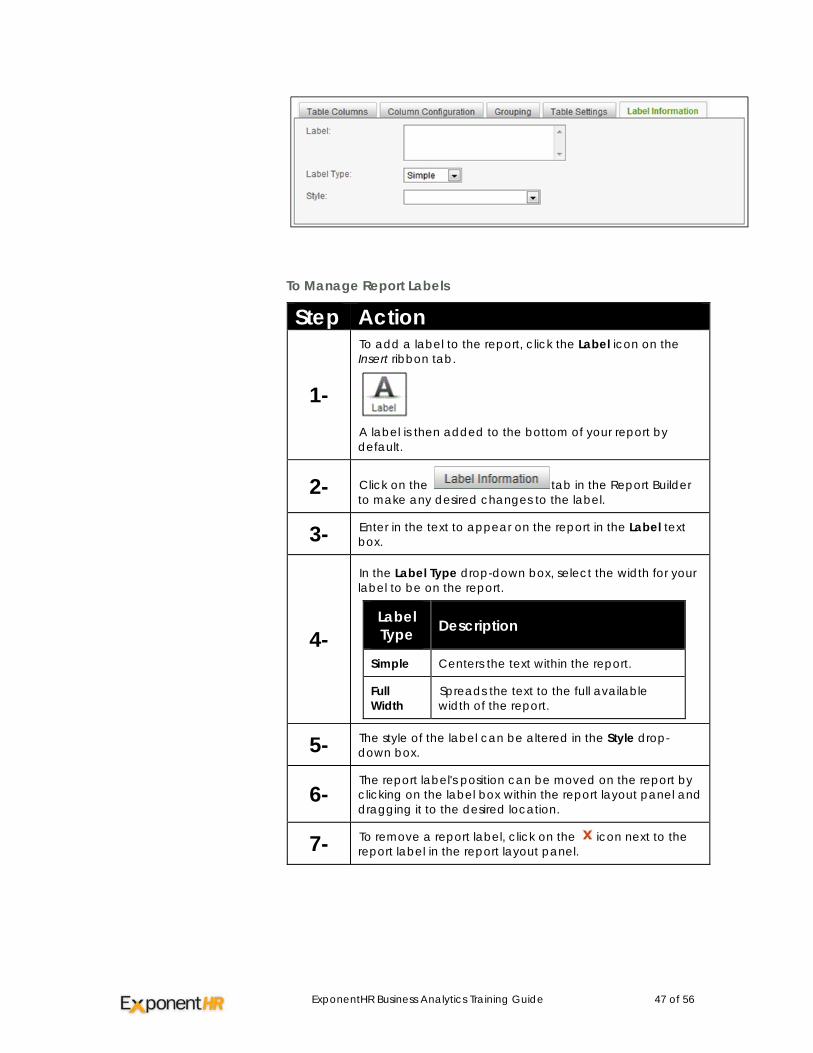
1-
To add a label to the report, click the Label icon on the Insert ribbon tab.
A label is then added to the bottom of your report by default.
2- Click on the tab in the Report Builder to make any desired changes to the label.
3- Enter in the text to appear on the report in the Label text box.
4-
In the Label Type drop-down box, select the width for your label to be on the report.
Label Type Description
Simple Centers the text within the report.
Full Width
Spreads the text to the full available width of the report.
5- The style of the label can be altered in the Style drop-down box.
6- The report label's position can be moved on the report by clicking on the label box within the report layout panel and dragging it to the desired location.
7- To remove a report label, click on the icon next to the report label in the report layout panel.
ExponentHR Business Analytics Training Guide 48 of 56
Using Images
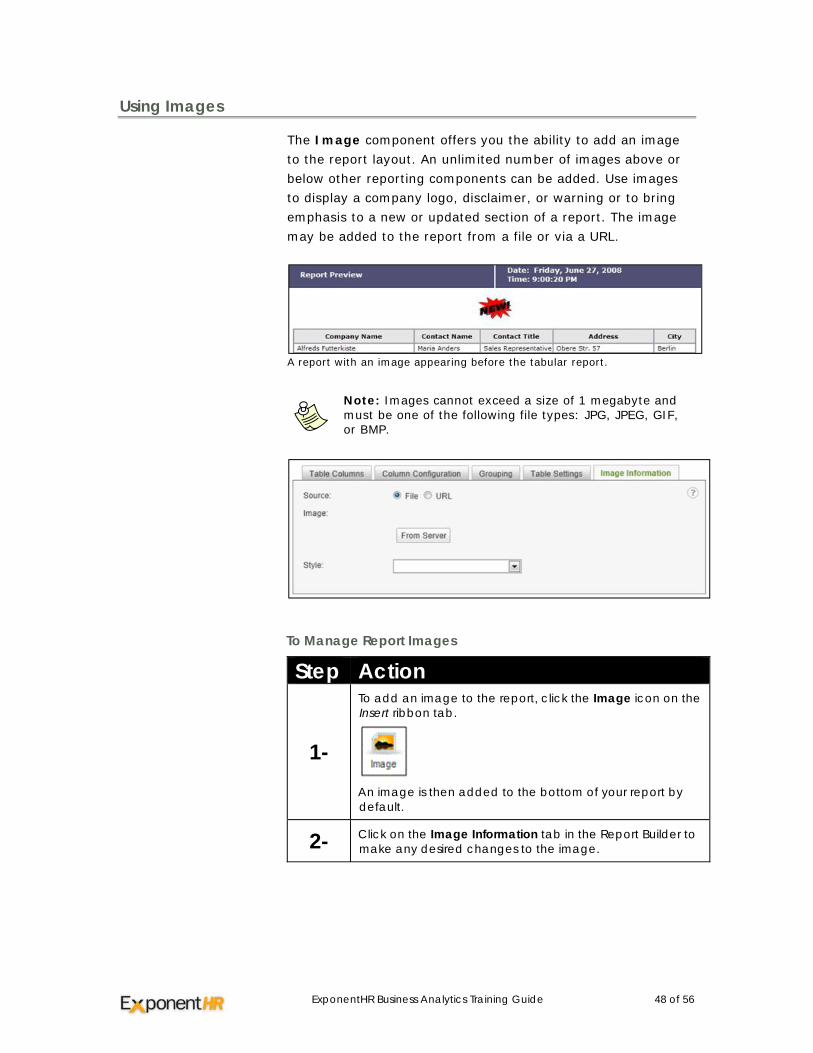
The Image component offers you the ability to add an image to the report layout. An unlimited number of images above or below other reporting components can be added. Use images to display a company logo, disclaimer, or warning or to bring emphasis to a new or updated section of a report. The image may be added to the report from a file or via a URL.
A report with an image appearing before the tabular report.
Note: Images cannot exceed a size of 1 megabyte and must be one of the following file types: JPG, JPEG, GIF, or BMP.
To Manage Report Images
Step Action
1-
To add an image to the report, click the Image icon on the Insert ribbon tab.
An image is then added to the bottom of your report by default.
2- Click on the Image Information tab in the Report Builder to make any desired changes to the image.
ExponentHR Business Analytics Training Guide 49 of 56
Step Action
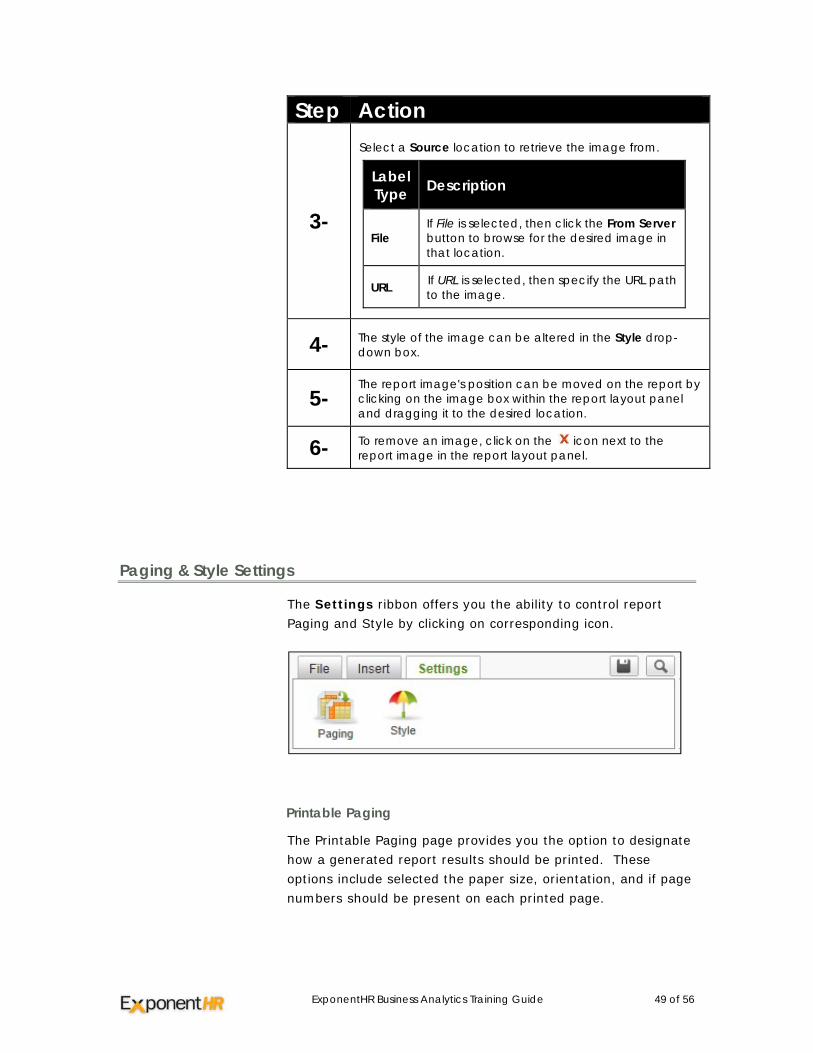
3-
Select a Source location to retrieve the image from.
Label Type Description
File If File is selected, then click the From Server button to browse for the desired image in that location.
URL If URL is selected, then specify the URL path to the image.
4- The style of the image can be altered in the Style drop-down box.
5- The report image's position can be moved on the report by clicking on the image box within the report layout panel and dragging it to the desired location.
6- To remove an image, click on the icon next to the report image in the report layout panel.
Paging & Style Settings
The Settings ribbon offers you the ability to control report Paging and Style by clicking on corresponding icon.
Printable Paging
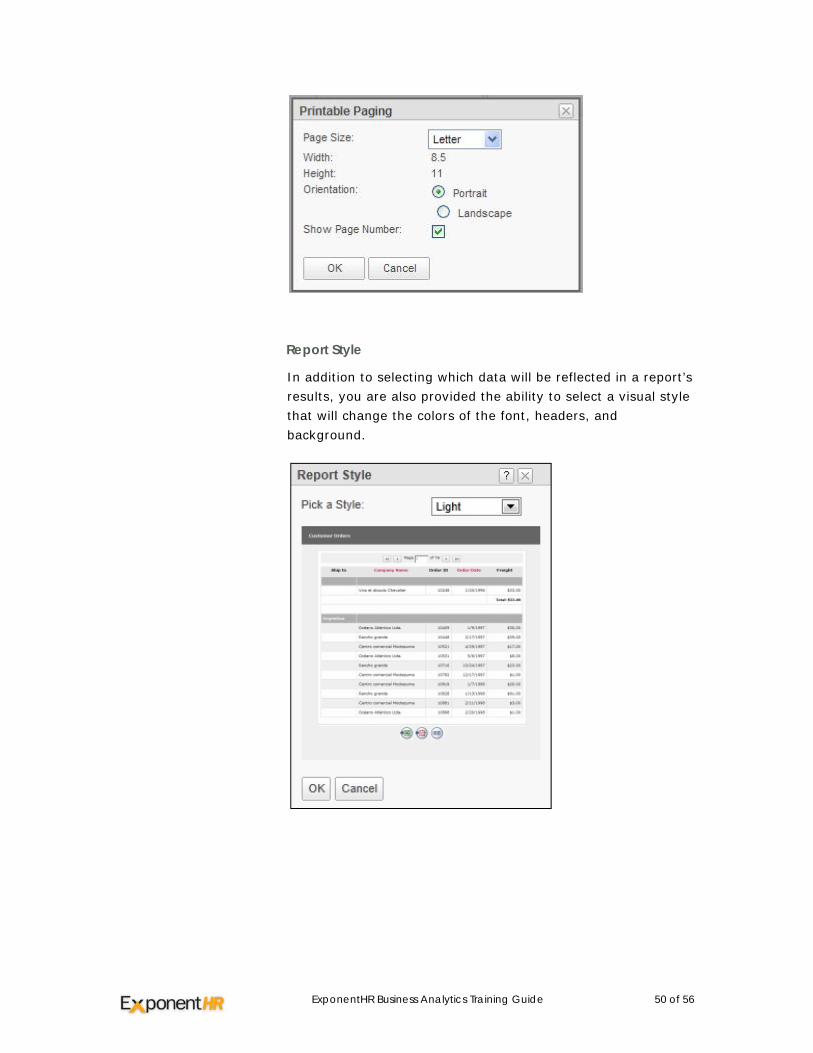
The Printable Paging page provides you the option to designate how a generated report results should be printed. These options include selected the paper size, orientation, and if page numbers should be present on each printed page.
ExponentHR Business Analytics Training Guide 50 of 56
Report Style
In addition to selecting which data will be reflected in a report’s results, you are also provided the ability to select a visual style that will change the colors of the font, headers, and background.
ExponentHR Business Analytics Training Guide 51 of 56
Exporting Reports
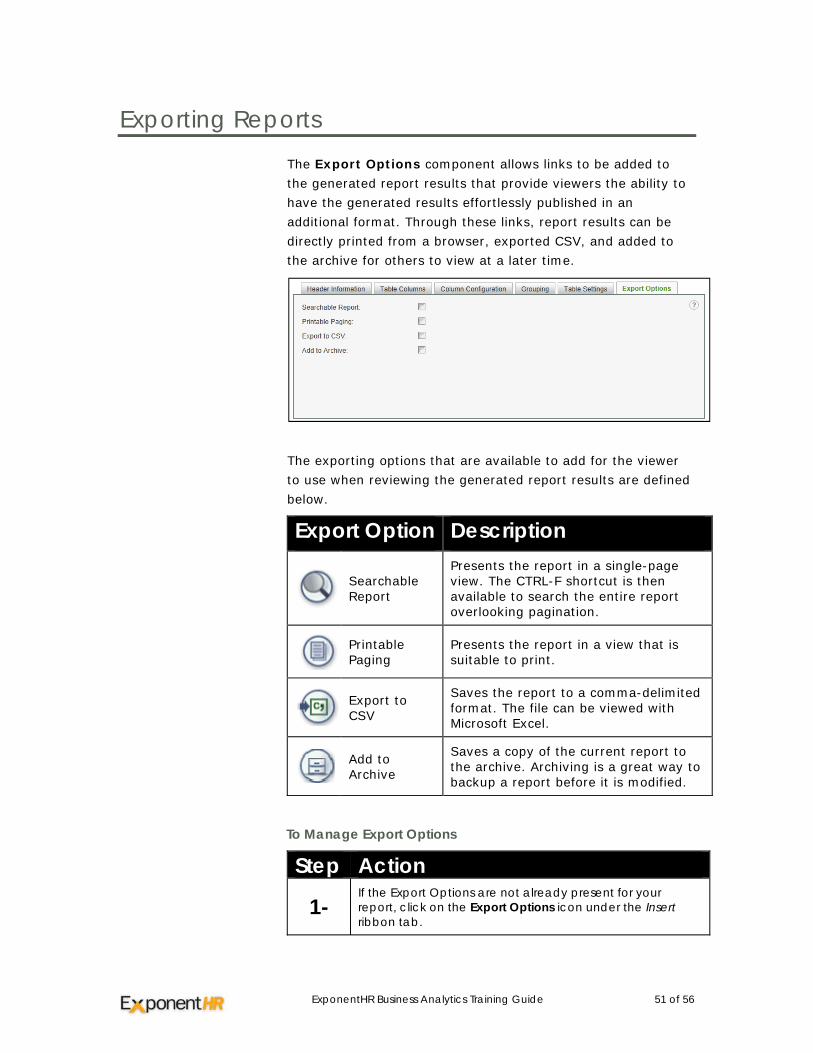
The Export Options component allows links to be added to the generated report results that provide viewers the ability to have the generated results effortlessly published in an additional format. Through these links, report results can be directly printed from a browser, exported CSV, and added to the archive for others to view at a later time.
The exporting options that are available to add for the viewer to use when reviewing the generated report results are defined below.
Export Option Description
Searchable Report
Presents the report in a single-page view. The CTRL-F shortcut is then available to search the entire report overlooking pagination.
Printable Paging
Presents the report in a view that is suitable to print.
Export to CSV
Saves the report to a comma-delimited format. The file can be viewed with Microsoft Excel.
Add to Archive
Saves a copy of the current report to the archive. Archiving is a great way to backup a report before it is modified.
To Manage Export Options
Step Action
1- If the Export Options are not already present for your report, click on the Export Options icon under the Insert ribbon tab.
ExponentHR Business Analytics Training Guide 52 of 56
Step Action
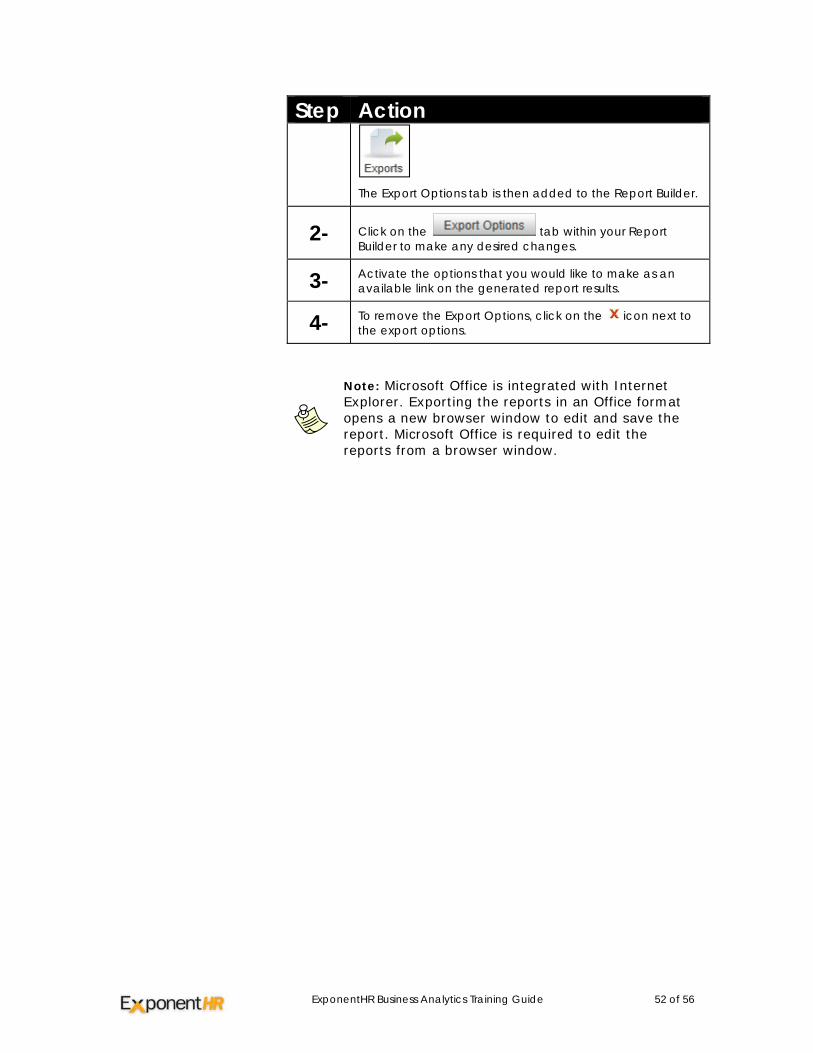
The Export Options tab is then added to the Report Builder.
2- Click on the tab within your Report Builder to make any desired changes.
3- Activate the options that you would like to make as an available link on the generated report results.
4- To remove the Export Options, click on the icon next to the export options.
Note: Microsoft Office is integrated with Internet Explorer. Exporting the reports in an Office format opens a new browser window to edit and save the report. Microsoft Office is required to edit the reports from a browser window.
ExponentHR Business Analytics Training Guide 53 of 56
Building a Dashboard
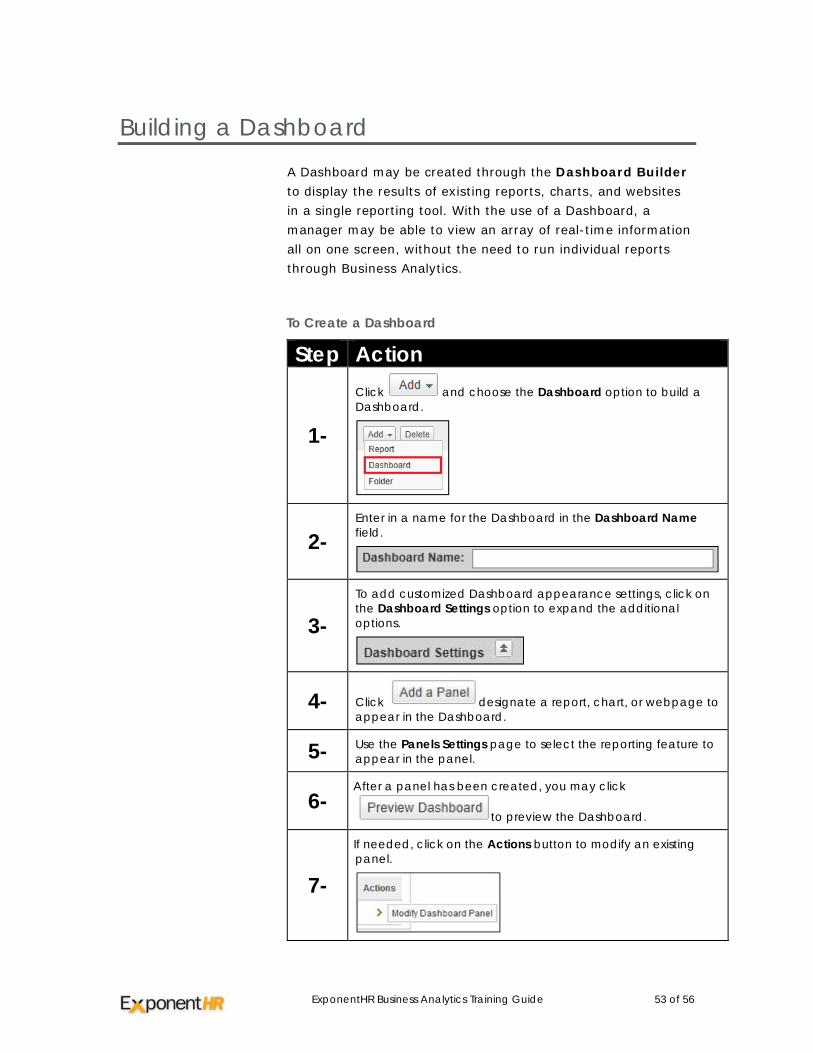
A Dashboard may be created through the Dashboard Builder to display the results of existing reports, charts, and websites in a single reporting tool. With the use of a Dashboard, a manager may be able to view an array of real-time information all on one screen, without the need to run individual reports through Business Analytics.
To Create a Dashboard
Step Action
1-
Click and choose the Dashboard option to build a Dashboard.
2- Enter in a name for the Dashboard in the Dashboard Name field.
3- To add customized Dashboard appearance settings, click on the Dashboard Settings option to expand the additional options.
4- Click designate a report, chart, or webpage to appear in the Dashboard.
5- Use the Panels Settings page to select the reporting feature to appear in the panel.
6- After a panel has been created, you may click
to preview the Dashboard.
7-
If needed, click on the Actions button to modify an existing panel.
ExponentHR Business Analytics Training Guide 54 of 56
Step Action
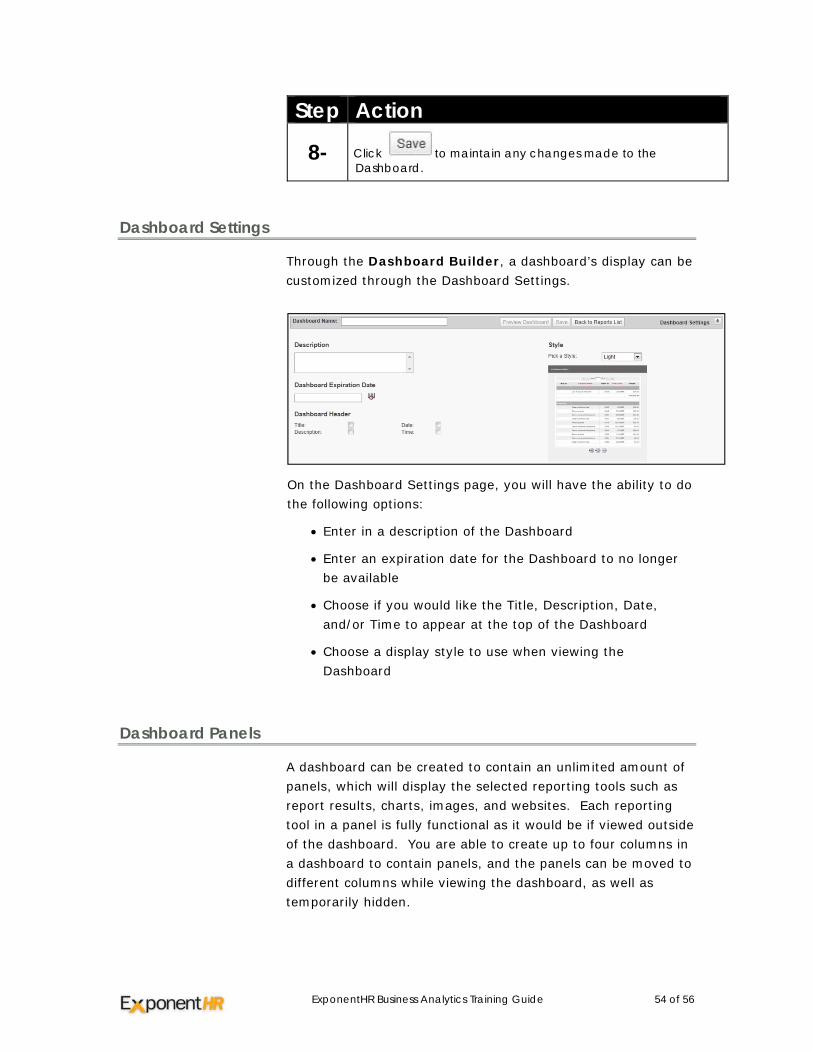
8- Click to maintain any changes made to the Dashboard.
Dashboard Settings
Through the Dashboard Builder, a dashboard’s display can be customized through the Dashboard Settings.
On the Dashboard Settings page, you will have the ability to do the following options:
• Enter in a description of the Dashboard
• Enter an expiration date for the Dashboard to no longer be available
• Choose if you would like the Title, Description, Date, and/or Time to appear at the top of the Dashboard
• Choose a display style to use when viewing the Dashboard
Dashboard Panels
A dashboard can be created to contain an unlimited amount of panels, which will display the selected reporting tools such as report results, charts, images, and websites. Each reporting tool in a panel is fully functional as it would be if viewed outside of the dashboard. You are able to create up to four columns in a dashboard to contain panels, and the panels can be moved to different columns while viewing the dashboard, as well as temporarily hidden.
ExponentHR Business Analytics Training Guide 55 of 56
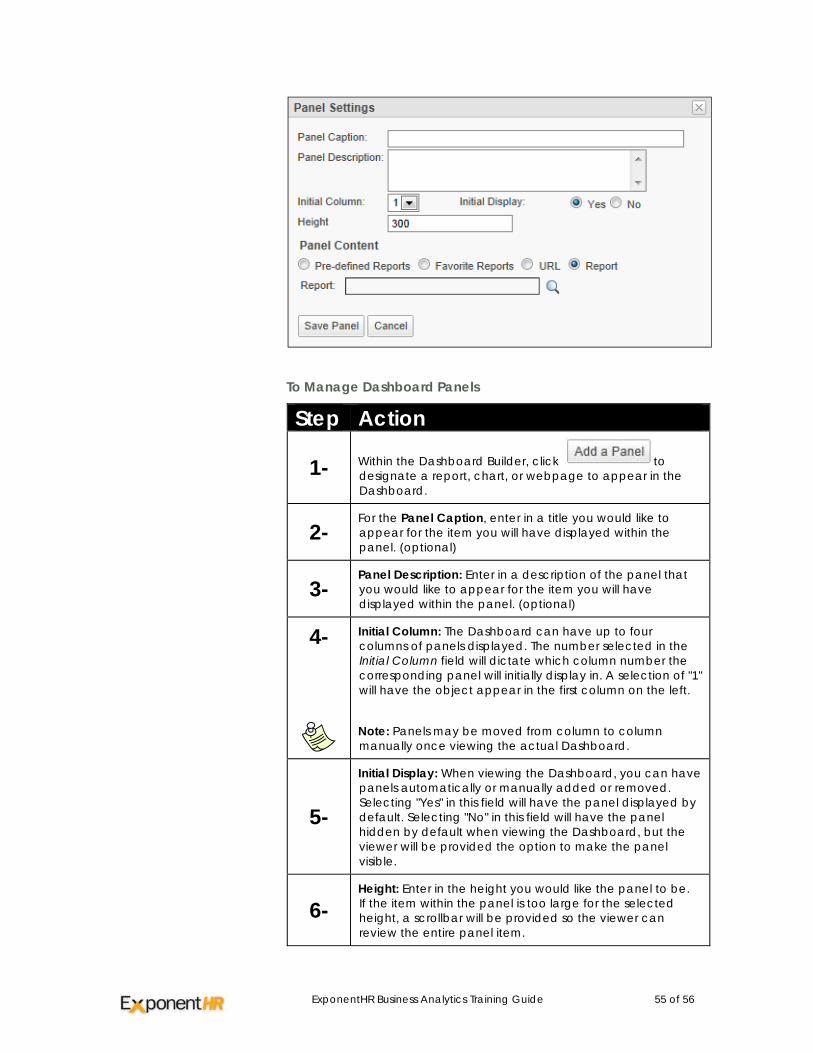
To Manage Dashboard Panels
Step Action
1- Within the Dashboard Builder, click to designate a report, chart, or webpage to appear in the Dashboard.
2- For the Panel Caption, enter in a title you would like to appear for the item you will have displayed within the panel. (optional)
3- Panel Description: Enter in a description of the panel that you would like to appear for the item you will have displayed within the panel. (optional)
4-
Initial Column: The Dashboard can have up to four columns of panels displayed. The number selected in the Initial Column field will dictate which column number the corresponding panel will initially display in. A selection of "1" will have the object appear in the first column on the left.
Note: Panels may be moved from column to column manually once viewing the actual Dashboard.
5-
Initial Display: When viewing the Dashboard, you can have panels automatically or manually added or removed. Selecting "Yes" in this field will have the panel displayed by default. Selecting "No" in this field will have the panel hidden by default when viewing the Dashboard, but the viewer will be provided the option to make the panel visible.
6- Height: Enter in the height you would like the panel to be. If the item within the panel is too large for the selected height, a scrollbar will be provided so the viewer can review the entire panel item.
ExponentHR Business Analytics Training Guide 56 of 56
Step Action
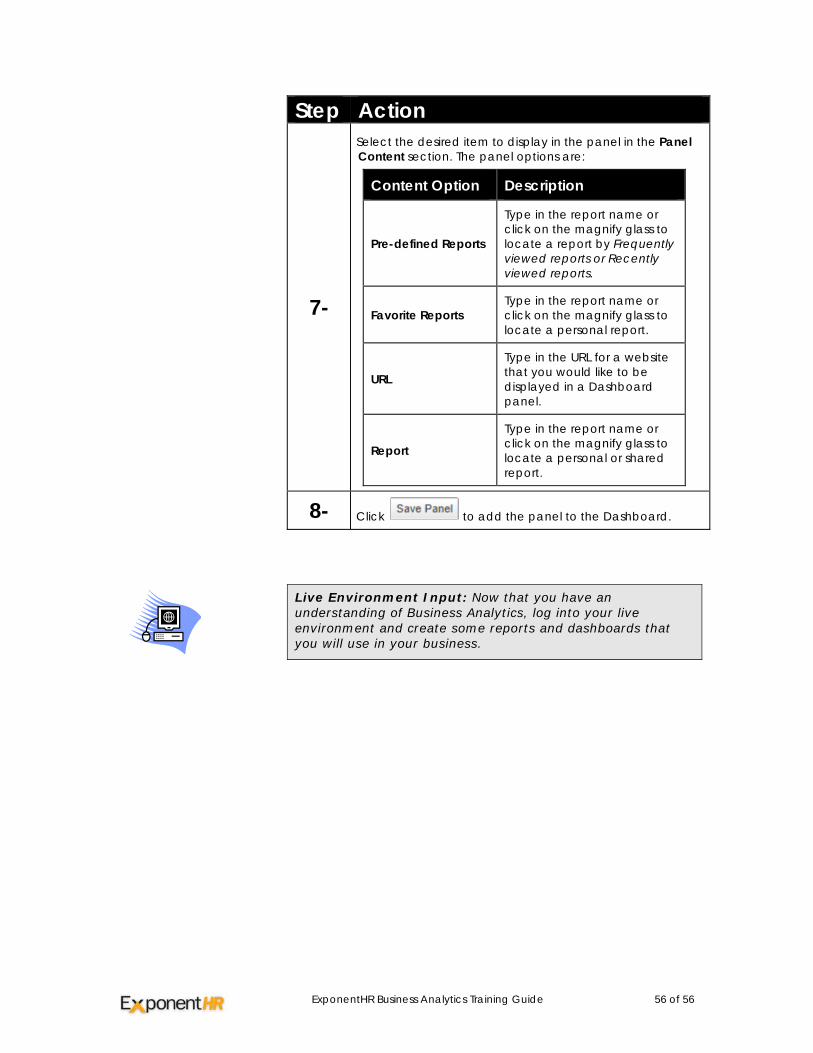
7-
Select the desired item to display in the panel in the Panel Content section. The panel options are:
Content Option Description
Pre-defined Reports
Type in the report name or click on the magnify glass to locate a report by Frequently viewed reports or Recently viewed reports.
Favorite Reports Type in the report name or click on the magnify glass to locate a personal report.
URL
Type in the URL for a website that you would like to be displayed in a Dashboard panel.
Report
Type in the report name or click on the magnify glass to locate a personal or shared report.
8- Click to add the panel to the Dashboard.
Live Environment Input: Now that you have an understanding of Business Analytics, log into your live environment and create some reports and dashboards that you will use in your business.