Page 1
September 2018
Economic and Financial Affairs
BUSINESS AND CONSUMER SURVEY RESULTS
60
70
80
90
100
110
120
1994 1996 1998 2000 2002 2004 2006 2008 2010 2012 2014 2016 2018
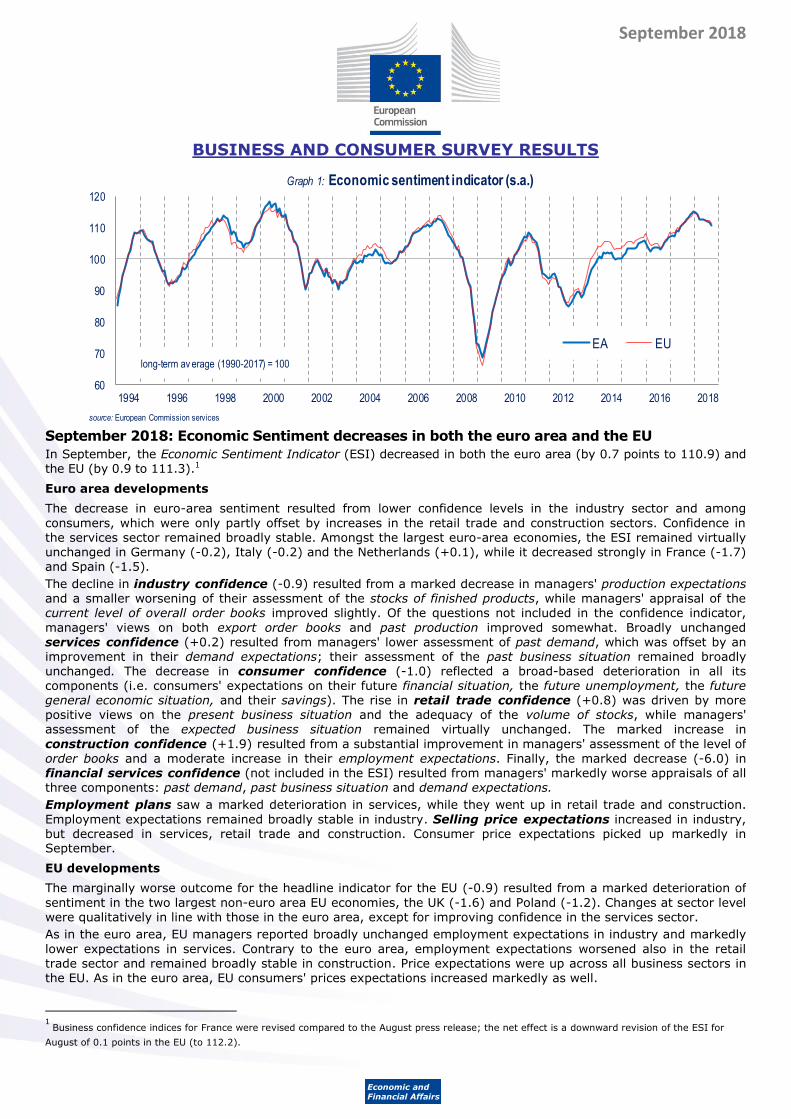
Graph 1: Economic sentiment indicator (s.a.)
EA EU
source: European Commission services
long-term av erage (1990-2017) = 100
September 2018: Economic Sentiment decreases in both the euro area and the EU
In September, the Economic Sentiment Indicator (ESI) decreased in both the euro area (by 0.7 points to 110.9) and the EU (by 0.9 to 111.3).1
Euro area developments
The decrease in euro-area sentiment resulted from lower confidence levels in the industry sector and among
consumers, which were only partly offset by increases in the retail trade and construction sectors. Confidence in
the services sector remained broadly stable. Amongst the largest euro-area economies, the ESI remained virtually unchanged in Germany (-0.2), Italy (-0.2) and the Netherlands (+0.1), while it decreased strongly in France (-1.7) and Spain (-1.5).
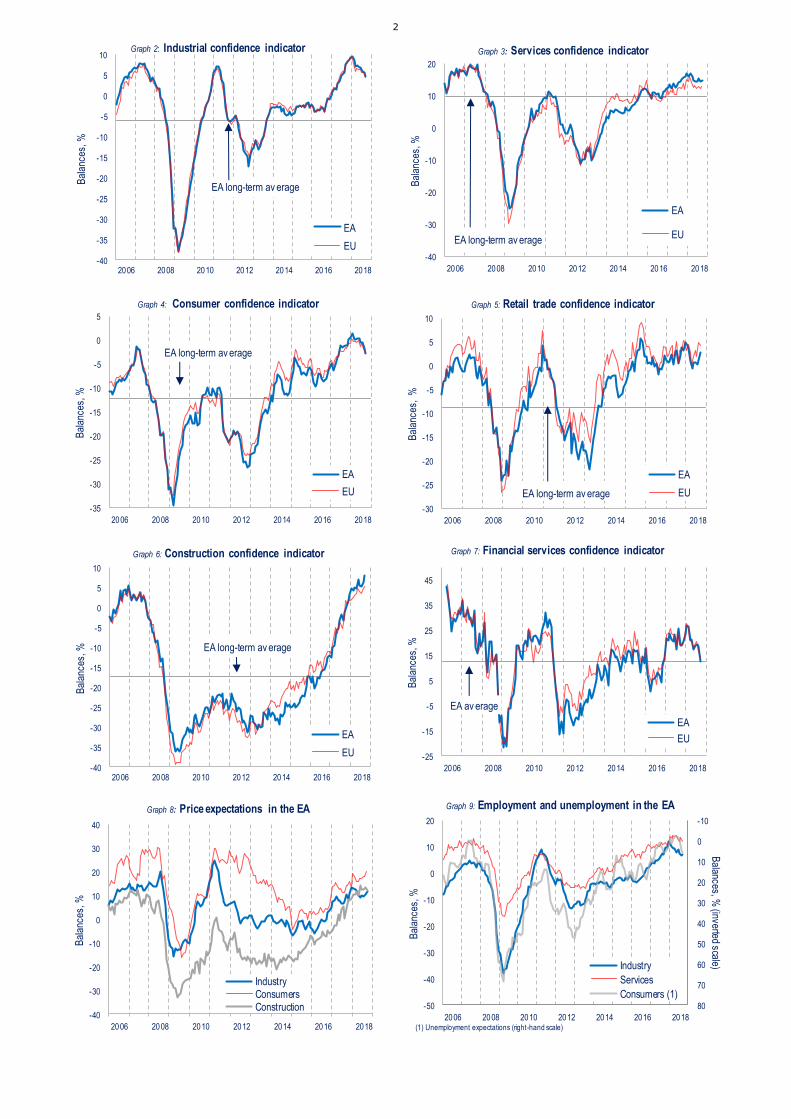
The decline in industry confidence (-0.9) resulted from a marked decrease in managers' production expectations and a smaller worsening of their assessment of the stocks of finished products, while managers' appraisal of the current level of overall order books improved slightly. Of the questions not included in the confidence indicator,
managers' views on both export order books and past production improved somewhat. Broadly unchanged services confidence (+0.2) resulted from managers' lower assessment of past demand, which was offset by an improvement in their demand expectations; their assessment of the past business situation remained broadly unchanged. The decrease in consumer confidence (-1.0) reflected a broad-based deterioration in all its components (i.e. consumers' expectations on their future financial situation, the future unemployment, the future general economic situation, and their savings). The rise in retail trade confidence (+0.8) was driven by more positive views on the present business situation and the adequacy of the volume of stocks, while managers' assessment of the expected business situation remained virtually unchanged. The marked increase in
construction confidence (+1.9) resulted from a substantial improvement in managers' assessment of the level of
order books and a moderate increase in their employment expectations. Finally, the marked decrease (-6.0) in financial services confidence (not included in the ESI) resulted from managers' markedly worse appraisals of all three components: past demand, past business situation and demand expectations.
Employment plans saw a marked deterioration in services, while they went up in retail trade and construction.
Employment expectations remained broadly stable in industry. Selling price expectations increased in industry, but decreased in services, retail trade and construction. Consumer price expectations picked up markedly in September.
EU developments
The marginally worse outcome for the headline indicator for the EU (-0.9) resulted from a marked deterioration of
sentiment in the two largest non-euro area EU economies, the UK (-1.6) and Poland (-1.2). Changes at sector level were qualitatively in line with those in the euro area, except for improving confidence in the services sector.
As in the euro area, EU managers reported broadly unchanged employment expectations in industry and markedly
lower expectations in services. Contrary to the euro area, employment expectations worsened also in the retail trade sector and remained broadly stable in construction. Price expectations were up across all business sectors in
the EU. As in the euro area, EU consumers' prices expectations increased markedly as well.
1 Business confidence indices for France were revised compared to the August press release; the net effect is a downward revision of the ESI for
August of 0.1 points in the EU (to 112.2).
Page 2
2
-40
-35
-30
-25
-20
-15
-10
-5
0
5
10
2006 2008 2010 2012 2014 2016 2018
Bal
ance
s, %
Graph 2: Industrial confidence indicator
EA
EU
EA long-term av erage
-40
-30
-20
-10
0
10
20
2006 2008 2010 2012 2014 2016 2018
Bal
ance
s, %
Graph 3: Services confidence indicator
EA
EUEA long-term av erage
-35
-30
-25
-20
-15
-10
-5
0
5
2006 2008 2010 2012 2014 2016 2018
Bal
ance
s, %
Graph 4: Consumer confidence indicator
EA
EU
EA long-term av erage
-30
-25
-20
-15
-10
-5
0
5
10
2006 2008 2010 2012 2014 2016 2018
Bal
ance
s, %
Graph 5: Retail trade confidence indicator
EA
EUEA long-term av erage
-40
-35
-30
-25
-20
-15
-10
-5
0
5
10
2006 2008 2010 2012 2014 2016 2018
Bal
ance
s, %
Graph 6: Construction confidence indicator
EA
EU
EA long-term av erage
-25
-15
-5
5
15
25
35
45
2006 2008 2010 2012 2014 2016 2018
Bal
ance
s, %
Graph 7: Financial services confidence indicator
EA
EU
EA av erage
-40
-30
-20
-10
0
10
20
30
40
2006 2008 2010 2012 2014 2016 2018
Bal
ance
s, %
Graph 8: Price expectations in the EA
IndustryConsumersConstruction
-10
0
10
20
30
40
50
60
70
80-50
-40
-30
-20
-10
0
10
20
2006 2008 2010 2012 2014 2016 2018
Balances, %
(inverted scale)
Bal
ance
s, %
Graph 9: Employment and unemployment in the EA
Industry
Services
Consumers (1)
(1) Unemployment expectations (right-hand scale)
Page 3
3
TABLE 1*: Indicators of confidence and economic sentiment (s.a.)
2017 2018
Date Value Date Value Oct Nov Dec Jan Feb Mar Apr May Jun Jul Aug Sep
EU 1. Industry 03-09 -38.3 -6.1 01-18 9.2 8.1 8.6 9.1 9.2 7.9 6.0 6.7 6.4 6.5 5.8 5.7 4.5
2. Services 03-09 -29.8 9.3 06-98 33.6 13.8 12.1 15.0 14.6 16.1 14.2 12.7 13.3 12.3 13.1 12.4 13.1
3. Consumer 03-09 -32.5 -11.1 08-00 1.4 -1.7 -0.7 -0.6 0.4 -0.3 -0.3 -0.5 -0.1 -1.3 -0.7 -1.8 -2.8
4. Retail trade 12-08 -26.7 -6.3 10-15 9.1 3.1 5.3 5.1 3.3 4.5 2.8 0.1 1.9 3.2 2.0 5.0 4.4
5. Construction 06-93 -44.2 -18.1 09-18 5.3 1.9 0.8 2.2 1.8 2.4 3.0 3.5 4.8 4.2 3.5 4.3 5.3
= 6. ESI 03-09 66.1 100.0 05-00 116.7 113.5 113.8 115.0 114.8 114.4 112.7 112.4 112.8 112.2 112.3 112.2 111.3
7. Financial services (n) 01-09 -20.0 14.4 04-06 43.3 19.3 19.2 22.8 27.7 25.9 21.3 20.9 17.8 19.0 20.6 16.9 14.2
EA 1. Industry 03-09 -38.0 -6.0 01-18 9.7 8.4 8.9 9.5 9.7 8.8 7.0 7.3 6.9 6.9 5.8 5.6 4.7
2. Services 03-09 -25.1 9.9 06-98 35.1 15.7 15.8 16.9 15.9 16.9 16.0 14.7 14.4 14.4 15.3 14.4 14.6
3. Consumer 03-09 -34.7 -12.1 05-00 2.0 -1.1 0.0 0.5 1.4 0.1 0.1 0.3 0.2 -0.6 -0.5 -1.9 -2.9
4. Retail trade 02-93 -28.4 -9.0 10-15 5.7 3.8 3.2 4.8 4.1 3.5 0.8 -0.7 0.7 0.7 0.3 1.9 2.7
5. Construction 09-93 -45.4 -17.4 09-18 8.3 0.1 1.7 3.2 4.7 4.2 5.2 4.6 7.1 5.6 5.4 6.4 8.3
= 6. ESI 03-09 68.5 100.0 05-00 118.3 113.4 114.2 115.2 114.9 114.3 112.8 112.7 112.5 112.3 112.1 111.6 110.9
7. Financial services (n) 01-09 -21.8 12.6 04-06 42.6 18.9 20.2 23.2 26.6 26.2 20.8 21.1 17.3 18.9 19.1 18.6 12.6
BE 1. Industry 03-09 -33.8 -8.9 06-07 6.9 -1.7 0.2 -2.8 1.2 1.3 -1.0 -1.9 -1.0 -1.6 -2.3 0.8 1.6
2. Services 04-09 -42.9 12.2 08-07 32.2 11.0 13.3 17.8 12.9 18.3 16.9 23.1 12.6 17.1 8.7 13.4 15.0
3. Consumer 02-09 -26.5 -6.5 12-00 16.2 3.9 3.0 1.8 4.0 -0.3 3.4 3.5 0.7 -1.6 0.2 -0.6 0.6
4. Retail trade 01-09 -27.9 -4.5 10-10 13.7 -7.4 -5.6 -10.4 -9.1 -9.6 -4.4 -7.2 -9.1 -9.7 -14.9 -6.4 -5.7
5. Construction 11-95 -35.1 -10.1 02-90 9.7 -6.7 -5.2 -4.3 -1.3 -5.3 -2.1 1.4 1.3 0.0 2.0 1.6 1.9
= 6. ESI 03-09 68.2 100.0 06-07 117.2 105.4 107.3 106.6 107.1 107.2 108.0 108.9 105.9 106.0 103.5 107.2 108.6
BG 1. Industry 06-93 -32.1 -5.2 01-08 12.3 3.9 3.4 1.4 4.4 3.8 3.8 3.3 3.9 0.7 -0.3 0.0 -0.3
2. Services 06-10 -13.6 10.5 03-07 33.4 14.5 15.1 12.8 16.4 15.8 15.8 20.5 18.9 18.6 16.6 21.8 18.4
3. Consumer 04-09 -50.1 -32.5 08-01 -13.0 -23.5 -22.4 -23.6 -22.4 -21.6 -22.2 -22.9 -22.1 -22.5 -23.1 -24.9 -24.4
4. Retail trade 07-09 -14.8 14.6 08-94 31.8 18.3 17.0 19.3 23.1 21.0 18.5 16.5 17.6 17.9 18.8 15.2 15.8
5. Construction 10-09 -56.0 -24.2 11-07 23.9 -13.2 -11.1 -10.3 -5.7 -4.8 -9.8 -10.1 -9.7 -10.1 -10.3 -9.0 -9.6
= 6. ESI 05-93 69.5 100.0 02-07 120.4 109.9 110.2 108.1 111.6 111.1 110.5 111.7 111.7 110.0 108.3 110.0 108.7
CZ 1. Industry 02-09 -35.6 2.3 06-00 29.8 7.4 6.0 4.5 2.8 2.7 5.1 4.5 3.4 3.8 0.0 0.0 1.3
2. Services 09-09 6.4 33.7 02-07 52.6 35.6 35.5 36.2 36.7 38.6 36.1 37.7 37.1 37.3 37.5 38.1 39.0
3. Consumer 03-98 -35.8 -9.7 05-18 11.9 4.9 7.3 7.0 11.3 10.8 11.1 10.9 11.9 11.0 9.2 6.8 8.1
4. Retail trade 02-99 -1.3 15.3 11-07 29.5 20.6 21.4 20.9 23.1 25.0 23.7 25.4 23.9 23.1 20.7 18.4 23.0
5. Construction 02-99 -54.9 -20.4 01-05 5.3 -17.4 -15.4 -13.2 -14.4 -8.4 -5.9 -5.3 -6.4 -5.4 -4.9 -3.2 -2.7
= 6. ESI 01-99 75.6 100.0 02-07 117.4 108.3 108.2 108.0 109.1 109.8 109.9 110.3 109.9 109.8 107.9 107.3 109.1
DK 1. Industry 02-09 -34.5 -1.3 09-94 16.7 4.0 3.2 6.2 -1.3 1.2 -2.4 0.2 4.9 0.2 3.3 3.9 -1.2
2. Services 02-13 -10.1 6.3 05-10 28.6 8.7 13.5 14.5 11.7 16.7 15.0 10.6 10.2 9.5 10.4 10.9 10.3
3. Consumer 10-90 -11.8 8.7 03-15 21.9 14.9 16.4 16.1 16.6 16.8 16.0 14.0 15.9 16.0 16.9 14.2 16.0
4. Retail trade 11-11 -11.4 6.4 04-15 17.0 8.4 9.0 7.4 13.9 3.4 7.2 7.8 5.7 10.7 7.8 4.7 12.0
5. Construction 10-09 -50.0 -9.5 11-06 24.2 -1.6 -2.3 -2.1 0.5 -0.3 -1.9 -2.7 -0.1 -1.8 -0.1 -0.9 -0.5
= 6. ESI 02-09 67.2 100.0 05-10 120.4 107.7 110.3 112.7 106.8 111.3 107.5 106.3 109.3 107.0 109.7 108.6 106.6
DE 1. Industry 03-09 -42.2 -6.8 02-11 16.4 14.6 14.4 15.5 16.4 14.2 11.9 12.5 12.1 12.2 10.3 10.8 10.0
2. Services 12-02 -19.9 18.2 03-99 50.1 19.5 20.6 21.3 22.5 22.2 19.7 17.7 18.5 16.5 23.7 22.2 22.3
3. Consumer 04-09 -32.9 -7.3 11-10 10.9 5.2 5.3 6.1 7.4 6.5 6.1 6.1 5.9 4.6 4.5 4.4 4.5
4. Retail trade 12-02 -41.2 -15.1 12-90 22.3 -2.3 -2.2 0.0 -1.0 -1.1 -6.0 -6.4 -2.3 -5.9 -6.6 -4.6 -2.2
5. Construction 12-02 -55.7 -24.6 07-18 19.0 11.5 13.5 14.2 15.3 15.6 15.6 16.0 16.6 15.0 19.0 17.6 18.0
= 6. ESI 03-09 71.9 100.0 08-90 118.3 113.7 114.2 115.2 116.0 114.8 112.7 112.6 112.7 111.9 112.8 112.7 112.5
EE 1. Industry 03-09 -39.1 2.8 12-06 28.5 8.5 10.0 10.5 8.3 7.9 7.8 7.4 5.9 6.1 6.3 5.0 6.9
2. Services 02-09 -50.3 9.7 01-06 38.3 13.1 17.0 20.4 20.5 15.8 16.3 10.0 7.0 8.3 14.5 9.5 6.8
3. Consumer 04-93 -56.3 -14.6 04-06 12.8 -0.3 -0.9 -4.1 -6.8 -5.8 -0.6 -1.9 0.0 -0.4 -1.5 -2.4 0.1
4. Retail trade 06-09 -45.6 8.3 04-07 35.6 14.1 8.3 9.8 15.2 13.3 5.3 8.5 7.7 7.6 8.1 10.8 14.3
5. Construction 04-09 -76.0 -1.2 05-06 48.8 9.7 13.0 10.5 13.0 6.2 8.8 6.5 3.0 11.5 12.3 9.5 12.5
= 6. ESI 03-09 66.1 100.0 09-06 118.8 106.5 107.9 108.5 107.3 106.1 106.7 105.0 104.2 104.9 106.1 104.2 105.1
IE (a)
1. Industry : : : : : : : : : : : : : : : : :
2. Services : : : : : : : : : : : : : : : : :
3. Consumer 03-09 -59.8 -8.9 01-00 21.2 12.5 11.5 11.4 12.1 12.3 13.6 13.1 14.4 10.6 12.9 8.9 :
4. Retail trade : : : : : : : : : : : : : : : : :
5. Construction : : : : : : : : : : : : : : : : :
= 6. ESI : : : : : : : : : : : : : : : : :
EL 1. Industry 03-09 -36.6 -4.4 03-00 13.3 -4.7 -3.9 0.2 1.2 4.2 -3.3 -1.2 -1.5 -1.6 5.4 6.3 0.3
2. Services 10-12 -46.0 8.5 08-00 58.7 14.4 13.6 13.4 8.9 18.9 17.7 23.6 25.1 21.0 15.9 11.9 10.5
3. Consumer 10-11 -83.8 -41.3 04-00 -5.8 -54.0 -53.8 -50.3 -51.0 -53.0 -52.8 -48.8 -51.0 -52.4 -49.9 -47.8 -44.9
4. Retail trade 10-12 -48.4 -1.8 07-07 39.0 2.0 2.3 -0.4 1.8 2.8 2.2 10.4 6.4 2.6 14.9 19.7 21.0
5. Construction 08-11 -77.4 -23.9 04-00 32.5 -44.7 -59.3 -58.3 -50.4 -45.1 -55.0 -54.7 -39.0 -47.8 -45.8 -45.1 -54.5
= 6. ESI 03-09 74.9 100.0 07-00 120.5 98.5 98.6 101.3 101.9 104.3 99.8 103.6 104.2 102.5 105.3 105.2 101.3
ES 1. Industry 01-93 -43.2 -8.9 06-98 7.4 2.5 5.5 4.8 4.2 2.4 1.9 3.3 0.8 -0.5 -1.3 -3.5 -3.0
2. Services 01-09 -38.7 11.3 06-98 54.0 26.4 20.7 19.8 20.1 23.8 26.6 22.5 24.5 23.6 23.3 22.2 19.3
3. Consumer 02-09 -47.6 -12.7 12-15 5.4 -1.4 -1.7 -1.5 1.3 0.4 -3.5 -0.7 0.5 1.8 0.6 -2.5 -8.0
4. Retail trade 02-93 -36.0 -6.9 12-15 17.0 10.6 10.0 10.5 11.3 13.0 10.8 10.9 8.8 11.4 11.0 11.0 9.2
5. Construction 08-13 -69.3 -13.9 12-98 39.5 -14.0 -14.5 -18.7 -3.0 -4.7 -5.2 -12.3 1.5 -1.4 -17.3 -10.2 2.5
= 6. ESI 01-93 71.1 100.0 06-98 116.3 109.9 110.5 110.0 110.9 110.2 109.0 110.6 109.4 109.4 107.7 107.0 105.5
FR 1. Industry 07-93 -39.4 -7.5 06-00 14.7 3.8 3.7 4.7 5.5 3.7 1.8 4.2 3.5 5.8 4.0 3.0 0.3
2. Services 04-09 -28.8 -0.3 01-90 16.2 5.6 7.1 10.2 7.6 6.8 6.7 5.9 3.2 4.6 4.5 2.9 3.2
3. Consumer 03-09 -37.0 -17.8 01-01 3.3 -9.5 -3.4 -3.9 -4.0 -7.1 -5.9 -6.7 -5.3 -9.5 -8.3 -10.6 -13.4
4. Retail trade 04-97 -27.2 -8.1 12-07 8.8 -0.4 -0.6 0.9 -0.6 -0.2 -5.1 -4.1 -4.7 -3.1 -1.1 -0.5 -0.6
5. Construction 01-93 -62.3 -15.1 10-00 44.9 0.6 0.5 5.7 4.4 3.4 5.9 4.9 5.0 6.4 8.2 8.4 9.3
= 6. ESI 03-09 73.1 100.0 10-00 118.7 109.8 111.6 113.9 112.4 109.9 109.2 110.2 108.6 109.6 109.5 108.0 106.3
HR 1. Industry 04-09 -28.6 -4.8 02-18 17.7 10.5 10.4 8.4 15.9 17.7 11.4 9.5 10.3 12.1 10.7 8.1 13.3
2. Services 07-09 -31.6 3.3 09-16 25.9 19.6 20.9 24.6 23.7 19.3 19.2 20.8 24.5 17.1 13.9 16.1 16.6
3. Consumer 08-09 -51.5 -28.9 05-18 -6.3 -17.2 -16.4 -13.8 -12.4 -8.7 -12.3 -11.0 -6.3 -10.5 -8.5 -9.0 -12.1
4. Retail trade 08-09 -31.0 -4.2 06-18 19.4 13.4 13.7 13.2 12.1 15.4 11.4 19.4 17.8 19.4 14.8 11.0 9.4
5. Construction 03-10 -49.2 -22.2 09-18 13.9 3.8 4.9 5.1 5.4 7.6 6.9 8.4 12.6 13.9 11.0 11.7 13.9
= 6. ESI 08-09 76.1 100.0 02-18 118.8 114.0 114.6 115.5 118.5 118.8 114.8 115.6 118.0 116.5 114.4 114.5 115.8
Ave.Min. Max.
Since 1990 (*)
Page 4
4
TABLE 1* (continued) : Indicators of confidence and economic sentiment (s.a.)
Since 1990 (*) 2017 2018
Min. Max.
Date Value Date Value Oct Nov Dec Jan Feb Mar Apr May Jun Jul Aug Sep
IT 1. Industry 03-09 -34.4 -4.3 02-95 14.2 5.6 5.4 5.4 5.0 5.6 3.9 2.8 2.8 1.8 1.8 0.7 0.9
2. Services 09-12 -24.3 4.3 04-00 33.1 12.5 13.6 13.3 9.8 12.9 10.1 9.8 9.6 11.9 9.0 9.1 9.5
3. Consumer 06-12 -41.5 -15.5 06-01 2.5 -7.0 -7.8 -6.4 -6.1 -6.4 -5.6 -5.1 -7.2 -3.2 -4.3 -6.6 -6.1
4. Retail trade 04-99 -65.4 -11.1 10-15 17.4 14.3 11.7 14.0 13.0 8.7 8.9 2.1 4.3 7.2 4.8 7.2 7.1
5. Construction 09-93 -75.4 -22.3 04-90 13.4 -15.3 -13.3 -13.4 -13.3 -12.1 -11.6 -10.8 -10.8 -12.7 -9.9 -8.8 -11.1
= 6. ESI 03-09 73.2 100.0 05-00 120.7 111.7 111.8 111.8 110.1 111.6 109.8 109.4 108.4 109.6 109.0 108.2 108.0
CY 1. Industry 04-13 -37.4 -2.7 04-08 19.9 7.9 8.7 8.7 10.7 10.8 5.5 7.1 4.1 -3.0 0.7 3.4 10.8
2. Services 04-13 -59.0 3.8 01-18 45.3 37.5 45.2 36.5 45.3 40.1 36.4 40.5 32.6 16.3 25.1 23.4 31.6
3. Consumer 04-13 -64.4 -29.2 02-18 5.0 -0.9 2.2 -1.2 0.8 5.0 2.2 4.4 2.9 -2.6 -10.6 -6.7 -5.6
4. Retail trade 04-13 -48.9 -7.3 05-07 20.6 7.5 6.4 10.0 8.0 8.6 12.6 8.3 9.6 5.8 4.6 9.6 0.4
5. Construction 04-13 -72.7 -24.8 12-03 36.5 -28.3 -22.9 -24.3 -22.8 -18.8 -15.6 -16.7 -13.1 -14.5 -10.8 -10.9 -23.1
= 6. ESI 04-13 67.8 100.0 02-18 117.8 116.0 116.7 115.7 117.8 117.8 114.8 116.6 113.6 107.8 109.2 109.9 114.7
LV 1. Industry 04-93 -44.0 -7.3 02-07 11.8 2.7 1.7 2.6 3.0 1.8 1.6 0.8 0.8 0.8 1.5 2.4 0.9
2. Services 03-09 -43.9 4.4 12-06 20.9 7.6 8.1 8.6 7.5 6.1 3.8 1.1 2.7 4.0 3.1 4.0 5.8
3. Consumer 07-09 -54.9 -15.9 09-06 1.0 -8.8 -9.4 -8.4 -1.0 -8.9 -9.3 -8.7 -6.7 -9.7 -9.0 -7.2 -5.4
4. Retail trade 02-09 -35.2 6.4 04-07 22.8 4.9 3.5 5.7 7.9 9.0 5.7 7.1 8.4 8.8 9.1 6.7 6.1
5. Construction 07-09 -79.4 -24.3 01-07 19.2 -7.4 -5.1 -0.6 -1.7 -1.2 -3.5 -2.8 -1.2 -0.5 -1.1 -0.6 0.7
= 6. ESI 04-93 68.7 100.0 02-07 115.2 107.5 107.3 108.1 109.2 107.0 105.8 105.1 106.0 105.9 105.9 106.9 107.2
LT 1. Industry 04-09 -41.4 -10.6 08-07 9.8 -2.3 -1.1 -1.8 -3.3 -5.6 -4.5 -1.0 -1.6 1.6 1.1 -0.8 -2.3
2. Services 03-09 -47.2 8.7 07-06 34.3 18.2 14.8 22.7 21.1 29.5 24.0 26.6 29.3 30.5 29.1 29.5 30.4
3. Consumer 01-09 -56.1 -14.4 05-07 9.2 -9.2 -9.9 -8.4 -9.7 -7.9 -7.9 -5.3 -3.3 -5.2 -2.9 -2.5 -1.1
4. Retail trade 04-09 -57.8 -0.7 01-07 41.7 4.8 5.9 7.0 7.8 8.7 7.7 8.2 7.5 6.9 9.3 9.9 11.2
5. Construction 05-09 -92.9 -32.1 01-07 13.4 -23.2 -12.7 -14.3 -15.1 -11.5 -8.7 -9.0 -12.1 -11.2 -9.0 -13.2 -12.4
= 6. ESI 04-09 66.7 100.0 07-06 118.6 109.0 108.5 110.7 109.3 111.0 110.1 112.7 113.4 114.5 114.8 114.0 113.9
LU 1. Industry 03-09 -53.9 -15.1 04-95 24.1 -0.7 -4.7 -0.9 -4.4 -5.4 -7.9 -8.3 -6.8 -6.3 -4.0 -11.1 -7.8
2. Services : : : : : : : : : : : : : : : : :
3. Consumer 12-08 -20.7 1.3 01-18 19.1 17.3 17.4 14.0 19.1 17.3 14.0 14.3 14.6 14.3 17.2 13.6 14.8
4. Retail trade : : : : : : : : : : : : : : : : :
5. Construction 03-94 -70.9 -18.3 09-17 40.8 15.9 12.5 8.1 17.6 20.9 19.0 15.2 16.0 16.1 16.2 16.8 17.8
= 6. ESI 03-09 74.2 100.0 04-95 123.4 114.7 113.6 112.5 113.4 111.9 109.1 108.9 110.1 111.0 113.6 107.7 110.4
HU 1. Industry 03-09 -34.7 -2.2 07-18 17.1 9.2 9.1 10.2 11.1 14.0 12.3 10.1 15.1 15.4 17.1 12.6 7.8
2. Services 03-09 -44.2 -4.9 04-18 17.9 13.9 16.5 15.7 16.3 16.0 10.9 17.9 8.6 13.2 17.7 11.8 9.6
3. Consumer 04-09 -68.8 -30.5 08-02 0.2 -13.1 -12.9 -7.7 -8.7 -7.5 -5.8 -3.8 -6.9 -5.6 -8.5 -12.0 -8.4
4. Retail trade 03-09 -41.1 -6.2 01-14 14.1 10.2 12.1 14.1 9.1 13.5 10.6 8.2 7.6 10.4 8.5 11.6 14.0
5. Construction 04-09 -56.0 -15.5 08-18 32.0 15.8 17.0 25.1 25.1 22.9 20.7 21.7 28.0 29.0 30.6 32.0 25.9
= 6. ESI 03-09 67.3 100.0 07-18 124.6 118.1 119.4 120.8 120.9 121.9 120.6 120.9 120.7 123.0 124.6 119.7 116.6
MT 1. Industry 03-09 -31.6 -3.0 03-08 18.8 5.6 14.1 13.0 16.0 13.9 11.0 -4.4 5.0 10.7 15.3 12.8 5.0
2. Services 03-09 -22.0 22.8 05-07 65.2 33.6 31.0 44.7 37.6 29.8 32.7 29.4 40.2 30.2 31.6 36.1 42.2
3. Consumer 04-11 -41.3 -16.4 02-18 27.4 11.3 16.5 22.5 24.5 27.4 25.6 22.7 21.9 23.2 23.4 22.7 23.6
4. Retail trade 06-12 -19.6 2.6 10-15 27.3 16.4 27.0 18.9 16.0 23.3 5.7 1.4 9.6 -0.3 12.3 11.1 17.1
5. Construction 03-09 -53.4 -16.0 05-18 37.9 26.4 21.0 33.4 27.4 28.8 26.2 25.0 37.9 25.3 29.1 21.5 11.8
= 6. ESI 03-09 71.6 100.0 12-17 124.7 116.0 119.9 124.7 123.1 121.2 119.4 111.3 119.4 117.9 121.4 120.7 119.7
NL 1. Industry 02-09 -25.4 -2.2 02-18 8.1 5.2 6.7 6.7 7.2 8.1 7.0 5.8 7.0 5.5 4.3 4.7 4.0
2. Services 03-09 -41.6 6.8 04-07 46.5 14.0 14.5 14.4 15.3 16.0 16.0 14.6 16.7 15.9 16.3 14.1 15.3
3. Consumer 02-13 -30.6 0.7 04-00 22.9 18.0 16.7 18.3 19.0 18.6 19.4 17.9 16.5 17.1 17.4 16.2 15.4
4. Retail trade 06-09 -16.9 10.8 10-99 33.3 13.7 6.1 11.8 13.4 10.6 9.8 5.3 6.4 6.5 6.1 6.7 9.7
5. Construction 12-12 -47.7 -4.0 12-17 41.8 22.4 31.9 41.8 33.6 30.0 36.0 35.1 38.2 31.4 34.0 32.5 35.1
= 6. ESI 03-09 65.5 100.0 03-07 117.6 110.6 111.3 112.0 112.9 113.3 112.8 110.5 111.7 109.9 109.9 109.4 109.5
AT 1. Industry 03-09 -37.8 -4.4 02-07 15.2 8.6 12.4 13.2 10.1 12.6 12.2 11.5 10.8 9.5 6.4 8.4 7.5
2. Services 04-09 -24.9 15.1 06-98 33.4 32.3 26.8 32.6 31.7 30.9 29.5 27.2 24.2 27.4 24.7 25.2 27.9
3. Consumer 04-09 -23.0 -1.8 06-07 16.3 8.8 10.2 11.8 11.7 12.5 12.5 12.9 11.2 9.2 8.7 8.1 9.9
4. Retail trade 03-09 -26.4 -7.5 05-10 13.2 -6.6 -8.1 1.5 -4.9 -10.2 -6.3 -9.9 -9.5 -8.1 -14.5 -12.6 -9.8
5. Construction 04-96 -56.4 -15.4 09-18 19.6 10.4 15.4 13.4 9.6 8.8 10.8 11.0 10.0 8.1 17.6 15.4 19.6
= 6. ESI 04-09 68.9 100.0 03-90 119.4 115.4 115.9 119.3 116.1 117.8 117.3 115.6 113.8 113.7 111.7 112.7 113.2
PL 1. Industry 03-09 -29.1 -13.4 06-07 -0.5 -6.6 -6.3 -5.6 -2.1 -2.8 -3.7 -5.0 -3.9 -3.1 -2.9 -4.1 -5.8
2. Services 03-09 -12.0 3.5 07-07 22.7 2.5 2.6 3.0 8.4 8.9 7.6 7.4 6.8 6.5 6.4 6.1 5.4
3. Consumer 08-01 -40.1 -19.0 05-18 2.0 -4.8 -2.8 -1.1 0.6 1.3 -0.2 1.7 2.0 1.5 1.5 -0.4 -0.9
4. Retail trade 03-03 -16.8 -2.2 12-07 11.9 6.6 6.5 9.9 9.2 9.8 7.5 5.4 5.0 5.7 5.8 4.9 6.4
5. Construction 02-02 -67.9 -31.6 02-08 -0.7 -13.2 -11.9 -8.7 -7.0 -6.0 -6.9 -7.3 -7.1 -7.3 -8.4 -8.7 -8.3
= 6. ESI 03-09 75.9 100.0 05-96 124.6 104.8 105.5 106.7 111.7 112.0 110.0 109.3 109.9 109.9 110.2 108.9 107.7
PT 1. Industry 04-09 -33.4 -5.9 03-98 8.4 4.2 3.3 4.1 3.3 2.6 2.2 -0.1 -0.3 0.9 0.6 1.5 -1.1
2. Services 10-12 -31.5 1.3 06-01 24.6 14.6 17.2 15.3 15.9 15.0 12.4 9.8 14.0 18.2 17.5 15.1 16.8
3. Consumer 10-12 -53.7 -21.3 10-17 4.6 4.6 4.2 1.4 0.5 1.8 2.8 3.1 4.3 2.2 -0.4 -0.6 -1.2
4. Retail trade 12-08 -32.1 -3.3 03-99 12.8 2.8 2.8 3.4 4.2 2.6 2.3 2.2 2.6 1.8 1.4 1.3 1.1
5. Construction 10-12 -70.2 -29.9 12-97 1.9 -19.0 -17.6 -17.2 -15.5 -15.4 -13.4 -9.2 -10.5 -7.5 -9.9 -12.9 -12.4
= 6. ESI 04-09 73.9 100.0 03-98 116.4 114.9 115.1 114.5 113.8 113.7 112.7 110.8 112.2 114.3 113.6 113.2 112.1
RO 1. Industry 09-92 -22.2 -1.8 06-96 27.3 2.6 2.7 3.4 2.7 1.6 0.6 0.0 0.2 1.0 0.7 0.8 1.6
2. Services 06-09 -19.3 11.8 06-04 56.2 12.0 9.6 11.0 10.7 11.3 9.2 6.1 10.2 11.4 4.4 5.1 4.8
3. Consumer 06-10 -63.3 -27.6 03-17 -10.4 -20.7 -22.2 -25.1 -26.4 -26.5 -24.5 -23.2 -24.3 -26.1 -22.4 -21.3 -19.9
4. Retail trade 07-09 -21.6 10.8 12-97 35.8 10.4 8.4 13.5 16.7 12.1 7.9 6.5 9.6 3.4 6.2 3.6 16.2
5. Construction 09-99 -60.4 -14.3 06-96 34.6 -14.1 -13.4 -12.3 -9.5 -14.9 -14.1 -15.2 -13.9 -12.3 -11.7 -9.4 -8.4
= 6. ESI 09-92 68.5 100.0 06-96 125.7 104.3 103.5 103.8 103.3 102.2 101.4 100.6 101.8 101.5 100.5 101.4 102.7
SI 1. Industry 01-09 -38.0 -1.3 06-00 17.8 12.3 13.9 14.1 13.5 12.5 10.0 9.3 9.7 9.8 6.2 7.0 4.5
2. Services 04-09 -28.9 14.5 09-02 38.0 26.9 28.4 29.4 25.9 24.7 22.8 24.4 24.8 24.4 24.2 24.8 25.4
3. Consumer 09-12 -46.1 -18.8 04-18 2.1 -0.6 0.6 0.5 2.0 1.6 0.8 2.1 1.0 0.9 -0.8 -4.5 -8.9
4. Retail trade 03-09 -21.6 11.9 09-07 38.2 27.4 30.7 22.2 28.5 20.1 9.3 15.7 5.6 21.5 10.9 10.6 11.7
5. Construction 03-10 -63.9 -9.6 03-07 27.8 23.1 15.1 21.0 23.9 24.5 24.8 27.3 26.0 27.4 23.4 22.1 17.6
= 6. ESI 04-09 67.6 100.0 07-07 119.7 116.6 117.5 117.2 117.1 115.2 113.3 114.6 113.6 113.6 111.6 111.2 108.4
Ave.
Page 5
5
TABLE 1* (continued) : Indicators of confidence and economic sentiment (s.a.)
Since 1990 (*) 2017 2018
Min. Max.
Date Value Date Value Oct Nov Dec Jan Feb Mar Apr May Jun Jul Aug Sep
SK 1. Industry 04-09 -31.8 3.1 05-96 25.8 8.7 2.3 6.9 -4.3 8.7 8.0 6.2 2.5 1.2 1.4 0.1 2.6
2. Services 05-09 -24.0 23.1 03-02 62.6 11.0 6.2 -0.6 4.2 7.3 8.0 8.7 7.7 5.4 2.4 -5.1 -8.8
3. Consumer 09-99 -49.0 -20.8 12-06 6.6 -4.8 -4.6 -5.7 -3.0 -3.8 -5.5 -7.1 -3.0 -3.4 -3.9 -3.9 -4.3
4. Retail trade 03-09 -22.7 9.9 11-98 34.4 18.8 21.5 19.8 24.3 24.0 22.0 24.8 26.5 27.2 23.1 20.2 25.5
5. Construction 07-99 -86.1 -25.2 03-97 17.5 0.5 -2.9 -1.5 -2.7 -1.7 -5.5 -1.3 -3.1 0.5 -2.5 -2.6 -11.4
= 6. ESI 04-09 63.9 100.0 05-96 123.5 106.2 101.8 101.8 99.2 105.7 104.7 103.5 102.6 101.7 100.5 97.7 97.3
FI 1. Industry 03-09 -37.3 1.4 10-94 31.3 12.8 14.3 18.2 15.9 14.1 11.3 12.7 12.0 15.0 17.7 14.5 11.1
2. Services 12-01 -47.6 14.5 09-00 51.1 26.3 24.6 21.1 22.2 27.9 29.8 22.0 23.7 16.9 17.7 17.7 23.4
3. Consumer 12-08 -6.4 13.9 10-17 27.2 27.2 25.8 26.9 26.1 26.8 25.1 25.5 25.2 23.6 23.9 22.9 23.2
4. Retail trade 02-15 -30.0 -1.2 02-18 26.2 5.7 21.7 12.1 10.7 26.2 12.8 6.0 19.1 15.4 14.9 15.0 16.0
5. Construction 09-91 -108.6 -17.5 06-98 36.5 4.5 9.6 8.4 2.3 4.0 1.5 8.4 5.9 6.7 -2.9 13.1 14.5
= 6. ESI 04-91 72.2 100.0 11-94 121.9 111.9 112.0 113.4 112.1 113.3 112.0 110.6 111.0 109.9 111.3 109.9 110.2
SE 1. Industry 03-09 -38.5 -2.6 08-18 20.6 19.0 20.2 15.5 13.5 14.7 16.7 19.9 18.1 15.1 18.1 20.6 15.4
2. Services 04-09 -26.3 20.6 02-11 53.0 27.8 27.9 30.7 28.0 28.2 24.4 24.5 22.7 27.1 26.0 23.5 28.3
3. Consumer 12-08 -10.0 10.4 09-10 28.0 16.1 17.2 16.7 16.3 14.6 13.6 15.0 13.6 13.6 11.6 14.4 15.6
4. Retail trade 01-09 -38.3 11.5 01-10 47.6 15.5 16.5 19.3 17.8 20.2 17.6 13.1 16.3 18.8 11.4 14.4 17.9
5. Construction 12-93 -82.9 -19.0 08-07 47.6 35.5 29.0 28.7 30.0 27.4 26.3 28.6 22.0 23.1 19.1 22.8 15.8
= 6. ESI 04-09 76.6 100.0 01-11 117.6 113.0 113.3 111.8 110.8 111.1 110.6 112.2 111.3 111.1 110.9 112.0 111.1
UK 1. Industry 03-09 -49.0 -7.8 07-17 16.2 10.5 11.5 13.2 13.0 6.4 0.1 5.1 3.6 5.9 7.0 7.6 5.4
2. Services 03-09 -57.4 4.6 10-97 36.1 4.8 -6.0 5.7 7.1 10.9 5.2 1.9 7.5 0.9 2.1 2.5 4.9
3. Consumer 01-09 -35.2 -8.4 05-14 7.6 -5.5 -5.2 -7.0 -4.8 -4.1 -3.4 -5.9 -3.0 -7.0 -2.9 -3.6 -5.8
4. Retail trade 01-09 -47.1 1.4 09-15 26.7 -5.0 9.8 0.6 -7.5 2.8 4.9 -4.0 0.2 7.6 4.0 14.5 5.0
5. Construction 06-91 -79.3 -19.9 10-17 10.7 10.7 -1.9 -1.0 -11.1 -4.7 -5.1 0.5 -2.0 0.5 -1.9 -2.4 -2.6
= 6. ESI 03-09 63.3 100.0 06-14 118.8 109.8 108.2 111.8 111.1 109.5 105.3 105.5 107.4 106.9 108.5 110.0 108.4
Ave.
In the tables: (s.a.) = seasonally adjusted, (n) = not seasonally adjusted, : = not available.
(*) Minimum, maximum and averages are calculated over the period of availability which is not necessarily as from 01/1990.
The economic sentiment indicator is composed of the industrial confidence indicator (40%), the service confidence indicator (30%), the consumer confidence indicator (20%), the construction
confidence indicator (5%), and the retail trade confidence indicator (5%). Its long term average (1990-2017) equals 100. The reported ESI average is based on this standardisation sample. All
confidence indicators are balances.
The country weights have been updated in January 2018.
(a) Business surveys for Ireland have been temporarily discontinued as from 05/2008.
Page 6
6
TABLE 2: Monthly survey of manufacturing industry (s.a.)
Since 1990 (*) 2017 2018
Date Value Date Value Oct Nov Dec Jan Feb Mar Apr May Jun Jul Aug Sep
INDUSTRIAL EU 03-09 -38.3 -6.1 01-18 9.2 8.1 8.6 9.1 9.2 7.9 6.0 6.7 6.4 6.5 5.8 5.7 4.5CONFIDENCE EA 03-09 -38.0 -6.0 01-18 9.7 8.4 8.9 9.5 9.7 8.8 7.0 7.3 6.9 6.9 5.8 5.6 4.7
INDICATOR (a)
BE 03-09 -33.8 -8.9 06-07 6.9 -1.7 0.2 -2.8 1.2 1.3 -1.0 -1.9 -1.0 -1.6 -2.3 0.8 1.6
BG 06-93 -32.1 -5.2 01-08 12.3 3.9 3.4 1.4 4.4 3.8 3.8 3.3 3.9 0.7 -0.3 0.0 -0.3
CZ 02-09 -35.6 2.3 06-00 29.8 7.4 6.0 4.5 2.8 2.7 5.1 4.5 3.4 3.8 0.0 0.0 1.3
DK 02-09 -34.5 -1.3 09-94 16.7 4.0 3.2 6.2 -1.3 1.2 -2.4 0.2 4.9 0.2 3.3 3.9 -1.2
DE 03-09 -42.2 -6.8 02-11 16.4 14.6 14.4 15.5 16.4 14.2 11.9 12.5 12.1 12.2 10.3 10.8 10.0
EE 03-09 -39.1 2.8 12-06 28.5 8.5 10.0 10.5 8.3 7.9 7.8 7.4 5.9 6.1 6.3 5.0 6.9
IE : : : : : : : : : : : : : : : : :
EL 03-09 -36.6 -4.4 03-00 13.3 -4.7 -3.9 0.2 1.2 4.2 -3.3 -1.2 -1.5 -1.6 5.4 6.3 0.3
ES 01-93 -43.2 -8.9 06-98 7.4 2.5 5.5 4.8 4.2 2.4 1.9 3.3 0.8 -0.5 -1.3 -3.5 -3.0
FR 07-93 -39.4 -7.5 06-00 14.7 3.8 3.7 4.7 5.5 3.7 1.8 4.2 3.5 5.8 4.0 3.0 0.3
HR 04-09 -28.6 -4.8 02-18 17.7 10.5 10.4 8.4 15.9 17.7 11.4 9.5 10.3 12.1 10.7 8.1 13.3
IT 03-09 -34.4 -4.3 02-95 14.2 5.6 5.4 5.4 5.0 5.6 3.9 2.8 2.8 1.8 1.8 0.7 0.9
CY 04-13 -37.4 -2.7 04-08 19.9 7.9 8.7 8.7 10.7 10.8 5.5 7.1 4.1 -3.0 0.7 3.4 10.8
LV 04-93 -44.0 -7.3 02-07 11.8 2.7 1.7 2.6 3.0 1.8 1.6 0.8 0.8 0.8 1.5 2.4 0.9
LT 04-09 -41.4 -10.6 08-07 9.8 -2.3 -1.1 -1.8 -3.3 -5.6 -4.5 -1.0 -1.6 1.6 1.1 -0.8 -2.3
LU 03-09 -53.9 -15.1 04-95 24.1 -0.7 -4.7 -0.9 -4.4 -5.4 -7.9 -8.3 -6.8 -6.3 -4.0 -11.1 -7.8
HU 03-09 -34.7 -2.2 07-18 17.1 9.2 9.1 10.2 11.1 14.0 12.3 10.1 15.1 15.4 17.1 12.6 7.8
MT 03-09 -31.6 -3.0 03-08 18.8 5.6 14.1 13.0 16.0 13.9 11.0 -4.4 5.0 10.7 15.3 12.8 5.0
NL 02-09 -25.4 -2.2 02-18 8.1 5.2 6.7 6.7 7.2 8.1 7.0 5.8 7.0 5.5 4.3 4.7 4.0
AT 03-09 -37.8 -4.4 02-07 15.2 8.6 12.4 13.2 10.1 12.6 12.2 11.5 10.8 9.5 6.4 8.4 7.5
PL 03-09 -29.1 -13.4 06-07 -0.5 -6.6 -6.3 -5.6 -2.1 -2.8 -3.7 -5.0 -3.9 -3.1 -2.9 -4.1 -5.8
PT 04-09 -33.4 -5.9 03-98 8.4 4.2 3.3 4.1 3.3 2.6 2.2 -0.1 -0.3 0.9 0.6 1.5 -1.1
RO 09-92 -22.2 -1.8 06-96 27.3 2.6 2.7 3.4 2.7 1.6 0.6 0.0 0.2 1.0 0.7 0.8 1.6
SI 01-09 -38.0 -1.3 06-00 17.8 12.3 13.9 14.1 13.5 12.5 10.0 9.3 9.7 9.8 6.2 7.0 4.5
SK 04-09 -31.8 3.1 05-96 25.8 8.7 2.3 6.9 -4.3 8.7 8.0 6.2 2.5 1.2 1.4 0.1 2.6
FI 03-09 -37.3 1.4 10-94 31.3 12.8 14.3 18.2 15.9 14.1 11.3 12.7 12.0 15.0 17.7 14.5 11.1
SE 03-09 -38.5 -2.6 08-18 20.6 19.0 20.2 15.5 13.5 14.7 16.7 19.9 18.1 15.1 18.1 20.6 15.4
UK 03-09 -49.0 -7.8 07-17 16.2 10.5 11.5 13.2 13.0 6.4 0.1 5.1 3.6 5.9 7.0 7.6 5.4PRODUCTION EU 03-09 -33.2 7.5 12-94 23.4 19.2 19.1 19.6 20.2 16.5 14.4 17.2 15.5 16.1 15.4 16.4 14.2EXPECTATIONS EA 03-09 -32.1 6.5 12-94 21.8 17.8 18.1 19.0 19.6 16.5 14.4 16.1 13.9 15.6 14.5 15.6 13.0(Question 5) BE 03-09 -35.3 -2.0 01-11 20.3 6.9 9.2 5.6 11.3 9.8 4.6 6.4 5.0 3.8 2.6 7.6 7.4
BG 02-97 -11.5 22.0 09-08 43.9 21.8 21.9 21.0 23.7 22.1 21.2 23.5 25.8 21.8 15.9 18.5 15.0Component of the CZ 02-09 -49.0 18.9 06-00 54.7 25.2 22.2 17.8 12.8 13.0 20.1 21.5 17.2 17.8 11.5 10.2 13.7industrial confidence DK 02-09 -34.3 11.0 07-17 31.6 21.7 19.7 27.2 10.6 22.2 11.2 18.4 29.0 18.6 21.7 24.5 20.4indicator DE 01-09 -41.0 4.0 12-10 28.6 22.9 21.9 23.4 24.5 19.0 16.5 17.4 13.3 16.1 14.0 16.0 15.5
EE 04-92 -69.6 15.0 03-02 67.5 17.2 20.1 18.8 18.0 15.9 21.2 20.4 17.8 13.2 19.4 20.2 20.8
IE : : : : : : : : : : : : : : : : :
EL 08-15 -28.5 18.6 02-00 44.3 13.7 18.2 22.5 23.2 21.7 13.1 14.6 18.2 17.8 28.7 29.0 22.4
ES 03-09 -28.3 3.2 12-00 17.7 3.7 7.1 10.5 9.2 4.6 6.9 15.7 7.4 7.9 1.2 5.1 1.7
FR 02-09 -31.3 5.9 11-00 26.8 15.4 15.5 17.3 18.2 14.9 10.0 16.1 16.7 23.1 22.2 21.5 10.9
HR 04-09 -18.6 18.0 08-17 46.0 37.7 32.0 29.9 43.4 44.9 38.0 31.0 33.6 34.5 36.5 30.3 39.4
IT 03-09 -27.5 11.3 12-94 34.3 18.0 17.1 16.0 17.4 16.4 15.5 14.9 13.2 12.0 13.3 13.1 12.6
CY 04-13 -53.2 7.6 02-08 37.8 24.8 27.7 19.3 24.4 25.2 32.3 29.8 24.9 3.3 15.9 21.1 27.1
LV 02-09 -38.9 12.2 03-02 41.8 16.5 14.8 16.6 13.7 12.2 8.9 10.8 11.3 10.9 12.5 12.8 11.4
LT 04-09 -34.8 11.2 08-97 35.9 13.2 15.5 17.9 12.7 12.3 12.7 19.9 20.5 27.7 24.0 18.7 14.7
LU 02-09 -49.8 -3.7 04-10 36.1 6.9 7.7 17.0 15.1 0.2 -0.7 6.5 7.3 8.8 14.2 -7.1 1.8
HU 04-09 -47.3 9.4 12-97 36.2 21.4 17.0 21.3 21.8 26.2 21.6 25.7 27.0 30.3 27.4 27.6 22.0
MT 12-08 -22.7 20.8 03-08 58.2 25.9 39.7 35.6 50.7 34.9 39.7 -1.4 19.7 19.9 44.3 40.3 27.8
NL 02-09 -25.9 6.5 02-18 20.8 13.7 15.6 15.1 18.6 20.8 18.4 15.6 19.3 15.1 12.6 13.1 10.4
AT 03-09 -34.5 10.4 11-00 32.4 20.7 28.1 26.5 23.0 23.1 24.4 22.2 20.8 20.8 21.2 21.0 21.5
PL 03-09 -19.0 14.6 06-95 34.1 12.3 13.6 15.1 20.4 15.2 15.6 14.9 14.3 15.3 16.0 11.3 12.5
PT 02-09 -27.5 4.3 01-97 21.3 16.2 14.5 14.7 11.4 11.2 8.6 6.6 6.0 9.0 10.3 11.0 8.8
RO 03-09 -25.9 13.0 03-03 48.1 10.5 11.1 14.0 11.2 6.3 4.8 5.2 5.4 6.9 7.9 6.7 8.8
SI 01-09 -25.4 20.5 06-06 43.3 30.4 32.0 28.0 29.0 31.0 24.5 25.3 24.8 25.5 21.4 20.4 18.4
SK 01-09 -32.1 22.9 12-97 62.0 13.5 11.2 13.0 -10.1 12.6 11.6 17.8 22.5 14.2 8.9 10.5 12.6
FI 11-08 -37.0 11.8 05-07 41.0 29.7 27.9 33.3 29.4 22.0 17.7 20.2 19.6 27.7 36.8 30.6 24.3
SE 12-08 -30.7 18.5 09-10 50.2 36.8 44.5 30.6 30.4 24.5 28.2 34.8 25.9 29.7 34.9 37.1 33.5
UK 03-09 -52.4 7.8 11-13 36.0 26.2 21.6 21.7 24.6 14.2 8.6 20.8 22.6 15.7 15.1 18.8 16.8ORDER BOOKS EU 06-09 -62.7 -16.8 03-07 8.5 6.3 7.7 7.6 8.4 8.0 6.2 5.5 6.3 6.0 5.0 3.5 3.2(Question 2) EA 06-09 -64.0 -16.1 04-07 10.6 8.2 8.9 9.1 10.2 10.1 8.3 7.4 9.1 7.6 6.1 5.0 5.4
BE 06-09 -56.8 -19.5 06-00 10.7 -8.7 -8.5 -11.2 -4.9 -2.2 -8.1 -6.5 -7.7 -8.3 -9.2 -7.4 -6.7Component of the BG 10-99 -70.0 -39.8 03-07 -10.2 -14.0 -16.3 -19.5 -14.9 -13.4 -13.2 -14.8 -14.5 -15.1 -14.9 -13.6 -16.0industrial confidence CZ 03-09 -56.8 -3.9 01-01 30.6 -1.4 0.0 0.5 0.2 -1.9 -1.2 -1.7 -1.9 -0.8 -4.5 -2.7 -4.2indicator DK 04-09 -61.7 -6.2 12-94 32.5 -4.7 -3.6 -3.3 -4.9 -10.0 -10.6 -11.9 -6.3 -11.9 -9.0 -8.5 -11.4
DE 06-09 -65.7 -15.8 01-18 22.3 19.7 18.8 20.0 22.3 20.5 17.5 18.6 21.0 18.7 17.6 17.5 17.4
EE 06-09 -76.5 -6.0 12-06 32.1 3.0 3.5 3.2 1.0 -0.5 -2.1 -2.0 -2.0 -1.0 -5.1 -6.9 -5.6
IE : : : : : : : : : : : : : : : : :
EL 05-09 -59.1 -19.9 05-98 5.9 -15.9 -18.5 -14.3 -15.8 -4.8 -13.0 -13.2 -20.7 -18.2 -9.9 -6.3 -8.9
ES 01-93 -63.9 -16.5 06-98 14.2 4.5 8.3 5.7 3.0 3.4 6.2 -1.1 3.3 -1.5 2.7 -5.7 -1.3
FR 06-09 -68.7 -17.2 06-00 27.7 -0.6 0.6 -1.2 2.2 2.8 1.8 1.2 2.1 1.4 -2.0 -2.9 -4.2
HR 07-09 -62.2 -32.0 02-18 -4.4 -11.7 -9.5 -14.5 -10.6 -4.4 -8.2 -10.9 -11.4 -9.6 -7.3 -10.5 -7.5
IT 03-09 -68.3 -18.0 02-95 14.5 0.4 1.1 2.6 1.8 3.0 0.0 -2.9 -0.5 -2.4 -4.6 -7.3 -5.9
CY 04-13 -67.7 -28.4 06-07 4.6 -16.6 -6.4 -8.8 -4.6 -4.9 -23.5 -18.8 -19.1 -27.6 -27.6 -17.2 -10.4
LV 07-93 -78.2 -32.4 02-07 -1.1 -12.4 -13.2 -12.8 -9.5 -11.5 -8.7 -10.9 -12.0 -11.8 -12.0 -10.4 -12.5
LT 11-98 -78.9 -37.3 08-07 1.9 -27.9 -23.4 -27.6 -26.8 -30.0 -25.0 -24.3 -22.6 -20.9 -24.5 -23.0 -22.8
LU 03-09 -83.0 -30.1 12-97 29.2 -9.8 -22.2 -21.3 -19.8 -10.6 -17.9 -24.8 -22.2 -28.9 -19.8 -18.5 -22.9
HU 03-09 -68.5 -14.7 07-18 25.2 8.9 11.8 11.9 14.0 21.2 15.8 12.0 20.4 17.3 25.2 14.5 9.1
MT 06-09 -71.9 -22.5 06-18 19.1 -10.8 -1.0 -5.6 -1.9 6.0 -1.6 0.8 -2.0 19.1 -0.9 2.9 -8.9
NL 06-09 -45.7 -8.2 12-06 9.0 5.2 8.0 8.5 6.5 6.9 6.2 6.7 7.2 7.8 4.9 5.2 5.0
AT 05-09 -63.7 -15.2 03-90 21.1 6.4 8.5 11.4 9.8 7.7 9.9 11.7 12.5 10.2 3.6 6.4 8.0
PL 12-01 -85.2 -51.5 06-18 -23.2 -31.2 -30.7 -29.6 -25.8 -23.9 -24.7 -26.6 -24.6 -23.2 -24.1 -25.1 -27.5
PT 04-09 -66.9 -18.5 03-98 10.5 -0.3 -0.4 0.2 1.1 -0.8 0.0 -4.1 -4.0 -4.1 -6.5 -4.6 -8.6
RO 06-99 -51.9 -14.5 06-96 50.9 -4.2 -4.7 -4.9 -5.2 -4.3 -5.0 -6.7 -6.1 -5.0 -5.4 -5.6 -5.5
SI 04-09 -82.1 -14.5 03-07 23.8 10.0 16.0 20.2 17.8 19.2 14.1 9.9 13.3 16.5 6.6 9.4 6.8
SK 03-99 -69.6 -10.5 09-94 49.0 0.5 -4.9 -3.0 -7.0 -1.8 4.3 2.0 -12.1 -9.0 -7.9 -8.8 -3.1
FI 06-09 -69.1 -10.9 11-94 42.1 10.9 17.5 17.0 14.0 17.8 16.8 13.3 17.6 19.7 16.1 16.2 15.6
SE 03-92 -70.6 -20.5 03-18 24.1 18.2 18.1 20.2 16.0 20.3 24.1 22.7 21.2 14.5 16.7 20.4 18.1
UK 07-09 -66.3 -15.8 11-17 17.4 10.6 17.4 15.5 15.5 10.2 5.7 7.3 0.5 10.2 11.2 4.8 1.5
Ave.Min. Max.
Page 7
7
TABLE 2 (continued) : Monthly survey of manufacturing industry (s.a.)
Since 1990 (*) 2017 2018
Min. Max.
Date Value Date Value Oct Nov Dec Jan Feb Mar Apr May Jun Jul Aug Sep
STOCKS OF EU 07-93 23.4 9.1 03-11 -0.4 1.2 1.0 -0.1 0.9 0.7 2.7 2.6 2.8 2.7 3.0 3.0 3.9FINISHED EA 07-93 25.3 8.4 03-11 -1.6 0.8 0.3 -0.3 0.5 0.1 1.8 1.7 2.4 2.4 3.1 3.8 4.3
PRODUCTS (b)
BE 10-01 26.1 5.3 03-10 -11.2 3.3 0.0 2.9 3.0 3.7 -0.6 5.6 0.3 0.2 0.3 -2.3 -4.2(Question 4) BG 08-93 35.2 -2.1 06-97 -20.5 -3.9 -4.6 -2.6 -4.5 -2.9 -3.5 -1.2 -0.5 4.7 1.9 5.1 -0.1
CZ 08-93 46.3 10.3 04-00 -11.5 1.6 4.4 4.8 4.7 3.2 3.7 6.4 5.2 5.5 7.1 7.7 5.6Component of the DK 01-15 33.1 8.6 02-10 -28.5 5.0 6.4 5.3 9.8 8.6 7.9 5.8 8.1 6.0 2.8 4.4 12.6industrial confidence DE 07-93 31.3 8.6 09-90 -9.0 -1.1 -2.4 -3.2 -2.4 -3.1 -1.8 -1.6 -2.1 -1.9 0.6 1.1 3.1indicator EE 06-93 38.7 0.5 12-06 -20.9 -5.4 -6.4 -9.5 -5.7 -8.3 -4.4 -3.7 -1.8 -6.3 -4.7 -1.6 -5.4
IE : : : : : : : : : : : : : : : : :
EL 03-09 33.9 12.0 05-13 -1.2 12.0 11.3 7.5 3.8 4.2 10.2 5.0 1.9 4.6 2.8 3.8 12.7
ES 01-93 46.6 13.4 11-17 -1.2 0.6 -1.2 1.9 -0.5 0.8 7.4 4.8 8.2 7.8 7.7 9.9 9.5
FR 07-93 32.5 11.2 03-10 -5.7 3.6 5.0 1.9 4.0 6.4 6.3 4.9 8.2 7.1 8.1 9.6 5.8
HR 06-09 19.0 0.3 01-18 -14.8 -5.6 -8.6 -9.7 -14.8 -12.8 -4.3 -8.5 -8.8 -11.4 -2.9 -4.5 -8.0
IT 10-90 20.0 6.1 06-10 -5.4 1.6 1.9 2.3 4.1 2.5 3.7 3.5 4.1 4.3 3.2 3.6 4.1
CY 03-09 5.5 -12.6 09-01 -34.9 -15.6 -4.8 -15.5 -12.2 -12.1 -7.6 -10.3 -6.4 -15.3 -13.6 -6.2 -15.8
LV 07-93 43.3 1.7 02-14 -14.0 -3.9 -3.5 -4.1 -4.7 -4.6 -4.6 -2.7 -3.0 -3.5 -4.1 -4.7 -3.9
LT 01-94 49.5 5.7 06-11 -17.3 -7.9 -4.6 -4.4 -4.2 -0.9 1.1 -1.4 2.6 2.0 -3.9 -1.9 -1.2
LU 05-12 45.6 11.5 03-95 -23.6 -0.7 -0.4 -1.6 8.5 5.9 5.1 6.8 5.4 -1.2 6.4 7.6 2.5
HU 04-97 17.7 1.3 05-09 -17.5 2.8 1.5 2.7 2.6 5.4 0.6 7.2 2.3 1.4 1.3 4.1 7.9
MT 06-06 36.7 7.3 06-05 -14.7 -1.8 -3.5 -9.0 1.0 -0.9 5.2 12.5 2.8 6.9 -2.5 4.8 3.7
NL 02-09 14.6 5.0 03-11 -0.8 3.2 3.4 3.6 3.6 3.4 3.5 4.9 5.4 6.3 4.6 4.1 3.4
AT 07-96 30.3 8.3 02-18 -6.9 1.3 -0.5 -1.8 2.6 -6.9 -2.2 -0.6 0.9 2.7 5.5 2.2 7.1
PL 01-99 11.5 -0.9 09-94 -22.1 0.9 1.8 2.4 0.8 -0.3 2.0 3.2 1.3 1.4 0.5 -1.6 2.3
PT 06-93 21.0 3.6 01-08 -13.9 3.2 4.1 2.5 2.5 2.5 2.2 2.7 2.9 2.2 1.8 1.8 3.4
RO 07-92 49.4 3.8 03-10 -10.9 -1.5 -1.8 -0.9 -2.0 -2.6 -2.0 -1.6 -1.3 -1.2 0.3 -1.2 -1.6
SI 02-96 29.6 9.9 03-10 -7.4 3.4 6.3 5.9 6.4 12.7 8.8 7.1 8.9 12.6 9.5 8.7 11.6
SK 05-94 54.6 3.3 02-01 -27.1 -12.1 -0.7 -10.8 -4.3 -15.3 -8.1 1.2 2.9 1.5 -3.2 1.4 1.9
FI 01-96 26.9 1.6 04-95 -23.7 2.2 2.5 -4.4 -4.3 -2.6 0.7 -4.6 1.2 2.2 -0.3 3.3 6.5
SE 04-09 39.1 13.4 01-16 -12.9 -2.0 1.8 4.3 5.9 0.7 2.2 -2.3 -7.2 -1.2 -2.6 -4.3 5.3
UK 04-09 37.0 15.3 07-17 -5.0 5.3 4.4 -2.3 1.1 5.4 14.0 12.8 12.1 8.3 5.2 0.8 2.0PRODUCTION EU 03-09 -46.9 0.5 03-11 20.5 15.5 17.1 19.2 16.8 17.6 14.8 10.9 9.8 11.9 12.3 9.4 9.3TREND OBSERVED EA 03-09 -48.4 -0.7 03-11 18.7 14.3 15.4 17.9 15.7 16.5 13.2 9.5 9.6 9.3 10.5 7.4 7.8IN RECENT MONTHS BE 03-09 -39.4 0.0 02-11 20.6 7.7 9.2 10.6 11.0 8.8 -1.3 -3.3 -0.8 2.5 2.8 7.4 6.4(Question 1) BG 07-09 -38.6 -1.3 01-07 32.0 12.5 11.2 10.9 12.4 15.5 12.9 10.8 1.4 9.2 7.0 9.2 9.3
CZ 02-09 -58.0 12.7 04-95 78.6 15.1 12.4 17.1 11.7 13.3 16.1 8.7 11.1 13.6 18.6 16.9 13.4
DK 06-09 -46.5 10.2 09-94 41.8 18.9 22.3 26.9 19.3 28.4 13.5 14.0 22.3 25.1 21.3 25.3 25.7
DE 03-09 -47.7 -0.1 01-11 28.7 19.7 18.1 22.7 17.1 18.8 12.8 11.5 11.9 9.2 12.5 7.4 4.4
EE 04-09 -53.0 9.5 06-01 56.2 9.2 12.4 10.3 13.1 16.6 10.3 0.6 8.5 9.3 3.2 3.2 3.7
IE : : : : : : : : : : : : : : : : :
EL 03-09 -35.1 7.7 01-00 35.7 16.3 8.1 4.7 2.0 10.6 12.6 18.8 2.5 10.8 12.0 11.1 9.1
ES 03-09 -52.0 -2.3 04-95 21.2 5.1 14.1 14.7 13.5 7.1 8.9 4.0 4.5 7.2 10.4 5.2 3.9
FR 04-09 -44.4 4.3 06-00 35.1 16.1 20.9 20.0 23.8 21.5 20.7 8.6 8.9 11.3 13.1 14.8 14.2
HR 04-09 -39.0 5.4 12-15 31.1 28.6 23.4 28.1 25.4 28.5 26.1 25.5 26.0 27.2 15.7 19.2 26.8
IT 07-09 -63.7 -13.0 03-95 12.1 0.8 2.0 2.7 2.6 5.1 2.9 1.6 2.4 -0.8 -0.3 -5.9 -1.7
CY 06-13 -60.4 -10.7 09-08 47.2 4.2 18.3 19.9 18.4 12.8 10.4 7.6 14.6 10.3 7.7 4.4 10.3
LV 02-09 -49.5 1.9 06-01 29.6 5.8 6.0 8.8 11.2 11.8 11.7 9.8 8.3 8.4 9.5 6.1 7.2
LT 01-09 -41.6 3.5 04-98 34.8 23.2 17.1 15.6 14.0 14.4 6.8 9.5 10.6 13.5 12.2 11.5 15.5
LU 12-08 -58.9 -1.8 08-10 44.4 -9.0 14.0 14.5 9.0 10.2 0.4 13.4 4.2 0.8 10.3 17.4 -3.7
HU 03-09 -57.4 -1.0 04-98 26.1 15.3 11.3 10.3 14.3 21.7 22.8 15.7 21.4 21.2 25.8 19.3 11.1
MT 04-09 -49.8 13.0 01-17 52.7 41.7 29.2 30.8 1.1 41.6 28.2 19.6 20.2 29.5 16.6 4.6 36.1
NL 04-09 -44.7 3.7 12-10 24.9 11.1 12.6 16.0 13.1 16.6 17.9 16.4 15.2 16.5 13.9 14.9 15.4
AT 03-09 -41.9 13.2 04-11 39.9 31.1 29.5 36.8 33.9 39.2 33.9 24.1 25.6 21.8 18.8 19.7 30.2
PL 03-09 -32.4 1.9 12-06 28.4 9.9 9.4 12.1 14.2 17.8 14.9 10.6 10.2 9.6 9.9 7.7 8.5
PT 11-08 -47.0 -5.2 08-14 16.1 10.1 9.7 12.9 11.8 10.9 6.3 2.9 6.1 5.1 0.7 1.6 0.9
RO 04-09 -32.4 6.4 04-02 42.6 8.0 10.3 6.2 9.9 10.8 10.2 5.5 8.5 6.1 9.3 5.9 3.4
SI 12-08 -45.4 9.3 05-00 40.3 34.6 30.5 34.6 30.7 30.7 23.1 25.5 26.4 27.8 22.0 24.0 22.3
SK 03-09 -63.0 14.5 12-03 77.7 13.0 -6.6 7.3 41.4 15.4 16.4 20.4 4.3 18.3 20.2 8.3 27.5
FI 02-09 -52.5 11.2 06-06 49.5 20.8 33.9 31.3 19.8 29.7 32.4 22.2 19.1 32.1 17.6 22.6 26.6
SE 04-09 -40.1 12.6 11-10 58.6 33.4 36.4 34.7 27.8 20.7 30.2 20.3 18.0 22.9 20.1 16.6 18.8
UK 05-09 -54.8 2.5 03-95 32.7 21.8 29.1 29.3 25.0 24.5 22.0 18.3 5.0 26.7 20.5 17.6 14.4EXPORT EU 05-09 -61.6 -18.0 04-07 5.2 1.6 3.5 3.1 4.9 2.9 2.6 1.1 2.1 0.9 0.7 -0.8 -0.4ORDER BOOKS EA 06-09 -63.2 -18.3 05-07 5.9 2.1 3.7 3.9 4.8 3.7 3.1 2.0 3.4 2.0 0.9 0.1 0.5(Question 3) BE 05-09 -63.3 -20.5 06-00 7.4 -12.1 -6.9 -7.8 -4.0 3.1 -9.1 -8.1 -8.9 -12.0 -10.8 -13.3 -10.8
BG 09-93 -68.5 -42.5 03-07 -18.9 -22.5 -24.3 -28.0 -23.6 -23.8 -23.4 -23.1 -23.8 -23.5 -22.1 -22.8 -25.8
CZ 03-09 -58.1 -4.5 09-00 26.7 0.1 0.7 1.2 -1.4 -4.3 -3.1 -4.9 -6.6 -5.7 -7.3 -5.8 -6.0
DK 04-09 -61.6 -5.4 05-07 27.6 -7.1 -4.6 -8.8 -6.5 -12.3 -11.5 -13.1 -8.3 -18.2 -11.5 -9.5 -12.9
DE 06-09 -63.6 -20.2 01-18 12.3 9.7 9.8 10.0 12.3 10.7 8.9 10.3 10.1 9.1 7.7 8.1 7.4
EE 03-09 -66.9 -6.9 03-01 25.4 1.0 3.0 1.9 1.1 -5.4 -3.3 -3.7 -4.9 -5.4 -11.0 -10.3 -3.8
IE : : : : : : : : : : : : : : : : :
EL 05-09 -58.6 -16.8 03-95 11.9 -4.7 -8.1 -11.8 -2.7 -0.4 -9.4 -12.6 -9.3 -6.6 3.9 4.2 -5.0
ES 07-09 -61.1 -20.8 06-17 6.6 -7.4 1.9 -2.0 -1.9 -9.9 -0.1 -6.5 4.0 -3.7 1.4 -3.5 -1.4
FR 06-09 -69.5 -14.9 06-00 25.9 2.0 1.2 1.6 2.6 3.6 1.6 0.2 0.2 0.0 -1.3 -3.1 -3.5
HR 07-09 -65.9 -38.7 06-18 -9.7 -26.0 -23.3 -24.9 -19.3 -14.7 -18.2 -19.5 -19.9 -9.7 -19.4 -23.7 -15.5
IT 05-09 -71.3 -18.8 02-95 18.5 -3.4 -2.9 1.0 -1.1 -1.0 -0.9 -5.4 -4.3 -4.3 -8.8 -11.2 -7.4
CY 10-09 -83.1 -32.6 04-16 10.6 -22.1 7.5 -23.3 -5.6 -14.9 -20.9 -11.5 -17.5 -35.7 -7.4 -0.2 -18.0
LV 03-09 -65.5 -31.3 03-07 -10.9 -17.4 -18.4 -17.8 -14.7 -14.9 -13.6 -13.9 -13.0 -16.1 -15.0 -13.6 -15.6
LT 07-09 -75.4 -34.5 08-07 28.1 -29.1 -24.4 -28.9 -24.6 -28.6 -25.1 -25.2 -24.3 -29.1 -26.0 -25.8 -23.1
LU 03-09 -91.1 -25.5 04-00 50.3 -12.2 -18.0 -20.5 -15.9 -5.4 -10.5 -25.3 -22.6 -23.5 -10.6 -8.8 -18.2
HU 04-09 -66.1 -16.7 12-00 5.9 -5.5 -3.5 -7.0 -1.7 0.8 1.2 -5.8 -1.1 -4.6 5.7 -4.5 -2.3
MT 12-03 -76.0 -26.7 09-07 23.9 -16.2 -5.1 -18.1 -9.4 0.7 -5.9 -3.3 -4.3 -2.7 -4.6 -1.8 -12.3
NL 04-09 -38.3 -7.5 09-00 9.6 -0.4 1.1 1.4 2.2 0.4 -0.8 -0.1 0.8 1.1 -0.8 -0.4 0.2
AT 05-09 -66.5 -21.8 03-90 11.5 -2.7 5.8 6.6 3.7 0.2 2.2 3.4 5.1 4.3 -3.8 1.8 3.2
PL 12-01 -75.1 -52.8 07-18 -31.6 -38.2 -37.0 -36.7 -34.1 -32.7 -33.6 -35.0 -33.6 -31.7 -31.6 -33.5 -33.6
PT 04-09 -71.2 -15.7 01-95 18.8 -0.3 -1.3 0.4 -1.7 -3.6 -2.8 -5.7 -7.4 -6.8 -4.8 -4.2 -7.1
RO 06-94 -39.5 -11.8 11-03 3.5 -2.9 -5.7 -5.2 -5.6 -4.5 -5.3 -7.4 -7.3 -6.0 -7.4 -7.5 -6.3
SI 04-09 -77.7 -13.0 12-17 19.5 9.4 13.6 19.5 15.4 18.0 13.4 8.3 11.7 14.9 6.1 7.7 5.0
SK 03-99 -56.6 -10.8 01-94 52.6 1.4 -4.6 -2.3 -6.2 -2.5 -2.7 -11.1 -11.4 -10.1 -9.3 -9.5 -5.8
FI 03-09 -71.9 -13.6 04-95 31.8 7.6 8.7 9.5 6.4 9.8 8.4 6.1 11.5 8.8 7.4 12.3 8.2
SE 02-09 -64.4 -2.9 08-91 44.4 22.0 18.9 24.2 21.6 23.7 26.4 27.6 25.6 19.6 16.5 22.0 20.7
UK 05-09 -60.5 -15.3 01-18 25.0 13.7 21.0 15.1 25.0 13.1 13.5 9.7 8.2 8.5 15.2 4.9 6.6
Ave.
Page 8
8
TABLE 2 (continued) : Monthly survey of manufacturing industry (s.a.)
Since 1990 (*) 2017 2018
Min. Max.
Date Value Date Value Oct Nov Dec Jan Feb Mar Apr May Jun Jul Aug Sep
EMPLOYMENT EU 03-09 -40.2 -9.1 12-17 12.1 10.8 11.1 12.1 10.7 10.8 10.1 9.4 7.7 9.3 7.8 7.1 6.9
EXPECTATIONS EA 06-93 -39.4 -8.2 12-17 12.3 9.8 9.9 12.3 11.2 10.3 9.7 9.4 8.2 9.3 7.7 7.0 7.3
(Question 7) BE 03-09 -36.3 -7.6 10-00 8.8 4.5 0.6 -0.4 -1.6 3.0 -4.8 -2.5 -4.3 -0.7 -3.2 -3.9 -4.8
BG 06-99 -45.3 -10.5 11-06 12.8 8.7 11.5 6.7 8.2 7.7 7.7 7.8 3.5 4.0 1.6 3.7 2.6
CZ 02-09 -61.9 -8.0 02-11 18.3 9.8 7.2 8.5 13.1 10.8 12.9 7.5 10.4 7.3 8.4 8.3 5.9
DK 04-09 -42.1 -1.4 07-17 23.1 13.6 22.4 12.0 10.2 13.2 4.8 8.3 12.4 18.0 9.6 11.3 -4.9
DE 06-93 -52.1 -9.9 03-11 18.7 14.6 14.7 17.3 16.0 14.1 13.3 14.4 12.1 13.1 11.7 10.9 11.3
EE 04-92 -77.8 -6.0 11-06 22.2 13.1 11.1 10.4 8.4 7.6 13.8 13.2 10.4 12.1 8.5 6.4 11.3
IE : : : : : : : : : : : : : : : : :
EL 08-15 -37.1 -5.2 08-17 14.3 -3.8 0.4 4.8 8.8 1.9 -0.3 11.5 -1.4 2.6 8.2 10.6 2.4
ES 06-93 -51.9 -7.5 12-17 13.3 8.8 2.5 13.3 7.7 4.7 4.4 3.5 3.6 4.7 0.5 0.4 2.1
FR 03-09 -45.0 -12.9 01-01 12.8 -0.2 2.4 0.5 2.1 3.0 4.5 2.2 3.1 4.0 1.2 2.3 1.3
HR 07-09 -28.2 -1.7 01-18 21.3 16.5 16.8 15.1 21.3 17.5 5.6 20.4 19.0 16.3 12.9 15.1 21.1
IT 08-96 -29.6 -4.4 11-00 11.6 5.7 5.5 6.7 6.9 6.0 4.9 5.1 3.8 3.0 3.9 3.3 4.0
CY 04-13 -37.2 0.8 10-07 50.9 4.6 5.6 -0.3 6.1 0.3 6.8 10.9 3.0 1.8 2.8 2.9 1.9
LV 04-93 -50.2 -4.5 11-05 13.4 6.2 5.9 6.0 6.5 5.1 3.3 4.0 5.3 7.2 4.6 8.4 5.7
LT 04-94 -59.1 -14.7 06-18 18.6 10.4 10.2 6.4 11.0 6.9 11.7 11.3 12.5 18.6 16.8 13.1 11.4
LU 04-09 -72.2 -23.5 06-10 25.4 -7.4 1.2 0.4 -3.8 -5.9 -3.3 3.2 -7.6 -6.8 -4.0 -6.8 -9.2
HU 03-09 -47.4 -3.1 02-18 20.4 16.6 12.9 14.0 15.3 20.4 12.3 16.2 17.3 16.0 15.3 16.4 12.8
MT 05-09 -40.1 2.3 03-18 52.9 23.0 24.5 27.5 45.0 42.4 52.9 25.0 30.1 46.2 44.4 25.5 32.5
NL 04-09 -37.8 -5.1 02-18 15.4 11.8 12.6 13.7 14.0 15.4 15.0 13.6 13.4 12.7 12.6 11.0 11.5
AT 03-09 -39.4 -1.9 12-17 24.2 13.6 18.8 24.2 17.3 16.4 18.5 14.1 12.4 16.5 13.4 12.8 12.6
PL 05-99 -50.7 -15.1 03-18 11.0 2.4 4.0 4.9 9.7 10.3 11.0 10.1 8.5 8.0 7.1 6.5 5.5
PT 06-93 -24.5 -3.9 10-17 8.8 8.8 6.8 7.9 5.6 7.3 6.8 5.7 5.8 4.7 4.0 4.3 3.4
RO 07-92 -70.9 -17.9 05-15 7.1 4.9 2.8 1.2 1.8 -0.5 -1.3 -0.2 0.0 -0.2 1.9 1.4 1.3
SI 04-09 -53.8 -14.1 01-18 25.4 20.1 23.2 21.3 25.4 25.2 21.7 24.4 25.2 17.4 16.5 14.8 14.4
SK 02-09 -57.1 -12.1 12-17 35.0 28.4 33.7 35.0 25.0 21.1 15.2 14.1 18.0 17.7 10.5 12.4 9.3
FI 06-91 -58.7 -14.6 02-18 22.3 12.8 16.1 21.3 19.8 22.3 14.6 18.0 14.0 18.9 14.8 10.5 15.0
SE 03-09 -60.1 -13.7 02-11 26.3 22.0 25.7 21.0 14.8 14.0 10.2 10.2 2.5 9.2 9.6 14.7 15.5
UK 03-09 -51.3 -11.4 10-17 18.2 18.2 18.2 13.1 7.1 13.9 15.1 10.2 4.0 9.9 9.0 4.7 4.1
SELLING–PRICE EU 03-09 -14.3 5.5 02-95 27.1 10.2 11.8 13.9 14.9 13.5 12.3 10.9 10.5 10.7 10.8 11.3 12.2
EXPECTATIONS EA 03-09 -15.5 4.8 03-11 24.8 8.5 11.0 13.4 13.0 12.6 11.9 9.9 9.3 10.1 9.6 10.5 11.6
(Question 6) BE 04-09 -21.1 2.8 12-94 25.9 8.3 9.9 8.8 14.4 12.4 11.5 9.2 7.8 5.9 8.9 9.7 9.2
BG 08-09 -5.5 18.6 11-96 90.6 2.5 1.9 2.1 4.5 4.0 4.2 3.9 1.0 0.9 1.9 2.0 1.7
CZ 01-09 -17.4 10.9 03-95 69.9 4.6 6.4 7.6 5.9 10.5 10.0 6.7 8.5 9.4 6.7 6.5 9.8
DK 01-15 -19.5 1.1 01-08 26.4 4.1 2.8 3.3 -1.5 -1.8 5.8 9.1 5.3 -1.4 9.0 3.5 8.6
DE 03-09 -12.8 5.3 04-11 28.2 11.7 13.0 17.8 16.3 14.5 14.2 14.6 12.1 14.6 15.1 15.9 16.5
EE 02-09 -36.9 12.3 04-92 86.3 11.8 16.4 13.2 18.2 19.3 17.3 12.5 10.1 11.1 9.4 12.1 12.0
IE : : : : : : : : : : : : : : : : :
EL 03-09 -18.1 10.0 10-90 40.6 -2.3 2.4 1.9 1.2 3.0 -2.8 0.1 -4.5 -0.1 5.5 7.3 5.1
ES 03-09 -20.3 1.0 03-95 33.0 3.2 5.0 5.9 10.4 10.7 7.2 4.8 1.3 1.1 1.6 1.7 6.6
FR 01-99 -24.7 1.6 03-11 32.9 2.5 11.9 10.7 9.7 13.1 14.2 4.8 9.0 7.2 2.5 7.3 9.5
HR 02-09 -21.9 0.3 07-08 30.9 5.7 10.8 12.1 16.1 11.7 8.6 6.9 11.0 11.8 11.2 11.1 12.0
IT 03-09 -13.2 8.1 03-95 39.9 8.0 8.4 9.2 9.0 9.8 6.8 7.5 7.2 6.7 5.7 5.4 5.3
CY 04-13 -18.5 2.7 10-03 38.7 -1.9 0.7 -5.9 -4.6 -0.1 -0.5 -1.1 0.9 4.6 -4.8 0.6 5.6
LV 02-09 -25.8 13.1 07-94 51.5 10.0 11.8 10.5 17.6 14.2 13.1 10.3 9.6 8.7 10.5 9.2 9.9
LT 04-09 -36.2 9.0 11-93 75.0 0.6 7.4 10.3 4.8 2.0 7.6 12.8 6.2 9.9 9.7 7.6 8.0
LU 08-91 -52.5 -4.0 12-94 51.2 21.4 20.6 19.5 21.7 20.3 8.9 10.1 6.4 21.3 20.4 17.6 23.8
HU 01-09 -17.3 13.5 01-01 49.4 10.7 13.4 9.7 16.9 20.7 16.4 13.5 15.3 15.9 16.4 16.0 15.0
MT 12-04 -41.7 -10.1 12-03 36.1 -12.4 -20.0 17.3 2.9 7.2 2.5 -13.4 10.0 -7.9 4.1 -5.7 -5.7
NL 04-09 -14.3 7.1 03-11 25.7 12.2 10.3 14.0 14.2 13.2 13.7 10.6 11.1 12.6 13.3 10.5 11.2
AT 03-09 -28.7 1.8 03-11 30.3 14.9 21.0 20.9 16.1 16.4 20.2 15.8 14.1 18.6 12.9 12.6 17.4
PL 04-09 -5.9 11.1 06-93 40.8 6.2 7.8 7.3 12.6 10.1 8.7 7.9 6.6 8.0 9.7 9.9 8.8
PT 01-09 -24.3 4.2 10-90 27.3 3.4 6.2 4.7 5.0 3.8 3.5 2.8 3.0 4.3 2.1 3.3 3.6
RO 01-16 -3.3 30.7 10-93 91.2 13.1 15.4 14.8 14.7 16.0 12.3 12.3 10.0 10.2 8.4 8.9 8.2
SI 03-09 -32.1 -3.0 03-11 25.9 11.1 14.0 14.7 17.9 12.7 13.4 8.1 9.6 10.0 10.3 8.4 9.6
SK 07-11 -44.4 16.2 04-95 81.2 7.2 9.3 16.5 7.4 2.6 2.3 0.8 -1.0 -2.6 10.1 8.6 -0.3
FI 03-09 -30.7 4.3 08-94 51.2 17.9 20.4 18.4 22.9 19.1 17.3 15.3 18.8 22.2 19.5 24.6 24.6
SE 06-09 -17.7 7.4 12-94 40.7 9.4 17.6 24.4 18.0 24.8 20.3 24.0 21.1 18.5 20.8 19.6 19.8
UK 01-99 -28.2 5.5 07-08 40.9 26.8 19.6 21.0 35.1 20.3 16.5 16.6 19.0 16.4 17.9 18.0 17.5(*) Minimum, maximum and averages are calculated over the period of availability which is not necessarily as from 01/1990.
(a) The indicator is the arithmetic average of the balances (%) of the questions on production expectations, order-books and stocks (the last with inverted sign).
(b) Highest figure is considered as a minimum, lowest figure is considered as a maximum.
Ave.
Page 9
9
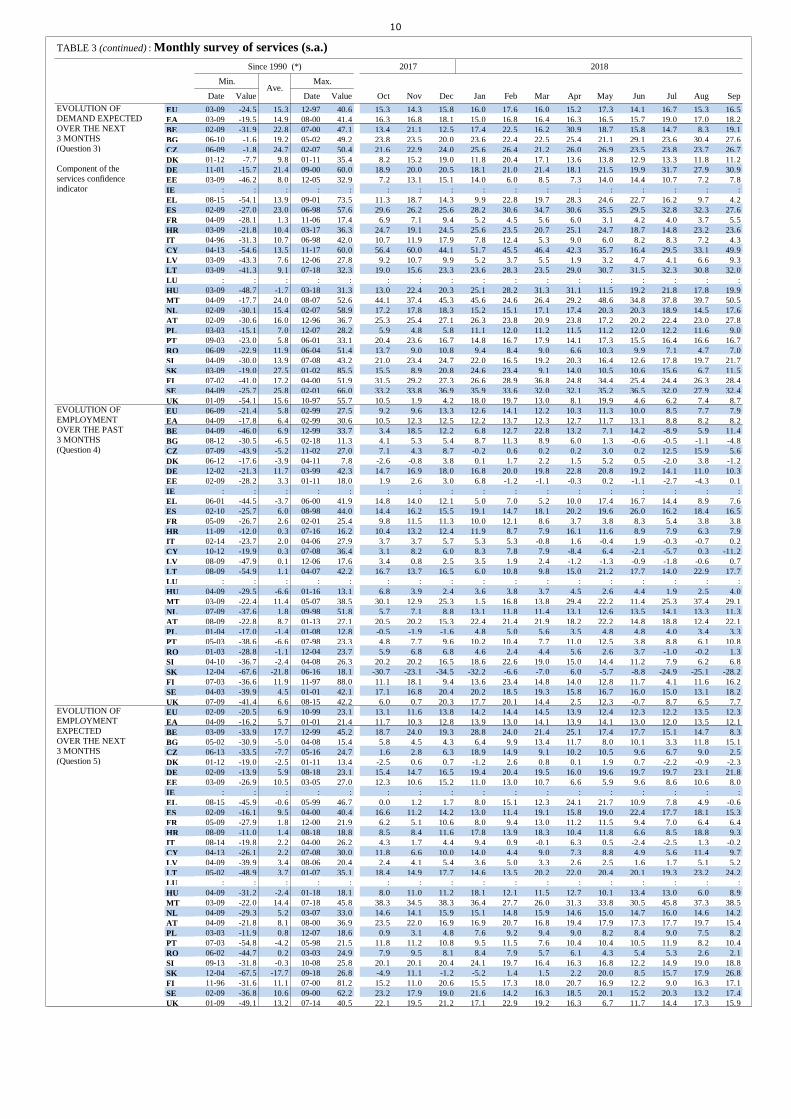
TABLE 3: Monthly survey of services (s.a.)
Since 1990 (*) 2017 2018
Min. Max.
Date Value Date Value Oct Nov Dec Jan Feb Mar Apr May Jun Jul Aug Sep
SERVICES EU 03-09 -29.8 9.3 06-98 33.6 13.8 12.1 15.0 14.6 16.1 14.2 12.7 13.3 12.3 13.1 12.4 13.1CONFIDENCE EA 03-09 -25.1 9.9 06-98 35.1 15.7 15.8 16.9 15.9 16.9 16.0 14.7 14.4 14.4 15.3 14.4 14.6
INDICATOR (a)
BE 04-09 -42.9 12.2 08-07 32.2 11.0 13.3 17.8 12.9 18.3 16.9 23.1 12.6 17.1 8.7 13.4 15.0
BG 06-10 -13.6 10.5 03-07 33.4 14.5 15.1 12.8 16.4 15.8 15.8 20.5 18.9 18.6 16.6 21.8 18.4
CZ 09-09 6.4 33.7 02-07 52.6 35.6 35.5 36.2 36.7 38.6 36.1 37.7 37.1 37.3 37.5 38.1 39.0
DK 02-13 -10.1 6.3 05-10 28.6 8.7 13.5 14.5 11.7 16.7 15.0 10.6 10.2 9.5 10.4 10.9 10.3
DE 12-02 -19.9 18.2 03-99 50.1 19.5 20.6 21.3 22.5 22.2 19.7 17.7 18.5 16.5 23.7 22.2 22.3
EE 02-09 -50.3 9.7 01-06 38.3 13.1 17.0 20.4 20.5 15.8 16.3 10.0 7.0 8.3 14.5 9.5 6.8
IE : : : : : : : : : : : : : : : : :
EL 10-12 -46.0 8.5 08-00 58.7 14.4 13.6 13.4 8.9 18.9 17.7 23.6 25.1 21.0 15.9 11.9 10.5
ES 01-09 -38.7 11.3 06-98 54.0 26.4 20.7 19.8 20.1 23.8 26.6 22.5 24.5 23.6 23.3 22.2 19.3
FR 04-09 -28.8 -0.3 01-90 16.2 5.6 7.1 10.2 7.6 6.8 6.7 5.9 3.2 4.6 4.5 2.9 3.2
HR 07-09 -31.6 3.3 09-16 25.9 19.6 20.9 24.6 23.7 19.3 19.2 20.8 24.5 17.1 13.9 16.1 16.6
IT 09-12 -24.3 4.3 04-00 33.1 12.5 13.6 13.3 9.8 12.9 10.1 9.8 9.6 11.9 9.0 9.1 9.5
CY 04-13 -59.0 3.8 01-18 45.3 37.5 45.2 36.5 45.3 40.1 36.4 40.5 32.6 16.3 25.1 23.4 31.6
LV 03-09 -43.9 4.4 12-06 20.9 7.6 8.1 8.6 7.5 6.1 3.8 1.1 2.7 4.0 3.1 4.0 5.8
LT 03-09 -47.2 8.7 07-06 34.3 18.2 14.8 22.7 21.1 29.5 24.0 26.6 29.3 30.5 29.1 29.5 30.4
LU : : : : : : : : : : : : : : : : :
HU 03-09 -44.2 -4.9 04-18 17.9 13.9 16.5 15.7 16.3 16.0 10.9 17.9 8.6 13.2 17.7 11.8 9.6
MT 03-09 -22.0 22.8 05-07 65.2 33.6 31.0 44.7 37.6 29.8 32.7 29.4 40.2 30.2 31.6 36.1 42.2
NL 03-09 -41.6 6.8 04-07 46.5 14.0 14.5 14.4 15.3 16.0 16.0 14.6 16.7 15.9 16.3 14.1 15.3
AT 04-09 -24.9 15.1 06-98 33.4 32.3 26.8 32.6 31.7 30.9 29.5 27.2 24.2 27.4 24.7 25.2 27.9
PL 03-09 -12.0 3.5 07-07 22.7 2.5 2.6 3.0 8.4 8.9 7.6 7.4 6.8 6.5 6.4 6.1 5.4
PT 10-12 -31.5 1.3 06-01 24.6 14.6 17.2 15.3 15.9 15.0 12.4 9.8 14.0 18.2 17.5 15.1 16.8
RO 06-09 -19.3 11.8 06-04 56.2 12.0 9.6 11.0 10.7 11.3 9.2 6.1 10.2 11.4 4.4 5.1 4.8
SI 04-09 -28.9 14.5 09-02 38.0 26.9 28.4 29.4 25.9 24.7 22.8 24.4 24.8 24.4 24.2 24.8 25.4
SK 05-09 -24.0 23.1 03-02 62.6 11.0 6.2 -0.6 4.2 7.3 8.0 8.7 7.7 5.4 2.4 -5.1 -8.8
FI 12-01 -47.6 14.5 09-00 51.1 26.3 24.6 21.1 22.2 27.9 29.8 22.0 23.7 16.9 17.7 17.7 23.4
SE 04-09 -26.3 20.6 02-11 53.0 27.8 27.9 30.7 28.0 28.2 24.4 24.5 22.7 27.1 26.0 23.5 28.3
UK 03-09 -57.4 4.6 10-97 36.1 4.8 -6.0 5.7 7.1 10.9 5.2 1.9 7.5 0.9 2.1 2.5 4.9ASSESSMENT EU 03-09 -34.6 4.6 04-00 34.2 11.3 8.6 12.3 11.6 12.0 12.0 9.6 8.9 9.3 8.8 7.9 9.0OF BUSINESS EA 03-09 -30.3 6.4 08-00 42.2 13.8 13.3 14.3 14.5 15.3 15.1 12.1 12.1 12.1 12.0 10.7 10.8SITUATION BE 04-09 -55.1 2.1 07-07 31.7 6.5 5.0 12.8 11.3 12.0 14.1 14.6 10.0 15.6 2.0 13.7 11.5OVER THE PAST BG 06-10 -14.1 8.3 05-02 46.1 8.5 8.2 8.9 11.2 13.1 11.2 19.9 17.0 10.7 15.4 14.4 13.13 MONTHS CZ 09-09 25.2 55.4 07-02 74.7 61.8 60.5 61.9 62.4 61.9 62.3 60.4 62.4 62.2 61.3 59.8 59.0(Question 1) DK 12-11 -16.2 3.5 05-10 26.3 7.8 10.4 10.3 9.7 10.3 12.6 9.2 6.6 6.1 6.6 9.5 8.0
DE 01-03 -38.8 16.9 12-98 59.3 18.3 19.1 19.1 22.8 19.6 18.0 14.2 13.5 11.6 14.6 13.9 12.7Component of the EE 04-09 -54.0 11.8 11-02 47.4 14.8 20.1 22.9 24.4 20.8 20.2 12.0 4.0 6.1 12.7 10.1 6.3services confidence IE : : : : : : : : : : : : : : : : :indicator EL 08-12 -47.3 1.8 09-00 54.7 17.6 12.2 14.5 9.8 20.1 19.2 27.2 25.5 20.8 19.3 16.9 14.7
ES 05-09 -49.0 6.9 04-00 64.9 22.7 17.4 14.4 14.9 19.5 22.3 18.7 17.6 19.5 18.7 15.3 14.3
FR 07-91 -34.1 -3.4 12-04 18.4 2.4 3.5 7.9 4.0 6.4 6.9 3.1 2.2 1.2 3.7 2.2 1.2
HR 07-09 -39.6 -1.7 11-16 26.2 14.0 16.0 20.9 20.3 15.1 16.1 19.6 20.5 16.1 12.1 14.5 10.4
IT 10-02 -34.7 4.4 04-00 55.9 13.5 13.4 11.8 11.2 14.2 13.8 10.4 14.6 17.1 12.7 10.2 14.7
CY 04-13 -64.8 -3.6 01-18 40.2 26.4 34.3 23.9 40.2 26.8 21.9 33.1 20.0 10.9 13.1 11.4 15.8
LV 03-09 -42.4 3.1 04-03 20.4 6.5 6.1 7.8 8.0 7.1 3.2 -1.3 2.2 3.1 3.1 1.8 2.6
LT 05-09 -49.5 8.1 03-03 50.9 17.0 16.7 19.5 17.8 25.8 22.9 24.4 24.7 25.6 25.8 28.8 28.3
LU : : : : : : : : : : : : : : : : :
HU 02-09 -40.9 -5.9 05-02 17.9 15.9 15.2 13.4 13.6 10.6 2.2 13.3 8.7 11.6 15.0 9.0 4.8
MT 03-09 -31.9 20.6 05-07 75.7 27.5 25.9 43.3 31.5 27.2 34.2 24.8 30.9 25.6 25.1 28.3 40.2
NL 07-93 -68.7 -15.7 05-07 49.7 9.8 11.4 11.9 13.5 14.1 12.0 11.5 11.7 11.3 12.0 9.5 8.4
AT 06-09 -28.3 11.7 03-18 33.4 32.7 22.8 32.4 32.6 28.8 33.4 25.8 26.6 29.1 25.4 23.9 23.0
PL 03-09 -14.1 2.6 08-07 20.3 1.2 2.0 1.8 6.8 6.9 6.3 4.9 4.0 2.6 2.8 2.1 2.8
PT 11-12 -36.4 -1.6 11-97 21.6 12.2 14.0 11.7 17.8 14.0 10.1 7.7 13.6 20.2 19.9 16.2 18.5
RO 05-09 -18.0 13.8 04-03 67.0 12.3 12.2 9.0 9.3 9.6 9.3 4.8 8.7 9.8 2.0 3.7 2.0
SI 10-12 -19.6 21.6 10-02 56.8 40.1 42.4 41.5 38.2 37.6 33.4 37.2 39.7 41.0 40.2 38.3 38.8
SK 04-09 -28.9 19.0 06-03 63.2 4.3 0.7 -15.7 -16.9 -4.7 8.0 6.5 5.9 -0.8 -8.3 -15.0 -21.0
FI 12-01 -92.4 8.6 11-02 112.4 21.0 20.5 14.1 23.0 28.1 16.4 18.4 11.2 6.1 7.2 5.9 8.8
SE 01-02 -60.2 16.1 02-11 52.9 22.4 20.7 26.5 22.8 23.1 16.2 17.2 10.5 16.1 17.2 20.3 23.7
UK 03-09 -64.0 -9.0 12-97 26.9 -2.0 -15.7 0.4 -4.1 -5.6 -3.8 -4.6 -7.4 -5.6 -8.1 -8.4 -2.4EVOLUTION EU 03-09 -30.3 8.4 08-98 31.0 14.7 13.3 17.0 16.0 18.6 14.6 13.2 13.7 13.5 13.8 14.1 13.7OF DEMAND EA 04-09 -26.1 8.7 03-00 34.6 17.0 17.3 18.3 18.1 18.7 16.6 15.7 14.6 15.5 15.0 15.4 14.9OVER THE PAST BE 04-09 -45.0 11.7 05-11 35.7 13.1 13.7 28.2 10.0 20.4 20.2 23.9 9.1 20.0 9.5 18.2 14.43 MONTHS BG 06-10 -25.0 4.0 01-07 29.2 11.3 13.7 9.6 14.4 11.9 13.6 16.1 18.6 16.0 10.8 20.6 14.4(Question 2) CZ 08-09 -13.0 21.0 04-07 43.9 23.3 23.1 22.6 22.2 27.5 24.7 26.9 21.9 26.3 27.3 30.7 31.3
DK 04-13 -13.5 5.7 05-10 32.8 10.2 14.8 14.1 13.5 19.4 15.3 8.9 10.2 9.6 11.1 11.5 11.7Component of the DE 01-03 -26.5 16.4 09-98 41.2 21.4 22.8 24.2 26.7 26.0 19.6 20.7 20.5 18.2 24.6 24.8 23.2services confidence EE 04-09 -60.8 9.2 01-06 48.6 17.3 17.8 23.1 23.1 20.5 20.3 10.7 2.9 4.6 20.1 11.4 6.4indicator IE : : : : : : : : : : : : : : : : :
EL 10-12 -50.4 9.9 06-01 67.7 14.4 10.0 11.3 6.9 13.8 14.3 15.5 25.3 19.6 12.2 9.0 12.7
ES 05-09 -51.2 3.9 06-98 53.8 27.1 18.6 19.3 17.2 21.3 22.8 18.1 20.6 21.8 18.4 19.1 15.9
FR 04-09 -27.7 1.3 01-90 18.9 7.5 10.7 13.2 13.6 9.5 7.8 8.7 4.2 8.3 5.7 2.9 2.9
HR 07-09 -35.9 1.2 05-18 28.4 20.1 27.7 28.4 25.1 19.2 20.9 17.8 28.4 16.5 14.9 10.8 15.8
IT 08-02 -43.8 -2.1 03-01 22.7 13.2 15.6 10.2 10.4 12.2 11.4 9.8 8.2 10.4 5.9 9.8 9.5
CY 04-13 -57.5 1.5 02-18 48.0 29.5 41.3 41.5 44.1 48.0 40.8 46.0 42.0 21.8 32.6 25.7 29.1
LV 04-09 -48.0 2.5 11-06 20.9 7.2 7.4 8.3 9.1 7.6 2.6 2.5 2.9 4.2 2.0 3.7 5.3
LT 03-09 -55.3 8.8 07-06 45.4 18.7 12.2 25.4 21.9 34.4 25.8 26.4 32.7 34.5 29.4 28.9 31.0
LU : : : : : : : : : : : : : : : : :
HU 09-09 -47.3 -7.1 09-17 17.1 12.7 11.9 13.4 10.2 9.3 -0.8 9.4 5.7 9.0 16.5 8.6 4.0
MT 06-09 -26.3 23.8 05-07 69.9 29.1 29.8 45.5 35.8 37.5 37.6 34.1 41.1 30.3 32.1 40.4 35.8
NL 03-09 -36.1 18.5 06-98 78.5 15.0 14.3 13.0 17.2 18.8 19.0 14.9 18.1 16.0 18.1 18.1 19.9
AT 04-09 -25.5 17.6 08-00 43.1 38.9 32.2 38.3 36.2 40.1 34.1 32.0 28.9 33.0 26.2 28.6 32.9
PL 01-03 -22.4 0.9 07-07 21.8 0.3 1.1 1.5 7.3 7.8 5.2 5.7 5.2 4.7 4.1 4.5 4.5
PT 10-12 -38.6 -0.1 01-08 24.1 11.2 14.1 17.4 15.1 14.1 9.2 7.6 11.0 18.8 16.3 12.6 15.2
RO 05-09 -19.4 9.8 06-04 56.9 10.0 7.6 13.3 13.3 15.9 9.3 6.9 11.6 14.3 4.0 6.7 5.5
SI 06-09 -41.5 8.0 03-06 36.7 19.4 19.4 21.8 17.7 20.1 15.8 15.8 18.3 19.4 14.7 16.4 15.8
SK 05-09 -30.2 22.8 07-03 65.5 13.2 9.1 -6.9 4.9 3.1 7.0 5.6 6.6 6.3 -0.1 -6.9 -16.9
FI 10-01 -41.1 17.9 04-01 71.6 26.3 24.1 22.1 17.0 26.9 36.2 23.0 25.6 19.3 21.7 20.8 33.1
SE 02-09 -30.4 19.8 01-01 53.3 27.7 29.4 28.8 25.3 28.1 25.0 24.2 22.5 28.8 28.7 22.2 28.8
UK 03-09 -56.1 7.0 01-97 41.7 5.8 -4.1 12.4 7.5 18.5 6.6 2.3 10.0 3.8 8.3 8.6 8.3
Ave.
Page 10
10
TABLE 3 (continued) : Monthly survey of services (s.a.)
Since 1990 (*) 2017 2018
Min. Max.
Date Value Date Value Oct Nov Dec Jan Feb Mar Apr May Jun Jul Aug Sep
EVOLUTION OF EU 03-09 -24.5 15.3 12-97 40.6 15.3 14.3 15.8 16.0 17.6 16.0 15.2 17.3 14.1 16.7 15.3 16.5DEMAND EXPECTED EA 03-09 -19.5 14.9 08-00 41.4 16.3 16.8 18.1 15.0 16.8 16.4 16.3 16.5 15.7 19.0 17.0 18.2OVER THE NEXT BE 02-09 -31.9 22.8 07-00 47.1 13.4 21.1 12.5 17.4 22.5 16.2 30.9 18.7 15.8 14.7 8.3 19.13 MONTHS BG 06-10 -1.6 19.2 05-02 49.2 23.8 23.5 20.0 23.6 22.4 22.5 25.4 21.1 29.1 23.6 30.4 27.6(Question 3) CZ 06-09 -1.8 24.7 02-07 50.4 21.6 22.9 24.0 25.6 26.4 21.2 26.0 26.9 23.5 23.8 23.7 26.7
DK 01-12 -7.7 9.8 01-11 35.4 8.2 15.2 19.0 11.8 20.4 17.1 13.6 13.8 12.9 13.3 11.8 11.2Component of the DE 11-01 -15.7 21.4 09-00 60.0 18.9 20.0 20.5 18.1 21.0 21.4 18.1 21.5 19.9 31.7 27.9 30.9services confidence EE 03-09 -46.2 8.0 12-05 32.9 7.2 13.1 15.1 14.0 6.0 8.5 7.3 14.0 14.4 10.7 7.2 7.8indicator IE : : : : : : : : : : : : : : : : :
EL 08-15 -54.1 13.9 09-01 73.5 11.3 18.7 14.3 9.9 22.8 19.7 28.3 24.6 22.7 16.2 9.7 4.2
ES 02-09 -27.0 23.0 06-98 57.6 29.6 26.2 25.6 28.2 30.6 34.7 30.6 35.5 29.5 32.8 32.3 27.6
FR 04-09 -28.1 1.3 11-06 17.4 6.9 7.1 9.4 5.2 4.5 5.6 6.0 3.1 4.2 4.0 3.7 5.5
HR 03-09 -21.8 10.4 03-17 36.3 24.7 19.1 24.5 25.6 23.5 20.7 25.1 24.7 18.7 14.8 23.2 23.6
IT 04-96 -31.3 10.7 06-98 42.0 10.7 11.9 17.9 7.8 12.4 5.3 9.0 6.0 8.2 8.3 7.2 4.3
CY 04-13 -54.6 13.5 11-17 60.0 56.4 60.0 44.1 51.7 45.5 46.4 42.3 35.7 16.4 29.5 33.1 49.9
LV 03-09 -43.3 7.6 12-06 27.8 9.2 10.7 9.9 5.2 3.7 5.5 1.9 3.2 4.7 4.1 6.6 9.3
LT 03-09 -41.3 9.1 07-18 32.3 19.0 15.6 23.3 23.6 28.3 23.5 29.0 30.7 31.5 32.3 30.8 32.0
LU : : : : : : : : : : : : : : : : :
HU 03-09 -48.7 -1.7 03-18 31.3 13.0 22.4 20.3 25.1 28.2 31.3 31.1 11.5 19.2 21.8 17.8 19.9
MT 04-09 -17.7 24.0 08-07 52.6 44.1 37.4 45.3 45.6 24.6 26.4 29.2 48.6 34.8 37.8 39.7 50.5
NL 02-09 -30.1 15.4 02-07 58.9 17.2 17.8 18.3 15.2 15.1 17.1 17.4 20.3 20.3 18.9 14.5 17.6
AT 02-09 -30.6 16.0 12-96 36.7 25.3 25.4 27.1 26.3 23.8 20.9 23.8 17.2 20.2 22.4 23.0 27.8
PL 03-03 -15.1 7.0 12-07 28.2 5.9 4.8 5.8 11.1 12.0 11.2 11.5 11.2 12.0 12.2 11.6 9.0
PT 09-03 -23.0 5.8 06-01 33.1 20.4 23.6 16.7 14.8 16.7 17.9 14.1 17.3 15.5 16.4 16.6 16.7
RO 06-09 -22.9 11.9 06-04 51.4 13.7 9.0 10.8 9.4 8.4 9.0 6.6 10.3 9.9 7.1 4.7 7.0
SI 04-09 -30.0 13.9 07-08 43.2 21.0 23.4 24.7 22.0 16.5 19.2 20.3 16.4 12.6 17.8 19.7 21.7
SK 03-09 -19.0 27.5 01-02 85.5 15.5 8.9 20.8 24.6 23.4 9.1 14.0 10.5 10.6 15.6 6.7 11.5
FI 07-02 -41.0 17.2 04-00 51.9 31.5 29.2 27.3 26.6 28.9 36.8 24.8 34.4 25.4 24.4 26.3 28.4
SE 04-09 -25.7 25.8 02-01 66.0 33.2 33.8 36.9 35.9 33.6 32.0 32.1 35.2 36.5 32.0 27.9 32.4
UK 01-09 -54.1 15.6 10-97 55.7 10.5 1.9 4.2 18.0 19.7 13.0 8.1 19.9 4.6 6.2 7.4 8.7EVOLUTION OF EU 06-09 -21.4 5.8 02-99 27.5 9.2 9.6 13.3 12.6 14.1 12.2 10.3 11.3 10.0 8.5 7.7 7.9EMPLOYMENT EA 04-09 -17.8 6.4 02-99 30.6 10.5 12.3 12.5 12.2 13.7 12.3 12.7 11.7 13.1 8.8 8.2 8.2OVER THE PAST BE 04-09 -46.0 6.9 12-99 33.7 3.4 18.5 12.2 6.8 12.7 22.8 13.2 7.1 14.2 -8.9 5.9 11.43 MONTHS BG 08-12 -30.5 -6.5 02-18 11.3 4.1 5.3 5.4 8.7 11.3 8.9 6.0 1.3 -0.6 -0.5 -1.1 -4.8(Question 4) CZ 07-09 -43.9 -5.2 11-02 27.0 7.1 4.3 8.7 -0.2 0.6 0.2 0.2 3.0 0.2 12.5 15.9 5.6
DK 06-12 -17.6 -3.9 04-11 7.8 -2.6 -0.8 3.8 0.1 1.7 2.2 1.5 5.2 0.5 -2.0 3.8 -1.2
DE 12-02 -21.3 11.7 03-99 42.3 14.7 16.9 18.0 16.8 20.0 19.8 22.8 20.8 19.2 14.1 11.0 10.3
EE 02-09 -28.2 3.3 01-11 18.0 1.9 2.6 3.0 6.8 -1.2 -1.1 -0.3 0.2 -1.1 -2.7 -4.3 0.1
IE : : : : : : : : : : : : : : : : :
EL 06-01 -44.5 -3.7 06-00 41.9 14.8 14.0 12.1 5.0 7.0 5.2 10.0 17.4 16.7 14.4 8.9 7.6
ES 02-10 -25.7 6.0 08-98 44.0 14.4 16.2 15.5 19.1 14.7 18.1 20.2 19.6 26.0 16.2 18.4 16.5
FR 05-09 -26.7 2.6 02-01 25.4 9.8 11.5 11.3 10.0 12.1 8.6 3.7 3.8 8.3 5.4 3.8 3.8
HR 11-09 -12.0 0.3 07-16 16.2 10.4 13.2 12.4 11.9 8.7 7.9 16.1 11.6 8.9 7.9 6.3 7.9
IT 02-14 -23.7 2.0 04-06 27.9 3.7 3.7 5.7 5.3 5.3 -0.8 1.6 -0.4 1.9 -0.3 -0.7 0.2
CY 10-12 -19.9 0.3 07-08 36.4 3.1 8.2 6.0 8.3 7.8 7.9 -8.4 6.4 -2.1 -5.7 0.3 -11.2
LV 08-09 -47.9 0.1 12-06 17.6 3.4 0.8 2.5 3.5 1.9 2.4 -1.2 -1.3 -0.9 -1.8 -0.6 0.7
LT 08-09 -54.9 1.1 04-07 42.2 16.7 13.7 16.5 6.0 10.8 9.8 15.0 21.2 17.7 14.0 22.9 17.7
LU : : : : : : : : : : : : : : : : :
HU 04-09 -29.5 -6.6 01-16 13.1 6.8 3.9 2.4 3.6 3.8 3.7 4.5 2.6 4.4 1.9 2.5 4.0
MT 03-09 -22.4 11.4 05-07 38.5 30.1 12.9 25.3 1.5 16.8 13.8 29.4 22.2 11.4 25.3 37.4 29.1
NL 07-09 -37.6 1.8 09-98 51.8 5.7 7.1 8.8 13.1 11.8 11.4 13.1 12.6 13.5 14.1 13.3 11.3
AT 08-09 -22.8 8.7 01-13 27.1 20.5 20.2 15.3 22.4 21.4 21.9 18.2 22.2 14.8 18.8 12.4 22.1
PL 01-04 -17.0 -1.4 01-08 12.8 -0.5 -1.9 -1.6 4.8 5.0 5.6 3.5 4.8 4.8 4.0 3.4 3.3
PT 05-03 -38.6 -6.6 07-98 23.3 4.8 7.7 9.6 10.2 10.4 7.7 11.0 12.5 3.8 8.8 6.1 10.8
RO 01-03 -28.8 -1.1 12-04 23.7 5.9 6.8 6.8 4.6 2.4 4.4 5.6 2.6 3.7 -1.0 -0.2 1.3
SI 04-10 -36.7 -2.4 04-08 26.3 20.2 20.2 16.5 18.6 22.6 19.0 15.0 14.4 11.2 7.9 6.2 6.8
SK 12-04 -67.6 -21.8 06-16 18.1 -30.7 -23.1 -34.5 -32.2 -6.6 -7.0 6.0 -5.7 -8.8 -24.9 -25.1 -28.2
FI 07-03 -36.6 11.9 11-97 88.0 11.1 18.1 9.4 13.6 23.4 14.8 14.0 12.8 11.7 4.1 11.6 16.2
SE 04-03 -39.9 4.5 01-01 42.1 17.1 16.8 20.4 20.2 18.5 19.3 15.8 16.7 16.0 15.0 13.1 18.2
UK 07-09 -41.4 6.6 08-15 42.2 6.0 0.7 20.3 17.7 20.1 14.4 2.5 12.3 -0.7 8.7 6.5 7.7EVOLUTION OF EU 02-09 -20.5 6.9 10-99 23.1 13.1 11.6 13.8 14.2 14.4 14.5 13.9 12.4 12.3 12.2 13.5 12.3EMPLOYMENT EA 04-09 -16.2 5.7 01-01 21.4 11.7 10.3 12.8 13.9 13.0 14.1 13.9 14.1 13.0 12.0 13.5 12.1EXPECTED BE 03-09 -33.9 17.7 12-99 45.2 18.7 24.0 19.3 28.8 24.0 21.4 25.1 17.4 17.7 15.1 14.7 8.3OVER THE NEXT BG 05-02 -30.9 -5.0 04-08 15.4 5.8 4.5 4.3 6.4 9.9 13.4 11.7 8.0 10.1 3.3 11.8 15.13 MONTHS CZ 06-13 -33.5 -7.7 05-16 24.7 1.6 2.8 6.3 18.9 14.9 9.1 10.2 10.5 9.6 6.7 9.0 2.5(Question 5) DK 01-12 -19.0 -2.5 01-11 13.4 -2.5 0.6 0.7 -1.2 2.6 0.8 0.1 1.9 0.7 -2.2 -0.9 -2.3
DE 02-09 -13.9 5.9 08-18 23.1 15.4 14.7 16.5 19.4 20.4 19.5 16.0 19.6 19.7 19.7 23.1 21.8
EE 03-09 -26.9 10.5 03-05 27.0 12.3 10.6 15.2 11.0 13.0 10.7 6.6 5.9 9.6 8.6 10.6 8.0
IE : : : : : : : : : : : : : : : : :
EL 08-15 -45.9 -0.6 05-99 46.7 0.0 1.2 1.7 8.0 15.1 12.3 24.1 21.7 10.9 7.8 4.9 -0.6
ES 02-09 -16.1 9.5 04-00 40.4 16.6 11.2 14.2 13.0 11.4 19.1 15.8 19.0 22.4 17.7 18.1 15.3
FR 05-09 -27.9 1.8 12-00 21.9 6.2 5.1 10.6 8.0 9.4 13.0 11.2 11.5 9.4 7.0 6.4 6.4
HR 08-09 -11.0 1.4 08-18 18.8 8.5 8.4 11.6 17.8 13.9 18.3 10.4 11.8 6.6 8.5 18.8 9.3
IT 08-14 -19.8 2.2 04-00 26.2 4.3 1.7 4.4 9.4 0.9 -0.1 6.3 0.5 -2.4 -2.5 1.3 -0.2
CY 04-13 -26.1 2.2 07-08 30.0 11.8 6.6 10.0 14.0 4.4 9.0 7.3 8.8 4.9 5.6 11.4 9.7
LV 04-09 -39.9 3.4 08-06 20.4 2.4 4.1 5.4 3.6 5.0 3.3 2.6 2.5 1.6 1.7 5.1 5.2
LT 05-02 -48.9 3.7 01-07 35.1 18.4 14.9 17.7 14.6 13.5 20.2 22.0 20.4 20.1 19.3 23.2 24.2
LU : : : : : : : : : : : : : : : : :
HU 04-09 -31.2 -2.4 01-18 18.1 8.0 11.0 11.2 18.1 12.1 11.5 12.7 10.1 13.4 13.0 6.0 8.9
MT 03-09 -22.0 14.4 07-18 45.8 38.3 34.5 38.3 36.4 27.7 26.0 31.3 33.8 30.5 45.8 37.3 38.5
NL 04-09 -29.3 5.2 03-07 33.0 14.6 14.1 15.9 15.1 14.8 15.9 14.6 15.0 14.7 16.0 14.6 14.2
AT 04-09 -21.8 8.1 08-00 36.9 23.5 22.0 16.9 16.9 20.7 16.8 19.4 17.9 17.3 17.7 19.7 15.4
PL 03-03 -11.9 0.8 12-07 18.6 0.9 3.1 4.8 7.6 9.2 9.4 9.0 8.2 8.4 9.0 7.5 8.2
PT 07-03 -54.8 -4.2 05-98 21.5 11.8 11.2 10.8 9.5 11.5 7.6 10.4 10.4 10.5 11.9 8.2 10.4
RO 06-02 -44.7 0.2 03-03 24.9 7.9 9.5 8.1 8.4 7.9 5.7 6.1 4.3 5.4 5.3 2.6 2.1
SI 09-13 -31.8 -0.3 10-08 25.8 20.1 20.1 20.4 24.1 19.7 16.4 16.3 16.8 12.2 14.9 19.0 18.8
SK 12-04 -67.5 -17.7 09-18 26.8 -4.9 11.1 -1.2 -5.2 1.4 1.5 2.2 20.0 8.5 15.7 17.9 26.8
FI 11-96 -31.6 11.1 07-00 81.2 15.2 11.0 20.6 15.5 17.3 18.0 20.7 16.9 12.2 9.0 16.3 17.1
SE 02-09 -36.8 10.6 09-00 62.2 23.2 17.9 19.0 21.6 14.2 16.3 18.5 20.1 15.2 20.3 13.2 17.4
UK 01-09 -49.1 13.2 07-14 40.5 22.1 19.5 21.2 17.1 22.9 19.2 16.3 6.7 11.7 14.4 17.3 15.9
Ave.
Page 11
11
TABLE 3 (continued) : Monthly survey of services (s.a.)
Since 1990 (*) 2017 2018
Min. Max.
Date Value Date Value Oct Nov Dec Jan Feb Mar Apr May Jun Jul Aug Sep
SELLING–PRICE EU 02-09 -11.9 3.6 06-08 13.2 9.2 10.0 9.1 11.4 10.6 8.9 9.1 10.1 9.9 9.5 9.1 10.4EXPECTATIONS EA 05-09 -8.4 3.7 12-07 13.8 8.6 8.2 7.9 9.0 9.4 8.3 9.0 9.0 9.0 9.0 9.3 8.4(Question 6) BE 01-10 -13.8 6.5 07-08 28.8 10.9 15.6 25.0 21.8 12.3 8.4 12.2 14.0 17.0 15.0 13.2 13.0
BG 01-11 -11.9 5.9 07-04 37.5 2.7 5.6 2.7 5.8 7.4 6.2 3.7 6.4 5.8 5.8 6.1 7.3
CZ 02-13 -8.3 4.3 01-04 23.6 3.7 9.1 15.3 14.7 6.0 10.4 7.8 11.9 8.1 7.0 11.8 13.4
DK 01-13 -7.4 0.3 12-10 16.2 -1.4 -0.3 2.2 -0.8 2.4 2.3 0.9 2.7 4.2 0.8 3.4 3.6
DE 04-03 -8.5 11.6 04-18 24.8 22.8 18.4 19.5 21.9 24.5 21.4 24.8 24.1 22.2 24.7 23.4 23.2
EE 03-09 -31.5 9.0 01-18 26.8 16.8 16.7 22.1 26.8 22.4 17.1 11.9 13.5 16.5 19.3 18.0 14.1
IE : : : : : : : : : : : : : : : : :
EL 09-12 -40.2 -4.2 06-06 24.2 -2.0 -3.7 -5.5 -3.8 -3.6 0.7 6.6 -2.5 -1.1 0.6 -3.5 -5.2
ES 11-11 -17.9 2.9 09-04 20.3 5.8 9.1 5.9 11.4 9.0 11.5 7.8 9.5 8.5 10.4 10.2 3.9
FR 07-09 -21.0 -3.0 04-90 16.6 -3.2 -2.7 -3.0 -2.4 -3.9 -2.8 -3.0 -2.6 -4.4 -5.3 -1.3 -2.5
HR 03-10 -10.6 -0.7 07-08 25.4 5.8 1.8 6.2 1.1 4.9 4.7 5.5 4.8 2.8 3.8 1.7 5.1
IT 04-13 -15.6 -0.5 05-04 17.7 1.9 1.4 0.7 -1.8 2.1 -1.5 -0.4 0.0 5.5 0.9 0.2 1.2
CY 04-13 -38.9 0.9 06-03 72.7 -8.0 -3.3 -5.1 -9.6 -6.4 -2.0 0.9 0.2 -10.0 -1.3 -2.8 -7.0
LV 12-09 -31.1 6.3 12-07 35.8 5.9 4.4 5.8 9.7 8.2 5.3 3.9 3.2 3.8 2.7 2.1 3.2
LT 06-09 -23.0 0.7 08-06 20.8 4.9 4.2 4.4 5.4 5.6 3.4 1.7 7.0 9.3 7.2 10.1 10.7
LU : : : : : : : : : : : : : : : : :
HU 02-09 -8.5 5.9 09-06 28.0 9.5 14.7 17.5 17.4 17.0 17.9 14.7 16.2 14.9 20.5 21.8 18.8
MT 11-16 -45.0 1.7 11-17 28.4 7.7 28.4 6.0 13.1 6.3 -1.0 1.6 -1.9 -0.5 10.3 16.2 14.3
NL 08-09 -5.5 9.0 01-07 30.7 11.9 11.8 10.4 13.8 12.5 11.7 9.8 9.7 10.4 10.7 10.5 10.6
AT 05-09 -10.3 9.8 11-07 30.4 16.3 14.4 12.8 13.4 16.2 17.4 12.9 16.4 15.1 15.4 14.8 11.8
PL 07-13 -10.6 1.1 04-08 16.8 0.4 0.7 0.8 3.7 3.5 4.5 4.2 4.0 3.5 4.1 3.6 3.9
PT 11-03 -17.1 -0.7 11-05 13.7 5.7 4.2 2.9 2.9 3.1 2.7 3.0 4.1 4.5 4.9 4.5 5.2
RO 06-10 -8.7 12.3 04-04 54.5 7.2 7.2 8.0 8.8 9.6 10.9 6.2 6.9 5.5 3.6 3.7 2.0
SI 02-10 -16.4 1.3 01-08 23.1 3.8 3.1 5.2 9.9 11.3 10.1 7.7 7.3 5.8 6.6 7.1 5.8
SK 12-10 -17.5 10.6 07-02 68.9 6.4 16.9 25.3 3.0 4.2 11.6 18.1 3.5 22.5 6.7 4.7 8.3
FI 07-04 -25.1 8.6 01-08 40.7 10.8 11.8 13.8 12.1 15.1 13.3 8.6 8.0 6.2 3.2 5.6 9.8
SE 04-09 -17.0 9.4 11-07 32.4 12.9 7.1 5.4 8.3 10.3 12.9 11.8 12.2 7.4 12.8 5.7 8.8
UK 02-09 -34.3 2.1 01-18 23.8 14.3 20.9 16.0 23.8 17.8 11.6 11.0 16.2 15.7 12.9 10.2 20.7(a) The indicator is the arithmetic average of the balances (%) for the questions on business situation and recent and expected evolution of demand.
(*) Minimum, maximum and averages are calculated over the period of availability which is not necessarily as from 01/1990.
Ave.
Page 12
12
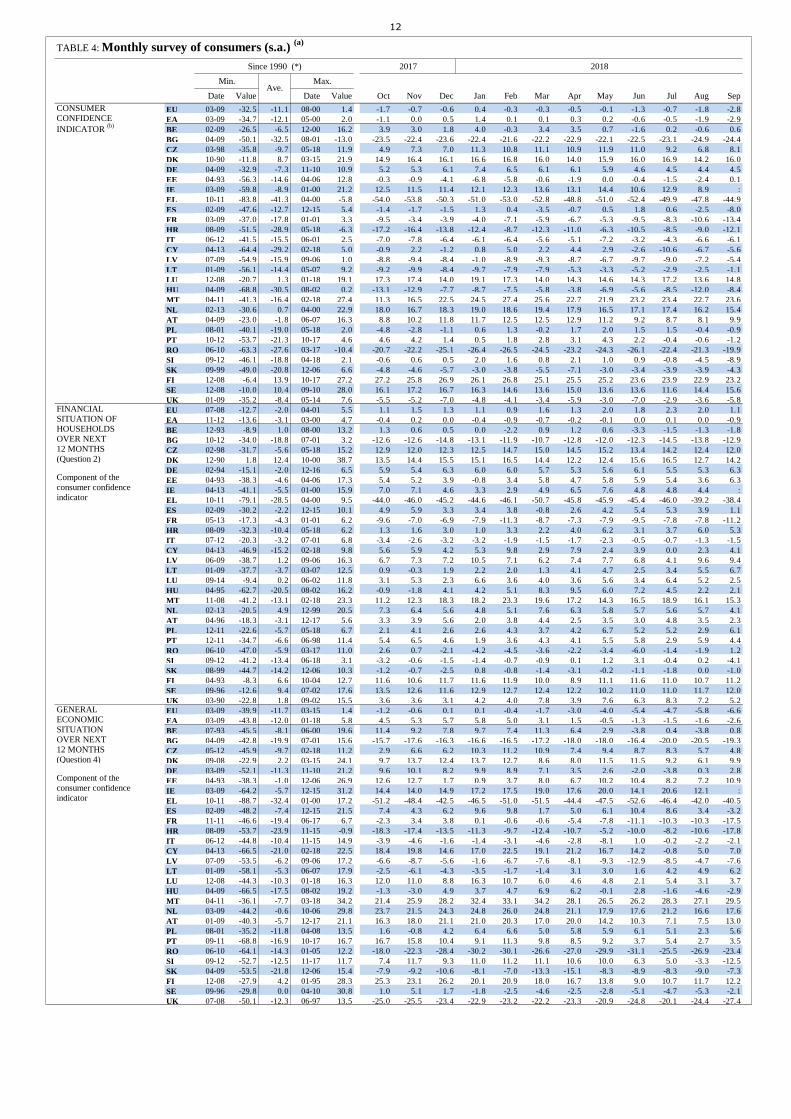
TABLE 4: Monthly survey of consumers (s.a.) (a)
Since 1990 (*) 2017 2018
Min. Max.
Date Value Date Value Oct Nov Dec Jan Feb Mar Apr May Jun Jul Aug Sep
CONSUMER EU 03-09 -32.5 -11.1 08-00 1.4 -1.7 -0.7 -0.6 0.4 -0.3 -0.3 -0.5 -0.1 -1.3 -0.7 -1.8 -2.8CONFIDENCE EA 03-09 -34.7 -12.1 05-00 2.0 -1.1 0.0 0.5 1.4 0.1 0.1 0.3 0.2 -0.6 -0.5 -1.9 -2.9
INDICATOR (b)
BE 02-09 -26.5 -6.5 12-00 16.2 3.9 3.0 1.8 4.0 -0.3 3.4 3.5 0.7 -1.6 0.2 -0.6 0.6
BG 04-09 -50.1 -32.5 08-01 -13.0 -23.5 -22.4 -23.6 -22.4 -21.6 -22.2 -22.9 -22.1 -22.5 -23.1 -24.9 -24.4
CZ 03-98 -35.8 -9.7 05-18 11.9 4.9 7.3 7.0 11.3 10.8 11.1 10.9 11.9 11.0 9.2 6.8 8.1
DK 10-90 -11.8 8.7 03-15 21.9 14.9 16.4 16.1 16.6 16.8 16.0 14.0 15.9 16.0 16.9 14.2 16.0
DE 04-09 -32.9 -7.3 11-10 10.9 5.2 5.3 6.1 7.4 6.5 6.1 6.1 5.9 4.6 4.5 4.4 4.5
EE 04-93 -56.3 -14.6 04-06 12.8 -0.3 -0.9 -4.1 -6.8 -5.8 -0.6 -1.9 0.0 -0.4 -1.5 -2.4 0.1
IE 03-09 -59.8 -8.9 01-00 21.2 12.5 11.5 11.4 12.1 12.3 13.6 13.1 14.4 10.6 12.9 8.9 :
EL 10-11 -83.8 -41.3 04-00 -5.8 -54.0 -53.8 -50.3 -51.0 -53.0 -52.8 -48.8 -51.0 -52.4 -49.9 -47.8 -44.9
ES 02-09 -47.6 -12.7 12-15 5.4 -1.4 -1.7 -1.5 1.3 0.4 -3.5 -0.7 0.5 1.8 0.6 -2.5 -8.0
FR 03-09 -37.0 -17.8 01-01 3.3 -9.5 -3.4 -3.9 -4.0 -7.1 -5.9 -6.7 -5.3 -9.5 -8.3 -10.6 -13.4
HR 08-09 -51.5 -28.9 05-18 -6.3 -17.2 -16.4 -13.8 -12.4 -8.7 -12.3 -11.0 -6.3 -10.5 -8.5 -9.0 -12.1
IT 06-12 -41.5 -15.5 06-01 2.5 -7.0 -7.8 -6.4 -6.1 -6.4 -5.6 -5.1 -7.2 -3.2 -4.3 -6.6 -6.1
CY 04-13 -64.4 -29.2 02-18 5.0 -0.9 2.2 -1.2 0.8 5.0 2.2 4.4 2.9 -2.6 -10.6 -6.7 -5.6
LV 07-09 -54.9 -15.9 09-06 1.0 -8.8 -9.4 -8.4 -1.0 -8.9 -9.3 -8.7 -6.7 -9.7 -9.0 -7.2 -5.4
LT 01-09 -56.1 -14.4 05-07 9.2 -9.2 -9.9 -8.4 -9.7 -7.9 -7.9 -5.3 -3.3 -5.2 -2.9 -2.5 -1.1
LU 12-08 -20.7 1.3 01-18 19.1 17.3 17.4 14.0 19.1 17.3 14.0 14.3 14.6 14.3 17.2 13.6 14.8
HU 04-09 -68.8 -30.5 08-02 0.2 -13.1 -12.9 -7.7 -8.7 -7.5 -5.8 -3.8 -6.9 -5.6 -8.5 -12.0 -8.4
MT 04-11 -41.3 -16.4 02-18 27.4 11.3 16.5 22.5 24.5 27.4 25.6 22.7 21.9 23.2 23.4 22.7 23.6
NL 02-13 -30.6 0.7 04-00 22.9 18.0 16.7 18.3 19.0 18.6 19.4 17.9 16.5 17.1 17.4 16.2 15.4
AT 04-09 -23.0 -1.8 06-07 16.3 8.8 10.2 11.8 11.7 12.5 12.5 12.9 11.2 9.2 8.7 8.1 9.9
PL 08-01 -40.1 -19.0 05-18 2.0 -4.8 -2.8 -1.1 0.6 1.3 -0.2 1.7 2.0 1.5 1.5 -0.4 -0.9
PT 10-12 -53.7 -21.3 10-17 4.6 4.6 4.2 1.4 0.5 1.8 2.8 3.1 4.3 2.2 -0.4 -0.6 -1.2
RO 06-10 -63.3 -27.6 03-17 -10.4 -20.7 -22.2 -25.1 -26.4 -26.5 -24.5 -23.2 -24.3 -26.1 -22.4 -21.3 -19.9
SI 09-12 -46.1 -18.8 04-18 2.1 -0.6 0.6 0.5 2.0 1.6 0.8 2.1 1.0 0.9 -0.8 -4.5 -8.9
SK 09-99 -49.0 -20.8 12-06 6.6 -4.8 -4.6 -5.7 -3.0 -3.8 -5.5 -7.1 -3.0 -3.4 -3.9 -3.9 -4.3
FI 12-08 -6.4 13.9 10-17 27.2 27.2 25.8 26.9 26.1 26.8 25.1 25.5 25.2 23.6 23.9 22.9 23.2
SE 12-08 -10.0 10.4 09-10 28.0 16.1 17.2 16.7 16.3 14.6 13.6 15.0 13.6 13.6 11.6 14.4 15.6
UK 01-09 -35.2 -8.4 05-14 7.6 -5.5 -5.2 -7.0 -4.8 -4.1 -3.4 -5.9 -3.0 -7.0 -2.9 -3.6 -5.8FINANCIAL EU 07-08 -12.7 -2.0 04-01 5.5 1.1 1.5 1.3 1.1 0.9 1.6 1.3 2.0 1.8 2.3 2.0 1.1SITUATION OF EA 11-12 -13.6 -3.1 03-00 4.7 -0.4 0.2 0.0 -0.4 -0.9 -0.7 -0.2 -0.1 0.0 0.1 0.0 -0.9HOUSEHOLDS BE 12-93 -8.9 1.0 08-00 13.2 1.3 0.6 0.5 0.0 -2.2 0.9 1.2 0.6 -3.3 -1.5 -1.3 -1.8OVER NEXT BG 10-12 -34.0 -18.8 07-01 3.2 -12.6 -12.6 -14.8 -13.1 -11.9 -10.7 -12.8 -12.0 -12.3 -14.5 -13.8 -12.912 MONTHS CZ 02-98 -31.7 -5.6 05-18 15.2 12.9 12.0 12.3 12.5 14.7 15.0 14.5 15.2 13.4 14.2 12.4 12.0(Question 2) DK 12-90 1.8 12.4 10-00 38.7 13.5 14.4 15.5 15.1 16.5 14.4 12.2 12.4 15.6 16.5 12.7 14.2
DE 02-94 -15.1 -2.0 12-16 6.5 5.9 5.4 6.3 6.0 6.0 5.7 5.3 5.6 6.1 5.5 5.3 6.3Component of the EE 04-93 -38.3 -4.6 04-06 17.3 5.4 5.2 3.9 -0.8 3.4 5.8 4.7 5.8 5.9 5.4 3.6 6.3consumer confidence IE 04-13 -41.1 -5.5 01-00 15.9 7.0 7.1 4.6 3.3 2.9 4.9 6.5 7.6 4.8 4.8 4.4 :indicator EL 10-11 -79.1 -28.5 04-00 9.5 -44.0 -46.0 -45.2 -44.6 -46.1 -50.7 -45.8 -45.9 -45.4 -46.0 -39.2 -38.4
ES 02-09 -30.2 -2.2 12-15 10.1 4.9 5.9 3.3 3.4 3.8 -0.8 2.6 4.2 5.4 5.3 3.9 1.1
FR 05-13 -17.3 -4.3 01-01 6.2 -9.6 -7.0 -6.9 -7.9 -11.3 -8.7 -7.3 -7.9 -9.5 -7.8 -7.8 -11.2
HR 08-09 -32.3 -10.4 05-18 6.2 1.3 1.6 3.0 1.0 3.3 2.2 4.0 6.2 3.1 3.7 6.0 5.3
IT 07-12 -20.3 -3.2 07-01 6.8 -3.4 -2.6 -3.2 -3.2 -1.9 -1.5 -1.7 -2.3 -0.5 -0.7 -1.3 -1.5
CY 04-13 -46.9 -15.2 02-18 9.8 5.6 5.9 4.2 5.3 9.8 2.9 7.9 2.4 3.9 0.0 2.3 4.1
LV 06-09 -38.7 1.2 09-06 16.3 6.7 7.3 7.2 10.5 7.1 6.2 7.4 7.7 6.8 4.1 9.6 9.4
LT 01-09 -37.7 -3.7 03-07 12.5 0.9 -0.3 1.9 2.2 2.0 1.3 4.1 4.7 2.5 3.4 5.5 6.7
LU 09-14 -9.4 0.2 06-02 11.8 3.1 5.3 2.3 6.6 3.6 4.0 3.6 5.6 3.4 6.4 5.2 2.5
HU 04-95 -62.7 -20.5 08-02 16.2 -0.9 -1.8 4.1 4.2 5.1 8.3 9.5 6.0 7.2 4.5 2.2 2.1
MT 11-08 -41.2 -13.1 02-18 23.3 11.2 12.3 18.3 18.2 23.3 19.6 17.2 14.3 16.5 18.9 16.1 15.3
NL 02-13 -20.5 4.9 12-99 20.5 7.3 6.4 5.6 4.8 5.1 7.6 6.3 5.8 5.7 5.6 5.7 4.1
AT 04-96 -18.3 -3.1 12-17 5.6 3.3 3.9 5.6 2.0 3.8 4.4 2.5 3.5 3.0 4.8 3.5 2.3
PL 12-11 -22.6 -5.7 05-18 6.7 2.1 4.1 2.6 2.6 4.3 3.7 4.2 6.7 5.2 5.2 2.9 6.1
PT 12-11 -34.7 -6.6 06-98 11.4 5.4 6.5 4.6 1.9 3.6 4.3 4.1 5.5 5.8 2.9 5.9 4.4
RO 06-10 -47.0 -5.9 03-17 11.0 2.6 0.7 -2.1 -4.2 -4.5 -3.6 -2.2 -3.4 -6.0 -1.4 -1.9 1.2
SI 09-12 -41.2 -13.4 06-18 3.1 -3.2 -0.6 -1.5 -1.4 -0.7 -0.9 0.1 1.2 3.1 -0.4 0.2 -4.1
SK 08-99 -44.7 -14.2 12-06 10.3 -1.2 -0.7 -2.5 0.8 -0.8 -1.4 -3.1 -0.2 -1.1 -1.8 0.0 -1.0
FI 04-93 -8.3 6.6 10-04 12.7 11.6 10.6 11.7 11.6 11.9 10.0 8.9 11.1 11.6 11.0 10.7 11.2
SE 09-96 -12.6 9.4 07-02 17.6 13.5 12.6 11.6 12.9 12.7 12.4 12.2 10.2 11.0 11.0 11.7 12.0
UK 03-90 -22.8 1.8 09-02 15.5 3.6 3.6 3.1 4.2 4.0 7.8 3.9 7.6 6.3 8.3 7.2 5.2GENERAL EU 03-09 -39.9 -11.7 03-15 1.4 -1.2 -0.6 0.1 0.1 -0.4 -1.7 -3.0 -4.0 -5.4 -4.7 -5.8 -6.6ECONOMIC EA 03-09 -43.8 -12.0 01-18 5.8 4.5 5.3 5.7 5.8 5.0 3.1 1.5 -0.5 -1.3 -1.5 -1.6 -2.6SITUATION BE 07-93 -45.5 -8.1 06-00 19.6 11.4 9.2 7.8 9.7 7.4 11.3 6.4 2.9 -3.8 0.4 -3.8 0.8OVER NEXT BG 04-09 -42.8 -19.9 07-01 15.6 -15.7 -17.6 -16.3 -16.6 -16.5 -17.2 -18.0 -18.0 -16.4 -20.0 -20.5 -19.312 MONTHS CZ 05-12 -45.9 -9.7 02-18 11.2 2.9 6.6 6.2 10.3 11.2 10.9 7.4 9.4 8.7 8.3 5.7 4.8(Question 4) DK 09-08 -22.9 2.2 03-15 24.1 9.7 13.7 12.4 13.7 12.7 8.6 8.0 11.5 11.5 9.2 6.1 9.9
DE 03-09 -52.1 -11.3 11-10 21.2 9.6 10.1 8.2 9.9 8.9 7.1 3.5 2.6 -2.0 -3.8 0.3 2.8Component of the EE 04-93 -38.3 -1.0 12-06 26.9 12.6 12.7 1.7 0.9 3.7 8.0 6.7 10.2 10.4 8.2 7.2 10.9consumer confidence IE 03-09 -64.2 -5.7 12-15 31.2 14.4 14.0 14.9 17.2 17.5 19.0 17.6 20.0 14.1 20.6 12.1 :indicator EL 10-11 -88.7 -32.4 01-00 17.2 -51.2 -48.4 -42.5 -46.5 -51.0 -51.5 -44.4 -47.5 -52.6 -46.4 -42.0 -40.5
ES 02-09 -48.2 -7.4 12-15 21.5 7.4 4.3 6.2 9.6 9.8 1.7 5.0 6.1 10.4 8.6 3.4 -3.2
FR 11-11 -46.6 -19.4 06-17 6.7 -2.3 3.4 3.8 0.1 -0.6 -0.6 -5.4 -7.8 -11.1 -10.3 -10.3 -17.5
HR 08-09 -53.7 -23.9 11-15 -0.9 -18.3 -17.4 -13.5 -11.3 -9.7 -12.4 -10.7 -5.2 -10.0 -8.2 -10.6 -17.8
IT 06-12 -44.8 -10.4 11-15 14.9 -3.9 -4.6 -1.6 -1.4 -3.1 -4.6 -2.8 -8.1 1.0 -0.2 -2.2 -2.1
CY 04-13 -66.5 -21.0 02-18 22.5 18.4 19.8 14.6 17.0 22.5 19.1 21.2 16.7 14.2 -0.8 5.0 7.0
LV 07-09 -53.5 -6.2 09-06 17.2 -6.6 -8.7 -5.6 -1.6 -6.7 -7.6 -8.1 -9.3 -12.9 -8.5 -4.7 -7.6
LT 01-09 -58.1 -5.3 06-07 17.9 -2.5 -6.1 -4.3 -3.5 -1.7 -1.4 3.1 3.0 1.6 4.2 4.9 6.2
LU 12-08 -44.3 -10.3 01-18 16.3 12.0 11.0 8.8 16.3 10.7 6.0 4.6 4.8 2.1 5.4 3.1 3.7
HU 04-09 -66.5 -17.5 08-02 19.2 -1.3 -3.0 4.9 3.7 4.7 6.9 6.2 -0.1 2.8 -1.6 -4.6 -2.9
MT 04-11 -36.1 -7.7 03-18 34.2 21.4 25.9 28.2 32.4 33.1 34.2 28.1 26.5 26.2 28.3 27.1 29.5
NL 03-09 -44.2 -0.6 10-06 29.8 23.7 21.5 24.3 24.8 26.0 24.8 21.1 17.9 17.6 21.2 16.6 17.6
AT 01-09 -40.3 -5.7 12-17 21.1 16.3 18.0 21.1 21.0 20.3 17.0 20.0 14.2 10.3 7.1 7.5 13.0
PL 08-01 -35.2 -11.8 04-08 13.5 1.6 -0.8 4.2 6.4 6.6 5.0 5.8 5.9 6.1 5.1 2.3 5.6
PT 09-11 -68.8 -16.9 10-17 16.7 16.7 15.8 10.4 9.1 11.3 9.8 8.5 9.2 3.7 5.4 2.7 3.5
RO 06-10 -64.1 -14.3 01-05 12.2 -18.0 -22.3 -28.4 -30.2 -30.1 -26.6 -27.0 -29.9 -31.1 -25.5 -26.9 -23.4
SI 09-12 -52.7 -12.5 11-17 11.7 7.4 11.7 9.3 11.0 11.2 11.1 10.6 10.0 6.3 5.0 -3.3 -12.5
SK 04-09 -53.5 -21.8 12-06 15.4 -7.9 -9.2 -10.6 -8.1 -7.0 -13.3 -15.1 -8.3 -8.9 -8.3 -9.0 -7.3
FI 12-08 -27.9 4.2 01-95 28.3 25.3 23.1 26.2 20.1 20.9 18.0 16.7 13.8 9.0 10.7 11.7 12.2
SE 09-96 -29.8 0.0 04-10 30.8 1.0 5.1 1.7 -1.8 -2.5 -4.6 -2.5 -2.8 -5.1 -4.7 -5.3 -2.1
UK 07-08 -50.1 -12.3 06-97 13.5 -25.0 -25.5 -23.4 -22.9 -23.2 -22.2 -23.3 -20.9 -24.8 -20.1 -24.4 -27.4
Ave.
Page 13
13
TABLE 4 (continued) : Monthly survey of consumers (s.a.) (a)
Since 1990 (*) 2017 2018
Min. Max.
Date Value Date Value Oct Nov Dec Jan Feb Mar Apr May Jun Jul Aug Sep
SAVINGS EU 08-93 -16.5 -6.5 08-18 3.0 -0.3 1.6 1.0 1.8 1.4 1.1 1.2 2.6 0.3 2.4 3.0 1.4OVER NEXT EA 06-08 -17.5 -8.3 04-01 1.1 -3.5 -1.7 -1.3 -1.3 -2.6 -3.3 -2.2 -1.0 -2.6 -1.5 -1.6 -2.612 MONTHS BE 12-12 -9.3 8.1 06-98 31.2 2.8 2.5 3.3 -0.2 -3.1 -2.1 1.6 -1.6 0.7 -1.0 1.6 1.6(Question 11) BG 03-02 -80.7 -64.1 01-17 -42.7 -46.3 -43.5 -44.9 -45.7 -44.3 -47.6 -47.9 -48.8 -49.9 -44.2 -46.6 -46.8
CZ 03-98 -16.2 -0.9 06-18 20.5 7.8 10.3 10.5 19.8 14.6 18.1 19.2 19.7 20.5 16.2 10.7 18.1Component of the DK 01-90 -3.2 24.8 12-06 39.9 27.5 29.0 26.2 25.6 29.4 29.8 26.9 29.2 26.0 32.2 27.2 32.1consumer confidence DE 03-03 -5.2 6.2 08-90 23.4 10.7 11.9 13.4 14.7 12.7 10.1 13.2 12.2 11.3 13.2 12.3 11.4indicator EE 10-93 -69.2 -34.6 05-06 -4.2 -16.5 -17.5 -17.9 -25.8 -24.3 -15.0 -16.2 -15.4 -15.7 -18.0 -19.0 -18.1
IE 04-13 -14.6 2.0 04-15 25.1 : : : : : : : : : : : :
EL 04-17 -86.8 -53.9 01-00 -23.3 -78.6 -79.5 -77.5 -75.9 -75.9 -76.3 -72.8 -77.4 -75.8 -74.9 -75.1 -75.3
ES 12-08 -44.5 -23.6 07-00 0.0 -17.5 -15.4 -17.1 -17.8 -19.1 -20.7 -21.1 -18.0 -18.1 -18.1 -16.2 -15.9
FR 03-96 -35.8 -17.1 06-17 -1.1 -10.7 -5.8 -4.6 -6.7 -9.3 -10.1 -11.2 -6.7 -10.7 -7.1 -7.7 -10.2
HR 12-12 -63.5 -52.4 08-18 -29.8 -36.1 -37.2 -38.1 -38.3 -35.0 -36.8 -40.9 -32.0 -34.8 -32.9 -29.8 -34.8
IT 09-12 -49.5 -21.4 03-91 2.2 -13.2 -12.5 -13.0 -11.7 -11.3 -9.6 -9.2 -7.1 -10.4 -11.3 -11.0 -12.3
CY 06-13 -67.1 -45.4 06-01 -12.3 -32.7 -34.2 -33.6 -36.5 -32.2 -32.8 -30.3 -28.7 -37.8 -44.1 -41.2 -38.4
LV 10-09 -69.7 -43.6 01-18 -11.1 -27.0 -22.9 -26.2 -11.1 -23.8 -25.1 -25.1 -21.6 -24.0 -28.3 -26.6 -18.6
LT 11-01 -55.0 -37.5 09-18 -16.2 -28.5 -30.7 -26.8 -31.1 -24.7 -23.0 -25.1 -17.9 -21.4 -18.2 -17.7 -16.2
LU 10-16 32.9 44.4 10-05 58.0 52.6 52.9 44.8 48.9 49.6 43.4 42.7 43.9 46.0 53.6 45.1 49.6
HU 05-12 -77.1 -55.7 01-00 -19.0 -46.2 -43.4 -40.4 -43.8 -38.3 -35.1 -33.4 -34.6 -33.9 -35.3 -41.5 -33.2
MT 04-11 -66.1 -36.2 02-18 24.7 -7.2 0.4 11.2 17.0 24.7 16.6 14.5 13.8 20.2 18.2 18.8 17.8
NL 02-13 1.3 13.9 10-00 26.4 13.4 13.4 14.0 15.6 14.3 14.3 15.5 15.9 17.1 16.0 15.4 13.2
AT 11-00 -11.3 26.3 03-02 54.6 20.0 21.2 21.8 19.8 20.7 24.1 25.3 22.3 20.3 24.0 25.2 24.0
PL 09-03 -65.7 -39.2 07-18 -12.3 -23.7 -20.3 -17.5 -17.8 -12.4 -14.9 -15.7 -14.4 -14.5 -12.3 -14.8 -17.7
PT 01-97 -42.7 -27.2 02-98 -1.9 -17.9 -18.8 -21.8 -21.6 -17.9 -18.5 -18.5 -17.2 -16.7 -19.7 -18.7 -17.8
RO 06-10 -69.8 -53.1 04-17 -37.2 -45.0 -42.4 -45.4 -47.2 -49.1 -47.6 -45.9 -44.8 -51.6 -46.2 -42.3 -40.1
SI 06-99 -52.0 -24.2 05-07 -6.2 -15.2 -17.1 -17.6 -14.8 -14.2 -15.0 -13.3 -15.2 -12.4 -14.3 -15.0 -19.4
SK 08-01 -69.1 -29.9 09-17 -12.6 -15.7 -13.1 -15.2 -12.9 -14.6 -14.8 -18.0 -13.5 -12.9 -16.0 -12.9 -15.6
FI 01-96 19.0 45.8 04-08 58.4 56.0 53.5 54.5 54.8 52.5 52.7 54.7 53.9 55.7 54.7 53.8 55.0
SE 06-98 11.1 38.9 10-15 62.1 49.1 48.2 47.5 50.1 44.8 41.9 48.1 44.4 47.1 38.0 50.0 49.9
UK 10-92 -26.0 1.1 04-16 24.0 14.3 16.6 11.4 15.7 18.1 19.6 15.5 18.5 12.7 20.1 23.4 17.6UNEMPLOYMENT EU 03-09 67.0 24.3 05-00 0.9 6.3 5.3 4.9 1.5 3.2 2.2 1.4 0.9 2.2 2.7 6.6 7.1OVER NEXT EA 03-09 68.5 24.9 05-18 -2.4 4.8 3.6 2.4 -1.3 1.0 -1.2 -2.3 -2.4 -1.8 -0.8 4.6 5.4
12 MONTHS (c)
BE 02-09 76.0 27.0 12-00 -17.2 -0.1 0.3 4.4 -6.4 3.2 -3.4 -4.6 -0.7 0.1 -3.1 -1.2 -1.6(Question 7) BG 02-10 65.5 27.2 07-01 -1.6 19.4 16.1 18.5 14.2 13.7 13.2 13.0 9.6 11.2 13.8 18.8 18.8
CZ 01-99 67.8 24.2 05-17 -4.1 3.8 -0.2 1.0 -2.6 -2.8 -0.6 -2.4 -3.4 -1.6 1.7 1.7 2.3Component of the DK 02-09 51.4 4.6 02-95 -20.5 -8.8 -8.4 -10.4 -12.0 -8.6 -11.2 -8.9 -10.7 -11.1 -9.8 -11.0 -8.0consumer confidence DE 03-09 71.9 22.2 05-07 -18.6 5.5 6.3 3.5 1.1 1.6 -1.6 -2.3 -3.2 -3.2 -3.3 0.5 2.8indicator EE 09-93 81.0 21.2 09-06 -21.6 2.8 3.9 3.9 1.7 6.0 1.2 2.8 0.5 2.4 1.6 1.6 -1.3
IE 03-09 80.2 15.7 12-99 -29.8 -16.0 -13.4 -14.6 -15.8 -16.4 -17.0 -15.1 -15.7 -12.7 -13.4 -10.4 :
EL 12-11 92.9 50.6 02-15 15.7 42.3 41.3 36.1 37.1 39.1 32.8 32.1 32.9 35.6 32.3 35.0 25.4
ES 12-08 71.2 17.4 04-15 -16.1 0.3 1.5 -1.8 -10.1 -7.2 -5.9 -10.6 -9.8 -9.4 -6.7 1.3 14.1
FR 03-09 74.0 30.4 01-01 -12.7 15.2 4.1 8.0 1.2 7.1 4.4 2.8 -1.3 6.7 8.1 16.5 14.9
HR 03-10 67.5 28.8 02-18 -6.5 15.7 12.6 6.6 1.1 -6.5 2.2 -3.7 -6.0 0.4 -3.4 1.6 1.0
IT 03-93 70.8 27.1 06-01 -4.0 7.5 11.5 7.6 8.1 9.3 6.6 6.9 11.4 3.0 5.0 11.9 8.3
CY 04-13 79.5 35.0 05-18 -21.2 -5.3 -17.1 -9.8 -17.5 -20.1 -19.6 -18.9 -21.2 -9.2 -2.5 -7.2 -4.8
LV 02-09 80.1 20.7 09-06 -10.4 8.4 13.4 8.9 1.7 12.4 10.9 9.0 3.4 8.7 3.4 7.2 4.9
LT 02-09 82.1 11.1 06-07 -33.1 6.6 2.6 4.3 6.5 6.9 8.6 3.2 3.0 3.6 1.0 2.7 1.2
LU 04-09 75.2 29.3 05-17 -10.0 -1.5 -0.4 -0.3 -4.5 -5.3 -2.5 -6.4 -4.0 -5.6 -3.4 -0.9 -3.2
HU 02-09 84.0 29.5 07-98 -6.2 3.9 3.6 -0.6 -1.3 1.4 3.5 -2.5 -1.1 -1.4 1.7 4.0 -0.3
MT 01-04 45.7 8.7 05-18 -32.9 -19.7 -27.3 -32.2 -30.2 -28.5 -31.9 -31.0 -32.9 -30.0 -28.3 -28.6 -31.9
NL 03-09 80.0 15.4 03-18 -30.8 -27.7 -25.4 -29.5 -30.8 -29.1 -30.8 -28.7 -26.3 -28.1 -26.8 -26.9 -26.9
AT 04-09 65.4 24.7 03-01 -8.1 4.3 2.3 1.4 -3.8 -5.2 -4.4 -3.9 -4.9 -3.4 1.2 3.7 -0.4
PL 05-01 61.0 19.1 07-07 -20.2 -0.9 -5.6 -6.5 -11.2 -6.6 -5.3 -12.5 -9.9 -9.3 -8.1 -8.2 -2.2
PT 02-09 85.6 34.6 06-17 -20.0 -14.1 -13.3 -12.5 -12.6 -10.5 -15.4 -18.2 -19.8 -16.2 -9.8 -7.8 -5.0
RO 02-10 78.0 37.0 01-07 10.5 22.6 25.0 24.4 23.8 22.2 20.2 17.5 19.0 15.5 16.6 13.9 17.3
SI 01-09 72.7 25.2 01-18 -13.2 -8.7 -8.6 -12.0 -13.2 -10.2 -8.2 -11.0 -8.0 -6.5 -6.6 0.1 -0.4
SK 03-09 76.5 17.2 01-07 -19.5 -5.5 -4.6 -5.6 -8.1 -7.2 -7.4 -7.8 -10.1 -9.4 -10.6 -6.4 -6.6
FI 12-08 51.8 3.6 03-98 -27.7 -15.8 -16.3 -15.4 -17.9 -22.0 -19.5 -21.6 -21.8 -18.1 -19.3 -15.2 -14.5
SE 04-09 64.0 6.8 08-00 -28.0 -1.0 -3.0 -5.9 -4.0 -3.5 -4.8 -2.2 -2.7 -1.5 -2.4 -1.2 -2.7
UK 01-09 75.3 24.3 07-97 -13.9 14.9 15.7 19.0 16.2 15.1 18.7 19.9 17.4 22.1 20.0 20.6 18.4FINANCIAL EU 02-13 -21.4 -10.8 05-00 -1.7 -3.5 -3.4 -3.6 -3.2 -3.7 -3.6 -4.1 -3.3 -3.6 -2.8 -3.2 -3.6SITUATION OF EA 07-08 -23.2 -11.9 05-90 -0.6 -5.4 -5.3 -5.1 -4.8 -5.5 -6.0 -6.2 -5.5 -5.5 -5.1 -5.8 -6.0HOUSEHOLDS BE 12-08 -16.5 -7.2 11-00 3.5 -5.5 -6.0 -5.9 -6.3 -7.4 -6.1 -5.2 -6.4 -7.3 -7.9 -9.0 -8.5OVER LAST BG 10-12 -45.8 -31.0 06-18 -12.5 -17.6 -16.1 -17.8 -17.1 -16.5 -13.6 -15.0 -14.3 -12.5 -17.9 -18.1 -15.912 MONTHS CZ 05-12 -33.1 -12.9 05-18 9.6 3.3 4.3 6.4 5.5 4.5 8.0 8.5 9.6 7.7 8.4 5.2 8.7(Question 1) DK 02-12 -5.8 5.2 02-05 15.8 10.4 7.0 5.8 5.8 5.9 7.7 4.5 8.6 6.2 7.9 6.4 6.5
DE 12-02 -31.2 -6.8 09-18 7.7 6.0 6.5 5.5 7.0 6.7 6.2 5.7 5.7 6.9 6.3 6.6 7.7
EE 04-93 -54.1 -12.6 03-07 18.0 -0.8 0.2 -1.4 -2.9 -1.3 1.0 2.8 1.6 2.3 3.9 1.4 3.0
IE 02-11 -53.2 -13.4 04-00 11.2 0.7 1.2 1.4 1.9 1.6 2.2 0.7 2.7 1.8 3.6 2.2 :
EL 04-12 -86.0 -39.8 04-00 -6.2 -54.5 -52.7 -52.8 -51.7 -50.3 -54.6 -49.8 -48.1 -43.7 -46.0 -44.6 -45.1
ES 11-12 -44.7 -14.3 04-00 3.8 -7.0 -6.1 -8.3 -9.2 -8.5 -11.1 -11.0 -9.9 -7.3 -7.5 -7.7 -9.8
FR 08-08 -23.5 -12.4 01-01 -2.1 -12.9 -11.8 -10.7 -9.8 -13.8 -14.5 -16.8 -14.6 -16.7 -16.5 -18.8 -19.2
HR 03-11 -43.4 -24.6 05-18 -0.3 -9.5 -6.4 -7.7 -8.2 -6.2 -7.6 -7.1 -0.3 -7.6 -4.8 -3.9 -2.8
IT 01-13 -40.2 -17.9 05-90 -0.9 -12.3 -13.8 -12.3 -13.1 -11.4 -10.2 -9.4 -9.7 -9.8 -7.9 -9.0 -10.1
CY 09-13 -53.4 -24.2 02-18 -0.4 -5.6 -5.4 -5.2 -5.1 -0.4 -5.8 -1.1 -3.0 -4.5 -9.2 -6.8 -4.5
LV 10-09 -64.3 -11.0 09-06 9.4 -2.2 -1.8 0.1 -0.9 -0.7 1.5 1.2 0.7 0.4 0.9 3.3 1.4
LT 03-10 -45.6 -13.9 03-07 14.6 -14.8 -14.7 -16.0 -13.1 -12.7 -10.4 -7.4 -5.2 -7.6 -4.8 -5.1 -3.1
LU 08-08 -11.0 -2.4 01-02 7.7 1.6 4.8 3.8 5.7 4.2 1.4 1.2 0.9 1.7 3.8 3.0 4.1
HU 11-95 -64.7 -32.8 06-18 4.4 -5.8 -5.6 0.8 0.9 -0.3 3.0 4.1 1.3 4.4 1.8 -1.4 -1.2
MT 08-12 -54.4 -21.9 02-18 22.2 14.8 21.7 21.1 20.3 22.2 19.1 15.8 12.3 17.8 17.3 14.3 15.4
NL 06-13 -27.4 -1.2 12-99 21.1 0.6 -1.4 1.6 -0.4 -2.6 -2.8 -0.4 -0.3 -1.6 0.3 0.5 0.1
AT 06-08 -27.8 -11.4 01-18 1.0 0.4 -1.4 0.1 1.0 -1.9 -2.5 -2.8 -0.6 -2.7 0.4 -1.2 -1.2
PL 08-01 -34.5 -12.2 07-18 10.0 4.8 5.6 2.2 7.8 7.2 5.8 8.4 7.2 8.3 10.0 7.3 7.0
PT 03-13 -41.7 -16.0 01-92 2.9 -4.4 -4.1 -3.1 -3.0 -3.2 -3.8 -2.1 -1.8 -3.2 -4.1 -4.1 -3.6
RO 12-10 -54.3 -20.3 09-17 5.2 0.2 0.3 -2.2 -5.7 -9.5 -6.4 -5.3 -5.0 -7.3 -3.9 -4.1 -2.0
SI 01-08 -48.1 -27.6 04-18 -5.0 -9.4 -9.4 -8.5 -7.9 -7.1 -6.3 -5.0 -7.6 -5.7 -7.0 -7.6 -9.3
SK 10-99 -43.0 -18.0 04-07 4.8 -5.4 -3.8 -3.8 -4.9 -4.5 -5.1 -7.6 -5.3 -6.6 -4.7 -3.7 -4.9
FI 04-93 -21.7 1.4 04-05 9.4 7.1 3.6 7.2 5.8 7.0 7.3 6.9 7.5 6.8 6.8 7.7 7.0
SE 11-95 -12.9 4.5 04-07 13.0 6.4 7.9 8.2 10.6 9.6 7.5 7.3 7.6 5.5 5.8 9.5 8.9
UK 05-90 -32.4 -8.2 06-02 7.0 -0.4 0.0 -1.6 -1.8 -0.8 1.4 -1.1 0.3 -1.2 1.6 2.8 1.1
Ave.
Page 14
14
TABLE 4 (continued) : Monthly survey of consumers (s.a.) (a)
Since 1990 (*) 2017 2018
Min. Max.
Date Value Date Value Oct Nov Dec Jan Feb Mar Apr May Jun Jul Aug Sep
GENERAL EU 05-09 -66.1 -27.2 02-18 -2.7 -4.1 -4.0 -2.7 -2.8 -2.7 -3.1 -3.4 -4.0 -5.1 -4.6 -5.8 -7.6ECONOMIC EA 03-09 -65.6 -28.0 01-18 2.7 1.0 1.5 2.4 2.7 2.6 2.2 1.8 0.5 -0.5 -0.6 -2.0 -4.2SITUATION BE 02-09 -75.7 -24.8 12-00 22.4 4.1 2.9 -0.3 4.1 4.6 6.6 5.3 2.0 -0.8 1.4 -3.5 -3.6OVER LAST BG 03-10 -59.5 -37.6 08-01 -8.8 -25.9 -25.4 -23.9 -23.2 -23.3 -23.1 -23.9 -24.1 -22.8 -25.9 -27.2 -24.912 MONTHS CZ 08-12 -60.0 -19.4 05-18 16.8 3.5 4.1 9.9 10.5 11.7 12.7 13.4 16.8 16.4 13.9 13.6 15.2(Question 3) DK 03-09 -53.9 0.1 03-06 26.3 15.0 17.4 18.0 17.5 19.5 17.9 16.2 18.7 22.4 17.1 15.9 14.9
DE 06-09 -67.3 -16.3 05-11 29.3 13.9 16.1 15.6 15.7 17.0 16.2 12.7 12.2 11.9 8.5 12.5 13.9
EE 10-92 -72.1 -10.6 01-07 33.0 11.1 7.9 1.7 0.4 -1.4 7.6 4.5 7.9 7.2 6.3 2.9 7.9
IE 07-09 -91.8 -46.7 04-15 20.9 : : : : : : : : : : : :
EL 01-12 -98.6 -46.8 05-00 5.8 -62.9 -60.7 -57.2 -57.2 -56.2 -55.6 -52.7 -53.1 -48.9 -47.9 -47.8 -48.7
ES 08-12 -82.0 -25.3 03-00 12.8 4.4 1.8 -2.3 -0.2 -0.7 -7.0 -3.9 -3.7 2.4 3.6 -2.5 -9.8
FR 08-09 -74.2 -39.1 01-01 -1.3 -12.9 -8.8 -6.0 -6.7 -9.5 -7.4 -7.6 -9.4 -13.2 -14.0 -18.8 -23.9
HR 03-11 -74.0 -44.2 07-07 -14.3 -31.9 -31.3 -26.8 -25.6 -23.5 -26.6 -25.7 -22.2 -24.8 -22.8 -23.5 -29.3
IT 04-93 -73.9 -40.9 05-90 -8.2 -13.2 -16.4 -14.2 -13.6 -12.8 -12.2 -10.8 -14.6 -16.4 -12.4 -14.8 -19.0
CY 05-13 -90.5 -32.7 02-18 27.8 18.1 17.9 17.5 17.6 27.8 23.8 25.8 19.8 16.6 0.3 5.7 3.6
LV 06-09 -92.1 -19.3 09-06 5.9 -19.8 -20.6 -18.1 -10.5 -14.9 -16.2 -17.2 -15.9 -20.4 -16.9 -14.2 -15.6
LT 01-10 -72.8 -16.5 06-07 21.5 -19.9 -18.7 -18.8 -15.4 -15.4 -12.3 -7.6 -5.9 -7.0 -3.9 -2.4 -0.3
LU 04-09 -54.6 -22.7 01-18 13.5 5.3 7.1 4.5 13.5 10.7 4.2 5.3 2.9 -0.6 7.8 0.7 4.2
HU 04-09 -79.4 -33.0 09-02 6.3 -6.3 -6.3 1.2 0.2 0.1 0.1 2.5 -2.3 1.3 -4.2 -7.2 -5.4
MT 04-10 -59.2 -15.6 01-18 41.5 33.0 35.8 37.9 41.5 37.9 39.9 33.9 30.5 33.7 34.3 38.9 37.3
NL 07-03 -70.7 -11.3 03-98 33.6 26.7 25.7 33.0 30.7 30.3 30.9 31.8 30.5 30.1 32.2 30.5 27.2
AT 04-09 -66.0 -19.4 05-18 24.5 15.4 18.8 21.6 22.6 22.8 21.5 23.6 24.5 19.7 19.6 18.7 18.1
PL 09-01 -54.9 -18.3 04-08 15.3 7.4 3.2 8.7 13.3 13.2 9.5 13.0 13.2 9.4 10.4 10.1 11.6
PT 10-12 -78.7 -30.7 10-17 20.9 20.9 14.2 16.5 17.1 15.9 14.9 15.1 13.4 6.3 7.1 6.4 6.8
RO 06-10 -76.1 -28.6 07-07 -3.1 -22.2 -22.9 -29.6 -32.7 -33.4 -32.1 -32.8 -35.1 -34.9 -35.6 -34.4 -31.4
SI 10-09 -77.3 -34.1 01-18 13.4 5.4 5.6 8.8 13.4 13.2 12.1 13.1 11.9 13.1 11.6 3.6 -0.6
SK 10-99 -69.0 -29.1 04-07 17.4 -12.2 -12.5 -14.3 -13.0 -9.9 -15.1 -18.3 -11.4 -12.9 -12.1 -12.1 -11.7
FI 01-92 -65.1 -6.2 12-17 36.4 33.7 31.6 36.4 31.4 29.8 28.4 27.6 26.8 21.9 20.1 21.9 23.2
SE 04-09 -68.3 -5.9 01-11 30.1 6.6 9.3 8.2 4.2 2.7 -0.1 -0.7 -0.8 -2.1 -0.9 -1.8 0.4
UK 05-09 -82.3 -29.5 04-15 4.9 -28.4 -30.0 -27.9 -28.5 -27.7 -26.9 -28.0 -26.1 -28.4 -24.1 -25.3 -27.5SAVINGS EU : : : : : : : : : : : : : : : : :
AT PRESENT (d)
EA : : : : : : : : : : : : : : : : :(Question 10) BE 04-16 -60.0 7.8 02-01 69.6 -47.7 -47.0 -44.1 -44.8 -44.7 -42.9 -42.6 -42.8 -42.3 -45.6 -46.1 -46.8
BG 07-03 -76.5 -61.0 09-17 -44.3 -45.3 -44.5 -46.3 -45.7 -47.4 -49.8 -49.9 -49.5 -49.1 -48.5 -50.0 -49.8
CZ 06-11 -37.4 -16.2 03-01 14.7 -11.7 -7.2 -5.0 -1.1 -3.5 -1.4 1.5 0.1 5.4 3.9 -4.1 1.7
DK 01-90 50.7 65.8 07-08 82.8 53.2 56.9 55.3 57.3 54.8 58.6 61.5 59.2 57.8 63.3 60.9 59.6
DE 04-16 5.5 38.0 09-02 61.1 8.2 10.3 12.6 14.3 13.7 11.9 13.8 15.6 13.0 16.2 13.8 12.3
EE 09-96 -58.3 -26.2 02-07 -2.0 -11.0 -11.0 -14.3 -20.8 -13.8 -11.8 -14.9 -11.6 -15.8 -15.4 -15.8 -17.1
IE 01-13 -24.0 -8.7 05-09 19.3 -2.1 -0.3 1.7 3.0 2.9 -3.1 1.8 1.5 0.7 0.9 1.7 :
EL 06-17 -75.4 -50.9 07-08 -13.9 -69.2 -68.2 -63.8 -62.6 -62.6 -61.3 -57.7 -64.5 -63.2 -62.8 -63.5 -61.6
ES 06-08 -48.4 2.5 08-96 58.5 -20.4 -19.6 -19.9 -20.9 -23.1 -24.2 -26.2 -25.0 -20.8 -23.0 -23.0 -21.4
FR 12-16 -7.0 28.4 06-95 61.1 -3.9 2.3 1.4 2.2 2.6 0.3 1.8 6.0 4.3 5.0 11.6 3.4
HR 07-05 -47.0 -35.0 05-18 -18.7 -28.6 -22.5 -21.0 -25.9 -22.4 -25.2 -27.6 -18.7 -28.1 -21.4 -21.2 -22.5
IT 06-04 26.0 54.4 09-09 84.8 59.3 59.8 62.8 64.2 64.8 69.7 68.9 69.0 66.5 69.0 68.3 76.2
CY 07-13 -50.5 -17.1 06-01 9.9 -15.2 -17.9 -18.3 -19.7 -8.8 -13.9 -10.8 -8.8 -14.1 -26.9 -24.3 -19.3
LV 08-09 -70.2 -48.9 01-18 -17.3 -36.3 -31.5 -32.1 -17.3 -28.4 -33.0 -30.4 -28.1 -29.9 -31.9 -29.2 -25.6
LT 10-05 -49.2 -27.2 03-15 4.0 -20.6 -19.0 -20.6 -22.2 -22.1 -18.2 -17.2 -9.4 -13.9 -12.8 -10.5 -10.4
LU 09-16 18.0 47.1 08-07 69.3 28.0 32.0 33.6 31.3 31.6 27.0 28.3 42.6 34.9 40.1 40.5 38.9
HU 11-95 -82.9 -61.7 12-00 -27.5 -43.4 -42.1 -41.2 -43.6 -39.3 -35.9 -31.4 -38.9 -35.5 -37.2 -41.1 -33.3
MT 04-11 -65.2 -39.0 02-18 20.8 -15.9 -5.3 8.0 14.1 20.8 14.4 15.2 11.5 15.3 13.1 14.0 19.9
NL 07-16 -23.6 -1.6 04-02 16.4 -16.7 -17.2 -19.9 -17.8 -16.0 -12.5 -8.0 -6.0 -8.1 -6.5 -7.3 -7.3
AT 04-15 -2.2 33.4 11-07 65.6 7.2 16.1 14.1 12.4 12.8 11.1 15.9 15.5 15.3 18.0 13.8 16.5
PL 09-01 -48.7 -19.9 07-18 11.2 0.5 -0.1 -0.7 -3.0 4.6 4.0 1.0 2.7 2.1 11.2 8.2 3.0
PT 03-08 -53.7 -31.8 09-97 -2.3 -16.2 -17.2 -17.5 -18.4 -15.8 -14.3 -14.0 -12.5 -14.9 -14.3 -16.7 -14.0
RO 06-02 -62.1 -46.0 06-01 -23.7 -33.5 -34.0 -32.2 -36.9 -37.4 -35.2 -35.8 -33.9 -37.9 -32.7 -32.2 -29.1
SI 04-15 -33.8 -10.5 12-06 18.6 -9.4 -14.0 -12.5 -8.0 -7.6 -7.3 -4.1 -8.8 -3.2 -4.2 -9.3 -10.2
SK 10-04 -55.0 -36.5 04-17 -17.2 -21.4 -22.5 -23.1 -22.3 -21.3 -21.2 -20.9 -22.5 -23.5 -25.9 -22.3 -24.0
FI 04-94 -22.8 8.7 11-07 36.6 21.9 20.0 24.1 24.9 26.3 27.4 29.1 28.5 29.2 27.4 28.6 30.2
SE 09-01 -9.4 8.9 08-07 26.1 5.2 5.8 3.8 6.4 8.0 9.1 11.4 8.0 1.1 8.6 9.7 5.5
UK 03-09 -22.3 7.2 08-07 41.1 2.6 7.8 5.3 6.6 11.2 12.4 7.9 5.9 5.7 6.9 16.3 13.5MAJOR EU 01-09 -27.3 -17.7 03-00 -10.0 -13.3 -13.8 -13.2 -14.0 -13.3 -14.3 -13.8 -13.5 -13.2 -12.8 -13.0 -13.4PURCHASES EA 08-13 -28.4 -18.8 03-00 -12.2 -15.7 -16.0 -14.8 -16.0 -15.6 -16.0 -15.6 -15.9 -15.3 -15.0 -15.1 -16.0OVER NEXT BE 10-96 -28.7 -15.7 10-03 -5.9 -9.1 -7.5 -9.5 -10.9 -11.9 -13.6 -15.3 -11.6 -14.2 -15.4 -15.1 -15.312 MONTHS BG 04-03 -46.8 -30.9 08-08 -5.9 -28.8 -28.0 -25.3 -26.8 -27.8 -27.7 -31.9 -29.2 -28.3 -27.2 -21.1 -23.0(Question 9) CZ 01-01 -36.2 -19.1 05-07 -0.3 -4.9 -5.0 -9.2 -11.4 -9.7 -5.0 -9.2 -9.1 -6.8 -9.3 -9.7 -5.9
DK 01-93 -14.2 -5.4 03-06 3.9 -0.1 0.5 -2.4 -1.4 -0.1 -2.1 -5.1 -3.4 -1.5 -2.4 -4.1 -0.5
DE 02-03 -38.9 -24.0 01-90 -13.6 -16.6 -18.1 -19.1 -19.6 -17.0 -18.1 -17.2 -18.2 -17.1 -18.2 -17.2 -19.7
EE 10-92 -64.3 -25.3 09-06 -0.3 -23.0 -20.4 -27.9 -21.3 -15.8 -15.9 -20.4 -22.5 -23.2 -16.3 -11.3 -17.9
IE 07-09 -56.7 -36.4 04-15 -9.8 : : : : : : : : : : : :
EL 01-13 -81.2 -36.7 06-03 4.8 -50.5 -50.4 -51.5 -48.3 -51.1 -51.7 -54.0 -52.7 -53.9 -47.6 -54.1 -47.0
ES 08-12 -53.8 -27.4 11-00 -7.1 -14.8 -13.7 -12.1 -15.2 -16.6 -13.6 -16.3 -13.2 -11.7 -11.9 -12.7 -13.8
FR 05-08 -8.0 -2.0 09-99 1.2 -2.8 -2.3 -1.9 -1.2 -1.3 -1.5 -0.4 -2.0 -1.5 -0.7 -1.6 -2.6
HR 03-11 -50.2 -33.9 09-18 -15.0 -19.8 -20.2 -19.5 -20.8 -17.4 -18.3 -18.4 -15.1 -17.9 -18.1 -16.3 -15.0
IT 08-13 -58.1 -23.1 12-06 -8.0 -28.4 -29.1 -23.0 -26.8 -28.0 -29.0 -27.9 -28.0 -28.2 -26.5 -25.7 -25.9
CY 04-13 -79.8 -20.1 03-03 40.0 -27.7 -26.5 -20.5 -25.6 -16.5 -21.8 -19.2 -15.4 -15.3 -24.1 -14.2 -17.1
LV 06-09 -45.1 -10.6 06-06 22.9 -18.2 -17.4 -22.2 -14.8 -14.3 -18.5 -16.7 -22.1 -21.8 -25.3 -25.2 -19.9
LT 11-09 -38.1 -6.1 03-08 16.6 1.3 3.0 3.4 2.2 4.0 2.9 -0.5 3.1 2.0 4.8 1.9 2.2
LU 02-14 -32.7 -15.9 06-17 -4.3 -17.3 -15.2 -13.8 -14.4 -12.1 -20.1 -16.1 -20.9 -19.6 -14.1 -16.5 -17.7
HU 06-95 -68.6 -35.5 12-17 -6.6 -11.6 -13.7 -6.6 -7.3 -6.9 -7.8 -8.3 -9.5 -8.8 -7.3 -13.2 -11.5
MT 08-18 -30.6 -8.5 11-13 3.9 -3.1 -8.3 -12.8 -17.5 -7.4 -11.5 -23.4 -29.4 -25.7 -20.8 -30.6 -22.1
NL 03-03 -32.4 -19.9 07-18 -11.0 -11.7 -13.6 -12.3 -13.2 -13.9 -13.1 -11.7 -13.8 -11.8 -11.0 -14.6 -13.6
AT 01-09 -27.6 -16.4 11-00 -3.9 -14.4 -15.6 -10.9 -11.4 -9.2 -13.2 -11.6 -13.9 -11.4 -11.4 -8.8 -10.9
PL 09-01 -25.7 -4.9 07-18 2.0 0.5 -3.5 -2.1 -1.5 -2.4 -6.2 -1.5 -5.0 1.9 2.0 -0.8 -2.6
PT 05-13 -49.1 -21.7 06-90 14.1 -27.8 -24.5 -26.5 -27.7 -25.4 -25.2 -24.0 -24.7 -24.3 -24.1 -25.3 -22.6
RO 09-10 -50.6 -29.5 08-04 -15.6 -25.1 -20.8 -21.5 -24.7 -25.9 -30.0 -24.1 -24.6 -27.3 -24.1 -28.9 -23.3
SI 09-16 -34.6 -12.3 08-07 4.3 -22.4 -24.5 -23.6 -15.9 -21.0 -19.7 -17.4 -20.2 -19.1 -19.5 -19.7 -21.4
SK 10-99 -40.9 -25.9 12-16 -12.9 -16.9 -16.7 -15.3 -17.3 -15.1 -17.0 -16.9 -17.9 -19.6 -19.1 -14.8 -18.9
FI 11-08 -17.7 -9.0 12-17 -3.0 -8.5 -9.4 -3.0 -7.5 -8.8 -8.9 -8.7 -8.3 -10.0 -9.6 -7.8 -6.7
SE 10-08 -17.0 -5.5 09-96 7.2 -5.6 -6.7 -8.3 -4.3 -7.2 -6.2 -8.4 -6.2 -9.5 -10.8 -6.5 -6.6
UK 02-09 -39.7 -15.6 03-00 0.6 -7.8 -8.9 -10.0 -9.9 -7.5 -10.7 -9.4 -6.3 -8.2 -7.3 -7.9 -6.9
Ave.
Page 15
15
TABLE 4 (continued) : Monthly survey of consumers (s.a.) (a)
Since 1990 (*) 2017 2018
Min. Ave. Max.
Date Value Date Value Oct Nov Dec Jan Feb Mar Apr May Jun Jul Aug Sep
MAJOR EU 10-08 -35.6 -12.0 01-00 4.5 1.1 0.2 1.1 -0.4 0.5 -0.5 0.7 -0.3 -0.6 0.2 0.5 0.0PURCHASES EA 10-08 -36.8 -15.1 03-99 3.3 0.9 0.8 2.1 0.2 0.8 -0.7 0.5 -0.1 -0.2 -0.2 -0.2 -1.0AT PRESENT BE 06-97 -40.4 -0.6 09-07 26.1 7.5 12.3 11.0 12.0 12.5 6.6 8.3 9.2 11.0 11.6 11.1 8.9(Question 8) BG 06-02 -65.3 -37.7 10-06 -17.1 -26.0 -24.8 -27.0 -25.3 -26.8 -25.0 -27.8 -28.6 -31.3 -30.2 -29.8 -29.4
CZ 05-95 -31.4 1.8 07-03 33.9 11.2 12.3 10.4 11.7 12.4 18.0 18.8 18.5 20.2 22.4 19.2 18.0
DK 11-08 -32.8 -7.6 09-97 9.5 -3.8 -6.4 -6.2 -8.1 -7.3 -7.3 -8.0 -5.6 -6.9 -7.9 -5.8 -3.2
DE 11-02 -30.8 -1.5 11-06 32.2 27.1 26.6 25.4 24.2 23.2 21.7 23.5 22.3 22.2 22.7 23.8 22.8
EE 11-11 -20.6 11.9 08-01 52.7 17.2 13.0 14.9 9.6 12.6 15.4 20.5 17.4 14.0 15.0 14.8 13.2
IE 04-92 -21.5 12.4 09-97 39.7 27.2 29.6 29.8 30.2 27.7 28.6 28.1 33.9 30.4 31.1 26.0 :
EL 07-12 -75.0 -44.1 01-01 -9.8 -64.8 -61.3 -56.4 -61.8 -57.4 -57.2 -61.1 -59.8 -58.7 -57.6 -60.9 -57.8
ES 06-93 -63.8 -24.1 11-99 25.7 -19.4 -20.7 -21.9 -21.8 -23.2 -24.1 -20.8 -22.0 -18.9 -19.9 -22.2 -26.6
FR 08-08 -40.6 -16.3 07-00 14.4 -5.6 -4.8 -3.2 -4.7 -4.4 -6.3 -3.5 -3.6 -8.8 -7.3 -8.0 -7.5
HR 05-12 -50.8 -32.2 12-06 -11.4 -26.2 -23.3 -18.9 -23.7 -16.0 -23.8 -27.1 -18.9 -23.4 -21.3 -19.0 -20.1
IT 11-96 -64.2 -35.5 05-90 -2.4 -23.0 -24.8 -18.6 -25.1 -20.0 -22.3 -24.2 -24.6 -20.9 -22.8 -21.8 -22.1
CY 04-13 -70.4 -23.2 06-01 28.0 -16.1 -17.6 -14.5 -17.0 -20.9 -12.6 -10.7 -13.0 -14.9 -19.7 -10.9 -6.5
LV 02-09 -36.7 -12.7 12-06 21.4 -21.4 -18.9 -17.7 -12.3 -16.4 -13.6 -15.7 -18.4 -16.3 -15.9 -17.3 -13.0
LT 03-09 -11.9 15.1 02-06 50.0 0.6 1.8 -1.6 8.0 8.2 5.3 7.8 7.9 7.8 9.2 9.9 7.8
LU 10-08 -34.5 -4.0 11-14 22.9 17.1 14.0 9.1 21.6 20.4 19.9 12.4 17.3 16.2 19.9 10.5 10.9
HU 06-96 -86.8 -48.6 03-06 -6.9 -27.0 -26.6 -24.1 -26.5 -24.0 -20.1 -21.3 -27.7 -21.6 -22.9 -25.2 -21.2
MT 04-09 -22.4 13.2 07-17 48.9 43.1 48.3 44.2 43.3 36.4 37.0 38.2 42.6 35.3 26.4 39.3 33.5
NL 09-03 -39.1 -3.7 12-00 43.0 18.7 20.2 22.4 19.7 21.3 21.0 22.5 19.8 19.1 18.9 18.2 18.0
AT 07-08 -17.8 9.5 08-99 29.4 21.6 16.5 23.7 23.3 21.0 21.2 23.1 21.0 22.3 20.8 22.9 22.2
PL 11-01 -27.0 -2.2 07-18 15.6 7.3 6.7 10.2 6.4 11.4 11.4 11.4 4.4 8.8 15.6 14.3 15.0
PT 12-08 -90.3 -49.3 01-92 -1.5 -34.4 -35.5 -33.6 -36.0 -33.3 -36.0 -33.3 -33.0 -33.4 -35.3 -35.4 -35.1
RO 08-10 -62.8 -37.1 06-01 12.5 -34.2 -33.2 -37.3 -40.0 -39.7 -39.0 -33.2 -35.6 -36.3 -34.8 -36.3 -33.6
SI 08-12 -59.6 -24.0 08-06 17.7 -4.5 -6.7 -7.7 -4.8 -4.3 -5.5 -7.1 -2.3 2.1 -1.9 -6.3 -8.0
SK 02-04 -24.8 -7.1 06-08 11.3 -7.5 -2.8 -4.3 -3.0 -5.0 -4.6 -8.1 -2.7 -2.9 -6.7 -4.0 -6.8
FI 04-90 -27.3 17.0 12-09 48.7 24.0 27.4 26.2 28.5 27.3 27.2 25.7 24.8 24.6 24.9 27.4 27.3
SE 10-08 -37.9 14.4 08-05 36.2 24.0 21.3 23.2 18.1 17.7 15.2 11.4 7.3 10.7 15.6 12.6 16.1
UK 10-08 -40.6 0.4 11-02 28.3 2.2 -1.9 -2.8 -1.9 0.2 0.1 2.4 1.2 -1.4 0.9 3.4 3.1PRICE TRENDS EU 08-09 -11.6 19.8 09-90 48.8 18.9 19.9 18.4 23.2 21.9 19.7 20.1 20.7 21.2 21.2 22.6 24.1OVER NEXT EA 08-09 -16.4 18.6 01-91 50.6 14.6 15.9 13.6 19.6 18.0 16.1 16.1 17.5 17.5 18.0 18.2 20.112 MONTHS BE 08-09 -13.6 19.1 10-01 45.6 19.6 13.3 18.1 20.1 19.3 19.8 18.0 18.4 21.1 20.2 27.4 23.7(Question 6) BG 07-01 -3.2 32.9 12-06 54.4 26.3 28.3 30.0 35.3 33.8 31.2 27.8 30.7 29.4 30.8 33.1 32.8
CZ 11-09 -8.7 34.4 03-98 72.0 29.8 26.7 23.9 25.6 23.8 22.0 23.8 25.7 24.1 23.6 27.3 32.3
DK 07-09 -40.9 -1.7 06-08 31.5 18.7 24.5 24.0 24.6 20.2 23.9 22.3 23.7 21.7 26.9 28.7 27.2
DE 08-09 -18.1 26.0 03-91 57.9 16.0 17.2 14.8 16.6 18.3 14.4 15.1 16.8 19.9 20.7 21.9 21.5
EE 04-09 -28.8 36.5 05-04 87.8 39.1 43.1 42.9 56.6 44.8 42.0 40.7 40.0 46.3 43.8 53.3 55.8
IE 05-09 -43.5 -2.6 09-12 17.9 : : : : : : : : : : : :
EL 03-15 -16.6 29.3 05-90 60.1 7.1 8.6 13.3 9.4 9.8 9.4 9.1 3.7 10.6 10.4 -4.2 -0.4
ES 05-09 -29.9 10.2 08-12 40.0 6.4 8.8 12.3 20.1 12.4 15.3 15.2 16.8 10.6 16.3 12.2 21.5
FR 08-97 -13.4 14.4 01-91 53.6 21.7 20.0 15.8 25.4 26.8 25.7 24.1 29.8 29.0 26.1 25.7 30.7
HR 02-16 -6.9 22.7 06-08 52.2 17.9 16.7 21.9 19.7 21.4 18.2 22.9 19.6 20.8 21.3 19.0 17.3
IT 07-09 -29.1 10.3 02-91 61.8 -3.0 -0.9 -6.5 6.9 0.6 -2.2 -3.1 -4.5 -8.4 -5.6 -7.0 -7.1
CY 01-15 -43.0 14.3 10-02 68.2 -10.3 -5.6 -10.8 -10.7 -12.6 -18.3 -11.9 -7.2 3.0 -1.9 0.4 -2.0
LV 05-09 -40.8 28.0 03-04 69.7 26.8 28.8 22.6 30.3 26.0 26.2 22.7 26.7 22.3 20.1 22.9 29.9
LT 06-09 1.4 43.4 05-04 74.2 37.9 34.9 36.2 32.2 35.2 37.2 39.5 37.8 41.9 38.3 41.1 41.0
LU 07-09 -21.2 14.6 08-07 44.1 12.3 10.5 14.3 14.2 15.9 18.7 16.0 12.5 20.1 16.9 24.9 22.0
HU 05-16 12.9 46.0 01-07 75.5 20.1 20.9 20.5 19.2 19.8 26.2 19.7 25.9 26.1 27.3 31.3 29.3
MT 08-14 -8.3 25.4 03-11 66.1 11.6 -1.2 1.5 1.5 12.1 8.4 5.5 2.9 7.7 9.3 9.7 10.1
NL 12-02 -19.1 21.2 01-91 57.4 40.5 50.7 41.5 46.5 39.3 34.0 37.1 35.8 37.0 36.3 47.3 47.0
AT 12-95 -18.6 22.8 03-11 50.4 30.6 34.6 31.5 29.6 32.6 31.0 32.0 31.0 34.9 33.7 37.7 35.0
PL 01-16 -5.0 25.3 04-04 54.7 13.9 16.9 19.3 14.8 15.5 9.0 14.0 14.7 15.7 17.1 16.8 22.5
PT 06-09 -9.9 24.5 09-11 69.5 6.3 11.0 19.1 21.4 12.7 11.7 13.6 15.0 17.0 16.0 13.7 14.9
RO 01-16 -18.0 38.7 02-08 63.4 25.8 33.4 33.7 32.6 33.0 26.7 28.2 33.0 33.1 34.8 35.6 28.6
SI 10-09 -11.0 31.3 04-00 62.2 36.9 39.9 36.7 35.8 33.8 30.8 30.6 29.1 33.9 29.5 34.5 36.0
SK 01-16 -15.1 35.4 11-02 77.6 32.7 35.7 37.1 37.0 36.4 37.2 36.0 30.3 31.8 32.8 30.5 34.5
FI 12-95 -21.4 17.1 01-08 49.9 21.0 21.0 19.1 19.1 23.7 23.8 27.3 23.8 23.0 22.3 27.0 28.0
SE 03-05 -14.4 16.0 10-07 47.1 21.6 19.6 23.2 24.2 21.3 23.9 17.5 20.1 21.6 25.7 27.8 25.4
UK 07-09 -5.1 23.5 09-90 57.1 35.8 34.5 34.3 38.6 37.9 34.4 36.7 33.4 36.2 32.5 39.0 39.0PRICE TRENDS EU 04-16 -4.9 23.5 07-08 68.1 14.4 16.2 16.1 19.5 20.1 17.6 17.3 18.3 21.3 21.0 19.9 21.8OVER LAST EA 10-09 -7.3 27.0 07-08 73.6 13.0 14.7 13.6 17.3 18.3 16.5 16.3 18.0 21.1 20.7 19.6 22.612 MONTHS BE 06-98 -1.3 40.1 05-08 83.6 44.5 40.2 41.3 45.8 43.6 39.3 39.4 39.8 42.4 43.5 42.7 47.6(Question 5) BG 06-01 5.6 46.8 05-08 85.9 40.2 40.0 41.7 47.6 45.1 45.1 44.8 43.8 42.5 43.4 46.3 45.4
CZ 10-09 -36.5 8.6 03-98 63.2 19.6 18.4 21.0 14.5 14.5 14.3 7.3 12.7 7.4 8.4 6.7 14.3
DK 09-93 -50.8 -15.0 07-08 55.5 -5.4 -4.9 -7.4 1.8 -3.5 -4.2 -4.0 -8.6 -7.6 -6.3 -7.9 -3.8
DE 10-09 -24.9 27.8 07-08 77.8 17.9 20.2 16.2 18.6 21.4 15.4 16.2 17.7 22.5 23.1 20.8 22.6
EE 11-09 -35.0 38.2 04-08 88.3 62.1 61.6 62.2 67.4 69.6 65.0 62.3 60.4 63.0 60.3 61.6 61.5
IE 02-10 -62.4 -10.2 09-12 18.4 : : : : : : : : : : : :
EL 03-15 -9.1 40.4 01-08 84.8 21.4 21.3 24.3 19.1 15.3 18.3 15.5 17.6 18.6 20.3 10.3 8.3
ES 01-10 -37.5 25.1 07-08 65.6 9.4 8.4 15.8 21.3 15.7 18.8 19.7 18.8 21.7 19.7 18.6 27.2
FR 01-99 -22.6 22.9 06-08 82.5 12.3 15.0 13.9 18.8 23.1 23.8 23.0 30.1 31.2 30.0 30.0 36.2
HR 06-16 7.0 44.9 07-08 85.3 26.9 30.2 30.3 33.6 31.3 30.5 33.5 25.7 33.4 32.3 26.9 29.1
IT 12-16 -18.4 27.1 08-08 70.3 -2.5 -0.4 -4.8 1.8 1.4 -0.5 -2.2 -4.4 -1.6 -1.6 -3.8 -3.0
CY 02-15 -37.7 20.8 06-08 68.5 -11.7 -11.7 -9.4 -17.0 -14.8 -28.0 -11.1 -12.0 -3.1 -2.1 -1.9 2.5
LV 02-10 -36.5 30.0 06-08 81.0 39.2 37.7 36.5 40.3 43.4 40.1 35.5 32.2 37.3 33.3 28.9 30.0
LT 10-03 -17.4 39.1 06-08 71.2 59.7 63.7 61.4 61.0 63.1 58.4 59.4 54.0 55.6 52.3 52.0 46.7
LU 11-09 -9.6 28.5 08-08 69.6 14.8 18.2 19.1 20.5 17.4 17.4 16.9 13.0 17.9 17.6 16.6 19.6
HU 05-16 -5.5 34.5 06-95 71.2 2.5 4.2 1.3 4.1 2.1 7.6 4.6 10.3 6.5 11.8 14.5 14.3
MT 07-14 0.6 38.6 01-11 69.3 18.4 8.0 6.8 5.3 16.7 10.1 12.9 13.3 13.7 16.8 21.5 20.1
NL 09-09 0.2 33.6 12-02 86.3 23.3 26.8 27.9 29.5 29.2 30.7 31.0 32.8 37.9 37.5 41.5 40.1
AT 02-96 -48.2 21.2 06-08 79.8 32.9 34.6 35.0 34.1 35.2 31.1 27.2 29.5 31.2 29.8 33.0 32.3
PL 01-16 -15.1 21.9 04-11 55.1 10.1 16.5 17.0 18.4 18.0 12.8 13.9 12.4 17.8 15.6 17.9 18.1
PT 01-10 -16.5 32.6 05-08 74.1 3.6 1.6 2.7 8.5 9.0 4.3 7.3 8.4 9.9 10.3 12.4 11.2
RO 01-16 -33.4 43.6 06-11 79.3 16.2 23.8 30.4 32.9 35.3 29.2 28.1 30.0 34.9 39.5 37.4 31.5
SI 11-15 -2.6 34.5 02-08 87.8 11.3 21.4 20.7 22.2 21.0 23.4 19.9 22.7 24.2 20.1 22.5 23.7
SK 04-15 -20.1 22.2 10-99 69.9 14.8 20.0 22.6 20.1 23.4 25.2 26.2 23.2 24.0 24.0 23.9 24.3
FI 11-95 -58.5 -10.7 07-08 33.0 -22.5 -23.8 -24.5 -25.9 -19.8 -18.2 -17.3 -16.8 -14.9 -17.4 -15.7 -15.5
SE 03-05 -40.1 -22.0 07-08 21.9 -11.2 -10.5 -8.5 -9.5 -12.5 -11.5 -14.6 -9.5 -7.8 -9.0 -9.5 -9.4
UK 11-01 -15.1 15.8 08-08 59.6 25.5 27.0 30.2 33.7 33.9 28.3 28.1 26.3 29.5 29.3 27.4 25.7(*) Minimum, maximum and averages are calculated over the period of availibility which is not necessarily as from 01/1990.
(a) The sum of the replies for each Member State are weighted in the Community total with the value of consumers’ expenditure.
(b) The indicator is the arithmetic average of the balances (%) of four questions: the financial situation of households, the general economic situation,
unemployment expectations (with inverted sign) and savings, all over the next 12 months.
(c) Results for question 7 are not seasonally adjusted.
(d) Due to a lack of harmonisation, the publication of the European aggregates is discontinued. National results are not comparable across countries.
Page 16
16
TABLE 5: Monthly survey of retail trade (s.a.)
Since 1990 (*) 2017 2018
Min. Max.
Date Value Date Value Oct Nov Dec Jan Feb Mar Apr May Jun Jul Aug Sep
RETAIL TRADE EU 12-08 -26.7 -6.3 10-15 9.1 3.1 5.3 5.1 3.3 4.5 2.8 0.1 1.9 3.2 2.0 5.0 4.4CONFIDENCE EA 02-93 -28.4 -9.0 10-15 5.7 3.8 3.2 4.8 4.1 3.5 0.8 -0.7 0.7 0.7 0.3 1.9 2.7
INDICATOR (a)
BE 01-09 -27.9 -4.5 10-10 13.7 -7.4 -5.6 -10.4 -9.1 -9.6 -4.4 -7.2 -9.1 -9.7 -14.9 -6.4 -5.7
BG 07-09 -14.8 14.6 08-94 31.8 18.3 17.0 19.3 23.1 21.0 18.5 16.5 17.6 17.9 18.8 15.2 15.8
CZ 02-99 -1.3 15.3 11-07 29.5 20.6 21.4 20.9 23.1 25.0 23.7 25.4 23.9 23.1 20.7 18.4 23.0
DK 11-11 -11.4 6.4 04-15 17.0 8.4 9.0 7.4 13.9 3.4 7.2 7.8 5.7 10.7 7.8 4.7 12.0
DE 12-02 -41.2 -15.1 12-90 22.3 -2.3 -2.2 0.0 -1.0 -1.1 -6.0 -6.4 -2.3 -5.9 -6.6 -4.6 -2.2
EE 06-09 -45.6 8.3 04-07 35.6 14.1 8.3 9.8 15.2 13.3 5.3 8.5 7.7 7.6 8.1 10.8 14.3
IE : : : : : : : : : : : : : : : : :
EL 10-12 -48.4 -1.8 07-07 39.0 2.0 2.3 -0.4 1.8 2.8 2.2 10.4 6.4 2.6 14.9 19.7 21.0
ES 02-93 -36.0 -6.9 12-15 17.0 10.6 10.0 10.5 11.3 13.0 10.8 10.9 8.8 11.4 11.0 11.0 9.2
FR 04-97 -27.2 -8.1 12-07 8.8 -0.4 -0.6 0.9 -0.6 -0.2 -5.1 -4.1 -4.7 -3.1 -1.1 -0.5 -0.6
HR 08-09 -31.0 -4.2 06-18 19.4 13.4 13.7 13.2 12.1 15.4 11.4 19.4 17.8 19.4 14.8 11.0 9.4
IT 04-99 -65.4 -11.1 10-15 17.4 14.3 11.7 14.0 13.0 8.7 8.9 2.1 4.3 7.2 4.8 7.2 7.1
CY 04-13 -48.9 -7.3 05-07 20.6 7.5 6.4 10.0 8.0 8.6 12.6 8.3 9.6 5.8 4.6 9.6 0.4
LV 02-09 -35.2 6.4 04-07 22.8 4.9 3.5 5.7 7.9 9.0 5.7 7.1 8.4 8.8 9.1 6.7 6.1
LT 04-09 -57.8 -0.7 01-07 41.7 4.8 5.9 7.0 7.8 8.7 7.7 8.2 7.5 6.9 9.3 9.9 11.2
LU : : : : : : : : : : : : : : : : :
HU 03-09 -41.1 -6.2 01-14 14.1 10.2 12.1 14.1 9.1 13.5 10.6 8.2 7.6 10.4 8.5 11.6 14.0
MT 06-12 -19.6 2.6 10-15 27.3 16.4 27.0 18.9 16.0 23.3 5.7 1.4 9.6 -0.3 12.3 11.1 17.1
NL 06-09 -16.9 10.8 10-99 33.3 13.7 6.1 11.8 13.4 10.6 9.8 5.3 6.4 6.5 6.1 6.7 9.7
AT 03-09 -26.4 -7.5 05-10 13.2 -6.6 -8.1 1.5 -4.9 -10.2 -6.3 -9.9 -9.5 -8.1 -14.5 -12.6 -9.8
PL 03-03 -16.8 -2.2 12-07 11.9 6.6 6.5 9.9 9.2 9.8 7.5 5.4 5.0 5.7 5.8 4.9 6.4
PT 12-08 -32.1 -3.3 03-99 12.8 2.8 2.8 3.4 4.2 2.6 2.3 2.2 2.6 1.8 1.4 1.3 1.1
RO 07-09 -21.6 10.8 12-97 35.8 10.4 8.4 13.5 16.7 12.1 7.9 6.5 9.6 3.4 6.2 3.6 16.2
SI 03-09 -21.6 11.9 09-07 38.2 27.4 30.7 22.2 28.5 20.1 9.3 15.7 5.6 21.5 10.9 10.6 11.7
SK 03-09 -22.7 9.9 11-98 34.4 18.8 21.5 19.8 24.3 24.0 22.0 24.8 26.5 27.2 23.1 20.2 25.5
FI 02-15 -30.0 -1.2 02-18 26.2 5.7 21.7 12.1 10.7 26.2 12.8 6.0 19.1 15.4 14.9 15.0 16.0
SE 01-09 -38.3 11.5 01-10 47.6 15.5 16.5 19.3 17.8 20.2 17.6 13.1 16.3 18.8 11.4 14.4 17.9
UK 01-09 -47.1 1.4 09-15 26.7 -5.0 9.8 0.6 -7.5 2.8 4.9 -4.0 0.2 7.6 4.0 14.5 5.0PRESENT EU 12-08 -32.9 -6.2 10-15 19.0 10.1 10.5 12.1 9.5 10.8 8.8 3.6 5.9 7.6 7.7 12.7 11.8BUSINESS EA 11-94 -37.5 -10.2 06-90 21.3 11.7 9.1 12.7 11.9 11.0 6.9 3.6 5.8 4.1 5.2 8.6 9.3
SITUATION (b)
BE 08-16 -30.9 -0.7 10-10 35.0 -15.6 -2.6 -18.4 -11.9 -11.4 -0.9 -1.2 -10.0 -12.9 -21.9 -4.4 0.9(Question 1) BG 08-09 -36.2 14.0 11-97 51.9 24.6 25.6 21.3 29.6 31.2 26.6 23.4 24.4 26.3 26.2 20.5 21.3
CZ 12-09 -2.6 31.1 11-07 67.2 47.4 46.3 48.8 43.3 47.2 47.1 50.3 43.0 43.8 38.0 36.6 40.2Component of the DK 11-11 -22.9 7.4 04-15 44.1 10.1 10.0 8.3 22.4 8.7 16.5 10.6 9.7 24.5 14.0 6.9 20.8retail confidence DE 01-03 -54.8 -11.2 11-90 52.6 18.1 14.0 21.1 19.2 20.5 10.9 11.7 19.4 11.1 13.3 14.4 17.1indicator EE 06-09 -61.5 15.4 04-07 71.6 31.9 20.9 22.9 26.9 31.4 22.4 21.8 17.7 21.7 22.8 22.7 36.4
IE : : : : : : : : : : : : : : : : :
EL 10-12 -78.7 -8.7 09-07 63.9 0.0 4.0 -7.4 -1.5 -5.1 -8.7 9.5 16.5 3.1 20.2 29.9 18.7
ES 07-93 -72.7 -27.4 01-16 19.3 9.2 6.2 10.7 4.9 8.3 6.8 3.0 2.1 2.2 8.5 3.1 5.9
FR 04-97 -48.7 -8.8 12-07 24.8 -1.3 -6.6 1.0 0.3 2.7 -6.9 -6.1 -7.1 -6.0 -4.2 -1.2 1.1
HR 07-09 -50.5 -9.8 06-18 33.8 20.1 17.2 21.2 23.4 29.0 12.7 28.5 27.3 33.8 22.4 11.1 8.7
IT 11-94 -91.7 -14.6 05-00 45.3 21.9 19.5 19.5 23.4 12.2 16.8 0.7 -4.2 0.9 0.4 10.8 5.2
CY 04-13 -72.5 -24.5 04-07 25.9 5.5 10.4 12.6 7.2 4.5 7.3 13.5 11.8 0.8 3.3 5.8 -2.9
LV 02-09 -60.9 4.7 03-07 36.2 1.5 -0.4 6.0 9.7 14.2 9.4 11.2 13.2 14.7 14.7 8.4 10.3
LT 09-09 -58.0 -1.2 01-07 75.4 3.3 3.9 7.7 7.5 13.5 14.9 13.2 13.0 15.2 21.6 19.1 18.7
LU : : : : : : : : : : : : : : : : :
HU 03-09 -59.9 -6.7 09-18 21.5 12.3 15.6 19.1 10.7 18.4 14.7 9.1 4.5 14.7 15.1 16.6 21.5
MT 02-14 -32.5 6.1 05-15 61.6 34.9 43.1 22.2 38.0 25.8 2.8 8.3 12.7 7.6 15.0 16.1 27.5
NL 08-09 -25.2 21.9 06-99 61.3 29.9 16.3 26.5 15.8 11.2 20.1 8.9 16.3 17.2 12.0 19.1 16.7
AT 03-03 -32.8 -2.8 02-06 26.6 5.1 4.3 11.0 10.6 1.0 -3.2 -7.8 3.7 -3.3 -8.2 -7.6 -3.9
PL 10-01 -30.9 -3.2 12-07 23.8 15.2 14.2 19.4 19.7 23.4 19.8 16.3 11.8 14.4 14.3 13.2 14.5
PT 08-12 -61.2 -7.5 04-99 21.9 7.2 6.2 8.4 10.7 8.4 6.1 5.1 5.0 3.5 3.6 0.6 3.1
RO 08-09 -41.1 16.8 09-97 57.3 14.7 0.5 23.5 29.2 25.7 20.9 14.3 20.9 13.2 12.1 -5.6 18.3
SI 03-09 -48.1 14.3 11-07 63.1 33.1 39.1 19.4 23.0 13.7 4.5 12.0 -8.1 40.1 19.1 11.7 15.1
SK 06-95 -35.1 14.3 11-98 57.9 33.8 42.0 38.5 41.2 44.8 32.1 40.1 44.1 41.1 39.9 33.7 41.4
FI 01-15 -51.2 6.1 03-12 48.8 5.2 34.5 13.7 12.8 32.6 14.9 -0.4 32.0 33.0 23.1 31.3 31.5
SE 01-09 -50.1 18.6 07-06 66.9 22.6 27.1 35.3 37.9 30.8 16.1 14.2 25.5 26.3 27.7 20.7 27.6
UK 01-09 -56.8 5.2 01-11 48.9 -2.4 11.1 1.5 -11.8 0.6 8.4 -5.8 -2.8 11.6 9.8 28.2 15.4VOLUME EU 04-99 26.6 15.8 04-10 5.5 13.4 11.2 10.3 13.5 15.1 14.6 17.1 15.2 13.5 16.0 14.0 14.0OF STOCKS EA 04-99 28.2 15.9 02-10 6.1 13.9 13.5 11.8 13.8 14.5 15.1 16.0 14.8 14.6 16.2 15.3 13.5(Question 2) BE 02-93 30.9 11.5 12-13 -11.7 4.1 10.9 9.1 10.7 13.8 10.1 14.4 13.4 16.0 15.1 14.9 8.5
BG 02-12 6.1 -10.1 07-96 -52.2 0.5 1.7 -0.5 1.4 0.2 2.4 2.0 -0.6 0.8 1.3 0.7 1.7Component of the CZ 05-95 27.8 8.2 10-14 -8.3 7.3 8.0 7.0 5.5 7.6 6.1 7.9 5.0 8.5 6.2 6.0 4.8retail confidence DK 10-11 28.0 10.6 05-13 -6.6 9.9 6.5 9.8 9.3 10.8 11.0 10.3 11.6 11.5 11.6 13.1 11.1indicator DE 12-92 41.3 25.7 09-90 3.5 23.8 22.4 21.4 22.0 22.9 24.7 27.0 21.6 21.8 25.8 24.2 20.1
EE 06-09 37.4 11.6 07-96 -7.7 13.9 14.0 10.9 14.4 13.1 17.0 14.6 12.8 15.5 12.2 9.2 10.3
IE : : : : : : : : : : : : : : : : :
EL 12-93 40.9 9.6 01-16 -16.4 5.5 4.8 6.1 10.8 7.9 5.8 -5.7 7.6 5.1 9.6 7.8 -2.5
ES 06-06 25.4 4.9 02-96 -7.2 9.5 9.8 9.6 7.2 6.5 10.6 7.8 9.5 6.0 9.1 8.3 7.5
FR 03-12 25.2 10.8 03-09 -13.9 11.0 9.2 8.7 12.0 13.7 13.9 13.1 15.5 14.6 13.5 13.5 13.3
HR 10-08 17.7 9.1 10-15 0.7 10.3 11.1 8.1 5.9 9.2 10.1 3.1 8.9 4.2 4.6 5.3 7.4
IT 04-99 73.7 16.6 11-13 -5.6 9.7 10.5 5.3 11.3 12.6 12.8 13.9 10.6 12.3 13.4 11.2 12.9
CY 03-09 26.7 0.6 04-05 -18.8 6.5 10.6 2.7 9.0 9.0 5.4 9.2 5.6 0.8 3.8 -2.8 1.4
LV 12-02 7.6 -1.2 07-96 -17.2 -1.8 -0.4 -0.5 1.5 0.4 2.2 2.7 2.8 2.9 1.9 1.3 1.2
LT 04-09 49.8 2.9 12-99 -20.7 0.6 1.4 2.7 3.9 3.4 0.9 0.4 1.3 1.8 2.1 3.5 2.4
LU : : : : : : : : : : : : : : : : :
HU 01-99 33.8 15.7 12-16 -1.3 4.5 2.7 0.8 5.8 -0.3 3.3 2.5 -0.2 3.0 2.9 -0.3 4.3
MT 12-15 28.1 10.2 11-17 -2.2 4.7 -2.2 6.8 21.7 3.1 3.1 6.7 12.1 4.4 5.8 7.0 6.4
NL 10-11 21.3 8.2 08-09 -2.4 6.7 7.9 8.0 4.9 6.7 7.1 9.8 10.1 9.0 8.5 11.5 7.4
AT 01-02 41.6 22.1 01-00 -1.7 24.6 22.7 15.8 24.8 28.7 16.4 27.7 25.4 21.4 31.4 25.1 21.7
PL 05-05 13.0 2.3 12-93 -15.5 5.8 6.3 5.4 6.2 6.9 7.1 6.6 7.2 7.4 7.0 7.8 7.4
PT 06-90 27.4 10.3 10-13 -12.6 6.0 4.5 5.2 5.8 5.5 4.0 2.8 3.7 3.9 4.3 4.4 5.1
RO 10-95 54.7 2.2 03-17 -26.0 -1.4 1.8 2.5 -2.3 6.1 3.9 -1.1 4.6 9.0 6.2 -1.5 1.9
SI 01-99 32.6 9.7 06-17 -14.9 7.3 6.2 3.2 5.0 3.8 5.4 4.1 5.4 10.3 2.8 6.6 6.5
SK 02-95 25.9 8.3 01-03 -11.0 5.9 4.8 4.4 4.8 6.6 5.8 5.2 4.0 3.6 5.1 5.2 5.8
FI 08-00 38.8 17.7 01-16 -8.5 14.8 10.5 10.2 4.1 -8.3 -1.2 7.2 9.2 16.3 2.8 9.4 12.7
SE 02-98 45.4 27.4 06-10 4.0 25.7 22.5 25.9 24.2 20.4 17.4 21.0 26.2 21.9 28.6 24.9 15.8
UK 11-14 34.6 17.3 08-09 0.9 13.6 3.5 4.4 15.1 21.2 16.2 26.9 20.1 10.8 18.3 11.5 19.9
Ave.
Page 17
17
TABLE 5 (continued) : Monthly survey of retail trade (s.a.)
Since 1990 (*) 2017 2018
Date Value Date Value Oct Nov Dec Jan Feb Mar Apr May Jun Jul Aug Sep
EXPECTED EU 02-09 -29.2 3.3 04-07 20.1 12.6 16.6 13.4 13.7 17.9 14.2 13.6 14.9 15.6 14.4 16.1 15.4
BUSINESS EA 02-93 -32.6 -0.8 05-07 16.0 13.5 13.8 13.4 14.1 14.0 10.5 10.5 11.2 12.6 11.9 12.4 12.4
SITUATION BE 02-09 -42.5 -1.4 01-90 26.8 -2.4 -3.2 -3.6 -4.7 -3.5 -2.1 -6.2 -4.1 -0.3 -7.7 0.0 -9.4
(Question 4) BG 02-97 -39.3 19.6 01-07 56.6 31.0 27.3 36.0 41.1 32.0 31.5 27.9 27.7 28.4 31.4 25.8 27.8
CZ 02-99 3.5 23.1 02-02 46.1 21.6 25.8 21.0 31.4 35.5 30.1 33.8 33.8 34.1 30.2 24.5 33.7
Component of the DK 02-12 -19.6 22.4 01-11 58.7 24.9 23.5 23.6 28.6 12.3 16.0 23.0 18.9 19.1 21.1 20.3 26.4
retail confidence DE 04-09 -43.7 -8.5 12-90 27.0 -1.3 1.8 0.4 0.0 -1.0 -4.1 -3.8 -4.5 -7.1 -7.2 -4.0 -3.6
indicator EE 03-09 -48.4 20.3 03-04 57.4 24.3 18.1 17.3 33.0 21.6 10.5 18.2 18.1 16.6 13.8 18.7 16.8
IE : : : : : : : : : : : : : : : : :
EL 10-12 -68.0 12.9 07-07 70.3 11.5 7.9 12.3 17.6 21.2 20.9 16.0 10.4 9.9 34.2 37.0 41.9
ES 02-93 -33.7 11.5 03-15 39.9 32.1 33.6 30.3 36.3 37.1 36.3 37.4 33.7 38.0 33.8 38.0 29.1
FR 04-09 -33.1 -4.8 06-07 20.0 11.2 14.0 10.5 9.9 10.3 5.4 6.7 8.6 11.2 14.4 13.3 10.5
HR 08-09 -34.7 6.2 06-16 36.2 30.4 34.9 26.4 18.8 26.6 31.8 32.6 34.8 28.6 26.8 27.3 26.9
IT 08-95 -79.6 -2.0 10-15 40.9 30.8 26.0 27.9 27.0 26.4 22.7 19.5 27.7 33.1 27.4 22.1 28.9
CY 04-13 -69.6 3.4 02-08 54.7 23.5 19.2 20.3 25.7 30.4 36.0 20.5 22.6 17.3 14.3 20.3 5.6
LV 03-09 -43.7 13.3 02-07 38.2 11.3 10.5 10.7 15.4 13.3 9.7 12.7 14.8 14.5 14.5 13.0 9.3
LT 04-09 -74.3 2.2 11-06 62.6 11.7 15.1 16.0 19.6 16.0 9.2 12.0 10.8 7.4 8.5 14.0 17.4
LU : : : : : : : : : : : : : : : : :
HU 03-09 -50.1 3.9 02-98 36.9 22.7 23.5 24.0 22.3 22.0 20.5 18.1 18.2 19.4 13.3 18.0 24.7
MT 11-13 -32.1 12.0 09-15 49.9 19.1 35.7 41.2 31.8 47.2 17.3 2.6 28.3 -3.9 27.6 24.3 30.3
NL 07-09 -18.4 18.7 10-99 45.3 17.9 9.9 17.0 29.3 27.2 16.5 16.9 13.1 11.4 14.7 12.4 19.7
AT 03-09 -26.6 2.5 03-05 30.3 -0.3 -6.0 9.1 -0.5 -2.9 0.7 5.8 -6.8 0.4 -3.9 -5.2 -3.9
PL 01-02 -27.1 -1.3 02-08 16.9 10.3 11.5 15.6 14.1 13.0 9.9 6.6 10.3 10.1 10.0 9.3 12.2
PT 09-12 -35.4 8.0 07-98 40.6 7.2 6.7 6.9 7.7 4.8 5.0 4.1 6.6 5.9 4.8 7.9 5.4
RO 10-94 -36.7 17.8 11-95 73.6 15.2 26.5 19.5 18.6 16.7 6.5 4.2 12.5 6.1 12.8 14.9 32.1
SI 01-09 -20.2 31.0 01-18 67.6 56.3 59.3 50.3 67.6 50.4 28.8 39.4 30.3 34.7 16.3 26.9 26.4
SK 03-09 -34.8 23.7 12-96 60.0 28.7 27.2 25.3 36.6 34.0 39.6 39.4 39.3 44.0 34.5 32.0 41.1
FI 02-15 -40.8 7.9 04-07 41.2 26.7 41.1 32.8 23.5 37.7 22.3 25.5 34.5 29.6 24.5 23.0 29.3
SE 01-09 -33.9 43.4 01-10 86.2 49.7 44.9 48.7 39.8 50.1 54.2 46.1 49.7 52.1 35.2 47.4 42.0
UK 02-09 -55.7 16.3 09-15 51.6 0.9 21.8 4.6 4.3 29.1 22.5 20.8 23.6 22.0 20.4 26.9 19.6
INTENTIONS EU 02-09 -34.8 -5.7 02-90 10.5 4.0 7.1 6.1 6.3 6.8 6.0 5.1 5.1 7.1 5.9 4.8 4.1
OF PLACING EA 12-08 -31.5 -9.6 02-90 9.9 4.7 5.6 6.5 6.2 5.4 4.0 4.1 5.2 4.5 3.7 4.4 4.8
ORDERS BE 01-09 -37.3 -7.7 01-90 19.8 -6.7 -5.6 -12.1 -5.4 -15.7 -10.4 -10.7 -6.3 -12.5 -17.6 -16.0 -12.5
(Question 3) BG 02-97 -43.1 13.1 01-07 49.5 26.8 22.3 24.7 25.2 29.2 25.2 22.8 26.1 26.9 23.7 24.6 24.0
CZ 02-96 -32.4 20.6 02-95 57.6 14.5 14.4 3.5 19.3 10.4 14.2 13.4 16.8 20.7 16.0 18.0 19.3
DK 02-12 -27.0 7.6 11-14 30.1 13.8 15.4 20.3 17.2 6.1 10.3 9.6 9.4 8.3 13.5 8.6 3.8
DE 10-02 -46.4 -16.6 09-90 20.3 -7.6 -3.8 -1.8 -4.1 -4.0 -5.6 -7.7 -4.8 -8.0 -8.3 -7.0 -3.7
EE 03-09 -58.8 12.3 03-02 62.8 10.1 16.2 13.2 24.1 14.3 10.0 12.9 9.9 14.7 9.8 18.0 21.3
IE : : : : : : : : : : : : : : : : :
EL 08-15 -64.8 -1.1 07-07 46.6 -4.8 -6.8 -7.0 2.0 6.6 16.0 5.8 1.3 3.2 19.2 22.9 32.6
ES 12-08 -37.4 1.2 02-18 25.6 23.1 22.0 19.9 18.8 25.6 23.6 24.3 21.0 21.7 18.9 17.9 18.7
FR 04-09 -33.7 -9.3 10-99 12.6 8.2 10.9 7.2 4.3 3.3 0.9 4.2 4.3 5.4 6.9 10.3 6.0
HR 08-09 -41.7 -7.5 04-18 27.1 7.1 9.7 -1.4 7.9 15.2 11.5 27.1 20.6 23.4 20.4 8.0 14.7
IT 07-99 -82.1 -12.4 09-00 32.5 11.8 6.4 15.7 18.4 13.4 10.1 12.2 14.2 14.5 12.1 8.8 8.6
CY 04-13 -72.2 -13.7 03-07 34.8 15.6 8.7 8.3 15.6 16.8 24.3 13.4 13.1 9.5 8.0 11.6 -3.5
LV 02-09 -53.7 5.7 02-07 30.2 7.7 9.3 7.5 13.9 12.4 10.2 8.0 9.3 11.3 14.3 12.2 7.9
LT 11-09 -86.1 5.2 12-06 55.7 7.2 6.7 26.1 17.4 18.4 10.5 2.4 1.8 2.9 3.5 8.9 13.5
LU : : : : : : : : : : : : : : : : :
HU 02-09 -48.8 -2.3 01-14 27.7 18.6 16.3 15.1 24.9 22.6 17.7 13.5 9.0 15.8 12.2 11.2 19.3
MT 11-12 -23.9 0.5 06-16 38.6 5.9 15.3 2.7 16.0 18.6 -16.8 -4.8 -14.4 -1.7 6.3 4.8 4.0
NL 07-09 -25.2 5.4 08-99 29.0 11.8 12.8 13.6 18.9 16.9 13.7 14.7 11.5 10.4 8.5 7.1 10.3
AT 03-03 -39.1 -19.0 10-10 6.3 -12.9 -6.2 -5.0 -9.2 -16.0 -9.3 -8.5 -8.8 -11.0 -12.0 -14.5 -14.0
PL 02-02 -24.3 -1.9 06-08 18.4 6.4 8.0 12.9 10.6 9.6 6.6 4.2 7.1 6.3 6.5 5.3 8.2
PT 10-12 -42.6 -4.6 11-98 28.8 2.9 -0.2 1.8 2.0 -0.5 0.6 0.0 0.9 1.2 -0.3 1.9 0.8
RO 01-10 -25.7 13.3 03-97 80.5 23.9 22.1 9.8 15.4 11.8 1.4 -6.0 12.4 7.2 0.4 10.1 21.7
SI 03-09 -47.0 10.4 11-16 43.4 11.4 5.6 12.2 10.4 5.4 -2.9 24.8 5.7 1.6 8.9 7.7 10.9
SK 03-96 -18.8 33.3 01-02 79.8 27.3 23.8 26.2 33.3 28.6 29.6 23.8 30.5 37.1 30.5 26.0 26.1
FI 06-15 -54.0 -8.9 09-07 21.3 4.8 16.3 4.2 1.2 10.5 9.9 -2.7 16.9 20.2 8.9 19.3 9.4
SE 01-09 -49.8 12.8 04-10 60.1 27.2 22.7 27.0 15.2 19.9 20.3 19.4 15.1 20.7 13.4 24.5 10.8
UK 01-09 -65.7 6.9 12-01 44.4 -6.5 7.9 -2.1 1.0 8.4 10.1 5.8 0.4 13.4 11.7 0.6 -4.4
EMPLOYMENT EU 03-09 -18.0 -2.2 05-00 7.0 0.8 1.1 -0.1 1.6 2.5 3.9 4.5 4.7 6.2 4.0 4.7 3.3
EXPECTATIONS EA 04-09 -15.2 -3.1 03-91 7.8 6.2 6.9 6.3 7.4 6.4 4.1 5.0 4.0 4.6 6.3 3.9 5.3
(Question 5) BE 04-09 -17.2 2.0 01-07 16.4 5.1 0.5 0.6 1.6 -3.4 -1.9 -4.7 -4.5 -9.0 -2.7 -5.4 -7.3
BG 04-98 -44.6 -4.1 05-16 18.3 12.1 13.3 14.4 13.3 11.9 12.8 12.7 9.4 7.3 7.3 7.2 11.4
CZ 01-95 -40.7 6.9 02-08 37.3 15.8 13.8 11.6 16.4 26.7 29.9 25.3 31.9 29.3 28.0 28.3 18.3
DK 01-12 -17.1 1.5 08-14 15.2 3.0 5.7 4.2 7.1 7.7 5.0 3.6 8.9 6.4 6.7 1.0 4.1
DE 12-02 -33.6 -7.8 03-91 10.4 2.8 3.8 4.4 6.4 4.0 0.6 2.1 3.1 2.1 2.7 1.0 1.0
EE 03-09 -51.1 -1.6 04-07 25.0 9.3 2.0 3.4 5.2 7.4 -6.7 0.2 -1.4 -3.2 1.1 4.6 6.8
IE : : : : : : : : : : : : : : : : :
EL 01-12 -69.9 16.0 03-98 62.0 12.5 9.8 9.8 13.0 15.4 13.3 10.7 -1.4 -6.2 5.1 11.1 39.4
ES 12-08 -19.2 -0.8 09-17 15.0 11.4 13.0 8.3 8.9 10.0 8.9 14.0 11.4 14.6 10.6 9.1 9.7
FR 05-09 -22.0 -2.5 12-00 12.3 -2.2 0.9 0.5 -0.6 0.7 -0.1 0.7 -1.1 1.7 2.9 -2.8 -0.5
HR 08-09 -25.2 -1.6 05-18 31.4 18.7 13.7 15.1 14.7 14.4 15.7 25.8 31.4 25.0 17.6 15.3 16.8
IT 01-97 -53.9 -2.5 01-00 34.3 18.5 18.2 16.0 16.8 14.9 8.2 8.2 6.1 9.2 13.3 13.9 12.2
CY 06-13 -19.2 -2.4 06-08 13.1 0.8 0.5 1.3 -0.7 0.4 3.2 0.1 0.7 0.3 0.6 0.2 0.2
LV 03-09 -39.3 0.8 04-07 24.6 4.0 0.7 2.1 4.4 6.0 2.0 1.9 4.9 5.3 6.5 2.4 3.4
LT 11-09 -69.9 2.7 11-06 74.3 2.8 5.8 13.3 15.9 15.3 10.2 12.0 13.2 11.7 13.3 11.9 12.5
LU : : : : : : : : : : : : : : : : :
HU 05-96 -35.2 -5.6 04-18 12.6 8.6 6.5 9.9 8.0 5.5 6.2 12.6 5.4 6.2 7.3 6.6 10.9
MT 07-12 -24.3 2.5 08-18 45.2 5.2 18.2 5.2 21.2 20.7 13.3 -10.9 7.0 5.0 13.3 45.2 24.0
NL 11-12 -21.5 3.2 12-10 20.7 8.1 7.5 8.7 13.6 10.5 9.8 14.2 11.7 8.8 14.5 10.6 12.3
AT 03-96 -16.4 -3.4 08-10 12.7 5.3 -8.3 5.4 4.9 -0.1 5.3 -1.5 -1.6 -6.1 -2.5 -10.7 2.5
PL 12-01 -24.6 -5.4 02-08 12.9 3.5 4.7 3.9 5.2 4.2 2.8 1.0 2.8 3.0 3.4 5.1 4.4
PT 10-12 -30.6 -3.0 09-97 19.4 5.3 4.9 2.9 3.5 3.0 2.3 5.1 4.4 3.7 5.7 4.1 3.0
RO 10-94 -32.1 -0.3 12-98 64.2 9.8 10.3 12.3 10.4 9.6 9.7 9.5 6.1 12.8 15.2 8.4 12.6
SI 02-99 -46.5 -5.1 11-17 59.5 46.8 59.5 44.2 45.7 39.6 46.9 38.8 39.4 34.8 23.6 19.7 40.8
SK 12-93 -70.6 2.0 09-02 32.7 17.1 20.2 12.8 5.3 13.2 18.4 21.3 19.2 26.3 22.5 17.7 17.6
FI 04-15 -38.7 -8.4 02-07 11.1 -8.2 -0.7 -2.9 0.9 6.9 8.0 -2.0 5.4 3.5 6.1 2.9 1.0
SE 12-08 -50.3 -8.5 02-10 23.1 13.8 11.7 9.0 8.9 6.3 3.7 1.2 4.5 3.5 2.4 6.4 9.3
UK 01-09 -44.3 2.7 10-97 33.4 -26.7 -27.6 -31.8 -27.0 -17.3 0.6 1.5 5.5 11.7 -8.0 6.0 -8.6
Ave.Max.Min.
Page 18
18
TABLE 5 (continued) : Monthly survey of retail trade (s.a.)
Since 1990 (*) 2017 2018
Min. Max.
Date Value Date Value Oct Nov Dec Jan Feb Mar Apr May Jun Jul Aug Sep
SELLING–PRICE EU 11-14 -2.7 9.5 03-11 26.7 13.7 16.4 15.7 12.8 13.2 11.4 12.2 14.0 11.2 12.7 13.8 15.8
EXPECTATIONS EA 03-09 -8.5 5.6 11-07 21.2 7.0 6.9 7.3 7.1 6.5 6.4 6.1 7.3 6.8 6.8 7.8 7.2
(Question 6) BE 08-09 -13.2 5.3 04-11 26.4 11.8 10.8 10.4 6.8 5.0 10.9 9.1 7.0 11.8 10.5 6.9 1.7
BG 11-09 -9.2 10.5 07-08 45.8 8.0 5.3 9.0 11.6 6.9 5.6 5.6 6.1 9.5 7.7 10.7 10.2
CZ 01-15 -11.9 3.3 01-04 22.5 22.1 20.2 9.5 11.3 7.3 7.5 13.5 12.5 9.4 9.5 8.4 7.6
DK 02-13 -12.5 0.1 02-11 24.2 -3.6 1.9 -0.7 4.8 0.2 -5.5 -1.2 -0.5 -0.2 0.2 -1.4 -1.9
DE 11-09 -5.6 11.9 07-91 41.0 11.5 12.4 13.6 12.7 10.2 11.0 10.4 14.7 14.1 14.2 18.2 16.4
EE 03-09 -35.9 28.3 04-11 54.9 49.3 51.2 49.7 50.7 47.2 44.4 48.5 44.2 41.8 50.9 45.2 48.2
IE : : : : : : : : : : : : : : : : :
EL 06-12 -35.2 -0.9 05-08 33.6 -2.1 -3.6 1.7 1.0 0.1 3.2 1.3 4.6 -4.7 3.2 5.9 0.4
ES 02-09 -18.6 4.7 01-05 28.7 7.1 9.1 6.1 8.4 5.1 4.2 3.2 2.6 0.9 2.2 2.5 6.2
FR 03-09 -29.4 -2.7 09-95 15.5 3.1 -0.4 -2.5 -3.6 2.0 -2.7 -0.4 -0.5 -3.1 -0.6 -1.6 0.0
HR 02-14 -13.2 1.1 06-08 31.6 9.5 8.7 2.6 -0.3 7.1 4.4 12.2 10.9 11.2 8.0 6.2 1.0
IT 08-05 -14.5 8.0 06-08 33.1 6.6 5.9 9.1 7.1 4.3 9.5 5.6 6.5 8.3 4.7 5.2 3.0
CY 04-13 -27.7 3.9 07-08 34.3 9.2 9.1 8.1 2.0 4.6 2.8 11.2 3.0 3.2 4.3 7.7 3.9
LV 01-10 -22.5 20.9 05-04 55.7 17.1 16.3 18.5 27.6 22.6 17.4 16.0 15.5 17.0 15.8 14.3 16.3
LT 07-09 -46.5 8.6 04-11 61.7 8.7 10.3 5.9 3.2 1.5 -2.0 0.5 2.0 9.7 4.9 3.5 8.6
LU : : : : : : : : : : : : : : : : :
HU 03-10 3.6 39.1 05-96 81.3 21.0 19.5 26.8 22.0 27.0 36.7 25.1 20.7 32.1 39.6 32.8 31.1
MT 02-14 -25.0 6.7 04-15 33.7 3.4 -1.9 -3.1 3.4 12.6 -5.9 -5.4 -5.1 8.1 3.0 4.2 8.2
NL 11-10 -18.7 5.5 10-12 26.2 -1.3 -1.3 3.5 4.6 2.8 0.0 2.8 3.5 3.5 4.2 2.9 1.4
AT 09-09 -1.0 13.8 02-08 34.1 11.5 21.2 25.2 20.8 17.1 14.7 12.0 13.9 17.5 13.9 21.2 17.2
PL 07-02 -7.0 14.0 03-09 39.4 14.3 13.7 14.9 12.7 11.8 12.7 9.8 12.0 12.7 12.5 11.3 13.0
PT 07-03 -21.5 3.8 07-05 25.3 1.6 1.0 2.3 4.2 1.8 0.8 0.9 2.7 2.0 1.7 5.0 2.2
RO 01-16 -14.9 25.0 10-04 56.0 29.7 30.1 25.3 28.9 24.8 17.7 18.6 29.8 26.1 26.4 17.7 26.9
SI 03-09 -32.6 9.7 02-08 40.2 -0.6 12.6 -2.2 12.1 6.9 8.2 9.0 2.4 -4.8 13.2 6.3 7.2
SK 07-09 -36.9 15.3 11-02 73.9 18.0 19.2 13.7 26.5 9.9 18.1 18.6 23.5 28.6 19.8 18.2 20.3
FI 03-15 -48.9 4.2 07-11 59.6 8.4 7.3 4.7 23.9 36.2 26.6 23.8 18.3 19.6 15.3 3.0 10.9
SE 07-05 -10.3 13.1 07-08 36.8 12.5 13.4 11.2 13.8 13.6 13.6 14.7 24.3 25.4 32.8 27.1 33.3
UK 05-15 -17.3 23.5 01-11 66.9 40.6 56.1 51.3 34.9 40.9 31.3 37.5 40.6 25.7 33.0 37.7 49.7(a) The indicator is the arithmetic average of the balances (%) for the present and the future business situation, and for stocks – with inverted sign.
(b) United Kingdom: refers to the volume of sales for the time of the year.
(*) Minimum, maximum and averages are calculated over the period of availability which is not necessarily as from 01/1990.
Ave.
Page 19
19
TABLE 6: Monthly survey of construction industry (s.a.) (a)
Since 1990 (*) 2017 2018
Min. Max.
Date Value Date Value Oct Nov Dec Jan Feb Mar Apr May Jun Jul Aug Sep
CONSTRUCTION EU 06-93 -44.2 -18.1 09-18 5.3 1.9 0.8 2.2 1.8 2.4 3.0 3.5 4.8 4.2 3.5 4.3 5.3CONFIDENCE EA 09-93 -45.4 -17.4 09-18 8.3 0.1 1.7 3.2 4.7 4.2 5.2 4.6 7.1 5.6 5.4 6.4 8.3
INDICATOR (a)
BE 11-95 -35.1 -10.1 02-90 9.7 -6.7 -5.2 -4.3 -1.3 -5.3 -2.1 1.4 1.3 0.0 2.0 1.6 1.9
BG 10-09 -56.0 -24.2 11-07 23.9 -13.2 -11.1 -10.3 -5.7 -4.8 -9.8 -10.1 -9.7 -10.1 -10.3 -9.0 -9.6
CZ 02-99 -54.9 -20.4 01-05 5.3 -17.4 -15.4 -13.2 -14.4 -8.4 -5.9 -5.3 -6.4 -5.4 -4.9 -3.2 -2.7
DK 10-09 -50.0 -9.5 11-06 24.2 -1.6 -2.3 -2.1 0.5 -0.3 -1.9 -2.7 -0.1 -1.8 -0.1 -0.9 -0.5
DE 12-02 -55.7 -24.6 07-18 19.0 11.5 13.5 14.2 15.3 15.6 15.6 16.0 16.6 15.0 19.0 17.6 18.0
EE 04-09 -76.0 -1.2 05-06 48.8 9.7 13.0 10.5 13.0 6.2 8.8 6.5 3.0 11.5 12.3 9.5 12.5
IE : : : : : : : : : : : : : : : : :
EL 08-11 -77.4 -23.9 04-00 32.5 -44.7 -59.3 -58.3 -50.4 -45.1 -55.0 -54.7 -39.0 -47.8 -45.8 -45.1 -54.5
ES 08-13 -69.3 -13.9 12-98 39.5 -14.0 -14.5 -18.7 -3.0 -4.7 -5.2 -12.3 1.5 -1.4 -17.3 -10.2 2.5
FR 01-93 -62.3 -15.1 10-00 44.9 0.6 0.5 5.7 4.4 3.4 5.9 4.9 5.0 6.4 8.2 8.4 9.3
HR 03-10 -49.2 -22.2 09-18 13.9 3.8 4.9 5.1 5.4 7.6 6.9 8.4 12.6 13.9 11.0 11.7 13.9
IT 09-93 -75.4 -22.3 04-90 13.4 -15.3 -13.3 -13.4 -13.3 -12.1 -11.6 -10.8 -10.8 -12.7 -9.9 -8.8 -11.1
CY 04-13 -72.7 -24.8 12-03 36.5 -28.3 -22.9 -24.3 -22.8 -18.8 -15.6 -16.7 -13.1 -14.5 -10.8 -10.9 -23.1
LV 07-09 -79.4 -24.3 01-07 19.2 -7.4 -5.1 -0.6 -1.7 -1.2 -3.5 -2.8 -1.2 -0.5 -1.1 -0.6 0.7
LT 05-09 -92.9 -32.1 01-07 13.4 -23.2 -12.7 -14.3 -15.1 -11.5 -8.7 -9.0 -12.1 -11.2 -9.0 -13.2 -12.4
LU 03-94 -70.9 -18.3 09-17 40.8 15.9 12.5 8.1 17.6 20.9 19.0 15.2 16.0 16.1 16.2 16.8 17.8
HU 04-09 -56.0 -15.5 08-18 32.0 15.8 17.0 25.1 25.1 22.9 20.7 21.7 28.0 29.0 30.6 32.0 25.9
MT 03-09 -53.4 -16.0 05-18 37.9 26.4 21.0 33.4 27.4 28.8 26.2 25.0 37.9 25.3 29.1 21.5 11.8
NL 12-12 -47.7 -4.0 12-17 41.8 22.4 31.9 41.8 33.6 30.0 36.0 35.1 38.2 31.4 34.0 32.5 35.1
AT 04-96 -56.4 -15.4 09-18 19.6 10.4 15.4 13.4 9.6 8.8 10.8 11.0 10.0 8.1 17.6 15.4 19.6
PL 02-02 -67.9 -31.6 02-08 -0.7 -13.2 -11.9 -8.7 -7.0 -6.0 -6.9 -7.3 -7.1 -7.3 -8.4 -8.7 -8.3
PT 10-12 -70.2 -29.9 12-97 1.9 -19.0 -17.6 -17.2 -15.5 -15.4 -13.4 -9.2 -10.5 -7.5 -9.9 -12.9 -12.4
RO 09-99 -60.4 -14.3 06-96 34.6 -14.1 -13.4 -12.3 -9.5 -14.9 -14.1 -15.2 -13.9 -12.3 -11.7 -9.4 -8.4
SI 03-10 -63.9 -9.6 03-07 27.8 23.1 15.1 21.0 23.9 24.5 24.8 27.3 26.0 27.4 23.4 22.1 17.6
SK 07-99 -86.1 -25.2 03-97 17.5 0.5 -2.9 -1.5 -2.7 -1.7 -5.5 -1.3 -3.1 0.5 -2.5 -2.6 -11.4
FI 09-91 -108.6 -17.5 06-98 36.5 4.5 9.6 8.4 2.3 4.0 1.5 8.4 5.9 6.7 -2.9 13.1 14.5
SE 12-93 -82.9 -19.0 08-07 47.6 35.5 29.0 28.7 30.0 27.4 26.3 28.6 22.0 23.1 19.1 22.8 15.8
UK 06-91 -79.3 -19.9 10-17 10.7 10.7 -1.9 -1.0 -11.1 -4.7 -5.1 0.5 -2.0 0.5 -1.9 -2.4 -2.6ORDER BOOKS EU 08-93 -56.5 -27.2 03-90 0.4 -6.3 -7.7 -6.6 -6.5 -5.6 -5.2 -5.2 -2.5 -2.7 -2.7 -2.8 -0.9(Question 3) EA 08-93 -56.6 -25.2 09-18 4.0 -7.3 -5.0 -4.4 -2.6 -2.9 -1.6 -2.4 1.1 -0.1 0.7 1.0 4.0
BE 01-96 -47.2 -18.7 03-07 3.5 -15.3 -11.1 -12.5 -9.9 -11.0 -5.3 -4.7 -5.1 -6.2 -4.8 -4.6 -4.7Component of the BG 03-12 -82.2 -43.7 10-07 0.8 -37.7 -36.0 -31.6 -28.7 -28.7 -32.0 -31.1 -31.2 -29.8 -29.1 -30.4 -30.0construction confidence CZ 10-13 -70.7 -28.3 12-02 10.9 -27.6 -27.7 -27.2 -27.6 -21.0 -17.8 -17.7 -17.1 -14.7 -15.0 -14.4 -14.9indicator DK 01-10 -66.0 -14.9 07-06 33.4 -14.2 -14.0 -15.4 -14.7 -11.8 -10.1 -11.0 -10.9 -9.0 -8.5 -10.9 -11.9
DE 07-02 -66.7 -33.3 07-18 25.4 13.1 15.8 15.4 15.6 19.1 20.2 20.3 20.7 20.8 25.4 24.4 24.1
EE 07-09 -82.8 -10.0 04-06 59.1 7.3 12.3 -0.6 1.6 -5.8 -5.4 -2.3 -3.3 6.0 10.6 7.3 4.8
IE : : : : : : : : : : : : : : : : :
EL 11-11 -98.6 -45.0 04-00 16.0 -59.7 -63.8 -78.0 -70.4 -57.4 -67.5 -59.5 -53.5 -56.0 -62.7 -65.3 -58.3
ES 08-13 -72.9 -13.2 11-05 54.2 -32.8 -30.6 -34.8 -22.0 -27.8 -25.4 -31.3 -14.5 -21.4 -31.9 -31.3 -5.6
FR 07-93 -71.3 -23.5 10-00 50.9 -9.5 -9.4 -5.7 -5.0 -5.5 -4.7 -7.6 -6.8 -3.3 -1.6 -1.6 -1.7
HR 03-10 -64.4 -39.1 09-18 2.4 -12.0 -10.1 -10.3 -12.0 -10.5 -8.6 -5.8 -2.4 -0.4 -2.2 -3.2 2.4
IT 01-94 -94.5 -35.9 04-90 6.5 -24.3 -23.4 -22.6 -20.5 -22.5 -23.9 -22.7 -19.6 -24.0 -18.7 -19.1 -21.1
CY 08-13 -94.1 -43.5 12-03 43.0 -58.6 -46.5 -46.5 -52.0 -45.0 -36.6 -42.1 -36.5 -33.6 -37.3 -33.4 -50.7
LV 09-09 -92.3 -43.1 01-07 8.5 -19.5 -16.7 -12.8 -13.8 -9.8 -12.2 -11.5 -10.1 -8.0 -8.5 -11.4 -7.0
LT 09-09 -102.9 -53.4 03-07 1.2 -49.4 -38.2 -42.5 -37.7 -35.2 -24.9 -31.0 -31.9 -32.7 -26.6 -30.3 -28.3
LU 08-93 -70.1 -20.9 09-17 33.4 13.6 10.8 1.9 16.5 19.8 18.4 14.5 17.0 16.7 14.0 13.8 5.6
HU 05-09 -69.2 -25.8 08-18 40.0 10.9 16.4 26.3 24.1 27.8 25.0 26.4 36.8 35.2 34.9 40.0 36.1
MT 10-13 -72.6 -31.1 05-18 32.8 20.1 15.4 28.1 20.7 29.0 25.5 16.2 32.8 18.2 23.2 20.0 6.9
NL 03-13 -56.7 -9.3 05-18 41.4 18.5 30.9 39.5 30.1 29.1 36.3 36.0 41.4 35.2 37.6 37.9 37.8
AT 04-96 -59.1 -22.8 08-18 19.8 8.6 9.3 8.1 10.3 6.3 9.6 11.8 11.4 12.3 16.1 19.8 18.3
PL 10-02 -86.4 -52.7 05-18 -17.4 -30.4 -28.9 -25.1 -21.7 -19.1 -19.0 -18.2 -17.4 -18.2 -19.1 -20.1 -19.6
PT 10-12 -82.8 -45.4 12-97 -4.9 -31.0 -29.0 -28.8 -26.2 -27.5 -26.3 -20.6 -21.4 -18.0 -23.4 -25.7 -23.2
RO 09-99 -89.1 -22.2 03-98 63.2 -23.2 -23.7 -22.8 -20.1 -21.0 -22.8 -23.2 -22.2 -20.5 -19.0 -17.7 -17.2
SI 07-10 -79.1 -14.5 08-04 31.7 18.1 12.4 17.6 14.2 12.5 21.3 23.3 20.0 24.7 21.4 15.7 10.0
SK 03-94 -92.8 -39.9 04-18 -1.2 -9.9 -13.4 -11.5 -16.6 -11.6 -12.0 -1.2 -4.3 -4.8 -4.9 -3.0 -15.5
FI 12-91 -126.7 -27.5 11-07 27.8 0.0 5.8 0.8 0.2 1.8 -2.5 8.2 1.0 7.9 -4.9 15.6 13.9
SE 05-97 -97.4 -31.5 05-07 43.3 36.7 22.8 26.6 30.1 26.8 29.7 24.2 23.5 26.2 24.6 20.4 16.1
UK 06-91 -86.6 -33.8 10-17 1.7 1.7 -14.5 -12.9 -21.2 -15.3 -19.5 -15.7 -15.1 -11.9 -14.4 -15.6 -15.9EMPLOYMENT EU 10-92 -34.9 -8.9 03-07 12.3 10.1 9.3 11.1 10.1 10.5 11.2 12.2 12.0 11.1 9.8 11.5 11.6EXPECTATIONS EA 12-96 -36.7 -9.6 02-90 13.9 7.6 8.4 10.9 12.1 11.4 12.1 11.5 13.0 11.3 10.2 11.7 12.5(Question 4) BE 11-95 -25.1 -1.5 02-90 20.8 1.8 0.7 4.0 7.2 0.4 1.2 7.5 7.7 6.1 8.8 7.8 8.5
BG 10-09 -49.3 -4.7 12-07 49.7 11.4 13.9 11.0 17.3 19.1 12.5 10.9 11.9 9.6 8.6 12.5 10.7Component of the CZ 03-99 -53.1 -12.6 01-96 19.7 -7.3 -3.2 0.7 -1.2 4.3 6.1 7.1 4.3 3.9 5.2 8.0 9.6construction confidence DK 03-09 -38.0 -4.2 03-98 42.0 10.9 9.5 11.3 15.7 11.3 6.4 5.6 10.6 5.3 8.3 9.1 10.9indicator DE 01-96 -54.2 -16.0 02-90 18.9 9.9 11.3 13.0 14.9 12.2 10.9 11.7 12.5 9.2 12.6 10.7 12.0
EE 03-09 -75.9 7.5 01-97 68.6 12.2 13.7 21.7 24.4 18.2 23.0 15.4 9.3 17.0 13.9 11.7 20.1
IE : : : : : : : : : : : : : : : : :
EL 08-15 -74.2 -2.7 03-99 59.5 -29.6 -54.8 -38.6 -30.3 -32.9 -42.5 -49.9 -24.5 -39.5 -28.8 -24.9 -50.7
ES 12-11 -76.2 -14.7 12-98 54.6 4.8 1.7 -2.6 15.9 18.3 14.9 6.6 17.6 18.5 -2.8 10.9 10.6
FR 01-93 -54.9 -6.7 10-00 39.0 10.6 10.3 17.1 13.8 12.4 16.6 17.5 16.7 16.2 18.0 18.4 20.2
HR 08-09 -35.2 -5.4 06-18 28.1 19.6 19.8 20.6 22.7 25.6 22.5 22.7 27.5 28.1 24.1 26.6 25.4
IT 09-93 -64.5 -8.8 05-04 26.8 -6.2 -3.3 -4.1 -6.0 -1.7 0.6 1.1 -2.1 -1.5 -1.1 1.5 -1.2
CY 04-13 -53.0 -6.2 11-03 49.6 2.1 0.6 -2.1 6.4 7.5 5.5 8.7 10.3 4.5 15.6 11.6 4.6
LV 05-09 -74.4 -5.5 12-06 34.5 4.6 6.4 11.7 10.4 7.4 5.2 6.0 7.6 6.9 6.3 10.2 8.4
LT 05-09 -95.2 -10.9 03-03 36.7 2.9 12.8 13.8 7.5 12.3 7.4 12.9 7.6 10.3 8.7 3.8 3.6
LU 02-94 -75.6 -15.7 09-17 48.3 18.2 14.3 14.3 18.7 22.1 19.5 15.8 15.0 15.5 18.4 19.7 30.0
HU 04-09 -46.0 -5.2 07-18 26.3 20.7 17.7 23.9 26.0 18.0 16.3 17.0 19.1 22.7 26.3 24.0 15.7
MT 04-09 -38.6 -0.9 05-18 43.0 32.7 26.6 38.6 34.1 28.5 27.0 33.8 43.0 32.4 35.1 23.0 16.8
NL 12-12 -42.8 1.4 12-17 44.1 26.3 32.9 44.1 37.2 30.9 35.6 34.2 35.1 27.6 30.3 27.0 32.3
AT 02-01 -73.9 -8.1 11-17 21.6 12.1 21.6 18.8 8.9 11.3 12.0 10.2 8.6 3.8 19.1 11.0 20.8
PL 02-02 -58.6 -9.9 12-07 24.1 4.1 5.1 7.7 7.7 7.1 5.3 3.6 3.3 3.6 2.3 2.7 3.0
PT 05-12 -59.9 -14.4 09-97 19.4 -7.0 -6.2 -5.5 -4.9 -3.2 -0.6 2.1 0.4 3.1 3.7 -0.1 -1.5
RO 06-97 -39.4 -6.4 03-01 37.6 -4.9 -3.2 -1.8 1.0 -8.8 -5.3 -7.2 -5.5 -4.0 -4.3 -1.1 0.4
SI 03-10 -56.8 -4.6 02-18 36.5 28.2 17.8 24.3 33.6 36.5 28.4 31.3 31.9 30.2 25.3 28.5 25.2
SK 07-99 -85.9 -10.5 01-97 40.5 10.9 7.5 8.5 11.1 8.3 1.0 -1.4 -1.8 5.9 -0.2 -2.3 -7.2
FI 06-91 -104.8 -7.6 03-97 59.8 9.0 13.4 16.0 4.4 6.2 5.4 8.6 10.9 5.4 -1.0 10.6 15.1
SE 01-97 -77.6 -6.6 12-10 63.0 34.3 35.2 30.9 29.8 28.0 23.0 33.1 20.6 20.1 13.6 25.1 15.5
UK 06-91 -72.0 -6.0 01-16 20.9 19.8 10.8 10.8 -1.0 5.9 9.2 16.7 11.1 12.8 10.6 10.9 10.6
Ave.
Page 20
20
TABLE 6 (continued) : Monthly survey of construction industry (s.a.)
Since 1990 (*) 2017 2018
Min. Max.
Date Value Date Value Oct Nov Dec Jan Feb Mar Apr May Jun Jul Aug Sep
TREND OF ACTIVITY EU 06-09 -32.4 -5.8 02-07 16.7 10.1 6.2 6.3 9.2 10.2 6.7 7.1 10.6 6.6 6.7 5.4 6.9COMPARED WITH EA 06-09 -34.6 -6.9 09-06 16.1 8.7 6.2 7.1 11.2 11.7 6.6 7.6 10.8 8.4 7.3 8.5 9.2PRECEDING MONTHS BE 03-96 -25.3 -3.3 02-90 12.9 -1.7 4.1 0.8 3.8 0.7 -6.3 -0.1 5.1 3.4 7.8 5.5 3.0(Question 1) BG 10-00 -51.3 -8.7 12-05 28.2 0.3 3.2 5.5 9.0 9.6 6.7 3.3 3.4 1.3 -0.7 0.7 1.0
CZ 01-14 -11.1 25.1 01-05 78.4 25.3 26.7 31.9 35.7 36.9 35.8 37.5 37.1 36.6 35.4 45.0 44.7
DK 03-10 -46.0 -2.5 02-07 21.0 12.4 7.0 5.5 11.4 14.6 13.7 14.4 11.8 15.7 12.5 8.3 11.7
DE 03-05 -45.3 -12.4 03-91 37.1 6.5 2.7 5.6 8.2 12.3 -2.6 -0.6 3.0 6.7 7.6 10.4 9.1
EE 06-09 -50.5 12.1 06-02 87.1 26.2 18.1 21.3 18.6 17.4 11.5 17.8 23.9 22.0 29.8 19.2 20.9
IE : : : : : : : : : : : : : : : : :
EL 08-11 -73.7 -6.7 06-98 60.6 -29.0 -45.2 -46.6 -41.9 -34.3 -33.8 -40.6 -44.3 -44.3 -20.2 -31.1 -44.7
ES 07-97 -50.7 -1.6 06-99 47.8 16.7 -10.1 -12.0 13.3 3.4 1.9 8.0 24.4 10.1 -12.3 -4.5 10.8
FR 01-93 -65.8 -5.5 04-00 51.3 11.7 14.8 18.9 18.1 20.5 20.4 17.2 12.6 10.3 15.1 14.9 12.0
HR 01-10 -54.1 -9.0 04-17 26.1 12.9 21.9 15.9 13.5 22.5 9.7 17.4 21.7 23.9 18.6 18.9 20.5
IT 02-93 -56.7 -14.6 06-04 19.4 -7.0 -4.2 -3.9 -2.9 -1.7 -6.7 -3.9 -4.4 -3.6 -0.5 -2.9 -2.9
CY 04-13 -77.6 -21.3 09-02 63.6 -4.3 6.5 3.0 11.8 4.8 10.2 13.0 11.5 -2.5 3.4 9.8 7.2
LV 07-09 -74.3 -4.8 06-02 41.9 6.5 13.7 16.9 19.2 16.9 5.4 2.6 7.0 10.2 12.3 6.7 6.4
LT 06-09 -85.7 -1.5 06-02 81.1 -0.1 5.9 15.0 16.7 16.9 10.6 3.3 6.1 7.4 5.9 7.9 12.0
LU 08-99 -78.6 -19.1 09-99 49.4 3.4 -0.6 1.8 6.5 4.2 6.8 9.4 6.8 5.1 4.6 5.3 -0.4
HU 05-09 -54.5 -12.4 06-18 33.6 11.4 18.8 21.8 32.3 29.7 30.9 25.6 32.5 33.6 30.6 29.8 21.0
MT 04-09 -54.2 -0.6 05-15 49.8 24.5 28.2 37.7 33.2 32.9 41.0 32.7 29.6 49.7 34.1 32.3 25.9
NL 03-10 -47.4 -1.4 03-97 36.5 20.7 32.1 28.2 25.6 30.5 30.5 23.4 36.4 23.9 24.7 25.3 27.8
AT 04-96 -83.7 2.2 01-04 30.2 26.4 24.5 25.7 27.6 22.6 20.2 23.5 26.5 21.6 27.3 24.1 18.8
PL 03-04 -26.9 3.3 01-05 45.3 3.6 3.5 4.6 10.4 13.0 9.3 6.9 7.1 4.7 2.4 3.0 2.3
PT 05-12 -66.8 -15.9 05-97 26.1 -5.0 -3.3 -7.6 -6.4 -6.2 -5.0 -2.7 -3.5 0.8 -7.3 -3.9 -2.0
RO 06-99 -103.5 4.5 04-02 98.8 -3.3 -3.1 -3.8 -2.2 -1.9 -5.9 -5.9 -5.3 -3.3 -2.6 -0.8 1.0
SI 10-09 -65.6 0.6 03-07 48.1 34.2 30.6 39.2 32.0 19.7 24.6 27.9 31.2 32.5 31.4 25.6 14.8
SK 06-99 -43.4 9.5 12-04 56.6 31.7 22.2 23.9 28.6 26.5 34.1 35.1 36.6 37.2 32.0 33.9 26.0
FI 09-91 -99.7 -3.0 06-98 47.1 4.9 24.6 11.1 10.6 17.5 3.2 7.7 -6.8 -2.1 1.6 5.8 4.7
SE 12-91 -66.7 0.3 12-10 61.8 21.9 15.9 25.2 30.8 18.6 16.2 8.5 16.7 0.7 5.6 3.6 -1.0
UK 06-91 -68.2 -5.6 01-14 22.9 15.5 3.6 -1.7 -6.0 -1.3 2.2 2.8 8.4 -2.6 2.3 -10.4 -4.1PRICE EU 05-09 -33.3 2.6 05-90 30.6 13.7 11.7 13.0 12.6 14.1 16.1 13.2 16.3 15.5 14.3 14.5 15.9EXPECTATIONS EA 05-09 -32.7 -0.6 05-90 42.2 8.1 7.9 8.8 10.6 10.2 11.8 9.8 14.3 12.5 12.3 13.2 11.9(Question 5) BE 01-96 -20.0 -1.0 01-90 32.5 1.4 2.2 -1.4 0.3 3.2 4.4 6.2 4.2 4.9 4.1 3.5 4.1
BG 10-09 -18.1 23.0 01-95 91.3 5.6 5.0 6.0 6.5 5.8 5.8 4.6 3.2 2.1 3.8 5.9 3.3
CZ 07-13 -32.8 21.1 02-95 81.6 12.6 11.0 12.7 19.1 21.5 14.3 18.4 20.5 22.2 21.4 21.4 20.7
DK 02-09 -53.1 -13.4 02-06 8.3 -0.4 -1.0 -0.7 0.8 -3.1 0.3 -1.7 -1.7 -2.0 -1.3 -3.4 -2.1
DE 03-96 -43.2 -9.8 02-90 44.7 10.2 11.5 13.4 17.1 14.5 11.2 10.9 11.9 15.2 18.2 19.8 20.0
EE 02-09 -59.8 24.9 04-94 88.3 45.4 39.4 39.2 42.9 41.3 37.1 37.2 32.9 37.5 43.6 42.6 33.8
IE : : : : : : : : : : : : : : : : :
EL 12-11 -47.8 -5.8 06-95 35.3 -18.1 -22.7 -29.0 -30.0 -23.3 -30.0 -20.4 -23.6 -16.9 -22.3 -23.0 -42.2
ES 04-14 -44.7 6.0 08-99 75.5 5.2 2.4 -3.5 -7.4 2.9 5.1 -5.7 19.8 6.1 -2.1 4.9 1.1
FR 06-09 -55.7 -19.2 04-07 12.7 -2.9 -3.4 1.7 5.1 3.2 4.2 5.7 6.6 5.6 7.8 6.2 6.6
HR 07-10 -27.3 -2.5 06-08 48.5 13.4 14.5 20.1 17.2 18.9 19.3 19.2 23.4 25.7 27.0 24.0 21.9
IT 05-09 -20.7 5.6 05-90 60.6 -3.3 -2.8 -1.9 -1.7 -0.4 -1.1 -2.2 -0.9 -1.2 -1.2 -1.2 -1.7
CY 05-13 -62.3 -4.8 06-04 75.5 7.4 13.7 -0.5 -0.2 10.5 9.0 2.9 13.3 15.0 10.7 14.2 10.1
LV 05-09 -55.8 21.8 02-07 75.0 18.8 19.8 23.4 28.3 28.0 25.8 25.0 24.3 27.2 25.2 23.8 23.7
LT 03-09 -70.5 24.2 01-95 89.1 19.9 22.0 19.6 23.7 18.9 19.5 21.7 21.4 21.9 24.0 21.5 18.3
LU 05-93 -68.3 -27.7 11-00 24.8 -21.4 -21.1 -19.4 -20.6 -17.1 -18.1 -17.9 -19.0 -15.0 -16.5 -12.7 -6.6
HU 03-10 -22.6 3.5 12-17 43.5 27.2 33.8 43.5 35.9 38.1 33.4 36.3 36.7 39.9 36.0 36.3 31.4
MT 08-13 -30.2 3.9 05-08 58.1 31.3 13.5 27.2 17.9 28.3 19.7 24.9 15.6 30.1 22.0 29.8 13.8
NL 07-09 -22.5 22.2 03-18 77.0 53.1 55.8 60.2 62.7 52.4 77.0 64.9 75.1 62.7 65.7 62.6 59.9
AT 02-96 -59.6 -4.5 11-03 32.9 23.0 15.2 22.7 28.0 19.8 25.8 23.9 19.4 22.1 26.2 20.4 23.7
PL 03-02 -27.5 7.6 06-07 47.0 5.4 5.8 7.3 10.3 10.9 10.9 11.0 9.9 11.5 11.0 11.7 10.9
PT 08-12 -44.3 -9.8 06-90 45.8 -3.6 -5.1 -3.8 -1.1 -3.4 -1.9 -1.5 -0.6 2.1 -0.9 1.1 -1.9
RO 03-10 -8.0 42.9 11-93 97.2 17.6 17.0 20.0 23.1 20.1 20.1 15.9 15.6 12.9 12.2 15.2 12.5
SI 01-10 -44.1 -3.0 02-08 25.4 12.0 11.1 10.3 19.3 20.7 19.0 18.5 17.7 16.0 11.1 13.2 10.1
SK 02-13 -30.2 32.6 06-97 93.3 20.4 23.7 17.5 26.0 19.3 15.9 11.5 15.0 16.9 18.9 17.2 3.0
FI 04-09 -83.4 1.8 05-97 57.4 25.0 27.5 9.4 19.2 11.4 10.2 20.6 8.0 14.9 2.4 9.3 6.5
SE 06-91 -75.3 -6.2 02-11 63.7 20.7 13.1 7.6 8.0 8.3 4.5 -5.0 -7.3 -2.6 -2.1 -0.8 -3.7
UK 12-90 -56.0 14.5 01-17 44.5 38.6 28.9 32.5 21.3 32.1 38.4 31.4 32.1 33.5 26.7 24.0 38.8(a) The indicator is the arithmetic average of the balances (%) for the questions on order-books and employment expectations.
(*) Minimum, maximum and averages are calculated over the period of availibily which is not necessarily as from 01/1990.
Ave.
Page 21
21
TABLE 7: Monthly survey of financial services sector (a)
Since 04/2006 2017 2018
Min. Max.
Date Value Date Value Oct Nov Dec Jan Feb Mar Apr May Jun Jul Aug Sep
FINANCIAL SERVICES EU 01-09 -20.0 14.4 04-06 43.3 19.3 19.2 22.8 27.7 25.9 21.3 20.9 17.8 19.0 20.6 16.9 14.2
CONFIDENCE INDICATOR (b)
EA 01-09 -21.8 12.6 04-06 42.6 18.9 20.2 23.2 26.6 26.2 20.8 21.1 17.3 18.9 19.1 18.6 12.6
ASSESSMENT OF BUSINESS SITUATION EU 02-09 -31.6 11.6 04-06 38.6 16.3 18.2 20.8 26.0 26.7 18.1 16.6 17.6 15.6 19.7 13.0 15.5
OVER THE PAST 3 MONTHS (c)
EA 03-09 -30.1 10.1 04-06 39.6 16.0 20.5 22.0 26.2 28.2 15.8 19.4 16.1 14.1 18.4 16.7 13.2
EVOLUTION OF DEMAND EU 03-09 -24.9 13.1 04-06 41.6 19.1 17.9 24.0 28.2 25.8 20.2 20.1 17.6 18.7 23.0 19.4 12.2
OVER THE PAST 3 MONTHS (c)
EA 03-09 -25.3 11.5 04-06 40.3 17.2 19.3 25.5 31.4 29.2 22.9 21.2 16.4 18.7 22.5 21.1 10.1
EVOLUTION OF DEMAND EXPECTED EU 01-09 -18.2 18.4 04-06 49.5 22.5 21.5 23.6 28.8 25.1 25.6 26.0 18.4 22.8 19.3 18.2 15.0
OVER THE NEXT 3 MONTHS (c)
EA 01-09 -19.9 16.1 04-06 47.8 23.4 20.9 22.1 22.3 21.2 23.7 22.7 19.5 23.8 16.5 17.9 14.4
EVOLUTION OF EMPLOYMENT EU 02-09 -11.2 6.2 01-07 23.3 2.0 6.1 9.0 9.3 8.0 6.2 10.7 9.1 11.4 13.7 9.0 12.3
OVER THE PAST 3 MONTHS EA 03-13 -12.4 4.2 09-08 25.7 -2.9 3.2 5.4 2.5 5.9 4.3 7.3 5.4 9.5 9.1 8.5 8.1
EVOLUTION OF EMPLOYMENT EU 01-09 -11.8 8.0 04-06 30.0 8.9 2.8 5.5 9.4 13.9 9.4 11.6 11.5 9.6 15.0 13.4 16.1
EXPECTED OVER THE NEXT 3 MONTHS EA 12-12 -12.4 5.1 04-06 29.5 5.1 0.6 4.6 5.6 11.1 5.7 7.4 6.0 7.9 14.5 12.3 11.4(a) Data are not seasonally adjusted.
(b) The confidence indicator is the arithmetic average of the balances (%) for the questions on business situation and past and expected evolution of demand.
(c) Component of the confidence indicator.
Ave.
Information
The Directorate-General Financial and Economic Affairs (DG ECFIN) of the European Commission publishes the Business and Consumer Survey Results every month. The issues of January, April, July and October also include the quarterly survey results for the manufacturing industry and consumers. The April and November issues also include the investment survey results.
The data of the surveys is processed by DG ECFIN's Unit Economic situation, forecasts, business and consumer surveys (A3), Sector Business and consumer surveys and short-term forecast.
© European Union, 2018 Reproduction is authorised provided the source is acknowledged
To obtain additional information regarding these survey results you can contact DG ECFIN at the following addresses:
Mail: European Commission DG ECFIN / Unit A3 200, Rue de La Loi B-1049 Brussels
Email: [email protected]
Website: http://ec.europa.eu/economy_finance/db_indicators/surveys/index_en.htm
Upcoming releases: Flash Consumer Confidence Indicator 23 October 2018
Economic Sentiment Indicator 30 October 2018
Business Climate Indicator for the euro area 30 October 2018