31
1 SAFE ROADS TO PROSPERITY BUSINESS AND FINANCIAL PLAN 2018-2023 2018/19- 2022/23 Roads Authority The Chief Executive Officer Roads Authority Private Bag 12030 Ausspannplatz Windhoek

1
SAFE ROADS TO PROSPERITY
BUSINESS AND FINANCIAL PLAN 2018-2023
2018/19- 2022/23
Roads Authority
The Chief Executive Officer
Roads Authority
Private Bag 12030
Ausspannplatz
Windhoek

2
TABLE OF CONTENTS
1 BUSINESS PLAN .......................................................................................................... 4
EXECUTIVE SUMMARY ..................................................................................................... 4
1.1 CORPORATE VISION ............................................................................................ 4
1.2 MISSION STATEMENT .......................................................................................... 4
1.3 BRAND PROMISE ................................................................................................. 4
1.4. CORE VALUES ...................................................................................................... 4
1.5 THE GOVERNANCE AND MANAGEMENT STRUCTURE .................................... 5
1.6 STRATEGIC PLAN 2018/19 – 2022/23 .................................................................. 6
1.7 STRATEGIC FOCUS ............................................................................................. 6
2 FINANCIAL PLAN ......................................................................................................... 8
2.1 INTRODUCTION .................................................................................................... 8
2.2 ANALYSIS OF THE BUDGET ................................................................................ 8
2.3 THE BUDGET FOR FY 2018/19 COMPARED TO FY 2017/18 ........................... 10
2.4 DISTRIBUTION OF THE 2018/19 OPERATIONS BUDGET ................................ 10
2.5 SOURCES OF FUNDS FOR THE BUDGET ........................................................ 11
2.6 THE BUDGET IN PERSPECTIVE ........................................................................ 12
3 FY 2018/19 OPERATIONS BUDGET ......................................................................... 17
4 FY 2018/19 ADMINISTRATION BUDGET .................................................................. 23
5 CONSOLIDATED BUDGET TABLES ......................................................................... 24
6 APPROVAL OF THE BUDGET SUBMISSION BY THE BOARD OF DIRECTORS .... 29
7 APPROVAL OF THE RA 2018/19 BUDGET BY RFA ................................................. 30
3
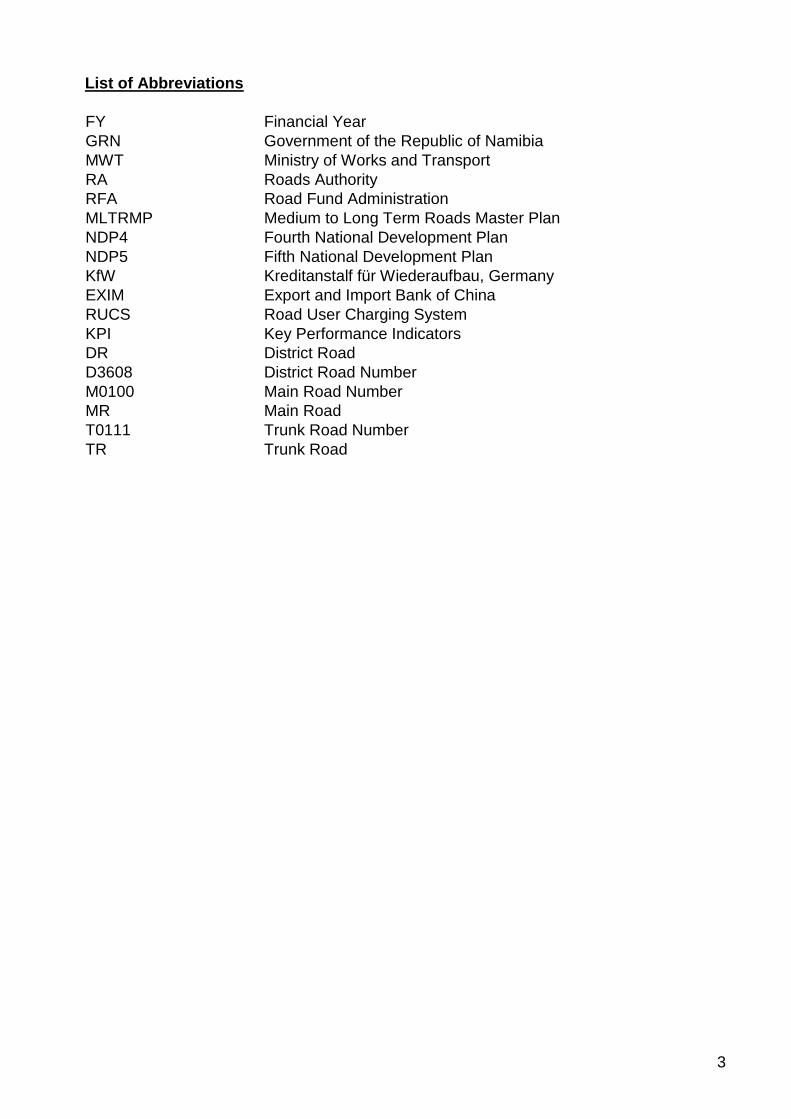
List of Abbreviations
FY Financial Year
GRN Government of the Republic of Namibia
MWT Ministry of Works and Transport
RA Roads Authority
RFA Road Fund Administration
MLTRMP Medium to Long Term Roads Master Plan
NDP4 Fourth National Development Plan
NDP5 Fifth National Development Plan
KfW Kreditanstalf für Wiederaufbau, Germany
EXIM Export and Import Bank of China
RUCS Road User Charging System
KPI Key Performance Indicators
DR District Road
D3608 District Road Number
M0100 Main Road Number
MR Main Road
T0111 Trunk Road Number
TR Trunk Road

4
1 BUSINESS PLAN
EXECUTIVE SUMMARY
The Roads Authority was established as a juristic person according to the Roads Authority
Act (Act 17 of 1999), with the statutory objective: "To manage the national road network of
Namibia and to provide for matters incidental thereto."
The management of the proclaimed road network includes planning, designing, construction
and maintenance. It also includes quality control of materials and supervision of work
contracted out and the operation of the Road Management System (RMS). In addition to its
core functions, the RA also provides transport and traffic related services to vehicle owners,
operators and drivers and overload control as assigned functions from the Minister of Works
and Transport. The latter is also mandated with the collection of certain road user charges
that include Vehicle Registration and Licensing Fees on behalf of the Road Fund
Administration (RFA) as legislated in the RFA Act ,1999(Act 18 of 1999).
The RA manages a road network of approximately 48, 327.53 kilometres, comprising
bitumen standard, gravel, earth tracks, earth graded and salt roads.
1.1 CORPORATE VISION
A sustainable road sector which is ahead of national and regional socio-economic needs in
pursuit of Namibia’s Vision 2030.
1.2 MISSION STATEMENT
To manage the national road network to achieve a safe and efficient road sector in support
of socio-economic growth.
1.3 BRAND PROMISE “Safe Roads to Prosperity”.
1.4. CORE VALUES
The Roads Authority defined five (5) core values illustrated by the acronym ROADS:
Value Definition
(ROADS )
Respect We believe that there is strength in diverse teams. Therefore, we respect people
from all walks of life
Open
Communication
We believe that people that connect and share information freely are enabled to
align towards achieving shared goals. Therefore, we commit to share relevant
information in an open and transparent manner.
Accountability We are uncompromisingly committed to good governance and therefore shall
expect employees, at all levels of the organisation, to uphold ethical principles and
shall be held accountable for their decisions and actions.
Dedication We are committed to work together as a team in our quest to deliver on our
mandate, irrespective of the many obstacles we might face. We will always support
one another and never give up.
Service Excellence We are in pursuit of excellence in everything we do. Therefore, we are always
seeking new innovative solutions in providing quality service to our stakeholders.
5
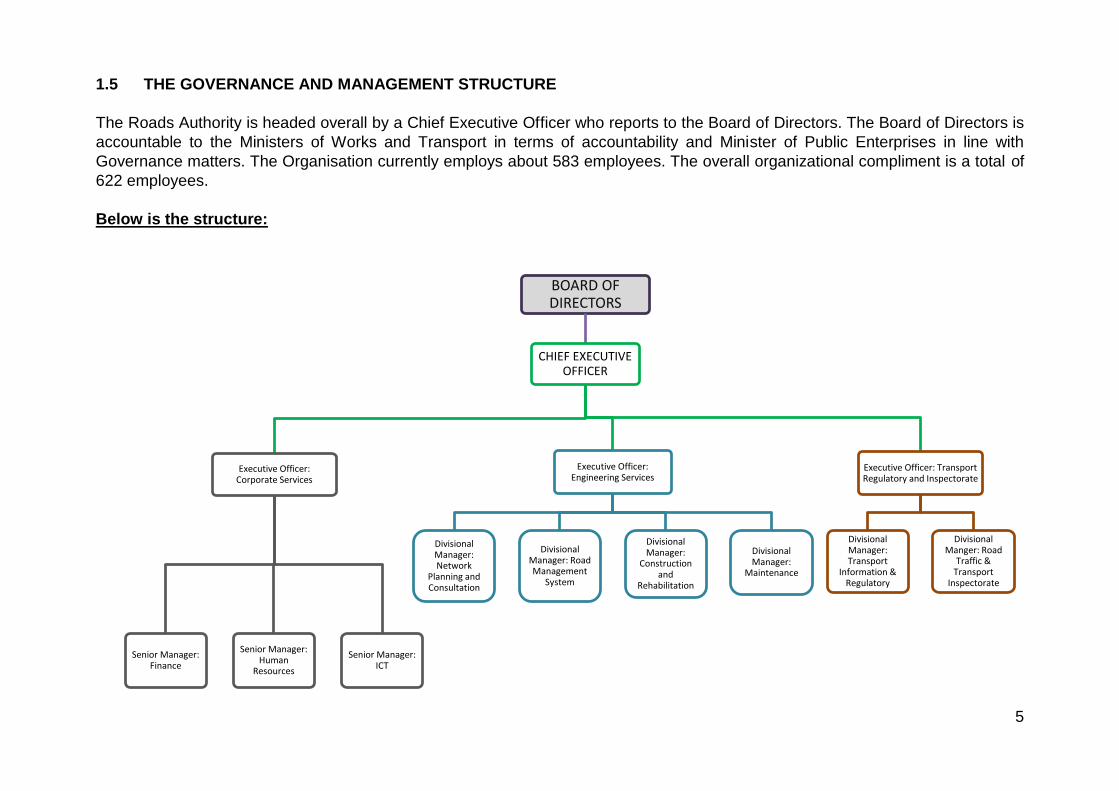
1.5 THE GOVERNANCE AND MANAGEMENT STRUCTURE
The Roads Authority is headed overall by a Chief Executive Officer who reports to the Board of Directors. The Board of Directors is
accountable to the Ministers of Works and Transport in terms of accountability and Minister of Public Enterprises in line with
Governance matters. The Organisation currently employs about 583 employees. The overall organizational compliment is a total of
622 employees.
Below is the structure:
BOARD OF DIRECTORS
CHIEF EXECUTIVE OFFICER
Executive Officer: Corporate Services
Senior Manager: Finance
Senior Manager: Human
Resources
Senior Manager: ICT
Executive Officer: Engineering Services
Divisional Manager: Network
Planning and Consultation
Divisional Manager: Road Management
System
Divisional Manager:
Construction and
Rehabilitation
Divisional Manager:
Maintenance
Executive Officer: Transport Regulatory and Inspectorate
Divisional Manager: Transport
Information & Regulatory
Divisional Manger: Road
Traffic & Transport
Inspectorate

6
1.6 STRATEGIC PLAN 2018/19 – 2022/23
The RA engaged a participatory strategic planning process during the first quarter of
2018/19 to define its five (5) year Strategic Plan for the period 2018/19 – 2022/23
which is aligned to its mandate and also to the Republic of Namibia’s strategic
imperatives as defined in Vision 2030, the Fifth National Development Plan (NDP5),
the Harambee Prosperity Plan 2016/17 – 2019/20, the United Nations’ Seventeen
Sustainable Development Goals and the Africa Agenda 2063.
1.7 STRATEGIC FOCUS
The RA eight strategic objectives are;
Ensure stakeholder satisfaction
Avail and preserve National Road network
Manage Traffic and Transport Operation
Enhance Capacity Building
Optimise information communication technology
Inculcate ethical, performance driven culture
Ensure organisational sustainability
The strategic targets, relevant to its mandate, for the next five years, aligned to the
national strategic imperatives are:
• To upgrade 800 km of road to bitumen standards;
• To construct 250 km of road to gravel standards;
• To rehabilitate 279 km of road;
• To reseal (preservation) 1,800 km of road;
• To re-gravel (preservation) 6,500 km of road;
• To rehabilitate 9 bridges;
• To contain the percentage of surfaced roads that are in an unacceptable
condition at 10%;
• To contain the percentage of gravel roads that are in an unacceptable condition
at 40%;
• To ensure that 99.30% of heavy vehicles are within the weight tolerance level
• To improve NaTIS service delivery to 85% customer satisfaction.

7
Summary of the Strategic Matrix is reflected below:
S1.1 Develop and Implement Annual Stakeholder Engagement Plan 500 000.00 550 000.00 605 000.00 665 500.00 732 050.00 Stakeholder Participation
S1.2 Conduct annual stakeholder Satisfaction Survey every two years 50 000.00 300 000.00 50 000.00 400 000.00 50 000.00Stakeholder participation and
Budget constraints
S1.3 Implement the CSR Policy 200 000.00 200 000.00 220 000.00 242 000.00 266 200.00 Budget constraints
S1.4Implement Office Accommodation Program 35 550 000.00 20 900 000.00 2 990 000.00 6 320 000.00 30 000 000.00 Budget constraints
% Adherence to MTLTRMP 5 60% 60% 65% 70% 75% 80% I1.1 Execute Projects as per Road Upgrading Programme 243 742 000.00 166 885 000.00 163 386 000.00 400 000 000.00 400 000 000.00Availability of Resources and
National Support.
Km road upgraded to bitumen standard 5 368 200 200 100 100 200 I1.2 Execute Projects as per Program and Harambee Plan 851 258 000.00 1 353 693 000.00 1 450 673 182.00 1 115 872 763.00 1 115 872 763.00Lack of experienced Enginers to
execute projects
Km road constructed to gravel standards 5 177 25 25 50 50 50 I1.3 Execute Projects as per Gravel Construction Programme 245 170 000.00 263 314 000.00 99 146 000.00 250 000 000.00 237 093 250.00Economic downturn. Availability of
resources.
Km road rehabilitation 5 0 10 45 79 80 65 I1.4 Execute Projects as per Rehabilitation Program 220 450 000.00 292 559 000.00 351 754 000.00 206 477 000.00 206 477 000.00Funds, inadequate funding and
procurement process delays
Km road preservation (reseal) 5 688 600 600 0 300 300 I1.5 Execute Projects as per Preservation / Reseal Program 393 660 443.00 389 330 334.00 337 325 552.00 354 191 829.00 354 191 829.00
Insufficient funds and alignment of
funds as per master plan
requirements.
Km road preservation (re-gravelling) 5 522 500 1200 1400 1600 1800 I1.6 Execute Projects as per Re-Gravelling Program 132 475 919.00 299 135 835.00 392 092 626.00 411 697 257.00 411 697 257.00Insufficient funds to impelemt
projects as planned
Number of bridges rehabilitated 5 3 0 1 2 3 3 I1.7 Execute Projects as per Bridge- Rehabilitation and Construction Programme 17 822 000.00 75 000 000.00 75 000 000.00 75 000 000.00 75 000 000.00Insufficient funds to impelemt
projects as planned
Number of road safety initiatives initiated 5 3 2 3 3 3 3 I1.8Collaborate with relevany BU's to implement Road Safety Initiatives (Road Safety Audits, Road Signs, Road
Markings, Traffic Calming Flashers, grass mowing, bush clearing, sand removal, )685 886 243.00 682 374 915.00 711 039 147.00 715 980 945.00 715 980 945.00
Interdependence and successful
collaboration
% Surfaced roads in unacceptable
condition5 7% 10% 10% 10% 10% 10% I1.9 Measure Condition of Road Network (Plan) - Surfaced Roads
Insufficient funds to impelemt
projects as planned
% Gravel roads in unacceptable
condition5 46% 40% 40% 40% 40% 40% I1.10 Measure Condition of Road Network (Plan) - Gravel Roads
Insufficient funds to impelemt
projects as planned
I2.1 Collaborate with RFA and MoW&T on usage on non-road user charges to fund construction of new testing centres. 30 000 000.00 33 000 000.00 36 300 000.00 39 930 000.00 43 923 000.00Funds required are higher than what
is currently provided by GRN
I2.2 Avail Testing Centre Infrastructure for Windhoek according to Project Plan. 26 000 000.00 25 000 000.00 25 000 000.00 25 000 000.00 25 000 000.00 Delays in Project Execution
I2.3 Collaboarate with MWT on execution of reports of Vehicle and Driver Testing Centre Inspectorate 50 000.00 55 000.00 60 500.00 66 550.00 73 205.00 Lack of funds to execute findings
I2.4 Collaboarate with MWT on finalising Bill for Public Passenger Transport 30 000.00 33 000.00 36 300.00 39 930.00 43 923.00 Delays in Project Execution
% Customer Satisfaction 2 54% 60% 70% 75% 80% 85% I2.5 Collaborate with Human Resources to arrange Customer Service Training for all Staff. 100 000.00 100 000.00 100 000.00 100 000.00 100 000.00
Dependent on Human Resources to
arrange according to available
budget.
I2.6 Maximise Weighbridge and Road Safety operations 10 000 000.00 11 000 000.00 12 100 000.00 13 310 000.00 14 641 000.00 Shortage of staff and funds
I2.7 Fully Implement Overload Control Strategies; Construct Weighbridges 0.00 15 000 000.00 63 333 333.00 63 000 000.00 63 000 000.00Staff shortage, completion of
constructions
I2.8 Conduct Road Network Planning, feasibility studies, Strategic studies, Road Safety and Quality Audits, 27 000 000.00 47 500 000.00 49 500 000.00 54 000 000.00 54 000 000.00 Recommendations to be funded.
C1.1 Enhance the Engineering Graduate Development Programme 200 000.00 220 000.00 242 000.00 266 200.00 292 820.00 Reward and incentives
C1.2 Develop and implement Succession Planning Programme 50 000.00 0.00 0.00 0.00 0.00 Reward and incentives
C1.3 Develop and implement contract and project management training initiatives. 350 000.00 385 000.00 423 500.00 465 850.00 512 435.00 Reward and incentives
C1.4 Train all staff on policies and procedures 7 000 000.00 7 000 000.00 7 000 000.00 7 000 000.00 7 000 000.00
C1.5 Develop knowledge management strategy. 100 000.00 110 000.00 121 000.00 133 100.00 146 410.00 Reward and incentives
C1.6 Implement Business Process Reengineering Project 500 000.00 550 000.00 605 000.00 665 500.00 732 050.00
C2.1 Implement ICT Governance Framework 3 999 834.00 4 150 000.00 4 370 000.00 4 460 000.00 4 700 000.00 Funds and skills availability
C2.2 Ensure ICT continuity mechanisms 7 497 000.00 8 275 115.00 8 100 000.00 8 300 000.00 8 300 000.00 Funds and skills availability
C2.3 Ensure Cybersecurity systems / solutions are in place 6 594 366.00 6 800 000.00 7 000 000.00 7 200 000.00 7 500 000.00 Funds and skills availability
C3.1 Review the Code of Conduct and Ethics Policy; Conflict of Interest Policy 150 000.00 0.00 0.00 0.00 0.00 Approvals.
C3.2 Develop Fraud and Corruption Response Plan and Policy 100 000.00 100 000.00 100 000.00 100 000.00 100 000.00 Funds and skills availability
% Employee Satisfaction 5 54% 60% N/A 65% N/A 70% C3.3 Develop Change Management Policy and Initiatives; Facilitate Employee Satisfaction Survey every second year 100 000.00 110 000.00 121 000.00 133 100.00 146 410.00Internal Leadership capacity and
resistance to change
% Staff Achieving Performance Targets 5 80% 90% 90% 90% 90% 90% C3.4 Continue Implementing Performance Management System (including Reward and Recognition Policy) 5 000 000.00 5 000 000.00 5 000 000.00 5 000 000.00 5 000 000.00 Commitment at all levels.
F1.1 Initiate the review of Funding Model for Road Network, NaTIS Services in collaboration with MOF,MWT,MME & RFA. 56 184 352.00 65 670 282.00 64 904 915.00 37 210 941.00 34 503 168.00
Availability of Target Audiences and
Support; Buy-in from the relevant
Political office bearers.
F1.2 Collaborate with MoW&T to finalize the decriminalization of the Overload Fines 0.00 0.00 0.00 0.00 0.00 Approval of legislation
F1.2Budget (administration ) allocation based on zerobased method, priorities and collectively supported internally -
MTEF, Harambee Prosperity Plan, MTLTRMP, NDP 5, RFA & RA Business Plans303 198 843.00 345 138 386.00 384 995 816.00 320 455 400.00 0.00
Dedication and Effectiveness of
team
F1.3 Ensure compliance with Financial Reporting Standards in order to receive unqualified Audit Opinion 400 000.00 440 000.00 484 000.00 532 400.00 585 640.00Full cooperation of all internal and
external roleplayers
7 Strategic Objectives 21 Measures 10039 Strategic Initiatives 3 337 369 000.00 4 163 840 367.00 4 295 536 521.00 4 169 709 680.00 3 867 704 112.00
19 834 159 680.00
ROADS AUTHORITY STRATEGIC SCORECARD 2018/19 - 2022/23ROADS AUTHORITY
TARGETS
# Objectives: KRA Measurements: PI Weight
FINANCIAL RESOURCE REQUIREMENTS
2018.19 2019.2 2020.21 2021.22
99.3% 99.30 99.30 99.30 99.30 99.30
26 000 000.00 43 961 500.00 41 357 650.00 45 493 415.00 50 042 757.00
55% 60% 70% 75%
Assumptions / RisksInitiatives/ ProgramsBaseline
2017/182018/19 2022/23 #2019/20 2020/21 2021/22 2022.23
80% 90%
% Heavy Vehicles within Weight
Tolerance5
Ro
ad N
etw
ork
Man
agem
ent
I1 Avail and Preserve National Road Network
Inculcate Ethical, Performamce Driven Culture
Fin
anci
al C
apac
ity
Org
anis
atio
nal
Cap
acit
y
C3
Enhance Capacity Building
% Stakeholder Satisfaction
Sta
keh
old
er S
atis
fact
ion
S1 Ensure Stakeholder Satisfaction
% Compliance to ICT Governance
Framework
C1
% Effective utilisation of the budget
(variance)
F1
C2 Optimise Information Communication Technology
Manage Traffic and Transport OperationsI2
5 75% N/A 80% N/A 85% N/A
Ensure Organisational Financial Sustainability
Audit Improvement Notices Closed Out
(Policies, procedures and ethics)5
% Achievement on Annual Human
Capital Development Plan5
75% 80% 85% 90%
70% 75% 80% 85% 90% 95%
OPEX:
CAPEX: O: 5%; C: O: 5%; C: O: 5%; C: O: 5%; C: O: 5%; C:
% Compliance to Vehicle and Driver
Testing Centres Standards4 New 5% 10% 15% 20% 25%
Additional Funding Secured (% of
current budget)5 New 2% 2% 2% 2% 2%
60% 70%
4
5

8
2 FINANCIAL PLAN
2.1 INTRODUCTION
The Roads Authority Act (Act 17 of 1999) assigns the RA with the responsibility of managing
the national road network with a view of attaining a safe and efficient roads sub-sector in
Namibia. The mandate requires sufficient financial resources for undertaking the various
activities needed for the development and preservation of the road network including
preparing master plans and feasibility studies, operating road management systems,
implementing road construction and rehabilitation projects, carrying out routine and periodic
maintenance of all paved and unpaved roads. The Authority must also control the movement
of heavy vehicles for preventing the damage of roads and bridges due to excessive loads
and manage the Namibia traffic information system as assigned by the Ministry of Works
and Transports.
This five-year Roads Authority Budget covering the financial years 2018/19 to 2022/23 is
presented to the Road Fund Administration (RFA) in accordance with subsections 20(1) and
20(2) of the Road Fund Administration Act, 1999 (Act 18 of 1999). The budget has been
approved by the Board of Directors of the Roads Authority and the Board of Directors of the
Road Fund Administration (see Appendix A) in terms of the provision of the Roads Authority
Act, Act 17 of 1999 and by Government through the Ministry of Finance.
The preparation of the budget was guided by the following key planning documents: The
Roads Authority Strategic Plan 2015/16 – 2017/18 and the Medium to Long Term Road
Master Plan (MLTRMP) (2012 revision). In line with the MLTRMP and the National
Development Plan (NDP4), the Strategic Plan defines targets to be achieved against the
Authority’s Key Performance Indicators (KPIs) as set by the Ministry of Works and Transport.
The preparation of the budget was further guided by the amount of funding that the RFA
could allocate to the Authority (See annexe 1) together with resources anticipated from
Government and our development partners. The amount of funding allocated for the
administration and operations of the Authority will impact on the achievements against most
of the indicators of the Strategic Plan.
2.2 ANALYSIS OF THE BUDGET
The Current Budget Cycle 2018/19 to 2022/23
The five-year budget of the Roads Authority is a rolling budget reviewed and updated
annually. Budget commitment and approval is limited to the current financial year 2018/19
while budgets for the ensuing financial years are indicative pending future review and
approval. Table 1 presents the five-year budget cycle for financial years 2018/19 to 2022/23
and the total for the 5 years. Table 2 and Figure 1 compare the total budget per financial
year in the current budget cycle to the previous cycle which covered the financial years
2017/18 to 2021/22. The comparison shows that the 2018/19 budget is at 83% of the amount
that was anticipated in the previous cycle. For the ensuing years, the 2019/20 is at the same

9
level as anticipated while the projected budget for 2020/21 exceeds the amount planned in
the previous cycle. The 2021/22 budget is lower than anticipated in the previous cycle. The
five-year total for the current cycle is N$19,834 million comparable to the N$15,809 of the
previous cycle (126%).
Table 1: Current Five-Year Budget Cycle
CURRENT BUDGET CYCLE
N$ Million 2017/18 2018/19 2019/20 2020/21 2021/22 2022/23
Total 5
years
Operations Budget 2,269 2,809 3,635 3,746 3,583 3,240 17,012
Maintenance 1,236 1,212 1,571 1,441 1,482 1,482 7,187
Construction and
Rehabilitation
929 1,490 1,909 2,153 1,939 1,587 9,078
Network planning and
Consultation
25 27 50 50 54 54 235
Road Management
Systems
25 26 44 41 45 50 206
Transport Information
and Agents
50 44 49 50 53 56 252
Road Transport
Inspection Services
4 10 12 11 10 11 54
Administration Budget 412 528 529 550 587 628 2,822
Total Budget 2,681 3,337 4,164 4,296 4,170 3,868 19,834
Table 2: Current Budget Cycle 2018/19-22/23 Compared to Previous Cycle 2017/18-21/22
N$ million 2017/18 2018/19 2019/20 2020/21 2021/22 2022/23 Total
Previous Budget cycle
2017/18 - 2021/22 2,681 4,033 3,704 2,645 2,746 -
15,809
Current Budget cycle
2018/19 - 2022/23 - 3,337 4,164 4,296 4,170 3,868
19,834
Figure 1: Current Budget Cycle compared to Previous Budget Cycle
0
2000
4000
6000
2017/18 2018/19 2019/20 2020/21 2021/22
2681
4033 37042645 2746
33374164 4296 4170 3868
N$
MIl
lion
Financial Year
Previous Budget Cycle Versus Current Budget Cycle
Previuos Cycle 2017/18-2021/22 Current Cycle: 2018/19-2022/23 _

10
2.3 THE BUDGET FOR FY 2018/19 COMPARED TO FY 2017/18
Table 3 compares the current financial year budget to the budget of the just completed
2017/18 financial year. The analysis considers the two main budgetary allocations: the
operations budget and the administration budget. The operations budget provides for
expenditure on activities performed for the management of the road network and assigned
functions. The administration budget covers for the functioning of the Authority as an
organisation and as such, the budget amount is not directly related to the scope of work
performed for the management of the road network and assigned functions.
The comparison shows an improvement with a budget increase of 25% compared to the
previous total budget. Significant improvements in the operation budget are for the
Construction and Rehabilitation (61%) and for Road Transport and Inspection Services
(144%).
Table 3: Budget for FY 2018/19 Compared to FY 2017/18.
(N$) 2017/18 2018/19 Change in %
Operations Budget 2,269,212,000 2,809,217,605 24%
Maintenance 1,236,434,000 1,212,022,605 -2%
Construction and Rehabilitation 928,622,000 1,490,442,000 61%
Network planning and Consultation 24,500,000 27,000,000 10%
Road Management Systems 25,200,000 26,000,000 3%
Transport Information and Agents 50,356,000 43,753,000 -13%
Road Transport Inspection Services 4,100,000 10,000,000 144%
Administration Budget 412,000,000 528,151,395 28%
Office Accommodation 11,000,000 35,550,000 223%
Post-Retirement Medical Aid 17,843,000 34,843,000 95%
RA ICT Infrastructure 13,287,851 18,091,000 36%
Administration 369,869,149 439,667,195 19%
Total Budget 2,681,212,000 3,337,369,000 25%
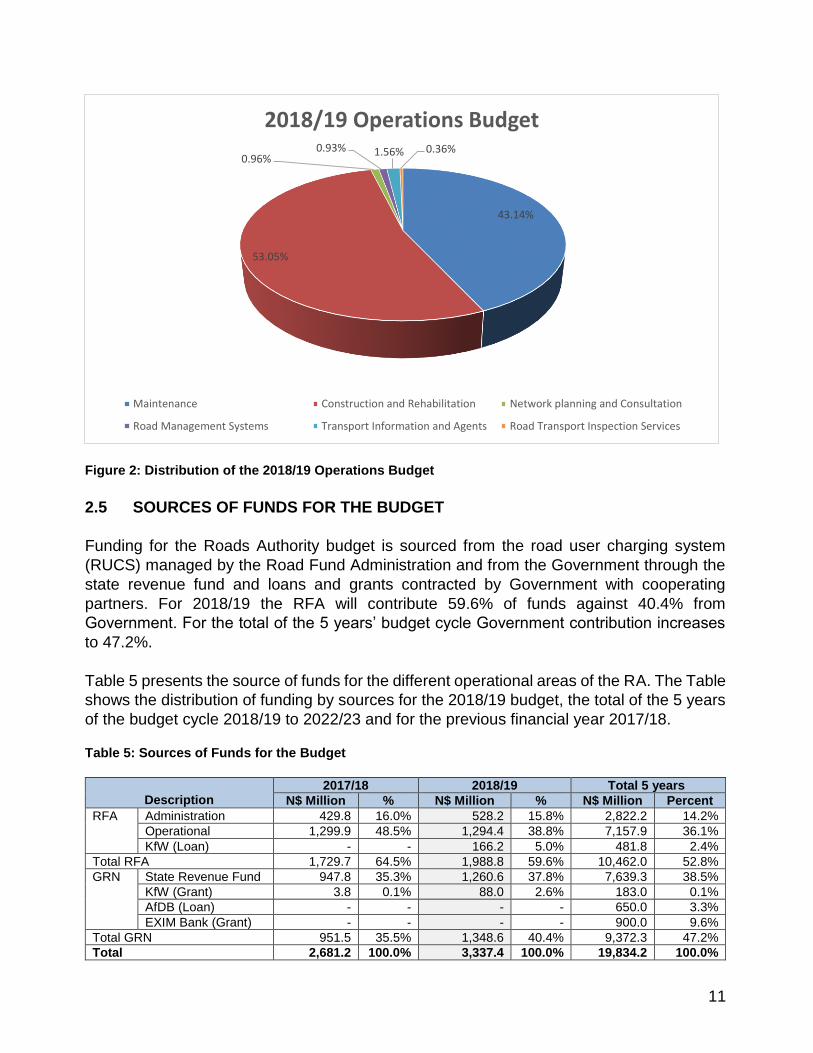
2.4 DISTRIBUTION OF THE 2018/19 OPERATIONS BUDGET
Table 4 and Figure 2 present the distribution of the 2018/19 operations budget to the six
operations areas in terms of the management of the road network and implementation of
assigned functions. The allocation for Maintenance absorbs 43.14% of the operations
budget while Construction and Rehabilitation is allocated 53.05% of the budget. These two
largest recipients represent together 96.19% of the RA operations budget. The remaining is
shared by Network Planning and Consultation: 0.96%, Road Management Systems: 0.93%,
Transport Information and Agents: 1.56% and Road Transport Inspection Services: 0.36%.
Table 4: Distribution of the 2018/19 Operations Budget
(N$) 2018/19 %
Maintenance 1,212,022,605 43.14%
Construction and Rehabilitation 1,490,442,000 53.05%
Network planning and Consultation 27,000,000 0.96%
Road Management Systems 26,000,000 0.93%
Transport Information and Agents 43,753,000 1.56%
Road Transport Inspection Services 10,000,000 0.36%
Total 2,809,217,605 100.00%
11
Figure 2: Distribution of the 2018/19 Operations Budget
2.5 SOURCES OF FUNDS FOR THE BUDGET
Funding for the Roads Authority budget is sourced from the road user charging system
(RUCS) managed by the Road Fund Administration and from the Government through the
state revenue fund and loans and grants contracted by Government with cooperating
partners. For 2018/19 the RFA will contribute 59.6% of funds against 40.4% from
Government. For the total of the 5 years’ budget cycle Government contribution increases
to 47.2%.
Table 5 presents the source of funds for the different operational areas of the RA. The Table
shows the distribution of funding by sources for the 2018/19 budget, the total of the 5 years
of the budget cycle 2018/19 to 2022/23 and for the previous financial year 2017/18.
Table 5: Sources of Funds for the Budget
Description
2017/18 2018/19 Total 5 years
N$ Million % N$ Million % N$ Million Percent
RFA Administration 429.8 16.0% 528.2 15.8% 2,822.2 14.2%
Operational 1,299.9 48.5% 1,294.4 38.8% 7,157.9 36.1%
KfW (Loan) - - 166.2 5.0% 481.8 2.4%
Total RFA 1,729.7 64.5% 1,988.8 59.6% 10,462.0 52.8%
GRN State Revenue Fund 947.8 35.3% 1,260.6 37.8% 7,639.3 38.5%
KfW (Grant) 3.8 0.1% 88.0 2.6% 183.0 0.1%
AfDB (Loan) - - - - 650.0 3.3%
EXIM Bank (Grant) - - - - 900.0 9.6%
Total GRN 951.5 35.5% 1,348.6 40.4% 9,372.3 47.2%
Total 2,681.2 100.0% 3,337.4 100.0% 19,834.2 100.0%
43.14%
53.05%
0.96%0.93% 1.56% 0.36%
2018/19 Operations Budget
Maintenance Construction and Rehabilitation Network planning and Consultation
Road Management Systems Transport Information and Agents Road Transport Inspection Services

12
Table 6: Sources of Funds by Operational Areas
Description
RFA GRN Total
N$ Percent N$ Percent
Maintenance:
Unpaved Roads 508,858,605 93.3% 35,582,000 6.7% 544,440,605
Maintenance: Paved
Roads 538,158,000 100% 0 0% 538,158,000
Maintenance:
Miscellaneous 129,424,000 100% 0 0% 129,424,000
Harambee projects 0 0% 851,258,000 100% 851,258,000
Rehabilitation: Paved
Roads 166,152,000 75% 54,298,000 25% 220,450,000
Rehabilitation: Bridges 17,000,000 95% 822,000 5% 17,822,000
Development: Paved
Roads 0 0% 243,742,000 100% 243,742,000
Development: Gravel
Roads 0 0% 2,000,000 100% 2,000,000
Labour Based: Gravel
Roads 0 0% 155,170,000 100% 155,170,000
Planning 27,000,000 100% 0 0% 27,000,000
Road Management
Systems 26,000,000 100% 0 0% 26,000,000
TI&RS 38,000,000 87% 5,753,000 13% 43,753,000
RTTI 10,000,000 100% 0 0% 10,000,000
Administration 528,151,395 100% 0 0% 528,151,395
Total 3,337,369,000.00
Table 6 shows that Government contribution concentrates on road development projects
being: (i) the construction of highways; (ii) the upgrading of gravel roads to paved standard;
and (iii) the construction of new gravel roads. The RFA is essentially funding road
preservation: (i) road maintenance; and (ii) road rehabilitation in addition to other road
network management activities.
2.6 THE BUDGET IN PERSPECTIVE
The Budget and the MLTRMP Targets
The Medium to Long Term Roads Master Plan (MLTRMP) of 2012 defines funding targets
for the management of the road network for the period 2016 – 2030 which can be used to
benchmark the current budget. The assessment presented in
Table 7 indicates the following:
The 2018/19 budget allocation for road maintenance activities including routine,
reseal and gravelling is at N$1,212 million against N$1,362 million recommended by
the MLTRMP.
The budget is at 89% of the target and does not include any allocation for the
maintenance of bridges despite the recommended MLTRMP minimum of N$10
million.

13
The budget allocation for the rehabilitation of paved roads is at N$520.1 million
against the Master Plan target of N$398 million which is a 130.7% achievement. In
the evaluation, the Windhoek – Okahandja project is included as it covers the
rehabilitation of the existing road and upgrading to dual carriageway standard.
With regard to the rehabilitation of bridges, the budget allocated for 2018/19 is at
111% of the MLTRMP target with N$17.8 million against N$ 16 million required by
the Master Plan.
The 2018/19 budget allocation for the upgrading to paved roads standards excluding
the Windhoek-Okahandja road is N$902.1 million against N$138 million
recommended by the MLTRMP. The budget largely exceeds the target of the Master
Plan (654%) and this is mostly due to the implementation of the large projects under
the Harambee Prosperity Plan.
The 2018/19 budget allocation for the construction of new gravel roads is N$157.2
million at 157% of the MLTRMP target of N$100 million.
Overall, the 2018/19 operations budget exceeds by 39.5% the MLTRMP target. In this
comparison there is need to underline that the MLTRMP targets date from 2012 and have
not yet been updated to reflect changes in the road network and the cost of undertaking
preservation and development works. It may be anticipated in particular that the significant
road development programmes of upgrading gravel roads to bitumen standard that have
been implemented in recent years will impact on the needs for preservation and therefore
on target budgets for maintenance.
Table 7: Benchmarking the 2018/19 Budget to the MLTRMP
MLTRMP Target 2018/19 Budget Achievement
Routine maintenance 595,000,000
Reseal 398,000,000
Gravelling / Re-gravelling 369,000,000
Total routine and periodic maintenance 1,362,000,000 1,212,022,605 89%
Rehabilitation of roads 398,000,000 220,450,000 55%
Rehabilitation of bridges 16,000,000 17,822,000 111%
Total for Rehabilitation Program 414,000,000 238,272,000 57%
Upgrading 138,000,000 1,201,753,000 871%
New gravel roads construction 100,000,000 157,170,000 157%
Total for Upgrading Program 238,000,000 1,358,923,000 571%
Total 2,014,000,000 2,809,217,605 140%
Preservation Versus Development
Table 8 compares the 2018/19 budget to the MLTRMP targets in terms of road preservation
and road development. The comparison shows that the budget for development is
N$1,358.9 million against N$1,450.3 million for preservation. The percentage for
development is bound to increase when all the Harambee projects come on stream,
specifically those financed by our cooperating partners. While the master plan aims at 88%
of the resources towards preservation, the budget achieves 51.6%.

14
Table 8: Preservation vs. Development in the 2018/19 Budget
Description MLTRMP Target 2018/19 Budget
Amount (N$) Percentage Amount (N$) Percentage
Preservation (maintenance &
rehabilitation) 1,776,000,000 88% 1,450,294,605 51.6%
Development (upgrading & new
construction) 238,000,000 12% 1,358,923,000 48.4%
Total 2,014,000,000 100% 2,809,217,605 100%
The Budget and the Strategic Plan Indicators and Targets
Key Performance Indicators and Targets
The Roads Authority’s Strategic Plan includes key performance indicators and targets that
the Authority must achieve. The amount of funding has a direct impact on some of the key
performance indicators adopted in the strategic plan. Table 9 indicates those indicators and
the targets assigned by the Strategic Plan.
Table 9: RA Strategic Plan Key Performance Indicators and Targets
Key Performance Indicator (KPI) Baseline 2017/18 Target 2018/19
Km road upgraded to bitumen standard 368 200
Km road constructed to gravel standards 177 25
Km road rehabilitation 0 10
Km road preservation (reseal) 688 600
Km road preservation (re-gravelling) 522 300
Number of bridges rehabilitated 3 0
Number of road safety initiatives initiated 3 2
% Surfaced roads in unacceptable condition 7% 10%
% Gravel roads in unacceptable condition 46% 40%
% achievement on overload control strategies 99.3% 99.30
Estimated Impact of the 2018/19 Budget
The above indicators are measurable physical achievements which will be evaluated at the
end of the financial year. For estimating the impact of the 2018/19 budget allocations,
reference is made to the achievements of the previous financial year 2017/18. Comparing
the respective budgets provides an assessment of the likely impact on the achievement of
the Strategic Plan target for 2018/19.
It is understood that besides the budget, the annual physical output can be influenced by
other factors such as the intensity and period of rainfall, the tendering process and response
of the contractors and the actual performance of contractors and suppliers of the
construction industry on awarded contracts. Furthermore, the timeframe for implementation
of road projects generally exceeds one year. Therefore, achievements of the year depend
to a certain extent on the achievements of the previous years.

15
Table 10 presents the results of the assessment for the key performance indicators by
identifying the associated budget items and comparing budget amounts for 2017/18 and
2018/19 and achievements reported for 2017/18.

16
Table 10: Estimated Achievements Based on 2018/19 Budget
KPI Representative budget
item
2017/18 budget 2018/19 budget Achievement
2017/18
Target
2018/19
Anticipated
for 2018/19
Km road upgraded to
bitumen standard
Development: Paved Roads
+ Harambee projects
852,500,000 1,201,753,000 368 200 Above target
Km road constructed to
gravel standards
Development: Gravel Roads
+ labour based
66,622,000 157,170,000 177 25 Above target
Km road rehabilitation Rehabilitation: Paved Roads - 220,450,000 0 10 Above target
Km road preservation
(reseal)
Pavement rehabilitation /
Reseal / Improvements +
reseal supervision
327,120,000 614,110,443 688 600 On target
Km road preservation (re-
gravelling)
Gravelling 222,122,907 132,475,919 522 500 Below target
Number of bridges
rehabilitated
Rehabilitation: Bridges 9,500,000 17,822,000 3 0 Below target
Number of road safety
initiatives initiated
Measures for Road Safety
Improvement
1,000,000 5,500,000 3 2 On target
% Surfaced roads in
unacceptable condition
Maintenance: Paved Roads 434,820,000 538,158,000 7% 10% Below target
% Gravel roads in
unacceptable condition
Maintenance: Unpaved
Roads
660,202,000 544,440,605 46% 40% Below target
% achievement on overload
control strategies
RTTI allocation 4,100,000 10,000,000 99.3% 99.30 On target
17
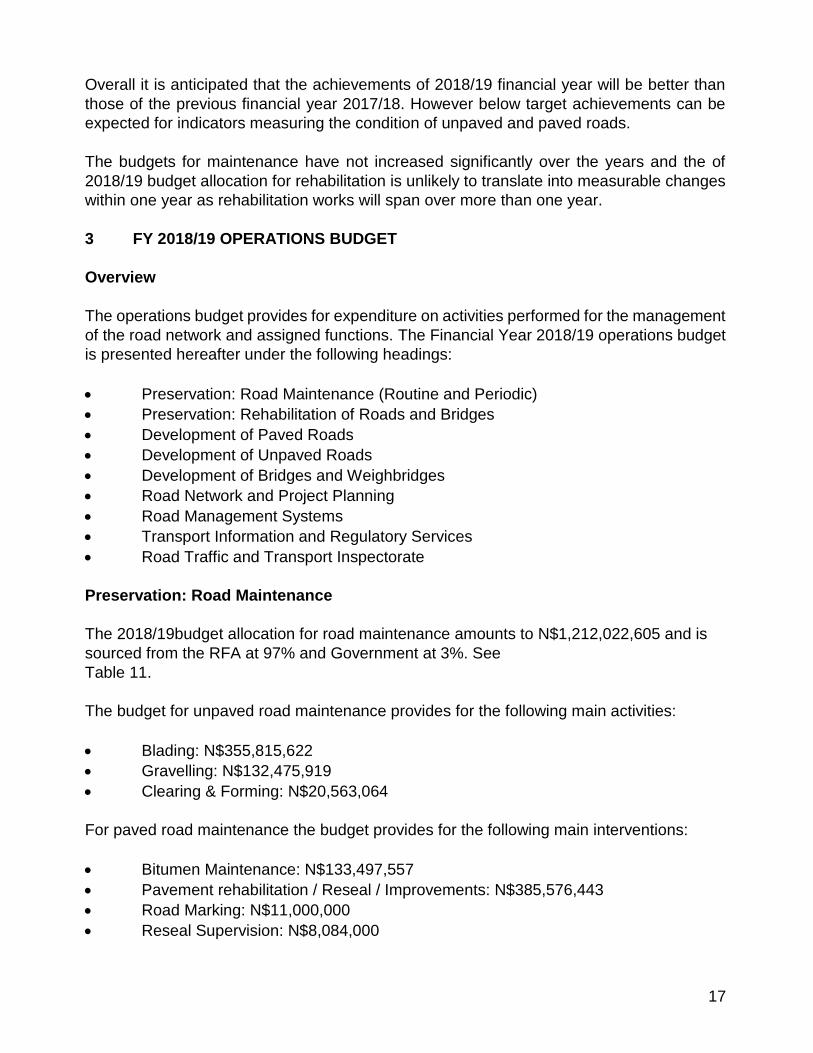
Overall it is anticipated that the achievements of 2018/19 financial year will be better than
those of the previous financial year 2017/18. However below target achievements can be
expected for indicators measuring the condition of unpaved and paved roads.
The budgets for maintenance have not increased significantly over the years and the of
2018/19 budget allocation for rehabilitation is unlikely to translate into measurable changes
within one year as rehabilitation works will span over more than one year.
3 FY 2018/19 OPERATIONS BUDGET
Overview
The operations budget provides for expenditure on activities performed for the management
of the road network and assigned functions. The Financial Year 2018/19 operations budget
is presented hereafter under the following headings:
Preservation: Road Maintenance (Routine and Periodic)
Preservation: Rehabilitation of Roads and Bridges
Development of Paved Roads
Development of Unpaved Roads
Development of Bridges and Weighbridges
Road Network and Project Planning
Road Management Systems
Transport Information and Regulatory Services
Road Traffic and Transport Inspectorate
Preservation: Road Maintenance
The 2018/19budget allocation for road maintenance amounts to N$1,212,022,605 and is
sourced from the RFA at 97% and Government at 3%. See
Table 11.
The budget for unpaved road maintenance provides for the following main activities:
Blading: N$355,815,622
Gravelling: N$132,475,919
Clearing & Forming: N$20,563,064
For paved road maintenance the budget provides for the following main interventions:
Bitumen Maintenance: N$133,497,557
Pavement rehabilitation / Reseal / Improvements: N$385,576,443
Road Marking: N$11,000,000
Reseal Supervision: N$8,084,000

18
The budget for miscellaneous maintenance (N$129,424,000) provides for Contingencies /
Day-works, Road Signs, Concrete & Steelwork, Cleaning of Cuttings, Sand Removal,
Cleaning, Grass Mowing, Bush Clearing, Road Sign erection and Consulting Services.
Table 11: 2018/19 Budget for Road Maintenance
Preservation: Road Maintenance 2018/19 %
Unpaved Road Maintenance 544,440,605 45%
Paved Road Maintenance 538,158,000 44%
Miscellaneous road maintenance 129,424,000 11%
Total 1,212,022,605 100%
Total for budget source: RFA 1,176,440,605 97%
Total for budget source: GRN 35,582,000 3%
Preservation: Rehabilitation of Roads and Bridges
The 2018/19 budget allocation for the rehabilitation of roads and bridges amounts to
N$238,272,000 and is sourced from the RFA at 77% and from Government at 23%. See
Table 12.
The availed resources for the rehabilitation of roads were allocated to the Grunau -
Keetmanshoop - Mariental road rehabilitation (386 km): N$220,450,000. Funding from RFA
(N$166,152,000) will specifically be allocated to the section Tses - Gochas (87km). Loan
financing amounting to N$166,152,000 has been secures from the KfW for the Tses-Gochas
road section.
For the rehabilitation of bridges, the following projects will be funded:
T0202: B0250 Road over Rail Bridge, Swakopmund: N$16,000,000
D0210: B0250 Homs River Bridge, Warmbad: N$1,000,000
Construction of Oute Bridge- Opuwo to Etanga road: N$822,000
Table 12: 2018/19 Budget for Rehabilitation
Preservation: Rehabilitation of Roads and Bridges 2018/19 %
Rehabilitation: Paved Roads 220,450,000 92.5%
Rehabilitation: Bridges 17,822,000 7.5%
Total 238,272,000 100%
Total for budget source: RFA 17,000,000 7.1%
Total budget source: KfW 166,152,000 69.7%
Total for budget source: GRN 55,120,000 23.2%
Development to Dual Carriageway and Upgrading of Un-paved Roads
The 2018/19 budget allocation for the upgrading of roads to paved standards and to
freeway standard amounts to N$1,100,000,000 and sourced from Government at 100%.
See
Table 13. The budget will fund the implementation of the following projects to dual
carriageway standards as part of the Harambee Prosperity Plan:

19
Windhoek – Okahandja (97 km): N$299,646,000
T0901: Windhoek-Dordabis Interchange-Phase 2A (19.5km): N$650,000,000 loan
financing from the African Development Bank (AfDB) will commence 2019/2020;
T0901: Dordabis Interchange-Hosea Kutako International Airport-Phase 2B:
N$900,000,000 grant financing from the China Exim Bank will commence 2019/20;
Swakopmund- Henties Bay- Kamanjab road upgrading (Phase 1 & 2) (402 km):
N$145,790,000
TR1/11: Ongwediva - Ondangwa - Omuthiya (Section A & B) (142km): N$5,000,000
Windhoek – HKI Airport (Phase 1, 8 km) (44km): N$200,000,000
MR44: Swakopmund - Walvis Bay road upgrading (44km): N$205,822,000
MR120: Onunho - Endola- Okatana: Upgrading to bitumen and Dual Carriageway
(40km): N$66,842,000
The budget will also allow pursuing the implementation of the various stages of the following
paved roads:
MR91: Gobabis – Aminuis – Aranos (245 km): N$10,724,000
Gobabis - Otjinene - Grootfontein (231 km): N$64,342,000
Liselo - Linyanti - Kongola (205km): N$10,044,000
MR118: Oranjemund – Roshpinah (100km): N$2,000,000
DR3609: Oshakati – Ongenga (37km): N$4,000,000
Isize - Sifuha - Malindi - Schuckmannsburg upgrading (50km): N$85,790,000
Table 13: 2018/19 Budget for the Development of Paved Roads
Development: Freeways and Paved Roads 2018/19 %
Harambee Projects 851,258,000 82.8%
Development: Paved Roads 176,900,000 7.2%
Total 1,028,158,000 100%
Total for budget source: RFA - 0%
Total for budget source: GRN 1,028,158,000 100%
Development of Unpaved Roads
The 2018/19 budget allocation for the construction of unpaved gravel roads through
conventional and labour-based methods amounts to N$157,170,000 and funded by

20
Government from state revenue at 44%and the financial assistance of the KfW at 56%.
See
Table 14.
The budget provides funding for the following conventional gravel road construction:
Masokotwani (MR125) -Machita gravel road construction (32km): N$2,000,000
Epato (MR111) - Onkani (Onaushe) (46km): N$239,000
Uukwiyuushona - Omuntele ( Amilema) (80.7km): N$572,000
Etomba (DR3639) - Omundaungilo (71km): N$357,000
D3622: Omukukutu - Omboloka (25Km): N$905,000
Access Roads to Schools and Clinics: N$92,193,000
D3624: Omundaungilo - Omboloka (86 km): N$3,000,000
D3654: Omuthiya – Elambo) (DR3630) gravel road construction (48.8 km):
N$1,500,000
Endola - Eembo gravel road construction (19km): N$52,154,000
Epinga- Onakalunga - gravel road construction (12km): N$2,000,000
D3619: Onaanda- Otamanzi: N$2,250,000
Table 14: 2018/19 Budget for Gravel Road Construction
Development: Unpaved Roads 2018/2019 %
Development: gravel roads 2,000,000 1%
Development: Labour based gravel roads 155,170,000 99%
Total 157,170,000 100%
Total for budget source: GRN 69,170,000 44%
Total for budget source: KfW 88,000,000 56%
Road Network and Project Planning
The 2018/19 budget allocation for Network Planning and Consultation amounts to
N$27,000,000 and sourced from the RFA at 100%. See
Table 15: The budget provides for the following under network planning, project
investigations and feasibility studies and measures for road safety:
Nationwide transport planning: N$1,000,000
Consultants / specialists: N$2,000,000
Research & Development: N$4,000,000
Revision of the Medium to Long Term Roads Master Plan: N$1,200,000
Study on Pricing and Costing of Roads Construction and Preservation Works in
Namibia: N$1,000,000

21
Pavement Rehabilitation Investigation and Design for Oshakati - Ruacana (187 km),
Kongola - Katima Mulilo (25 km), Taranaki - Mururani gate Rundu (240 km):
N$4,400,000
Planning for the Upgrade to Bitumen Standards of Gravel roads: Bukalo- Muyako-
Ngoma, Grootfontein - Tsumkwe (300 km), Noordoewer - Aussenkehr (144 km):
N$2,900,000
Measures for Road Safety Improvement including studies and the rehabilitation of
borrow pits phase II: N$5,500,000
The budget includes for N$5,000,000 for fencing and compensation associated with the
management of the road network.
Table 15: 2018/19 Budget for Network Planning and Consultation
Road Network and Project Planning 2018/2019 %
Network Planning 9,200,000 34%
Fencing and Compensation 5,000,000 19%
Project Planning 7,300,000 27%
Measures for Road Safety Improvement 5,500,000 20%
Total 27,000,000 100%
Total for budget source: RFA 27,000,000 100%
Road Management Systems
The 2018/19 budget allocation for Road Management Systems amounts to N$26,000,000
and sourced from the RFA at 100%. See Table 16. The budget provides for:
Ongoing condition surveys which absorb 26% of the budget: N$6,690,000
Specialist consultancy for road management systems development and
maintenance which represent 42% of the budget: N$11,000,000
A total of N$8,310,000 for the development and operations of other systems,
technical support and other specialist services.
Table 16: 2018/19 Budget for Road Management Systems
Road Management Systems 2018/2019 %
Road condition survey 6,690,000 26%
Specialist consultancy RMS development & maintenance 11,000,000 42%
Other system development and operation 8,310,000 32%
Total 26,000,000 100%
Total for budget source: RFA 26,000,000 100%

22
Transport Information and Regulatory Services
The 2018/19 budget allocation for the Division: Transport Information and Regulatory
Services amounts to N$43,753,000 and sourced from the RFA at 87% and from Government
at 13%. See Table 17. The budget provides for the continued undertaking of the various
activities related to the management of the Namibia Transport Information Systems. The
largest budget items are:
Driving Licences cards & LCU maintenance representing 34% of the budget:
N$15,000,000
NaTIS management fees, operations and maintenance absorbing 31% of the
budget: N$13,500,000
NaTIS VTS construction and renovations absorbing 13% of the budget:
N$5,753,000
Agency fees: N$5,000,000 (11%).
Table 17: 2018/19 Budget for Transport Information and Regulatory Services
Transport Information and Regulatory Services 2018/2019 %
Agency fees 5,000,000 11%
NaTIS VTS Construction and Renovations 5,753,000 13%
NaTIS management fees, operations and maintenance 13,500,000 31%
Driving Licences cards & LCU maintenance 15,000,000 34%
Systems and other operations 4,500,000 10%
Total 43,753,000 100%
Total for budget source: RFA 38,000,000 87%
Total for budget source: GRN 5,753,000 13%
Road Traffic and Transport Inspectorate
The 2018/19 budget allocation for the Division: Road Traffic and Transport Inspectorate
amounts to N$10,000,000 and sourced from the RFA at 100%. See Table 18.
The budget provides for the various activities of the Road Traffic and Transport Inspectorate
including:
The management of weighbridges and overload control: N$1,697,500
The maintenance of the traffic monitoring system covering Trafman System Licence,
calibration, verification and scale maintenance: N$4,302,500
The implementation of the Oshivelo weighbridge renovation and additions project:
N$4,000,000
23
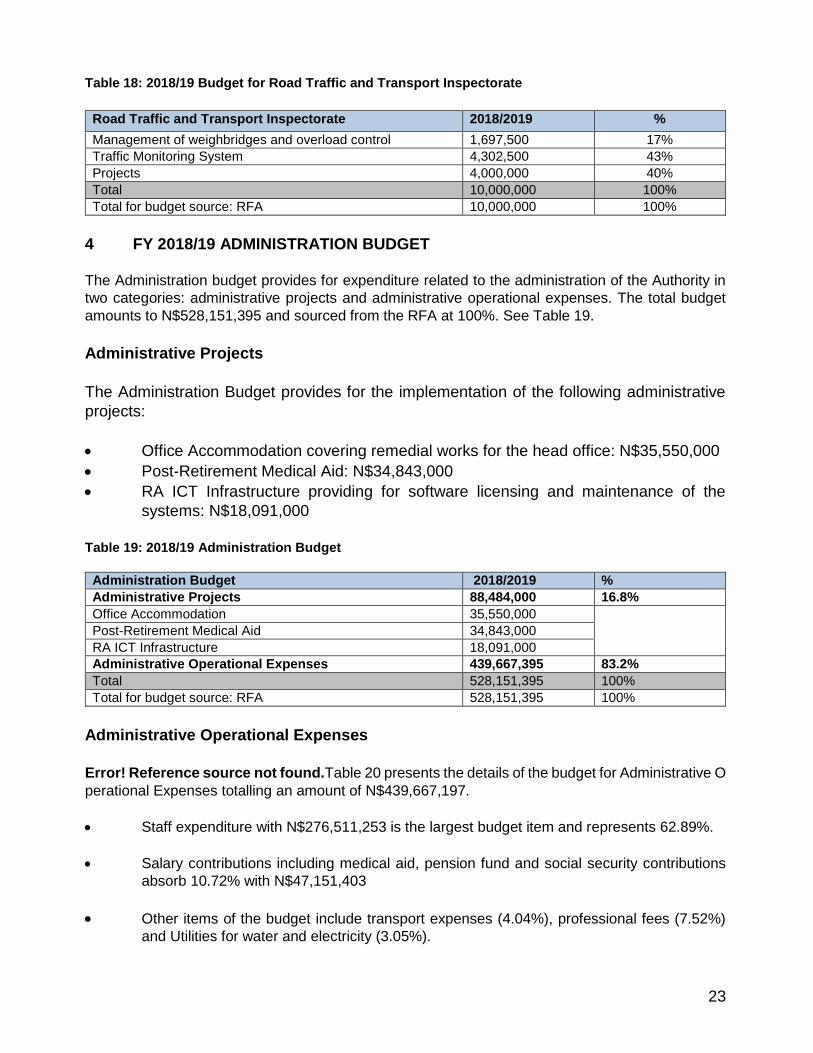
Table 18: 2018/19 Budget for Road Traffic and Transport Inspectorate
Road Traffic and Transport Inspectorate 2018/2019 %
Management of weighbridges and overload control 1,697,500 17%
Traffic Monitoring System 4,302,500 43%
Projects 4,000,000 40%
Total 10,000,000 100%
Total for budget source: RFA 10,000,000 100%
4 FY 2018/19 ADMINISTRATION BUDGET
The Administration budget provides for expenditure related to the administration of the Authority in
two categories: administrative projects and administrative operational expenses. The total budget
amounts to N$528,151,395 and sourced from the RFA at 100%. See Table 19.
Administrative Projects
The Administration Budget provides for the implementation of the following administrative
projects:
Office Accommodation covering remedial works for the head office: N$35,550,000
Post-Retirement Medical Aid: N$34,843,000
RA ICT Infrastructure providing for software licensing and maintenance of the
systems: N$18,091,000
Table 19: 2018/19 Administration Budget
Administration Budget 2018/2019 %
Administrative Projects 88,484,000 16.8%
Office Accommodation 35,550,000
Post-Retirement Medical Aid 34,843,000
RA ICT Infrastructure 18,091,000
Administrative Operational Expenses 439,667,395 83.2%
Total 528,151,395 100%
Total for budget source: RFA 528,151,395 100%
Administrative Operational Expenses
Error! Reference source not found.Table 20 presents the details of the budget for Administrative O
perational Expenses totalling an amount of N$439,667,197.
Staff expenditure with N$276,511,253 is the largest budget item and represents 62.89%.
Salary contributions including medical aid, pension fund and social security contributions
absorb 10.72% with N$47,151,403
Other items of the budget include transport expenses (4.04%), professional fees (7.52%)
and Utilities for water and electricity (3.05%).

24
Table 20: 2018/19 Administrative Operational Expenses
Administrative Operational Expenses 2018/2019 %
Fixed Assets 2,584,770 0.59%
Material & Supplies 3,412,378 0.78%
Maintenance 1,792,300 0.41%
Staff Expenditure 276,511,253 62.89%
Salary Contributions 47,151,403 10.72%
Employee Support 0 0.00%
Staff Welfare 7,407,959 1.68%
Travel & Subsistence 10,635,535 2.42%
Subscriptions And Donations 2,760,792 0.63%
Directors Fees 1,102,500 0.25%
Transport 17,742,498 4.04%
Utilities 13,406,200 3.05%
Communication Cost 6,980,589 1.59%
Rentals 4,188,200 0.95%
General Expenses 10,485,767 2.38%
Professional Fees 33,074,600 7.52%
Fines And Penalties 10,000 0.00%
Finance Charges 190,000 0.04%
Inventory Items(<1000) 230,453 0.05%
Total 439,667,197 100.00%
5 CONSOLIDATED BUDGET TABLES
The Tables below provide the summarized details of the consolidated budget for the five-
year Roads Authority Budget for financial year 2018/19 to 2022/23.

25
Table 21: FIVE-YEAR BUDGET FOR THE PERIOD 2018/19 TO 2022/23: CONSOLIDATED BUDGET - ALL SOURCES OF FUNDING (N$)
Current Cycle 2018/19 - 2022/23 Budget
Class Budget Category 2017/18 2018/19 2019/20 2020/21 2021/22 2022/23 Total 5 years
Op
era
tion
s b
ud
ge
t
Maintenance: Unpaved Roads 660,202,000 544,440,605 555,889,756 631,758,677 655,358,694 655,358,694 3,042,806,426
Maintenance: Paved Roads 434,820,000 538,158,000 797,398,616 578,418,548 587,889,475 587,889,475 3,089,754,114
Bridge Maintenance and repair 0 0 46,662,000 51,444,855 51,444,855 51,444,855 200,996,565
Maintenance: Miscellaneous 141,412,000 129,424,000 170,890,712 178,835,245 187,177,007 187,177,007 853,503,971
Emergency funds 0 0 0 0 0 0 0
Harambee projects 423,500,000 851,258,000 1,191,382,225 1,613870,401 1,723,17,895 1,517,137,967 6,896,816,488
Rehabilitation: Paved Roads 0 220,450,000 292,559,000 201,754,000 0 0 714,763,000
Rehabilitation: Bridges 9,500,000 17,822,000 75,000,000 12,000,000 0 0 104,000,000
Development: Paved Roads 429,000,000 243,742,000 166,885,000 163,386,000 70,000,000 2,000,000 579,171,000
Development: Gravel Roads 4,116,000 2,000,000 21,262,000 95,146,000 146,000,000 68,000,000 332,408,000
Labour Based: Gravel Roads 62,506,000 155,170,000 147,147,000 4,000,000 0 0 306,317,000
Development: Bridges 0 0 0 0 0 0 0
Development: Weighbridges 0 0 15,000,000 63,000,000 0 0 78,000,000
Planning 24,500,000 27,000,000 47,500,000 49,500,000 54,000,000 54,000,000 232,000,000
Road Management Systems 25,200,000 26,000,000 43,961,500 41,357,650 45,493,415 50,042,757 206,855,322
TI&RS 50,356,000 43,753,000 48,608,500 50,047,010 52,828,631 55,913,149 251,150,290
RTTI 4,100,000 10,000,000 12,150,000 10,525,000 10,354,958 13,332,487 56,362,445
Ad
min
istr
ation
bu
dg
et
Office Accommodation 11,000,000 35,550,000 38,038,500 40,701,195 43,550,279 46,598,798 204,438,772
Post Retirement med. Benefit 17,843,000 34,843,000 17,000,000 2,000,000 0 0 53,843,000
RA ICT Infrastructure 13,287,851 18,091,000 19,357,584 20,712,615 22,162,498 23,713,873 104,037,770
Administration 369,869,149 439,667,395 455,025,199 486,876,963 520,958,350 557,425,435 2,459,953,142
Total Budget
2,681,212,000 3,337,369,000 4,163,840,367 4,295,536,521 4,169,709,681 3,867,704,113 19,834,159,681

26
Table 22: FIVE-YEAR BUDGET FOR THE PERIOD 2018/19 TO 2022/23: CONSOLIDATED BUDGET - FUNDING SOURCE: RUCS AND LOANS TO RFA
(N$)
Current Cycle 2018/19 - 2022/23
Budget
Class Budget Category
Fundin
g
Source 2017/18 2018/19 2019/20 2020/21 2021/22 2022/23 Total 5 years
Op
era
tion
s b
ud
ge
t
Maintenance: Unpaved
Roads RFA 660,202,000 508,858,605 375,238,423 472,000,344 495,600,361 495,600,361 2,347,298,094
Maintenance: Paved Roads RFA 434,820,000 538,158,000 560,189,040 516,727,194 542,563,553 542,563,553 2,700,201,340
Maintenance: Bridges RFA 0 0 46,662,000 51,444,855 51,444,855 51,444,855 200,996,565
Maintenance: Miscellaneous RFA 141,412,000 129,424,000 170,890,712 178,835,245 187,177,007 187,177,007 853,503,971
Harambee projects RFA 38,500,000 0 0 0 0 0 0
Rehabilitation: Paved Roads RFA 0 166,152,000 170,326,000 145,277,000 0 0 481,755,000
Rehabilitation: Bridges RFA 9,500,000 17,000,000 75,000,000 12,000,000 0 0 104,000,000
Development: Paved Roads RFA 0 0 0 0 0 0 0
Development: Gravel Roads RFA 0 0 0 0 0 0 0
Labour Based: Gravel Roads RFA 0 0 0 0 0 0 0
Development: Bridges RFA 0 0 0 0 0 0 0
Development: Weighbridges RFA 0 0 15,000,000 63,000,000 0 0 78,000,000
Planning RFA 24,500,000 27,000,000 47,500,000 49,500,000 54,000,000 54,000,000 232,000,000
Road Management Systems RFA 25,200,000 26,000,000 43,961,500 41,357,650 45,493,415 50,042,757 206,855,322
TI&RS RFA 39,456,000 38,000,000 36,312,500 37,013,250 39,012,845 41,268,416 191,607,011
RTTI RFA 4,100,000 10,000,000 12,150,000 10,525,000 10,354,958 13,332,487 56,362,445
Ad
min
istr
atio
n b
udg
et
Office Accommodation RFA 11,000,000 35,550,000 38,038,500 40,701,195 43,550,279 46,598,798 204,438,772
Post Retirement med.
Benefit RFA 17,843,000 34,843,000 17,000,000 2,000,000 0 0 53,843,000
RA ICT Infrastructure RFA 13,287,851 18,901,000 19,357,584 20,712,615 22,162,498 23,713,873 104,037,770
Administration RFA 369,869,149 439,667,395 455,025,199 486,876,963 520,958,350 557,425,435 2,459,953,142
Total RFA 1,729,690,000 1,988,744,000 2,271,558,458 2,216,171,311 2,011,948,127 2,063,167,542 10,461,959,430

27
Table 23: FIVE-YEAR BUDGET FOR THE PERIOD 2018/19 TO 2022/23: CONSOLIDATED BUDGET - FUNDING SOURCE: GRN + LOANS AND GRANTS (N$)
Current Cycle 2018/19 - 2022/23
Budget
Class Budget Category
Funding
Source 2017/18 2018/19 2019/20 2020/21 2021/22 2022/23 Total 5 years
Op
era
tion
s b
ud
ge
t
GRN: STATE REVENUE
FUND
Maintenance: Unpaved
Roads GRN 60,000,000 35,582,000 180,651,333 159,758,333 159,758,333 159,758,333 695,508,332
Maintenance: Paved Roads GRN 0 0 237,209,576 61,691,354 45,325,922 45,325,922 389,552,774
Maintenance: Bridges GRN 0 0 0 0 0 0 0
Maintenance:
Miscellaneous GRN 0 0 0 0 0 0 0
Harambee projects GRN 385,000,000 851,258,000 1,191,382,225 1,613870,401 1,723,167,895 1,517,137,967 6,896,816,488
Rehabilitation: Paved
Roads GRN 0 54,298,000 122,233,000 56,477,000 0 0 233,008,000
Rehabilitation: Bridges GRN 0 822,000 1,741,000 2,000,000 0 0 4,563,000
Development: Paved Roads GRN 429,000,000 243,742,000 166,885,000 163,386,000 70,000,000 2,000,000 579,171,000
Development: Gravel
Roads GRN 4,116,000 2,000,000 21,262,000 95,146,000 146,000,000 68,000,000 332,408,000
Labour Based: Gravel
Roads GRN 58,756,000 67,170,000 53,147,000 4,000,000 0 0 121,258,000
Development: Bridges GRN 0 0 0 0 0 0 0
Development:
Weighbridges GRN 0 0 0 0 0 0 0
Planning GRN 0 0 0 0 0 0 0
Road Management
Systems GRN 0 0 0 0 0 0 0
TI&RS GRN 10,900,000 5,753,000 12,296,000 13,033,760 13,815,786 14,644,733 59,543,279
RTTI GRN 0 0 0 0 0 0 0
Total State Revenue Fund 947,772,000
1,260,625,000
1,447,376,909
1,669,365,210
1,657,391,560
1,604,536,571 7,639,295,250
GRN: LOANS & GRANTS
LB: Gravel Roads KfW 3,750,000 88,000,000 94,905,000 0 0 0 182,905,000
Harambee Projects ADB 0 0 150,000,000 300,000,000 200,000,000 0 650,000,000
Harambee Projects EXIM 0 0 200,000,000 200,000,000 300,000,000 200,000,000 900,000,000
Total GRN+ Loans, Grants 951,522,000 1,348,625,000 1,892,281,909 2,169,365,210 2,157,391,560 1,804,536,571 9,372,200,250

28
Table 24: FIVE-YEAR BUDGET FOR THE PERIOD 2018/19 TO 2022/23: CONSOLIDATED BUDGET: SUMMARY AND SOURCES OF FUNDS (N$)
Current Cycle 2018/19 - 2022/23
Budget
Class Budget Category 2017/18 2018/19 2019/20 2020/21 2021/22 2022/23 Total 5 years
Opera
tions B
udg
et Maintenance 1,236,434,000 1,212,022,605 1,570,841,084 1,440,457,325 1,481,870,031 1,481,870,031 7,187,061,076
Construction and Rehabilitation 928,622,000 1,490,442,000 1,909,035,225 2,153,156,401 1,939,167,895 1,587.137,967 9,078,939,488
Network planning and Consultation 24,500,000 27,000,000 47,500,000 49,500,000 54,000,000 54,000,000 232,000,000
Road Management Systems 25,200,000 26,000,000 43,961,500 41,357,650 45,493,415 50,042,757 206,855,322
Transport Information and Regulatory
Services 50,356,000 43,753,000 36,312,500 37,013,250 39,012,845 41,268,416 191,607,011
Road Traffic and Transport
Inspectorate 4,100,000 10,000,000 12,150,000 10,525,000 10,354,958 13,332,487 56,362,445
Adm
inis
tr
atio
n
Bud
get Office Accommodation 11,000,000 35,550,000 38,038,500 40,701,195 43,550,279 46,598,798 204,438,772
Post Retirement med. Benefit 17,843,000 34,843,000 17,000,000 2,000,000 0 0 53,843,000
RA ICT Infrastructure 13,287,851 18,091,000 19,357,584 20,712,615 22,162,498 23,713,873 104,037,770
Administration 369,869,149 439,667,395 455,025,199 486,876,963 550,904,600 557,425,435 2,489,953,142
Total 2,681,212,000 3,337,369,000 4,163,840,367 4,295,536,521 4,169,709,681 3,867,704,113 19,834,159,681
Sources of Funds
RFA + LOANS 1,729,690,000 1,988,744,000 2,271,558,458 2,126,171,311 2,012,318,121 2,063,167,542 10,461,959,431
GRN + LOANS & GRANTS
951,522,000 1,348,625,000 1,892,281,909 2,169,365,210
2,157,391,560
1,804,536,571 9,372,200,250
Total 2,681,212,000 3,337,369,000 4,163,840,367 4,295,536,521 4,169,709,681 3,867,704,113 19,834,159,681
29
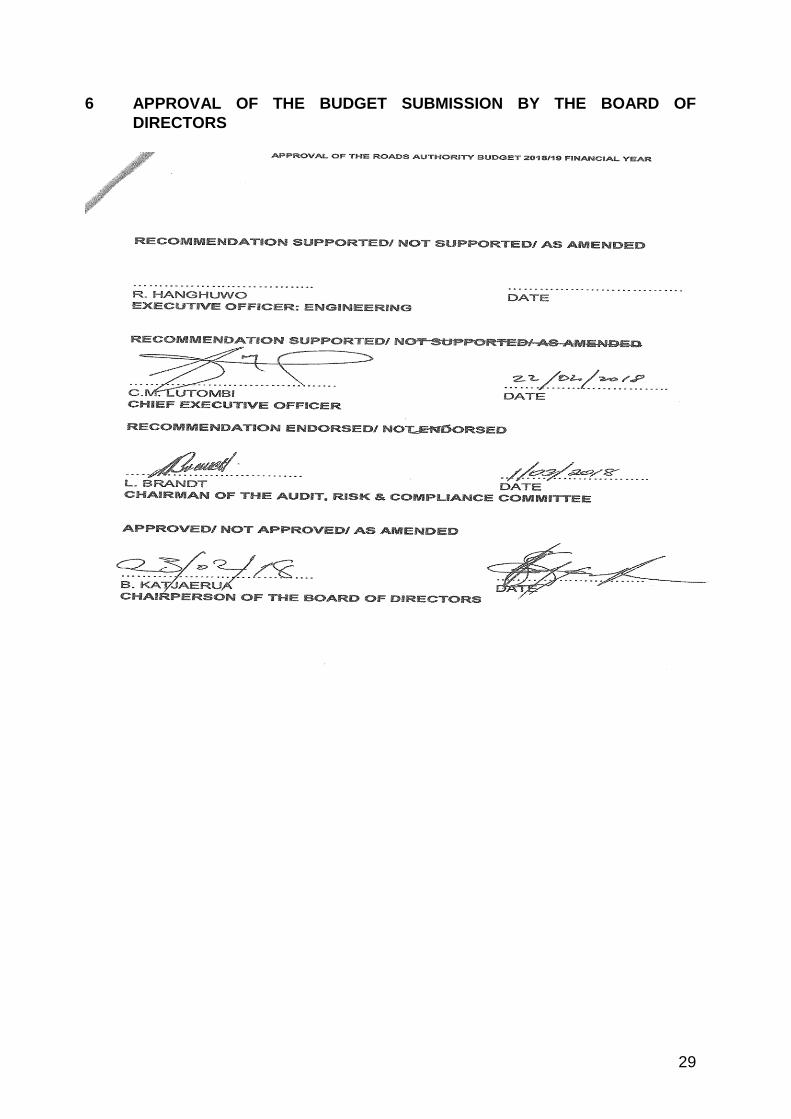
6 APPROVAL OF THE BUDGET SUBMISSION BY THE BOARD OF
DIRECTORS

30
7 APPROVAL OF THE RA 2018/19 BUDGET BY RFA
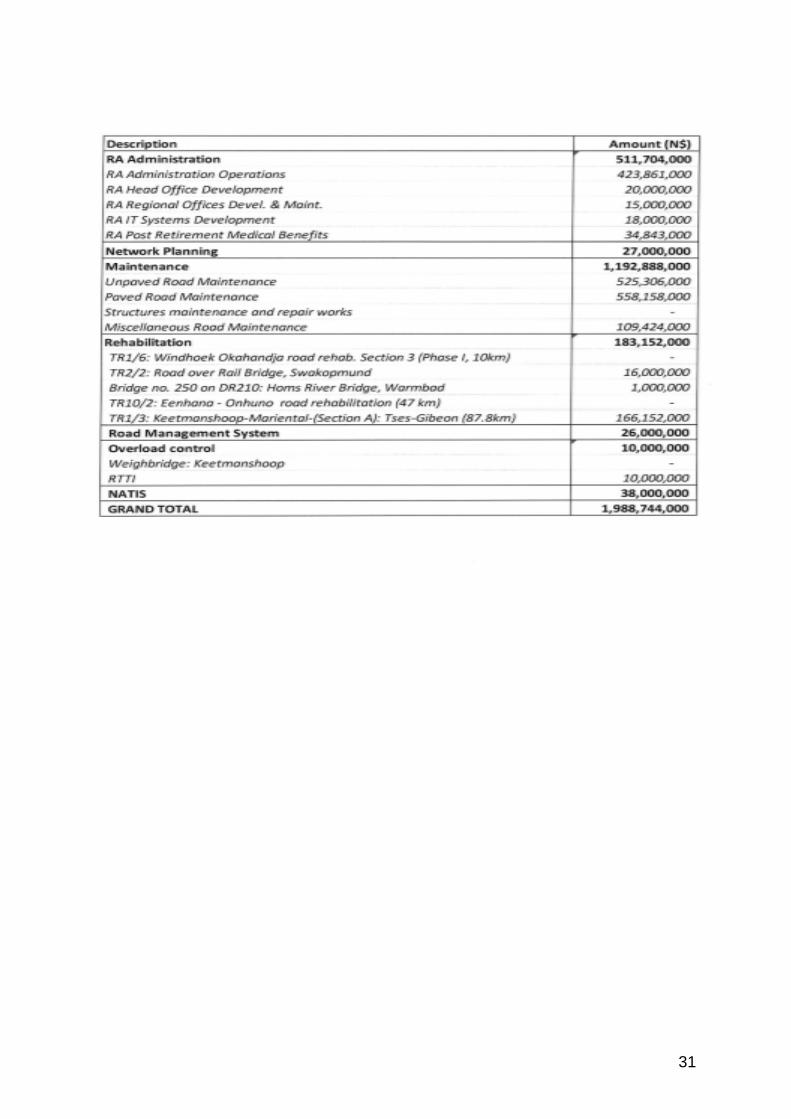
31


