Page 1
Accelerating Our Momentum
1
Accelerating Our Momentum
Business and Franchise MomentumNorfolk Southern Investor and Financial Analyst ConferenceJune 8, 2011 Donald W. Seale
Executive Vice President & Chief Marketing Officer
Page 2
Accelerating Our MomentumAccelerating Our Momentum
Agenda
Strong platform for accelerated rail growth
NS business trends and franchise update
NS market drivers, network and outlook
NS long term focus and strategy
2
Page 3
Accelerating Our MomentumAccelerating Our Momentum
Favorable Environment for Rail
Favorable Rail Environment
Seizing the opportunity from
manufacturing growth
Foreign trade growth & increased
domestic containerization
Impact of CSA 2011
Increasing focus on environmental
stewardship
Tightening capacity across all modes
Public sentiment
Rail productivity gains
3
Page 4
Accelerating Our MomentumAccelerating Our Momentum
0
50,000
100,000
150,000
200,000
250,000
300,000
2006 2007 2008 2009 2010
Units U.S. Class 8 Sales U.S. Trailer Production
Shrinking Truckload Capacity Trends
Source: FTR Associates, Paccar
Class 8 Replacement Rate
4
Page 5
Accelerating Our MomentumAccelerating Our Momentum
Compliance Safety Accountability Program 2011 & The Changing Truckload Market
CSA 2011 safety rating program Calculates carriers’ and drivers’ safety ratings using defined set of criteria
Hours of service regulations Reduction of workday to 10 hours of driving time
FMCSA training requirements New regulations governing recruitment and improving training
ID requirements Imposes strict national standards for issuance of state ID documents
Net Effect
More than 300,000 drivers will be disqualified between now and 2012 –doubling current driver shortage
Driver shortage may cost shippers an additional $25 billion
Estimated that new regulations will decrease trucking productivity by over 5%
5
Page 6
Accelerating Our MomentumAccelerating Our Momentum
251,169 156,874
258,691 128,655 133,212
1,259,969
663,075
Agriculture Chemicals MetCon Paper Automotive Intermodal Coal
NS Railway VolumeYTD through Week 21 vs. 2010
Source: AAR carloadings, which are reported weekly and may not equal NS’ reported volumes.
(3%)(5%)
3%(3%)
9%
15%
7%
2.9 million units YTD, up 153,894 or 6% vs. 2010
6
Page 7
Accelerating Our MomentumAccelerating Our Momentum
Record Revenue Per Unit in 1st Quarter 2011
$0
$300
$600
$900
$1,200
$1,500
$1,800
$2,100
$2,400
2000 2001 2002 2003 2004 2005 2006 2007 2008 2009 2010 2011
RPU Merchandise Intermodal Coal Total
7
70% increase
since 2000
2010 vs. 2000RPU CAGR
4.6%
Page 8
Accelerating Our MomentumAccelerating Our Momentum
Highest Revenue Per Ton Mile among U.S. Class I RRs
020406080
100120140160180200
2000 2001 2002 2003 2004 2005 2006 2007 2008 2009 2010
Indexed to 2000 NS Carrier A Carrier B Carrier C
Source: AAR for UP, BNSF; NS and CSXT from Financial Statements, revenue per revenue ton mile
8
68% increase
since 2000
2010 vs. 2000RPTM CAGR
5.3%
Page 9
Accelerating Our MomentumAccelerating Our Momentum
Source: AAR, FTR, Global Insight, NS
NS Volume vs. Low Tech IPI and Motor Carriers
9
80859095
100105110115120125130
2000 2001 2002 2003 2004 2005 2006 2007 2008 2009 2010 2011
Indexed to 1Q 00 NS Volume Other U.S. RRs Volume less NS Truck Tonnage Low Tech IPI
Page 10
Accelerating Our MomentumAccelerating Our Momentum
020406080
100120140160180200
2000 2001 2002 2003 2004 2005 2006 2007 2008 2009 2010
Indexed to 2000 NS Revenue Other U.S. RRs Revenue less NS Truck Revenue Low Tech IPI
Source: AAR, FTR, Global Insight, NS
NS Revenue vs. Low Tech IPI and Motor Carriers
10
Page 11
Accelerating Our Momentum
$0
$2,000
$4,000
$6,000
$8,000
$10,000
$12,000
2000 2001 2002 2003 2004 2005 2006 2007 2008 2009 2010
Revenue in $ Millions
Intermodal Merchandise Coal
NS Railway Revenue Growth
$9,407$8,527
$7,312$6,468$6,270$6,170$6,159
$9,432$10,661
$7,969
$9,516
2010 vs. 2000Up $3.36 billion or
55% increase 4.4% CAGR
11
Page 12
Accelerating Our MomentumAccelerating Our Momentum
Major Group Revenue2000 - 2010
Revenue in $ Millions
2000 2002 2004 2006 2008 2010 CAGR
Agriculture $609 $637 $727 $994 $1,282 $1,326 8.1%
Coal $1,435 $1,441 $1,728 $2,330 $3,111 $2,719 6.6%
Chemicals $756 $755 $864 $1,079 $1,238 $1,302 5.6%
Intermodal $1,119 $1,181 $1,537 $1,971 $2,058 $1,796 4.8%
MetCon $689 $692 $818 $1,168 $1,251 $1,013 3.9%
Paper $630 $603 $684 $891 $898 $712 1.2%
Automotive $921 $961 $954 $974 $823 $648 (3.5%)
Total $6,159 $6,270 $7,312 $9,407 $10,661 $9,516 4.4%
12
Page 13
Accelerating Our MomentumAccelerating Our Momentum
Summary of NS Drivers of Volume and Revenue Since 2000
Strong global trade – strong imports, and exports expansion
Growth in utility, domestic, export and metallurgical coal
New intermodal corridors, terminals and products
Resurgent steel industry – despite recessionary impact in 2009
Strong growth in ethanol and bio-fuels
Robust industrial development
Strong safety and service performance
Pricing to market gains
Effective fuel surcharge program
13
Page 14
Accelerating Our MomentumAccelerating Our Momentum
Balanced Portfolio of Business
% of 2010 NS Revenue
NS Network
74% of U.S. population
58% of total energy consumption in U.S.
63% of U.S. manufacturing
Estimate 30M+ truck shipments over 550 miles touch our network
Extensive port access
Intermodal19%
Coal28%
Agriculture14%
Manufacturing39%
14
Page 15
Accelerating Our MomentumAccelerating Our Momentum
NY / NJPhiladelphia
WilmingtonBaltimore
Morehead City
Charleston
Savannah
Brunswick
Jacksonville
NorfolkPortsmouth
Mobile
New OrleansBraithwaite
St. Bernard
15
NS Railway& Ports served by NS
Seaports 16
River Ports 8
Lake Ports 7
Cleveland
ErieAshtabula
Detroit
Toledo
Chicago
Burns Harbor
Granite City, IL
Jeffersonville, IN
Cincinnati
Louisville
NaplesPortsmouth, OH
Pittsburgh
Memphis
A Network of Key Corridors andPort Access
Camden / South Jersey
Page 16
Accelerating Our MomentumAccelerating Our Momentum
Our Coal Network
Coal Robust electrical generating base
Strong export network with increased demand in European, Asian & South American markets
Custom coking coal blending
Expansive coal sourcing
More productive coal car fleet
Corridor/terminal investment
Cutting edge supply chain management (CTMS)
16
6.6%
10 Year CAGR Revenue
6.6%
% of 2010 Tonnage
Utility 71%
Industrial4%
Domestic Met12%
Export13%
Page 17
Accelerating Our MomentumAccelerating Our Momentum
Our Coal Network
17
Utility Coal
Reaches 103 utility coal generation plants
Directly serves 86 plants 55 in the North 31 in the South
Access to an additional 17 plants through connecting carriers and lake service
Page 18
Accelerating Our MomentumAccelerating Our Momentum
Lamberts Point, VA Coal Terminal
18
Export Coal
Largest and fastest export coal loading terminal in the Northern Hemisphere
Handled 40 million tons in 1990
2011 Tonnage vs. 2010 1st Q 15% April 34% May 59%
Available for capacity growth
Steam coal opportunities ahead
Page 19
Accelerating Our MomentumAccelerating Our Momentum
CNX Marine Terminal, Baltimore, MD
19
Export Coal
CONSOL announced Baltimore export terminal expansion April 28, 2011
2 million ton capacity expansion to 16 million tons/year
Rail infrastructure expansion online in 2012
Long term potential for additional expansion
Page 20
Accelerating Our MomentumAccelerating Our Momentum
Fairless, PA and Charleston, SCCoal Tonnage Moving Today
20
Norfolk Southern Railway and its Railroad Operating Subsidiaries- - - NS Trackage and Haulage Rights
Illinois Basin
Northern Appalachia
Powder River Basin
CentralAppalachia
Fairless, PA
Charleston, SC
Page 21
Accelerating Our MomentumAccelerating Our Momentum
Wheelersburg, OH Coal Terminal
21
Domestic Met Coal
9 million tons/year throughput
1.2 million tons ground storage capacity, with optimized pile configuration
Custom blending for domestic coke production
Expansion plans to support new steam coal
Page 22
Accelerating Our MomentumAccelerating Our Momentum
NS Coal Network Flows
22
Tonnage % ChangeYTD thru May vs. 2010
Utility 7%
Export 26%
Domestic Met (9%)
Industrial (5%)
% of 2010 Tonnage
Utility 71%
Industrial4%
Domestic Met12%
Export13%
Page 23
Accelerating Our MomentumAccelerating Our Momentum
Norfolk Southern Railway and its Railroad Operating Subsidiaries- - - NS Trackage and Haulage Rights
Illinois Basin
11.1 M Tons8%
Northern Appalachia45.3 M Tons
29%
Powder River Basin
32.8 M Tons 21%
CentralAppalachia64.8 M Tons
42%
NS Origin Coal 2010 Volume (Tons)
23
Page 24
Accelerating Our MomentumAccelerating Our Momentum
Norfolk Southern Railway and its Railroad Operating Subsidiaries- - - NS Trackage and Haulage Rights
Illinois Basin
11.1 M Tons8%
NS Mid-America Corridor to reach Illinois Basin
24
Corinth, MS
Page 25
Accelerating Our Momentum
Increased Coal Car Capacity
Hoppers
Old steel hopper payload capacity: 104 tons
New stainless body hopper payload capacity: 113 tons
Gons
Old steel gondola payload capacity: 112 tons
New hybrid body gondola payload capacity: 118 tons
25
Page 26
Accelerating Our MomentumAccelerating Our Momentum
Our Manufacturing Network
Manufacturing
Resurgence of U.S. Manufacturing
Metals, Construction, Chemicals, Automotive and Paper
63% of U.S. manufacturing in our service territory
Highest revenue per unit network for NS
26
10 Year CAGR Revenue
2.1%
% of NS Mfg. 2010 Revenue
Auto18%
Paper19%
Chemicals35%
MetCon28%
Page 27
Accelerating Our MomentumAccelerating Our Momentum
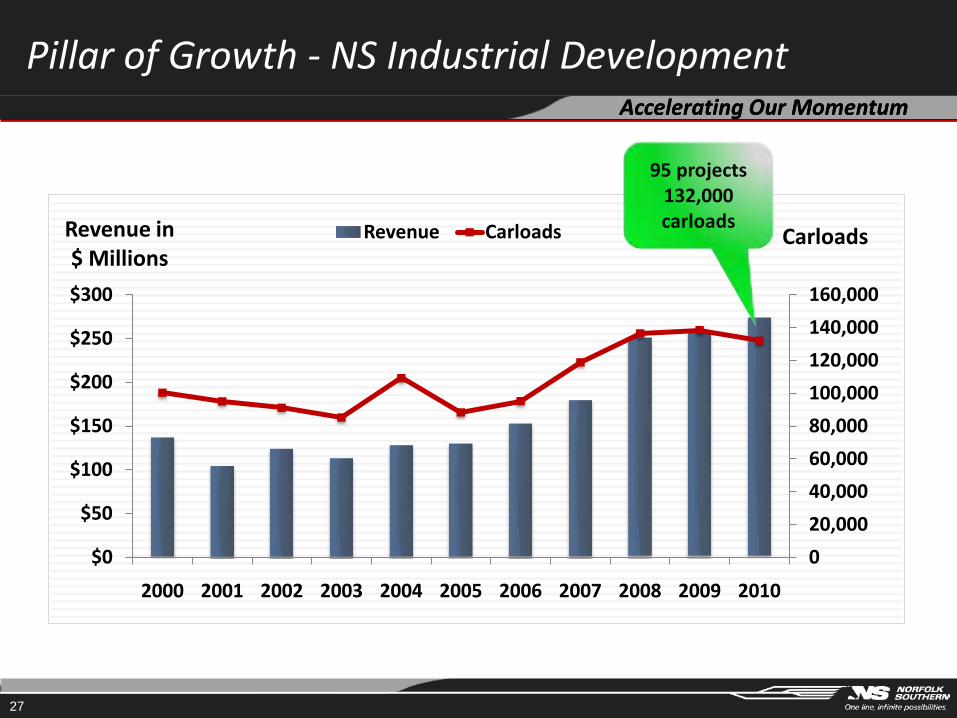
Pillar of Growth - NS Industrial Development
0
20,000
40,000
60,000
80,000
100,000
120,000
140,000
160,000
$0
$50
$100
$150
$200
$250
$300
2000 2001 2002 2003 2004 2005 2006 2007 2008 2009 2010
CarloadsRevenue in $ Millions
Revenue Carloads
27
95 projects132,000 carloads
Page 28
Accelerating Our MomentumAccelerating Our Momentum
$5 billion investment
5.3 million metric tons of annual production
3,460 acres (155 under roof)
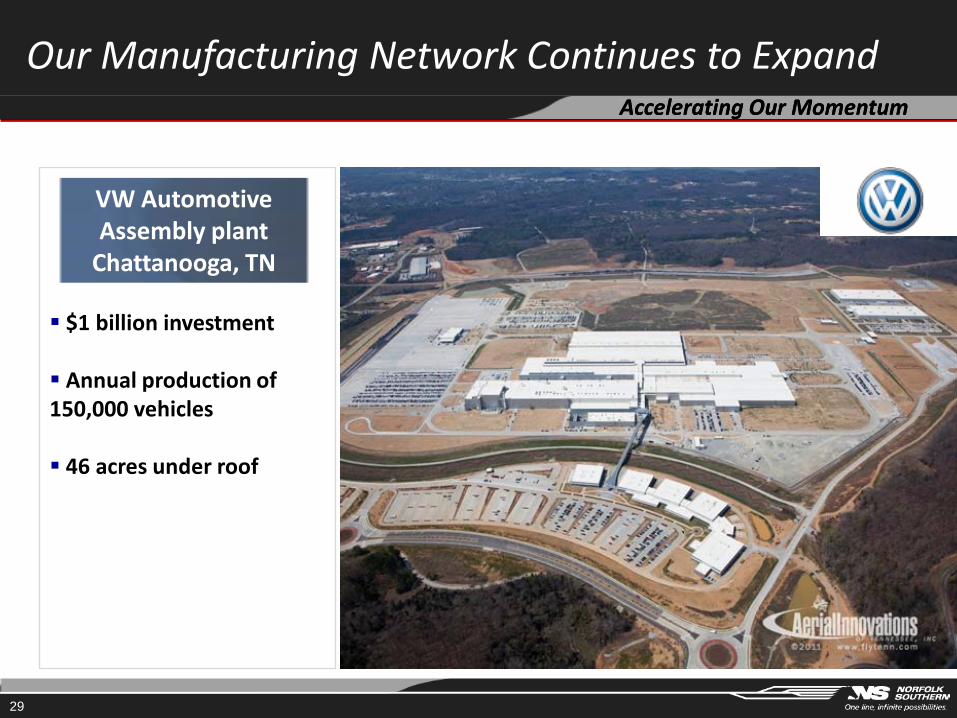
Our Manufacturing Network Continues to Expand
ThyssenKrupp Steel and Stainless USA,
Calvert, AL
28
Page 29
Accelerating Our MomentumAccelerating Our Momentum
Our Manufacturing Network Continues to Expand
29
$1 billion investment
Annual production of 150,000 vehicles
46 acres under roof
VW Automotive Assembly plant
Chattanooga, TN
Page 30
Accelerating Our MomentumAccelerating Our Momentum
Major Auto Projects
30
Our Manufacturing Network Continues to Expand
Page 31
Accelerating Our MomentumAccelerating Our Momentum
Our Manufacturing Network Continues to Expand
31
First Quality TissueAnderson, SC
$1 billion investment
1,000 new jobs
Among the “Top Ten Deals” for industrial development projects in North America in 2010
Page 32
Accelerating Our MomentumAccelerating Our Momentum
Our Manufacturing Network Continues to Expand
32
PBF Energy Partners, LP Delaware City, DE
$130 million reinvestment in the facility
Previously dormant refinery
Reopened due to increased demand for refinery production and byproducts
Page 33
Accelerating Our MomentumAccelerating Our Momentum
Biofuels and Energy Investments
Our Manufacturing Network Continues to Expand
33
Page 34
Accelerating Our MomentumAccelerating Our Momentum
34
Volume % ChangeYTD thru May vs. 2010
MetCon 3%
Chemicals (5%)
Paper (3%)
Automotive 15%
NS Manufacturing Network Flows
% of NS Mfg. 2010 Revenue
Auto18%
Paper19%
Chemicals35%
MetCon28%
Page 35
Accelerating Our MomentumAccelerating Our Momentum
Our Agriculture Network
Agriculture
NS serves more than 330 shippers and receivers of corn and soybeans
Extensive Ag network for domestic and export grain markets
Extensive supply chain support for ethanol producers and distributors
Projected rise in global demand
10 Year CAGR Revenue
8.1%
35
% of NS Agriculture2010 Revenue
Ethanol16%
Fertilizers10%
Sweeteners12%
Corn18%
Soybeans4%
Other40%
Page 36
A l ti O M tA l ti O M t
Our Unit GrainTrain Network Accelerating Our MomentumAccelerating Our MomentumTrain Network
NSNSUnit Grain TrainUnit Grain Train
NetworkNetwork
Shreveport
30 75‐Car Unit Train Receivers
44 75‐Car Unit Train Loaders
3636
Page 37
Accelerating Our MomentumAccelerating Our Momentum
Our Agriculture Network
Ethanol
74 terminals served
25 production plants in service territory
2.4 billion production gallons annually, 16% of U.S. demand
E15 long term growth
Yr. 2000-2005
Yr. 2005-2010
Carload Growth
2011 Three new NS
Terminals Opening in VA, TN
and PA
124%226%
37
Page 38
Accelerating Our MomentumAccelerating Our Momentum
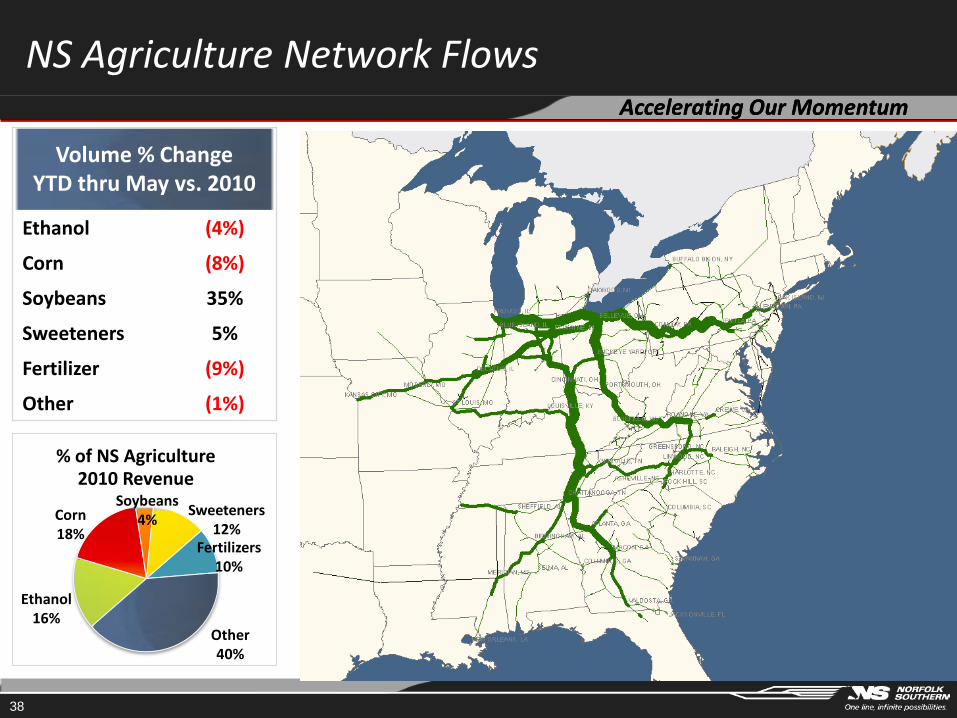
NS Agriculture Network Flows
Volume % ChangeYTD thru May vs. 2010
Ethanol (4%)
Corn (8%)
Soybeans 35%
Sweeteners 5%
Fertilizer (9%)
Other (1%)
38
% of NS Agriculture 2010 Revenue
Ethanol16%
Fertilizers10%
Sweeteners12%
Corn18%
Soybeans4%
Other40%
Page 39
Accelerating Our MomentumAccelerating Our Momentum
10 Year CAGR Revenue
4.8%
Our Intermodal Network
Intermodal
Extensive distribution network
97% of network cleared for doublestack
Public/private partnerships
Investment in key corridors and equipment
Terminal network supports East Coast and West Coast flows
39
% of NS Intermodal 2010 Revenue
International29%
Premium11%
Domestic42%
Triple Crown18%
Page 40
Accelerating Our MomentumAccelerating Our Momentum
U.S. Intermodal Year-over-Year Change in Units Since 2009
-40%
-30%
-20%
-10%
0%
10%
20%
30%
40%
Jan Mar May Jul Sep Nov Jan Mar May Jul Sep Nov Jan Mar
% Change in Units Y-o-Y Domestic International
2009 2010Source: IANA
2011
40
Page 41
Accelerating Our MomentumAccelerating Our Momentum
NS Domestic and International Intermodal Long-Term Growth
Source: NS traffic data
0
100,000
200,000
300,000
400,000
500,000
600,000Units Domestic Units International Units
41
Page 42
Accelerating Our MomentumAccelerating Our Momentum
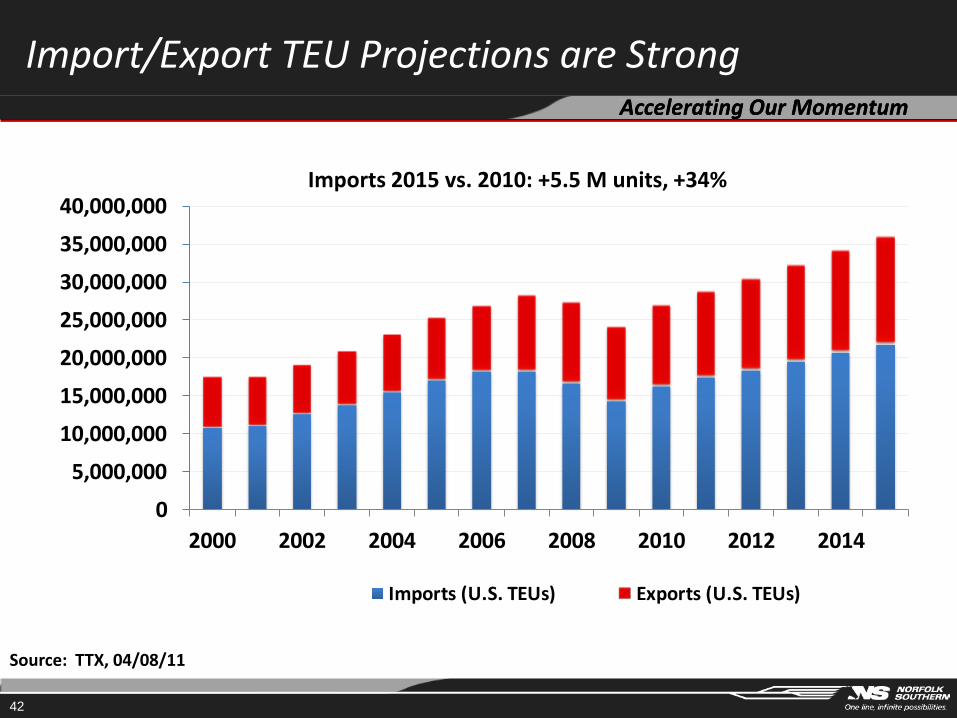
Import/Export TEU Projections are Strong
0
5,000,000
10,000,000
15,000,000
20,000,000
25,000,000
30,000,000
35,000,000
40,000,000
2000 2002 2004 2006 2008 2010 2012 2014
Imports (U.S. TEUs) Exports (U.S. TEUs)
Source: TTX, 04/08/11
Imports 2015 vs. 2010: +5.5 M units, +34%
42
Page 43
Accelerating Our MomentumAccelerating Our Momentum
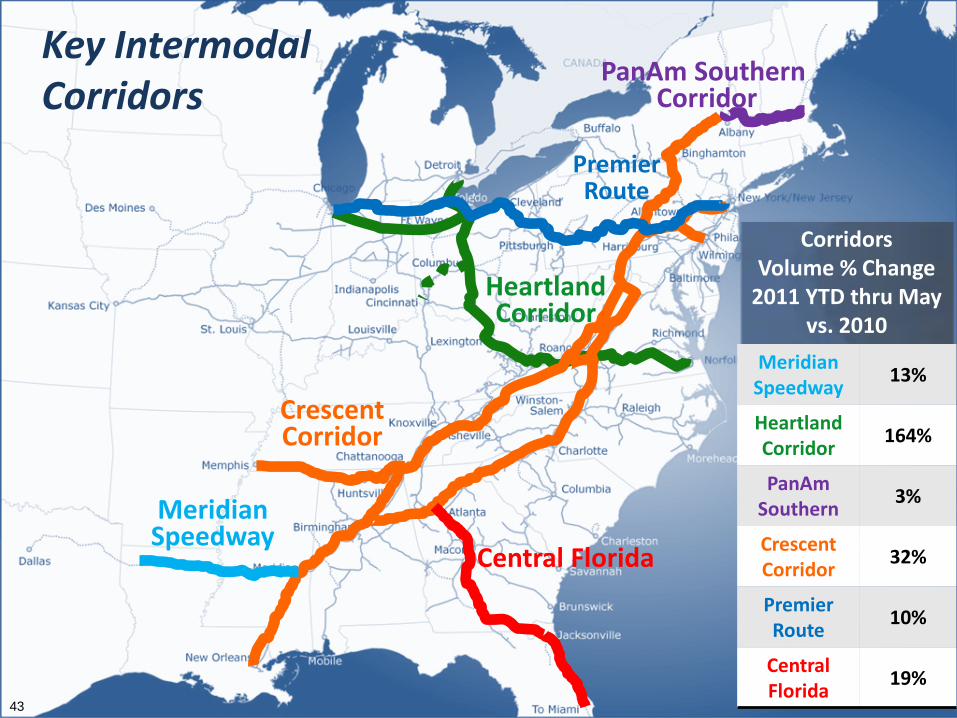
Key IntermodalCorridors
Corridors Volume % Change
2011 YTD thru Mayvs. 2010
Meridian Speedway
13%
HeartlandCorridor
164%
PanAmSouthern
3%
CrescentCorridor
32%
Premier Route
10%
Central Florida
19%
HeartlandCorridor
CrescentCorridor
MeridianSpeedway
PanAm Southern Corridor
43
Central Florida
PremierRoute
Page 44
Accelerating Our MomentumAccelerating Our Momentum
Key IntermodalCorridors
MeridianSpeedway
44
MeridianSpeedway
JV with KCS
NS investment of $300 million
Fastest route LA to Atlanta (4 days)
Volume up 13% YTD thru May 2011
Domestic and international growth
Page 45
Accelerating Our MomentumAccelerating Our Momentum
Key IntermodalCorridors
HeartlandCorridor
45
HeartlandCorridor
Completed in Sept. 2010
Total investment $191 million (NS 51%, 49% public)
Reduced over 200 route miles
Volume up 164% YTD thru May 2011
Port, corridor, and terminals ready for big ships NOW
MeridianSpeedway
Page 46
Accelerating Our MomentumAccelerating Our Momentum
Key IntermodalCorridors
HeartlandCorridor
MeridianSpeedway
PanAm Southern Corridor
46
PanAm SouthernCorridor
JV with PanAmRailway
Initial investment $140 million
Direct access to Boston & New England markets
Volume up 3% YTD thru May 2011
Mechanicville / Albany terminal under construction
Efficient intermodal terminal at Ayer, MA
Page 47
Accelerating Our MomentumAccelerating Our Momentum
Key IntermodalCorridors
HeartlandCorridor
CrescentCorridor
47
PanAm Southern Corridor
CrescentCorridor
Largest NS corridor project
Total investment $599 million (NS 55%, public 45%)
Targets I-81 and I-40 truck corridors
Volume up 32% YTD thru May 2011
4 new terminals under construction
MeridianSpeedway
Page 48
Accelerating Our MomentumAccelerating Our Momentum
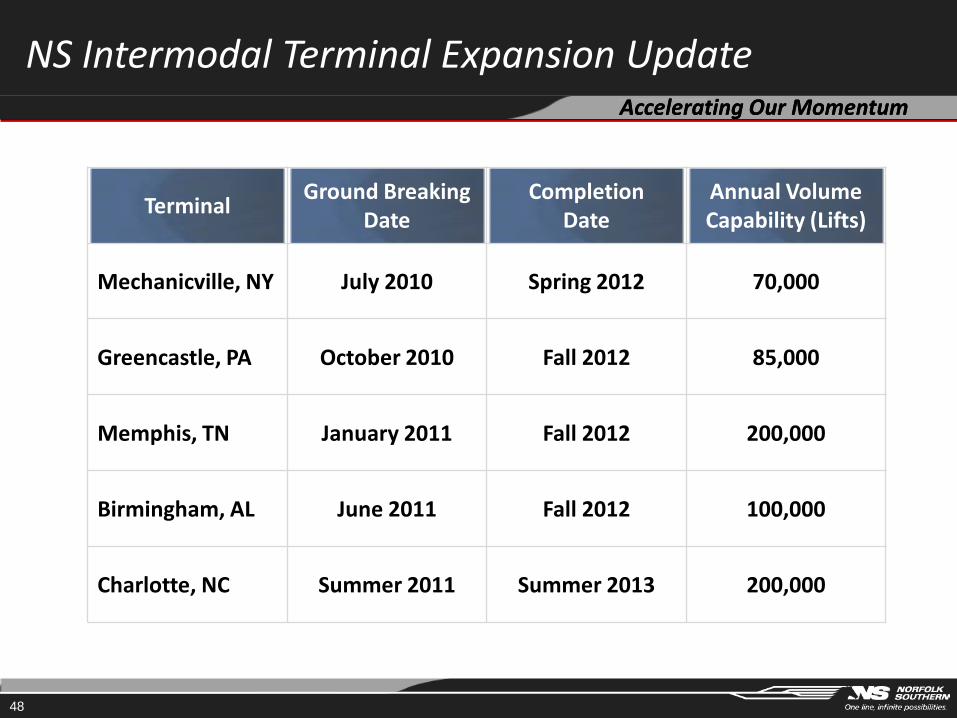
TerminalGround Breaking
DateCompletion
DateAnnual Volume Capability (Lifts)
Mechanicville, NY July 2010 Spring 2012 70,000
Greencastle, PA October 2010 Fall 2012 85,000
Memphis, TN January 2011 Fall 2012 200,000
Birmingham, AL June 2011 Fall 2012 100,000
Charlotte, NC Summer 2011 Summer 2013 200,000
48
NS Intermodal Terminal Expansion Update
Page 49
Accelerating Our MomentumAccelerating Our Momentum
Volume % ChangeYTD thru May vs. 2010
Domestic 17%
International 2%
49
NS Intermodal Network Flows
Chicago
Golden Triangle volume represents
approx. 90% of total NS Intermodal
volume
Harrisburg
Atlanta
% of NS Intermodal 2010 Revenue
International29%
Premium11%
Domestic42%
Triple Crown18%
Page 50
Accelerating Our MomentumAccelerating Our Momentum
Market and volume growth across all markets
Collaboration with supply chain partners in support of
manufacturing resurgence
Collaboration with key global trade partners in support of continued
international bulk and intermodal growth
Strategic investments in network and terminals to support
profitable growth
Pricing to the market, exceeding rail inflation
Long-Term Business Focus and Strategy
50
Page 51
Accelerating Our MomentumAccelerating Our Momentum
Thank You
51