37
Business Case June 1993
| Date post: | 27-Dec-2015 |
| Category: |
Documents |
| Upload: | alan-williamson |
| View: | 216 times |
| Download: | 1 times |

Business Case
June 1993

Presentations 04/19/23 @ 13:36 - 2 -
BUSINESS CASE
Content
• Objective
• Approach and Assumptions
• Project Impact
– Quantifiable benefits
· Revenue enhancement
· Cost reduction
· Asset reduction
– Non- quantifiable benefits
– Intangible benefits
• Appendix
Presentations 04/19/23 @ 13:36 - 3 -
BUSINESS CASE
Objective
To begin to estimate the timing and sequence of benefits during implementation
To establish a logical business justification for change
To create a rationale for making the tough decisions and staying on track after the emotion of discovery has worn off and the challenges of implementation set in

Presentations 04/19/23 @ 13:36 - 4 -
BUSINESS CASE
Approach and Assumptions
The goal is to overachieveThe goal is to overachieve
• Financial information was gathered from
– 1988 to 1992 Budgets
– 1988 to 1992 Financial Reports (Actuals)
– 1993 YTD Financial Report
– 1993 Budget
• Benefits are quantified conservatively by design
• Margin for revenue enhancement opportunities is 40%
• Weighted average cost of capital is assumed to be 18%
• Benefits include U.S. and W.R.C. only and does not include Seeds or Canada

Presentations 04/19/23 @ 13:36 - 5 -
BUSINESS CASE
The Project will yield Quantifiable, Non-quantifiable and Intangible Benefits
Asset Reduction Margin Contribution
Cost Reduction
CarryingCosts
LowerAccountsreceivable
Finished Goods Inventory
DealerInventory
Improved Productivityfrom effective
teamwork
Strategic Value Of PD&I
WIP & Finished Goods Inventory
CustomerFocus
EmployeeMorale
Intangible
ReducedFrustration
ProductFocus Improved
Team work Culture
Customersatisfaction
Raw Material Inventory
Maintenance Productivity SAP Implementation
Sales Productivity
ManufacturingProductivity
Enhanced Revenue
MaintenanceSupplies
Procurement PD&I and Customer Service
Rework
Qua
ntifi
ed
Non-
QuantRevenuesassociatedwith cycle time reduction

Presentations 04/19/23 @ 13:36 - 6 -
BUSINESS CASE
Asset Reduction Benefits Come From Reduced Plant And Finished Goods Inventory and Amount To $49 Million
• Cold Creek $6.2 M– Raw– WIP– Maintenance
• Bayport $0.9 M– Raw– Maintenance
• Omaha $1.2 M– WIP– Maintenance
• St. Gabriel $0.7 M
– WIP
• Reduction in Finished Goods Inventory $40.0 M
Total Asset Reduction Benefit $ 49.0 M
Verified by Larry Lapple, Joe Gallagher and Jim Wissmiller

Presentations 04/19/23 @ 13:36 - 7 -
BUSINESS CASE
Cost Reduction Benefits Come From Several Areas And Range From $18 Million to $25 Million
Manufacturing - Productivity Improvement
Market Impact - Carrying cost of FG Inventory and faster title transfer
PD&I - Reducing backup projects, formulation tests
Order processing - Containers, sub optimal shipping
S.A.P. & I.T. - Productivity
Infrastructure - Productivity
Procurement - Process Improvement
$1.4 M - $1.8 M
$8.6 M - $10.0 M
$1.3 M
$0.6 M
$1.7 M
$1.0 M - $1.3 M
$4.1 M - $8.5 M
$18.7 M - $25.2 MTotal Cost Reduction Benefit
Verified by Joe Gallagher, Joe Powell, Larry Lapple, Carol Johnson, Al Willard, and Stanley Oliver

Presentations 04/19/23 @ 13:36 - 8 -
BUSINESS CASE
Quantification of Potential Sales Revenue From all Activities
1994 vs. 93 1995 vs. 93
RevenueIncrease (budget)
+$64M +$135M
Target AmountBelieved Possible
$100M $150M
Net Incremental RevenuePotential From:
(At 40% Margin)• Increased volume of ‘Force’• Increased volume of ‘Reflex’• Additional TSR’s• 20% TSR efficiency increase• ‘Karate’ labels• Re-engineering• Other registration• Sales tools
$14M $6M
$36M $15M
Verified by Keelan Pulliam (?) and Jim Wissmiller
Expected margin benefit = $0 - 20 MExpected margin benefit = $0 - 20 M
Presentations 04/19/23 @ 13:36 - 9 -
BUSINESS CASE
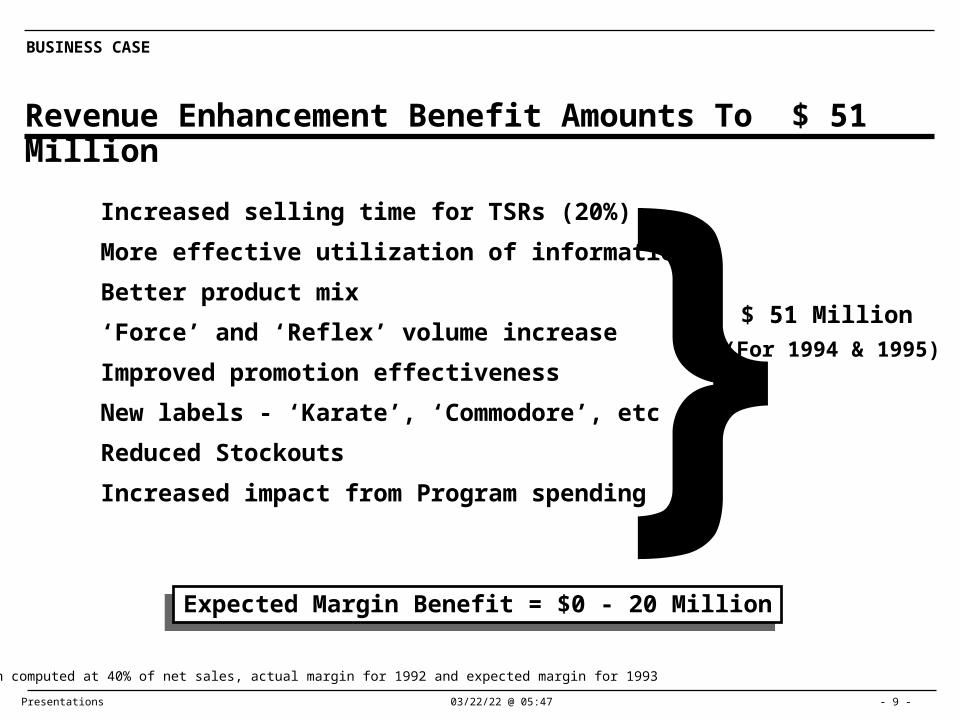
Revenue Enhancement Benefit Amounts To $ 51 Million
Increased selling time for TSRs (20%)
More effective utilization of information
Better product mix
‘Force’ and ‘Reflex’ volume increase
Improved promotion effectiveness
New labels - ‘Karate’, ‘Commodore’, etc
Reduced Stockouts
Increased impact from Program spending
Expected Margin Benefit = $0 - 20 MillionExpected Margin Benefit = $0 - 20 Million
Margin computed at 40% of net sales, actual margin for 1992 and expected margin for 1993
$ 51 Million}(For 1994 & 1995)
Presentations 04/19/23 @ 13:36 - 10 -
BUSINESS CASE
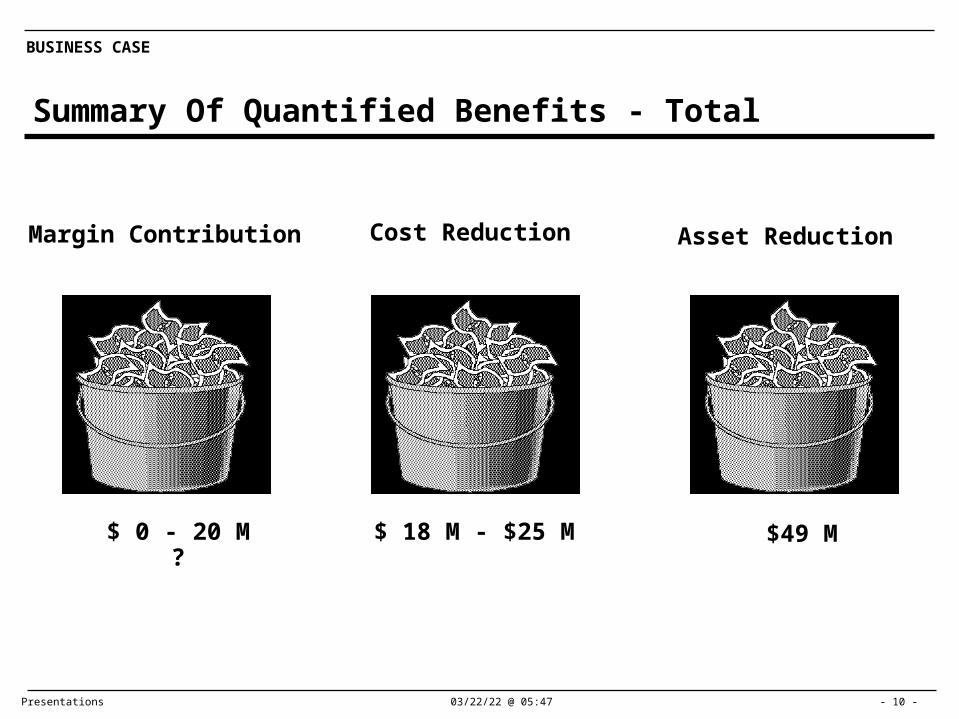
Summary Of Quantified Benefits - Total
Cost Reduction Asset ReductionMargin Contribution
$ 18 M - $25 M $49 M$ 0 - 20 M?

Presentations 04/19/23 @ 13:36 - 11 -
BUSINESS CASE
Quantified Benefits
Margin Contribution Target For 1994 & 1995 (Revenue enhancement - $51M)
Cost Reduction
Asset Reduction
U.S. U.K.
$ 0 - 20 M
$ 8 M - $14 M $ 10 - 11 M
$ 41 M $ 8 M

Presentations 04/19/23 @ 13:36 - 12 -
BUSINESS CASE
Non - Quantifiable Benefits (External Focus Benefits)
• Enhanced customer satisfaction
• Improved productivity from effective team work, communications
• Enhanced strategic value of Product Development
• Revenues associated with cycle time reduction and earlier time to market
• Better decision making from timely and effective information
• Focusing initiatives

Presentations 04/19/23 @ 13:36 - 13 -
BUSINESS CASE
Intangible Benefits (Internal Focus Benefits)
• Reduced frustration and complexity throughout the organization
• Ability to focus on customers and products
• Improved teamwork and cohesiveness of the executive management team
• Increased employee morale
• A foundation and beginning of a new culture
• Clearer roles / responsibilities, accountabilities and authority levels throughout the organization
• Effective and consistent decision making throughout all levels of the organization
• Motivation and movement in one clear strategic direction

Presentations 04/19/23 @ 13:36 - 14 -
BUSINESS CASE
0
20
40
60
80
100
1993 1994 1995
Project Benefits Have Significant Impact on RONA
* Target for 1995
Source for base line 1993- 1995 RONA: FMG April 1993
RONA Contribution ($M)
Avg Net Assets
RONA,%
25%
33%
45%40%
50%
Additional cost of redeployment and POS is not known and not included
*
Total
67
268
96
290
119
266
116
290
131
264
Presentations 04/19/23 @ 13:36 - 15 -
BUSINESS CASE
0
20
40
60
80
100
1993 1994 1995
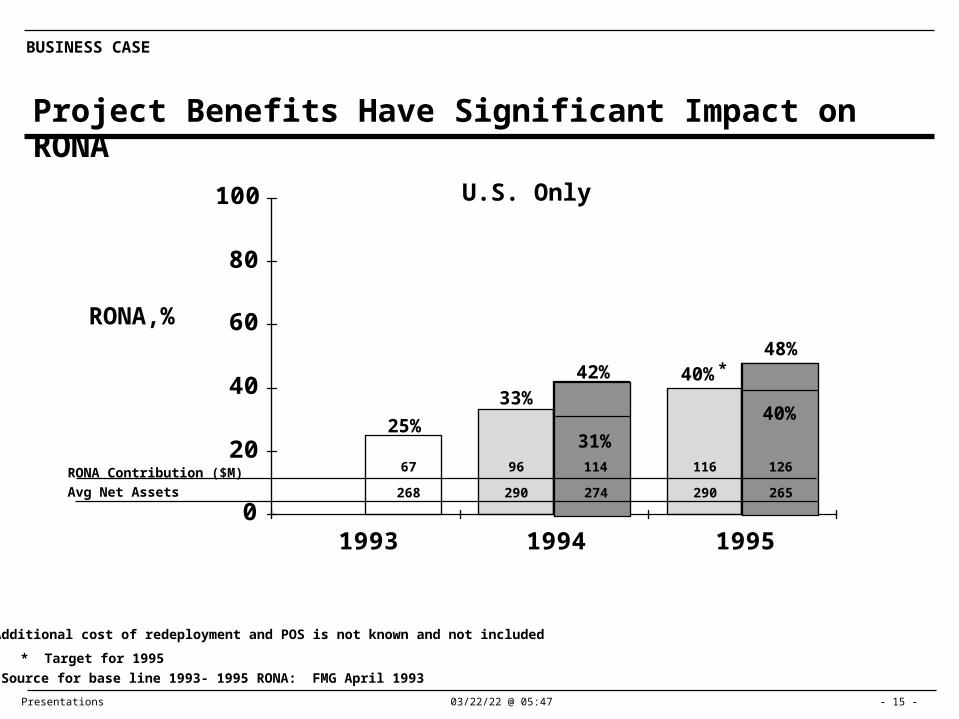
Project Benefits Have Significant Impact on RONA
* Target for 1995
Source for base line 1993- 1995 RONA: FMG April 1993
RONA Contribution ($M)
Avg Net Assets
RONA,%
25%
33%42%
31%
40%48%
40%
Additional cost of redeployment and POS is not known and not included
*
U.S. Only
67
268
96
290
114
274
116
290
126
265
Presentations 04/19/23 @ 13:36 - 16 -
BUSINESS CASE
1993 Benefit Of $ 200,000 Comes From Procurement
• Procurement $0.2 M
Areas Benefits Realizable in 1993
Presentations 04/19/23 @ 13:36 - 17 -
BUSINESS CASE
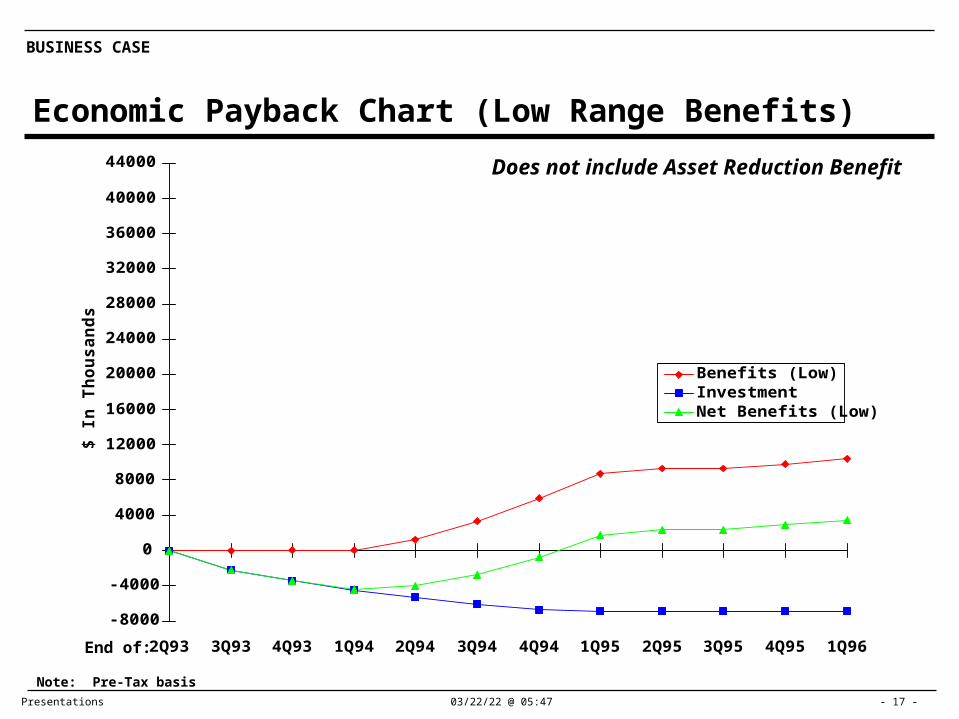
Economic Payback Chart (Low Range Benefits)$
In
Th
ou
sa
nd
s
-8000
-4000
0
4000
8000
12000
16000
20000
24000
28000
32000
36000
40000
44000
2Q93 3Q93 4Q93 1Q94 2Q94 3Q94 4Q94 1Q95 2Q95 3Q95 4Q95 1Q96
Benefits (Low)InvestmentNet Benefits (Low)
End of:
Note: Pre-Tax basis
Does not include Asset Reduction Benefit

Presentations 04/19/23 @ 13:36 - 18 -
BUSINESS CASE
Economic Payback Chart (High Range Benefits)$
In
Th
ou
sa
nd
s
-8000
-4000
0
4000
8000
12000
16000
20000
24000
28000
32000
36000
40000
44000
2Q93 3Q93 4Q93 1Q94 2Q94 3Q94 4Q94 1Q95 2Q95 3Q95 4Q95 1Q96
Benefits (High)InvestmentNet Benefits (High)
End of:
Note: Pre-Tax basis
Does not include Asset Reduction Benefit

Presentations 04/19/23 @ 13:36 - 19 -
BUSINESS CASE
Accounting Payback Chart (Low Range Benefits Without Interest)
$ In
Th
ou
sa
nd
s
-8000
-4000
0
4000
8000
12000
16000
20000
24000
28000
32000
36000
40000
44000
2Q93 3Q93 4Q93 1Q94 2Q94 3Q94 4Q94 1Q95 2Q95 3Q95 4Q95 1Q96
Benefits (Low)InvestmentNet Benefits (Low)
End of:
Note: Pre-Tax basis
Does not include Asset Reduction Benefit

Presentations 04/19/23 @ 13:36 - 20 -
BUSINESS CASE
Accouting Payback Chart (High Range Benefits Without Interest)
$ In
Th
ou
sa
nd
s
-8000
-4000
0
4000
8000
12000
16000
20000
24000
28000
32000
36000
40000
44000
2Q93 3Q93 4Q93 1Q94 2Q94 3Q94 4Q94 1Q95 2Q95 3Q95 4Q95 1Q96
Benefits (High)InvestmentNet Benefits (High)
End of:
Note: Pre-Tax basis
Does not include Asset Reduction Benefit

Presentations 04/19/23 @ 13:36 - 21 -
BUSINESS CASE
Project Investment
Professional fees $5.1 M
Expense $1.8 M
Total investment $6.9 M
Investment in Gemini
Presentations 04/19/23 @ 13:36 - 22 -
BUSINESS CASE
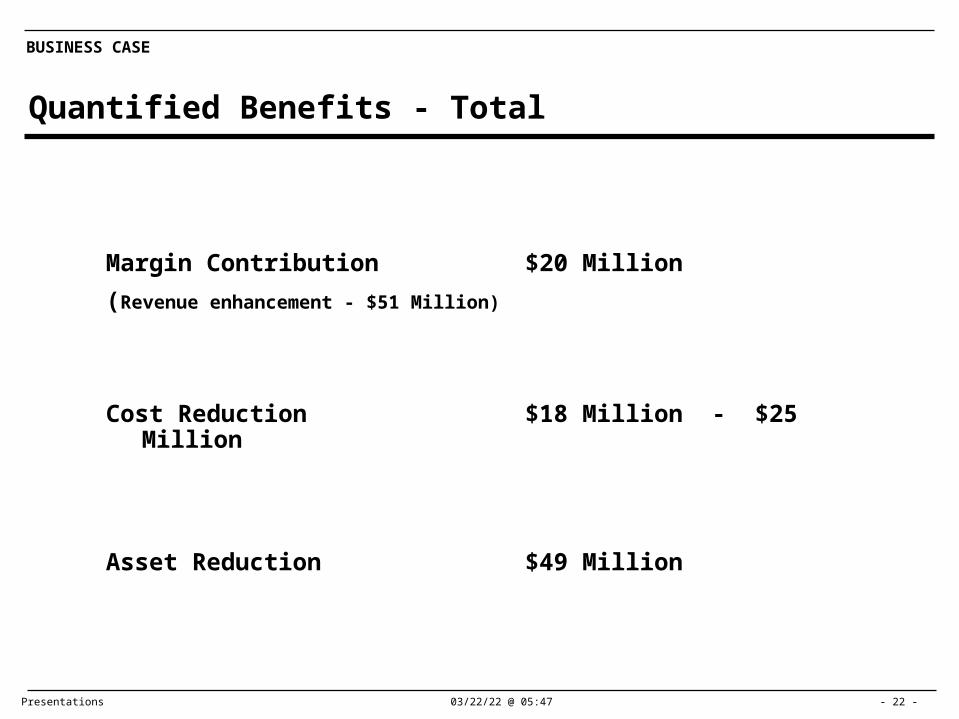
Quantified Benefits - Total
Margin Contribution $20 Million
(Revenue enhancement - $51 Million)
Cost Reduction $18 Million - $25 Million
Asset Reduction $49 Million

Presentations 04/19/23 @ 13:36 - 23 -
BUSINESS CASE
• Re-engineering benefits– Margin enhancement – 0-14.0 0-6.0 0-20.0– Cost reduction – 5.9-9.9 2.7-4.0 8.6–
13.9– 5.9-23.9 2.7-10.0 8.6-33.9
• Savings budgeted– Strategy (streamline) 0.5 4.0 – 4.0– Purchasing 0.5 1.4 – 1.4– Strategy (formulation) – 0.9 – 0.9– Woods, Pink agreement 0.2 0.2 – 0.2
1.2 6.5 – 6.5
• Re-engineering benefits– Asset reduction – 16.0 25.0 41.0
– 16.0 25.0 41.0• Savings budgeted
– Streamline 30 (ETR)* 10 (ETR) 10(ETR) 20 (ETR)
Reconciliation Of Benefits With Budget ($ in Millions)
Total
U.S. P&L Impact
U.S. B/S Impact
• ETR as of 1Q93
Note: Cummulative U.K. P&L impact of $10M - $11M and B/S impact of $8M is not recongized
Total
1993 1994 1995 Cumm
Total

Presentations 04/19/23 @ 13:36 - 24 -
BUSINESS CASE
• Re-engineering benefits– Margin enhancement – 0-14.0 0-6.0 0-20.0– Cost reduction – 10.0-15.4 8.5-9.8 18.6-25.2
– 10.0-29.4 8.5-15.8 18.5-45.2• Savings budgeted
– Strategy (streamline) 0.5 4.0 – 4.0– Purchasing 0.5 1.4 – 1.4– Strategy (formulation) – 0.9 – 0.9– Woods, Pink agreement 0.2 0.2 – 0.2
1.2 6.5 – 6.5
• Re-engineering benefits– Asset reduction – 24.0 25.0 49.0
– 24.0 25.0 49.0• Savings budgeted
– Streamline 30 (ETR)* 10 (ETR) 10(ETR) 20 (ETR)
Reconciliation Of Benefits With Budget - Total ($ in Millions)
Total
Total P&L Impact
Total B/S Impact
• ETR as of 1Q93
Total
1993 1994 1995 Cumm
Total
Presentations 04/19/23 @ 13:36 - 25 -
BUSINESS CASE
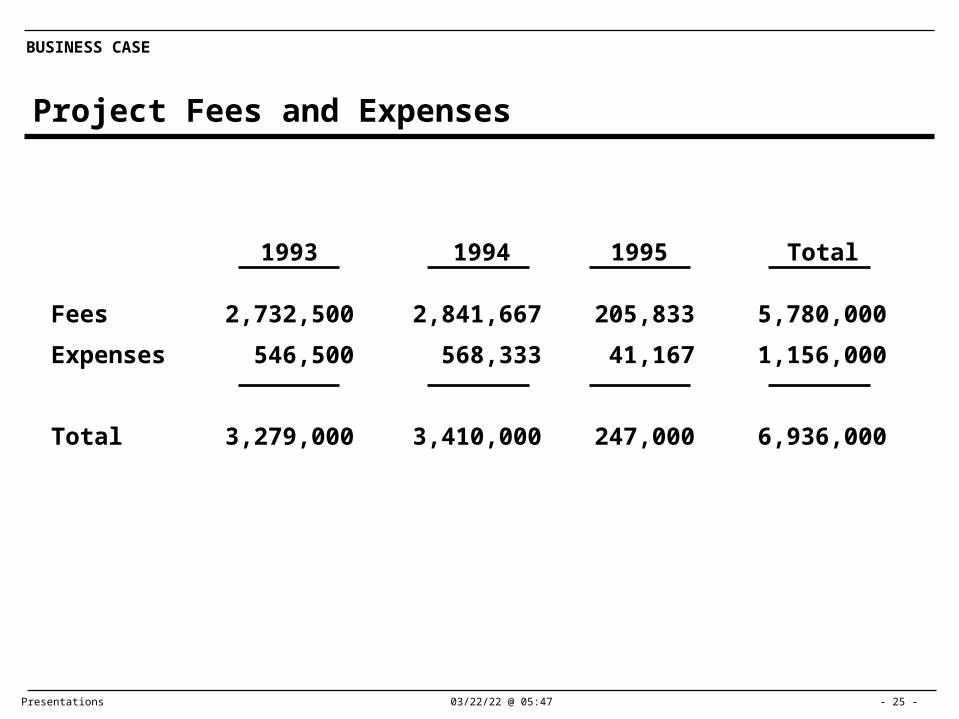
Project Fees and Expenses
Fees
Expenses
Total
2,732,500
546,500
3,279,000
2,841,667
568,333
3,410,000
205,833
41,167
247,000
5,780,000
1,156,000
6,936,000
1993 1994 1995 Total

Appendix
Presentations 04/19/23 @ 13:36 - 27 -
BUSINESS CASE
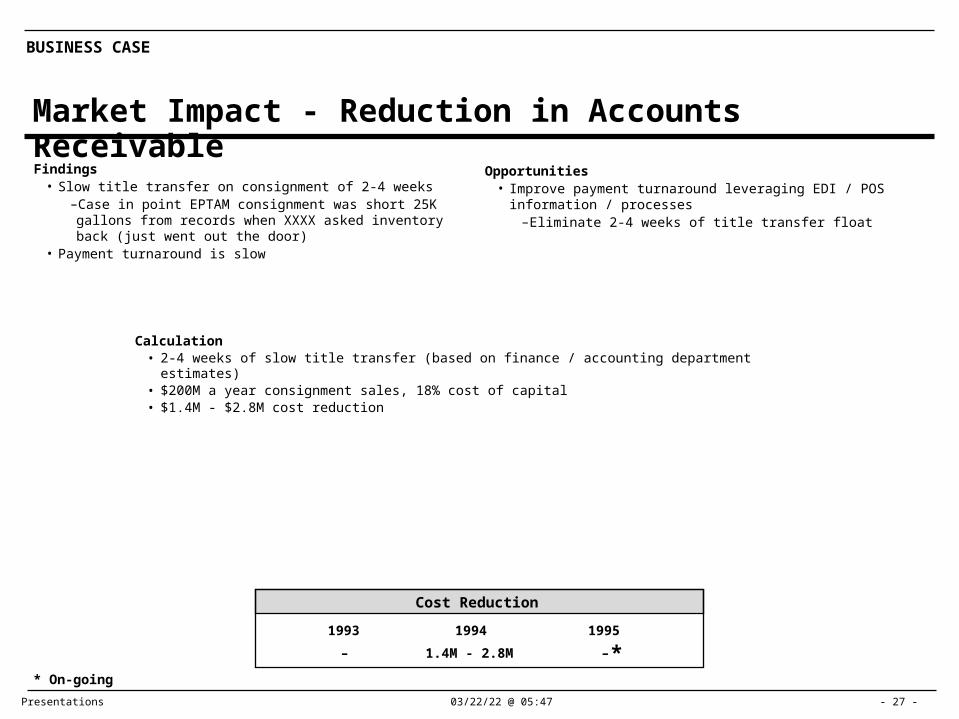
Market Impact - Reduction in Accounts Receivable
Calculation• 2-4 weeks of slow title transfer (based on finance / accounting department estimates)• $200M a year consignment sales, 18% cost of capital• $1.4M - $2.8M cost reduction
Findings• Slow title transfer on consignment of 2-4 weeks
–Case in point EPTAM consignment was short 25K gallons from records when XXXX asked inventory back (just went out the door)
• Payment turnaround is slow
Opportunities• Improve payment turnaround leveraging EDI / POS information /
processes–Eliminate 2-4 weeks of title transfer float
1.4M - 2.8M–
Cost Reduction
1994 19951993
– ** On-going

Presentations 04/19/23 @ 13:36 - 28 -
BUSINESS CASE
Market Impact - Revenue Enhancement
Calculation• TSR’s expect (sales survey) 12% sales increase based on 20% more selling time. $460M sales, yield $55M
sales increase• DSM expect $45M to $85M sales increase based on better targeting, optimized product mix, and automation.
$85M is best case estimate. $45M is average of best case and most likely and worst case ÷ 3• Industry report sales increase range of 10% - 25% based on POS implementation. $460M sales = $45M - $115M
sales increase
Findings• 60% of TSR’s felt they were not effectively focused on the most
attractive target groups• 73% of TSR’s felt that XXXX was not the superior performer in
delivering value to the market place• TSR’s expect 12% sales increase with more selling time• DSM expect sales increase of 10% - 18% with POS implementation
–Better targeting–Better product mix–Lower administration time
• XXXX can not measure impact of advertisements and promotions• XXXX does not have sufficient detailed product demand patterns• Sales reps and customers suggest that the dealer programs are
overly complex and diffused as an incentive
Opportunities• Focus for more selling time from sales force• Better, faster and more complete user information for targeting efforts• Optimize product mix• Fewer stockouts, product delays• Reallocation of program budgets• Improve promotion effectiveness• Improve product introduction effectiveness
Revenue Enhancement
1994 19951993
Rev. Increase
Margin Increase
* On-going
–
–
$32M
$13M
$19M
$7M
**
**
Presentations 04/19/23 @ 13:36 - 29 -
BUSINESS CASE
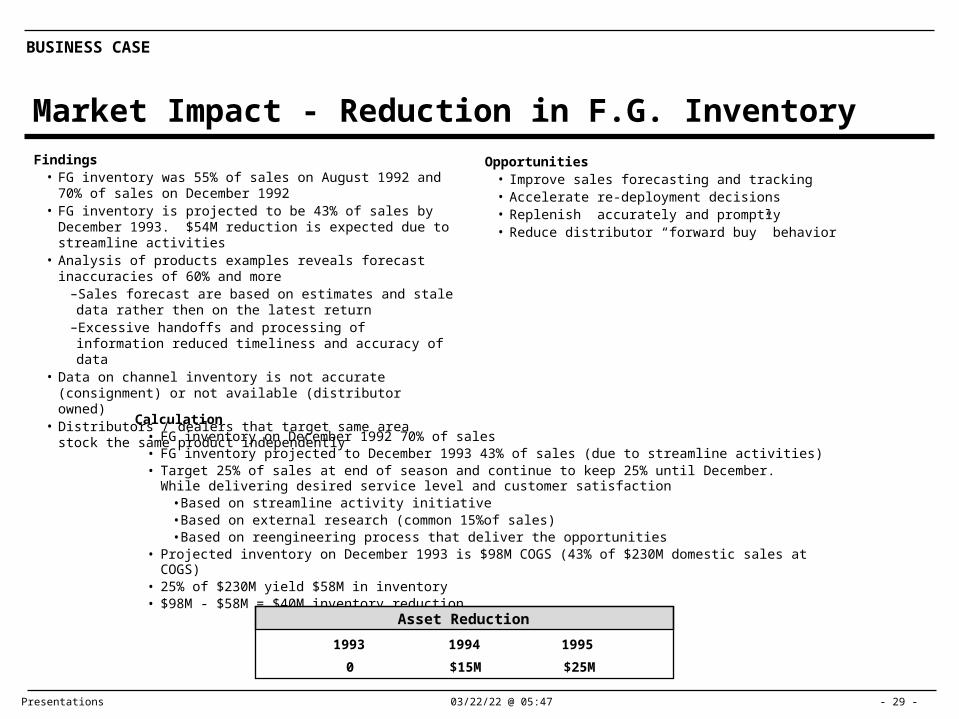
Market Impact - Reduction in F.G. Inventory
Calculation• FG inventory on December 1992 70% of sales• FG inventory projected to December 1993 43% of sales (due to streamline activities)• Target 25% of sales at end of season and continue to keep 25% until December. While delivering desired
service level and customer satisfaction• Based on streamline activity initiative• Based on external research (common 15%of sales)• Based on reengineering process that deliver the opportunities
• Projected inventory on December 1993 is $98M COGS (43% of $230M domestic sales at COGS)• 25% of $230M yield $58M in inventory• $98M - $58M = $40M inventory reduction
Findings• FG inventory was 55% of sales on August 1992 and 70% of sales
on December 1992• FG inventory is projected to be 43% of sales by December 1993.
$54M reduction is expected due to streamline activities• Analysis of products examples reveals forecast inaccuracies of
60% and more–Sales forecast are based on estimates and stale data rather then on the latest return
–Excessive handoffs and processing of information reduced timeliness and accuracy of data
• Data on channel inventory is not accurate (consignment) or not available (distributor owned)
• Distributors / dealers that target same area stock the same product independently
Opportunities• Improve sales forecasting and tracking• Accelerate re-deployment decisions• Replenish accurately and promptly• Reduce distributor “forward buy” behavior
Asset Reduction
$15M $25M0
1994 19951993

Presentations 04/19/23 @ 13:36 - 30 -
BUSINESS CASE
Market Impact – Inventory Carrying Cost of Reduced F.G. Inventory
Calculation• $40M inventory asset reduction, 18% cost of capital
Findings• XXXX finances the entire channel• Non selling activities account for 42% of TSR’s time• Main non selling activities
•Paper work•Program administration •Processing mail
• CSR spent significant time allocating inventory• CSR operates in crisis mode to satisfy customers on demanded
products while other products are idle (e.g., high inventory levels)• XXXX’s product portfolio is one of the largest, but individual product
profitability is the lowest of the major competitor’s• Product mix inaccuracies cause excessive rework• Product mix opportunities are significant in mature products (e.g.,
Eradicame, Dyfonate, Sutam)
Opportunities• Reduction in inventory carrying cost• Reduce admin expense associated with dealer programs• Reduce customer service expense• Rationalize product portfolio• Reduce rework
Cost Reduction
$2.7M $4.5M0
1994 19951993

Presentations 04/19/23 @ 13:36 - 31 -
BUSINESS CASE
Manufacturing - Plant Inventory
Calculation• Increase Cold Creek raw material turns from 13.4 to 20 ($5.2 - $3.6 = $1.6)• Decrease average work-in-process at St. Gabriel by 50% ($1.3 x 50.% = $0.7)• Increase Cold Creek work-in-process turns from 9.3 to 12 turns ($18.5 - $14.3 = $4.2)• Decrease Omaha work-in-process by 4 days supply (20% x $6.6 = $1.2)• Increase turns of viable maintenance parts inventory from 1.4 to 3 ($0.8 - $0.4 = $0.4)• Decrease Bayport safety stocks of Pyaidivc, Sodium, and MLCI by 10 days or $0.9 million
Findings• Low turns in raw material• High work-in-process inventory• Slow turning maintenance inventory• High pre-mix inventory at St. Gabriel
Opportunities• Reduce safety stocks of raw materials• Increase equipment reliability to support higher production rates and
reduce lead time and reduce work-in-process• Clean-up rework and packaging inventory at formulation plants• Accelerate flow of pre-mix at St. Gabriel
Inventory Reduction
Carrying Cost
1994 19951993
$7.1M –One-Time
$0.3M
$1.9M
$1.6M –**
* On-going

Presentations 04/19/23 @ 13:36 - 32 -
BUSINESS CASE
Manufacturing – Productivity Improvement
• Omaha reduce FG rework by 25%• .25 x $.400 (annual expense) = .100
• Omaha shift avoidance (direct labor saving)• $800 per shift x 391 avoided shifts = .300
• Eliminate 7 rail cars by accelerating flow of AI’s - $75,000
Findings• Contract services are currently used to perform maintenance
services while full time employees are idle• NLR plant downtime impacts operator productivity• Cold Creek plant downtime impacts operator productivity• Significant finished goods rework at Omaha• Omaha continuous unit and Canner downtime impacts operator
productivity
Opportunities• Improve Cold Creek maintenance effectiveness by utilizing full time
employees to complete work now done by contractors• Increase operator productivity at NLR through increased uptime and
throughput of product• Increase operator productivity at Cold Creek through increased uptime
and throughput of product• Avoid rework of finished goods at Omaha by formulating and
packaging close to market demand• Increase throughput at Omaha of continuous unit output to 140,000
pounds per shift and canners to 8000 gallons per shift
Cost Reduction
$1.5M–
19941993
Calculation• 50% contract services could be picked up by Cold Creek staff
• $1,712 (actual 1992) x .50 = $856• 50% contract services is material
• $856 x .50 = $428• NRL operator productivity valued at
• 15 - 20X x 12 = 1.8 - 2.4• 1.8 x $45,700 = $.082• 2.4 x $45,700 = $.110
• Cold Creek operator productivity valued at• 10 - 20% x 94 operators• 9.0 x $46,800 = $.421• 18.0 x 46,800 = $.842
$0.3M
1995
* ** On-going

Presentations 04/19/23 @ 13:36 - 33 -
BUSINESS CASE
Procurement
Findings• Raw material cost rising as a percent of sales• Over 100 supplies with purchases less than $100,00 annually• Costly process for purchasing MRO and WRC supplies• Communications and plant coordinations issues• Complex packaging buying process
Opportunities• Streamline packaging procurement and graphics change process• Simplify MRO / supplies procurement• Concentrate more time on vendor development and selection
Cost Reduction
$0.3M–
19941993
Calculation
• Raw material 1.5% x $142mm = $2.1
• U.K. purchasing 1.5% x $83mm = $1.2
• Packaging 3.0% x $13mm = $0.4
• WRC 2.0% x $12mm = $0.2
MRD 6.0% x $4mm = $0.2
$0.3M
1995
* ** On-going
Presentations 04/19/23 @ 13:36 - 34 -
BUSINESS CASE
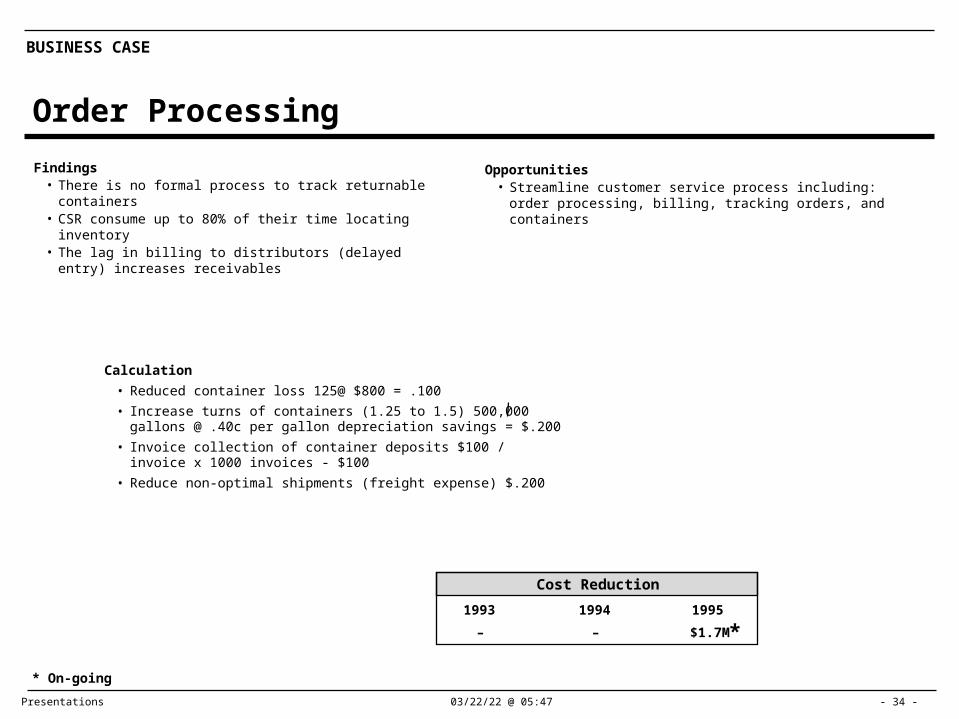
Order Processing
Findings• There is no formal process to track returnable containers• CSR consume up to 80% of their time locating inventory• The lag in billing to distributors (delayed entry) increases
receivables
Opportunities• Streamline customer service process including: order processing,
billing, tracking orders, and containers
Cost Reduction
––
19941993
Calculation
• Reduced container loss 125@ $800 = .100
• Increase turns of containers (1.25 to 1.5) 500,000 gallons @ .40c per gallon depreciation savings = $.200
• Invoice collection of container deposits $100 / invoice x 1000 invoices - $100
• Reduce non-optimal shipments (freight expense) $.200
$1.7M
1995
*
* On-going
Presentations 04/19/23 @ 13:36 - 35 -
BUSINESS CASE
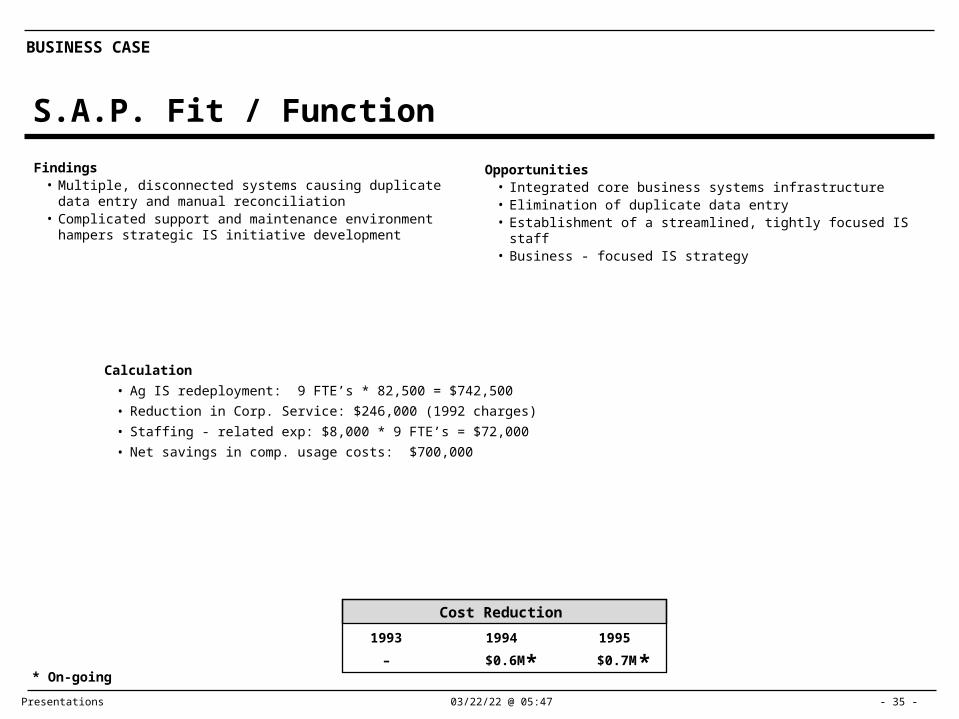
S.A.P. Fit / Function
Findings• Multiple, disconnected systems causing duplicate data entry and
manual reconciliation• Complicated support and maintenance environment hampers
strategic IS initiative development
Opportunities• Integrated core business systems infrastructure• Elimination of duplicate data entry• Establishment of a streamlined, tightly focused IS staff• Business - focused IS strategy
Cost Reduction
19941993
Calculation
• Ag IS redeployment: 9 FTE’s * 82,500 = $742,500
• Reduction in Corp. Service: $246,000 (1992 charges)
• Staffing - related exp: $8,000 * 9 FTE’s = $72,000
• Net savings in comp. usage costs: $700,000
$0.7M
1995
– $0.6M * ** On-going

Presentations 04/19/23 @ 13:36 - 36 -
BUSINESS CASE
Product Development and Introduction
Findings• Work priorities of existing projects are not re-prioritized regularly
causing unnecessary expense on potentially discontinued projects• Excessive back-up formulations projects cause added work efforts
to compensate for complex approval process• Insufficient level of commercial / technical group coordination
causes•Unnecessary effort spent on questionable formulation projects•Formulation rework
Opportunities• How to identify costly, unrealistic projects early in the process before
investing significant effort• How to minimize development of back-up formulations which involves
formulation / repackaging as well as field trail effort• How to integrate technical input into commercial business cases early
in project planning process to establish feasibility, ownership and accountability for project decisions
Cost Reduction
19941993
Calculation• 14 man-months per year can be saved (based on Fusilade, Reflex, Karate examples)• $200K (overhead dollars) can be saved in formulations effort
• $200K savings in overheaded dollars equals• $125K savings in direct dollars (overhead not included)
• Savings = 25% of evaluation trials on formulations of established products• Yearly average = 800 - 900 trails total• 256 trials are “evaluation” formulations of established products, in 1992• Savings = 25% of 256 trails = 64 trials• $960k potential savings on evaluation efficacy trails based on $15k / trail
• $960k savings in overheaded dollars equals• $760K savings in direct dollars (overhead not included)
• 0.5 project per year• 50% success rate on new technology project• 66% of failures are predictable
1995
• Potential savings = 0.5 x 0.5 x 0.660.16 project / year
• Project takes 2 man-years of Product Development and Process Technology effort / year
• + 10 field trails / year• Pilot plant capital
$1.1M– $3.0M * ** On-going

Presentations 04/19/23 @ 13:36 - 37 -
BUSINESS CASE
Infrastructure
Findings• Wilmington budget process consumes 30 - 40% excess resources• Month end close processing utilizes 50 - 60% extra effort• Accounts payable activities hold opportunity in best practices and
S.A.P. implementation ranging from 50% to 400% implement• Excessive reporting consumes resources and creates confusion• Span of control too low• 38% of site accountants time is spend on administrative duties
Opportunities• Streamline operating and capital budget process• Simplify and streamline the monthly close process• Simplify reporting and reduce number of reports• Redeploy accounts payable personnel
Cost Reduction
19941993
Calculation
• Wilmington accounting 30% x 27 FTE = $.5
• WRC A/P 50% x 3 FTE = .1
• Plant A/P 50% x 8 FTE = .3
• Plant accounting 20% x 15FTE = .2
1995
* On-going
$0.6M– $0.5M * *


