41
Business Cycles, Unemployment, and Inflation Chapter 9 McGraw-Hill/Irwin Copyright © 2009 by The McGraw-Hill Companies, Inc. All rights reserved.
| Date post: | 17-Dec-2015 |
| Category: |
Documents |
| Upload: | rolf-arnold |
| View: | 218 times |
| Download: | 1 times |

Business Cycles, Unemployment, and Inflation
Chapter 9
McGraw-Hill/Irwin Copyright © 2009 by The McGraw-Hill Companies, Inc. All rights reserved.
Chapter Objectives
• The business cycle and its phases
• Measuring unemployment and inflation
• The types and impacts of unemployment and inflation
9-2

The Business Cycle
• The long-run economic growth of the U.S. has from time to time, become unstable.– This is commonly referred to as the business
cycle, but fluctuation may be a better term
– The instability may result in great periods of rapid growth, or periods of degrowth or recession
– When in a growth phase, the business cycle will result in full employment and near-capacity output (GDP is increasing)
– When in recession, there is usually considerable unemployment and low output (GDP is decreasing)
The Business Cycle
• There are four phases of the business cycle– A peak when business activity reaches a
temporary maximum with full employment and near-capacity output
– A recession is a decline in total output, income, employment and trade, sometimes lasting a year or more
– The trough is the bottom of the recession period
– Recovery is when output and employment are expanding toward full employment
Possible Causes of the Business Cycle
• There are several suggested causes for macroeconomic instability as suggested by the business cycle– Supply shocks may occur when major
innovations are developed such as the internet
• these innovations have large effects on investment spending and consumption spending
• We have earlier discussed the role of demand and supply shock and the stickiness of price as factors which contribute to fluctuations in the economy
• Shocks to productivity such as unexpected increases or decreases

Possible Causes of the Business Cycle
• One thing most economists agree on: the immediate cause of the large majority of cases is the unexpected changes, increases or decreases, in the level of total spending– When total spending drops unexpectedly,
firms cannot immediately lower prices (the stickiness factor)
• Firms find themselves selling fewer units because of the decreased spending
• With slower sales, firms cut back on production, leading to a decrease in GDP

Possible Causes of the Business Cycle
• By contrast, when the level of spending unexpectedly rises, output, employment, and incomes will rise– With sticky prices, the increased spending levels
will mean larger consumer purchases – In response to greater consumption, firms will
raise output– In order to raise output, firms will hire more
workers and employment increases– Eventually, in a boom economy, prices are
probably going to increase because of the increased spending
The Business Cycle
Lev
el o
f R
eal O
utp
ut
Time
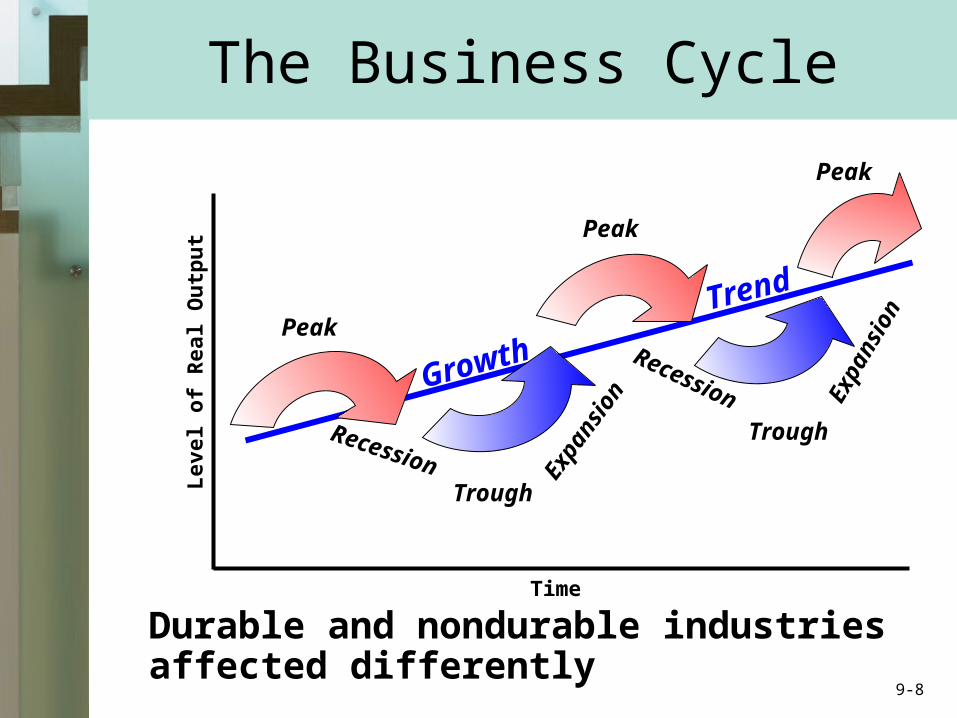
Peak
Peak
Peak
Recession
Recession
Expa
nsio
n Exp
ansi
on
Trough
Trough
Growth
Trend
Durable and nondurable industries affected differently
9-8

How is unemployment measured
• Common problems which occur as a consequence of the business cycle is high unemployment and increased inflation
• Measurement of unemployment– The labor force consists of all those who are
working or are actively looking for work
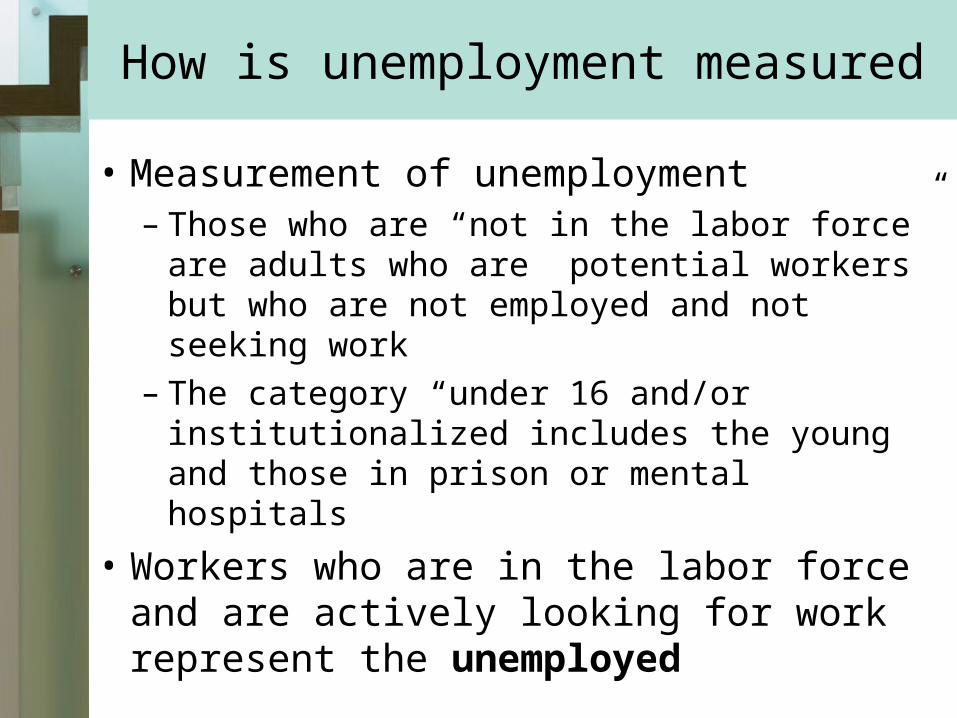
How is unemployment measured
• Measurement of unemployment– Those who are “not in the labor force” are
adults who are potential workers but who are not employed and not seeking work
– The category “under 16 and/or institutionalized includes the young and those in prison or mental hospitals
• Workers who are in the labor force and are actively looking for work represent the unemployed

How is unemployment measured
The unemployment is determined in this manner:
• Unemployment rate = unemployed/labor force X 100• Criticisms of how who is counted as unemployed
– Part-time employment; those working part-time but also those who wanted to work full time but could find a job and had to settle for part time• By counting these workers, the unemployment
rate is understated– Workers who become discouraged and give up
looking for work; they are not part of the unemployment sector and thus unemployment again is under-reported

Unemployment
Under 16And/or
Institutionalized(71.8 Million)
2007 data
TotalPopulation
(303.6 Million)
Not inLabor Force(78.7 Million)
Employed(146.0 Million)
LaborForce(153.1 Million)
Unemployed(7.1 Million)
Source: Bureau of Labor Statistics 9-12

Types of Unemployment
• Types of unemployment–Frictional where workers are
between jobs from either voluntary resignation or from being fired• There is always a percent if
unemployed people who are frictionally unemployed
• Not a bad type of unemployment, it shows there is mobility as people change or seek jobs 9-13
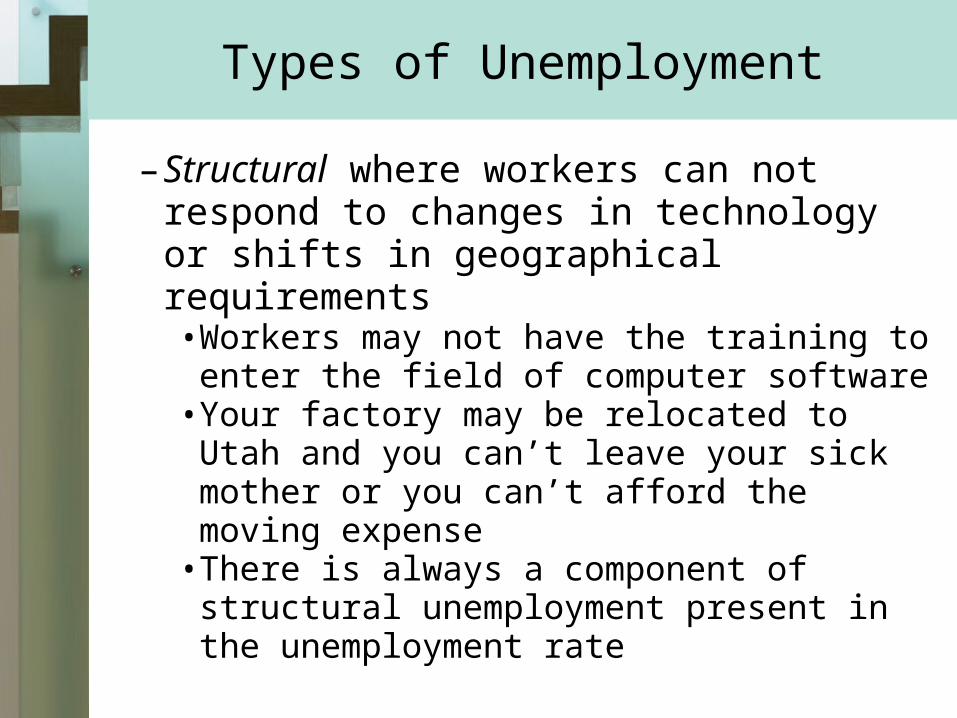
Types of Unemployment
–Structural where workers can not respond to changes in technology or shifts in geographical requirements• Workers may not have the training to
enter the field of computer software• Your factory may be relocated to Utah
and you can’t leave your sick mother or you can’t afford the moving expense
• There is always a component of structural unemployment present in the unemployment rate
Unemployment
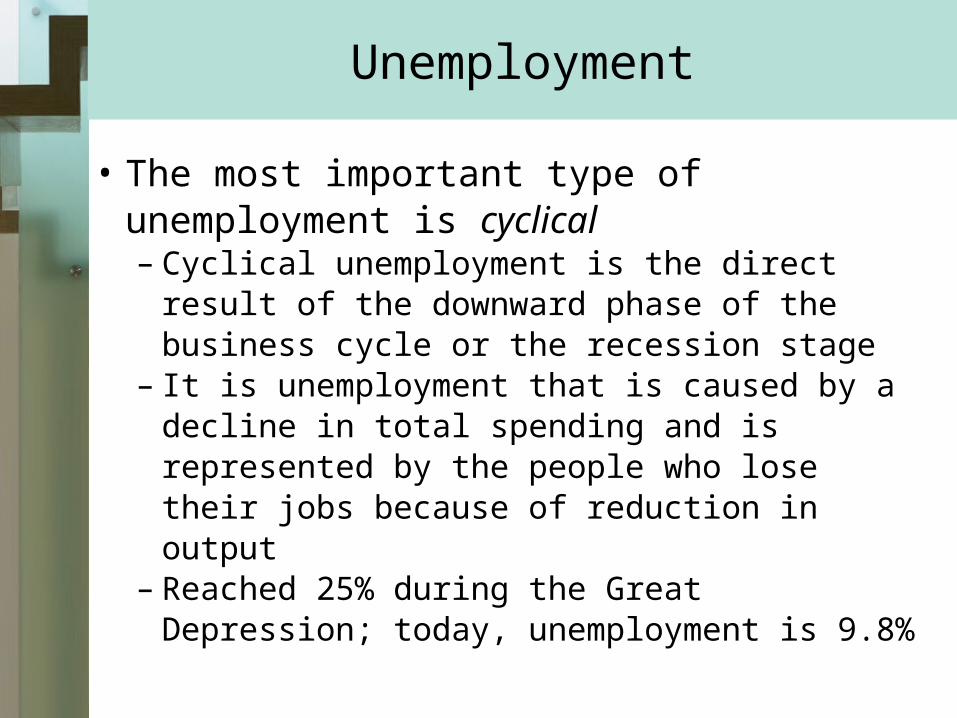
• The most important type of unemployment is cyclical– Cyclical unemployment is the direct result of
the downward phase of the business cycle or the recession stage
– It is unemployment that is caused by a decline in total spending and is represented by the people who lose their jobs because of reduction in output
– Reached 25% during the Great Depression; today, unemployment is 9.8%

What is “Full Employment”?
• Full employment does not mean zero unemployment
• When an economy has only frictional and structural unemployment, it is said to be in full employment– Still have a small component of those
frictionally or structurally unemployed– Thus, there is no cyclical unemployment
when an economy is in full employment– At full employment, the economy is
producing at its full or potential output

What is “Full Employment”?
• The Natural Rate of Unemployment or NRU is the unemployment rate that is consistent with full employment–Thus, the NRU measures only
structural and frictional unemployment–The NRU is achieved when the
number of job seekers equals the number of job vacancies
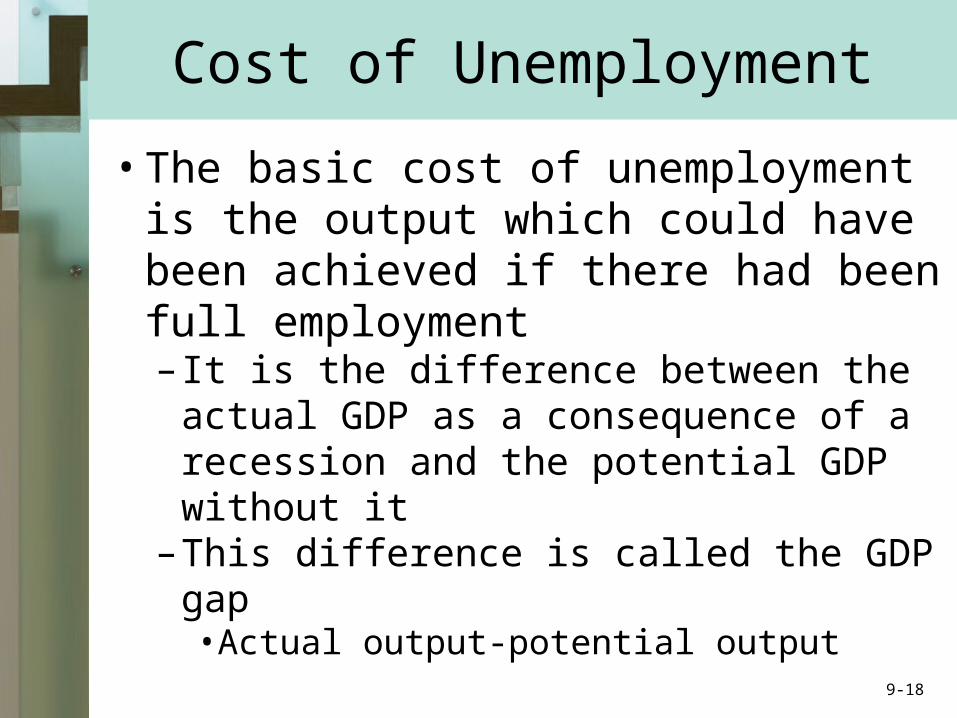
Cost of Unemployment
• The basic cost of unemployment is the output which could have been achieved if there had been full employment– It is the difference between the actual
GDP as a consequence of a recession and the potential GDP without it
–This difference is called the GDP gap• Actual output-potential output
9-18
Cost of Unemployment
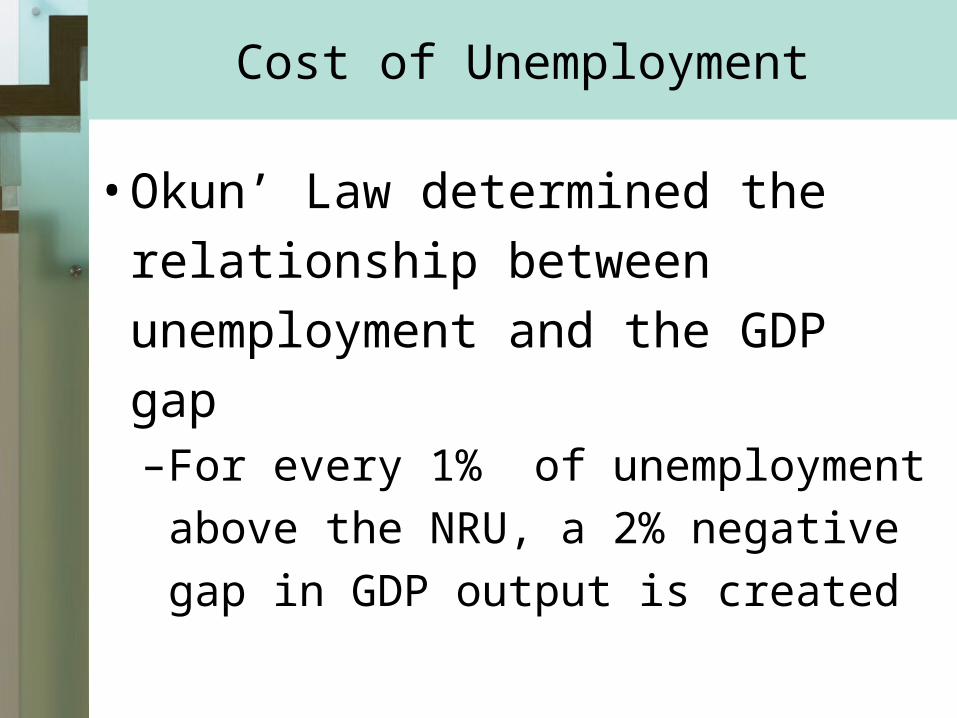
• Okun’ Law determined the
relationship between
unemployment and the GDP gap–For every 1% of unemployment
above the NRU, a 2% negative gap
in GDP output is created
The Unequal Burdens of Unemployment
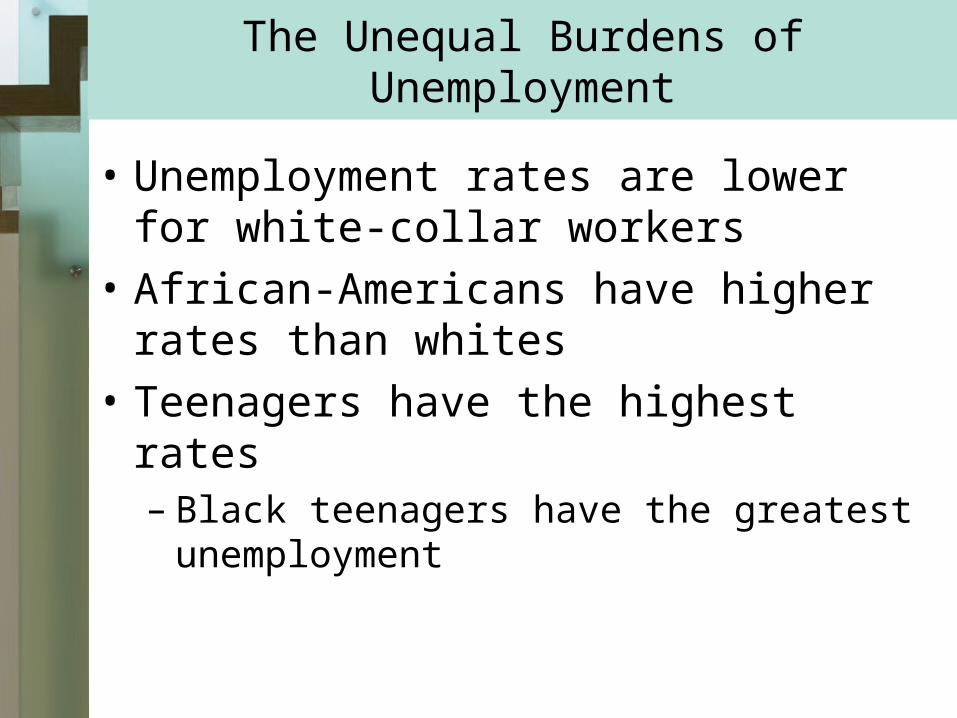
• Unemployment rates are lower for white-collar workers
• African-Americans have higher rates than whites
• Teenagers have the highest rates– Black teenagers have the greatest
unemployment
The Unequal Burdens of Unemployment
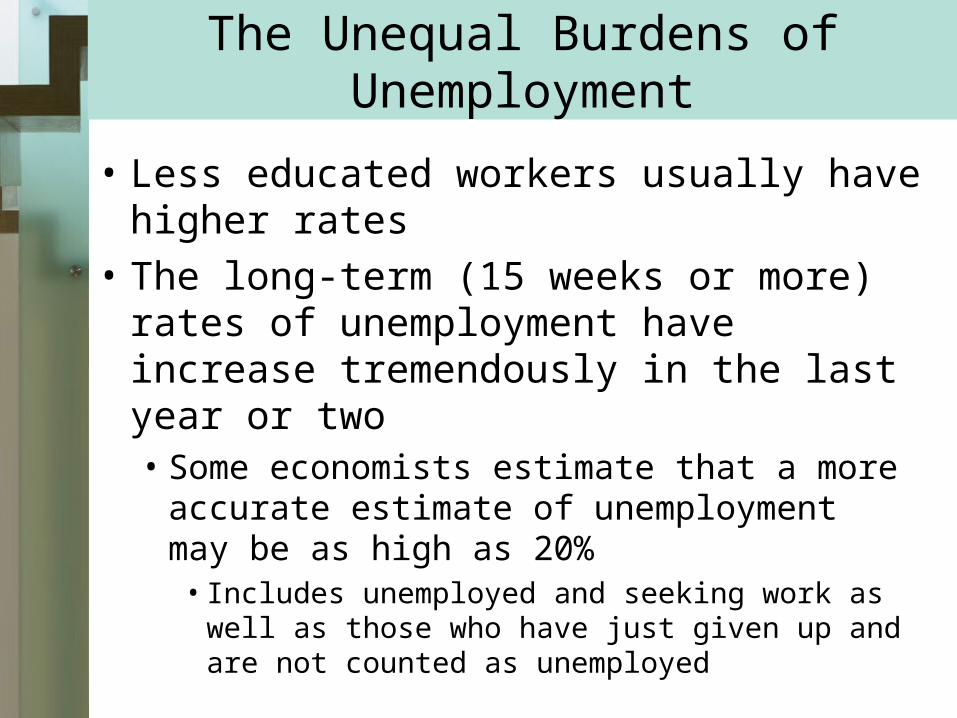
• Less educated workers usually have higher rates
• The long-term (15 weeks or more) rates of unemployment have increase tremendously in the last year or two• Some economists estimate that a more
accurate estimate of unemployment may be as high as 20%
• Includes unemployed and seeking work as well as those who have just given up and are not counted as unemployed

Unemployment
5,000
6,000
7,000
8,000
9,000
10,000
11,000
12,000
1985 1987 1989 1991 1993 1995 1997 1999 2001 2003 2005 1985 1987 1989 1991 1993 1995 1997 1999 2001 2003 2005
The GDP Gap12,000
11,000
10,000
9,000
8,000
7,000
6,000
5,000GD
P (
bil
lio
ns
of
1996
do
lla
rs)
0
2
4
6
8
10
1985 1987 1989 1991 1993 1995 1997 1999 2001 2003 2005 1985 1987 1989 1991 1993 1995 1997 1999 2001 2003 2005
The Unemployment Rate10
8
6
4
2
0
Un
emp
loy
men
t(p
erce
nt
of
civi
lian
Lab
or
forc
e)
Source: Congressional Budget Office & Bureau of Economic Analysis
GDP gap(positive)
GDP gap(negative)
Potential GDP
Actual GDP
9-22

Unemployment
Source: Bureau of Labor Statistics
Unemployment Rates in Five Industrial Nations,1995-2005
9-23
Inflation
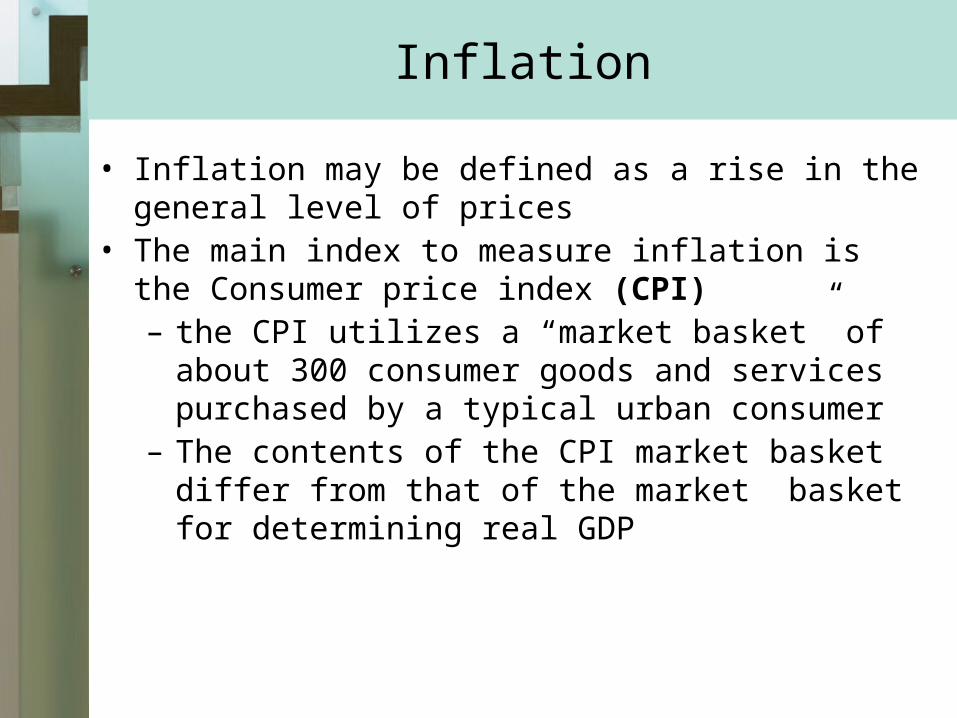
• Inflation may be defined as a rise in the general level of prices
• The main index to measure inflation is the Consumer price index (CPI)– the CPI utilizes a “market basket” of about 300
consumer goods and services purchased by a typical urban consumer
– The contents of the CPI market basket differ from that of the market basket for determining real GDP
Inflation
– The GDP market basket included not only consumer goods, but capital goods, goods and services purchased by the government and by foreign countries
– The CPI is updated every 2 years

How to determine the CPI• The “rule of 70” allows for quick calculation of the
time it takes the price level (i.e., inflation ) to double– Divide 70 by the percentage rate of inflation and the result
is the number of years for the price level to double– If the inflation rate is 7 %, it will take about 10 years for
prices to double– Only works if the inflation rate is consistent over the 10 year
period• Deflation (decrease in price level) has occurred in
past years– In the 1930’s, the depression was a time of declining prices
and wages
CPIPrice of the Most Recent Market
Basket in the Particular YearPrice estimate of the
MarketBasket in 1982-1984
= x 100
9-26
Inflation
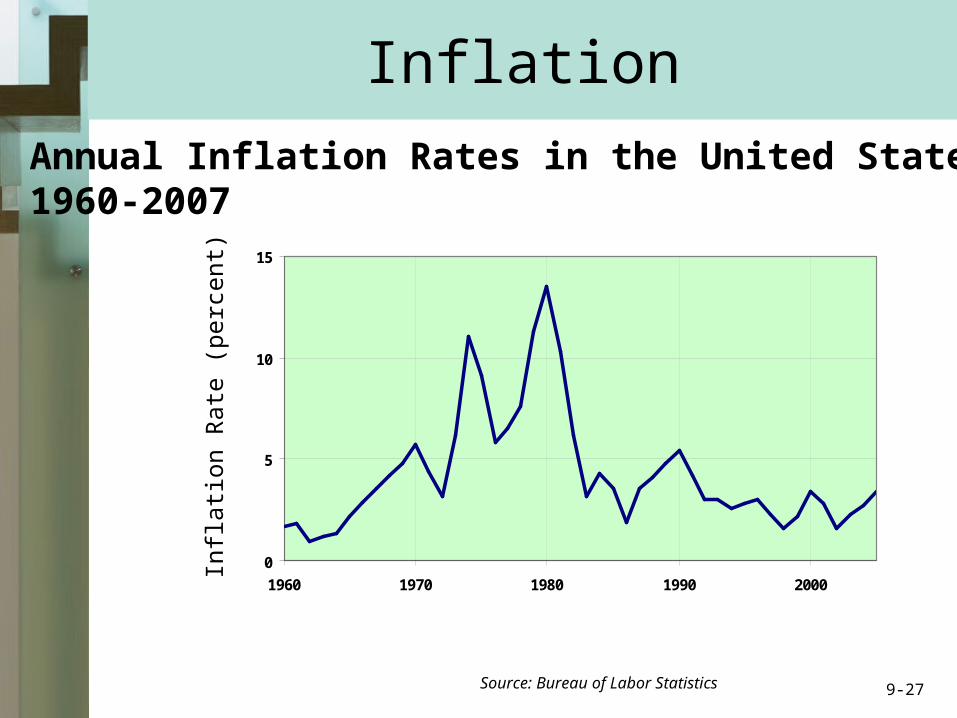
Annual Inflation Rates in the United States,1960-2007
0
5
10
15
1960 1970 1980 1990 2000
Infla
tion
Rat
e (p
erce
nt)
Source: Bureau of Labor Statistics 9-27
Inflation
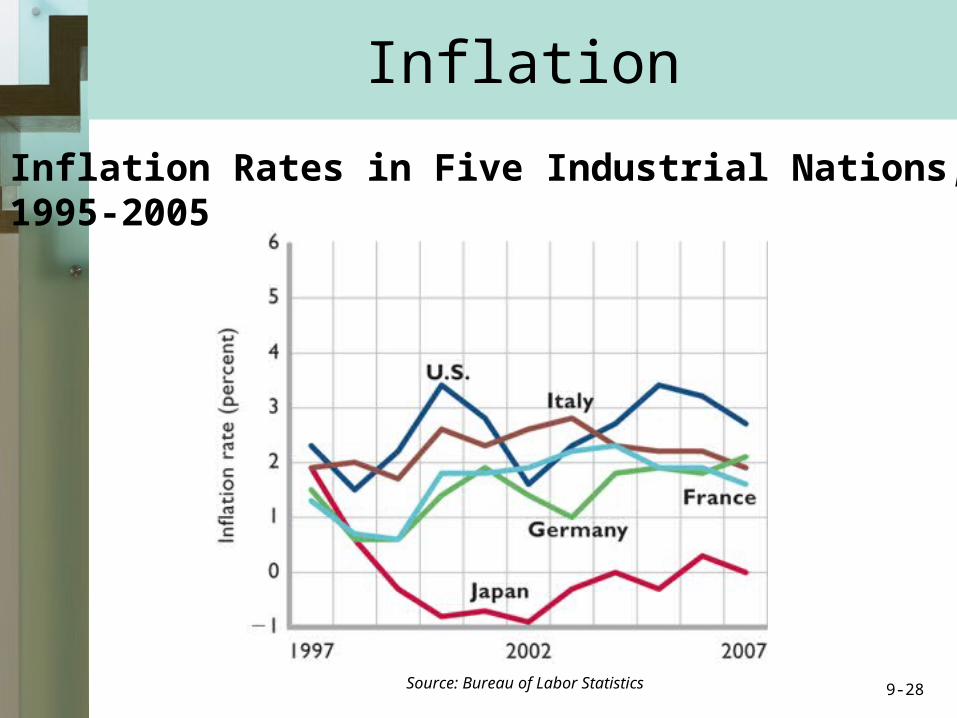
Source: Bureau of Labor Statistics
Inflation Rates in Five Industrial Nations,1995-2005
9-28

Causes of Inflation
• Types of Inflation–“Demand pull” is the most
common type of inflation• Increases in the price level are
caused an excess of total spending beyond the economy’s capacity to produce
– “to many dollars chasing too few goods”
–When inflation is rapid and sustained for a long period, the cause is usually an oversupply of money
9-29
Causes of Inflation
• If resources are already fully employed when prices begin to rise, firms cannot respond to excess demand by expanding output
• The excess demand then drives up the prices of the limited output
Causes of Inflation
– Cost-push inflation occurs on the supply side of the market
• With this type of inflation, the price level increases even though total spending was not excessive
• In fact, there were times when both output and employment were both declining

Causes of Inflation
• Cost-push inflation occurs when the cost of producing each rises
• This “per-unit” production figure is found by dividing the total input cost by the units of production
– Rising per-unit costs squeezes profits, thereby reducing the amount of output firms are willing to supply at the existing level
– The economy’s supply of goods and services then declines and is followed by a general rise in the level of prices
– Cost-push inflation is often referred to as a “Supply Shock”
Anticipated vs Unanticipated Inflation
• The effects of inflation on consumers and business firms will differ depending upon whether the inflation was “anticipated” or “unanticipated”– Unanticipated increases in prices limits the
ability of the government to enact economic policy to counter the inflation

Anticipated vs Unanticipated Inflation
– Unanticipated inflation is particularly harmful to consumers with fixed incomes
– If nominal income does not rise at the same rate of inflation, then loss in purchasing power will occur
– Real income = nominal income/price index

Inflation effects on debtors and creditors
• When prices are rising, the debtors are the gainers and pay back the debts when the purchasing power is low due to inflation– The creditors receive the same amount of money but in terms of
goods and services, they receive less.
• When prices are falling, the creditors are the gainers and the debtors are the losers
9-35

Inflation effects on debtors and creditors
• Savers will be hurt by unanticipated inflation, because interest rates may not cover the cost of inflation. Their savings will lose purchasing power
• Unanticipated inflation will increase the risks of investment by firms, and therefore slow the level of production activities– Faced with uncertainty, business will not
undertake capital investment or any other transactions involving long-term commitment

More effects of Inflation
• Anticipated inflation– The government has time to develop anti-
inflationary policies– some consumers such as union workers can
adjust their nominal incomes through negotiating new wage contracts
– Lenders can establish interest rates which “build in” the rate of inflation
– Lenders may charge an “inflation premium” to adjust for the increase in inflation
• The nominal interest rate = the real interest rate plus the inflation premium (which is the expected rate of inflation)

Anticipated Inflation
–Nominal Interest Rate –Real Interest Rate–Inflation Premium
NominalInterest
Rate
RealInterest
Rate
InflationPremium
11%
5%
6%
= +
9-38

The Stock Market• Stock prices have only a limited impact
on macroeconomic stability– The market for stocks has increased
tremendously in the last 20 or 30 years• Increases in the value of stocks creates
a wealth effect• Also, increases in stock value cause
companies to invest more• Stock market bubbles do have an impact• Stocks have been added to the index of
Leading Indicators which is used to help predict the direction of the economy
9-39

Key Terms
• business cycle• peak• recession• trough• expansion• labor force• unemployment rate• discouraged workers• frictional unemployment• structural unemployment• cyclical unemployment• full-employment rate of
unemployment• natural rate of unemployment
(NRU)• potential output• GDP gap
• Okun’s law• inflation• Consumer Price Index (CPI)• demand-pull inflation• cost-push inflation• per-unit production costs• nominal income• real income• anticipated inflation• unanticipated inflation• cost-of-living adjustments
(COLAs) • real interest rate• nominal interest rate• deflation• hyperinflation
9-40

Next Chapter Preview…
BasicMacroeconomicRelationships
9-41


