LEONARDO DA VINCI Transfer of Innovation Leonardo da Vinci programme Project „Development and Approbation of Applied Courses Based on the Transfer of Teaching Innovations in Finance and Management for Further Education of Entrepreneurs and Specialists in Latvia, Lithuania and Bulgaria” Business Financing Models and Instruments Dr. Marijus Keršys Vytautas Magnus University, Kaunas, Lithuania. E-mail: [email protected]2010
Transcript
LEONARDO DA VINCI Transfer of Innovation
Leonardo da Vinci programme Project „Development and Approbation of Applied Courses Based on the Transfer of Teaching Innovations in Finance and Management for Further Education of
Entrepreneurs and Specialists in Latvia, Lithuania and Bulgaria”
Table of contents ...................................................................................................................2 Introduction ...........................................................................................................................4 1. Finance management in a company...............................................................................6
1.1. Value creation in a company .................................................................................6 1.2. Role of the chief financial officer........................................................................10 1.3. Organisation of finance .......................................................................................11 Summary..........................................................................................................................14 Key terms.........................................................................................................................14 Further readings...............................................................................................................15 Review questions and problems ......................................................................................15
2. Decision making in finance .........................................................................................16 2.1. Steps in decision making .....................................................................................16 2.2. Separation of investment and financing decisions ..............................................18 2.3. Value creation criteria .........................................................................................19
2.3.1. Non-financial criteria for value creation .....................................................19 2.3.2. Payback period ............................................................................................20 2.3.3. Net present value .........................................................................................21 2.3.4. Internal rate of return...................................................................................24 2.3.5. Economic profit ...........................................................................................25 2.3.6. Activity-decision stage models....................................................................26
2.4. Project finance as a portfolio management .........................................................30 Summary..........................................................................................................................35 Key terms.........................................................................................................................35 Further readings...............................................................................................................36 Review questions and problems ......................................................................................36
3. Financial forecasting and modelling ...........................................................................37 3.1. Planning vs. budgeting vs. forecasting ................................................................37 3.2. Building pro-forma statements ............................................................................40
3.2.1. Forecasting sales..........................................................................................42 3.2.2. Forecasting balance sheet and need for external finance ............................43
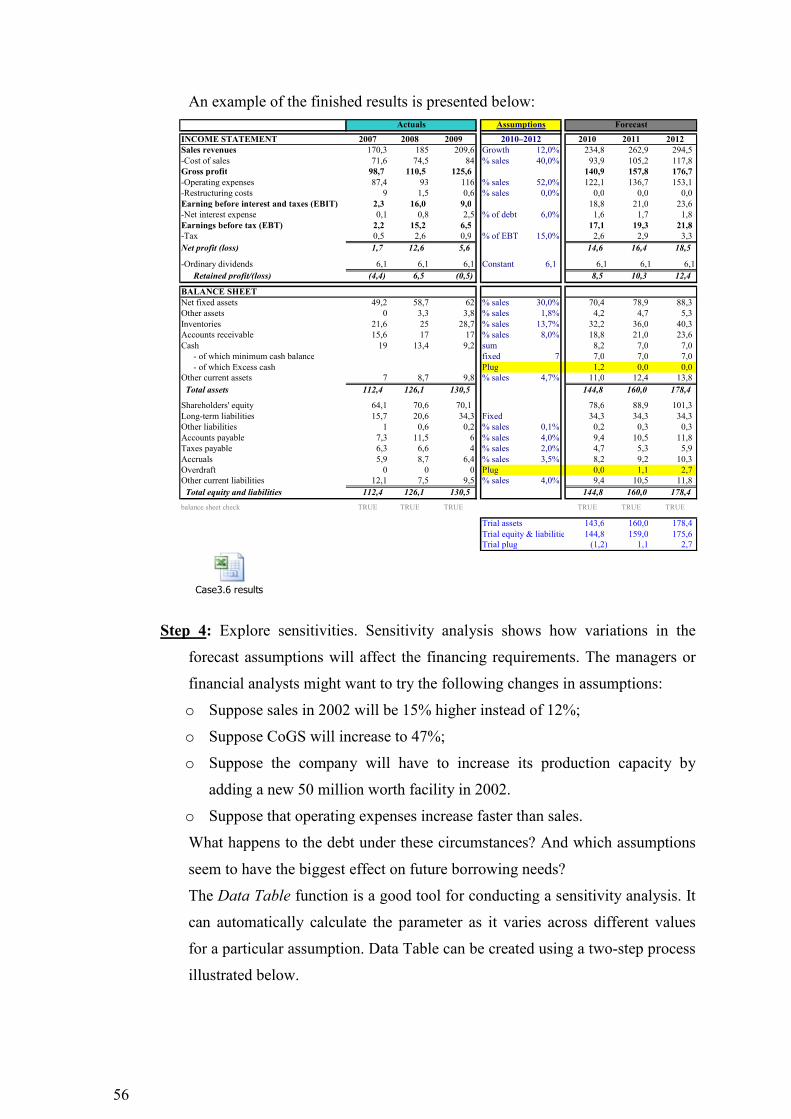
3.3. Assessing the needs for financing .......................................................................49 3.4. Sustainable growth rate .......................................................................................50 3.5. Scenarios in forecasting.......................................................................................51 3.6. Case: developing spreadsheet model...................................................................52 Summary..........................................................................................................................57 Key terms.........................................................................................................................58 Further readings...............................................................................................................58 Review questions and problems ......................................................................................58
4. Fund raising .................................................................................................................60 4.1. Criteria for evaluation of sources of finance .......................................................60 4.2. Preparing business plan .......................................................................................62 4.3. Elevator pitch.......................................................................................................72 Summary..........................................................................................................................73 Key terms.........................................................................................................................74 Further readings...............................................................................................................74 Review questions and problems ......................................................................................74
3
5. Long term finance-1: Equity finance...........................................................................75 5.1. Retained earnings ................................................................................................75 5.2. Rights issues ........................................................................................................76 5.3. Equity finance from risk capital ..........................................................................79
5.4. Going public: raising equity finance through equity market...............................88 5.5. Public funds as a source of external funding.......................................................93 Summary..........................................................................................................................96 Key terms.........................................................................................................................97 Relevant websites ............................................................................................................97 Further readings...............................................................................................................98 Review questions and problems ......................................................................................98
6. Long term finance-2: Debt finance............................................................................100 6.1. Long-term debt ..................................................................................................100 6.2. Leasing ..............................................................................................................102 6.3. Corporate bonds.................................................................................................107 6.4. Mezzanine finance.............................................................................................109 Summary........................................................................................................................114 Key terms.......................................................................................................................114 Relevant websites ..........................................................................................................115 Further readings.............................................................................................................115 Review questions and problems ....................................................................................115
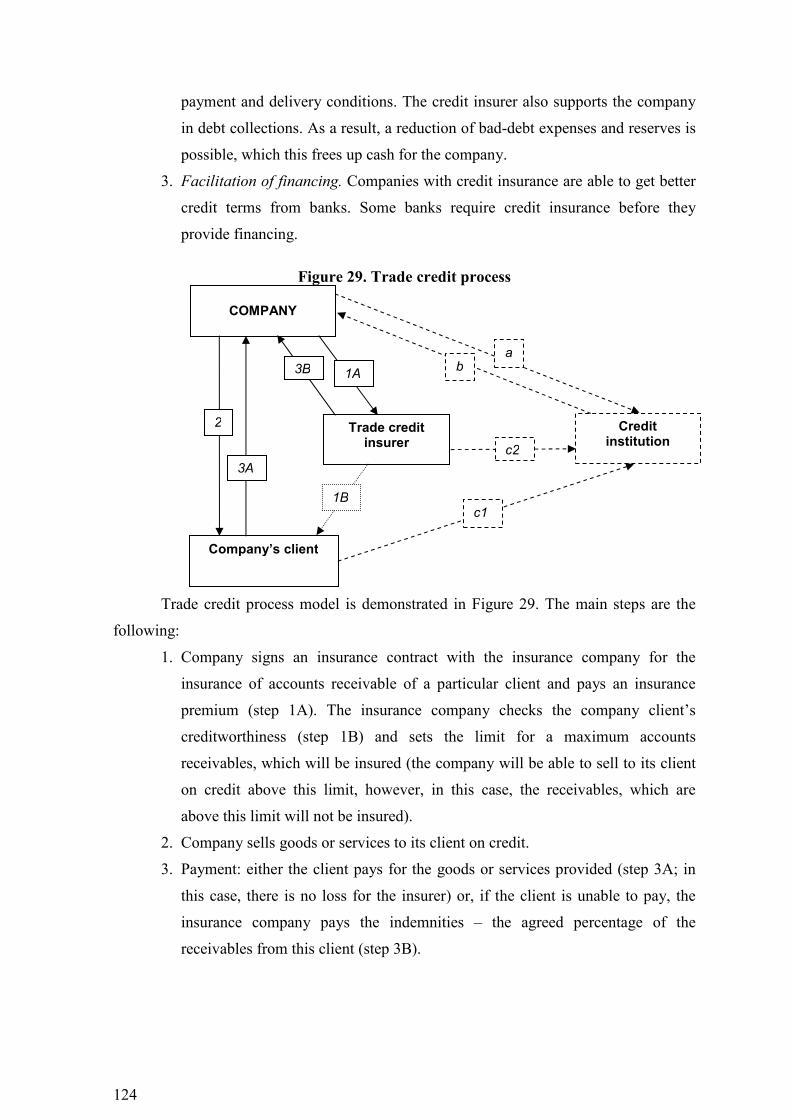
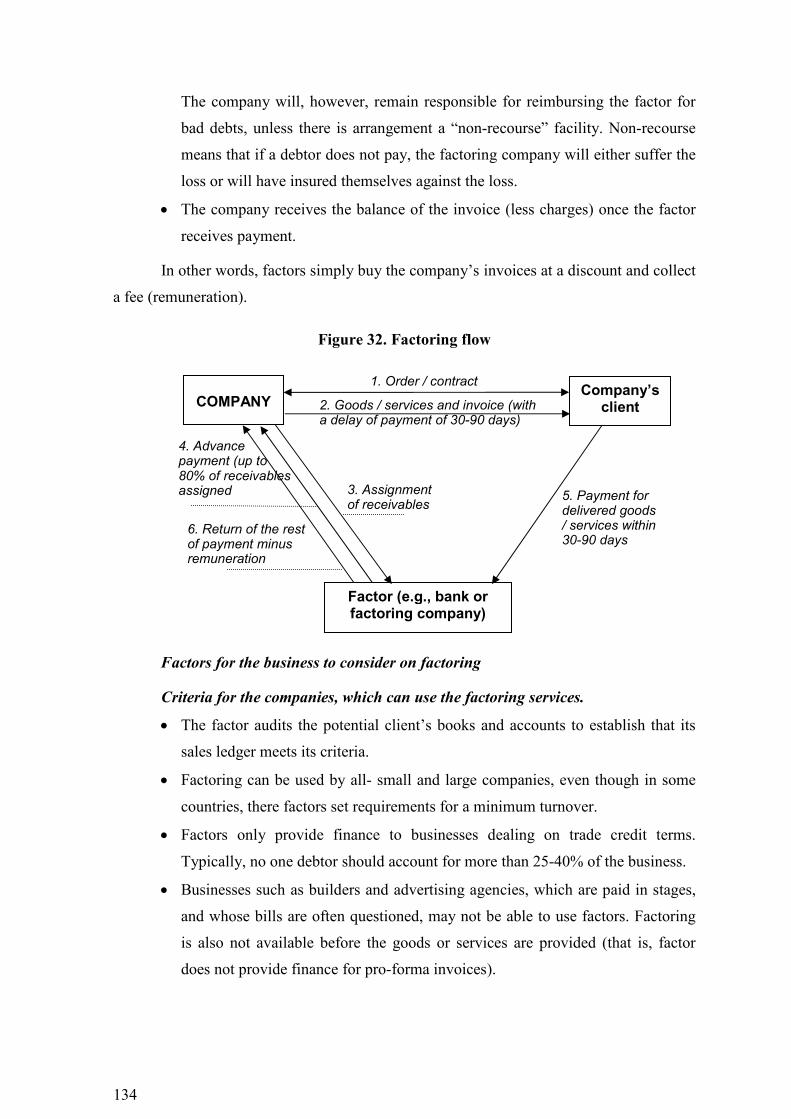
7. Short-term finance: financial instruments for working capital management ............117 7.1. Main concepts in working capital management ................................................117 7.2. Trade credit........................................................................................................121
7.2.1. Trade credit as a source of finance ............................................................121 7.2.2. Trade credit insurance ...............................................................................122 7.2.3. Letter of credit ...........................................................................................125 7.2.4. Other instruments for secure payments .....................................................129
7.3. Overdraft............................................................................................................131 7.4. Factoring............................................................................................................133 7.5. Instruments for management of cash surplus ....................................................136 Summary........................................................................................................................137 Key terms.......................................................................................................................138 Further readings.............................................................................................................138 Review questions and problems ....................................................................................138
Glossary.............................................................................................................................140 Abbreviations and symbols used .......................................................................................143 Annexes .............................................................................................................................144
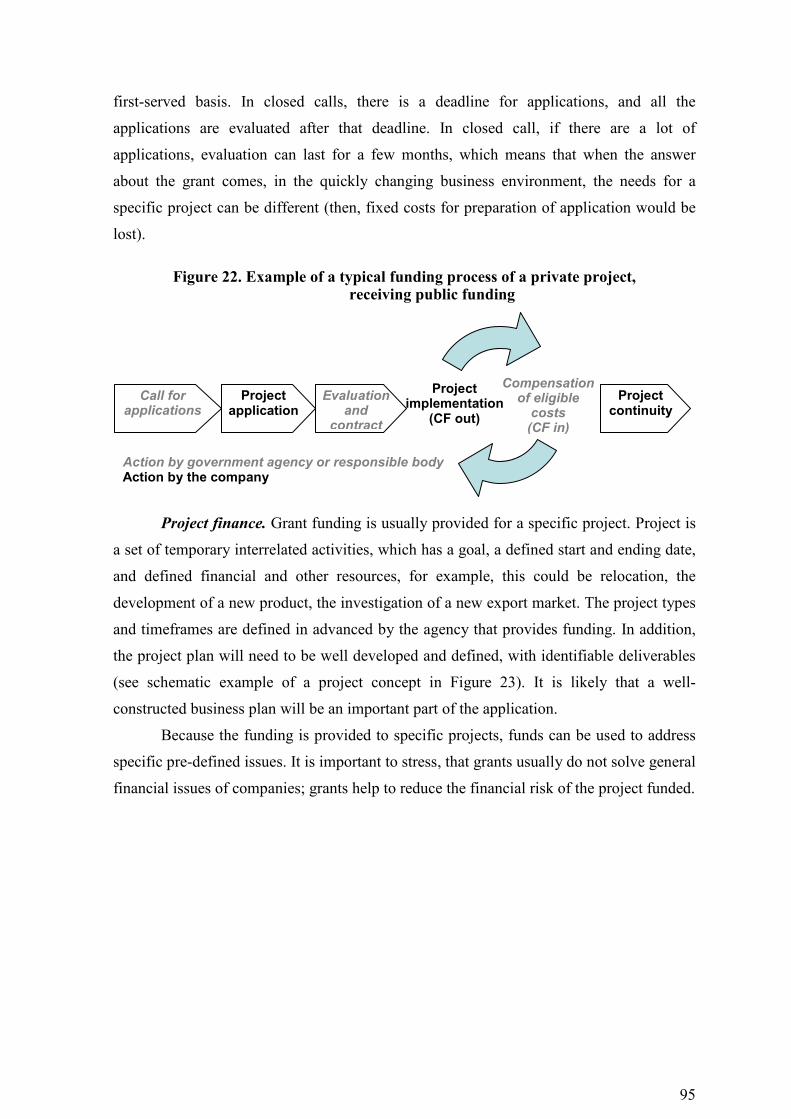
4
INTRODUCTION
Motivation for Developing the Course
Research by the members of the project consortium Employers’ Confederation of
Latvia and Bulgarian Chamber of Commerce and Industry indicated the need for further
education courses.
Innovative Content of the Course
The course is developed to include the following innovative content:
• key concepts of business finance, financial analysis and fund raising, which are
explained from an applied perspective;
• applied problems, cases and topics for discussion, which aim to develop
competences and skills in planning and raising finance in business companies;
• summaries are provided at the end of every chapter, which aid revision and
control of knowledge acquisition during self-study.
Innovative Teaching Methods of the Course
The course is developed to utilise the following innovative teaching methods:
• availability on the electronic platform with interactive learning and interactive
evaluation methods;
• active use of case studies and participant-centred learning;
• availability in modular form;
• utilising two forms of learning - self-study and tutorial consultations;
• availability in several languages simultaneously.
Target Audience for the Course
The course material is tailored for business managers or finance specialists of non-
financial sector, having some experience in the field of finance. The course is adapted for
the entrepreneurs and specialists in finance and management from Latvia, Lithuania, and
Bulgaria; in the longer run, it can be used for developing skills in similar groups in any
other European country.
The course assumes previous knowledge of principles of financial accounting and
basic concepts of financial management.
The course is intended for 32 academic hours (2 credit points).
5
Course Objectives
The world of finance is rather complex. On one hand, it requires some specific
knowledge and skills. On the other hand, in business, being a support function, finance
should not be regarded as a matter for specialists only. Finance is a part of the toolkit that
any manager should use for understanding and resolving business problems. Knowledge of
finance enables managers to understand how they can influence the process of value
creation, which is the core of any business, forecast and measure business performance
and to redistribute resources in order to improve it.
The objectives of the course are to:
• help to expand the knowledge in business finance, financial instruments and
sources;
• provide additional knowledge and improve skills in decision making, related to
business finance.
After successful completion of the course, the entrepreneurs and specialists in
finance / management will have an understanding of the role of finance in a contemporary
organisation, be able to evaluate the needs for finance in their organisation, make decisions
about financial resources allocation based on value creation criteria, identify and choose
the financial sources and instruments suitable for their needs.
Evaluation Methods
Every chapter of the course provides opportunities to test the knowledge of the
audience, which are in the form of questions and more complex problems. The types of
questions include open-ended questions as well as multiple-choice questions. The
problems involve calculations, building argumentation for decision making etc.
Summary of the Course and Evaluation Methods
The course provides the target audience with a broad knowledge on the key topics
of business finance and its application in a business company. The focus is on practical
application of the knowledge – during the course, entrepreneurs and finance specialists
have the possibility to model, evaluate and discuss the situation of their own company.
This course can be combined with the other professional education courses
developed in the project.
6
1. FINANCE MANAGEMENT IN A COMPANY
Contents • Value creation in a company
• Role of the chief financial officer
• Organisation of finance
1.1. Value creation in a company
The businesses can have various objectives. The most popular ones are the
following:
• maximisation of profit;
• maximisation of the return on capital employed;
• survival;
• long-term stability;
• growth;
• satisficing (which means that business should seek to give all stakeholders
satisfactory return for their inputs rather than seek to maximise the return to any
one of them);
• maximisation of shareholders’ wealth.
The maximisation of shareholder’s wealth is considered as the most appropriate
goal as it encompasses the incentives for efficiency, long-term development and value
creation. The shareholder wealth of a company is the monetary market value of the
interests of its owners. In a company that is listed on the stock market, the shareholder
value is very simply calculated as the product of the price of each share by the number of
shares outstanding. In a company that is not listed, it is more difficult to find out its market
value as one has to estimate the price at which shareholders could sell their holdings.
Shareholder wealth maximisation is a responsibility and a discipline for all
managers. This is so because of several reasons:
1. Effective business metric. Among the metrics for setting targets and measuring
2. It enables broad decentralisation. Maximising shareholder value is sufficient to
guarantee that any manager acts in the best interests of the corporation and of
7
each of the corporation’s owners – regardless of differences in their wealth and
preferences.
3. It has the power to unite all the stakeholders involved in a business: employees,
customers, suppliers, state authorities, owners, etc.
4. Focusing on shareholder value is a way of using external pressure to drive
continuous change and improvement. It helps companies to monitor the
competitiveness of their operations, scrutinise their investments, and identify the
areas that should be re-engineered, and so on.
5. Creating value corresponds to positive, progressive and motivating behaviours.
It is a matter of looking for opportunities, creating alternatives, redefining
situations, innovating, and so on.
Maximisation sometimes is associated with such negative attitudes as greed and
short-term thinking. However, we should be aware of some aspects, which make the
maximisation of shareholder value a rule:
• Shareholder value today is maximised within a co-operative system. It is hard to
imagine a company, which would not care for its customers, employees, or
other stakeholders, and still would be able to create value.
• The goal is to aim continuously at bringing the value to a maximum that would
be sustainable over the long run.
• Maximising shareholder value is a matter of doing the maximum that anybody
could do in the circumstances they are in. It is not trying to reach some kind of
theoretical maximum in the absolute.
Value creation is realised in various business contexts:
• commitment to growth;
• commitment to innovation;
• commitment to new business designs and processes;
• commitments to turnarounds and divestments;
• value pricing (e.g. price/volume trade-off, changes in product mix);
• negotiations;
• performance management;
• risk and flexibility management.
8
In any of these contexts, managers face the following financial problems and
decisions (for a more detailed description see chapter 1.2):
• investment or resource allocation / redistribution;
• financing decisions;
• management decisions.
Performance measurement is one of the most important management
responsibilities of the financial managers because it affects the way people behave.
Owners of the companies want performance measures to be aligned with maximising
shareholders value, a goal, which is easy to articulate but difficult to implement.
Figure 1 defines a wide variety of performance measures that companies can use.
Choice of the one to actually use is not immediately obvious. First, we have earnings per
share or growth in earning per share. It does not satisfy almost any criteria. It contains no
balance sheet information. This implies that if one company requires two currency units of
capital to generate one unit in earnings while another one requires only one, then the
market would assign the same value to both because they report the same earnings.
Another problem is that earnings are short term in nature.
Return on invested capital (ROIC) is a more comprehensive measure because it is
the product of two key value drivers (operating margin and capital turnover). The
definition of pre-tax ROIC is
EBIT salesROIC
sales invested capital= ⋅ .
When used to evaluate business unit performance, ROIC encourages capital
harvesting behaviour. It is easier for a manager to allow the capital under her control to
depreciate that it is to invest new capital profitably. As she harvests the business, ROIC
raised because the amount of invested capital is assumed to drift upward. However, the
capital base devalues and, assuming that the decline in sales is not as bad as the decline in
capital base, then ROIC will be fine. The spread of the ROIC over the weighted average
cost of capital (WACC) has the same problem. Management cannot influence WACC, so
the easiest way to raise ROIC is to allow the base of invested capital to depreciate.
As part of the expectations-based management, ROIC is useful because it traces
back into all of the items in the income statement and balance sheet.
Economic profit, measured by EVA®, helps to alleviate harvesting behaviour by
multiplying the spread by the amount of invested capital. One often reads that when
economic profit is positive, the business unit in question creates value for shareholders. It
9
is not usually the case because economic profit does not attempt to incorporate
expectations.
To create shareholder value it is necessary and sufficient for a company or a
business unit to exceed shareholder expectations. Overall, expectations-based management
is the best short-term measure of management performance. Research shows that this
measure is also highly correlated with the total return to shareholders.
The main shortcoming of all of the aforementioned performance measures is that
they are basically one-period views of the world. This issue is solved by the discounted
cash flow (DCF) approach.
Real options analysis is a superset of DCF. Most companies gain insight from this
type of analysis primarily at the project level, although decisions concerning whether to
exit and re-enter a line of business, and certain aspects of mergers and acquisitions (the
option to expand or abandon an acquired business), are common applications.
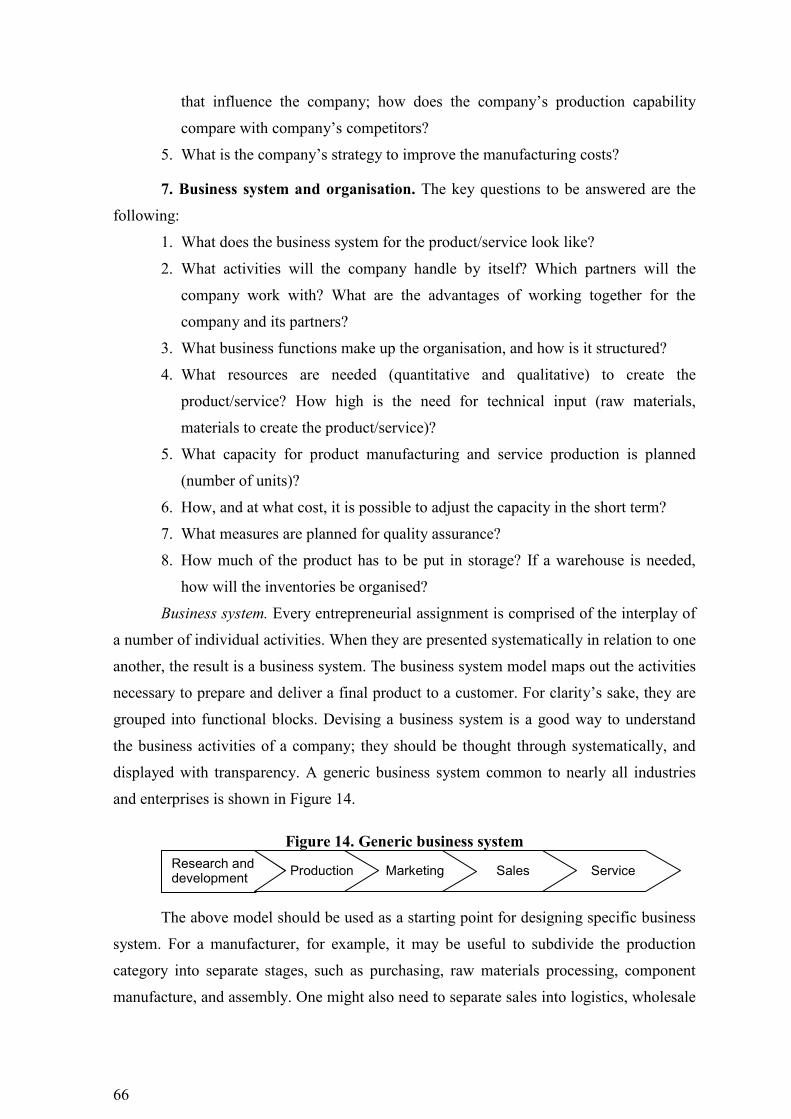
Figure 1. Comparison of companies’ performance metrics
No balance sheet
information
Encourages harvesting
behaviour
Not correlated with total
return to shareholders
Short-term
Fails to value flexibility
Earnings per share
Net incomeEPS
Number of shares=
Growth in earnings per share
1
1
t t
t
EPS EPSEPS
EPS
−
−
−∆ =
Return on invested capital
EBITROIC
I=
Return on equity Net income
ROEEquity
=
Spread ROIC WACC−
Economic profit (EP) or EVA
®
( )EP ROIC WACC I= − ⋅
Growth in economic profit 1
1
t t
t
EP EP
EP
−
−
−
Expectations-based-management
TM EBM Actual EP Expected EP= −
Discounted cash flow (1 )
t
tt
CFDCF
r=
+∑
Real options analysis Most complicated measure
10
Check Question 1 Which performance metrics are used in your
company? What are the implications of their usage on the activity of the company?
1.2. Role of the chief financial officer
In the 20th century, the chief financial officer (CFO) was primarily a financial
record keeper, in charge of internal accounts and of the company’s financial reporting to
shareholders and regulators. This role is still common in smaller businesses in Asia, Latin
America, Africa, and Eastern Europe. But in large multibusiness, multinational companies
CFO is one of the top decision makers, standing alongside the chief executive officer
(CEO) and the chief operating officer.
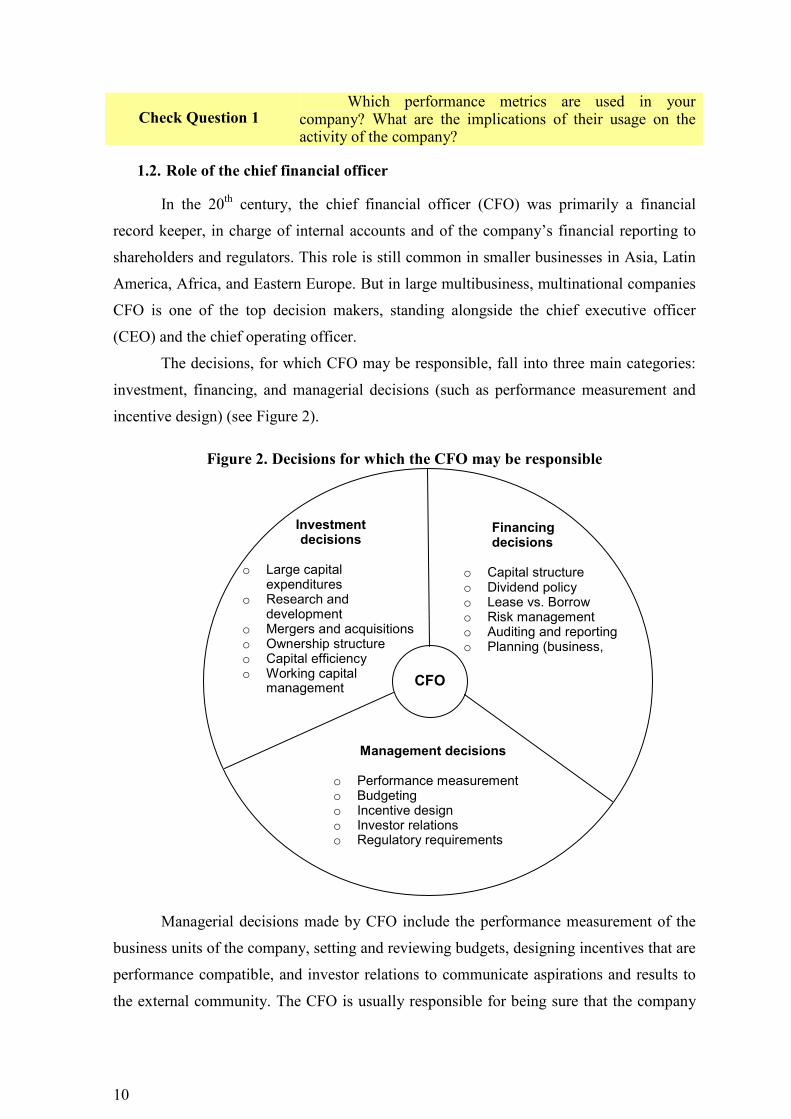
The decisions, for which CFO may be responsible, fall into three main categories:
investment, financing, and managerial decisions (such as performance measurement and
incentive design) (see Figure 2).
Figure 2. Decisions for which the CFO may be responsible
Managerial decisions made by CFO include the performance measurement of the
business units of the company, setting and reviewing budgets, designing incentives that are
performance compatible, and investor relations to communicate aspirations and results to
the external community. The CFO is usually responsible for being sure that the company
Investment decisions
o Large capital
expenditures o Research and
development o Mergers and acquisitions o Ownership structure o Capital efficiency o Working capital
management
Financing decisions
o Capital structure o Dividend policy o Lease vs. Borrow o Risk management o Auditing and reporting o Planning (business,
Management decisions
o Performance measurement o Budgeting o Incentive design o Investor relations o Regulatory requirements
CFO
11
conforms to all regulations (environmental, health and safety, tax, agency, and legal).
Other top executives from planning, budgeting, human resources, and legal staff will
report to the CFO on these matters. Financial managers, which perform these functions, in
smaller companies are sometimes titled as Directors of finance and administration.
The second area is financial decisions. The CFO is responsible for the audited
financial statement of the company; hence, the controller reports to him as do the external
auditors. He is also responsible for the sources and uses of funds. This means that he must
recommend capital structure (the mix of debt and equity) and dividend policy (the
percentage of dividends paid out) to the board of directors. For this purpose, the corporate
treasurer usually reports to the CFO. Risk management, which of course includes
management of financial risks, is also one of the functions of CFO. The CFO is usually
responsible for the insurance position, the hedging position, and the net risk exposure of
shareholders. He will also deal with bond rating agencies that provide an assessment of the
credit risk of the company. Also, the chief planning officer often reports to the CFO.
Companies may prepare many types of plans, for example, tax plans, short-term (annual
and quarterly) budgets, and strategic and long-range plans.
Finally, there are investment decisions. The CFO is often responsible for reviewing
all capital expenditures above a certain limit. A lot of details are involved: What
methodology should be used (traditional net present value or real option analysis)? How
should the cost of capital be adjusted for differences in project and country risk? How
should cash flow be defined? For firms with substantial research and development
budgets, the CFO is often assigned the responsibility for final allocations. In addition to
internally generated growth, most firms have a development officer in charge of mergers
and acquisitions, joint ventures, and divestitures, who reports to the CFO. Closely related
are issues that affect the ownership structure of the company – dilution of ownership
value, violation of debt covenants, equity carve outs (initial public offerings of ownership
in a business unit), issuance of tracking stock (whose value is based on the income of a
business unit), and issuance of executive stock option. Finally, there is working capital
management (inventory, payables, and receivables policy).
1.3. Organisation of finance
The role and importance, which is attributed to finance in an organisation, is also
reflected by how it is organised. There are several possible models. The main functions of
finance are presented in Figure 3. The accounting and management accounting group of
functions deal with collecting and presenting relevant information to external (tax
12
authorities, customs offices) and internal (managers) users, while the financial
management group of functions is about providing and efficient allocation and
management of financial resources.
Figure 3. Functions of Finance
Companies usually organise financial function in different ways, depending on
which role of finance is emphasised, how large is the organisation, what are its goals,
decision making rules, and traditions.
Figure 4. Centralised model
Finance
Financial management Accounting and management accounting
Treasury and currency exchange management
Short-term and long-term financing
Financial markets and negotiations
Management (operational) analysis and
control
Accounting
Taxes and customs
Management of financial commitments and risks
Internal audit
General management
Financial management
Development management
Operations management
Financial services
Management (operations) analysis
Accounting
Strategy, investment
Investment, acquisitions,
Audit
Information systems
13
Smaller companies usually have a centralised model (Figure 4), when all the
functions of finance are concentrated in one department / unit. This model benefits from
specialisation in financial functions and related cost efficiency. Centralised model in larger
companies creates the risk that finance will be detached from business reality and fail to
perform, especially, on management (operations) analysis and strategic and planning
activities (particularly, if they are integrated in finance and not as separate unit).
In order to overcome these potential dangers, larger companies use decentralised
model (Figure 5), when some of the financial functions are placed within operational units
or their groups. This way, it is ensured that financial perspective is integrated in the
decisions in all domains. However, the decentralisation sometimes can be more costly (for
example, for small companies). This model also creates risk for quality in financial
background, especially, if financial analysis and control is left to non-professionals (e.g.,
commercial analysts will have to analyse profitability or other financial aspects of
commerce).
Figure 5. Decentralised model
Binary model (see Figure 6) is in between of the two models. The support
functions (“focus on form”), such as accounting, audit and dealing with financial
institutions is separated from other functions, which focus on analysis and decision making
(“focus on content”).
General management
Operations management
Financial management
Planning / management
Audit
Treasury and markets
Financing
Accounting
Planning, investment decisions
Management (operations) analysis
and control
14
Figure 6. Binary model
Check Question 2 How the function of finance is organised in your
organisation? What are the implications of such organisation on the
decision making and efficiency of the organisation?
Summary
• Businesses can have various objectives. Maximisation of shareholders’ wealth
is generally accepted as the key objective because it takes account of returns and
risk, and provides a practical measure.
• The performance metrics used for assessment of companies’ success have an
impact on their behaviour because they create incentives. Performance metrics
should embrace all aspects of business finance (e.g. items in all – income
statement, balance sheet and cash flow), short and long-term perspectives as
well as expectations. Unfortunately, the more aspects the metrics covers, the
more complicated it gets.
• The decisions of contemporary financial managers involve investment (resource
allocation / redistribution), financing, and management decisions.
• The functions of finance in a company can be organised in a centralised way,
decentralised way or mix. Centralisation is more common and appropriate for
smaller companies.
Key terms
• Capital harvesting
• Expectations-based management
• Value creation
General management
Finance Management control Operations management
Financial services
Accounting
Audit
Planning, investment
Management (operations) analysis
Information systems
15
Further readings
1. Bragg, S. M. (2007). Financial analysis: A Controller’s Guide. New-Jersey:
John Wiley & Sons.
2. Copelan, T., Weston, J.F., Shastri, K. (2005). Financial theory and corporate
policy. Boston: Pearson Addison Wesley
3. Schlosser, M. (2002). Business Finance: Applications, Models and Cases.
Harlow: Pearson Education.
Review questions and problems
1. Why shareholder value maximisation is a relevant goal for any business
manager?
2. What is meant by value maximisation?
a) mathematical maximum of a value function;
b) highest efforts in a given situation;
c) most complicated company’s performance metrics;
d) economic profit measured by EVA®.
3. Why are company’s performance metrics important? What are the criteria for
choosing the appropriate company’s performance metrics?
4. Which of the financial organisation models is most suitable for small companies
and why? For large corporations?
5. The functions of contemporary CFO:
a) do not embrace anymore investment and financing decisions;
b) involve management of the company’s stakeholders expectations;
c) focus on value creation;
d) focus on long-term.
16
2. DECISION MAKING IN FINANCE
Contents • Steps in decision making
• Separation of investing and financing decision
• Value creation criteria, which can be both non-financial
and financial (payback, net present value, internal rate of
return, activity-decision stages models)
• A glimpse on project finance: application of portfolio
management for project management
• This chapter also includes some tips for using spreadsheets
2.1. Steps in decision making
Like any other decision-making area, financial decisions involve choices between
two or more possible courses of action. If there is only one possible course of action, no
decision is needed. All decision making should involve six steps, enumerated below.
1. Define objectives. The decision maker should be clear what the outcome of the
decision is intended to achieve.
2. Identify possible courses of action. At this stage, consideration should be
given to any restrictions on freedom of action imposed by law or other forces
not within the control of the decision maker. However, focus should be not
restrictions and obstacles but rather opportunities, i.e., business opportunities
and the means to finance them. Such opportunities will not often make
themselves obvious, and businesses need to be searching for them constantly. A
business failing to do so will certainly be heading into decline and opportunities
will be lost to its more innovative competitors.
3. Assemble data relevant to the decision. Under uncertainty, identifying only
relevant information is crucial due to at least two reasons – because collecting
data is costly (both money and time-consuming) and then at presence of
irrelevant information, there is a risk that the decision makers would be
confused and a sub-optimal decision would be taken.
There are two criteria a piece of information should satisfy in order to be
relevant and worthy of taking into account:
o The information should reply to the objectives of the decision maker.
Suppose that a company wants to buy some raw materials to accomplish one
17
project and get the best trade-off between quality and price. It means that the
information should be restricted to some technical parameters and price.
Other information, such as terms-of-payment, packaging size, country of
origin will be irrelevant.
o The information should be specific to the decision in question. Since
decisions involve selection from options, they can be sensibly made on the
basis of differences between them. This makes the factors, which are
common to all considered options, irrelevant. Therefore, sunk costs – the
costs, which refer to the past – are irrelevant for any decision making
because these costs will be the same for all options.
4. Assess the data and reach a decision. The data is usually assessed using some
pre-defined criteria. In some cases, the criteria will be easily quantifiable, in
some others, not so easy. In any case, some minimum threshold should be set
up. Another issue with the criteria is that they will not be equally important for
taking the decision. One should at least separate the necessary to fulfil and
“nice-to-have” criteria.
5. Implement the decision.
6. Monitor the effects of decision. Monitoring is important for at least two
reasons. First, it allows correcting the mistakes or changing the decision in time.
Second, by monitoring, knowledge base is built and it is possible to take more
efficient decisions in the future. In practice, most of the monitoring of the
decisions in financial terms is through the accounting system. Relevant
management accounting is very important at this stage. An example of
monitoring would be the budgetary control routines.
Check Question 3 Gadget Wizards Ltd has been approached by a customer
who would like a special job to be done for him, and is willing to pay 60 000 € for it. The job would require the following materials. Mate-rial
Units required
Units in
stock
Book value of units in stock €/unit
Realisable value €/unit
Replace–ment cost €/unit
A 1000 0 - - 16.00
B 1000 600 12.00 12.50 15.00 C 1000 700 13.00 12.50 14.00 D 200 200 14.00 16.00 19.00
• Material B is used regularly by Gadget Wizards Ltd, and if units of B are required for this job, they would need to be replaced to meet other production demands.
• Materials C and D are in stock due to previous over-buying, and they have restricted use. No other use could
18
be found for material C, but the units of material D could be used in another job as a substitute for 300 units of material E, which currently costs 15 €/unit (the company has no units of material E in stock at the moment).
Calculate the relevant costs of material for deciding whether or not to accept the contract. Justify your treatment of each material.
2.2. Separation of investment and financing decisions
The separation theorem says that investment decisions and financing decisions
should be made independently of one another. This proposition was first identified by
Irving Fisher in the 1930s and was formally set out by Hirshleifer (1958). The theorem is
built on three main propositions:
1. Businesses should invest in projects that make them wealthier. By doing this the
wealth of the shareholders will be increased. Usually this means that businesses
should invest in the opportunities that have a rate of return higher than the
borrowing / lending rate in order to maximise shareholders’ wealth.
2. Personal consumption / investment preferences of individual shareholders are
irrelevant in making corporate investment decisions. Irrespective of when and
how much individual shareholders wish to spend, there will be more available to
them provided that the investment policy outlined in proposition 1 is
implemented. This is because the instruments, which allow redistributing
financial resources in time – borrowing and lending – exist.
3. The financing method does not affect the shareholders’ wealth. Provided that
the investment policy outlined in proposition 1 is implemented, it does not
matter whether the investment is financed by the shareholders or by borrowing.
The separation theorem gets some criticism because of the simplifying
assumptions, on which it is built. However, even if it does not strictly hold true in practice,
it does give some insights into the relationship between shareholders and managers in the
context of real investment decisions.
The financial decisions in the company are not limited to investment. Sometimes,
the decision can be related to cancelling investment or pre-mature project termination in
order to protect investors against possible further losses.
19
2.3. Value creation criteria
Businesses operate by raising finance from various sources, which is then invested
in assets, usually real assets such as plant and machinery. Some businesses also invest in
financial assets, like the shares of another business or loans to businesses and individuals.
Selecting which investment opportunities to pursue and which to avoid is very
important matter to companies because:
• individual projects frequently involve relatively large and irreversible
commitments of finance;
• they involve this commitment for longer periods of time; and future
benefits also are distributed over time with some degree of uncertainty.
2.3.1. Non-financial criteria for value creation
All the business opportunities in practice are compared against non-financial
criteria, which can and should be combined with the financial ones. The non-financial
criteria sometimes can prove to be more efficient than financial ones and are crucial in the
financial decisions.
These criteria include such matters as whether the particular business opportunity
under consideration fits in with the general strategy of the company, whether it seems to
have growth potential and whether the competitive position of the product and the business
would be improved and so on.
These criteria are set during strategic planning, during which the direction, in
which the business needs to go, in terms of products, markets, financing etc., is defined. In
practice, strategic plans seem to have a time span of around five years and generally tend
to answer two questions: where do we want our business to be in five years’ time and how
can we get there.
Strategic planning usually takes several steps, which are in essence similar to the
general decision-making steps:
• defining mission and objectives;
• analysing current position;
• identifying and assessing the strategic options;
• selecting strategic options;
• review and control.
The strategic planning sets the framework for operational decision making.
20
2.3.2. Payback period
Payback period (PBP) is one of the simplest ways to evaluate investment
opportunity. This technique is about finding how long will it take for the investment to pay
for itself out of the cash inflows that it is expected to generate.
The decision rule for the payback period is that projects will be selected only if
they pay themselves within a predetermined period. Usually, alternative projects will be
assessed by selecting the one with the shorter PBP (provided it was within the
predetermined maximum).
Because of its characteristics (such as simplicity of use and the method’s
shortcomings, which are described further), this method can be used for short-term and
smaller-scale projects. However, it is not recommended to use it for long-term and large
scale projects.
The shortcomings of the PBP method are the following:
• it does not relate to wealth maximisation as it favours shorter-term projects and
thus promotes liquidity rather than increased value;
• it does not consider all relevant information – it ignores anything that occurs
beyond the payback period.
• it does not take into account time value of money.
The last shortcoming of PBP can be fixed by discounted PBP (DPBP), when
discounted cash flows are used for calculation of payback period (see Example 1).
Discounting, however, does not correct the other shortcomings of the PBP method,
namely, focus on short-term and liquidity and ignorance of what happens after payback.
21
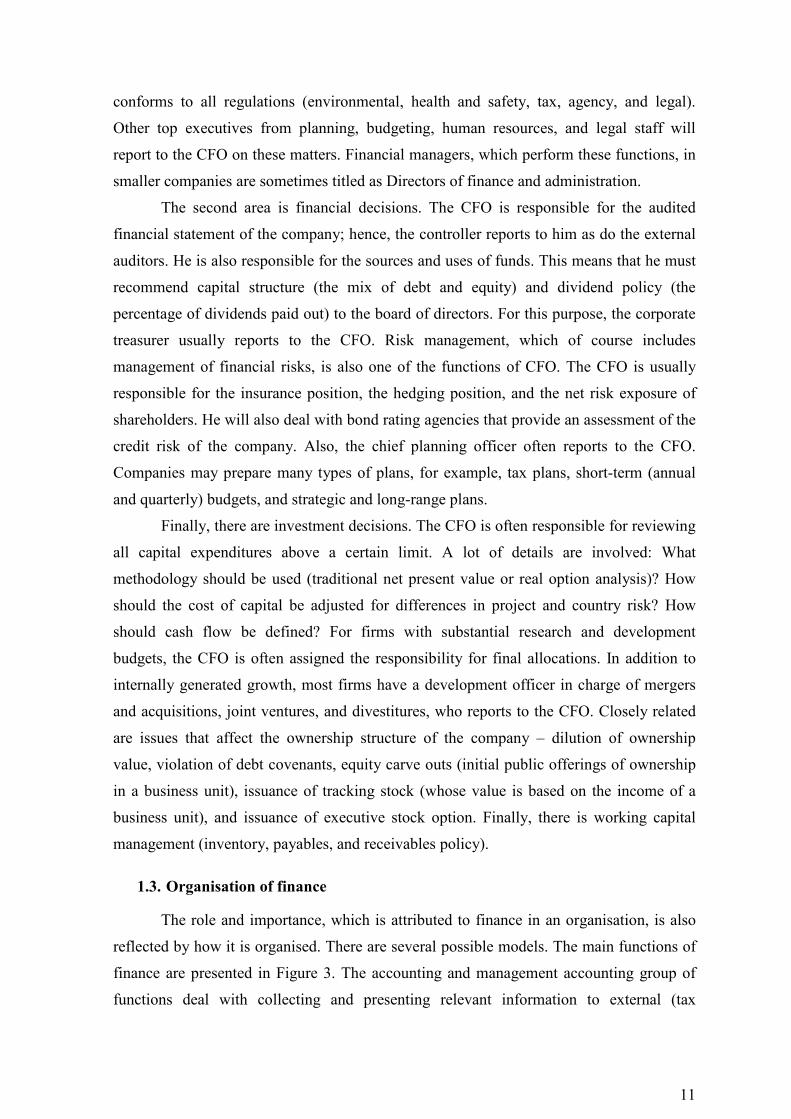
Example 1 Suppose, a company invests 10 000 € and expects the cash flows as demonstrated in the table below. The investment’s payback period, if PBP is used, is 3,67 years.
PBP DPBP PBP DPBP
Year CF PV(CF) Accumulated
CF Accumulated
PV(CF)
0 -10000 -10000 -10000 -10000
1 1500 1402 -8500 -8598
2 2500 2184 -6000 -6415
3 4000 3265 -2000 -3149
4 3000 2289 1000 -861
5 3000 2139 4000 1278
6 3000 1999 7000 3277
Payback period (in years) 3,67 4,40
If the interest rate is 7%, the cash flows need to be discounted – present value of cash flow is calculated in the column PV(CF). Just as for PBP, accumulated cash flows need to be calculated (column Accumulated PV(CF)). Using discounted cash flows, we get a payback period of 4,40, which is the payback that takes into account the time value of money.
2.3.3. Net present value
For investment decision, the net present value (NPV) approach is among the most
widespread. It takes into account time value of money, which depends on three main
factors: interest forgone in case the investment is made, inflation, and risk.
Net present value approach is about discounting future cash flows. An alternative
approach could be the net future value approach, which involves compounding cash flows
instead of discounting. However, there are at least two reasons for favouring the net
present value approach:
• When comparing investment opportunities, if net future value is to be used,
a decision must be made on when in the future the value should be
assessed. If the opportunities are of unequal length, this can cause
difficulties.
• If the opportunity is to be assessed by looking at its effect on the value of
the business, it is more logical to look at the present effect rather than the
future effect.
The NPV of any investment opportunity is given by:
0 (1 )
nt
tt
CFNPV
r=
=+
∑ ,
22
where CFt is the cash flow at time period t,
r – the required rate of return, used for discounting.
The required rate of return represents the cost of finance. As most businesses are
financed by equity or borrowed funds, the financing cost is partly the cost of equity and
partly interest cost, aggregated by WACC (weighted average cost of capital). As
discounting deals with the financing costs (the future cash flows are reduced (discounted)
to take into account of the time and the relevant cost of finance), the cost of finance to
support the project should not be included in the cash flow.
While calculating NPV, both cash flow and cost of finance should be estimated in a
consistent way. This means, that for example, when the cash flows are estimated in money
terms (incorporating inflation effect), then the discount rate should be based on the money
cost of finance as well (that is adjusted by inflation). The relationship between the real and
money rate and the inflation rate is
)1)(1(1 irr rn ++=+ ,
where i is the inflation rate;
rr – real rate,
rn – nominal (or money) rate.
If the cash flows are to be assessed in real terms, then the discount rate must be
based on the real cost of capital.
Spreadsheet tips:
In MS Excel, NPV can be easily calculated using the following functions:
• NPV(rate,value1,value2, ...), where rate is the discount rate for one time
period and value1, value2, etc. represent cash flows. This function
calculates net present value when cash flows are spaced in time equally and
the discount rate does not change over time. Important to know, that this
function assumes that cash flows occur at the end of each period. If we
want to assume that cash flows occur at the beginning of each period, the
value1 should be excluded from the function arguments and added
separately (i.e. net present value = value1+NPV(rate,value2, …).
• XNPV(rate,values,dates) function is used to calculate the net present value
for a schedule of cash flows that is not necessarily periodic. It requires
entering exact dates when cash flows occur.
23
Annualised NPV approach
Financial managers must often select the best of a group of unequal-lived projects.
Use of NPV to select the better project may result in an incorrect decision. In order to
compare such type of mutually exclusive projects correctly, the differing lives must be
considered in the analysis. The annualised net present value approach is one of the most
efficient techniques to do so. This approach can be applied by using the following steps:
1. Calculate the net present value, NPV, of each project over its life using the
appropriate cost of capital.
2. Divide the net present value of each project having a positive NPV by the
present-value interest factor for an annuity at the given cost of capital and the
project’s life to get the annualised net present value, ANPV, for each project.
3. Rank and select the best projects. The project having the highest ANPV would
be the best, followed by the project with the next highest ANPV, and so on.
Example 2 Suppose, a company decides, in which project – A or B – it should invest. The related investment and expected cash flows in € and calculated present value at 10% discount rate are presented in the table below.
Project A Project B
Year Projected CF PV(CF) Projected CF PV(CF)
0 -70 000 -70 000 -85 000 -85 000
1 28 000 25 455 35 000 31 818
2 33 000 27 273 30 000 24 793
3 38 000 28 550 25 000 18 783
4 20 000 13 660
5 15 000 9 314
6 10 000 5 645
NPV 11 277 19 013
According to the NPV criterion, project B should be chosen. The annualised NPV for each project can be
calculated using the PVIFA factor (at 10%, which is given cost of capital, and 3 for project A, which is its life time, and 6 for project B, which is project B’s life time):
10%,3
11277AANPV
PVIFA= ;
10%,6
19013BANPV
PVIFA= .
Alternatively, ANPV can be calculated using the MS Excel function PMT (see Chapter 6.1 on the use of the function).
ANPVA equals 4 535 €. It means that 11 277 € of project A’s NPV corresponds to annual positive flow of NPV of 4 535 (for three years); while ANPVB equals 4 366 €.
Project A will be recommended because it provides higher annualised net present value.
24
2.3.4. Internal rate of return
The internal rate of return (IRR) approach seeks to identify the rate of return that
an investment project yields on the basis of the amount of the original investment
remaining outstanding during any period, compounding interest annually. Technically, the
IRR is the discount rate that gives the project a zero NPV.
IRR is not directly related to wealth maximisation criterion. Even though NPV and
IRR can give similar results, when the projects involve a different scale of investment,
they can sometimes give conflicting signals. Assume finance is available at 10% rate.
Then, the IRR decision rule would say accept the project if IRR is more than 10%.
However, 13% on a 10 000 € investment gives more than 14% on 6 000 € investment.
Thus, IRR does not take into account difference in scale.
Another shortcoming of IRR is that it cannot deal with the rate of return, which
differs over time. It gives an average rate of return over the all project period. While, if the
required rate of return is fluctuating, the IRR will be sometimes below it, sometimes
above, and the decision maker faces a difficult problem. NPV method in this respect is
more favourable because it can use several rates of return.
Moreover, due to mathematical properties, IRR can have more than one solution or
none at all – it usually arises when the cash flows are not conventional, for example, when
investments – negative cash flow – appear not only at the beginning of the project life time
but also in the middle or end of the life time.
To conclude, IRR can be an alternative decision-making technique to NPV,
however, it can be used only when cash flows and required rate of return are without
irregularities. If IRR and NPV give conflicting results, NPV is preferable method.
Spreadsheet tips:
In MS Excel, IRR can be easily calculated using the following functions:
• IRR(values,guess) – it returns the internal rate of return for a series of cash
flows. These cash flows do not have to be even, however, the cash flows
must occur at regular intervals, such as monthly or annually.
• MIRR(values,finance_rate,reinvest_rate) gives the modified internal rate of
return. MIRR considers both the cost of the investment and the interest
received on reinvestment of cash. Here finance_rate is the interest rate you
pay on the money used in the cash flows. Reinvest_rate is the interest rate
you receive on the cash flows as you reinvest them.
25
2.3.5. Economic profit
Economic profit (EP, also sometimes called economic value added or EVA®) is
one of the most dynamic performance measurements to account properly for all ways, in
which value can be created or lost.
Economic profit is not to be mixed with the accounting profit. Conceptually,
economic profit is the difference between the revenue received from the sale of an output
and the opportunity cost of the inputs used.
Note that accounting profit includes the cost related to revenue generation but not
the opportunity cost. Opportunity costs are the alternative returns foregone by using the
chosen inputs. As a result, it is possible to have a significant accounting profit with little or
no economic profit.
Example 3 Suppose, you open a new business and the start-up
company gets 120 000 € revenues in a year. The costs related to these revenues (raw materials, other operating expenses etc) amount to 100 000 €. Thus, the accounting profit for the year is 20 000 €.
However, say that if you had been employed the same year, you could have earned and income of 30 000 € (this is your opportunity costs of opening a business). Thus, the economic loss is 10 000 € (20 000 €-30 000 €).
In terms of business finance, economic profit, which measures a company’s
financial performance based on the residual wealth, is calculated by deducting cost of
capital from its operating profit adjusted for taxes on a cash basis.
The formula for calculating EP is as follows:
EP NOPAT I WACC= − ⋅ ,
where NOPAT is net operating profit after taxes, I – invested capital, WACC – weighted average cost of capital.
An alternative way to express the formula is
( )EP R WACC I= − ⋅ ,
where R – economic rate of return, which can be approximated by ROIC, when we use capital invested as a measure of I or ROCE when we use capital employed as a measure of I.
Note that NOPAT NOPAT Sales
R NOPAT margin Capital turnoverI Sales I
= = ⋅ = ×
Economic profit will increase if:
• new capital is invested in any project that earns more than the cost of capital;
26
• capital is diverted or liquidated from business activities, which do not cover the
cost of capital;
• NOPAT increases without increasing the capital.
Check Question 4 Assume the company’s profit and loss statement is as
below (all numbers in ‘000 €): Sales revenue 275
- CoGS 80 Gross profit 195
- Marketing and Advertisings costs 38
- Administrative costs 40 EBITDA 117
- Depreciation and Amortisation 57 EBIT 60
- Interest cost 10 EBT 50
- Taxes 10 Net profit 40
In addition, company’s debt is 100 and equity 200. The average rate of return on the stock market is 15%
a) calculate NOPAT; b) calculate the economic profit of the company.
What conclusions and recommendations can you make concerning the company’s performance based on your results?
2.3.6. Activity-decision stage models
It was argued that the net present value (NPV) or internal rate of return (IRR) are
acceptable methods for evaluation of projects, but these are subject to large biases when
the value of the project is under the influence of changing factors. There are some
alternative methods, which are claimed to allow a project’s potential payoff to be
determined more accurately than by use NPV or IRR methods. These models are based on
the theory of optimal stopping times, the models for which have been used to evaluate
uncertain investment projects that take time to build value and provide no pay-off if
stopped before reaching a well-defined point of completion.
The build-up of value can vary, with:
1. a linear relationship with time,
2. a fast build-up in value early (decelerating build-up), or
3. most of the build-up in value appears late in the project (accelerating build-up).
A project developing new technology, for example, would have an accelerated
build-up − most of the value is generated at the end because potential benefits from most
of the solutions found in the early stages may not be fully realizable until other project
problems are solved. Since this type of project has a low salvage value early on, it is
27
subject to high downside risk. The general approach to finding a solution to the optimal
stopping time is to search for an optimal profit function that satisfies several optimality
conditions.
The decision whether to continue investment into a project can be based on the
objective stopping rules based on computationally-intensive statistical analysis, which
have appeared fairly recently. A typical example of stage-decision model application
would be an R&D or innovation project. Let us explore it more.
As part of the decision model, the R&D process is broken down into five stages
entailing four decision points. The five project stages are:
1. initial screening,
2. commercial evaluation,
3. development,
4. manufacturing / marketing launch,
5. initial commercialisation.
The four decision points are between the stages. This model is diagrammed in
Figure 7.
28
Figure 7. Activity-decision stage model
A probability function is derived for each stage that measures the probability of
success at that stage. There are eight variables used in the model (see Table 1), these
variables are assigned a value on a scale of 1-5 by personnel familiar with the R&D
project.
Initial screening
o Preliminary market assessment o Preliminary financial assessment o Preliminary technical assessment
Ideas
Decision 1
Commercial evaluation
o Detailed market assessment o Detailed financial assessment o Detailed technical assessment
Decision 2
Development
o Specifications and design o Prototype construction o Prototype testing
Decision 3
Manufacturing / Marketing launch
o Tooling and documentation o Pre-production o Testing and redesign o Initial market testing o Marketing strategy o Distribution and sales o Failure tracking
Initial commercialisation
Decision 4
Stage 1
Stage 2
Stage 3
Stage 4
Stage 5
29
Table 1. Variables used in activity decision stage model Stage Variable
1 Initial Screening CORPFIT Fit of project with corporate goals.
2 Commercial Evaluation
SCITEK Availability of related science and technology. REACTION Support for project from others in company. USES Applications for innovation not previously available using similar or substitute technology. TEKCAPAB The adequacy of a company’s technical capability to support the project’s complexity.
3 Development
DEVPROC Efficiency of development process. COMTEKFT Association between project’s commercial and technological aspects, such as the extent to which the end product matches the user’s requirements, and the extent to which the company can sell the product within acceptable mark-up levels.
4 Manufacturing / Marketing Launch
TEKCAPAB (see above) MKTEFORT Level of effort invested in promotion/selling activities.
The probability of success πnew is derived using the likelihood function
newπ 1/(1 )Y
newe= + , where Y
newe is the exponent of the probability function
0 1 1 .. n nY x xβ β β= + + + for each stage. The probability functions for the four decision
points, determined from the regression analysis, are:
Stage 1: Y = 12,12-2,60·CORPFIT
Stage 2: Y = 12,12+2,60·SCITEK-3,65·USES-3,37·REACTION-3,94·TEKCAPAB
Stage 3: Y = 20,18-3,80·DEVPROC-2,65·MKTEFORT
Stage 4: Y = 8,25-4,23·TEKCAPAB-1,95·MKTEFORT
The probability of success for the new project, πnew, is compared to a
predetermined threshold probability πc set by management. If πnew> πc, the project is likely
to be successful, and the project should be continued. If not, the project should be
terminated.
As an example of how these formulas are used, assume that at the completion of
Stage 1 (at decision point 1) the value of CORPFIT is 4 (on a scale of 1 to 5), the
probability function Y is 9.61, resulting in a likelihood function of 0.0942. This indicates
about a 10 percent likelihood of success, and the project should be abandoned. If, on the
other hand, CORPFIT was 5, the likelihood function would be 0.70, and the project should
proceed to Stage 2. (This particular result is consistent with the strong correlation between
the fit of a project within a corporation and the project’s chances of success.) A similar
analysis is made at the other three decision points as the project proceeds.
A key to implementing this technique, in addition to the evaluation of the eight
independent variables, is the determination of the threshold probability. Generally, it will
reflect the risk tolerance of management. A concern is that, at early stages of a project,
there may be a tendency to assess project variables in a more optimistic fashion due to
30
initial enthusiasm. Thus, management may want to set early thresholds at relatively low
values.
The shortcoming of statistics-backed activity-decision stage method is that it
requires a substantial amount of quantitative data in order to find out the relationships
between the rate of project success and relevant factors. These relationships may vary
across the industries or companies. It is worth noted that the idea of activity-decision stage
method (sometimes can be called stage-gate method) can be applied without lengthy
calculations as well.
2.4. Project finance as a portfolio management
Project portfolio management is about investing business resources, i.e. project
prioritization and allocating resources across the projects. In a business world preoccupied
with value to the shareholder and doing more with less, resources available for technology,
marketing or other uses are simply too scarce to waste on the wrong projects. The
consequences of poor portfolio management are evident: scarce resources are wasted, and
as a result, the truly deserving projects starve.
There are four main goals in project portfolio management:
1. maximizing the value of the portfolio;
2. seeking the right balance of projects;
3. ensuring that the portfolio is strategically aligned;
4. making sure there are not too many projects for the limited resources a company
has.
There are many tools – some quantitative, others graphical, some strategic –
designed to help to chose the right portfolio of projects. Let us explore the four goals and
related tools in more depth.
Maximizing the value of the portfolio. Here the goal is to select projects so as to
maximize the sum of the values or commercial worth of all active projects in the pipeline
in terms of some business objective. Tools used to assess “project value” and to build
project portfolio can include:
• Net present value (NPV) index. Using this method, first, the net present value of
projects is determined, then, the projects are ranked by NPV divided by the key
or constraining resource (for example, in case of new product development, if it
is the R&D costs still left to be spent on the projects, the rank would be by
NPV/R&D). Projects are rank-ordered according to this index until out of
31
resources, thus maximizing the value of the portfolio (the sum of the NPVs
across all projects) for a given or limited resource expenditure.
Expected commercial value (ECV). This method uses decision-tree
analysis, breaking the project into decision stages – for example, in
case of new product development project, the decision stages could be
development and launch (Figure 8). Define the various possible
outcomes of the project (cash flow at each stage, D, C and E) along
with probabilities of each occurring (for example, pts – probability of
technical and pcs – for commercial success).
Figure 8. Determination of a project’s expected commercial value
The resulting ECV at time of the decision (suppose, t0) is then calculated by
( )( )DpCpEPVECV tscs −⋅−⋅= ,
where pts – probability of technical success,
pcs – probability of commercial success (given technical success),
D – development costs remaining in the project,
C – launch (commercialisation) costs,
E – project’s future earnings,
PV – present value.
The ECVs of the projects are then divided by the constraining resource; and
projects are rank-ordered according to this index in order to maximize the value
of the portfolio. This method approximates the real options theory, and thus, is
appropriate for handling higher risk projects.
• Scoring model. Decision-makers rate projects on a number of questions that
distinguish superior projects, typically on 1-5 or 0-10 scales. The sum of these
ratings yields a quantified project attractiveness score, which must clear a
minimum hurdle. This score is a proxy for the “value of the project” but
Research and Development
D
Launch C
time
pts
(1-pts)
Technical success
pcs
(1-pcs)
Commercial success
t0
ECV at t0
Technical failure
Commercial failure
Future earnings
E
32
incorporates strategic, leverage and other considerations beyond just financial
measures. Projects are then rank-ordered according to this score until resources
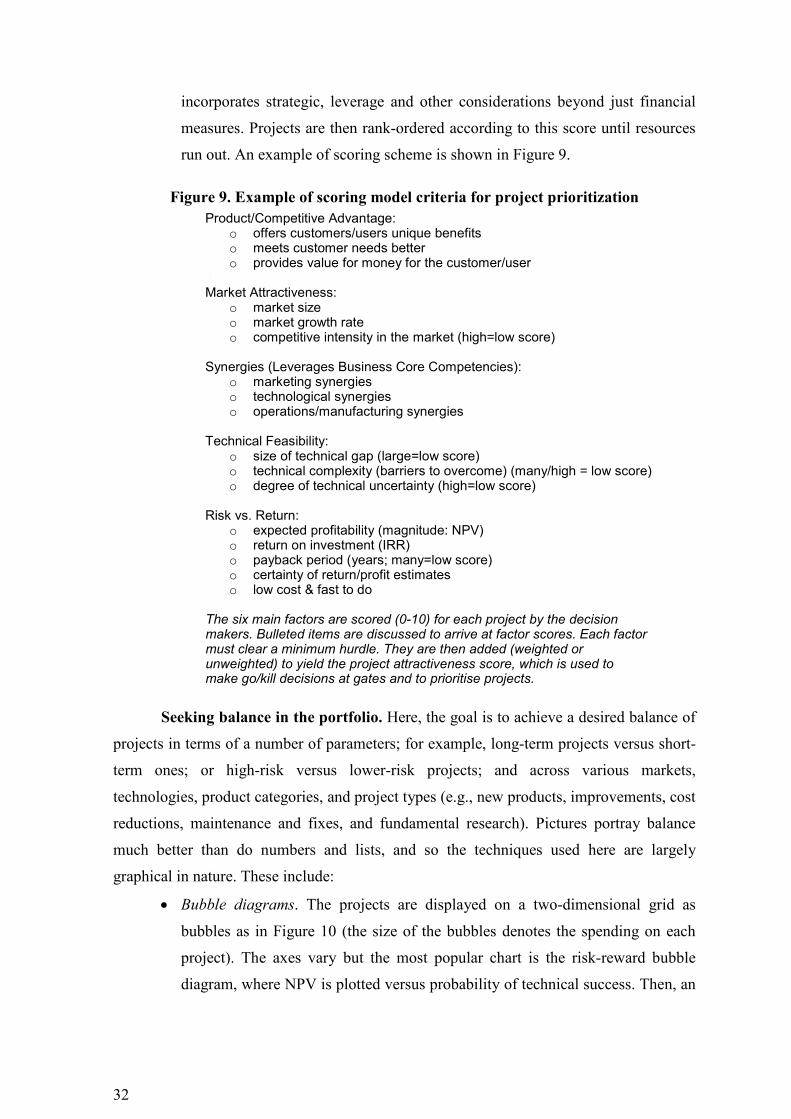
run out. An example of scoring scheme is shown in Figure 9.
Figure 9. Example of scoring model criteria for project prioritization
Seeking balance in the portfolio. Here, the goal is to achieve a desired balance of
projects in terms of a number of parameters; for example, long-term projects versus short-
term ones; or high-risk versus lower-risk projects; and across various markets,
technologies, product categories, and project types (e.g., new products, improvements, cost
reductions, maintenance and fixes, and fundamental research). Pictures portray balance
much better than do numbers and lists, and so the techniques used here are largely
graphical in nature. These include:
• Bubble diagrams. The projects are displayed on a two-dimensional grid as
bubbles as in Figure 10 (the size of the bubbles denotes the spending on each
project). The axes vary but the most popular chart is the risk-reward bubble
diagram, where NPV is plotted versus probability of technical success. Then, an
Product/Competitive Advantage: o offers customers/users unique benefits o meets customer needs better o provides value for money for the customer/user
3. Market Attractiveness:
o market size o market growth rate o competitive intensity in the market (high=low score)
Synergies (Leverages Business Core Competencies):
o marketing synergies o technological synergies o operations/manufacturing synergies
Technical Feasibility:
o size of technical gap (large=low score) o technical complexity (barriers to overcome) (many/high = low score) o degree of technical uncertainty (high=low score)
Risk vs. Return:
o expected profitability (magnitude: NPV) o return on investment (IRR) o payback period (years; many=low score) o certainty of return/profit estimates o low cost & fast to do
The six main factors are scored (0-10) for each project by the decision makers. Bulleted items are discussed to arrive at factor scores. Each factor must clear a minimum hurdle. They are then added (weighted or unweighted) to yield the project attractiveness score, which is used to make go/kill decisions at gates and to prioritise projects.
33
appropriate balance in numbers of projects (and spending) across the four
quadrants can be sought.
• Pie charts show the spending breakdowns as slices of pies in a pie chart.
Popular pie charts include a breakdown by project types, by market or segment,
and by product line or product category.
Figure 10. Example of risk-reward bubble diagram
Both bubble diagrams and pie charts, unlike the maximization tools outlined above,
are not decision-models, but rather information display: they depict the current portfolio
and where the resources are going – the “what is”. These charts provide a useful beginning
for the discussion of “what should be” – how should the resources be allocated.
Strategic alignment of the portfolio. This means that all the projects of a
company are “on strategy”; and that the breakdown of spending across projects, areas,
markets, etc., must mirror the company’s strategic priorities (the areas of focus and their
respective priorities). Several portfolio methods are designed to achieve strategic
alignment:
• Top-down, strategic buckets. Begin at the top with the business strategy and
from that, the functional strategies - their goals, and where and how to focus the
new business initiatives. Next, make splits in resources: “given the strategy,
where should the money be spent?” These splits can be by project types,
product lines, markets or industry sectors, and so on. This way, strategic buckets
or envelopes of resources are established. Then, within each bucket or envelope,
all the projects – active, on-hold and new – should be listed and ranked until the
resources in that bucket are exhausted. The result is multiple portfolios, one
High
Low
Reward (NPV)
High Low
“White elephants”
“Bread and butter”
“Oysters”
“Pearls”
Probability of technical success
34
portfolio per bucket. Another result is that the spending at year-end will reflect
the strategic priorities of the business.
• Top-down, product roadmap. Beginning is again at the top, namely with the
business strategy. But here the question is: “given that you have selected several
areas of strategic focus - markets, technologies or product types - what major
initiatives must you undertake in order to be successful here?” It's analogous to
the military general asking: given that I wish to succeed in this strategic arena,
what major initiatives and assaults must I undertake in order to win here? The
end result is a mapping of these major initiatives along a timeline - the product
roadmap. The selected projects are strategically driven.
• Bottom-up approach. “Make good decisions on individual projects, and the
portfolio will take care of itself” is a commonly accepted philosophy. If the
project gating system in a company is working well – that is, the good projects
are accepted, and the poor ones are killed in time, the resulting portfolio will be
a solid one. To ensure strategic alignment in the bottom-up approach, when a
scoring model is used, a number of strategic questions in the model should be
included. This way, the portfolio will indeed consist of all “on strategy” projects
(although spending splits may not coincide with the strategic priorities).
Note that regardless of the strategic approach here, all of these methods presuppose
that the company does indeed have projects-driven strategies.
The right number of projects. Most companies tend to have too many projects
underway for the limited resources available. The result is pipeline gridlock: projects end
up in a queue; they take too long to reach the market; and key activities – for example,
doing the up-front homework – are omitted because of a lack of people and time. Thus, an
over-riding goal is to ensure a balance between resources required for the active projects
and resources available. Here are the ways:
• Resource limits. The value maximization methods (goal 1) build in a resource
limitation – rank the projects until out of resources. The same is true for bubble
diagrams (goal 2): the sum of the areas of the bubbles - the resources devoted to
each project – should be a constant, and adding one more project to the diagram
requires that another be deleted.
• Resource capacity analysis. Determine the demand for resource: prioritize the
projects (best to worst) and add up the resources required by department for all
active projects (which can be expressed in money terms, person-days per month
etc.). Project management software, such as MS Project, enables this roll-up of
35
resource requirements. Then, the available resources (the supply) are to be
determined. A more detailed, i.e., a department-by-department and month-by-
month, assessment usually reveals that there are too many projects; it suggests a
project limit (the point beyond which projects in the prioritized list should be
put on hold); and it identifies, which departments are the bottlenecks.
Summary
• Financial decision making has six main steps: define objectives; identify
possible course of action; assemble data relevant to the decision; assess the data
and reach the decision; implement the decision; monitor the effects of decision.
• Separation of investment and financing decisions says that if there is an
opportunity to borrow and lend money, investment and financing decisions can
be separated. Provided business invest in all opportunities that have a rate of
return higher than borrowing / lending rate, the shareholders’ wealth will be
maximised and the financing method does not affect shareholders’ wealth.
These conclusions are based on simplifying assumptions.
• In practice, value creation criteria embrace both non-financial and financial
criteria. Non-financial criteria include such criteria as strategic alignment,
competitive position and so on. Financial methods to assess value creation
include payback period, net present value, internal rate of return, economic
profit. All these can be applicable for both investment and termination decision.
• If the company organises its activities by projects, portfolio management
approach helps to maximise the value the company creates. The value of the
portfolio can be maximised using NPV, ECV or scoring methods. The balance
of portfolio in terms of project number, size, risk and so on is achieved with the
visualisations of bubble diagrams and pie charts. Strategic alignment is achieved
with the help of strategic buckets, product roadmap or bottom-up approaches.
Key terms
• Activity-decision stages model
• Decision making
• Economic profit (Economic value added)
• Expected commercial value (ECV)
• Internal rate of return (IRR)
• Net present value (NPV)
36
• Payback period (PBP)
• Project portfolio management
• Scoring model
• Separation theorem
• Strategic planning
Further readings
1. Cooper, R. G., Edgett, S. J. (2001). Portfolio Management for New Products:
Picking the Winners // Working paper No. 11. Online: http://www.prod-
dev.com.
2. Crawley, S. (2005). Failed R&D project identification. Online:
http://stevencrowley.com/papers/.
3. Damodaran, A. (2005). Applied corporate finance: A user's manual. New York:
Wiley.
4. Schlosser, M. (2002). Business Finance: Applications, Models and Cases.
Harlow: Pearson Education.
Review questions and problems
1. When making a decision, an item of information needs to satisfy two criteria in
order to be relevant and worth being taken into account. What are these criteria?
2. Why, according to the separation theorem, the financing method (equity or loan)
does not affect shareholders’ wealth?
3. What is the key point about in the net present value approach to investment
decision making that makes it the most correct method?
4. Evaluate your company’s economic profit.
5. Why do project termination decisions contribute to the value creation?
6. Which of the methods help to achieve strategic alignment in a project portfolio?
a) NPV;
b) IRR;
c) ECV;
d) scoring.
37
3. FINANCIAL FORECASTING AND MODELLING
Contents • Planning, budgeting, and forecasting
• Building pro-forma statements (including income
statement, balance sheet, and cash flow statement)
• Assessing the needs for funds (including external funding)
• Sustainable growth rate
• Using scenarios in forecasting
• Case: developing spreadsheet model
Solving business problems using financial / value creation thinking requires the
following skills:
• Specifying problems so that they can be analysed in value creation terms;
• Searching for and analysing relevant information;
• Selecting adequate financial approaches and defining relevant variables and
relationships;
• Building these into effective models, understanding the outcome of these
models and testing them against concepts and theories.
3.1. Planning vs. budgeting vs. forecasting
The terms “planning”, “budgeting”, and “forecasting” are sometimes used
interchangeably, but each serve a distinctly different role.
Planning refers to defining a set of high-level objectives and targets, formulated in
order to set a strategic direction. The plan is usually prepared by a strategic group of the
company’s top management using the “top-down” approach. Summary accounts level of
detail (often – reporting line items) are used in planning; plans reflect more of an external
focus. That is, the plan shows how the company’s financial and operating plans roll up so
that investors and owners can plan and plot the general progress of the company. Plans are
typically on a multi-year cycle (one to five years perspective, with 1 year being operational
plan and five years – strategic one) and updated annually.
When plans are developed, targets are defined for certain revenue and expense (and
maybe capital and headcount), so that a higher-level goal can be set. The goal generally
serves a dual role. First, the goal acts as guidance for the line and staff managers as well as
38
the company; it also provides the company’s management with a high level benchmark for
strategy. The targets are designed to demonstrate how certain strategic moves should
impact the profit and loss statement, balance sheet and cash flow over a defined planning
horizon. Maybe the company introduces a new product, enters a new market or adopts a
new pricing strategy. Whatever course the company takes, targets define the company’s
financial and human resources and can usually be expressed at a somewhat summary level.
As targets become more detailed, they become the budget and the role of the line or staff
manager becomes more executional and less directional. Fundamentally, the target should
be the what.
Budgeting refers to a detailed financial program of how the company is going to
execute the plan. The budgets are prepared after the financial objectives have been set. The
budget involves agreement, approval of the top management and commitment of the
budget owners, who are responsible for the efficient management. A budget should relate
the overall plan in figures. It is different from a forecast in the sense that the plan, and
therefore the budget, sets minimum requirements, whereas a forecast is usually an estimate
of what is likely to happen.
Example 4 You might choose to budget for sales of 180 MLTL
and use this figure in calculating your likely expenditure, profit and so on.
Based on your market research, however, you predict sales of 200 MLTL, and set a target of 220 MLTL, in order to stretch your sales force. If all your costs are covered by the budgeted figure, then you will make a greater profit if you achieve the forecast and a still greater one if you achieve the target.
Even though this is an important distinction, in practice, for most businesses the forecast and budget will be the same.
Budgets are prepared at a level of detail that corresponds to how actual results are
to be recorded. “Actual vs. Budget” is a means for measuring how the company performed
against what was told to the management when the budgets were submitted. Thus, one can
think of the budgeting as a management of a collection of performance measurements.
These measurements must together encompass:
• fixed assets and capital requirements;
• revenues, direct expenses and gross margin;
• positions and human capital costs (salary, benefits, etc.);
• general and indirect expenses;
• other items specific to business area of the company in question.
39
These “sub-budgets” together form the performance management framework for
the company over the budgeting horizon. Typically, many firms address each of the
component pieces separately, but it is the package – taken in its entirety – that really
creates tool for a performance measurement and planning solution.
There are a few rules of thumb that separate good from bad budgeting practices:
1. Redo the budget whenever the operating environment changes.
2. Work to set reasonable stretch targets.
3. Assign decision rights to the people who have the right skills and necessary
information.
4. Don’t overreach a manager’s span of control.
5. Be aware that the process of setting expectations is not necessarily incentive
compatible with actual performance.
6. When decision rights are assigned, be sure to assign responsibility and
accountability to them.
7. Be aware of externalities among business units and seek market-based solutions.
8. Be aware of multiperiod problems with measuring performance and designing
incentives.
The first of the eight rules of thumb is almost always violated by bureaucrats who
insist that budgets have to be submitted at the same time each year no matter if the revision
is needed or not. When a dramatic (and usually unforeseen) business event occurs within a
budget cycle, basic budgeting assumptions change and the relevance of the original budget
can decrease dramatically. Therefore, when information, which materially changes the
opportunity set facing a company, arrives, then it is time to revise the plans that are
embedded in the budget and resubmit. An annual budgeting cycle is reasonable only in the
quickly changing environment. Rules 2 and 5 are closely related. Michael Jensen (2002)
has been quoted as saying that “the budgeting process is just an incentive for lying”.
Lower-level management has an incentive to set expectations low – low enough that it
becomes easy to surpass easy benchmarks – a process called sandbagging. There are two
ways to overcome this problem:
1. To be better informed. In order to have a two-way discussion between top
management who must set expected performance standards, and lower-level
management who must perform, it becomes necessary for top management to
take the time and effort to understand the business that they are evaluating.
Critical information may be gathered from former managers of the business,
40
from suppliers, customers, engineers, and from government agencies. An
informed discussion helps to reduce sandbagging.
2. To create an incentive-compatible compensation design. Rules 3, 4, and 6 are
also related. Together they imply that the manager of a business unit should
have a complete control over its resources. For example, a performance
measurement system based on earnings assigns no responsibility for managing
capital efficiently. It is hardly surprising that when managers are not charged for
using the company’s capital, that the sales revenue per currency unit of capital
employed begins to decline. Rules 7 and 8 are easy to state but difficult to
implement.
Forecasting or Projections. Like a used car, the value of the budget usually
diminishes the moment it “goes out the door”. Assumptions change, business rules change
and things happen that are outside of the control of budget owners. For this reason, most
companies have projections or forecasts. The forecast is simply a reflection of the new best
estimate of how the remainder of the budget cycle is going to finish. The forecast or
projection typically includes year-to-date actual results along with the best estimate of the
remainder of the budgeting cycle. Some managers state that one of the criteria for
distinguishing forecast from plan and budget is the commitment: the forecast indeed does
not involve a commitment (like a weather forecast – one can make the forecast or
prediction but cannot plan it); it is revisable whenever the new information arrives.
Forecast could be the basis for the plan and then budget (but not vice versa).
Variance and exception analysis. Most managers like to compare actual results
with all – planned, budgeted, and forecasted – numbers. Since plan numbers are typically
focused on higher level of details, actual vs. plan analysis is the most valuable at a higher
level as well – e.g., profit centres, departments, business units, etc. In the operational
management, the most important of the analyses, however, compare actual results against
budgets or those that compare actuals and forecasts. Both of these analyses take a forward
looking approach as well as a retrospective viewpoint.
3.2. Building pro-forma statements
Forecasting a company’s financial statements can help both financial managers and
general managers. Pro-forma statements help the financial manager plan the company’s
financial needs. With an estimate of future income statement and balance sheet accounts, it
can be told how much financing might be needed, and when it might be needed. One
intention of pro-forma analysis is to forecast a company’s financial statements under some
41
specific conditions. Since total assets must equal the sum of total liabilities and owner’s
equity, any imbalance will require management action. Having forecasted the amount and
timing of the imbalance, a financial manager can arrange for financing (for example,
loans) or investment (e.g., marketable securities) before the need becomes critical.
Pro-forma statements help general managers in overall planning (e.g., employment
and inventory levels) and problem solving. As forecasts are developed, a manager can
analyze the results to identify potential trouble spots and plan accordingly. Finding
problems and trying out solutions in advance is preferred to learning about the problem in
real time. Similarly, by “seeing” into the future with pro-forma statements, a manager can
anticipate opportunities and prepare to exploit them before the window of opportunity
begins to close.
In addition to being a planning tool, pro-forma statements, together with actual
results, can be used to evaluate performance and make midstream corrections. Variance
analysis, a comparison of the plan with actual performance, helps a manager analyse
company’s performance during the budget period, determine its strengths and weaknesses,
and make interim adjustments to the plan.
Figure 11. Financial forecasting flow chart
The financial forecasting flow chart is presented in Figure 11. The first step in
financial forecasting is forecasting sales, which usually directly influence the current assets
and current liabilities as well as retained earnings in the balance sheet. Forecasting fixed
assets and long-term sources of finance in the balance and forecasting cash flow can be
done simultaneously – depending on which method – direct or indirect – is chosen for
creating cash flow statement.
When the forecasted statements are ready, to ensure that the forecast is consistent
and valid, sanity check is needed. It allows identifying indirectly whether the quality of
forecast in terms of methodology (i.e. validity of assumptions) and content (i.e. financial
42
results of the forecasted actions) are satisfactory. It can be done using ratios, horizontal or
vertical analysis.
The accuracy of pro-forma statements is limited by the validity of the assumptions
used in creating them. Often, a number of financial statements are developed by making
different assumptions about sales and about the relationship between sales and the balance
sheet accounts. This is a sort of sensitivity analysis. The resulting set of statements
suggests the most likely outcomes for the company and a range of financing needs. The
sensitivity analysis can be used to answer questions, such as how the company's financial
needs will change if sales are 10 percent below or higher than their expected level, etc.
3.2.1. Forecasting sales
The first step in preparing pro-forma financial statements is to forecast sales.
Although difficult, forecasting sales is essential, because they normally influence the
current asset and current liability account balances (e.g., as sales increase, the company
will generally need to carry more inventory and will have a larger accounts receivable
balance); retained earnings are also tied to sales through the profit margin and dividend
payout ratio.
Sales typically depend on the industry, the economy, the season, and many other
factors.
Industry. In a generic sense, the two main variables in sales revenue are unit price
and volume. These two variables usually have a reciprocal relationship (i.e., a typical
demand curve). Therefore, a statement that, “unit demand will increase by 20 percent over
the next five years” need not mean that sales revenues (unit price × volume) will increase
by the same amount over that time period. An industry that is restructuring may
dramatically shift market share among its participants. Sales forecasters need to identify
important trends and quantify their impact on the company's business.
Economy. Economic business cycles (expansions and recessions) can have a
dramatic influence on some companies, exacerbating the forecasting problem. Cyclic
nature not only affects the level of sales, but also may change the relationship between
sales and the balance sheet accounts. Industries that require a great deal of capital
investment tend to add capacity in large chunks. Unit prices rise and fall depending on
whether there is currently a shortage or surplus of capacity in the industry. Thus, the pro-
forma techniques must be modified for cyclical industries, particularly if experiencing a
down turn.
43
Seasons. Year-end pro-forma balance sheets can project the external financing
needs of a company under specific conditions; however, they are static. When sales are
seasonal, peak financing needs may exceed the pro-forma projection because the pro-
forma is “out of season”. Furthermore, historical end-of-year relationships between sales
and balance sheet accounts may differ during the peak. For example, a toy manufacturer's
accounts receivable may average 5 percent of annual sales every year on the December
31st annual report. However, during the sales peak in August when retailers stock up for
Christmas, accounts receivable might increase to 30 percent of sales. Furthermore, in
September, inventory may peak at 25 percent of sales even though in December inventory
may be much smaller. The analyst must develop monthly pro-forma balance sheets to
become aware of seasonality in order to arrange for a sufficient line of credit.
3.2.2. Forecasting balance sheet and need for external finance
Pro-forma balance sheets are created by forecasting the individual account balances
at a future date and then aggregating them into a financial statement format. Account
balances are forecasted by identifying the forces that influence them and projecting how
the accounts will be influenced in the future by such forces. Sales, company policy, and
restrictive debt covenants are often significant forces.
A. Current Assets and Current Liabilities
Having obtained a sales forecast, the trial pro-forma balance sheet can be created.
Accounts that tend to vary with sales are typically forecasted first. Often, the current assets
and liabilities, such as accounts receivable, inventories, and accounts payable, will move
with sales. For example, a company may make a relatively constant 40 percent of sales on
credit.
In contrast, other accounts, such as long-term debt and dividends may be driven by
other management decisions, not sales. Some accounts such as plant and equipment may
have a relationship to sales in the long run, but not necessarily year to year. For example, a
company could have excess capacity allowing sales to grow without investing in new
assets. Then, when the plant and equipment become capacity constrained, these fixed
assets may grow at a faster rate than sales since equipment and factories tend to come in
“lump” amounts. It may be hard to buy 10 percent of a factory when sales increase by 10
percent.
Three common ways to describe the historical relationship between sales and the
current accounts are:
1. percent of sales,
44
2. ratios,
3. regression analysis.
For illustrative purposes, inventory and accounts payable will be forecasted using
the percent of sales method. Accounts receivables and gross profit can be forecasted using
ratios. For instance, historical profit margin can be used for prediction of future profits,
and average paying / collection periods can be used for forecasting accounts payables or
receivables. Cash will be forecasted using regression analysis. The choice of the
forecasting technique may vary depending on the type of relationship between forecasted
variables, available data and time span.
Example 5 Percentage of Sales. Table below shows the level of
sales, net profit, and the current accounts for 2007-2009.
'000 € 2007 2008 2009
Sales 134,0 189,0 213,0
Net profit 7,1 11,6 10,2
Cash 7,0 11,7 10,2
Receivables 13,7 21,0 24,8
Inventory 18,0 24,0 30,2
Payables 11,0 17,2 19,0
Inventory was 13.4, 12.7, and 14.2 percent of sales for 2007, 2008, and 2009, respectively.
On average, inventory has been 13.4 percent of sales. Thus, given the sales forecast for 2010 of 230, inventory is forecasted to be 30.9 (230·13.4%). On average accounts payable has been 8 percent of sales; thus, accounts payable is estimated to be 18.4 (230·8%).
In this example, the average or mean was used in connection with the percentage of
sales method. However, there will be situations when it makes more sense to use another
statistical measure such as the mode or median. Usage of managers or experts’ judgement
in extrapolating an upward or downward trend is also appropriate and desirable.
Example 6 Ratios. Using the accounts receivable and net income
data from the table in Example 5, the average collection period and the profit margin ratios can be calculated.
Assuming all sales were on credit and a 365 day year, the company took 37, 41, and 42 days to collect the typical account in 2007, 2008, and 2009, respectively.
Note: the average collection period is calculated by
/ 365
Accounts receivables Accounts receivablesACP
Average daily sales Total sales= = .
Given these ratios and some planned improvements in the billing and collection processes, management believes that next year’s receivables will be collected in 40 days, on average. Thus, next year’s receivables account is forecasted to
45
be 25.2 ((230/365)·40). The company’s profit margin ranged from 6.1 percent
in 2008 to 4.8 percent in 2009 and averaged 5.4 percent. Using this three-year average, net profit for 2010 is forecasted to be 12.4 (230·5.4%).
In this example, net income was found using the profit margin ratio. Typically,
managers will forecast a pro-forma income statement, complete with estimates of expenses
such as cost of goods sold, selling and administration expense, interest, and taxes.
Example 7 Regression: Figure below illustrates the regression
technique for cash (x is sales, y – cash level).
y = 0,0483x + 1,005
R2 = 0,6638
0,0
2,0
4,0
6,0
8,0
10,0
12,0
14,0
0,0 50,0 100,0 150,0 200,0 250,0
Sales
Cash
The cash balances have been plotted against sales and the “best fit” lines drawn in. This line or statistical relationship along with the sales forecast of 230 can be used to forecast the new level of cash. Specifically, 2010 forecasted cash will be 0.0483·230+1.005=12.1.
Unless the intercept term in the regression equation is close to zero, the percent of sales method and the regression technique will give slightly different estimates. Generally, the regression estimate is more accurate because it allows for a base amount of the asset when sales are zero.
In practice, the regression function or chart function in Excel are used to find the regression line.
Spreadsheet tips:
In MS Excel, in order to draw the regression line follow these instructions:
• Insert chart: <Insert>, choose <Chart>. If you have one variable, for
which you want to see the trend line, choose Line type of the chart (the
same applies if you have several series, for which you want to see separate
trends). Otherwise, if you have two variables, one of which is dependent on
another, choose Scatter type of the chart.
• On the chart, right-click on the point of the series, for which you would like
46
to see the regression line. Choose <Add Trendline>.
• Right click on the trend line. Under <Options> click <Display equation on
chart> and <Display R-squared value on chart>. Simply put, R-squared
show how good your trend line fits your data. Closer R-squared is to 1,
better is the fit.
Two caveats are appropriate when applying the percent of sales, ratio, and
regression approaches. The first concerns the number of years of historical data and the
second concerns potential problems associated with forecasting accounts based on sales.
First, judgment is needed in determining how far into the past one should go in estimating
the historical relationship. In the provided examples, three years of data were used.
However, if a company’s policies or business environment has changed, then perhaps only
the last year of data is relevant in predicting the future (then, regression does not have any
sense). On the other hand, if policies and the environment have been stable, then perhaps 6
or 7 years of historical data should be used (basically, only then regression can be used).
Second, all three of the above techniques are based on a historical relationship
between various accounts and sales. These historical relationships may not always hold. A
conscious change in policy will alter the historical relationship. For example, due to high
margins, a company may decide to liberalize its credit policy, extending credit to
customers with weaker financial positions. When the analyst suspects a policy change
might occur or when he wants to see the consequences of a recommended change, then the
historical data can, at best, only serve as a starting place to make new estimates. A
management decision to purchase inventory based on the economic order quantity model
will also break historical patterns. As sales grow, inventory amounts will not, but the
frequency of orders will. Relationships with sales may also change as the company grows.
In the regression example, cash was forecasted to increase 0.48 euro cents with every euro
of sales. This relationship may only be true in a one range of sales, say from 150 to 250
thousand. Above this range, the relationship may change because of economies of scale or
using technology such as a lockbox and concentration bank system that were not feasible
when the company was small.
The critical point is that pro-forma statements are not just linear projections of the
past. Pro-forma statements are learning and planning tools used to identify the problems
associated with another year of “business as usual,” to help try out solutions to those
problems before they occur. The manager must gather information about the past, present,
and future, and then develop the best contingency plans possible.
47
Check Question 5 Forecast your company’s inventory and accounts
payable using percentage of sales method.
Check Question 6 Forecast your company’s profit and accounts
receivable using selected ratios.
Check Question 7 Forecast your company’s cash and equivalents
account using regression.
B. Non-Sales Determined Accounts
Retained earnings. The retained earnings account on the balance sheet is a
function of a company’s profitability and its dividend policy. Like the current accounts,
the company’s profits are usually closely linked with sales. To forecast next year’s
retained earnings, the analyst must first forecast net income and then specify how much
will be paid out in dividends. Retained earnings on the balance sheet is a cumulative
account; growing each year by net income and shrinking by dividends:
- Forecasted retained earnings Current retained earnings Net income Dividends= +
Two assumptions about the company’s dividend policy can be commonly made:
dividends are either a constant dollar amount or a constant proportion of earnings.
Other accounts. Other accounts on the balance sheet often do not have such a
close relationship to the level of sales as do the current accounts. Typically, each of these
other accounts needs to be treated individually. Such accounts may be held constant at
their current dollar level or changed in some specified way unrelated to sales volume. The
following are some assumptions that are commonly used when estimating other accounts.
Table 2. Common assumptions for forecasting balance sheet accounts Account Common Assumptions
Net plant and equipment (P&E)
(1) Constant (if unused capacity exists) (2) Percentage of sales (if can be adjusted in small
amounts) (3) Forecast = Current P&E + Capital P&E
expenditures – Depreciation (if future investment is known)
Long-term debt (LTD) (1) Constant amount in the trial pro-forma (2) Forecast LTD = Current LTD – Debt repayment +
Proceeds from new debt
Common stock (CS) (1) Constant in the trial pro-forma (2) Forecast CS = Current CS + Proceeds from Sale of
new stock – Repurchase of stock
Notes payable (1) Constant in the trial pro-forma. (2) Occasionally, notes payable are used to make the
sheet balance, assuming any new external funds required will be borrowed from the bank.
As in the case of forecasting current assets and liabilities, good judgment is
necessary when forecasting these accounts, because each situation is different. The good
48
manager will gather information from past data, present policies, and future expectations,
then make the best estimate possible.
In the end, the balance sheet must balance. If the equity and liabilities side is lower
than the assets, the shortfall will need to be financed through additional external financing,
alternatively, the excess will have to be invested. The balancing amount is sometimes
referred to as the “plug figure” (calculated as total trial assets minus total trial equity and
liabilities). If the plug figure is positive, it indicates that external financing is required to
equate assets with liabilities and owners’ equity. In the trial pro-forma, long-term debt and
common stock are often held constant until the amount of the additional finance amount
required is found. Then, the permissible amounts of debt based on loan restrictions might
be added, with any residual balance covered by equity.
The plug figure may be also negative, which indicates that the company has
internally generated more than enough funds to finance the projected assets. In this case,
the excess funds can be used in many ways including paying off notes payable, investing
in marketable securities, or increasing the amount of dividends paid out.
When a pro-forma income statement and balance sheet are created simultaneously,
care must be taken to tie the two together. For example, interest expense on the income
statement must be related to the level of interest bearing debt on the balance sheet. The
level of debt also feeds back into the income statement by way of taxes. Higher interest
lowers the before tax profit and thus the amount of income taxes.
If the level of interest bearing debt on the pro-forma balance sheet is not set, an
iterative solution to the interest and debt accounts is needed:
1. make a rough estimate of the interest expense (perhaps based on the prior year)
and calculate net income;
2. use the resulting net income to forecast retained earnings and create the pro-
forma balance sheet including the size of the loan;
3. go back to the pro-forma income statement and enter a better estimate of
interest;
4. then iterate back to the balance sheet if your first estimate of interest was off the
mark. The third and fourth steps are examples of tying the pro-forma income
statement to the pro-forma balance sheet.
49
3.3. Assessing the needs for financing
We know that the uses of funds (assets in the balance sheet) must equal the sources
of funds (equity and liabilities in the balance sheet). Thus, any forecasted change in assets
will have to be covered by the change of the same size on the equity and liabilities side.
The increase in forecasted assets corresponds to the increase of the total need for
additional finance in the company. However, some financing is generated “automatically”,
as the company’s activities develop: i.e., the company earns profit and some assets (e.g.,
raw materials) can be acquired with deferred payment – these can be called “internal”
sources. Taking into account these “automatically” generated sources of finance, we can
assess the need for external funds:
Need for external funds = forecasted uses – forecasted “internal” sources
Another way of expressing this relationship is to associate the net uses and sources
of funds with the forecast change in assets, liabilities, and retained earnings. Expressed this
way we have:
Need for external funds assets - liabilities - retained earnings= ∆ ∆ ∆
If the sources and uses of funds are estimated as a constant percent of sales, the
amount of external financing over a one-year period can be calculated according the
formula, which is below. However, this technique is quite simplified and is not accurate if
all the sources and uses of funds do not move as a percent of sales (e.g., it does not account
for such events as the purchase of new fixed assets or repayment of the long-term debt);
this approach does not give the rich details of the full pro-forma. The formula must also be
adjusted for the successive accumulation of earnings retained from profits if a forecast
longer than one year is being made.
)1(1
0
0
0
0 dpSSS
LS
S
A nds xternal fuNeed for e −⋅⋅−∆⋅−∆⋅= ,
where A0/S0 – percentage relationship of variable assets to sales;
L0/S0 – percentage relationship of variable liabilities to sales;
∆S (=S1-S0) – forecasted change in sales;
d – initial dividend payout ratio (% of net profit, paid out as dividends);
p – net profit margin (net profit divided by sales);
S1 – forecast level of sales.
If the need for external funds is positive, the company will have to decide how to
raise them. Of course, probably the most straightforward solution would be to reduce cost
to increase profits; but, assuming the company is already operating efficiently, then some
50
other source of funding is needed. In some situations, the company may decide to use all
short-term financing or notes payable. This will decrease the company’s projected current
ratio and increase the company’s debt ratio. To raise all the funds with long-term debt will
leave the current ratio unaffected but increase the company’s debt ratio. The mix of short-
term versus long-term debt will depend on the company’s credit availability, borrowing
constraints, and expectations of interest rates.
If the debt choices cannot be used to fund all of the external financing needs, the
company must raise the remainder with equity financing. Either new stock must be sold or
less money paid out in dividends.
Check Question 8 Suppose the company, described in Example 5, needs
to maintain a current ratio of at least 1.2 and a total debt ratio of no more than 46%. If the company uses debt to finance its needs as much as possible, will it need to use any additional equity?
The balance sheet for 2009:
Plant&Equipment 81,0Ordinary shares 20,0
Inventories 30,2Retained earnings 59,0
Accounts receivable 24,8Long-term debt 13,1
Cash 10,2Accounts payable 18,0
Other liabilities 36,1
Total assets 146,2 146,2
3.4. Sustainable growth rate
If there is no possibility to raise funds externally, in order to balance uses with
sources, as a last resort, the company may have to decrease its use of funds to the point
that the uses can be funded with available sources. However, such situation means that
growth will have to be slowed because the projected growth is beyond its available means.
Setting the need for additional external funding equal to zero (only internally
generated equity and a proportionate amount of debt) and solving for the growth rate of
sales yields the sustainable growth (growth, which can be sustained without additional
external funding) formula:
)1(00
1
0
dLA
pS
S
S−⋅
−
⋅=
∆
Since S1 times p equals forecasted net income and (A0 – L0) equals beginning
equity, the above equation can be restated this way: sustainable growth, g, equals the
return on beginning equity, ROBE, times the retention ratio (one minus the payout ratio).
)1( dROBEg −⋅=
51
In practice, instead of ROBE, for the sake of simplicity, ROE is often used. Thus,
the approximation often used in practice is
)1( dROEg −⋅≈ .
Check Question 9 Calculate the sustainable growth rate for your
company. What would be your recommendations if the company’s managers want the company grow at a 20 % rate?
3.5. Scenarios in forecasting
When modelling financial results, in order to show possible futures, scenarios are
used. They are convenient to use because they can help analyze the variables, which have
an impact on the results of forecast. Usually, companies develop three types of scenarios:
• Base scenario, which is built on the most likely assumptions.
• Pessimistic scenario, which is based on the assumptions that are less
favourable than in the base scenario.
• Optimistic scenario, which is based on the assumptions, which are more
favourable than in the base scenario.
Pessimistic and optimistic scenarios show possible deviations from the most likely
(base) scenario, therefore, they identify possible risks (risk is the chance that there will be
deviation from the expected value) and allows planning respective risk mitigation actions,
which are a necessary integral part of any financial plan or forecast.
The developed scenarios must take into account the circumstances. There are four
options, which determine the development of scenario over time.
1. Explosion. Scenarios of this type are based on the assumption that the present
can not continue and that in the future, there will be some radical changes (e.g.,
economic downturn, increase in competition, etc.).
2. Steady state. This type of scenarios are based on the belief that we will return to
the preceding times
3. Transformation. Scenarios of this type are created when changes in technology,
economics, politics and so on are expected to influence the forecast or plan.
4. “Status quo” scenario is often referred to as “as it is, only more”. Scenarios of
this type assume that the future will develop similarly as before it, but possibly
at a different pace. This type of scenario is easiest to create.
52
Depending on the objective of the developed forecast, scenarios can be developed
in two ways:
• Future forward. In this method, the starting point is the current situation. The
scenario prepared is based on current situation, historical data and available
information about the future (or possible futures).
• Future backward. In this method, future goals are first set, and then, a number
of alternative options, which indicate, what should be done to achieve these
goals, are developed.
3.6. Case: developing spreadsheet model
The following case demonstrates how a simple financial model can be developed
using spreadsheet (commands indicated apply to MS Excel 2003 but usage in all
spreadsheet software should be straightforward).
Let us take a manufacturing company, having a retail chain. In the previous years,
the company expanded a lot and the strategic line remains further market expansion.
However, despite increasing turnover, the company experienced a drop in profitability.
You are asked to forecast the coming three years of financial statements and assess the
company’s financing needs. The historical information of the company’s financials is
presented in Table 3.
The following assumptions are to be used for developing the model:
• Sales: a 12% increase over the coming years
• CoGS: % of sales
• Operating expenses: % of sales
• Interest expense: 6% of debt (including long-term and overdraft)
• Corporate income tax: 15% (applicable in Lithuania)
• Dividends: constant (as previous years)
• Current assets: % of sales
• Fixed assets: % of sales
• Long-term debt: constant
• Minimum cash balance: 7 millions
53
Table 3. Historical financial information of the manufacturing company
INCOME STATEMENT 2007 2008 2009
Sales revenues 170,3 185 209,6
-Cost of sales 71,6 74,5 84
Gross profit 98,7 110,5 125,6
-Operating expenses 87,4 93 116
-Restructuring costs 9 1,5 0,6
Earning before interest and taxes (EBIT) 2,3 16,0 9,0
-Net interest expense 0,1 0,8 2,5
Earnings before tax (EBT) 2,2 15,2 6,5
-Tax 0,5 2,6 0,9
Net profit (loss) 1,7 12,6 5,6
-Ordinary dividends 6,1 6,1 6,1
Retained profit/(loss) (4,4) 6,5 (0,5)
BALANCE SHEET
Net fixed assets 49,2 58,7 62
Other assets 0 3,3 3,8
Inventories 21,6 25 28,7
Accounts receivable 15,6 17 17
Cash 19 13,4 9,2
Other current assets 7 8,7 9,8
Total assets 112,4 126,1 130,5
Shareholders' equity 64,1 70,6 70,1
Long-term liabilities 15,7 20,6 34,3
Other liabilities 1 0,6 0,2
Accounts payable 7,3 11,5 6
Taxes payable 6,3 6,6 4
Accruals 5,9 8,7 6,4
Overdrafts 0 0 0
Other current liabilities 12,1 7,5 9,5
Total equity and liabilities 112,4 126,1 130,5
Actuals
Follow these steps in order to develop the model:
Step 1. Start the spreadsheet software. Set the recalculation mode to MANUAL so
that the model will iterate only when you press CALCULATE (F9) [choose the
<Tools> menu, then <Options>. Click on <Calculations> tab; select the
button next to <Manual> and enter 1 in <Maximum iterations>]. This is
needed in order to demonstrate how the model works. When you get
acquainted with the model, you can then revert to automatic calculation.
Step 2. Use the file with the historical data to plan the model. To facilitate
sensitivity analysis, it is best to place the input data and / or assumptions either
54
at the top of the worksheet or next to each item (which is the case in the
presented sheet).
Case3.6 financials
A. Develop income statement by entering relevant formulas. For the first time
enter 0 for interest (first, we don’t know yet the information about the amount
of debt and second, it is important for the iteration to work properly).
B. Develop the balance sheet. Be sure to tie the balance sheet by formulas
(including link to the income statement (retained earnings line). Estimate
current assets, current liabilities and common equity. Overdraft becomes the
“plug” figure that makes the two sides of the balance sheet balance. This
amount is your estimate of the external financing needed by the company
(estimate it by subtracting the amounts for equity and liabilities from total
assets). If the plug is negative, put the balance on the cash line.
C. Iterate. Initially, you entered an interest expense of 0 on the income
statement, but this cannot be correct if debt is outstanding or if excess cash is
invested in interest-earning instruments. The income statement and balance
sheet are interdependent (this is the “circularity” problem: interest expense is
necessary to estimate retained earnings, which is necessary to estimate debt).
The way to deal with the problem would be to insert the best estimate of the
debt in the balance sheet (or overdraft), then estimate interest, then re-estimate
the plug figure, then re-estimate interest expense and so on. Stop iterating
when changes get to be small (normally, 5-10 times will suffice).
In order to do this in the spreadsheet, after the balance sheet is done, go back to
income statement and enter the formula to calculate interest as “interest rate x
debt”. Press the <F9> key and you should see the worksheet change. Press the
key several more times until the numbers stop changing, which means the
model has converged to a solution. The interest should be exactly the 6% of
debt and a balance sheet that balances.
When you have seen how this works, you may want to have the model
converge without having to press the button manually several times. In order to
do this, set the number of iterations you wish the spreadsheet to perform. Set
the number of iterations back to 100 (excel’s default) and allow the computer
to recalculate automatically [<Tools> menu, <Options> item, <Calculations>
55
tab; click on <Automatic>, enter 100 in <Maximum iterations>; make sure
that the box next to <Iterations> is checked].
Step 3. Modify the model to deal with the situations, when there is a minimum
requirement for cash and the plug for debt is negative – this can happen for
companies with seasonal or cyclical sales patterns. Negative debt, even though
can be interpreted as excess cash, is not a correct way to show cash. The
solution is to add a line for excess cash (or formula in the cash line) on the
assets side of the balance sheet and set up a few new lines below the last entry
in the balance sheet:
Name Formula
Trial Assets Fixed assets + Current Assets (without excess cash) Trial Equity and Liabilities
Equity + Long-term liabilities + Current Liabilities (without overdraft)
Plug Trial assets – Trial liabilities
Enter the following formula for “Excess cash”: =IF(PLUG<0;-PLUG;0). For
Overdraft: =IF(PLUG>=0;PLUG;0). Instead of the word “PLUG” the cell
address for the actual plug number should be used.
With the excess cash, interest income should be generated instead of interest
expense. Therefore, interest expense formula should be modified as follows:
Step 4: Explore sensitivities. Sensitivity analysis shows how variations in the
forecast assumptions will affect the financing requirements. The managers or
financial analysts might want to try the following changes in assumptions:
o Suppose sales in 2002 will be 15% higher instead of 12%;
o Suppose CoGS will increase to 47%;
o Suppose the company will have to increase its production capacity by
adding a new 50 million worth facility in 2002.
o Suppose that operating expenses increase faster than sales.
What happens to the debt under these circumstances? And which assumptions
seem to have the biggest effect on future borrowing needs?
The Data Table function is a good tool for conducting a sensitivity analysis. It
can automatically calculate the parameter as it varies across different values
for a particular assumption. Data Table can be created using a two-step process
illustrated below.
57
A. Set up the table. Move to a blank part of the spreadsheet. Suppose, we want
to explore impact of CoGS on sales ration on debt / excess cash. Put the
different CoGS to sales ratios in a column. At the top of the next column (one
row above the first CoGS to sales ratio) enter the location of the value to be
estimated, in this case, debt. In the next column, type the cell location for
excess cash.
B. Enter the data table commands. Highlight the area, which contains the
CoGS to sales ratios and the cell references to overdraft and excess cash. Go to
<Data> menu <Table> item. In the <Column Input Cell> enter the cell,
where the CoGS to sales ratio assumption is. The computer will fill in the
table. The results are presented in this file:
Vase3.6 results2
Note that the Table function allows exploring sensitivities to two factors at the
same time. Then, in the left column values of one parameter are put, on the top
row – values of another one and the reference to the cell of the explored value
is put in the top left cell of the table (where the intersection of the column and
row with parameters is). Then in the command window, <Column Input Cell>
refers to the assumption, the alternative values of which are placed in the left
column, and <Row Input Cell> refers to the assumption, the alternative values
of which are placed in the top row.
The results that you get need to be interpreted correctly. It is very easy to get
focused on the numbers and financial technicalities, however, the most relevant
interpretations are those that relate to business logics and value creation. Therefore, such
questions as “how the forecast was done?”, “why the assumptions, which where chosen,
were not something different?”, “what are the most important assumptions or “key
drivers” in the forecast and why are they important?”, “which finding are relevant to a
general manager and what actions should be undertaken based on these findings?” and so
on are the most important and should be answered based on the financial analysis
performed.
Summary
• Planning is a process of setting high-level set of objectives and targets. It comes
before budgeting.
58
• Budgeting refers to a detailed financial program of how the company is going to
execute. There are a few rules, which define good budgeting, budgets have to be
remade whenever the operating environment changes, state the first one.
• Forecasts or projections reflect the best estimate of how the plan will be
achieved. Plans and budgets are usually based on forecasts.
• Financial forecasting starts from income statement, then balance sheet and cash
flows are forecasted. Sanity check and sensitivity analysis are the last steps in
forecasting / planning process. Percentage of sales, ratios and regressions are the
most important methods used to forecast some items.
• The need for external funds is defined by change in assets, which is not covered
by “automatic” finance (which is “change in retained earnings and change in
(current) liabilities).
• Sustainable growth rate is the rate at which company can growth without
reverting to additional external sources of finance.
Key terms
• Need for external funds
• Pro-forma statement
• Sandbagging
• Sensitivity analysis
• Sustainable growth rate
• Total need for additional finance
Further readings
1. Bragg, S. M. (2007). Financial analysis: A Controller’s Guide. New-Jersey:
John Wiley & Sons.
2. Clarke, R., McQueen, G. (2001). Forecasting financial statements: pro-forma
analysis // Brigham Young University.
3. Schlosser, M. (2002). Business Finance: Applications, Models and Cases.
Harlow: Pearson Education.
Review questions and problems
1. What are the differences between planning, budgeting and forecasting?
2. What are the main rules for good budgeting.
59
3. Suppose, a company is about to launch a new product. What would be the best
method to forecast sales:
a) regression – sales trend;
b) regression sales on GDP growth;
c) experts judgement about potential market size;
d) ratio method.
4. Suppose, the company, which is described in Example 5 (the balance sheet for
2009 is provided in Check Question 8) plans to buy new equipment, the value of
which is 20. What would be the company’s need for external funds in 2010?
5. When the objectives are first set and possibilities to achieve these objectives are
analysed, such type of scenarios are called:
a) future forward;
b) future backward;
c) explosion;
d) steady state.
60
4. FUND RAISING
Contents • Criteria, used by both users and providers of funds for
evaluation of sources of finance
• General business plan structure and some tips for
preparation business plans
• Hints for presenting business plan and preparing an
efficient “elevator pitch”
When seeking for finance, there are three main questions: what are the company’s
needs in amount and time terms (provided it generates positive value); what are the
matching financial sources and how to reach them. The latter question is explored in this
chapter.
Long-term financial sources in most cases require a business plan, which covers
longer-perspective and more aspects that pure finance. If the company seeks for short-term
finance, financial institutions will limit themselves with past and current financial standing
of the company; however, a thoroughly prepared business plan even in this case is
advantageous.
Having a prepared business plan is not enough, it is important to demonstrate its
advantages and, what is even more important, be able to do it in short.
4.1. Criteria for evaluation of sources of finance
From the point of view of the company and its existing shareholders there are
several important factors relating to any particular source of new finance. These include:
• the administrative and legal costs of raising the finance;
• the cost of servicing the finance (this is the costs of providing returns to
suppliers of finance, for example, interest for debt providers, dividends for
equity providers);
• the level of obligation to make interest or similar payments;
• the level of obligation to repay the finance;
• the tax deductibility of costs related to the finance; and
• the effect of the new finance on the level of control of the business by its
existing shareholders and on their freedom of action.
61
From the point of view of the provider of new finance to the business, the following
are likely to be important factors:
• The level of return that is expected by investors;
• The level of risk attaching to the expected returns;
• The potential for liquidating the investment either through direct repayment by
the business or by using the secondary market;
• The personal tax position of investors in relation to returns from their
investment;
• The degree of control or influence over the business’s affairs that the investor is
likely to acquire as a consequence of investing.
Theory and research results suggest that investors expect and actually get, on
average, higher returns where higher risk is involved. The relationship appears to be
something like that depicted in Figure 12.
Figure 12. The risk/return relationship for various types of securities
For the company, the position is the opposite of that of the investors: sources of
finance that are relatively risky for business tend to be cheap in terms of servicing costs;
safe sources tend to be expensive. The level of returns required by secured lenders is
relatively low but the existence of such loans represents a potential threat to the welfare of
the shareholders. Equity investors expect high returns, but issuing additional ordinary
shares does not tend greatly to increase the risk borne by the original shareholders.
The main financial sources and instruments will be evaluated against the
aforementioned criteria in chapters 5-7. However, one has to have them in mind already
when getting ready to raise the funds needed.
Return
Short-dated government securities
Risk
Corporate bonds
Corporate equities
Corporate preference shares
62
4.2. Preparing business plan
The business plan developed should demonstrate the company’s ability to
implement the strategy of the company’s business and to project the company’s growth,
using realistic assumptions. The plan should be concise, but also thorough enough to
support and describe the points that will be the factors of success for the company’s
business. The following outline and information can be used as a guide in the development
of the company’s plan. All the parts will be discussed shortly, with the focus on the
financial part.
Figure 13. Elements of a business plan Phase 1
Business CONCEPT
Phase 2 Business PLAN
1. Executive summary
2. Product or service 3. Management team 4. Market and competition 5. Marketing and sales
6. Business system and organisation 7. Implementation schedule 8. Opportunities and risks
9. Financial planning and financing
1. Executive summary. The executive summary is designed to raise the interest of
decision makers. It should contain a brief overview of the most important aspects of the
business plan. In particular, it should highlight the product or service, the value to the
customer, the relevant markets, management expertise, financing requirements, and
possible return on investment. The executive summary abstracts in two or three pages the
key points of the business, the reasons customers need the product or service, and to entice
the reader to review the accompanying information. It is a concise presentation of the
business without the supporting arguments. Suggestions for elements to be covered under
executive summary:
1. Company’s history. When, where and why did the company begin to operate?
2. Company’s management and owners. Who are the managers and owners; what
are their capabilities; and what is their financial stake in the company?
3. Product or service. What does the company sell; are the products new or
established; are they protected by patents; and are more products being
developed?
4. Market. Where does the company's product sell; how does the company
penetrate the market place; what companies are playing pivotal rolls in the
market place; what is the growth trend?
63
5. Financials. This should be a summary that is one half page in length that
condenses the historical sales and earnings of the company, including a
summary of the pro forma forecasts.
6. Requirements. What is the amount of finance, which is needed for the business
and how will it help the company achieve its goals?
The subject headings and additional questions are not intended to be all-inclusive.
The entrepreneur, who prepares the business plan, is transferring vital information on
his/her business and the reader needs a sense of order and continuity. One should be
creative in the presentation of the business. The plan should not be too long; detailed
support information or in-depth analyses are better included in the appendices. Business
plans are used to describe the business, its strategies and opportunities for the future. The
development of a clear, concise presentation on the business encourages a careful review
of the material.
This section begins to develop for the reader the detail leading to a better
understanding of the business and the opportunity being presented. The summary
highlights the important aspects of the business.
2. Products or services offered. Elements to be covered in this section:
1. Prepare a detailed description of the products and services offered.
2. What are the strengths and weaknesses of the products or services; are there any
negatives or draw backs; what is the reaction to the customer base; are
customers requesting changes in the company’s product?
3. What is the development status of the product/service?
4. What is the strategy for future product development; are there funds set aside
for that particular effort or activity?
Any business plan derives from and the product or service’s value to the end
consumer. It does not make any sense to start up a new business unless the product or
service is superior to current market offerings. The function the product or service fulfils
and the value the customer will gain from it must be discussed in detail.
If comparable products and services are already available from the competitors,
business plan writer must convincingly substantiate the added value your customers will
receive from the start-up. To do so, one should put him/her in the place of the customer
and weigh the advantages and disadvantages of your product over the others very
carefully, applying the same criteria to all.
64
In explaining the development status of the product or service, one should imagine
him/her self as the financial sources provider who wants to minimize the risk involved in
participating. The description should be kept as simple as possible, refraining from
including too many technical details. A finished prototype could show the potential
investor that managers are up to meeting the technical challenge. If it enhances the
understanding of the product, a photo or sketch could be included in the business plan. It is
even better to have a pilot customer who already uses the product or service.
Regulatory requirements on products and services pose another set of risks. Any
permits the company has obtained, have applied for, or will apply for (e.g., departments of
health, technical control etc) should be noted in this part.
3. Management and Ownership. The investors want to know the technical and
managerial capabilities of the key people in the company. Some venture capitalists even
say that they invest in people, not ideas. The suggested outline information is as follows:
1. Abbreviated resumes of the principals with backgrounds of their prior work
experience, responsibility and educational background.
2. Have the principals invested any money in the transaction?
3. What is the current compensation for the principals and senior management?
4. What is the ownership structure of the company today?
Here is what the professional investors look for:
• Has the team already worked together?
• Do team members have relevant experience?
• Do the founders know their weaknesses and are they willing to make up for
them?
• Have the founders agreed on their future roles? Are ownership issues settled?
• Has the management team agreed on a common goal, or are there underlying
differences of opinion?
• Do the individual team members fully back the project?
4. Market and competition. Elements to be covered:
1. Brief description of the company’s key market(s), how large they are and how
they develop (growing, mature or growing);
2. What segments in that market place are attractive to the company and how will
the company attain, increase or retain their position in the market?
3. What products or services does the company target to each market segment;
how does the company anticipate growing business in each of these target
65
market segments; are there new segments of the market in which the company is
introducing existing or new products?
4. Description of the competition. Who are some of the company’s largest
competitors; what are their respective market shares; what are the strengths and
weaknesses of the company’s major competitors; how does the product or
service of the company compare with those competitors (i.e. price features,
distribution, service, whatever)?
5. Marketing and sales. Elements to be covered:
1. The ultimate question is why is someone going to purchase the company’s
product or service versus the competition?
2. Marketing strategy:
o what are the company’s channels of distribution;
o how does the company’s product reach the customer;
o what are the company’s marketing objectives;
o what outside services does the company use to assist in this area;
o what is the company’s pricing strategy;
o who controls the pricing of a product or service?
In general, well-planned marketing and sales activities are the key elements of a
well-conceived business plan. They require a persuasive description of your strategies for
market launch, marketing, and the measures planned for sales promotion. A skeleton
framework to follow is that of the four “P”: product, price, place, and promotion.
6. Production. This is applicable only if there is a product that is manufactured.
The questions the company should answer are:
1. Are the facilities adequate for the desired quality and quantity of the production;
is there any expansion planned and how much capital is needed; how efficient
are the facilities; are there threats of strikes; what kind of relationship does the
company have with vendors and suppliers?
2. Where is the company’s current facility and is it leased or owned?
3. Discuss the production process. Are there any materials that have long lead
times; is the company part of an ISO 9000 group or does the company have high
quality control standards?
4. What are the strengths and weaknesses of the company’s manufacturing facility;
what needs to be improved; what are positive and negative production factors
66
that influence the company; how does the company’s production capability
compare with company’s competitors?
5. What is the company’s strategy to improve the manufacturing costs?
7. Business system and organisation. The key questions to be answered are the
following:
1. What does the business system for the product/service look like?
2. What activities will the company handle by itself? Which partners will the
company work with? What are the advantages of working together for the
company and its partners?
3. What business functions make up the organisation, and how is it structured?
4. What resources are needed (quantitative and qualitative) to create the
product/service? How high is the need for technical input (raw materials,
materials to create the product/service)?
5. What capacity for product manufacturing and service production is planned
(number of units)?
6. How, and at what cost, it is possible to adjust the capacity in the short term?
7. What measures are planned for quality assurance?
8. How much of the product has to be put in storage? If a warehouse is needed,
how will the inventories be organised?
Business system. Every entrepreneurial assignment is comprised of the interplay of
a number of individual activities. When they are presented systematically in relation to one
another, the result is a business system. The business system model maps out the activities
necessary to prepare and deliver a final product to a customer. For clarity’s sake, they are
grouped into functional blocks. Devising a business system is a good way to understand
the business activities of a company; they should be thought through systematically, and
displayed with transparency. A generic business system common to nearly all industries
and enterprises is shown in Figure 14.
Figure 14. Generic business system
The above model should be used as a starting point for designing specific business
system. For a manufacturer, for example, it may be useful to subdivide the production
category into separate stages, such as purchasing, raw materials processing, component
manufacture, and assembly. One might also need to separate sales into logistics, wholesale
Research and development
Production
Marketing
Sales
Service
67
distribution, and retail sales, for example. Moreover, current business development talks
about open business systems, when even core activities are performed by the partners, so
the business system chart can (and should) be extended to include strategic partnerships as
well.
Organisation. It is essential that tasks and responsibilities are clearly delegated; the
organization must be flexible and always adaptable to new circumstances.
“Make or buy” and partnership decisions. Once the core of the business is
defined, it is necessary to think about who will carry out the individual activities best.
Activities outside the chosen focus should be handled by third parties. For example,
supporting activities do not necessarily have to be carried out by the company itself; these
may include bookkeeping, human resources, maintenance of facilities and so on. For each
activity, the question to ask is: Do we do it ourselves, or have someone else do it—to make
or to buy?
Make-or-buy decisions need to be conscious decisions taken after weighing the
advantages and disadvantages. Supplier partnerships, for example, cannot be dissolved
from one day to the next, and some partners cannot easily be replaced if, for some reason,
they are no longer available. When considering make-or-buy decisions all – financial and
non-financial – criteria have to be assessed:
• Strategic significance. Those aspects of performance that make a major
contribution to the company’s competitive advantage are of strategic importance
to the business. They must remain under the company’s control. A technology
company could hardly relinquish research and development, and a consumer
goods manufacturer would never give away its marketing activities.
• Growth perspectives. Partnerships will allow a young company to benefit from
the strengths of established companies and focus on developing their own
strengths. Through partnerships, you can usually grow faster than you could on
your own.
• Suitability. Every business activity demands specific abilities that may not be
available within the management team. The team must, therefore, consider
whether in specific instances it is best to carry out a particular task, acquiring
the necessary abilities, or whether it would be better to hand over the task to a
specialized company. Specialists may not only be able to carry out the
assignment better, they may also be able to offer a cost advantage thanks to
higher production volumes.
68
• Availability. Before a decision to buy is made, the company needs to find out
whether the product or service is available in the form or with the specifications
required. If it is impossible to find someone to supply what the company needs,
a business partner who is willing to acquire the necessary skills to do so might
be found.
Partnerships involve risks that are usually left aside when business is going well. A
supplier with an exclusivity agreement can, for example, end up in a difficult situation if
the buyer suddenly cuts back production and purchases fewer components. This is
especially true if the supplier has acquired specialised equipment that cannot immediately
be used for other orders and buyers. Conversely, a buyer can face difficulties if a major
supplier ceases to deliver (bankruptcy, fire, strike, etc.). Such risks and possible financial
consequences must be thought through from the beginning and perhaps regulated by
contract. Dissolution is also something to be covered in the contracts; it is important to lay
down in detail under which conditions a partner can withdraw from a partnership.
7. Implementation schedule. The key questions are the following:
1. What are the most important milestones for the development of the business,
and when must they be reached? Which tasks and milestones are
interdependent?
2. For which tasks / milestones bottlenecks are anticipated?
3. How many new employees will be needed in the individual business functions
over the next 5 years? What will this cost?
4. List of the planned short-term and longer-term (3 to 5 years) investments. What
investments will be required when which milestones are reached?
Investors want to know how the business owners and managers envision the
development of their business. A realistic five-year plan will inspire credibility among
investors and business partners. The focus should be on the most major milestones and the
most important interdependent events. The Gantt implementation schedule can be a good
tool to visualise the implementation chart.
The implementation schedule also includes human resources planning. As the
business grows, systematic personnel planning will become more and more indispensable.
Growth will require recruiting new employees who will have to be trained and integrated
into the business. In order to arrive at the total cost of human resources (wages and indirect
labour costs) for the income statement in the business plan, costs should be a part of the
personnel planning. The cost of personnel depends on a number of factors, such as the
69
industry itself, employee qualifications, and age. Additionally, indirect labour costs can
amount to over 50% of the wage.
8. Opportunities and risks. Questions to be covered:
1. What basic risks (market, competition, technology) does the company face?
2. What measures will be taken to counter these risks?
3. What extraordinary opportunities / business possibilities can the company see?
4. How realistic are the presented scenarios in the view of business owners /
managers?
5. What consequences do these risks have on the business planning?
The object of this exercise is to identify a margin of error for departures from the
assumptions made, while preparing the business plan. If possible with reasonable effort, it
is advisable to draw up best-case and worst-case scenarios involving key parameters to
identify the opportunities and risks. These calculations will allow potential investors to
judge how realistic your plans are, and to better assess the risk of their investment.
Changing various parameters in the scenarios (such as price or sales volumes) allows
simulating how a change in conditions might affect the key figures (sensitivity analysis).
9. Financial data. Questions to be covered:
1. History: profit and loss statements, cash flow, balance sheet including notes and
assumptions for the last three years (if available).
2. Pro-forma statements: P&L statements, cash flow and balance sheets.
Financial planning assists the managers and owners in evaluating whether the
business concept they have chosen will be profitable and can be financed. Projected
growth in value results from the planned cash flows from the main operations. These are
revealed through liquidity planning, which also provides information on the various
financing needs. In addition, the profit situation of the business can be seen in the income
statement.
Minimum financial planning required in the business plan contains:
• a cash flow calculation (liquidity planning), income statement, balance sheet;
• forecasts over 3 to 5 years, at least 1 year beyond the point of breaking even,
that is, beyond the generation of positive cash flow;
• detailed financial planning for the first 2 years (monthly or quarterly), thereafter
annually;
• all figures based on reasonable assumptions (only the main assumptions need to
be described in the plan).
70
There should be a section of assumptions that describe why the company will be
able to achieve the revenues defined. The assumptions would be used for such things as
sales; cost of goods sold; cost of marketing; production; achieving market share; what are
the cycles for accounts receivable, accounts payable, inventory, etc.
A potential investor will want to clearly understand how the funds being requested
will be used in the company; the timing of the amount requested and how this will impact
the balance sheets, the cash flows and the P&L statements.
Planned income statement. Whether a company’s assets grow or diminish depends
on the bottom line at the end of a year. The income statement can help to forecast this. In
contrast to liquidity planning (= planned cash flow), an income statement focuses on the
issue of whether transactions lead to an increase (= revenue) or a decrease (= expense) in
the net worth of the business (defined as the sum of all assets minus debt).
Liquidity (cash flow) planning. Sales of the products or services may be booked in
the current financial year, even though payment does not occur until the next; in this case,
the sales revenue will be listed even though the money has not yet been deposited into the
company’s accounts. The same is true for expenses. The company must have a certain
amount of cash on hand at any given time in order to avoid becoming insolvent, which
leads to bankruptcy that will mean the financial ruin of your business. Detailed liquidity
planning should help ensure a positive cash flow. The principle is simple: receipts are
compared directly to disbursements. Note that writing or receiving an invoice does not
mean that the money is already in the accounts or that one has paid the bill. Liquidity
planning is concerned with the date of payment when the money actually comes in or goes
out. Thus, liquidity planning involves only those transactions that cause a change in the
cash reserves. Depreciation, liabilities, and non-market output are not included.
The company is solvent when the sum of its receipts is greater than the sum of its
disbursements at any given time. The company will have to draw on capital for those times
when this planning does not cover all expenses. The sum of all these individual payments
will equal the total capital required for that planning interval.
Projected balance sheet. Providers of equity capital (e.g., business angels, venture
capitalists) are interested in seeing how the company’s assets are expected to grow as
represented on a projected balance sheet. As with the income statement, there is a standard
accounting format, required by law, for balance sheets. Balance sheet projections are
prepared at annual intervals.
Financing needs. Liquidity planning enables determining the amount of capital the
company will need and when the company will need it, but it does not indicate how these
71
needs would be met. The distinction is usually made between equity (investors have a
stake in the business) and loan capital (which is borrowed from outside sources). A
snapshot of the available sources of finance is presented in Figure 15.
Figure 15. Sources of finance at various stages of a company’s development
One has to be clear about the company’s needs and expectations and those of the
company’s investors. If the business is seeking a long-term commitment and is satisfied
with a small company, the advice will most probably be to make use of family funds and
loans from friends and banks. The entrepreneur will retain a majority shareholding; on the
other hand, the chances for growth will be rather limited.
If, however, a rapid expansion is projected, venture capital is an option. Venture
capitalists will generally expect to obtain a large share of the company. Professional
investors, however, are not interested in managing the business as long as the business
meets the set targets, even if these investors have the majority shareholding. They have,
after all, invested in the management team in order to lead it to success. They will support
the management team actively with their management skills and contribute specific
knowledge, such as legal or marketing expertise, and contacts.
Calculating the investors’ return. Investors evaluate the success of an investment
by the return they get on the capital invested. As a result, anticipated return should be
apparent at a glance in the business plan.
From the point of view of the investor, all funds contributed to a new company
result first in negative cash flows. After a business breaks even, positive cash flows will
not immediately be paid out in the shape of dividends, but will be first used to strengthen
the balance sheet. Cash will be returned to the investors at realisation. To calculate the
72
return, the internal rate of return (IRR) method can be used. The IRR is the discount rate at
which the sum of all positive and negative cash flows, discounted at present, results in
zero. For example, if the IRR is 72%, that means that the investors get an annual return of
72% on their capital.
9. Appendices section. This could include market data, customer information,
customer profiles, references, information from studies or trade journals supporting the
position of the business plan and the growth strategy, and references to other sources of
information that would be helpful for the investor in making the determination on the
appropriateness of the company’s business as an investment for their partnership.
4.3. Elevator pitch
Preparation of a good paper business plan is only one step to get finance. Being
able to “sell” the business idea and attract the finance requires good presentation skills as
well.
In business finance context, an elevator pitch (or elevator speech) is a concise,
carefully planned, and well-practiced persuasive description of a company or an idea for a
product, service, or project. An elevator pitch is often used by entrepreneurs pitching an
idea to venture capitalists or angel investors to receive funding. Venture capitalists often
judge the quality of an idea by the quality of its elevator pitch and will ask entrepreneurs
for their elevator pitches in order to quickly reject bad ideas and weak teams.
Good elevator pitches are short and compelling to their target audience (sometimes
it is said “the description should be done in such a way that your grandma should be able
to understand it”).
The name “elevator pitch” reflects the idea that it should be possible to deliver an
elevator pitch in the time span of an elevator ride, or approximately thirty seconds to two
minutes. To develop a short and appealing speech is not an easy task.
An elevator pitch is not a sales pitch. The entire pitch should not be used to tell the
investors how great the company’s product or service is. The investors are “buying” the
business, not the product, and therefore, they are mostly interested in how the business will
be run.
The elevator pitch should answer the following questions:
1. What is the company’s product or service? Briefly describe what it is the
company sells, no small details are needed.
2. Who is the company / product’s market? Brief description who the company is
selling the product or service to. What industry is it? How large is the market?
73
3. What is the revenue model?
4. Who is behind the company? “Bet on the jockey, not the horse” is a familiar
saying among investors. There should be little information about the company’s
management and the team’s background and achievements. If the company has
a strong advisory board, investors would be interested who they are and what
they have accomplished.
5. Who is the competition? Who the competitors are and what they have
accomplished. Successful competition can be an advantage; they are proof the
business model of the company and/or concept can work.
6. What is the company’s competitive advantage? Simply being in an industry with
successful competitors is not enough. One needs to effectively communicate
how the company / product is different and why the company product has an
advantage over the competition – for example, a better distribution channel, key
partners, proprietary technology and so on.
An effective elevator pitch must contain:
1. A "hook". The pitch should be opened by getting the investor’s attention with a
statement or question that piques their interest to want to hear more.
2. About 150-225 words. The pitch should go no longer than 60 seconds.
3. Passion. Investors expect energy and dedication from entrepreneurs.
4. A request. At the end of the pitch, the speaker should clearly state his/her
demand – do you want their business card, to schedule a full presentation, to ask
for a referral?
Check Question 10 Assume your company is about to expand and will
seek for finance. Think of a relevant target audience (whether it would be a banker, private investor or venture capitalists) Develop an elevator pitch, which would satisfy all the criteria mentioned above.
Summary
• The criteria against which businesses (together with existing shareholders) and
providers of finance are different. When seeking for finance, one needs to
consider all of them.
• In all sources of finance, risk and reward are related. To the business sources
that are cheap, in terms of servicing costs (e.g., loans), tend to be risky. Those
that are less risky (e.g. equity) tend to be expensive. To the provider of finance,
risk and reward are related positively, that is, high returns mean high risk and
vice versa.
74
• Business plan is required in order to get long-term funding. A typical business
plan covers product or service, description of management team, market and
competition, marketing and sales, business system and organisation,
implementation schedule, assessment of opportunities and risks, and financials
(needs and sources).
• Preparation of a good business plan on paper is only one step. An elevator pitch
is often used by entrepreneurs pitching an idea to venture capitalists or angel
investors to receive funding. An effective elevator pitch should be concise and
appealing to the target audience (providers of finance).
Key terms
• Business plan
• Elevator pitch
• Risk/return relationship
• Servicing of finance
Further readings
1. McLaney, E. (2006). Business Finance: Theory and Practice, 7th ed. Harlow:
Pearson education.
Review questions and problems
1. Using the concepts of risk and reward explain why servicing long-term loans is
usually less expensive than short-term loans.
2. What are the goals of a business plan? How business concept differs from
business plan?
3. What would be financial risks you would cover in the business plan?
4. Explain how elevator pitch differs from sales pitch? How is it similar?
75
5. LONG TERM FINANCE-1: EQUITY FINANCE
Contents • Retained earnings
• Rights issues
• Equity finance from risk capital: business angels
(“informal risk capital”) and venture capital (“formal risk
capital”)
• Raising equity through equity market
• Public funds (grants) as a source of external funding
There are three main means of raising equity finance:
1. retaining profits rather than paying them out as dividends;
2. issuing new shares to existing shareholders;
3. issuing new shares to new shareholders (which could be professional
investors such as business angels, venture or equity capital or the public).
5.1. Retained earnings
Retained earnings are an important source of finance. Profits lead to a net increase
in funds, and retaining these, or part of them, rather than paying them out as dividends, is
in effect a way of rising finance.
Factors to consider in respect of raising finance by retention of profits
Dividend policy. The dividend policy has an impact not only on the finance
available to the company but also on the shareholder wealth. Retaining one proportion of
the profit rather than another proportion has an effect on the after-dividend price of the
share, that is, on the net wealth of the shareholders.
On the other hand, some business instead of paying out dividends may convert
retained earnings into ordinary shares, which are then distributed to existing shareholders
free of charge (issue bonus shares).
76
Example 8 Here is an example summary balance sheet of a
company, which has retained some of its profits. Assets (M€) Equity and Liabilities (M€)
The company can convert all or part of 3 M€ of retained earnings to shares, which may be issued pro rata to the ordinary shareholders. Let us assume that 2 M€ are converted. Then, the balance sheet would be:
Total 11 Total 11 Note that the conversion of retained earnings into shares leaves the uses of funds
(assets) totally unaffected. The equity figure also does not change; the contribution of the
ordinary shareholders is not altered by the bonus issue.
Costs. The issue costs, which are applicable in case of other means of raising
additional equity, are not applicable to retained earnings. Therefore, at first sight, retained
earnings might seem to be a source that costs nothing to service. However, this is not to be
true. From the shareholder’s point of view, there is a clear opportunity cost in that, if cash
dividends were paid, that cash could be invested in some income-yielding way. As the
obvious comparison is an investment in equities of similar risk to those of the business
under consideration, retained profits have a service cost similar to that of the original
ordinary shares.
Uncertainty. When the need for finance has been assessed, there is no guarantee
that sufficiently large profits will be achieved to meet the requirements. On the other hand,
when the funds have been generated from profits, their existence is certain and their
retention becomes a matter of owners’ decision.
Control. Retaining profits doe not change the voting strength of any individual
shareholder.
5.2. Rights issues
Rights issues are offers to existing ordinary shareholders to take up additional
shares for cash, at a price usually significantly below the current market price of already
existing prices. A rights issue is, therefore, a way of raising new cash from shareholders –
this is an important source of new equity funding for publicly quoted companies.
77
In the UK, right issues have represented the most important method of raising new
equity, after retained profits. This method has not been very popular among quoted
companies in Central and Eastern Europe though, mostly due to limitations of existing
stock markets. The usage of rights issues by unlisted companies is not very popular, as it
will be discussed later.
In most countries, legally, a rights issue must be made before a new issue to the
public. This is because existing shareholders have the “right of first refusal” (otherwise
known as a “pre-emption right”) on the new shares. By taking these pre-emption rights up,
existing shareholders can maintain their existing ownership share in the company.
Shareholders can, and often do, waive these rights, by selling them to others. Shareholders
can also vote to rescind their pre-emption rights. The existence of pre-emption rights is
sometimes seen as a restriction on the ability of the company’s managers to take advantage
of some other source of equity finance.
Once the business has decided on the amount of finance it needs and has set a
price, it simply offers shares to existing shareholders. The number of new shares that any
individual shareholder has the right to take up depends on the number of shares already
owned.
Example 9 A business has in existence 4 M ordinary 1 € shares,
the current price of which is 1.80 € each. Business needs to raise 1.2 M€ by a rights issue at 1.50 € per share. The number of shares issued will be 1.2 M€ / 1.50 € = 800 000 shares. These, will be, therefore, be offered on a 1-for 5 basis to existing ordinary shareholders. For example, a shareholder owning 200 shares will be given the right to buy an additional 40 shares. It this shareholder is not willing to use his right, normally, he should be able to sell his rights to the ones who are willing to use them.
The value of the entire equity before the rights issue was 7.2 M€ (4 M shares × 1.80 €/share). After the rights issue the total equity would amount to 8.4 M€ (7.2 M€ + 1.2 M€ new money raised). The share price would then fall to 1.75 €/share (8.4 M€ / 4.8 M shares). Thus, the price for which the rights themselves would be traded is likely to be 0.25 €/right to buy one share (which is difference between the right issue price and the after-rights price of the shares).
The question remains whether the existing shareholders are better of or not. Assume a shareholder who has 100 ordinary shares. In this example, he would get 20 new shares in the rights issue. He would have then three options:
• Take the offer and buy the shares. Then he would pay 30 € (20 shares × 1.50 €/share), and his value would go up from 180 € (100 × 1.80 €) to 210 € (120 × 1.75 €). The increase is what he paid for, so
78
the overall, the shareholder’s wealth does not change.
• Sell the rights. Then his total wealth would be 175 € in shares (100 × 1.75 €) plus 5 € in cash (20 × 0.25 €), which is 180 – again, the wealth does not change.
• Allow the rights to lapse, in which case his wealth will decrease from 180 € to 175 €.
Thus, the shareholder has clear incentives to act (either by taking up the rights or by selling them).
It is important to stress, that rights issues cannot be used continuously for raising
new funds. Shareholders may react badly to companies continually making rights issues as
they are forced either to take up their rights or sell them. They may sell their shares in the
company, driving down the market price and leaving the other shareholders worse off.
Factors to consider in respect of raising finance by rights issues
Costs. Rights issues are a relatively cheap way of raising equity finance since the
costs of preparing a brochure, underwriting commission or press advertising involved in a
new issue of shares are largely avoided.
However, it still costs money to complete a rights issue. For example, in the UK,
issue costs are often estimated at around 4% for around £2 million amount raised. Larger
part of these issue costs are fixed (e.g., accountants and lawyers fees), therefore the costs,
as a proportion of the value of the funds raised, it will be higher for smaller issues and
lower for larger ones.
Pricing. Shareholders who either sell or take up their rights are left in more or less
the same position as regards wealth irrespective of the issue price. The price at which the
new shares are issued is generally much less than the prevailing market price for the
shares. A discount of up to 20-30% is fairly common. The main reason is to make the offer
relatively attractive to shareholders and encourage them either to take up their rights or sell
them so the share issue is “fully subscribed”.
The price discount also acts as a safeguard should the market price of the
company’s shares fall before the issue is completed. If the market share price were to fall
below the rights issue price, the issue would not have much chance of being a success –
since shareholders could buy the shares cheaper in the market than by taking up their
rights to buy through the new issue.
Certainty. It is rare in practice for a rights issue to fail (see the Example 9, which
explains why shareholders have the incentives to act). This is an important factor since
many of the issue costs are committed in advance and would be lost if the issue failed.
79
Shareholders who do not wish to take up their rights may sell them on the stock
market or via the company making the rights issue, either to other existing shareholders or
new shareholders. The buyer then has the right to take up the shares on the same basis as
the seller.
Control. Unless large numbers of existing shareholders sell their rights to new
shareholders there should be little impact in terms of control of the business by existing
shareholders
Unlisted companies. Unlisted companies often find rights issues difficult to use,
because shareholders unable to raise sufficient funds to take up their rights may not have
available the alternative of selling them where the company’s shares are not listed. This
could mean that the company is forced to rely on retained profits as the main source of
equity, seek to raise venture capital, or take on debt.
5.3. Equity finance from risk capital
5.3.1. Funding gaps
Business owners often report that company finance at a certain development stage
can be very difficult to obtain – even from traditional sources such as banks and venture
capitalists. Entrepreneurs need a relatively low price financing at certain time and place.
There have been identified two funding gaps, which occur during two stages of innovation
process and which are due to capital market inefficiency and information gap.
Figure 16. Funding gaps
Stage
Pre-seed
Seed/start-up
Initial growth
Expansion
Source
Founders
Business angels
Venture funds
Demand for
funding (in LTL)
~10.000
10.000-1 M 1 M-10 M
Secondary funding gap
Funding gap
Source: adapted from Sohl (2003)
The first gap occurs primarily in the seed and start-up financing stage (see Figure
16). In the US, the gap ranges from $100 000 at the low end, the point at which the money
raised from friends and families and by the means of reduction of expenses runs out, and
banks require security, which cannot be yet provided, to the $2 million range on the high
80
end, the time when the venture would become attractive enough for venture fund investors.
Similarly, considering the costs of setting up a business and living standard, the prediction
for Lithuania would range from several tens of thousands till 200 000 LTL (in some cases
it might go up till several millions LTL). Having in mind that the interest of venture capital
in seed and start-up companies is rather low, the role of business angels in the seed and
start-up stage financing becomes critical. Therefore, in order to encourage innovations,
initiatives directed at the angel investors need to be considered.
The secondary capital gap occurs in the early stage of equity (venture capital)
financing. As the venture capital industry in the US has progressed to larger and later stage
financing, and the informal (business angels’ finance) market has remained active below
the $2 million threshold, a capital gap in the $2 to $5 million range has developed. This
gap occurs when an innovative product (or business) is being introduced to the market and
production costs have to be covered. Having in mind that both the supply of venture
capital is limited and venture capital investment threshold is much higher than the early
stage financial sources as well, the problem of the funding gap is even more serious in
Lithuania. The capital needs for initial growth investment might be in the range of 200 000
to 1 million Litas. Venture capital funds invest in later stages and average investment
ranges from 2 to 8 million LTL.
5.3.2. Business angels financing
In these circumstances, companies have a possibility to turn to business angels.
Some of the larger capital requirements in the secondary gap can be met through co-
investment between private investors and early stage financing entities or the angel
alliances, which represent relatively large groups of business angels willing to fund larger
relatively later stage deals.
Business angels are wealthy, entrepreneurial individuals who provide capital in
return for a proportion of the company equity. They take a high personal risk in the
expectation of owning part of a growing and successful business. Since business angels
invest their own funds, they are sometimes called informal venture capital.
Factors to consider in respect of raising finance from business angels
Businesses are unlikely to be suitable for investment by a business angel unless
certain conditions are fulfilled.
Sector and characteristics of a company. Business angels specialise and invest in
companies, where they can make the best use of their professional experience and
81
networks. Therefore, a business angel who invests in IT companies would rarely go for
investment in retail, for example.
Development stage. The business should be new; usually, business angels invest
into seed or start-up stage of the company development, although there are some angels
who specialise in expansion stage as well.
Amount. The business needs to raise a limited amount (typically between ten
thousand to half a million Euros. One business angel would have a portfolio of two to five
ventures). Equity finance, which is higher than this amount is usually provided by venture
capital firms. The exceptions are when several business angels invest together in a
syndicate or when business angels co-invest with venture capital funds. The sums raised
can exceed 1 M€.
Transfer of equity. Current shareholders should be willing to sell a part of
shareholding in return for financing. The owners of small (and usually family-owned)
companies are usually unwilling to give up at least a part of their shareholdings. However,
there are at least several strong arguments why business angels (or venture capital)
investment is beneficial to business owners:
a. Raising finance in the form of equity (shares) strengthens the companies’
balance sheet. Banks (or other lenders) may then be willing to provide
additional debt finance.
b. With the additional finance and knowledge of business angels, the potential of
growth is much higher. Therefore, if the growth potential is realised, within few
years a part of ownership might be larger than the whole ownership today.
Personal relationship. The owners and managers of the business should be willing
to develop a personal relationship with a business angel. Typically, business angels want
hands-on involvement in the management of their investment, without necessarily
exercising day-to-day control. This relationship can be a positive one for the business. A
business angel with the right skills can strengthen a business by, for example, offering
marketing and sales experience. Building a personal relationship is also a reason, why
business angels limit their investment in some defined geographical area, which would not
be too far away from their residency.
High growth potential. This is related to the service cost of the finance. The
business should be able and prepared to offer the business angel the possibility of a high
return (usually an expected average annual return of at least 20%–30% per annum). This is
the service cost of finance. Most of this return will be realised in the form of capital gains
over a period of several years.
82
Understanding product and markets. The business, which seeks for business angel
finance, should be able to demonstrate a strong understanding of its products and markets.
Some business angels specialise by providing “expansion finance” for businesses with a
proven track record, or in particular sectors. This enables an already successful business to
grow faster. Business angels are also a significant source of start-up and early-stage capital
for companies without a track record. A business plan based on convincing market
research is essential.
Management team. The business should have an experienced and professional
management team – as a minimum with strong product and sales skills. If there are
weaknesses in the existing management team, a business angel can often provide the
missing skills or introduce the business to new management.
Exit. The business should be able to offer the business angel the possibility of an
‘exit’. Even if the business angel has no plans to realise the investment by any particular
date, the angel will want the option to be available. The most common exits are:
• A trade sale of the business to another company.
• Repurchase of the business angel’s shares by the company.
• Purchase of the business angel’s shares by the company’s directors or another
investor.
In addition to financial sources, business angels also provide a lot of non-financial
benefits to companies, which manage to attract business angels:
• Advice.
• Contacts. Business angels usually have a lot of experience in the field they work
in; therefore, they would be able to help opening the necessary doors.
• Support in operations – they might help in selecting the right staff, preparing
budgets and so on.
• Participation in management and / or representing the company (the most
valuable help is in developing, shaping, and changing business concept or
models)
• Understanding of market and business.
• “Guarantee” to other investors. Business angels can invest along with other
investors at the same time. On the other hand, there is some evidence that more
than 50% of companies, which attract business angels, at later stages, manage to
attract venture capital finance.
83
If the company does not need finance, but would like to benefit from non-financial
support, it should look for business mentors – these are the individuals who devote their
time and efforts for development in a specific pre-agreed business domain (e.g., finance,
marketing, planning and so on) without investing.
Finding an angel. Many contacts are made informally, for example, personal
friends and family; wealthy business contacts; major suppliers and clients of the business.
Investors can also be found by approaching formal angel networking organisations
(Business Angels Networks). Many of the most active business angels use these networks
to find out about interesting investment opportunities.
In any case, to get a business angel involved into business, a clear business concept
and a robust business plan will be required.
5.3.3. Venture capital
Venture capital (VC) is a form of “risk capital”, in other words, capital that is
invested in a business, where there is a substantial element of risk relating to the future
creation of profits and cash flows. Venture capital is invested as shares (equity) rather than
as a loan and the investor requires a higher “rate of return” to compensate him for his risk.
The main sources of venture capital are venture capital firms. Venture capital
provides long-term, committed share capital, to help unquoted companies grow and
succeed. In other words, venture capital is also called “business of raising businesses”.
If an entrepreneur is looking to start-up, expand, buy-into a business, buy-out a
business, in which he works, turnaround or revitalise a company, venture capital could
help do this. Obtaining venture capital is substantially different from raising debt or a loan
from a lender. Lenders have a legal right to interest on a loan and repayment of the capital,
irrespective of the success or failure of a business. Venture capital is invested in exchange
for an equity stake in the business. As a shareholder, the venture capitalist’s return is
dependent on the growth and profitability of the business. This return is generally earned
when the venture capitalist “exits” by selling its shareholding when the business is sold to
another owner.
Differently from business angels, venture capital firms do not invest their own
funds; they raise their funds from several sources. To obtain their funds, venture capital
firms have to demonstrate a good track record and the prospect of producing returns
greater than can be achieved through fixed interest or quoted equity investments. Venture
capital firms raise their funds for investment from external sources, mainly institutional
investors, such as banks, insurance companies, pension funds and individual investors.
84
Another difference from business angels is that venture capital usually invests larger
amounts and at later stages (often, expansion phase) of companies’ development.
The venture capital industry is mostly developed in the US. In Europe, the scope of
venture capital investment is lower and stage of VC development varies a lot (see Figure
17). In Central and Eastern European countries venture capital is mostly active and buy-
outs and mergers and acquisition deals.
Figure 17. Venture capital investment in EU, percentage of GDP in 1997 and 2007
10.38%
2.85%
8.55%
1.59%
11.41%
14.43%
7.85%
5.46%
3.89%
1.45%
4.43%
4.18%
5.11%
4.61%
0.00%
2.30%
0.43%
0.00%
0.00%
1.39%
23.79%
22.26%
20.98%
14.36%
13.42%
10.73%
9.89%
9.61%
9.44%
9.25%
7.64%
6.95%
5.98%
4.40%
2.44%
1.91%
1.77%
1.12%
1.11%
0.84%
0.00% 5.00% 10.00% 15.00% 20.00% 25.00%
Great Britain
Sweden
Finland
Switzerland
Norway
Netherlands
Belgium
EU
Spain
Denmark
France
Portugal
Ireland
Germany
Poland
Italy
Austria
Hungary
Czech
Greece
1997 2007
Source: EVCA
Factors to consider in respect of raising finance from venture capital
It should be pointed out that the attributes that both venture capital firms and
business angels look for in potential investments are often very similar.
High growth potential. Venture capitalists prefer to invest in entrepreneurial
businesses. This does not necessarily mean small or new businesses. Rather, it is more
about the investment’s aspirations and potential for growth, rather than by current size.
Such businesses are aiming to grow rapidly to a significant size. As a rule of thumb, unless
a business can offer the prospect of significant turnover growth within five years, it is
unlikely to be of interest to a venture capital firm. Venture capital investors are only
interested in companies with high growth prospects, which are managed by experienced
and ambitious teams who are capable of turning their business plan into reality. The
venture capital would expect minimum 30% of per annum growth in the value of shares,
so, this reflects the costs of servicing the finance as well.
85
Investment amount. The amount venture capital invests in one deal starts from
1 M€ in developed countries (like US or UK). In Central and Eastern Europe, it can be
from 250 000 €. Usually, venture capital would take 30-50% of equity in a company.
Investment span. Venture capital firms usually look to retain their investment for
between three and seven years (in exceptional cases, longer). The term of the investment is
often linked to the growth profile of the business. Investments in more mature businesses,
where the business performance can be improved quicker and easier, are often sold sooner
than investments in early-stage or technology companies where it takes time to develop the
business model.
Business sector and company characteristics. Venture capital firms’ investment
preferences may be affected by the source of their funds. Venture capital firms, just as
business angels can be specialised and invest either in a specific geographical area, in a
specific business sector and so on.
Investment process. The investment process, from reviewing the business plan to
actually investing in a proposition, can take a venture capitalist anything from one month
to one year but typically it takes between 3 and 6 months.
The key stage of the investment process is the initial evaluation of a business plan.
Most approaches to venture capitalists are rejected at this stage. In considering the
business plan, the venture capitalist will consider several principal aspects:
• Is the product or service commercially viable?
• Does the company have potential for sustained growth?
• Does management have the ability to exploit this potential and control the
company through the growth phases?
• Does the possible reward justify the risk?
• Does the potential financial return on the investment meet their investment
criteria?
Due diligence is the process of assessing the technical and financial feasibility of
the deal in detail. External consultants are often used to assess market prospects and the
technical feasibility of the proposition, unless the venture capital firm has the appropriately
qualified people in-house. Chartered accountants are often called on to do much of the due
diligence, such as to report on the financial projections and other financial aspects of the
plan. These reports often follow a detailed study, or a one or two day overview may be all
that is required by the venture capital firm. They will assess and review the following
points concerning the company and its management:
86
• management information systems;
• forecasting techniques and accuracy of past forecasting;
• assumptions, on which financial forecasts are based;
• the latest available management accounts, including the company’s cash/debt
positions;
• bank facilities and leasing agreements;
• employee contracts, etc.
The due diligence review aims to support or contradict the venture capital firm’s
own initial impressions of the business plan formed during the initial stage. References
may also be taken up on the company (e.g., with suppliers, customers, and bankers).
If venture capital does not have enough information about the expected returns,
there are two possibilities to solve it:
1. investing by stages (see Figure 18), or
2. a possibility to renegotiate the investment contract when there is some new
information.
Figure 18. Investment by stages
Exit. As in the case of business angels investment, the return to the investor is
realised by exiting (selling the shares, the value of which were increased). Venture capital
uses the same exit ways as business angels (management buy-out – that is, selling the
company to the company management team; selling to strategic investor – to another
company; selling to financial investor – another venture capital firm) or additionally
selling the company publicly (initiating initial public offering, IPO).
Initial investment
Information about likelihood of the
potential
Expansion investment
Efforts of entrepreneur and
advisors
Signs of success or
failure
Stop of financing
87
In structuring its investment, a venture capitalist may use one or more of the
following types of share capital:
• Ordinary shares. These are equity shares that are entitled to all income and
capital after the rights of all other classes of capital and creditors have been
satisfied. Ordinary shares have votes. In a venture capital deal these are the
shares typically held by the management and family shareholders rather than the
venture capital firm.
• Preferred ordinary shares. These are equity shares with special rights. For
example, they may be entitled to a fixed dividend or share of the profits.
Preferred ordinary shares have votes.
• Preference shares. These are non-equity shares. They rank ahead of all classes
of ordinary shares for both income and capital. Their income rights are defined
and they are usually entitled to a fixed dividend (e.g., 10% fixed). The shares
may be redeemable on fixed dates or they may be irredeemable. Sometimes they
may be redeemable at a fixed premium (e.g., at 120% of cost). They may be
convertible into a class of ordinary shares.
• Loan capital. Venture capital loans typically are entitled to interest and are
usually, though not necessarily, repayable. Loans may be secured on the
company’s assets or may be unsecured. A secured loan will rank ahead of
unsecured loans and certain other creditors of the company. A loan may be
convertible into equity shares. Alternatively, it may have a warrant attached,
which gives the loan holder the option to subscribe for new equity shares on
terms fixed in the warrant. They typically carry a higher rate of interest than
bank term loans and rank behind the bank for payment of interest and
repayment of capital.
Venture capital investments are often accompanied by additional financing at the
point of investment. This is nearly always the case where the business, in which the
investment is being made, is relatively mature or well-established. In this case, it is
appropriate for a business to have a financing structure that includes both equity and debt.
Other forms of finance provided in addition to venture capitalist equity include:
• Overdrafts and short to medium-term loans at fixed or, more usually, variable
rates of interest.
88
• Medium to longer-term loans. Later the banks that provide loans can play an
important role in the process of “going public” by advising on the terms and
price of public issues and by arranging underwriting when necessary.
• Instalment credit, ranging from hire purchase to leasing, often asset-based, and
usually for a fixed term and at fixed interest rates.
• Factoring services (buying trade debts at a discount, either on a recourse basis
(the company retains the credit risk on the debts) or on a non-recourse basis (the
factoring company takes over the credit risk)).
• Mezzanine finance that is halfway between equity and secured debt. These
facilities require either a second charge on the company’s assets or are
unsecured. Because the risk is consequently higher than senior debt, the interest
charged by the mezzanine debt provider will be higher than that from the
principal lenders and sometimes a modest equity “up-side” will be required
through options or warrants. It is generally most appropriate for larger
transactions.
• Government and European Commission sources provide financial aid to the
companies, ranging from project grants to guarantees for enterprise loans in
selective areas.
5.4. Going public: raising equity finance through equity market
As it has been already mentioned, there are three main ways of raising equity
finance:
• retaining profits in the business (rather than distributing them to equity
shareholders);
• selling new shares to existing shareholders (rights issue);
• selling new shares to the general public and investing institutions.
In this chapter, we talk about the process involved in the third method above.
Issues of new shares to the public account do not account of a very large proportion of
total equity fund-raising (for example, in UK it would be less or around 10% of new equity
finance over recent years). While not significant in the overall context of equity financing,
when new issues do occur, they are often large in terms of the amount raised.
New issues are usually used at the time a business first obtains a listing on the
Stock Exchange. This process is called an initial public offering (IPO) or a flotation. When
89
businesses that have been listed on the stock market for some time issue new shares, this
process is called seasoned equity offerings.
The following are reasons why a company may decide to go public and seek a
stock market listing:
1. Maximisation of value. By starting trade on the market, the company seeks to
minimise its costs of capital or maximise its value.
2. Access to a wider pool of finance. A stock market listing widens the number of
potential investors. It may also improve the company’s credit rating, making
debt finance easier and cheaper to obtain. Moreover, this is needed when there
is a good opportunity for acquisition of another company.
3. Improved marketability of shares. Shares that are traded on the stock market can
be bought and sold in relatively small quantities at any time. Existing investors
can easily realise a part of their holding.
4. Transfer of capital to other uses. Founder owners may wish to liquidate the
major part of their holding either for personal reasons or for investment in other
new business opportunities.
5. Enhancement of company image. Quoted companies are commonly believed to
be more financially stable. A stock exchange listing may improve the image of
the company with its customers and suppliers, allowing it to gain additional
business and to improve its buying power.
6. Facilitation of growth by acquisition. A listed company is in a better position to
make a paper offer for a target company than an unlisted one.
However, the owners of a private company, which becomes a listed public
company, must accept that the change is likely to involve a significant loss of control to a
wider circle of investors. The risk of the company being taken over will also increase
following listing. Moreover, the company has to comply with some information disclosure
standards, which are required by the stock exchange.
Factors to consider in respect of equity issues to the public
Issue costs. Issue costs are very large, in UK, where the stock market is well
developed, it amounts for 12.5% of the proceeds for a £5M issue. Other research reports
that in the USA it averages 11% of the funds raised for an IPO and 7% for a public issue of
seasoned shares. Most of the costs are fixed – these include the costs of preparing and
registering the prospectus, payments to the stock exchange, depository, audit, legal fees,
advertising to potential investors, and so on.
90
Issue timing. There are several alternative rules for decision on selling the new
shares on the market:
• Business cycle phase, when there is a need for additional external capital in
order to grow further.
• “Bull” market – that is, when the general price level on the market is expected
to increase.
• The examples of other companies’ successful IPO, which indicate that the
market is ready for new participants.
Uncertainty. The relative certainty about the success of raising funds with rights
issues does not exist with issues to the public. The issue can be addressed by the use of
underwriters and /or issuing by tender but it costs:
• Underwriters, for a fee, will guarantee to take up shares for which public do not
subscribe. Their fee or commission is fixed according to how many shares they
are underwriting, the offer price and how high the underwriter believes the
probability to be that some shares will not be taken up by the public.
Underwriting costs are around 2% of the capital raised.
• Tender is like an auction, where the shares are sold to the highest bidders,
usually subject to a pre-stated reserve price (that is, a price below which offers
will not be accepted.) When the closing date for offers has been reached, the
business or issuing house assesses what is the highest price at which all the
shares could be issued.
Pricing question is very important for all, existing and new shareholders. Tender
method to some extent helps to overcome this problem.
Dilution of control occurs with issues to the public. It is probably the price that the
original shareholders have to pay to obtain access to additional equity finance.
Process. Technically, there are two ways of making public issues:
1. Offer for sale – the issuing business can sell the shares to an issuing house. The
issuing house that sells the shares to the public. Usually, there is no restriction
on the amount of capital raised by this method. Placing is a variation of offer
for sale. In this case, issuing house sells the shares with several of its own
clients, such as insurance businesses and pension funds. Certain costs, such as
adverts and underwriting are saved.
91
2. Offer by prospectus (or public issue) – the issuing business sells the shares
direct to the public. Such companies are usually advised by banks or other
intermediaries.
The main steps of organising an IPO are the following:
1. Search for an intermediary (issuing house), which helps organising an IPO and
selling the shares to institutional and private investors;
2. Agreement on co-operation:
o Amount to be raised,
o Type of shares,
o Responsibilities of investment intermediary,
o Fee for organisation of IPO, etc.
3. Preparation of IPO prospectus:
o Information on the strategy, past and forecasted financial results, current
structure of shareholders and group of companies etc. has to be provided.
o Prospectus has to be submitted to the market supervision authority, which
takes the decision on its registration.
4. IPO:
o Account for the shares to be sold has to be open in the Central securities
depository; the Depository gives the unique number to the IPO, a minimal
number of securities sold for the IPO to be successful is set.
o Time period is set, when the potential investors can subscribe to buy the
shares.
Once the decision to go public was made, the selling procedures can be different
(depending on market regulations). The most common examples are fixed price procedure,
when both the price and quantity of securities sold are fixed (Figure 19), auction
procedure, when only minimum price is fixed (Figure 20) and book building procedure
(Figure 21) when a price range is set and there is only a limited number of potential
buyers.
92
Figure 19. Example of the fixed-price procedure.
Source: Derien, Womack (2001)
Figure 20. Example of an auction procedure
Source: Derien, Womack (2001)
93
Figure 21. Example of placing (book building) procedure
Source: Derien, Womack (2001)
5.5. Public funds as a source of external funding
In general, EU regulation does not allow for state aid to private businesses, so that
the competition is not distorted. For this reason, only a limited range of sectors and
activities can benefit from public funding. The exceptions are based on:
• regional dimension (state aid is allowed in less developed regions);
• companies dimensions – until certain limits, the state aid is allowed for small
and medium-sized enterprises;
• de minimis rule, the idea of which is that small amounts of aid (currently till
200 000 € during the period of three years for one company) do not distort
competition;
• certain types of activities, for which government want to create incentives to
develop (e.g., research and development, innovation creation, etc.)
State support to business companies can come in many different forms. There are
two main groups of support:
1. Direct support, which addresses the issue of provision of actual cash. The forms
of direct support can be the following:
o Grants;
o State guarantees in order to get bank loans;
94
o Compensations of interests paid for bank loans;
o Co-investment along with risk capital, etc.
2. Indirect support comes in the form of business support services to companies.
For example, certain grant agencies will provide assistance in finding investors,
to help in generating new export leads or introducing experts to accelerate the
development of new product ideas and strategies.
The availability of grants and subsidies often depends on which sector a business is
in, where it is located, how well the application is made and timing (some grants only last
for a certain period or until the funding has been allocated). The key factor in winning
grants and subsidies can be whether the funding results in the creation of jobs, especially
in the areas that particularly need them.
Factors to consider in respect of seeking for grants
Match funding. Businesses have to put up some of their own funding in addition to
grant they might receive. It is rare for a grant to cover more than 50% of the cost of a
particular private venture or project. In most cases between 15% and 50% will be offered
by the grant provider.
Moreover, the grant will cover only so-called eligible costs. For example, if the
government sets that the only eligible cost is purchase of equipment, and it covers 50%,
the company will have to invest more than 50% of the project value (which will include
staff costs, preparation of premises for the equipment, transport costs and so on).
Process and procedures. In order to get a grant, there will be certain procedures to
respect. A company will be asked to submit a project application (which might take some
paper work) before the grant and provide a report after project implementation (and
interim reports during the implementation, if the project duration is longer). A simplified
of funding process in presented in Figure 22.
If the funding is provided through compensation mechanism (which is usually the
case, when private projects are financed), the companies will have to address working
capital issues for the time between expenses and compensations. Working capital issues
for project implementation are not that important if the government agencies provide a
possibility of advance payments (that is the agency gives a part of funds in advance) or
direct invoice payment (that is when the agency pays the invoices on behalf of the
company, which implements the project) schemes. Which scheme is used, depends on the
rules for finance, which are set by the government.
Another issue is timing. In general, grants can be distributed through open or
closed calls. In open calls, project applications are evaluated as they come on a first-come-
95
first-served basis. In closed calls, there is a deadline for applications, and all the
applications are evaluated after that deadline. In closed call, if there are a lot of
applications, evaluation can last for a few months, which means that when the answer
about the grant comes, in the quickly changing business environment, the needs for a
specific project can be different (then, fixed costs for preparation of application would be
lost).
Figure 22. Example of a typical funding process of a private project, receiving public funding
Project finance. Grant funding is usually provided for a specific project. Project is
a set of temporary interrelated activities, which has a goal, a defined start and ending date,
and defined financial and other resources, for example, this could be relocation, the
development of a new product, the investigation of a new export market. The project types
and timeframes are defined in advanced by the agency that provides funding. In addition,
the project plan will need to be well developed and defined, with identifiable deliverables
(see schematic example of a project concept in Figure 23). It is likely that a well-
constructed business plan will be an important part of the application.
Because the funding is provided to specific projects, funds can be used to address
specific pre-defined issues. It is important to stress, that grants usually do not solve general
financial issues of companies; grants help to reduce the financial risk of the project funded.
Compensation of eligible costs (CF in)
Project implementation
(CF out)
Project continuity
Evaluation and
contract
Project application
Call for applications
Action by government agency or responsible body Action by the company
96
Figure 23. Project concept
Check Question 11 Assume your company is about to expand and will
seek for public grant. Develop a project concept according to the scheme above.
Costs. First, project application (which might sometimes include a complete
business plan) costs. Small and medium sized companies usually do not have internal
competences and resources to complete the paperwork, so they would employ external
consultants. Project administration is not free as well. During the project implementation,
government agencies providing the grants may ask to follow some rules, for example to
organise procurement procedures, have a separate project accounting, audit the project
results and so on. Businesses usually do not have these costs, when they finance their
activities from private sources.
Long-term commitments. Depending on the rules of the grant, companies might be
asked not to change their activities three to five years after the end of the project, regularly
submit reports for follow-up of the project impact and so on – these are additional
constraints and costs to the company.
Summary
• Retained earnings are one of the most important sources of finance (“internal
finance”). It can be a slow method with a degree of uncertainty, with the same
service costs as ordinary shares but no issue costs. Smaller companies are more
dependent on retained earnings. This source of finance is closely related to
dividend policy in the company.
• Equity finance from risk capital is available to high-growth-potential
companies, which are not quoted on the stock market. Business angels
PROJECT
Current situation
Expected situation
Problems General problem
Objective Goals
Impact Results
Activities
Deliverables
SSoouurrcceess // eexxppeennsseess
Terms and conditions of government support
97
(“informal risk capital”) are wealthy individuals who invest; venture capital
firms are the firms that invest the capital, which they gather from other
investors. Business angels and venture capitalists require a higher rate of return
(20-40% per annum), which is realised by “exit”, that is by selling shares of
higher value. A typical business angel and venture capital investment period is
from 3 to 7 years.
• Raising equity through equity markets involve initial public offerings (for
companies, which go public for the first time) and seasoned offerings (for
companies, which have been on the market for some time). These sources to
attract funding are used not very often (because of high issue costs and because
these methods are available only for companies, which attain a certain size), but
when used, a large amount of finance can be raised.
• Public grants are a source of finance, which is used for project finance. Some
specific activities (e.g., research and development) and small and medium
enterprises are favoured. However, this instrument is not free either – there are
fixed costs of application preparation and proper project administration and
reporting, as well as long-term commitments. In some cases, working capital
management issues between the expenses and compensation (grant) will have to
be addressed.
Key terms
• Business angel
• Eligible costs
• Grant
• Initial public offering (IPO)
• Project
• Rights issue
• Seasoned offering
• Venture capital
Relevant websites
• Overview of financial instruments in UK can be found here: http://tutor2u.net
• The European Trade Association for Business Angels, Seed Funds, and other
Early Stage Market Players (EBAN): http://www.eban.org
• Lithuanian Business Angels Network: http://www.businessangels.lt
98
• More on venture capital can be found at the European Private Equity and
Venture Capital Association: http://www.evca.eu
• Nasdaq OMX Baltic stock exchange provides information on the shares and
corporate bonds, which are traded in the Baltics:
http://www.nasdaqomxbaltic.com.
• 7th Framework Programme for EU research (FP7), which is the European
Union’s main instrument for funding research and development projects
(including private) in Europe: http://cordis.europa.eu/home_en.html.
• Information on grants for companies in Lithuania: http://www.esparama.lt.
• Enterprise Europe Network – European network of business support
1. Berk, J., DeMarzo, P. (2007). Corporate Finance. Boston: Pearson-Addison-
Wesley.
2. Damodaran, A. (2001). Corporate finance: theory and practice. New York:
Wiley.
3. Derrien, F., Womack, K. (2001). Auctions vs. Bookbuilding and the control of
underpricing in hot IPO markets // The Review of the Financial Studies
4. McLaney, E. (2006). Business Finance: Theory and Practice, 7th ed. Harlow:
Pearson education.
5. Vernimmen, P. (2005). Corporate finance: theory and practice. Chichester
(UK): Wiley
Review questions and problems
1. Why are retained profits not a free source of finance?
2. What are the main criteria business angels look for when seeking to invest in
business?
3. What are the opportunities of giving up a part of equity control to external
investors (such as business angels or venture capitalists)?
99
4. Which of the following instruments of raising finance have the lowest issue
costs?
a) rights issue;
b) initial public offering;
c) raising equity finance from venture capital;
d) seasoned offering.
5. If a public grant is given through compensation of eligible costs, why can it still
be considered as a long-term source of finance?
6. A company is planning to enter the Asian market with their products. The
marketing manager has to decide, which market is the best to start from and
how the products should be marketed. For that, she planned some desk research
(40 hours × 50 €), travelling (1 travel 5 000 €), printing works (10 000 €). She
found out that there is a grant scheme, according to which the government
agency covers 50% of travel and external consultancy costs for marketing
feasibility studies. The minimum project size is 30 000 €. Would you
recommend to the manager to submit the application? Please, justify.
100
6. LONG TERM FINANCE-2: DEBT FINANCE
Contents • Long-term debt
• Lease
• Corporate bonds
• Mezzanine finance
• This chapter also includes some tips for using spreadsheets
6.1. Long-term debt
Term loans are negotiated between the borrowing company and a financial
institution, such as bank or credit union. The issue costs tend to be relatively low since the
borrowing company deals with only one lender and there is room for much more flexibility
in the conditions of the loan than is usually possible with an issue of loan stock.
The main criteria on which banks judge their decision of granting loan:
1. Capital: does the company have enough own capital?
2. Repayment: are the cash flows sufficient to guarantee the service and repayment
of debt?
3. Growth: is the company going to grow?
4. Context: is the company independent enough from its suppliers and clients?
Would the company survive in the recession or economic crisis?
5. Collateral: what the value of collateral.
6. Character / history: are the entrepreneurs honest and will tend to repay the loan
in time?
In order to get a loan, the company has to demonstrate its ability to repay it. To do
so, a business plan and historical financial information is usually required by the bank.
The main terms of loan are interest rate, terms of repayment (schedule of
repayments) and collateral.
The interest rates can be:
• fixed over the whole loan period.
• variable, which will usually be interbank interest rate plus bank’s margin rate.
Fixed rates provide more security and clarity when forecasting cash flows. They
are more favourable when there are no major fluctuations in the economy or interest rates
101
are about to increase. Variable rates are more favourable when due to economic situation,
interest rates are likely to decrease. Due to the interest rate risk, depending on the situation
when a loan is taken, banks will charge a higher or lower margin for fixed or variable
interest rate arrangement.
When it comes to repayment schedule, the basic repayment schedules can be the
following:
• constant payment;
• constant principal payment.
Example 10
Suppose, a company takes a loan of 100 000 €, which is to be repaid in five years with 10% of interest rate. If the company chooses the constant payment schedule, it will have to pay the same amount each year. The weight of interests within the payment will decrease as the final payment is closer.
If the company chooses the constant principal payment, then it will have to return the same amount of the loan each year; and the amount of interests paid will be decreasing over the time.
TOTAL 100000,00 31898,74 131898,74 100000,00 30000,00 130000,00
If, as demonstrated in Example 10, the amount of interests paid was lower under
constant principal payment schedule, then why the companies would choose constant
payment schedules? The answer is twofold: first, constant payment is simpler for planning,
second, because of cash flow matching. Under constant principal payment schedule, the
greater part of loan and interests have to be repaid at the beginning, while the value and
cash flows do not necessarily are the highest right after investment.
Spreadsheet tips:
In MS Excel, constant payment schedules can be easily calculated using the
following functions:
• PMT(rate,nper,pv,fv,type) calculates the total payment for a loan based on
constant payments and a constant interest rate, where rate is the interest rate
for the loan per payment period (for instance, if you have 12% annual
interest rate but quarterly payments, it will be 12%/4=3%; nper is the total
number of payments for the loan; pv is the present value, or the total
102
amount that a series of future payments is worth now; also known as the
principal (enter with the “-“sign if it is a loan), fv is the future value, or a
cash balance you want to attain after the last payment is made. If fv is
omitted, it is assumed to be zero, that is, the loan is fully repaid; type
indicates when payments are due (0 or omitted: at the end of the period, 1:
at the beginning of the period)
• PPMT(rate,per,nper,pv,fv,type) returns the payment on the principal for a
given period for an investment based on periodic, constant payments and a
constant interest rate. The arguments are the same as above; per specifies
the period, for which we want to calculate the principal payment and must
be in the range 1 to nper.
• IPMT(rate,per,nper,pv,fv,type) returns the interest payment for a given
period for an investment based on periodic, constant payments and a
constant interest rate. The arguments are the same as above.
• Note that the sum of results of PPMT and IPMT functions for the same
period equals the result of PMT function.
The calculations of constant principle payment schedules is straightforward using
simple formulas (principle payment = principle divided by number of periods; interest
payment for the period = outstanding loan × interest rate)
6.2. Leasing
The acquisition of assets – particularly expensive capital equipment – is a major
commitment for many businesses. Rather than pay for the asset at once, it can often make
sense for companies to look for ways of spreading the cost of acquiring an asset over the
time, to coincide with the timing of the generated revenue. The most common sources of
medium- to long-term finance for investment in capital assets are hire purchase and
leasing. Some sources report that lease provides as much as 20 percent of the total finance
for new capital expenditure.
Hire purchase and leasing are financial facilities, which allow a business to use an
asset over a fixed period, in return for regular payments. The business customer chooses
the assets it requires and the finance company buys it on behalf of the business. Many
kinds of business asset are suitable for financing using hire purchase or leasing, including
plant and machinery, business cars, commercial vehicles, agricultural equipment, hotel
equipment, medical equipment, computers (including software packages), office
equipment.
103
Hire purchase. With a hire purchase agreement, after all the payments have been
made, the business customer becomes the owner of the equipment. This ownership transfer
either automatically or on payment of an option to purchase fee.
For tax purposes, from the beginning of the agreement the business customer is
treated as the owner of the equipment and therefore can deduct related depreciations and
amortisations from profit. Depreciations and amortisations can be a significant tax
incentive for businesses to invest in new plant and machinery or to upgrade information
systems. Under a hire purchase agreement, the business customer is normally responsible
for maintenance of the equipment.
Leasing. The fundamental characteristic of a lease is that ownership never passes
to the company, which uses the assets leased. Instead, the leasing company accounts for
assets depreciation and passes some of the benefit on to the business customer, by way of
reduced rental charges.
The business customer can generally deduct the full cost of lease payments from
taxable income, as an operating expense. As with hire purchase, the user of assets will
normally be responsible for their maintenance.
There are a few types of leasing arrangement:
• Financial lease. The financial lease or ‘full payout lease’ is close to the hire
purchase alternative. The leasing company recovers the full cost of the
equipment, plus charges, over the period of the lease.
Although the company does not own the equipment, it has most of the risks and
rewards associated with ownership. It is responsible for maintaining and
insuring the asset and must show the leased asset on their balance sheet as a
capital item.
When the lease period ends, the leasing company will usually agree to a
secondary lease period at significantly reduced payments. Alternatively, if the
business wishes to stop using the equipment, it may be sold second-hand to an
unrelated third party. The business arranges the sale on behalf of the leasing
company and obtains the bulk of the sale proceeds.
• Sale and leaseback arrangement is a variation of a financial lease. When a
company needs finance, and has a suitable asset, it can sell the asset to a finance
institution, with a leaseback deal as a part of the sale contract. Thus the
company retains the use of the asset and gains additional funds. Land and
buildings is often the subject of sale and leaseback deals.
104
• Operating (or service) lease. If a company needs the assets for a shorter time,
then operating leasing may be the answer. The leasing company will lease the
equipment, expecting to sell it second-hand at the end of the lease, or to lease it
again to someone else. It will, therefore, not need to recover the full cost of the
equipment through the lease rentals.
This type of leasing is common for equipment where there is a well-established
second-hand market (e.g., cars and construction equipment). The lease period
will usually be for two to three years, although it may be much longer, but is
always less than the working life of the machine.
Assets financed under operating leases are not shown as assets on the balance
sheet. Instead, the entire operating lease cost is treated as a cost in the profit and
loss account.
• Contract hire is a form of operating lease and it is often used for vehicles. The
leasing company undertakes some responsibility for the management and
maintenance of the vehicles. Services can include regular maintenance and
repair costs, replacement of tyres and batteries, providing replacement vehicles,
roadside assistance and recovery services and payment of the vehicle licences.
Accounting treatment. According to Financial Accounting Standards Board, from
the lessee’s point of view the two accounting categories are capital leases and operating
leases. A lease is classified as a capital lease if it meets one or more of four criteria (if a
lease is not a capital lease, it is classified as an operating lease):
1. The lease transfers ownership of the property to the lessee by the end of the
lease terms.
2. The lease gives the lessee the option to purchase the property at a price
sufficiently below the expected fair value of the property that the exercise of the
option is highly probably.
3. The lease term is equal to 75% or more of the estimated economic life of the
property.
4. The present value of the minimum lease payments exceeds 90% of the fair value
of the property at the inception of the lease. The discount factor to be used in
calculating the present value is the implicit rate used by the lessor or the lessee’s
incremental borrowing rate, whichever is lower.
For operating leases, rentals must be charged to expense over the lease term, with
disclosure of future rental obligations in total as well by each of the following years
throughout the lease period. Capital leases are to be capitalised and shown on the balance
105
sheet both as a fixed asset and as obligations. Capitalisation represents the present value of
the minimum please payments minus that portion of lease payments representing
execution costs such as insurance, maintenance, and taxes to be paid by the lessor. The
asset must be then amortised in a manner consistent with the lessee’s depreciation policy.
Factors to consider in respect of leasing
Certainty. One important advantage is that a hire purchase or leasing agreement is
a medium- to long-term funding facility, which cannot be withdrawn, provided the
business makes the payments as they fall due. Thus, the uncertainty that may be associated
with alternative funding facilities such as overdrafts, which are repayable on demand, is
removed.
However, on the other hand, both hire purchase and leasing agreements being long-
term commitments, it may not be possible, or could prove costly, to terminate them early.
Budgeting. The regular nature of the hire purchase or lease payments (which are
also usually of fixed amounts as well) helps a business to forecast cash flow. The business
is able to compare the payments with the expected revenue and profits generated by the
use of the asset.
Fixed rate finance. In most cases the payments are fixed throughout the hire
purchase or lease agreement, so a business will know at the beginning of the agreement
what their repayments will be. This can be beneficial in times of low, stable, or rising
interest rates but may appear expensive if interest rates are falling.
On some agreements (especially, longer-term ones), the finance company may
offer the option of variable rate agreements. In such cases, rentals or instalments will vary
with current interest rates; hence it may be more difficult to budget for the level of
payment.
The effect of security. Under both hire purchase and leasing, the finance company
retains legal ownership of the assets, at least until the end of the agreement. This normally
gives the finance company better security than lenders of other types of loan or overdraft
facilities. The finance company may therefore be able to offer better terms.
The decision to provide finance to a small or medium sized business depends on
that business’ credit standing and potential. Because the finance company has security in
the assets, it could tip the balance in favour of a positive credit decision.
Maximum finance. Hire purchase and leasing could provide finance for the entire
cost of the assets. There may, however, be a need to put down a deposit for hire purchase
or to make one or more payments in advance under lease.
106
Tax advantages. Hire purchase and leasing give the business the choice of how to
take advantage of depreciation and amortisation. If the business is profitable, it can
account its own depreciation and amortisation through hire purchase or outright purchase.
If it is not in a tax paying position, then an operational lease could be more beneficial to
the business.
Lease or borrow and buy? When considering investing into an asset, the company
must take two decisions. First, is the project acceptable as an investment – i.e., does it have
a positive net present value if financed at its optimal capital structure? Second, should it be
financed by leasing or borrowing? The costs and benefits of leasing involve an analysis of
the following cash flows:
1. A cash saving, which equals to the amount of the investment outlay, I, that the
company does not have to incur if it leases.
2. A cash outflow, which equals to the present value of the after-tax lease
payments, ( )(1 )tPV LF τ⋅ − , where LFt is lease-rental fee and τ – tax rate.
3. The present value of the opportunity costs of the lost depreciation tax shield,
( )tPV depτ ⋅ (and relevant investment tax credits if there are any), where dept is
the annual depreciation write-off.
4. The present value of the change in the interest tax shield on the debt that is
replaced by the lease financing, ( )( )D tPV k Dτ ⋅ ∆ ⋅ , where kD is interest rate on
the replaced debt capital before taxes and Dt is the remaining book value of the
debt outstanding in period t.
The four terms for a NPV to a lessee are summarised in the following equation:
( ) ( ) ( )(1 ) ( )t t D tNPV I PV LF PV dep PV k Dτ τ τ= − − ⋅ − ⋅ − ⋅∆ ⋅ .
Example 11
Assume, a company wants to invest 10 000 € and is considering whether to borrow and buy or lease. Interest rate for debt is 10%, while for leasing it is 12%. Relevant tax rate is 15%.
The example calculations are presented in the table below: A B C D E F G H I J K
ILease
payment
After-tax lease
payment Depreciation
Depreciation
tax shield
Debt
outstanding Interest
Interest
tax shield CF PV(CF)
=C*(1-tax rate)
=Investment /
number of years =E*tax rate =H*tax rate =D+F+I =J/[(1+10%)^A)]
As a conclusion, in this example, the leasing payment as compared to
borrow and buy option generates negative NPV, which means that borrow and buy option should be chosen.
There are some other factors, which are not purely financial, that have an impact on
the lease decision. These include:
• match of cash flows, as already mentioned;
• incentives to care about the assets (since lessees have no right to the residual
value of the asset, they have less incentive to take care of it, thus, the more
sensitive the value of an asset to use and maintenance decisions, the higher is
the probability that the asset will be purchased rather than leased);
• the degree that an asset is specialised for use within a given company
(organisation-specific assets generate agency costs in the form of negotiation,
administration, and enforcement costs due to conflicts between the lessor and
lessee; this may explain why companies lease office facilities or vehicles more
often than specific production or research equipment);
• time (if a company want to use the assets for a period, which is shorter than its
economic life, it might consider lease).
6.3. Corporate bonds
Companies can borrow by issuing securities with a fixed interest rate payable on
the nominal or face value of the securities (known as coupon rate) and a pre-stated
redemption date. Such securities are called corporate bonds (or loan stocks, or
debentures).
Corporate bonds can be issued in several ways, including direct issues to the
public. Companies can use the services of issuing houses and ask them to place the issue
with its clients, often institutional ones – this is mostly the case in the companies, which
are quoted on the stock exchange.
Unquoted companies can sell their bonds directly to their shareholders or other
investors. In this case, it is not allowed to trade such bonds publicly.
Factors for the business to consider on bond financing
Issue costs tend to be relatively low; they have been estimated from 2 to 3 percent
of the value of funds raised.
108
Servicing costs. Since bonds are a relatively low-risk investment to investors,
expected returns ten to be low compared with those typically sought by equity holders.
Obligation to pay interest. The bond issuers have the obligation to pay interest
according to the terms agreed at the time of issuing. Failure to do so is considered as
default and allows any of the bond holders to initiate the respective legal procedures.
Obligation to redeem bonds. Irrespective of whether bonds are issued as
redeemable or not, the company can always buy its own bonds in the open market
(provided they are quoted). Thus, bonds offer a level of flexibility, which is not provided
with shares. If bonds are issued as redeemable, the company is under a contractual
obligation to redeem. This could put the business into a difficult cash flow position as the
due date for redemption approaches.
Tax deductibility of bond interest. Interest paid to bond holders is deductible from
profit for corporation tax purposes.
Control and freedom of action. The bond holders do not get a control in terms of
voting rights, but there may be some restrictions. Those who lend money impose
conditions or covenants on the business. Failure to meet them, depending on the contract
between the lenders and the company, give the lenders the right to immediate repayment
of the loans. Typical covenants include:
• A restriction on dividend levels;
• Maintenance of a minimum current asset / current liability ratio;
• A restriction on the right of the business to dispose of its non-current assets;
• A restriction on the level of financial (capital) gearing.
A comparison of corporate bonds and bank loans is provided in Table 4.
Table 4. Comparison of bond and loan finance Bonds Loans
• Unlimited amount of emission;
• Possibility to refinance existing loans or implement large projects;
• No need for collateral;
• No control or restrictions, which might be imposed by banks providing loans;
• Diversification of cash and involvement of larger number of investors;
• Bonds can involve different conditions and covenants
• Correction of structure of liabilities;
• Marketing and publicity (visibility of company’s name);
• possibility to use cheaper resources than bank loans; Once the company is on the market, borrowing from other sources gets cheaper too.
• Closer collaboration between bank and its client and more active exchange of information;
• Experience of banks in monitoring situation in the companies and solving problem situations;
• Confidentiality of company information;
• Advantage when borrowing relatively small amounts of money;
• Possibility to review the conditions of the contracts;
• Possibility to satisfy quick needs for cash;
• Source of finance, when the situation on the bond market is not favourable.
109
6.4. Mezzanine finance
In corporate finance, mezzanine is a term for hybrid forms of financing that
combine elements of debt and equity financing. From a balance sheet perspective,
mezzanine capital is a hybrid instrument that acts as a flexible bridge between pure equity
and pure debt (see Figure 24). It is thus able to remedy financial shortfalls that cannot be
made good using the classic forms of corporate financing.
Figure 24. Mezzanine capital versus debt and equity
Source: Credit Suisse Economic Research based on Muller-Kanel (2004)
Mezzanine finance is not a standalone financing instrument like a loan or a stock,
but a hybrid construct that makes use of various instruments. The most important
mezzanine financing instruments include subordinated loans, participating loans, “silent”
participations, profit participation rights, convertible bonds, and bonds with warrants. A
common feature of the various instruments is that they can be structured flexibly in many
different forms, and combined in almost any way desired, in order to provide tailor-made
solutions for the specific financing requirements of private and listed companies. The
versatility and flexibility apply to the amount, maturity, and timing and method of
repayment, as well as to the instrument’s remuneration. Given these characteristics, there
is a very wide range of structuring options for mezzanine finance in practice.
The specific form of a mezzanine financing instrument is classified first by its
position between equity and debt in the balance sheet (equity vs. debt mezzanine), and
second, by its tradability, which ranges from book instruments (private mezzanine) to
those which can be traded on the capital markets (public mezzanine). The latter may be
110
issued publicly (e.g. on an exchange) or placed privately. Equity mezzanine includes
mezzanine finance arrangements under which the investor’s situation is relatively similar
to that of a stockholder. Conversely, finance under which the investor has a similar
position to that of a lender is classified as debt mezzanine. Different risk-return profiles for
the mezzanine investor can arise depending on how close the instrument is to pure debt or
equity (see Figure 25).
Figure 25. Risk-return characteristics of mezzanine instruments
Source: Credit Suisse Economic Research
Comparison of mezzanine with the traditional loan and equity capital is presented
in Table 5. The key feature of mezzanine capital is that mezzanine investors have a
subordinated status in relation to other loan creditors in the event of bankruptcy. This
means that in the event of bankruptcy, the loans providers are generally paid first, followed
by the mezzanine creditors. For this reason, mezzanine funds – although classified as debt
for legal and tax purposes – are also described as “economic equity” or “quasi-equity”,
because they represent liable equity capital from the point of view of the lenders.
From another side, mezzanine investors are classified as higher-ranking in
comparison with pure equity investors. In contrast to equity capital, mezzanine funds are
generally made available for a limited period of time, until the business can generate
sufficient equity capital from retained profits. The subordinated status of mezzanine capital
means that security in the form of property, equipment, etc. does not normally have to be
provided as would be the case with classic loan financing and participation rights are
limited.
111
Table 5. Comparison of mezzanine with “traditional” capital Conventional loan Mezzanine Equity capital
Economic perspective Debt capital Equity capital Equity capital
Legal perspective Debt capital Debt capital Equity capital
Taxation Debt interest deductible
Debt interest deductible
Tax on capital
Investor’s involvement in management
No direct involvement
No direct involvement
Direct involvement
Term 4-5 years, limited term
5-8 years, limited term
Long term
Security Usually secured No security No security
Purpose Contractually specified
Not specified Not specified
Source: Credit Suisse Economic Research
Advantages of mezzanine finance to the companies:
• Remedies financial shortfalls and provides capital backing for implementing
corporate projects;
• Improves the balance sheet structure and thus creditworthiness, which can have
a positive effect on the company’s rating and can widen the possibilities to
attract other types of finance;
• Strengthens economic equity capital without the need to dilute equity holdings
or surrender ownership rights, therefore, the company has greater freedom of
action;
• Tax-deductible interest payments and flexible remuneration structure
The disadvantages of the mezzanine are the following:
• More expensive than conventional loan financing;
• Capital is provided for a limited term only, in contrast to pure equity capital;
• Stricter transparency requirements.
Factors for the business to consider on mezzanine financing
Criteria for using mezzanine. Companies that would like to take advantage of
mezzanine finance, have to comply with the following criteria:
• the possibilities for funding from own resources have been exhausted and loan
financing is insufficient;
• the company in question has a strong market position based on
products/technology and market shares;
• the company is in healthy financial position and good earning power with
steady profit growth where possible; the company’s cash flows are positive and
stable; they can be forecasted reliably;
112
• the company has a focused business strategy and positive long-term
development prospects;
• the company ensures appropriate finance and accounting function, and open
information policy;
• quality and continuity of corporate management.
Instruments of mezzanine. Depending on the instrument used the service costs,
control level, finance treatment as debt of equity will be different. The main instruments
are below:
• Subordinated loans are the most common form of mezzanine financing.
Subordinated loans (junior debt) are unsecured loans where the lender’s claim
for repayment in the event of bankruptcy ranks behind that of providers of
“normal” loans (senior debt). Lenders of subordinated debt are nevertheless
repaid ahead of equity investors.
• Participating loans are “normal” loans, but rather than being fixed, their
remuneration is contingent upon the results of the business. Despite sharing of
profits, participating loans do not give rise to an ownership relationship.
Participation in losses is contractually excluded. In the event of bankruptcy,
providers of participating loans share in the results of the liquidation in the same
way as other loan creditors.
• “Silent” participation is closer in legal form to a shareholding than are
subordinated or participating loans. The distinguishing feature of this form of
financing is that one or more persons take an equity stake in a company, but
without assuming any liability to the company’s creditors. The typical “silent”
participation affects only the company’s internal affairs and is not apparent to
outside observers. The details of participation in profits or losses, involvement
in the company’s management, supervision and information rights, etc. can be
structured flexibly. A major feature of this type of financing is that the silent
investor participates in losses. However, it is possible to remove this feature
partially or completely.
• Profit participation rights. Profit participation rights are equity investments that
entitle the holder to rights over the company’s assets (e.g. participation in
profits or in the surplus on liquidation, subscription for new stock), but not to
the right to be consulted on business decisions. This means that the holder of
profit participation rights has no voting or management rights that would permit
113
intervention in the business affairs of the company, but simply a right to a
specific monetary claim and no more.
• Convertible bonds / bonds with warrants. In addition to the usual right to fixed
interest payments and repayment of principal, holders of convertible bonds or
bonds with warrants have the right to acquire shares or other equity instruments
of the company instead of accepting repayment of the bond. This right is
exercisable for a defined period and at a predetermined conversion or
subscription rate. The effect of the exercise of the conversion right by
bondholders is to convert debt into equity. The difference between a convertible
bond and a bond with warrants is that in the latter case, the warrants
(subscription rights) are separate from the bond and can therefore be traded
separately.
Table 6. Comparison of the main mezzanine instruments Subor–
dinated loan
Participa–ting loans
Silent participa–tion
Convertible bonds
Profit participa–tion
Atypical silent participation
Compensa-tion for lender
Fixed Variable Fixed and variable
Fixed and conversion right
Fixed and variable
Fixed and variable
Expected yield for lender
10-16% on average
10-16% on average
12-16% on average
10-16% on average; 20-30% for conversion.
12-16% on average
12-18% on average; >20% if there is a condition in participa–tion in equity
The rights of lenders to obtain information and take part in decision making
Position as creditor’s, usually with veto rights
Position as creditor’s
Contractual rights of approval and control
Position as creditor’s; after conversion – as partner / shareholder
Contractual rights of approval and control
Position as co-entrepreneur; contractual rights of approval and control
Equity on balance sheet
No No Depends on arran–gement
Only after conversion
Depends on arran–gement
Yes
Participation in losses
No No Usually yes No Usually yes Usually yes
The main providers of mezzanine finance are the following:
• private equity funds;
• specialised mezzanine funds;
• hedge funds;
• banks.
114
Summary
• Loans are a very important source of finance, which is used by companies of all
sizes. It is a rather cheap source of finance – very low issue costs (cheap to
negotiate). Loans are able to be negotiated to suit the borrower business’ needs:
the time periods can vary; there is usually a possibility of choice between
variable and fixed interest rates and various repayment schedules.
• Lease is an arrangement when a financial institution (usually, a bank or leasing
company) buys an asset, which it leases to the user. In principle, it is a loan
secured on the asset concerned. There are several instruments of lease, including
hire purchase, financial lease, sale and leaseback, operating lease, and contract
hire. Company should consider lease is it want to use the assets for a period,
which is shorter than its economic lease, in addition, the assets usually should
not be too specific for the company (it is important for the leasing company to
be able to reuse the assets).
• Corporate bonds are the securities with an interest rate payable on the nominal
value of the securities and redemption date. This type of securities can be issued
by any company irrespective of their size, except that smaller companies usually
are not allowed to sell their bonds publicly. The essence is for the business is
somewhat similar to long-term debt, just as debt, the presence of corporate
bonds can limit a company’s freedom of action. The issue costs are usually
higher than for a loan – there are significant fixed costs.
• Mezzanine is a term for hybrid forms of financing that combine elements of
debt and equity financing. The most popular instrument of mezzanine is
subordinated loan; this is an unsecured loan where the lender’s claim for
repayment in the event of bankruptcy ranks behind that of providers of
“regular” loans. The companies, which would like to use mezzanine finance,
have to comply with some requirements: they are in healthy financial position,
strong market position; positive long-term development prospects. This source
is more expensive than “regular” loans. It is used when borrowing opportunities
are exhausted and equity is not yet available; it is used for larger deals and very
often in mergers and acquisitions.
Key terms
• Capital lease
• Convertible bond
115
• Mezzanine finance
• Operating lease
• Silent participation
• Subordinated loan
• Term loan
Relevant websites
• Bank of Lithuania announces interbank interest rates: http://www.lb.lt. On the
website, one can find a list of commercial banks, which can provide loans, as
well.
• In addition to the list of banks, the Association of Lithuanian banks provides a
list of leasing companies: http://www.lba.lt/go.php/lizingas.
• Nasdaq OMX Baltic stock exchange provides information on shares and
corporate bonds, which are traded in the Baltics:
http://www.nasdaqomxbaltic.com.
Further readings
1. Berk, J., DeMarzo, P. (2007). Corporate Finance. Boston: Pearson-Addison-
Wesley
2. Credit Suisse (2005). Mezzanine Finance – a hybrid instrument with a future //
Economic briefing No. 42.
3. Copelan, T., Weston., J.F., Shastri, K. (2005). Financial theory and corporate
policy. Boston: Pearson Addison Wesley.
4. McLaney, E. (2006). Business Finance: Theory and Practice, 7th ed. Harlow:
Pearson education.
5. Vernimmen, P. (2005). Corporate finance: theory and practice. Chichester
(UK): Wiley.
Review questions and problems
1. Calculate constant payment and constant principal payment schedules for a
100 000 € loan, which was taken for 4 years. The loan is to be return in
quarterly payments; the annual interest rate is 14%.
2. What are the criteria, which distinguish capital lease from operating lease?
116
3. Suppose a company has three alternative types of equipment to buy:
Equipment Purchase price if bought
Annual lease expense and guaranteed residual value of 5-year operating lease
A 761 000 170 000; 16% residual value
B 735 000 162 500; 23% residual value C 715 000 159 000; 21% residual value
Assume, all equipments are substitutes. Tax rate is 15%.Which option should be
chosen based on financial criteria? (Hint: use NPV and IRR methods) What
other criteria might be important for making this decision?
4. Which of the following are true:
a) bond finance is not available to SMEs;
b) issuing bonds leaves more freedom of action for a company than loan
finance;
c) bond issue is more costly than equity issue;
d) bonds are the most important instruments of mezzanine finance.
5. Some companies issue convertible bonds, which carry the right for holders to
convert them into ordinary shares in the same business at a later date. Why
might a company choose to issue convertible bond instead of equity?
6. In what cases mezzanine is an appropriate mean of finance?
117
7. SHORT-TERM FINANCE: FINANCIAL INSTRUMENTS FOR WORKING
CAPITAL MANAGEMENT
Contents • Main concepts in working capital management
• Trade credit (including insurance of trade credit, credit
letters, main payment instruments)
• Overdraft
• Factoring
• Short-term investment instruments
7.1. Main concepts in working capital management
Working capital involves the relationship between a company’s short-term assets
and its short-term liabilities. The essence of working capital management is to ensure that
a company is able to continue its operations and that it has sufficient ability to satisfy both
maturing short-term debt and upcoming operational expenses. The management of
working capital involves managing inventories, accounts receivable and payable, and cash.
Therefore, when businesses make investment decision they must not only consider the
financial outlay involved in acquiring new machinery of buildings but also take account of
additional current assets that any activity will usually entail.
For example, when production increases, there will be a need to hold additional
stocks of inventories, change in sales revenue usually will be related to the levels of
debtors, a general increase in the scale of operations will imply a need for greater levels of
cash etc.
In literature, we can find two definitions of working capital:
• Gross working capital is usually investment into short-term assets;
• Net working capital (or usually just working capital) is defined as a difference
of company’s short-term assets and short-term liabilities. The net working
capital can be calculated from two sides:
o From capital side: as a difference between long-term capital (equity and
debt) and long-term assets;
o From assets: as a difference between short-term assets and short-term
liabilities.
118
In the management of working capital, the goal is to ensure an efficient level of
both short-term assets and short-term liabilities. During the process, the goal is to ensure
that the company will have sufficient cash-flows to cover all short-term liabilities. Of
course, the ultimate objective, as it was stated at the beginning of the course, is the
shareholders’ wealth maximisation.
The main ratios, which describe working capital, are embraced in the operating
cycle model, which is demonstrated in Figure 26. The operating cycle involves all the parts
of working capital management. At the beginning of cycle, raw materials or inventories
are purchased from suppliers and accounts payable increase. From purchase to sales
moment, inventories are accounted for; then, goods or services are sold on credit. When
the cash from clients reaches the company, the cycle restarts. The operating cycle depends
on the sector of economy (e.g., goods or services), company’s stage (new or old company);
geography of activities (export, import or internal market) and other factors, which define
the specifics of company’s activities.
Figure 26. Operating cycle
Operating cycle is the time period from inventory purchase until the receipt of
cash. The cash cycle is the time period from when cash is paid out, to when cash is
received.
Check Question 12 Information below relates to the company X (all
numbers in m€): Purchases of raw materials Usage of raw materials Revenue from sales (all on credit) Costs of sales Average creditors Average raw materials stock Average work in progress Average finished goods stock Average debtors
65 61
240 180
4 12 7
18 35
Operating cycle
Payments from clients
Inventories period Debtors’ collection period
Creditor payment period Cash cycle
Credit purchase Payments to creditors
Credit sales
Raw materials stock period
Production period Finished goods stock period
119
What is the company’s working capital size? What is the length of the operating cash cycle? How could it be possible to reduce the working capital
without shortening the operating cash cycle? (note that days of cycle are not of equal importance in money terms, i.e., changing one period may have not the same effect on working capital than another one).
Check Question 13 What is the length of the operating cash cycle in your company? What conclusions about the efficiency of working capital management you could draw based on your calculations? What are the rooms for improvement?
The amount of funds tied up in working capital is not a constant figure throughout
the year. Many industries are seasonal, this means that sales revenue, stocks, debtors, and
so on, will be at higher levels at some times of the year than at others.
For an efficient management, the working capital need should be separated into
two parts: a fixed part and a variable part. The fixed part can be defined as the minimum
working capital amount requirement for the year. It is widely accepted that companies
should funded as shown in Figure 27. This is a so-called maturity-hedging approach,
which says that the permanent needs (non-current assets and the fixed element of working
capital) should be financed from permanent (or long-term) sources (such as equity and
long-term debt); the variable element should be financed from a short-term sources, which
can be attracted and repaid easily and at short notice. As it can be seen in the figure, the
expansion requires to change the structure of finance required by the company as well (the
structure is to be altered by contraction and structural changes of the company’s operations
too).
120
Figure 27. Financing the company: maturity hedging approach
There exist several main strategies for managing working capital in companies:
1. Aggressive (or restrictive): maintaining a high level of short-term liabilities and
a low level of short-term assets;
2. Conservative (or flexible): maintaining a low level of short-term liabilities and a
high level of short-term assets;
3. Compromise (or moderate): an intermediate strategy, in between of the
aggressive and conservative ones.
These strategies are defined by partial investment (short-term assets management)
and financing (short-term liabilities management) strategies, which can be measured using
the share of short-term assets and short-term liabilities in total assets (see Figure 28).
Figure 28. Working management policies in companies
Since the working capital management is twofold – assets and liabilities side, there
are two ways of dealing with the financing: first, optimising needs (i.e., increasing debt
Financing (short-term liabilities) strategy
Agresssive Conservative
Conservative
Agressive
0,5
1,0
Investment (short-term assets) strategy
Agressive strategy
High revenues and risk
Moderate revenues and risk
Moderate revenues and risk
Low revenues and risk
Moderate strategy
Moderate strategy
Conservative strategy
Share of short-term liabilities in total assets
Share of short-term assets in total assets
0,5 1,0
Time
Total Assets
Non-current assets
Fixed part of working capital
Variable part of working capital Short-term finance
Long-term finance
121
collection efforts, reducing inventories by introducing modern inventory management
systems, actively managing treasury etc.), second if the assets are at the optimal level,
looking for suitable financial sources. Further on, financial instruments will be explored,
making the assumption that assets are at their optimal level.
The current assets (inventories, debtors and cash) are not financed entirely from
long-term sources of finance. Most companies have access to the following major short-
term sources:
• trade credit, when goods and services for production are purchased on credit
(e.g., the company does not have to pay immediately for delivery of raw
materials but is allowed to delay payment for 30 days);
• overdraft;
• short-term debt;
• factoring;
• letters of credit, etc.
7.2. Trade credit
7.2.1. Trade credit as a source of finance
Trade credit is the money owed for goods and services purchased on credit by the
company; it appears on the liabilities side and is, in effect, an interest-free loan. Of course,
trade credit might be not completely free if companies build the costs of granting credit
into the pricing policy and discriminate those who settle their bills immediately and those
who do not.
Factors for the business to consider on trade credit financing
Price vs. interest cost. Some suppliers might offer a discount for immediate
settlement. On the other hand discount should be always compared to the alternative –not
taking advantage of trade credit will induce interest costs. Therefore, it may be worth
incurring some of the costs of taking trade credit (i.e., losing the discount), especially,
when interest rates are high and during the inflation periods when borrowers are favoured
over lenders.
Supplier goodwill. If credit is overstepped, suppliers may discriminate against the
customer who does not pay on due time. The effect of the loss of goodwill depends on the
relative market strengths of the parties involved.
122
Administration and accounting. Taking advantage of the credit might increase
administrative and accounting costs that would not otherwise be incurred. On the other
hand, the explicit costs in trade credit are not very usual.
Restrictions by suppliers. Many suppliers insist that to be granted credit, orders
must be of some minimum size and / or regularity.
Exchange rate risk. Companies that buy on credit where settlement is to be in a
foreign currency, are exposed to risk and potential cost. Therefore, managing exchange
rate risk becomes an important issue.
Check Question 14 A company X produces fast moving consumer goods. About 80% of the company’s purchases were on terms of 2/10, net 30 (which mean that most suppliers offered a 2 percent discount to customers who paid within ten days but, in any case, full payment was expected by day thirty). The company pays 10% interest rate on its debt. Does taking the discount make financial sense?
Trade debt
Combined with management of trade debt (granting trade credits to the clients; it
appears on the assets side as receivables or selling on open account), trade credit
management is an important source of short-term finance. Trade debt works the same way
as trade credit but the opposite direction. Therefore, when managing trade debts, it is
important to have in mind the following aspects:
• Lost interest. Trade debtors are not usually secured (alternatively, insurance
does cost), therefore making interest-free loans is rather risky and expensive.
• Administration and record keeping costs. Most companies that grant credits
have to attribute resources for administration and collection of trade debts; the
volume of accounting transactions increase. Assessing customers’
creditworthiness has its costs as well.
• Bad debt expenses. Unless the company adopts an extremely cautious credit-
granting policy, some trade debts will never be paid.
• Discounts. It is quite common to offer a discount to the client if he settles the
debt quickly. Giving discounts for prompt payment can represent a significant
cost, however, prompt payment might also reduce some of the other costs.
7.2.2. Trade credit insurance
As it was already mentioned, trade credit is offered by sellers to their customers as
an alternative to prepayment or cash on delivery terms, providing time for the customer to
generate income from sales to pay for the product or service. This requires the seller to
123
assume non-payment risk. In an export transaction, the risk increases when the company
has uncertainties with regards to laws, customs, communications, and customers’
reputation. In addition to increased risk of non-payment, international trade presents the
problem of the time between product shipment and its availability for sale.
The account receivable is like a loan and represents capital invested by the seller
(in order to finance his clients, very often, the seller will have to borrow funds). But this
asset is not secure until it is paid. If the customers’ debt is credit-insured, the large, risky
asset becomes more secure, like an insured building. This asset may then be viewed as
collateral by lending institutions; and a loan based upon it can be granted to cover the
expenses and to produce more products. Trade credit insurance is, therefore, a trade
finance tool.
Trade credit insurance (also called credit insurance, business credit insurance, or
export credit insurance when export trade credit is insured) is an insurance policy and a
risk management product offered by private insurance companies and government export
credit agencies to companies wishing to indemnify their accounts receivable against losses
from non-payment of a trade credit. From the company’s perspective, there are several
main advantages of using trade credit insurance:
1. Risk transfer. Trade credit insurance is a financial tool to hedge against both
commercial (such as clients’ default, insolvency, bankruptcy etc.) and political
(e.g., political unrest, expropriation, etc.; this type of risks and insurance is
common in export credit insurance) risks that are beyond a company’s control.
The company using credit insurance, transfers the risk associated with default
by its clients to the insurance company. Because credit insurers manage risks by
holding diversified portfolios and back these risks with large amounts of equity,
they are more suited to assume the risks than the company.
Transfer of risk facilitates sales expansion (both in domestic and exports
markets): if accounts receivable are insured, a company can safely provide open
account terms for its existing customers, or go after new customers that may
have been too risky without insurance (open account terms for exporters
especially can be a major competitive advantage).
Risk transfer can also help to improve company’s financial position through
indemnification from customer non-payment.
2. Additional services. Credit insurance includes a larger package of services.
These include not only the continuous monitoring of the creditworthiness of the
insured clients, but also servicing the account receivables, or suggesting
124
payment and delivery conditions. The credit insurer also supports the company
in debt collections. As a result, a reduction of bad-debt expenses and reserves is
possible, which this frees up cash for the company.
3. Facilitation of financing. Companies with credit insurance are able to get better
credit terms from banks. Some banks require credit insurance before they
provide financing.
Figure 29. Trade credit process
Trade credit process model is demonstrated in Figure 29. The main steps are the
following:
1. Company signs an insurance contract with the insurance company for the
insurance of accounts receivable of a particular client and pays an insurance
premium (step 1A). The insurance company checks the company client’s
creditworthiness (step 1B) and sets the limit for a maximum accounts
receivables, which will be insured (the company will be able to sell to its client
on credit above this limit, however, in this case, the receivables, which are
above this limit will not be insured).
2. Company sells goods or services to its client on credit.
3. Payment: either the client pays for the goods or services provided (step 3A; in
this case, there is no loss for the insurer) or, if the client is unable to pay, the
insurance company pays the indemnities – the agreed percentage of the
receivables from this client (step 3B).
COMPANY
Company’s client
Trade credit insurer
Credit institution
1A
c1
3B
3A
2
b a
c2
1B
125
Sometimes, companies finance their working capital needs from credit institutions.
In such cases, the credit insurance scheme can be complemented. The process when credit
institutions are involved is as adjusted as follows:
a. Company addresses the credit institution for funding and as a guarantee
provides the trade credit insurance contract with a list of insured clients.
b. The credit institution provides the needed financing;
c. Payment: either company’s clients make payments for goods or services
directly to the credit institution, which provided finance for the company
(step c1) or, if they are unable to pay, the insurance company pays the
indemnities – the agreed percentage of these receivables from these clients
(step c2).
Costs. The insurance premium is calculated based on the turnover of receivables
insured; the size of the premium depends on the company’s trade history, turnover,
industry and clients insured. Usually, the annual insurance premium is at the level of 0.1-
0.8% of the turnover insured.
Substitutes. Smaller firms, which have few financing alternatives and are often
credit constrained, may prefer factoring or require their customers to provide letters of
credit in cases where insurance solutions may be less attractive. Although factoring is a
substitute for credit insurance, factor companies usually transfer the trade credit risk to a
credit insurer. The advantage of insurance over letter of credit is that is simpler to use and
more positively viewed by the clients.
7.2.3. Letter of credit
A letter of credit (L/C, also called documentary credit, documentary letter of
credit, or commercial letter of credit) is an agreement, issued by banks, guaranteeing the
payment of a customer’s draft up to a stated amount for a specified period. It substitutes
for a bank credit for the buyers and eliminates the risk for the sellers. Letters of credit are
required by the seller and are obtained by the buyer. In the event that the buyer is unable to
pay, the bank issuing the letter of credit is obliged to pay the seller. The L/C relates to
individual transactions, especially in international trading, and is subject to a fixed set of
rules where two or more banks are involved.
L/C is usually employed in the following cases:
• Trading parties are not familiar with each other (especially in international
trade), and therefore, reluctant to dispatch the goods without being certain of
receiving payment or pay without having received the goods;
126
• As insurance from political and in some cases of exchange rates risks related to
the buyer’s country (however, in markets where the sellers face intense
competition, insurance from political risks or partners’ default could be
provided by other instruments; and for example, by not requiring buyers to
provide guarantees or letters of credit, credit insurance could increase sales).
• When having a source of finance is important for both trading parties (by using
a documentary credit, a seller is certain of receiving payment at the agreed time,
and of having a source of finance; the buyer will often obtain advantages such
as a reduction in price for prompt payment as well as credit – a source of
finance).
• In some countries, a documentary credit is the only method, by which payment
for imports is permitted. This may be because import licences are administered
by the central banks.
The process of a transaction involving a letter of credit is depicted in Figure 30.
Figure 30. Process of a commercial letter of credit
1. Sale contract is signed between the company and its client.
2. Applicant approaches issuing bank and requests issuing bank to issue a letter of
credit in favour of beneficiary.
3. Issuing bank issues a letter of credit and sends it to the advising bank.
4. Advising bank advises issuance and forwards the original the letter of credit to
the beneficiary.
COMPANY (seller, beneficiary)
Company’s client (buyer, applicant)
Advising bank / confirming bank
Buyer’s bank / issuing bank
1
2
3
4
5
6A
6B
7A
7B
7C
8
9
127
5. When the beneficiary receives the L/C and if it suits his requirements, he
prepares the goods and hands over them to the carrier for dispatching to his
client.
6. The company then hands over the documents along with the transport document
as per L/C to the advising bank (6A) to be forwarded to the issuing bank (6B).
7. Issuing bank reimburses the advising bank with the amount of the L/C after
advising bank’s confirmation that they have negotiated the documents in strict
conformity of the L/C terms (7A). Advising bank credits seller’s account with
the net proceeds (7B). Simultaneously, the advising bank forwards the
documents to the issuing bank to be released to the applicant to claim the goods
from the carrier (7C).
8. Applicant reimburses the issuing bank for the amount, which it had paid to the
negotiating bank.
9. Issuing bank releases all documents along with the titled transport documents to
the applicant.
Settlements under a letter of credit
All commercial letters of credit must clearly indicate whether they are payable by
sight payment, by deferred payment, by acceptance, or by negotiation. These are noted as
formal demands under the terms of the commercial letter of credit.
• In a sight payment, the commercial letter of credit is payable when the
beneficiary presents the complying documents and if the presentation takes
place on or before the expiration of the commercial letter of credit.
• In a deferred payment, the commercial letter of credit is payable on a specified
future date. The beneficiary may present the complying documents at an earlier
date, but the commercial letter of credit is payable only on the specified future
date.
• An acceptance is a time draft drawn on, and accepted by a banking institution,
which promises to honour the draft at a specified future date. The act of
acceptance is without recourse as it is a commitment to pay the face amount of
the accepted draft.
• Under negotiation, the negotiating bank, a third party negotiator, expedites
payment to the beneficiary upon the beneficiary’s presentation of the complying
documents to the negotiating bank. The bank pays the beneficiary, normally at a
discount of the face amount of the value of the documents, and then presents the
128
complying documents, including a sight or time draft, to the issuing bank to
receive full payment at sight or at a specified future date.
Types of letter of credit:
• Irrevocable. An irrevocable letter of credit can neither be amended nor
cancelled without the agreement of all parties to the credit. In general, all letters
of credit are deemed to be irrevocable unless otherwise stated.
• Unconfirmed. The advising bank forwards an unconfirmed letter of credit
directly to the seller without adding its own undertaking to make payment or
accept responsibility for payment at a future date, but confirming its
authenticity.
• Confirmed. A confirmed letter of credit is one, in which the advising bank, on
the instructions of the issuing bank, has added a confirmation that payment will
be made as long as compliant documents are presented. This commitment holds
even if the issuing bank or the buyer fails to make payment. The added security
of confirmation to the seller needs to be considered in the context of the
standing of the issuing bank and the current political and economic state of the
buyer’s country. A bank will charge an additional fee for confirming a letter of
credit. Confirmation costs will vary according to the country involved, but for
many countries considered a high risk will be between 2%-8%. There also may
be countries issuing letters of credit, which banks do not wish to confirm – they
may already have enough exposure in that market or not wish to expose
themselves to that particular risk at all.
• Standby letters of credit. A standby letter of credit is used as support where an
alternative, less secure, method of payment has been agreed. In some countries
they can also be used instead of bank guarantees. If the seller fails to receive
payment its client, he may claim payment under the standby letter of credit.
• Revolving letters of credit. The revolving credit is used for regular shipments of
the same commodity to the same client. It can revolve in relation to time or
value. If the credit is time-revolving, once utilised, it is re-instated for further
regular shipments until the credit is fully drawn. If the credit revolves in relation
to value, once utilised and paid, the value can be reinstated for further drawings.
The credit must state that it is a revolving letter of credit and it may revolve
either automatically or subject to certain provisions. Revolving letters of credit
129
are useful to avoid the need for repetitious arrangements for opening or
amending letters of credit.
• Transferable letter of credit. A transferable letter of credit is one, in which the
seller has the right to request the paying, or negotiating bank to make either
part, or all, of the credit value available to one or more third parties. This type of
credit is useful for those acting as intermediaries, especially where there is a
need to finance purchases from third party suppliers.
• Back-to-back letter of credit. A back-to-back letter of credit can be used as an
alternative to the transferable letter of credit. Rather than transferring the
original letter of credit to the supplier, once the letter of credit is received by the
seller from the opening bank, that letter of credit is used as security to establish
a second letter of credit drawn on the seller in favour of his client. Many banks
are reluctant to issue back-to-back letters of credit due to the level of risk, to
which they are exposed, whereas a transferable credit will not expose them to
higher risk than under the original credit.
Table 7. Advantages and disadvantages of letter of credit Advantages Disadvantages
• The beneficiary is assured of payment as long as it complies with the terms and conditions of the letter of credit. The letter of credit identifies which documents must be presented and the data content of those documents. The credit risk is transferred from the applicant to the issuing bank.
• The beneficiary can enjoy the advantage of mitigating the issuing bank’s country risk by requiring that a bank in its own country confirm the letter of credit. That bank then takes on the country and commercial risk of the issuing bank and protects the beneficiary.
• The beneficiary minimises collection time as the letter of credit accelerates payment of the receivables.
• The L/C as a payment method is costlier and more complicated than other methods of payment.
• Buyers dislike L/C because they increase transaction costs and diminish their ability to borrow from banks, as the L/Cs are charged against the overall credit limit set by its bank.
• The beneficiary’s documents must comply with the terms and conditions of the L/C for issuing bank to make the payment.
• The beneficiary is exposed to the issuing bank’s commercial risk, issuing bank country’s political risk and foreign exchange risk.
• Since all the parties involved in L/C deal with the documents and not with the goods, the risk of beneficiary not shipping goods still persists.
7.2.4. Other instruments for secure payments
The following instruments are largely used in international trade as substitutes for
letters of credit, credit insurance, or factoring. Differently from these methods, the ones,
which are discussed in this chapter are meant to provide security and mitigate risks rather
than provide additional finance, therefore, will be presented shortly.
130
Documentary collections
Documentary collections are a payment collection mean, which is simpler and less
costly than documentary credit. Under documentary collection arrangements, the seller
ships the goods, and then gives the documents (including the bill of lading necessary to
claim the goods at the foreign port) to his bank, which will forward them to a bank in the
buyer’s country, along with instructions on how to collect the money from the buyer.
When the foreign bank receives the documents, it will contact the buyer and provide
documents to the buyer only when the buyer pays, accepts to pay or fulfils other conditions
set by the buyer. There are two types of documents collections:
1. documents against payment (D/P or documents on payment, DOP) – the
documents attached to the draft (bill) drawn by the exporter and needed to
obtain goods are deliverable to the importer only after he/she has paid the draft.
This transaction involves a sight draft (payable upon presentation)
2. Documents against acceptance (D/A or documents on acceptance, DOA) – the
documents attached to the draft (bill) drawn by the exporter and needed to
obtain goods are deliverable to the importer only after he/she has accepted the
draft for payment later. This transaction involves either a date draft (becomes
payable – matures – on a fixed date, irrespective of the date it was accepted by
the payer) or a time draft (which becomes payable at a determinable future time,
e.g., 30 days after presentation (after sight)). The acceptance of a date draft or
time draft by the buyer renders a documents against acceptance collection
transaction equivalent to an “open account” transaction, even though with a
written promise to pay.
Escrow
Escrow is a payment arrangement when money is delivered to a third party (called
an escrow agent) to be held in trust (“in escrow”) pending the fulfilment of condition(s) in
a contract, whereupon the escrow agent will deliver the payment to the proper recipient.
Typically, escrow is used when the seller and buyer are unknown to each other.
In trade context, after the seller and buyer have agreed to the transaction, the buyer
puts the payment in escrow by paying the escrow agent (it can be commercial bank, which
provides escrow account service), which both parties have agreed to use. The seller sends
the goods and upon acceptance by the buyer, the escrow agent releases the payment to the
seller. The contract determines what documents the seller must present to the escrow agent
in order to gain access to the funds on the account after the deal has taken place. An
131
escrow account is a useful alternative if the buyer and seller do not know each other very
well but do not, for some reason, wish to use letter of credit.
Escrow accounts have been used in payments of ordinary export deals, revolving
export orders, building renovation and contracting projects and mediated trade. Escrow
accounts have been used in arrangements related to corporate acquisitions.
Cash in advance
When cash in advance arrangement is used, full or significant partial payment is
required, usually through a credit card or a bank or wire transfer, before the ownership of
the goods is transferred. It is the most secure and favourable method for sellers and,
consequently, the least secure and attractive method for buyers. Both, the credit risk and
the competitive environment should be considered when making a decision on usage of
this method. Insisting on cash-in-advance could, ultimately, cause sellers to lose customers
to competitors who are willing to offer more favourable payment terms to their clients.
This method is used in the following situations:
• The buyer is a new customer and/or has a less-established operating history.
• The buyer’s creditworthiness is doubtful, unsatisfactory, or unverifiable.
• The political and commercial risks of the buyer’s home country are very high.
• The seller’s product is unique, not available elsewhere, or in heavy demand.
Figure 31 presents risks, associated to different payment methods incurred by
sellers and buyers. The attractiveness of these payment methods is opposite to risk.
Figure 31. Risk of different payment instruments for sellers and buyers
Risk for seller Risk for buyer Low High
Cash-in-advance Letters of credit
Documentary collections Escrow
Open account High Low
7.3. Overdraft
Overdraft financing is provided when companies make payments from their current
account exceeding the available cash balance. An overdraft facility enables a company to
obtain short-term funding, although in theory, the amount loaned is repayable on demand
by the bank. Overdraft is used to fill the gap between cash outflows and inflows, which
132
arise due to seasonality, to cover unforeseen expenses or take advantage of unforeseen
opportunities.
The amount of an overdraft at any one time will depend on the cash flows of the
business, the timing of receipts and payments, seasonal trends in the sales and so on. This
can be illustrated using the data in Example 12.
Example 12
Assume a company, which buys raw materials in summer time and sells the products in winter season. In this example, the company generates a positive overall cash flow in a full year. However, due to the timing of sales receipts compared with supplier payments, the business needs to fund a temporary overdraft during the year.
Opening balance
Sales receipts
Cash payments
Monthly cash flow
Closing balance
January 0 150 130 20 20
February 20 145 125 20 40
March 40 130 145 -15 25
April 25 130 135 -5 20
May 20 130 145 -15 5
June 5 125 150 -25 -20
July -20 120 155 -35 -55
August -55 120 135 -15 -70
September -70 140 130 10 -60
October -60 150 125 25 -35
November -35 160 120 40 5
December 5 170 110 60 65
Total year 1670 1605 65
In the example, the company will require a maximum overdraft facility of 70 in August. Afterwards, the overdraft balance reduces as sales receipts exceed cash payments.
If the business finds that an overdraft facility appears to be becoming a long-term
feature of the business, it might be valuable to convert the overdraft into a medium-term
loan.
Factors for the business to consider on overdraft financing
Limit. The amount borrowed should not exceed the agreed limit (“facility”). The
amount of the facility made available is a matter for negotiation with the bank.
Costs. The bank may usually charges an overdraft facility fee (which might be
from 0.2 to 1.5% of the maximum facility amount). Interest is charged on the amount
overdrawn – at a rate that is above the bank’s base rate; interest rate can be fixed or
flexible. Some banks also charge a commitment fee (0.3-1% on non-used facility).
133
Security. Depending on the size of the overdraft facility, the bank may require the
company to provide some security, for example, by securing the overdraft against tangible
fixed assets, or against personal guarantees provided by the directors.
Table 8. Comparison of bank overdrafts and bank loans Advantages of overdraft Advantages of loan
• Flexibility and speed: once the facility is granted, funds can be used when needed.
• Customer only pays interest when overdrawn, no additional charges for payment earlier than required.
• Overdraft can be effectively be used as a medium-term loan without additional efforts (the period for which the company is allowed to have a negative balance on its account, however, is limited).
• Being part of short-term debt, the overdraft balance is not normally included in calculations of the business’ financial gearing.
• Cost – interest rate on loans are lower than interest rate for overdraft facilities.
• Business and bank know precisely what the repayments of the loan will be and how much interest is payable and when. This makes cash flow planning more predictable.
• The loan is committed – the business does not have to worry about the loan being withdrawn whilst it complies with the terms of the loan.
7.4. Factoring
Factoring is a set of services, which includes financing, administration of invoices,
bookkeeping of receivables (sales ledger) and risk of bad debt management by assignment
of receivables to factoring company.
Factoring is suitable for both small and larger companies, which:
• have a shortage of finance for their working capital but cannot borrow, because
do not have collateral;
• compete in the market where payments are usually deferred and the term for
payment is an important factor;
• have some uncertainties regarding buyers’ reliability and abilities to pay.
Factoring allows the companies to raise finance based on the value of their
outstanding invoices. Factoring also gives the opportunity to outsource debt collection
operations and to use more sophisticated credit rating systems. Once the company has set
up a factoring arrangement with a factor (usually, the bank, bank’s subsidiary, or a
specialised factoring company), the factoring process is as follows (see also Figure 32):
• When the company makes a sale, it invoices its customer and sends a copy of
the invoice to the factor. The factor pays the company a pre-agreed proportion
of the invoice value within a pre-agreed time, which is much shorter than a
standard payment period.
• The factor issues statements on the company’s behalf and collects payments –
this includes contacting late payers by phone and pursuing outstanding invoices.
134
The company will, however, remain responsible for reimbursing the factor for
bad debts, unless there is arrangement a “non-recourse” facility. Non-recourse
means that if a debtor does not pay, the factoring company will either suffer the
loss or will have insured themselves against the loss.
• The company receives the balance of the invoice (less charges) once the factor
receives payment.
In other words, factors simply buy the company’s invoices at a discount and collect
a fee (remuneration).
Figure 32. Factoring flow
Factors for the business to consider on factoring
Criteria for the companies, which can use the factoring services.
• The factor audits the potential client’s books and accounts to establish that its
sales ledger meets its criteria.
• Factoring can be used by all- small and large companies, even though in some
countries, there factors set requirements for a minimum turnover.
• Factors only provide finance to businesses dealing on trade credit terms.
Typically, no one debtor should account for more than 25-40% of the business.
• Businesses such as builders and advertising agencies, which are paid in stages,
and whose bills are often questioned, may not be able to use factors. Factoring
is also not available before the goods or services are provided (that is, factor
does not provide finance for pro-forma invoices).
COMPANY Company’s
client
Factor (e.g., bank or factoring company)
1. Order / contract
2. Goods / services and invoice (with a delay of payment of 30-90 days)
3. Assignment of receivables
4. Advance payment (up to 80% of receivables assigned 5. Payment for
delivered goods / services within 30-90 days
6. Return of the rest of payment minus remuneration
135
• For non-recourse factoring (where the factor protects the client against bad
debts) the factor will usually set credit limits for each customer.
Costs. Factoring is a rather costly instrument with charges based on numbers and
volumes of invoices, risk, and so on. The following are the costs:
• Factoring contract and limit fee – till 1-2% of factoring limit
• Finance charges should be comparable to an overdraft. Typical charges on the
amount financed range from 1.5% to 3% over base rate, with interest calculated
on a daily basis. Finance charge is based on amount of advance payments.
• Administration of invoices: 0.3-1% of invoiced amounts plus a fixed fee per one
invoice, which makes factoring not attractive for companies having a lot of
invoices for small amounts.
• Credit protection charges (for non-recourse factoring) largely depend on the
degree of risk the factor associates with your business. Typical charges range
from 0.5% to 2% of annual turnover.
On the other hand, all these costs provide tax shield.
Relationship with the client. Firms that highly value their relationships with their
customers would prefer other means of finance (for example, credit insurance) rather than
sell their receivables to a factor. This is particularly true in industries where there is
repeated buying of goods and services from the sellers.
Table 9. Advantages and disadvantages of factoring Advantages Disadvantages
• No need for collateral in order to get finance; increase in liquidity of the company.
• Possibility to maximise the company’s cash flow as factoring enables to raise up to 80% or more on the outstanding invoices. An overdraft secured against invoices could only raise up to 50%.
• Planning cash flows is simpler.
• Using a factor can reduce the time and money the company spends on debt collection since the factor can run the sales ledger for the company.
• The company can use the factor’s credit control system to help assess the creditworthiness of new and existing customers.
• Factoring can be an efficient way to minimise the cost and risk of doing business overseas.
• Factoring enables offering more attractive payment terms to the clients
• If the factor takes over the maintenance of the sales ledger, customers may prefer to deal with the company they are trading with rather than a factor.
• Factoring may impose constraints on the way to do business. For non-recourse factoring, most factors will want to pre-approve customers, which may cause delays. The factor will apply credit limits to individual customers (though these should be no lower than prudent credit control would suggest).
• The client company might only want the finance arrangements and yet it might feel it is paying for collection services they do not really need.
• Ending a factoring arrangement can be difficult where the only exit route is to repurchase the sales ledger or to switch factors and that could cause a sudden shortfall in the company’s working capital.
• Costs of the instrument – it is more costly than most of the short or medium-term loans.
136
A comparison of factoring and its closest substitutes is provided in Table 10.
Table 10. Comparison of factoring, credit insurance and documentary credit
Criteria Credit insurance L/C Factoring
Risk insurance
Against buyers default (including failure to pay on due time) and insolvency
Against buyers’ insolvency
Against buyers default (including failure to pay on due time) and insolvency
Services Risk assessment, debt collection
Risk assessment
Debt collection
Access to finance
Easier access to finance for seller provided credit institution is involved
Easier access to finance for both seller and buyer
Easier access to finance for seller
Relations with business clients
Buyer is not involved in the insurance
Buyer is a part of the transaction
Risk to harm the relations if the revenues are collected by factoring company
7.5. Instruments for management of cash surplus
When a company is experiencing cash surpluses, it is necessary to determine
whether this cash represents a permanent surplus or a temporary one. If it is a permanent
surplus, then the question is about using the cash for some long-term purpose. This could
involve further investment, if positive NPV projects can be found, or the repayment of
some long-term finance.
When the cash surplus is temporary (for example, due to the seasonality of the
business’s activity), the cash should be used in the most effective way. There are the
following short-term possibilities:
• Interest-yielding deposits. In general, higher returns are generated from deposits
requiring a period of notice of withdrawal or longer term deposits. Therefore,
the company will have to assess for how long the spare funds are likely to be
available and how likely it is that they will be needed unexpectedly. Companies,
which experience larger cash fluctuations, also have the possibility of overnight
deposit (which means that cash from the company account is deposited after
working hours and returned to the account in the morning); there is a minimal
threshold for the amount, which can be placed as an overnight deposit.
• Marketable investments. These could be securities, currency exchange, and
other assets, which can be easily sold. There are, however, at least two caveats.
First, risk – the price for equities fluctuates, government bonds are related to
interest rate risk, currency exchange rates are also unpredictable; it would be
possible to use derivatives or other instruments for hedging, however at a cost.
Second, cost – dealing charges are likely to be involved with buying and selling
137
marketable securities, therefore, such investment will be inappropriate when
small amounts and / or short investment periods are involved. Moreover, taxes
can be another cost item – proceedings from change in value of traded securities
may be taxable.
Summary
• Working capital = inventories + debtors + cash – creditors. In practice,
investment in working capital cannot be avoided. Management of working
capital is about seeking for balance between risks and costs of having too much
vs. too little of each element.
• In general, working capital strategy depends on short-term assets and short-term
liabilities strategies. There are three main strategic options for working capital
management: aggressive, conservative and moderate.
• Cash cycle is the length of time (in days) from buying raw materials to
receiving cash from debtors less creditors’ payment period. A goal of working
capital management is to limit the length of the cash cycle taking into account
the risks it may involve.
• Trade credit is, in effect, an interest-free loan. There are opportunity costs of
taking advantage of the credit, which might include higher price for credit
purchase, restrictions imposed by sellers, some administrative costs. A rule of
thumb for working capital management is to match trade credit and trade
debtors’ policies.
• Letter of credit, credit insurance, and factoring are the instruments used when
the sales deal involves delay of payment terms. Letter of credit is the most
complicated and the most expensive instrument but also provides the highest
level of security for the seller.
• Cash in advance, escrow and documentary collections are payment methods
used in trade (particularly, international trade); these instruments provide
different levels of security to the deal parties, however, do not serve as sources
of finance.
• Overdraft is a short-term source of finance, available for companies with
cyclical activities or in case of unforeseen circumstances. It is an easy-to-use
facility, however, rather costly.
138
• An efficient cash management is not only about raising the needed cash but also
about making use of cash surpluses. The companies have two main instruments
to generate returns on cash surpluses: deposits and marketable assets.
Key terms
• Documentary collections
• Escrow
• Factoring
• Letter of credit
• Operating cycle
• Overdraft
• Trade credit
• Trade credit insurance
• Working capital
Further readings
1. Damodaran, A. (2005). Applied Corporate finance: A user's manual. New York:
Wiley.
2. McLaney, E. (2006). Business Finance: Theory and Practice, 7th ed. Harlow:
Pearson education.
3. Vernimmen, P. (2005). Corporate finance: theory and practice. Chichester
(UK): Wiley.
Review questions and problems
1. Why is working capital a particularly important area for financial managers?
2. What are the advantages and disadvantages of using a bank overdraft as a means
of financing?
3. The sales of a company Goodies Ltd are at the level of 5 M€ per year.
Customers on average pay in 64 days. The company does not have a significant
level of bad debt expenses because it spends 50 000 € a year on debt collection
procedures. Manager of Goodies Ltd is considering a proposal to introduce a
cash discount of 2% of the amount due if clients pay within 30 days of sale. The
company’s analysts estimate that 60% of customers would pay on the 30th day
and benefit from discount. The remaining customers would take on average 75
days to pay. The costs of debt collection procedures would fall by 20 000 € a
year. The costs of funds to finance the debtors are 12%.
139
What will happen to the needs of working capital investment in the
proposal is implemented? In terms of effect on profit of the company, would the
policy be introduced?
4. Goodies Ltd produced high-tech equipment, which is sold to specialised
companies, having own physics research labs worldwide. A new potential client
Meatronix from Middle East approached the company with a demand for three
sets of equipment delivered over 3 years. The value of the whole deal would be
4.5 M€. Goodies Ltd is able to fulfil the order but it will need additional
working capital. Which is the instrument would you recommend to use for
Goodies Ltd in the deal with the Meatronix – trade credit insurance, letter of
credit, factoring, documentary collections, or escrow would you recommend for
Goodies Ltd? Please, justify.
5. It was stated that credit insurance is a better solution than a letter of credit when
the competition is high. Explain why?
6. What is the right option for investment of short-term cash surplus:
a) escrow;
b) cash in advance;
c) marketable securities;
d) credit insurance.
140
GLOSSARY
Accounting profit The difference between revenues and the explicit costs related to revenue generation that are accounted (e.g., the component costs of delivered goods and/or services, any operating or other expenses). Accounting profit does not take into account implicit or opportunity costs as opposed to Economic profit.
Budget A detailed financial program of how the company is going to execute its Plan.
Business angel A wealthy, entrepreneurial individuals who provide capital in return for a proportion of the company equity.
Business mentor A non-investing individual who devotes his time and efforts, provides advisory and guiding help to develop a specific pre-agreed business domain in a company (e.g., finance, marketing, planning and so on).
Business plan A document that details a business’ goals and shows how it is going to achieve them Typically a business plan contains description of top level business strategy, research data, marketing plans, tactical plans and financial forecasts.
Business system Model, which outlines the activities necessary to prepare and deliver a final product to a customer and the relations between these activities.
Capital harvesting behaviour Seeking to maximise the return by using the instrument of capital investment. An example of capital harvesting behaviour is restraining new investments and letting the assets to depreciate in order to achieve a higher return on capital invested.
Corporate bond A debt security issued by company and sold to investors (in UK also called loan stock).
Covenants (on loans) Restrictions imposed by lenders, as part of the lending contract, on the freedom of action of borrowers: for example, imposing obligation to maintain a certain liquidity ratio.
Due diligence The process of assessing the technical and financial feasibility of the deal in detail.
Economic profit The difference between the revenue received from the sale of an output and the opportunity cost of the inputs used.
Economic value added See Economic profit
Elevator pitch A concise, persuasive description of a company or an idea for a product, service, or project. An elevator pitch is often used by entrepreneurs pitching an idea to venture capitalists or angel investors to receive funding.
Elevator speech See Elevator pitch
Expectations-based management Management practice that uses differences between expected and actual values as metrics for performance.
Factor Financial institution (such as bank or factoring company), which provides factoring service, i.e., buys a company’s invoices at a discount.
Factoring A set of services, which includes financing, administration of invoices, bookkeeping of receivables (sales ledger) and risk of bad debt management by assignment of receivables to factoring company (factor).
141
Financial asset An asset that derives value because of a contractual claim. Stocks, bonds, bank deposits, and the like are all examples of financial assets. Financial assets are non-physical.
Forecast Reflection of the best estimate of how the future will develop.
Informal venture capital another way to call Business angels
Initial public offering A company’s first offer of shares to the public, following its first listing on a stock market.
Internal rate of return is the rate of return that an investment project yields on the basis of the amount of the original investment remaining outstanding during any period, compounding interest annually. IRR is the discount rate that gives the project a zero NPV.
Leasing An arrangement where a financial institution buys an asset needed by a potential user and then gives that asset to the user for regular payments.
Letter of credit An agreement, issued by banks, guaranteeing the payment of a customer’s draft up to a stated amount for a specified period.
Maturity-hedging approach A company’s finance structure management in such a way that the permanent assets are financed from permanent sources and variable assets are financed from short-term sources.
Mezzanine finance Hybrid forms of financing that combine elements of debt and equity financing. The main instruments of mezzanine finance are subordinated loans, convertible loans, profit participation rights, “silent” participations, and so on.
Need for external funds Change in assets, which is not covered by change in retained earnings and liabilities.
Operating cycle Working capital metrics, which measures time period from inventory purchase until the receipt of cash.
Opportunity costs The value an alternative that must be forgone in order to pursue a certain action.
Overdraft Financing facility provided by banks when companies can make payments from their current account exceeding the available cash balance.
Plan A set of high-level objectives and targets, formulated in order to set a strategic direction.
Portfolio A set of assets, real or financial, held by an investor.
Pre-emption rights Rights of shareholders to be offered any new issue of shares before the shares are offered to non-shareholders.
Project A set of temporary interrelated activities, which has a goal, a defined start and ending date, and defined financial and other resources.
Projection See Forecast
Real asset Physical or identifiable assets such as gold, land, equipment, patents, etc. They are the opposite of a financial asset.
142
Rights issue Issuing rights to a company's existing shareholders to buy a proportional number of additional securities at a given price (usually at a discount) within a fixed period.
Rights offering See Rights issue
Risk The chance that actual result will be different than expected.
Sandbagging Setting expectations low– low enough that it becomes easy to surpass easy benchmarks.
Seasoned equity offering A public issue of shares by a company that has already made at least one previous offering of shares to the public.
Sensitivity analysis A technique used to determine how different values of an independent variable will impact a particular dependent variable under a given set of assumptions. Sensitivity analysis is a way to predict the outcome of a decision if a situation turns out to be different compared to the key prediction(s).
Separation theorem Proposition that states that investment decisions and financing decisions should be made independently on one another. The theorem was identified by Fisher and formally set out by Hirshleifer (1958).
Servicing (of finance) The cost of providing returns to suppliers of finance (e.g., interest and dividends)
Sunk costs The costs, which, at the decision moment, refer to the past
Sustainable growth rate Growth of a company, which can be sustained without additional external funding.
Trade credit insurance A risk management product offered by private insurance companies and government export credit agencies to companies wishing to indemnify their accounts receivable against losses from non-payment of a trade credit.
Variance analysis Analysis, which indicates where the actuals results differ from plans, budgets or forecasts and what the reasons of the differences are.
Venture capital Equity finance provided to support new, expanding private (non-quoted) companies.
Working capital A metrics of both, a company’s efficiency and its short-term financial health. Calculated as short-term assets, net of short-term liabilities.
143
ABBREVIATIONS AND SYMBOLS USED
A Assets
ANPV Annualised Net Present Value
CEO Chief Executive Officer
CF Cash Flow
CFO Chief Financial Officer
CoGS Costs of Goods Sold
d Dividend payout ratio (% of net profit paid out as dividends)
D debt
DCF Discounted Cash Flows
DPBP Discounted Payback Period
EBIT Earning Before Interest and Taxes
EBITDA Earning Before Interest, Taxes, Depreciations and Amortisations
EBT Earning Before Taxes
ECV Expected Commercial Value
EP Economic Profit
EVA Economic Value Added
I Investment, Invested Capital
IPO Initial Public Offering
IRR Internal Rate of Return
kD Cost of Debt
kE Cost of equity
L Liabilities
L/C Letter of credit
LF Leasing fee
LTL Lithuanian Litas (currency unit)
NOPAT Net Operating Profit after Taxes
NPV Net Present Value
PBP Payback Period
P&L Profit and Loss
PV Present Value
R&D Research and Development
ROBE Return on Beginning Equity
ROCE Return on Capital Employed
ROE Return on Equity
ROIC Return on Invested Capital
S Sales
τ Tax rate
VC Venture capital
WACC Weighted Average Cost of Capital
144
ANNEXES
Annex 1. Flow-chart for seeking finance at different product development stage