Business for Development in Latin America Javier Santiso Deputy Director and Chief Economist OECD Development Centre Organisation for Economic Cooperation and Development Exporta 2007 Sevilla ICEX June 13-14 2007
Transcript
Business for Developmentin Latin America
Javier Santiso
Deputy Director and Chief Economist
OECD Development Centre
Organisation for Economic Cooperation and Development
Exporta 2007 Sevilla ICEX June 13-14 2007
2
11 Spain and Latin America: A Helping HandSpain and Latin America: A Helping Hand
Emerging Multinationals: New Developers?Emerging Multinationals: New Developers?22
Source: OECD Development Centre, 2007; based on Annual Reports.
Percentage of sales to Latin America
0%10%20%30%40%50%60%
RepsolYPF
GasNatural
Iberdrola Endesa Santander Telefónica BBVA
20042005
30%
5
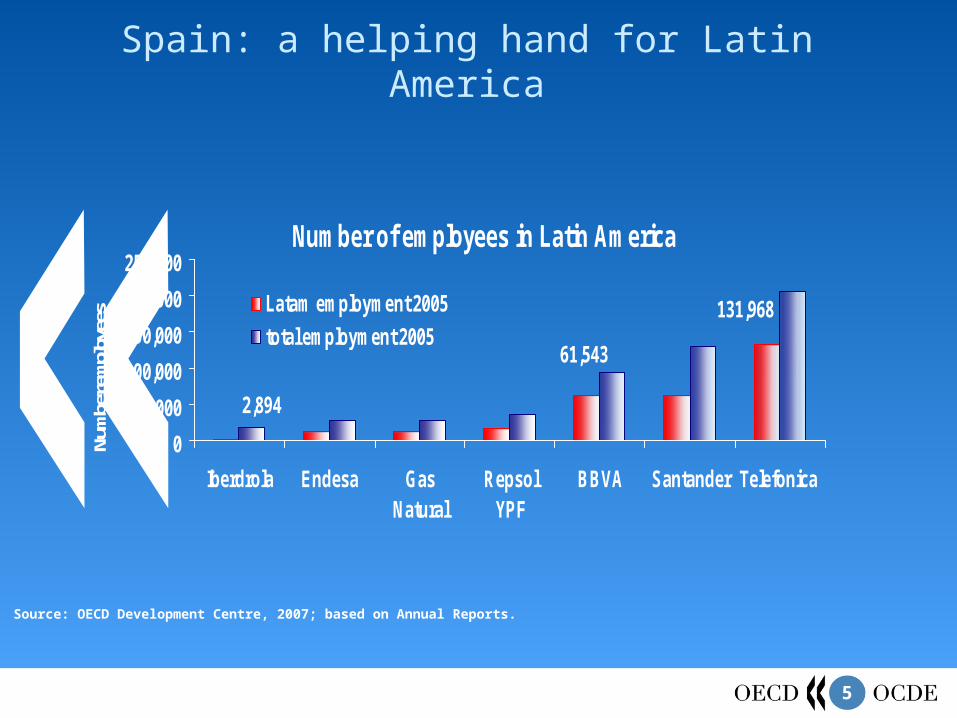
Spain: a helping hand for Latin America
Number of employees in Latin America
131,968
61,543
2,894
0
50,000
100,000
150,000
200,000
250,000
Iberdrola Endesa GasNatural
RepsolYPF
BBVA Santander Telefonica
Num
ber e
mpl
oyee
s Latam employment 2005
total employment 2005
Source: OECD Development Centre, 2007; based on Annual Reports.
6
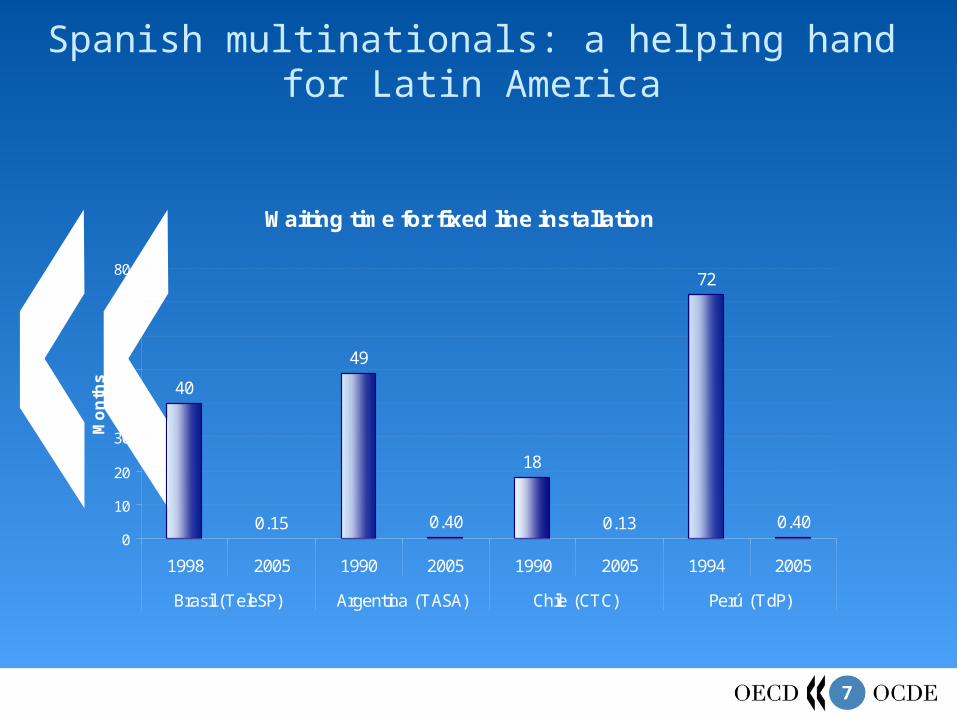
Spanish multinationals: a helping hand for Latin America
Fiscal contribution of Telefónica per country in 2005
0
500
1000
1500
2000
2500
3000
3500
México Colombia Chile Venezuela Perú Argentina España Brasil
Euro
s Milli
ons
Source: OECD Development Centre, 2007; based on Telefónica Annual Report.
To
tal fis
ca
l co
ntrib
utio
n E
uro
72
66
Fiscal contribution of Telefonica as % of GDP in 2005
0.00%
0.10%
0.20%
0.30%
0.40%
0.50%
0.60%
0.70%
México Colombia Chile Venezuela Perú Argentina España Brasil
7
Spanish multinationals: a helping hand for Latin America
Waiting time for fixed line installation
40
0.15
49
0.40
18
0.13
72
0.400
10
20
30
40
50
60
70
80
1998 2005 1990 2005 1990 2005 1994 2005
Brasil (TeleSP) Argentina (TASA) Chile (CTC) Perú (TdP)
Mo
nth
s
8
Spanish FDI flows to Latin America
0
5000
10000
15000
20000
25000
30000
35000
1993
1994
1995
1996
1997
1998
1999
2000
2001
2002
2003
2004
2005
Th
ou
san
ds
Eu
ros
Total FDI stock to Latin America Vs. cumulative Spanish flows
0
100,000
200,000
300,000
400,000
500,000
600,000
700,000
800,000
900,000
1,000,000
1993
1994
1995
1996
1997
1998
1999
2000
2001
2002
2003
2004
2005
Mil
lio
ns
US
Do
llar
s
Source: UNCTAD, World Investment Report 2006
Spain has become one of the leading direct foreign investors in Latin America
Source: Ministerio de Industria Turismo y Comercio de España, 2006
9
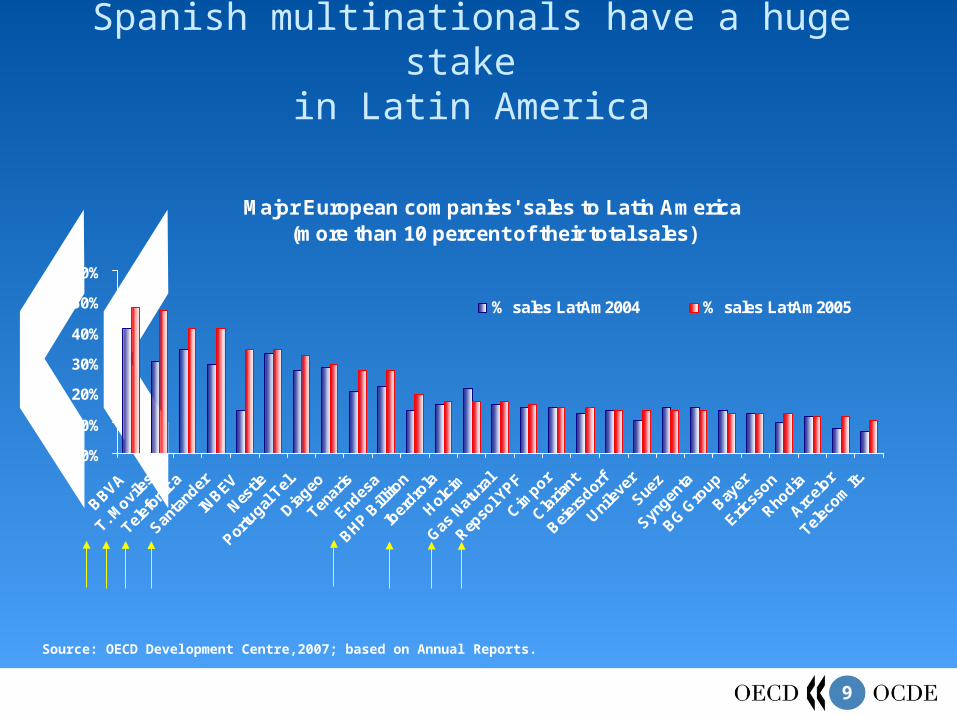
Spanish multinationals have a huge stake in Latin America
Major European companies' sales to Latin America(more than 10 percent of their total sales)
0%
10%
20%
30%
40%
50%
60%
BBVA
T. Movi
les
Telef
onica
Santa
nder
INBEV
Nestle
Portu
gal T
el.
Diageo
Tenar
is
Endes
a
BHP Bill
iton
Iber
drola
Holci
m
Gas N
atura
l
Repso
l YPF
Cimpor
Claria
nt
Beier
sdor
f
Unile
ver
Suez
Syngen
ta
BG Gro
up
Bayer
Ericss
on
Rhodia
Arcel
or
Telec
om It
.
% sales LatAm2004 % sales LatAm2005
Source: OECD Development Centre,2007; based on Annual Reports.
10
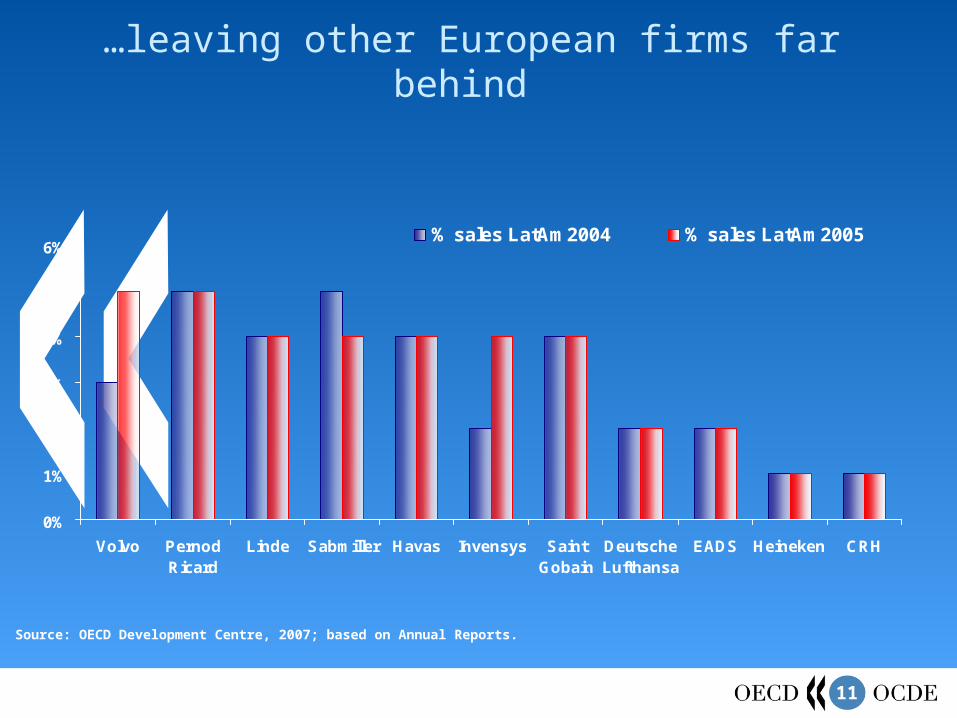
…leaving other European firms far behind
European companies' sales to Latin America (5-10 percent of total)
0%
2%
4%
6%
8%
10%
12%
% sales LatAm2004 % sales LatAm2005
Source: OECD Development Centre, 2007; based on Annual Reports.
11
…leaving other European firms far behind
0%
1%
2%
3%
4%
5%
6%
Volvo PernodRicard
Linde Sabmiller Havas Invensys SaintGobain
DeutscheLufthansa
EADS Heineken CRH
% sales LatAm2004 % sales LatAm2005
Source: OECD Development Centre, 2007; based on Annual Reports.
12
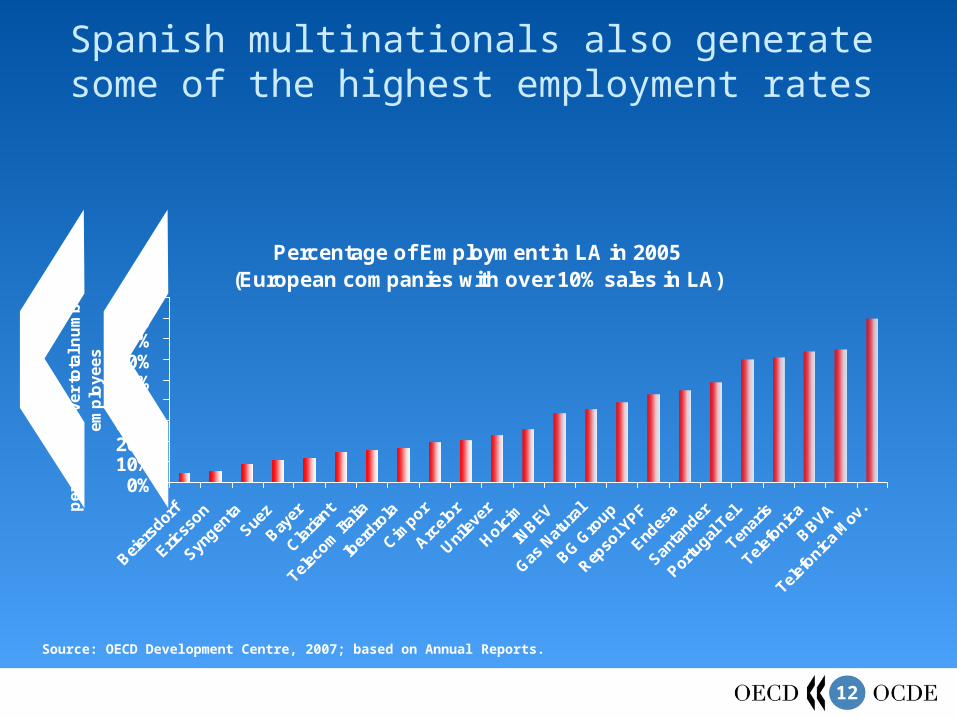
Spanish multinationals also generate some of the highest employment rates
Percentage of Employment in LA in 2005(European companies with over 10% sales in LA)
0%10%20%30%40%50%60%70%80%90%
Beier
sdor
f
Ericss
on
Syngen
taSue
z
Bayer
Claria
nt
Telec
om It
alia
Iber
drola
Cimpor
Arcel
or
Unile
ver
Holci
m
INBEV
Gas N
atura
l
BG Gro
up
Repso
l YPF
Endes
a
Santa
nder
Portu
gal T
el.
Tenar
is
Telef
onica
BBVA
Telef
onica
Mov
.pe
rce
nta
ge
ov
er
tota
l nu
mb
er
of
em
plo
ye
es
Source: OECD Development Centre, 2007; based on Annual Reports.
13
11 Spain and Latin America: A Helping HandSpain and Latin America: A Helping Hand
Emerging Multinationals: New Developers?Emerging Multinationals: New Developers?22
33 ConclusionsConclusions
14
Increasing capital flows south-south connection:
Source: UN Comtrade datababase, World Bank staff estimates, Global Development Finance, 2006.
Source: Global Development Finance, 2006.
SOUTH - SOUTH CAPITAL FLOWS BY TYPE, 2005
0
10
20
30
40
50
60
70
80
90
100
Export revenues Remittances Syndicated Loans FDI
% o
f Tot
al fl
ows
to L
DC .
South-South
North-South
SOUTH - SOUTH FDI AS A SHARE OF GLOBAL FDI 1999-2003
0
20
40
60
80
100
120
140
160
180
1995 1999 2000 2001 2002 2003
US B
illions
.
Total inflows
South-south FDI
15
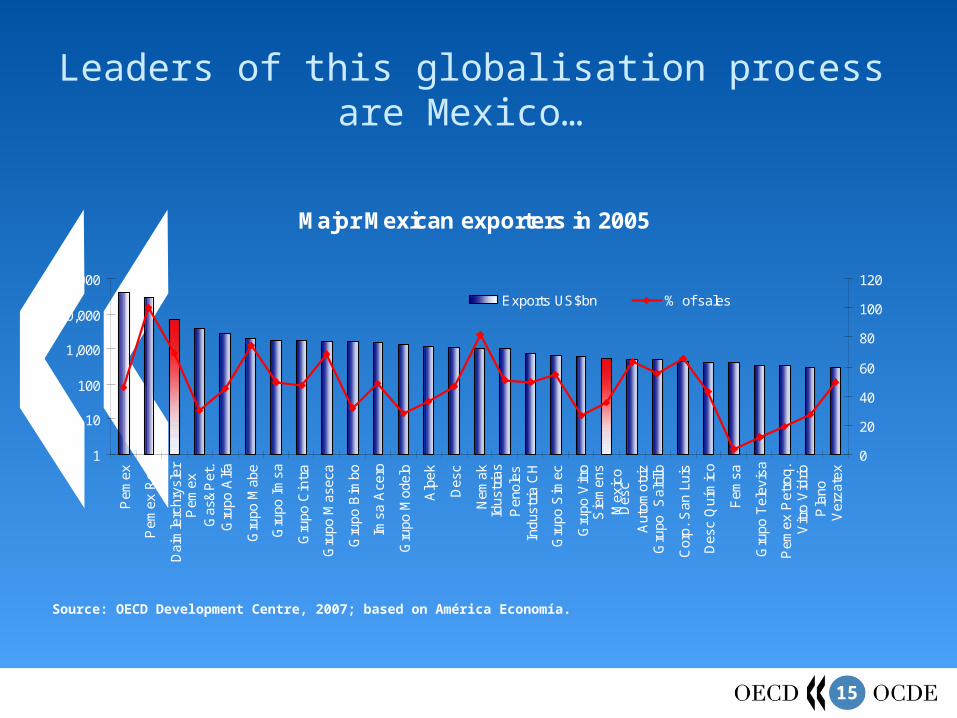
Leaders of this globalisation process are Mexico…
Source: OECD Development Centre, 2007; based on América Economía.
Major Mexican exporters in 2005
1
10
100
1,000
10,000
100,000
Pem
ex
Pem
ex R
ef.
Dai
mle
rchr
ysle
rP
emex
Gas
&P
et.
Gru
po A
lfa
Gru
po M
abe
Gru
po I
msa
Gru
po C
intr
a
Gru
po M
asec
a
Gru
po B
imbo
Imsa
Ace
ro
Gru
po M
odel
o
Alp
ek
Des
c
Nem
akId
ustr
ias
Pen
oles
Indu
stria
CH
Gru
po S
imec
Gru
po V
itro
Sie
men
sM
exic
oD
esc
Aut
omot
rizG
rupo
S
altil
lo
Cor
p. S
an L
uis
Des
c Q
uím
ico
Fem
sa
Gru
po T
elev
isa
Pem
ex P
etro
q.V
itro
Vid
rioP
lano
Ver
zate
x
0
20
40
60
80
100
120
Exports US$bn % of sales
16
…and Brazil
Top Brazilian exporters in 2005
0
1,000
2,000
3,000
4,000
5,000
6,000
7,000
8,000
Pet
robr
asV
ale
de R
ioO
derb
rech
tE
mbr
aer
Car
gill
Bun
geV
olks
wag
enG
rupo
Gen
eral
Mot
ors
Sad
iaG
erda
uD
aim
lerc
hrys
ler
CS
TA
DM
MB
RS
amar
coC
ater
pilla
rP
edirg
aoB
rask
emA
racr
uzC
SN
Alb
rás
Vol
voR
ober
t B
osch
Cop
ersu
car
Fia
t A
uto.
Sea
ra A
lim.
Pet
robr
asS
hell
Sie
men
s B
rasi
lS
uzan
oA
cesi
taA
luno
rte
Car
aiba
Met
ais
CB
AP
irelli
Pne
usC
oam
oR
enau
ltE
mbr
aco
Cop
esul
WE
GS
ouza
Cru
z
0
10
20
30
40
50
60
70
80
90
100Exports % of sales
Source: OECD Development Centre, 2007; based on América Economía.
17
Increasing appetite for overseas expansion can also be seen in other countries such as
India…
Source: OECD Development Centre. Based on Dealogic and local press.
RECENT INDIAN INVESTMENTS 2006(EXCLUDING CORUS-TATA DEAL)
9%
22%
43%
26%
USEurope
Latin AmericaAfrica
RECENT INDIAN INVESTMENTS
4%
61%
22%
13%
US
Europe
Latin America
Africa
Target Nationality Acquirer Deal Value ($m)
Corus UK/NL Tata Group 7700Oil & Gas Assets (Campos Basin) Brazil Oil & Natural Gas Corp 1670Omnimex de Colombia Colombia Oil & Natural Gas Corp: China Group 850Oil & Gas Assets (Brazil) Brazil ONGC Videsh 820Greater Nile Petroleum (25%) Sudan Oil & Natural Gas Corp 783Glaceau (30%) US Tata tea 677
Shell Development Angola Angola Oil & Natural Gas Corp 600Oil & Gas Assets (Syria) Syria Oil & Natural Gas Corp: China Group 581
Betapharm Arzneimittel Germany Dr Reddy's Lab 572Hansen Transmissions Belgium Suzlon Energy 562Eve Holding Belgium Suzlon Energy 548Terapia Rumania Ranbaxy 324Total 15687
18
11 Spain and Latin America: A Helping HandSpain and Latin America: A Helping Hand
Emerging Multinationals: New Developers?Emerging Multinationals: New Developers?22
33 ConclusionsConclusions
19
Globalisation strategies have turned into success stories in Spain, Latin America and other emerging markets.
Spanish expansion abroad is moving towards new markets, beyond Latin America: OECD countries and Asia.
The region remains however a strategic bet for both old and newcomers. Above all the internationalization of Spanish economy could capitalize on this 10 years of increasing linkages:
Spain as a business hub for European corporations operating in Latin America.
Spain as a business hub for Latin American corporations operating in Europe.
Conclusions: Spain as a Latin American Business Hub?