21
Business Intelligence Lessons Learned October 21, 2005
| Date post: | 22-Dec-2015 |
| Category: |
Documents |
| Upload: | roland-walker |
| View: | 220 times |
| Download: | 4 times |

Business Intelligence
Lessons Learned
October 21, 2005

© 2005 BearingPoint, Inc. 2
Presenters
This document is protected under the copyright laws of the United States and other countries as an unpublished work. This document contains information that is proprietary and confidential to BearingPoint, Inc. or its technical alliance partners, which shall not be disclosed outside or duplicated, used, or disclosed in whole or in part for any purpose other than to evaluate BearingPoint, Inc. Any use or disclosure in whole or in part of this information without the express written permission of BearingPoint, Inc. is prohibited.© 2005 BearingPoint, Inc. (Unpublished). All rights reserved.
7301 North, Highway 161Irving, TX 75039
www.bearingpoint.com
Richard LarrabeeGlobal Account Manager
Tel: +1. 972.373.7308E-mail: [email protected] Perimeter Center Place
Suite 380Atlanta, GA 30346
Anu JainSenior Manager
Business Intelligence
Mobile: [email protected]
7301 North, Highway 161Irving, TX 75039
www.bearingpoint.com
Richard LarrabeeGlobal Account Manager
Tel: +1. 972.373.7308E-mail: [email protected]
7676 Hazard Center DriveSan Diego, CA 92108
John VoloudakisRegional Practice Leader
Higher Education Consulting Services
T: 1.617.308.7161 [email protected]

About BearingPoint

© 2005 BearingPoint, Inc. 4
About BearingPointCentury of Unbiased and Objective Advice
Industry Tailored Solutions17,000 Resources, 39 countries, Average of 14 yrs
Experience
Business StrategyBoard Room
What Should You Do ?
How Should You Do It?
Operational StrategyBusiness ProcessROI Framework Implementation
Technology People
Get it Done!
Managed ServicesTechnology
People
Maintain and Improve!
Peat Marwick -KPMG, LLP - KPMG Consulting/Andersen - BearingPoint Proven Get-it-Done Culture – Start Small, Think Big, Deliver Value
Scope of Services
Collaborate with technology partners to apply new and emerging technology to deliver enterprise value
Leverage technology solutions to drive new business processes, products, and services
Deliver flexible, proven solutions from our extensive experience in the industries we serve
Our Approach to Collaborating for Client Success

© 2005 BearingPoint, Inc. 5
BearingPoint is the leading provider of consulting services to higher education
Strong Resource Compliment
180+ dedicated higher education professionals, many who have held management positions at major universities
Extensive experience helping large universities succeed in complex technology projects
Ability to provide complete end-to-end solutions by leveraging our firm’s industry and solution resources
Nearly 100% of project managers PMP Certified
Industry Specific Solutions
Industry-leading data warehousing/ business intelligence capabilities
Leadership in research administration
ERP, Student for Life and cost take-out solutions
Campus Wireless solutions
Higher Education Benchmarking Database (www.higheredbenchmarking.com)
Work with industry leaders including EDUCAUSE and NACUBO to bring new innovation to the industry
Multi-site, Multi-specialty Experience with Complex Institutions
Extensive experience with complex higher ed institutions and systems across numerous sites and geographies
Large-scale and client-tailored project experience
Experience with research institutions; multi-campus state university systems; liberal arts colleges, and community colleges
Over 300 projects completed for more than 150 colleges and universities in the 30 year history of our practice
Have worked with or are currently engaged at over 80% of US R1 institutions

© 2005 BearingPoint, Inc. 6
The following is a representative list of BearingPoint’s higher education clients
University of Alabama-Birmingham Boston College Brigham Young University California State University California Institute of Technology Carnegie Mellon University The Catholic University of America The University of Chicago The City University of New York Clemson University Columbia University University of Connecticut Cornell University Creighton University Dartmouth College The University of Denver Duke University Emory University Florida A&M University Florida State University Fordham University The University of Florida The George Washington University Georgetown University Harvard University Howard University Johns Hopkins University University of Kentucky University of Massachusetts—Lowell
University of Missouri System Muhlenberg College The University of New Hampshire New York University Oakland University Pace University Pepperdine University University of Redlands Research Foundation of the State University of New York The University of Rhode Island Rice University The Rockefeller University Rutgers University St. John’s University Salem State College Santa Clara University Stanford University Syracuse University University of Texas Tufts University Vanderbilt University University of Hawaii- The University of Vermont The University of Virginia West Virginia University Westchester Community College (SUNY) Yale University Yeshiva University
© 2005 BearingPoint, Inc. 7
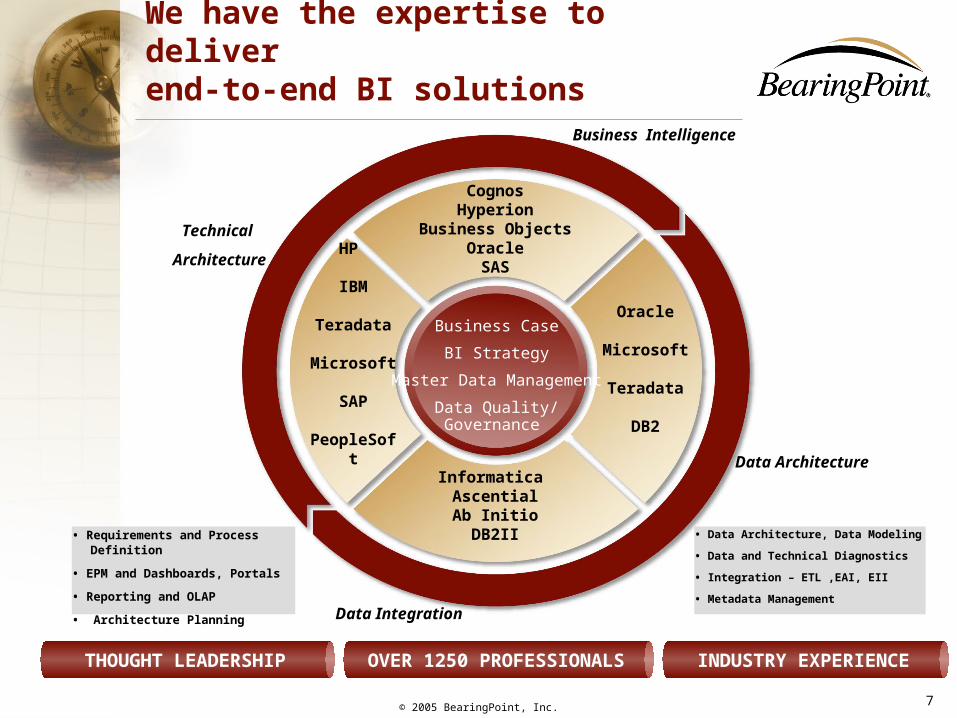
Oracle
Microsoft
Teradata
DB2
CognosHyperion
Business ObjectsOracleSAS
HP
IBM
Teradata
Microsoft
SAP
PeopleSoft
Informatica AscentialAb Initio
DB2II
Business Case
BI Strategy
Master Data Management
Data Quality/Governance
We have the expertise to deliver end-to-end BI solutions
THOUGHT LEADERSHIP INDUSTRY EXPERIENCE
• Data Architecture, Data Modeling
• Data and Technical Diagnostics
• Integration – ETL ,EAI, EII
• Metadata Management
OVER 1250 PROFESSIONALS
• Requirements and Process Definition
• EPM and Dashboards, Portals
• Reporting and OLAP
• Architecture Planning
Business Intelligence
Data Integration
Technical
Architecture
Data Architecture

© 2005 BearingPoint, Inc. 8
Allstate
American Express
AmeriSource Corporation
Apple Computer
Applied Material
Bank of America
Barclays Bank PLC
Bellsouth
BISYS Banking Services
Burger King
Campbell Soup
Cargill, Inc.
Catholic Health East
Cardinal Distribution
City of San Francisco
Coleman Manufacturing
Columbia HCA
Compaq Conoco Convenience StoresDole Foods CompanyDun & BradstreetExelonExpediaExxonMobilFirst Data CorporationFleet BankGE PlasticsHallmark Cards Intl.Hershey’sHartford Life InsuranceHewlett-PackardLeaf IndustriesLeap Wireless
KLA Instrumentation
MBNA
Business Intelligence and Data Warehousing Experience
We have helped numerous companies in many industries, design and implement data warehouses. We believe the caliber of our clientele reflects the quality of our service.
Metlife
Mellon Bank
Microsoft
Mobil Convenience Foods
Morris Communications
Motorola
Mutual Life
Nestle Foods
NationsBank
National Institute of Health
Pacific Bell
Philips Lighting
Pitney Bowes Credit Corp
Promina Health System
Ryder
Sara Lee
SideStep.com
Six Continents
Smithsonian Food Service
Springs Industries
Southern Company
T-Mobile
Total Systems
University of Alabama at Birmingham
U.S. Air Force
Western Digital
York Industries
Business Intelligence Challenges and Trends

© 2005 BearingPoint, Inc. 10
What Have Organizations Done?
Multiple versions of truth (e.g. Customer, Bookings) Single version of truth
Limited time for data analysis, time wasted on data gathering More analysis; Less data gathering/reconciliation
Project-driven approach resulting in disparate data definitions Common data definitions leveraged across applications
Uncontrolled data redundancy or data mart anarchySummarized data marts linked to a data warehouse support departmental reporting
Unclear data ownership rules Well defined data ownership/stewardship rules
Inconsistent and incomplete information (poor quality) Well defined data with robust data quality processes
Inflexible custom code and “work-arounds” from early implementations
Cost effective, scalable technology upgraded to take advantage of newer functionality (lower TCO)
No widely adopted standard reporting tools,
Heavy “end-user” IT report support
Robust end-user toolbox and common portal,
End-user self-service and process support
Re-writing history for realignments / errors Detailed data repository acts as a data “clearing house”
Development focus on providing detail dataDelivery of analytical applications versus reports (OLAP, dashboards etc)
High IT maintenance and development costs Well defined roadmap for adaptive IT architectures
Challenges Best Practices
Gap C
orrections
Most enterprises, large and small, have undertaken multiple Business Intelligence initiatives. These numerous ad-hoc initiatives often introduce additional challenges to effective information management.
Right Information at the right time to the right people to make the right decisions
© 2005 BearingPoint, Inc. 11
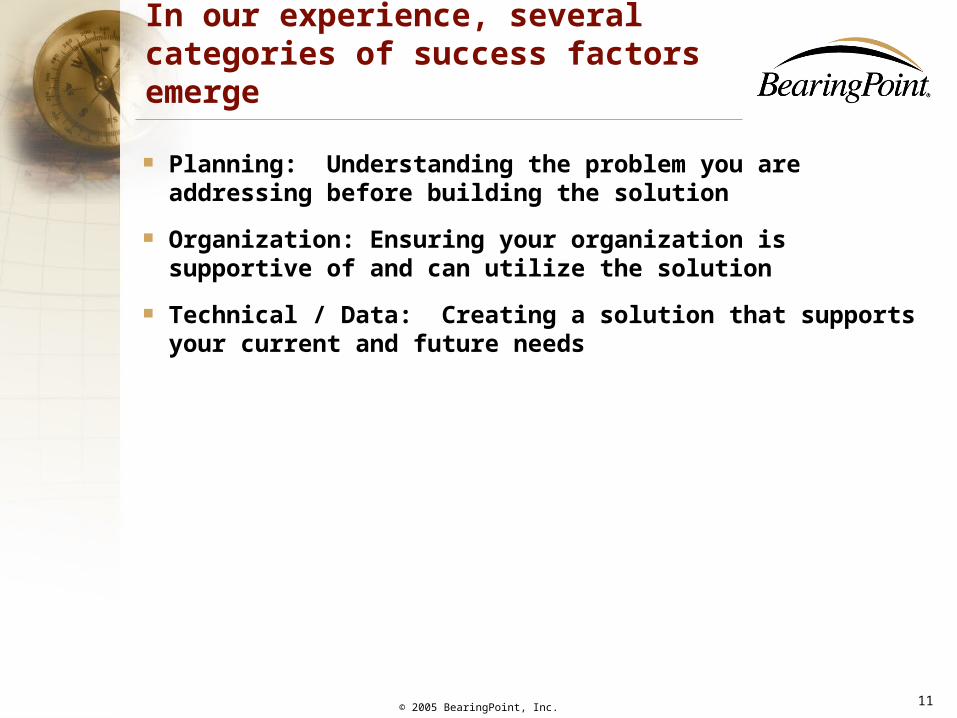
In our experience, several categories of success factors emerge
Planning: Understanding the problem you are addressing before building the solution
Organization: Ensuring your organization is supportive of and can utilize the solution
Technical / Data: Creating a solution that supports your current and future needs

Critical Success Factors:Planning

© 2005 BearingPoint, Inc. 13
Planning success factors
Sound Methodology
CHANGE MANAGEMENTCHANGE MANAGEMENT
Technology TrackTechnology Track
User TrackUser Track
ANALYZEANALYZE
Data TrackData Track
BUILDBUILD DEPLOYDEPLOY
Business TrackBusiness Track
DevelopBusiness
Case
DevelopBusiness
Case
Testand
Deploy
Testand
Deploy
TrainTrain
STRATEGYSTRATEGY
U1
TrainTrain
U7
Build & TestBuild & Test
U6Build
PresentationLayer
BuildPresentation
Layer
U5Prototype
PresentationLayer
PrototypePresentation
Layer
U4Design
PresentationLayer
DesignPresentation
Layer
U3Analyze
Business Metrics &
Rules
AnalyzeBusiness Metrics &
Rules
U2Analyze
PresentationRequirements
U1
Build Data Sourcing
& Mapping
Build Data Sourcing
& Mapping
DesignData Mgmt.
DesignData Mgmt.
DesignData Model
DesignData Model
ConductData
Quality Assessment
ConductData
Quality Assessment
Define Metadata Require-ments &Strategy
Define Metadata Require-ments &Strategy
AnalyzeSource
Systems
AnalyzeSource
Systems
Define Implemen-
tation Strategy
Define Implemen-
tation Strategy
Analyze Organiza-
tionalImpact &
Gap
Analyze Organiza-
tionalImpact &
Gap
Conduct Risk
Assessment
Conduct Risk
Assessment
Define Business Require-ments
Define Business Require-ments
Define CSF’s / KPI’s
Define CSF’s / KPI’s
Define Business
Vision
Define Business
Vision
B1 B2 B3 B4 B5 B6 B7
D1 D2 D3 D4 D5 D6 D7
Configure & InitialLoad
Configure & InitialLoad
Build Technical
Architecture
Build Technical
Architecture
Select & Validate
Tools
Select & Validate
Tools
DesignTechnical
Architecture
DesignTechnical
Architecture
Define Technology
Require-ments
Define Technology
Require-ments
AnalyzeCurrent State
AnalyzeCurrent State
T1 T2 T3 T4 T5 T6 T7
PROJECT MANAGEMENTPROJECT MANAGEMENT
Our BI/DW Methodology
DESIGNDESIGN
Forward BuyingAnalysis
• Identification and analysis of attractive items for forward buying
MIF
Data Source Key Data Critical Process Output of Process
Users of Information
Time / Effort Requirements:
• 3 FTE’s
Other Analytical Tools Used:• Excel• Access• Lotus Notes
Current Analysis Frequency:
• Daily
Desired Analysis Frequency:• Daily
Business Impact:
• $720 million in buy margin
• $15-$20 million additional potential margin
Criticality to Business:High
• Potential $5-10m in additional margin from improved analysis prior to purchasing
• Potential $10m in margin from increased access to vendor cancellations
• Old price
• Actual build duration
• Actual holding duration
• Actual sell duration
• Purchase dates
• Planned price increase
• Lost sales
• Seasonality
• Sales history
• Increase/decrease in customer base
• Planned demand
• Planned depletion rate / anticipation overstock
• Item/order cancellations from vendors
Manufacturer policies
• Ability to forward buy
• Quantity restrictions
Industry trends
• Price leaders / followers
• Patent expiration dates
Distrack
Purchasing
SCORE
Lotus Notes DB
Access Database
Chris Daly
Sid Geller
Focus on HighImpact Processes
• Proven approach to executing the project
• Accelerates project and reduces risk
• Should address not only technology, but strategy, business requirements, user needs, and data as well
• Can incorporate an iterative or modular approach
• Methodology should be an enabler, not the focus
• Don’t try to be all things to all people (at first anyway)
• Focus either on areas strategic to the institution, or on areas that have a clear need
• Need to get to the level of defining KPIs, and what drives KPIs

© 2005 BearingPoint, Inc. 14
Planning success factorsDeliver the Right Information to the
Right People at the Right Time
We take a long-term, strategic view of Business Intelligence, systems integration and data management, but attack the problem with targeted, well
coordinated initiatives focused on delivering value rapidly.
Think Big – Develop a BI roadmap that supports your long-term objectives and ties in existing, related quick hits. This Roadmap is the compass that steers your systems integration and data management initiatives as you incrementally build the vision over time.
Start Small – Define and prioritize initiatives and carve out meaningfulphases to deliver the highest value in the shortest amount of time. This builds ongoing support and momentum in the organization. A proof-of-concept can be effectively structured around one of the earlier phases to gain confidence and internal support.
Deliver Quickly – Develop and execute the roadmap with 90–120 day projects, grouped into phases of no longer than 6 months. This methodology allows you to incrementally build toward the vision while providing interim benefits to the business along the way.
Think Big – Start Small – Deliver Quickly
Think Big – Start Small – Deliver Quickly
• Start with the end in mind
• Build in manageable components
• Quickly deliver value to your users
• Continue to expand and iterate as needed
• Understand what business problem you are trying to solve
• Use the right tools and the right presentation to meet the needs
• Static vs. ad hoc vs. dashboards
Critical Success Factors:Organization

© 2005 BearingPoint, Inc. 16
Organization success factors
Executive Sponsorship
Top Management Involvement
• Common understanding of the DW concept• Define objectives and scope for short and
term• Medium Iterative Process• Define and conquer benefits• Publicize gains• Design and Implement by Subject Area• Layout Architecture
Executive Sponsorship
Top Management Involvement
• Strategic Thinking• Business Model Alignment• Focus on Business, not just technology
Expectations Management
• Adoption by user community will be dependent upon commitment of leadership
• Strong leadership can help define and convey a new vision
• While business sponsorship is critical, IT often must lead on BI initiatives
• No, it doesn’t make the coffee
• Underpromise, overdeliver
• Show success, then build on it
• BI isn’t a cure for bad source systems, bad data, or faulty processes

© 2005 BearingPoint, Inc. 17
Organization success factors
Alignment with InstitutionalCulture Training / Roles
Culture
BI
• Your BI solution needs to support the decision making norms of the institution
• Fact based vs. Instinctual
• BI can help leadership enact a cultural shift
• Training of functional users is critical to successful adoption & use
• Training needs to focus on the data and how to use it, not on the tools themselves
• Processes & job roles should be reassessed to encompass the impact of new capabilities and metrics
• The value to the community increases over time

Critical Success Factors:Technical / Data

© 2005 BearingPoint, Inc. 19
Technical success factors
Develop ExtensibleTechnical Architectures
Define the Right Data Models
SCORE
PROMO RATESREWARD
DEPOSITS
APPLICATION
COMMERCIALLOAN
MONTHLY DATA
EMPLOYEE ROLE
ADDRESS
COLLATERAL
BANK CARDYEARLY DATA
DEALER
MORTGAGE CYCLEDATA
BANK CARDMONTHLY DATA
MARKETINGPROGRAM
CREDIT BUREAU
EVENT
EVENT TYPE
ORGANIZATIONUNIT
TELEPHONE
ACCOUNT
PRODUCT
ACCOUNT CREDITBUREAU
ACCOUNTBANKRUPTCY
VEHICLEPROPERTY
DEALER ILACCOUNT
INDIVIDUAL
INVOLVED PARTY
CUSTOMER
MORTGAGE
BANK CARD CYCLEDATA
TRIAD
LEGAL ENTITY
INSTALLMENTLOAN
IL MONTHLY
BANK CARD
COMMERCIALLOAN
ACCOUNTTRANSACTION
1
1
Address Subject AreaAccount Subject AreaProduct Subject Area
Involved Party Subject AreaOrganization Subject Area Event Subject Area
Financial Services High Level Data Model
DEPOSIT MONTHLYDATA
2
2
3
3
REAL ESTATE
RECOVERY
4
4
SECOND DIRECT INDIRECT SMALL BUSINESS
SMALL BUSINESS CREDIT CARD CHARTER EQUITY DEBIT CARD
IL COLLECTION
MONTHLYACCOUNT COSTS
COST TYPE
5
6
6
5
SCORE
PROMO RATESREWARD
DEPOSITS
APPLICATION
COMMERCIALLOAN
MONTHLY DATA
SCORE
PROMO RATESREWARD
DEPOSITS
APPLICATION
COMMERCIALLOAN
MONTHLY DATA
EMPLOYEE ROLE
ADDRESS
COLLATERAL
BANK CARDYEARLY DATA
DEALER
MORTGAGE CYCLEDATA
BANK CARDMONTHLY DATA
EMPLOYEE ROLE
ADDRESS
COLLATERAL
BANK CARDYEARLY DATA
DEALER
MORTGAGE CYCLEDATA
BANK CARDMONTHLY DATA
MARKETINGPROGRAM
CREDIT BUREAU
EVENT
EVENT TYPE
ORGANIZATIONUNIT
TELEPHONE
ACCOUNT
MARKETINGPROGRAM
CREDIT BUREAU
EVENT
EVENT TYPE
ORGANIZATIONUNIT
TELEPHONE
ACCOUNT
PRODUCT
ACCOUNT CREDITBUREAU
ACCOUNTBANKRUPTCY
VEHICLEPROPERTY
DEALER ILACCOUNT
INDIVIDUAL
INVOLVED PARTY
CUSTOMER
PRODUCT
ACCOUNT CREDITBUREAU
ACCOUNTBANKRUPTCY
VEHICLEPROPERTY
DEALER ILACCOUNT
INDIVIDUAL
INVOLVED PARTY
CUSTOMER
MORTGAGE
BANK CARD CYCLEDATA
TRIAD
LEGAL ENTITY
INSTALLMENTLOAN
IL MONTHLY
BANK CARD
MORTGAGE
BANK CARD CYCLEDATA
TRIAD
LEGAL ENTITY
INSTALLMENTLOAN
IL MONTHLY
BANK CARD
COMMERCIALLOAN
ACCOUNTTRANSACTION
1
1
Address Subject Area
COMMERCIALLOAN
ACCOUNTTRANSACTION
1
1
Address Subject AreaAccount Subject AreaProduct Subject Area
Involved Party Subject AreaOrganization Subject Area Event Subject Area
Financial Services High Level Data Model
DEPOSIT MONTHLYDATA
Account Subject AreaProduct Subject Area
Involved Party Subject AreaOrganization Subject Area Event Subject Area
Financial Services High Level Data Model
DEPOSIT MONTHLYDATA
2
2
3
3
REAL ESTATE
RECOVERY
4
4
2
2
3
3
REAL ESTATE
RECOVERY
4
4
SECOND DIRECT INDIRECT SMALL BUSINESS
SMALL BUSINESS CREDIT CARD CHARTER EQUITY
SECOND DIRECT INDIRECT SMALL BUSINESS
SMALL BUSINESS CREDIT CARD CHARTER EQUITY DEBIT CARD
IL COLLECTION
MONTHLYACCOUNT COSTS
COST TYPE
5
DEBIT CARD
IL COLLECTION
MONTHLYACCOUNT COSTS
COST TYPE
5
6
6
5
• Don’t build a solution to focus on a single source system or single problem
• One tool may not be able to solve all your issues
• A component (service) based approach enables flexibility and scalability
• Why not just use your transaction system’s data structures?
• Ability to store and analyze historical data
• Build in the right dimensions (e.g. time) to address the business problems you may encounter
• Denormalized models are easier to understand, navigate, and use
• Understand what data and how much of it needs to be stored
© 2005 BearingPoint, Inc. 20
Technical success factors
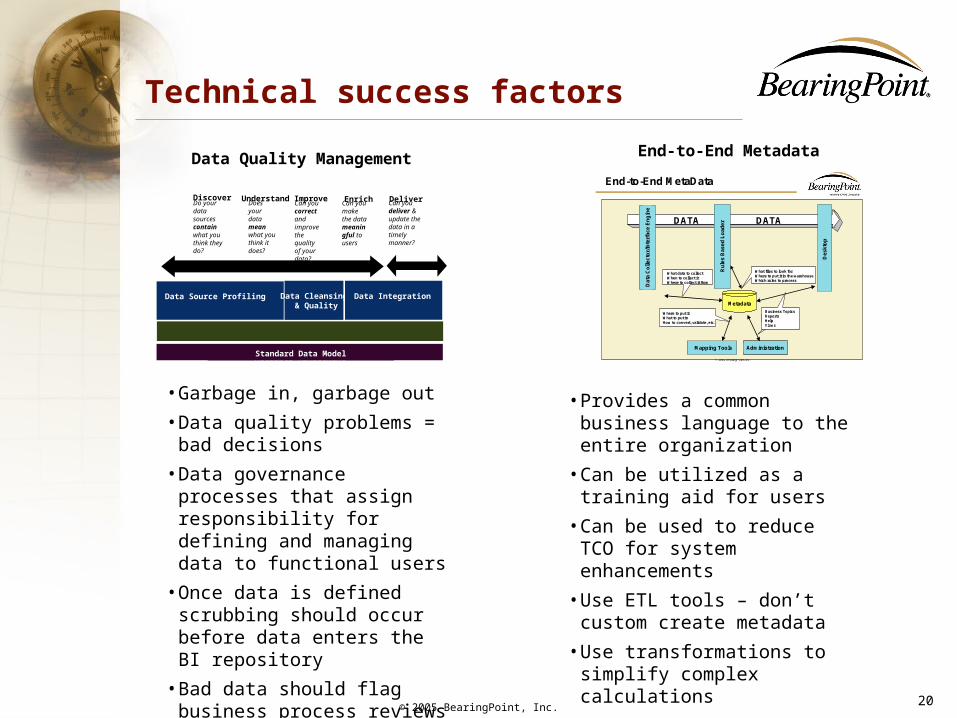
End-to-End Metadata Data Quality Management
Do your data sources contain what you think they do?
Does your data mean what you think it does?
Can you correct and improve the quality of your data?
Can you make the data meaningful to users
Can you deliver & update the data in a timely manner?
Enrich Deliver
80% of time
Metadata Management
Data Source Profiling Data Cleansing & Quality
Data Integration
Standard Data Model
Understand ImproveDiscover
© 2002 BearingPoint, Inc.
End-to-End MetaData
What data to collectWhen to collect itWhere to collect it from
What files to look forWhere to put it in the warehouseWhich rules to process
Where to put itWhat to put inHow to convert, validate, etc.
Business TopicsReportsHelpViews
Metadata
Mapping Tools Administration
Ru
les
Bas
ed L
oad
er
Dat
a C
oll
ecto
r/In
terf
ace
En
gin
e
Des
kto
p
DATA DATA
• Garbage in, garbage out
• Data quality problems = bad decisions
• Data governance processes that assign responsibility for defining and managing data to functional users
• Once data is defined scrubbing should occur before data enters the BI repository
• Bad data should flag business process reviews to correct error-producing activities
• Provides a common business language to the entire organization
• Can be utilized as a training aid for users
• Can be used to reduce TCO for system enhancements
• Use ETL tools – don’t custom create metadata
• Use transformations to simplify complex calculations