122
BUSINESS INTELLIGENCE MODELS (IPORTALDOC-STATISTICS MODULE) SHIVA KUMAR VITALAPURA OMKARAPPA dezembro de 2017

BUSINESS INTELLIGENCE MODELS(IPORTALDOC-STATISTICS MODULE)
SHIVA KUMAR VITALAPURA OMKARAPPAdezembro de 2017

BUSINESS INTELLIGENCE MODELS
(IPORTALDOC-STATISICS MODULE)
Shiva Kumar Vitalapura Omkarappa 2017 ISEP – School of Engineering, Polytechnic of Porto Mechanical Engineering Department


BUSINESS INTELLIGENCE MODELS
(IPORTALDOC-STATISICS MODULE)
Shiva Kumar Vitalapura Omkarappa 1150232 Dissertation presented to ISEP – School of Engineering, Polytechnic of Porto to fulfill the requirements necessary to obtain a Master's degree in Mechanical Engineering, carried out under the guidance of Doctor Sandra F. Ramos and co-supervised by Doctor Francisco J. G. Silva, Adjunct Professors at ISEP – School of Engineering, Polytechnic of Porto. 2017 ISEP – School of Engineering, Polytechnic of Porto Mechanical Engineering Department


STATISTICS MODULE SHIVA KUMAR
JURY
President Doctor Francisco Silva Professor Adjunto, Instituto Superior de Engenharia do Porto Supervisor Doctor Sandra F. Ramos Professor Adjunto, Instituto Superior de Engenharia do Porto Second supervisor Doctor Francisco J. G. Silva Professor Adjunto, Instituto Superior de Engenharia do Porto Examiner Doutor António Miguel Gomes Professor Auxiliar, Faculdade de Engenharia da Universidade do Porto

STATISTICS MODULE SHIVA KUMAR

STATISTICS MODULE SHIVA KUMAR
ACKNOWLEDGEMENTS
“Let us rise up and be thankful, for if we didn’t learn a lot today, at least we learned a little, and if we didn’t learn a little, at least we didn’t get sick, and if we got sick, at least we didn’t die; so, let us all be thankful”- Gautama Buddha
First, I would like to express my sincere gratitude to Prof. Sandra Ramos for the continuous support, for her patience, motivation, enthusiasm, and immense knowledge. Her guidance helped me in all the time of research and writing of this thesis. I couldn’t have imagined having a better advisor and mentor for my thesis.
Second, I would like to thank Telma Salgueiro for offering me internship opportunity in her company (IPBrick), her encouragement, insightful comments, and hard questions throughout my thesis. Thank you for extending compassion and flexibility when I needed it. As a supervisor, you are truly inspirational to your staff.
Third, my sincere thanks also goes to Prof. Francisco J.G Silva for his valuable guidance. You definitely provided me with the tools that I needed to choose the right direction and successfully complete my dissertation.
Last but not the least, I would like to thank my family for their direct/indirect support during the entire course of this project and supporting me spiritually throughout my life.

STATISTICS MODULE SHIVA KUMAR

ABSTRACT IX
STATISTICS MODULE SHIVA KUMAR
KEYWORDS
Business Intelligence tools; Database Management Systems; Key Performance Indicators; Open source
ABSTRACT
Several Business Intelligence tools are available in the market, some are paid others have free trial version and others are free for commercial use. Selecting the best tool for a particular set of data through its specifications is not a simple process unless it is installed and used for a reasonable period of time.
The objective of this thesis is to analyze and compare Business Intelligence tools available in the market in order to identify the one that best meets the needs of iPortalDoc (document management tool). It is also intended to improve the iPortalDoc Statistics module according to the capabilities of the selected Business Intelligence tool.
The objectives were achieved by comparing the characteristics of various Business Intelligence applications available in the market and selecting the two most promising applications (one free and the other with free trial version) and which are open source.
The responses of the selected application functionalities to iPortalDoc were evaluated, with a superiority of the SpagoBI tool compared to the installed one (Pentaho).
On this basis, the SpagoBI tool is recommended for its advanced and easy-to-use features.

ABSTRACT X
STATISTICS MODULE SHIVA KUMAR

RESUMO XI
STATISTICS MODULE SHIVA KUMAR
PALAVRAS CHAVE
Ferramentas de Business Intelligence; Sistemas de gestão de dados; Indicadores-chave de desempenho; Open source; Ferramentas estatísticas
RESUMO
Várias ferramentas de Business Intelligence estão disponíveis no mercado, algumas são comerciais, outras têm versão de teste gratuita e outras são gratuitas para uso comercial. A seleção da melhor ferramenta, para determinado conjunto de dados, através das suas especificações não é um processo simples, a menos que esta seja instalada e usada por um período de tempo razoável. O objetivo desta dissertação é analisar e comparar ferramentas de Business Intelligence disponíveis no mercado de maneira a identificar a que melhor responde às necessidades do iPortalDoc (ferramenta de gestão documental). Pretende-se ainda melhorar o módulo de Estatísticas do iPortalDoc de acordo com as potencialidades da ferramenta de Business Intelligence selecionada. Os objectivos traçados foram obtidos através da comparação das características de várias aplicações de Business Intelligence disponíveis no mercado e da selecção das duas aplicações mais promissoras (uma gratuita e a outra com versão teste gratuita) e que sejam open source. As respostas das funcionalidades das aplicações selecionadas ao iPortalDoc foram avaliadas, tendo-se verificado uma superioridade da ferramenta SpagoBI relativamente à outra ferramenta instalada (Pentaho). Nesta base, recomenda-se a ferramenta SpagoBI pelas suas características avançadas e fáceis de usar.

RESUMO XII
STATISTICS MODULE SHIVA KUMAR

LIST OF SYMBOLS AND ABBREVIATIONS XIII
STATISTICS MODULE SHIVA KUMAR
LIST OF SYMBOLS AND ABBREVIATIONS
List of abbreviations <Term> <Designation> BA Business Analytics BI Business Intelligence eBAM Eclipse Business Activity Monitoring ETL Graphical Extract Transform Load GIS Geographical Information System GUI Graphical User Interface HTML Hyper Text Markup Language HTTP Hyper Text Transfer Protocol JDBC Java Database Connectivity KPI Key Performance Indicator LDW Logical Data Warehouse OLAP Online Analytical Processing OGC Open Geospatial Consortium QbE Query by Example RDBMS Relational Database Management System SMB Server Message Block SQL Standardized Query Language SMTP Simple Mail Transfer Protocol TOS Talend Open Studio List of units <Term> <Designation> GB Giga Byte MB Mega Byte TB Tera Byte


GLOSSARY OF TERMS XV
STATISTICS MODULE SHIVA KUMAR
GLOSSARY OF TERMS
<Term> <Designation>
Business Intelligence
It is an umbrella term that includes the applications, infrastructure and tools, and best practices that enable access to and analysis of information to improve and optimize decisions and performance.
Dashboards A business intelligence dashboard is an information management tool that is used to track KPIs, metrics, and other key data points relevant to a business, department, or specific process.
Domain A distinct subset of the internet with addresses sharing a common suffix or under the control of a particular organization or individual.
HTML A standardized system for tagging text files to achieve font, colour, graphic, and hyperlink effected on World Wide Web pages.
Key Performance Indicators
A quantifiable measure used to evaluate the success of an organization, employee, etc. in meeting objectives for performance.
Linux An open-source operating system based on UNIX, that runs on many hardware platforms and whose source code is available to the public.
Multidimensional expressions(MDX)
It is a query language for online analytical processing(OLAP) using database management system.
Open source Denoting software for which the original source code is made freely available and may be redistributed and modified.
PostgreSQL It is often simply Postgres, is an object-relational database management system(ORDBMS) with an emphasis on extensibility and standards compliance.
Query
A query is a request for data or information from a database table or combination of tables. This data may be generated as results returned by Structured Query Language (SQL) or as pictorials, graphs or complex results, eg., trend analyses from data-mining tools.
Statistics module
The Statistics Module shows information about your server installation together with statistics on the Web site users, number of Articles in your database and the number of Web links you provide.
Workflow A sequence of industrial, administrative, or other processes through which a piece of work passes from initiation to completion.


FIGURES INDEX XVII
STATISTICS MODULE SHIVA KUMAR
FIGURES INDEX
FIGURE 1 - VALIDATION IN IPBRICK .............................................................................................................. 9
FIGURE 2 - USERS INSERTION IN IPBRICK ..................................................................................................... 9
FIGURE 3 - USER'S FORM ............................................................................................................................ 10
FIGURE 4 - VALIDATE USERS ....................................................................................................................... 10
FIGURE 5 - IPORTALDOC'S LOGIN WINDOW .............................................................................................. 12
FIGURE 6 - IPORTALDOC NAVIGATION AREAS ............................................................................................ 13
FIGURE 7 - HIERARCHY OF DOCUMENTS .................................................................................................... 13
FIGURE 8 - VISUALIZATION OF DOCUMENTS ............................................................................................. 14
FIGURE 9 - TOOL BAR.................................................................................................................................. 14
FIGURE 10 - DOCUMENT SEARCH BOX ....................................................................................................... 15
FIGURE 11 - SEARCH RESULT ...................................................................................................................... 15
FIGURE 12 - ADVANCED SEARCH FORM ..................................................................................................... 16
FIGURE 13 - USERS PARTITION IN THE DOCUMENT MANAGEMENT SYSTEM............................................ 16
FIGURE 14 - FOLDER INSERTION ................................................................................................................. 17
FIGURE 15 - INSERTION FOLDER WITH IPORTALDOC WORKFLOW FOLDERS ............................................. 17
FIGURE 16 - DOCUMENT HIERARCHY GENERATED BY THE INTRODUCTION OF THE DOCUMENT
THROUGH INSERTION FOLDER ......................................................................................................... 18
FIGURE 17 - E-MAIL ADDRESSED TO AN IPORTALDOC USER ...................................................................... 19
FIGURE 18 - FLOWCHART OF INSTALLATION OF PENTAHO........................................................................ 44
FIGURE 19 - FLOWCHART OF INSTALLATION OF SPAGOBI ......................................................................... 45
FIGURE 20 - OPENING PAGE OF SPAGOBI .................................................................................................. 46
FIGURE 21 - ADD DATA SOURCE ................................................................................................................. 46
FIGURE 22 - DATABASE DETAILS ................................................................................................................. 47
FIGURE 23 - TESTING DATA SOURCE .......................................................................................................... 48
FIGURE 24 - CREATION OF NEW DATA SOURCE ......................................................................................... 48
FIGURE 25 - DATA SET MENU ..................................................................................................................... 49
FIGURE 26 - FILLING DATA SET DEFINITION FORM..................................................................................... 49
FIGURE 27 - ADDING QUERY ...................................................................................................................... 50
FIGURE 28 - SCRIPT TYPE ............................................................................................................................ 53
FIGURE 29 - FILE DATA SET ......................................................................................................................... 54
FIGURE 30 - JAVA CLASS DATA SET ............................................................................................................. 55
FIGURE 31 - QBE DATA SET ......................................................................................................................... 55
FIGURE 32 - QUERY EDITOR ........................................................................................................................ 56
FIGURE 33 - FILE DATA SET ......................................................................................................................... 56
FIGURE 34 - TRANSFORMATION TYPE ........................................................................................................ 58

FIGURES INDEX XVIII
STATISTICS MODULE SHIVA KUMAR
FIGURE 35 - RESULT SET ............................................................................................................................. 59
FIGURE 36 - PERSISTENT DATA SET ............................................................................................................ 59
FIGURE 37 - PREVIEW ................................................................................................................................. 60
FIGURE 38 - RESULT OF DATA SET .............................................................................................................. 60
FIGURE 39 - LOGGING IN IPORTALDOC ...................................................................................................... 63
FIGURE 40 - SELECTING MODULES ............................................................................................................. 64
FIGURE 41 - FILLING SEARCH FIELDS .......................................................................................................... 64
FIGURE 42 - BAR CHART RESULT ................................................................................................................ 65
FIGURE 43 - IPORTALDOC LOG ................................................................................................................... 65
FIGURE 44 - SELECTING QUERY TYPE.......................................................................................................... 66
FIGURE 45 - ENTERING A QUERY ................................................................................................................ 66
FIGURE 46 - OPERATION SUCCEEDED ........................................................................................................ 67
FIGURE 47 - CHANGING FIELDS MATERIALS ............................................................................................... 67
FIGURE 48 - PREVIEW ACCORDING TO YOUR INFORMATION ENTERED .................................................... 68
FIGURE 49 - DOCUMENT DEVELOPMENT ................................................................................................... 68
FIGURE 50 - COCKPIT WINDOW ................................................................................................................. 69
FIGURE 51 - COCKPIT WINDOW AND SELECTING THE DATASET ................................................................ 69
FIGURE 52 - CUSTOM CONFIGURATION ..................................................................................................... 70
FIGURE 53 - OVERVIEW OF DIFFERENT KINDS OF CHARTS ........................................................................ 70
FIGURE 54 - PENTAHO LOGIN PAGE ........................................................................................................... 89
FIGURE 55 - HOME PAGE(PENTAHO) ......................................................................................................... 89
FIGURE 56 - SPAGOBI LOGIN PAGE ............................................................................................................ 91
FIGURE 57 - HOME PAGE (SPAGOBI) .......................................................................................................... 91

TABLES INDEX XIX
STATISTICS MODULE SHIVA KUMAR
TABLES INDEX
TABLE 1 - AN OVERVIEW OF THE FEATURES OF THE BI TOOLS .................................................................. 42
TABLE 2 - PRICING OF BI SUITE ................................................................................................................... 42
TABLE 3 - COMPARISON OF BI TOOLS WITH 14 IMPORTANT FEATURES ................................................... 43
TABLE 4- COMBINATION OF SCOPE OPTIONS ............................................................................................ 50

INDEX XXI
STATISTICS MODULE SHIVA KUMAR
INDEX
1 INTRODUCTION ................................................................................................................................... 3
1.1 CONTEXTUALIZATION ................................................................................................................... 3
1.2 MAIN GOALS ................................................................................................................................ 5
1.3 THESIS STRUCTURE ....................................................................................................................... 5
2 IPORTALDOC ....................................................................................................................................... 9
2.1 What is iPortalDoc ........................................................................................................................ 9
2.2 Users Management ...................................................................................................................... 9
2.3 iPortalDoc FEATURES .................................................................................................................. 11
2.4 iPortalDoc INTERFACES ............................................................................................................... 11
2.4.1 Web access interface............................................................................................................... 12
2.4.2 File system interface ................................................................................................................... 16
2.4.3 Email Interface ........................................................................................................................... 18
3 BUSINESS INTELLIGENCE TOOLS ....................................................................................................... 23
3.1 PENTAHO COMMUNITY EDITION ................................................................................................. 23
3.1.1 Big data ...................................................................................................................................... 23
3.1.3 Embedded Analytics ................................................................................................................... 27
3.2 SPAGOBI ..................................................................................................................................... 30
3.2.1 Specifications ............................................................................................................................. 31
3.2.2 Self-service ................................................................................................................................. 33
3.2.3 Big data ...................................................................................................................................... 33
3.3 Pentaho Mondrian ..................................................................................................................... 35
3.3.1 Main advantages and disadvantages .......................................................................................... 37
3.4 TACTIC Open Source ................................................................................................................... 37

INDEX XXII
STATISTICS MODULE SHIVA KUMAR
3.4.1 What is TACTIC workflow?.......................................................................................................... 37
4. SELECTING AN ADEQUATE BI TOOL .................................................................................................. 41
4.1 COMPARISON BETWEEN DIFFERENT BI TOOLS ....................................................................... 41
4.2 INSTALLING PENTAHO AND SPAGOBI TOOLS .......................................................................... 43
4.2.1 Installing Pentaho BI tool on Linux Ubuntu ............................................................................. 43
4.2.2 Installing SpagoBI BI tool on Linux Ubuntu ............................................................................. 45
4.2.3 Performance of the Two BI tools: A comparison..................................................................... 45
5 ABOUT THE USE OF SPAGOBI WITH IPORTALDOC ............................................................................ 63
5.1 After the installation of SpagoBI BI suite(User Manual- Working of SpagoBI with iPortalDoc) ....... 63
6 CONCLUSIONS AND PROPOSALS FOR FUTURE WORK ...................................................................... 73
6.1 CONCLUSIONS ................................................................................................................................... 73
6.2 PROPOSALS FOR FUTURE WORKS .................................................................................................... 73
7 REFERENCES AND OTHER SOURCE OF INFORMATION ..................................................................... 77
7.1 PAPERS IN INTERNATIONAL JOURNALS ............................................................................................ 81
8 ANNEXES ........................................................................................................................................... 85
8.1 Installing Pentaho on Linux Ubuntu [14] .......................................................................................... 85
8.2 Installing SpagoBI on Linux Ubuntu [15] ........................................................................................... 90
8.3 Some other different types of Business Intelligence tools available in market [20] ........................ 92
8.4 Most frequently used Linux commands ........................................................................................... 97

23
INTRODUCTION
1.1 CONTEXTUALIZATION
1.2 MAIN GOALS
1.3 THESIS STRUCTURE
INTRODUCTION 3
STATISTICS MODULE SHIVA KUMAR
1 INTRODUCTION 1.1 CONTEXTUALIZATION
Database Management System (DBMS) is a system software for creating and managing databases [1]. The DBMS provides users and programmers with a systematic way to create, retrieve, update and manage data.
A DBMS makes it possible for end users to create, read, update and delete data in a database. The DBMS essentially serves as an interface between the database and end users or application programs, ensuring that data is consistently organized and remains easily accessible.
The DBMS manages three important things: the data, the database engine that allows data to be accesses, locked and modified – and the database schema, which defines the database’s logical structure. These three foundational elements help provide concurrency, security, data integrity and uniform administration procedures. Typical database administration tasks supported by the DBMS include change management systems are also responsible for automated rollbacks, restarts and recovery as well as the logging and auditing of activity.
iPortalDoc is an integrated solution for Document Management and Processes based on workflows. Allows the modelling and implementation of processes related to all areas of public and private organizations: Electronic billing with Digital Signature, Orders, Proposals, Purchases, mail, Contracts, Complaints and others.
At any given moment in a process that takes place on iPortalDoc, the Document Management and Processes, with the involvement of various users and different departments, one will always have access to the entire history of individuals involved, interventions that have been carried out, as well as documentation e-mails associated, facilitating research and avoiding loss of time and information. This results not only in the continued improvement of activities and processes of organizations, making them more efficient, but in the increase of productivity in the different areas of business.
Communications (e-mails, calls and instant messages) integrated with Document Management and Processes. iPortalDoc is the only Document Management Software which integrates in a singular way with communications such as calls, e-mails and chat conversations. They are recorded and associated to documents and can be accesses at any time.
Since, there are not a lot of options in iPortalDoc’s statistics module section like it has only the bar chart and table, so in order to make the results with more available formats and also giving importance to the different design of results (Pie charts, Pivot

INTRODUCTION 4
STATISTICS MODULE SHIVA KUMAR
table, Horizontal bar charts etc.) which makes easier to analyze our data comparing with different design, it is needed to link iPortalDoc’s database with Business Intelligence tool that best responds to iPortalDoc needs.
The world of data is constantly changing and evolving every second. This in turn has created a completely new dimension of growth and challenges for companies around the globe. By accurately recording data, updating and tracking them on an efficient and regular basis, companies can address their challenges on one hand make use of the immense potential offered by this sector on the other hand.
Data management system is needed for data access within the company - Modern database management systems are dependent on a programming language that is called structured query language. This language is then used to access, update and delete data that are present within its tables. The database systems also contain programs that include Microsoft’s SQL server and open source MySQL queries that enable outside programs to access its data through SQL queries. For example, a web page can display information or data that includes product data and description, photographs and prices. This information is easily available to the user, when web server software is connected to the relational database management system.
It is needed to maintain strong relationships between data – One of the most important functions of relational database management systems programs is that it allows different data tables to relate to one another. When a database contains information about employee data on its product sales in one table and another table contain information with sales employee data, then a relational database will be perfect to manage their relationships in a systematic and simple style. This system in turn can help brand managers to understand important statistics like which salesperson is able to sell the most or which product is being sold by a particular sales person.
This system allows newer and better updates – A useful and productive database management system allows brand managers to not just enter newer information but also update the current information and also delete information that they do not require. For example, when a salesperson is able to sell 1,000 units, the that person can enter that transaction information in the relational management system which can include certain details like the person’s name, customer information along with the product and number of products sold by the user. The relational database management system will enter the new records and update all the required information, thereby allowing brands to track and sell their products in an effective fashion.
It helps brand managers to search data in a better manner – The relational database management system also allows brand managers to maintain and build their data over successive years. The various tables in the relational database management system

INTRODUCTION 5
STATISTICS MODULE SHIVA KUMAR
allow brand managers to search through their entire system for particular information. The company manager can easily find any information that they need, using a particular criterion. This is also available for customers who can search for any feature that they want including price, color and brand.
1.2 MAIN GOALS This thesis has two main purposes. The first purpose of the thesis is to study and analyze BI (Business Intelligence) tools available in the market and identify the one that adequately meets the requirements of the iPortalDoc. To evaluate the performance of the link between iPortalDoc’s database and the BI tool that adequately responds to iPortalDoc needs with respect to statistics module is the second big purpose of this work.
1.3 THESIS STRUCTURE The organization of the thesis is as follows.
Chapter 2 introduces some basic information about the iPortalDoc Data base management system, user management, iPortalDoc features, Interfaces etc.
Chapter 3 provides a review of BI tools available on the web, their features, main concepts, contribution etc. Chapter 4 presents the results of a comparative study among the 4 BI tools, the efficiency and performance of the BI tool is decided on the basis of their advanced features, the last section of chapter 4 explains the method of connecting selected BI tool with iPortalDoc.
Chapter 5, the final chapter, provides a brief introduction to some statistical methodologies available in the tool SpagoBI and also illustrates how this BI tool can be used jointly with the iPortalDoc. Chapter 6 and 7 explains the conclusion and references used respectively.
Finally, the chapter 8 provides some additional information that supports the thesis study.

7
<TÍTULO DA TESE> <NOME DO AUTOR>
IPORTALDOC
2.1 WHAT IS iPortalDoc
2.2 USERS MANAGEMENT


IPORTALDOC 9
STATISTICS MODULE SHIVA KUMAR
2 IPORTALDOC This chapter introduces the Document Management System tool iPortalDoc. This tool is the focus of this work. 2.1 What is iPortalDoc iPortalDoc [2] is a workflow and Document Management System, allowing its users to manage an organization's document flow. iPortalDoc works in tandem with another system, the IPBrick system.
IPBrick manages iPortalDoc users, as well as the groups to which they belong. It is also in IPBrick that entities are created, and their respective contacts.
2.2 Users Management The only profile capable of performing this task is the system's administrator. The administrator has to access https://ipbrick, where his credentials shall be asked. (Figure 1).
Figure 1 - Validation in IPBrick
After validation, the IPBrick interface will display the system settings. The administrator will have to access the IPBrick.I menu on the left side of the screen and click on user management. If there are users in IPBrick, a list of user names will be presented (Figure 2).
Figure 2 - Users insertion in IPBrick

IPORTALDOC 10
STATISTICS MODULE SHIVA KUMAR
On the right side of the screen you will find the insert link, if you click on it a page will appear, as in the figure 3, fill the form to insert the users' data. This operation may be repeated as many times as necessary.
Figure 3 - User's form
Please remember it's necessary to apply configuration, so that the users may be admitted as system users, as you can see in the figure 4.
Figure 4 - Validate users
Next, there is similar process for the creation and management of groups. For chart process, we access to the users’ groups menu in IPBrick.I. If there are groups these are presented in the central part of the screen, and the insertion of more groups is possible by clicking on the insert button.
However, if iPortalDoc is no longer in a trial version, users recently inserted in IPBrick shall not immediately appear in iPortalDoc, and they cannot access it. The admission of new users in iPortalDoc is an operation that shall have to be done in iPortalDoc itself. As for the removal of users, that will also be made in iPortalDoc.

IPORTALDOC 11
STATISTICS MODULE SHIVA KUMAR
2.3 iPortalDoc FEATURES This document management system allows the modeling and implementation of processes related to all areas of public and private organizations: Electronic Billing with Digital Signature, Orders, Proposals, Purchases, Mail, Contracts, Complaints and others. It is easy to use and requires reduced training: iPortalDoc does not need substantial computer knowledge; a little orientation and practice are enough for a good use of iPortalDoc.
Seamlessly integrated with users' working environment: This system allows the integration of any document in any format.
Safety in access to actions and documents: iPortalDoc is a system that gives safety guarantees, through the assignment of several profiles and respective permissions.
Reduction of paper use and process control via use of workflows: This system allows a drastic reduction of paper documents, through the digitalization of documents.
Communication: This system allows the exchange of information between people and departments in a quick safe process, avoiding a communication system external to iPortalDoc (eg: Telephone, Oral communication etc.)
After analyzing the general characteristics of iPortalDoc, we shall explore the three main interaction interfaces that the system's architecture provides.
2.4 iPortalDoc INTERFACES All access interfaces are based on standard protocols (HTTP, SMTP and SMB). iPortalDoc provides two ways of user-system interaction:
• WEB access through a web browser;
• SMB access (Network partitions) through a file manager.
So, since iPortalDoc is supported by internet protocols, it may be accessed by any workstation (Windows, Mac, Unix, Palms, etc.) or mobile devices (IOS or Andriod). In short, the user may access to/visualize his documents through:
• A web browser (eg: Internet-Explorer);
• A file manager (eg: Windows-Explorer).
This type of approach allows users to access the documents locally or externally.

IPORTALDOC 12
STATISTICS MODULE SHIVA KUMAR
2.4.1 Web access interface This is the most powerful interface, as it allows all type of operations documents, workflow management, insertion of templates etc.
To access to iPortalDoc interface, after installation you will get a window as shown in a figure 5 and you can use the default user as ‘administrator’ with password ‘123’.
The graphic WEB access interface is divided into four types of areas which enables interaction with documents, as in figure 6.
1. Navigation area in document hierarchy(left side);
2. Visualization area of the documents from a certain section of document management hierarchy(in the middle);
3. Search engine;
4. Tool bar (above the document visualization area).
Figure 5 - iPortalDoc's login window

IPORTALDOC 13
STATISTICS MODULE SHIVA KUMAR
Figure 6 - iPortalDoc navigation áreas
Figure 7 - Hierarchy of documents
Navigation area in document hierarchy The navigation area in document hierarchy is on the left side of the web browser and allows the user to select the system's document management part (Figure 7) where he wants to execute queries or alterations, that is, select a section to interact with. This area also allows the user to see the sections and respective documents simultaneously, if his profile allows it.

IPORTALDOC 14
STATISTICS MODULE SHIVA KUMAR
Figure 8 - Visualization of documents
Figure 9 - Tool bar
Document visualization area The central WEB browser area, on the right side of the document hierarchy, is the document visualization area of iPortalDoc. In this area, Figure 8, the user sees a list of documents which are in the section that he has selected in the document hierarchy.
Tool bar In the Web browser, above the central document visualization area, is the tool bar, as you can see in figure 9.
It is in the area that user will interact with system. The tool bar is compressed of five menus. NOTE: You have to take into account the user profile, that is, the number and type of menus, as well as the respective mail options may vary according to the user respective profile(Permissions and Profile shall be further explained) Thus, you can access to a series of features in each menu:
• Document- Manipulate the objects document type and access associated information, document attributes, associated documents, revision, document flow, actions to execute on documents etc.
• Definitions: Access system settings regarding profiles, users, groups, enable modules, etc., creation of new types of document and profiles.
• Workflow: Manipulate document flows, instantiating the available factory flows and configuring them for further use.
• Folder: Here you can associate users to these sections with certain use profiles and this way associate documents to the users in the appropriate sections.
• Modules: Here you can access to iPortalDoc statistics.
• Session: Access and configure the section in process.
IPORTALDOC 15
STATISTICS MODULE SHIVA KUMAR
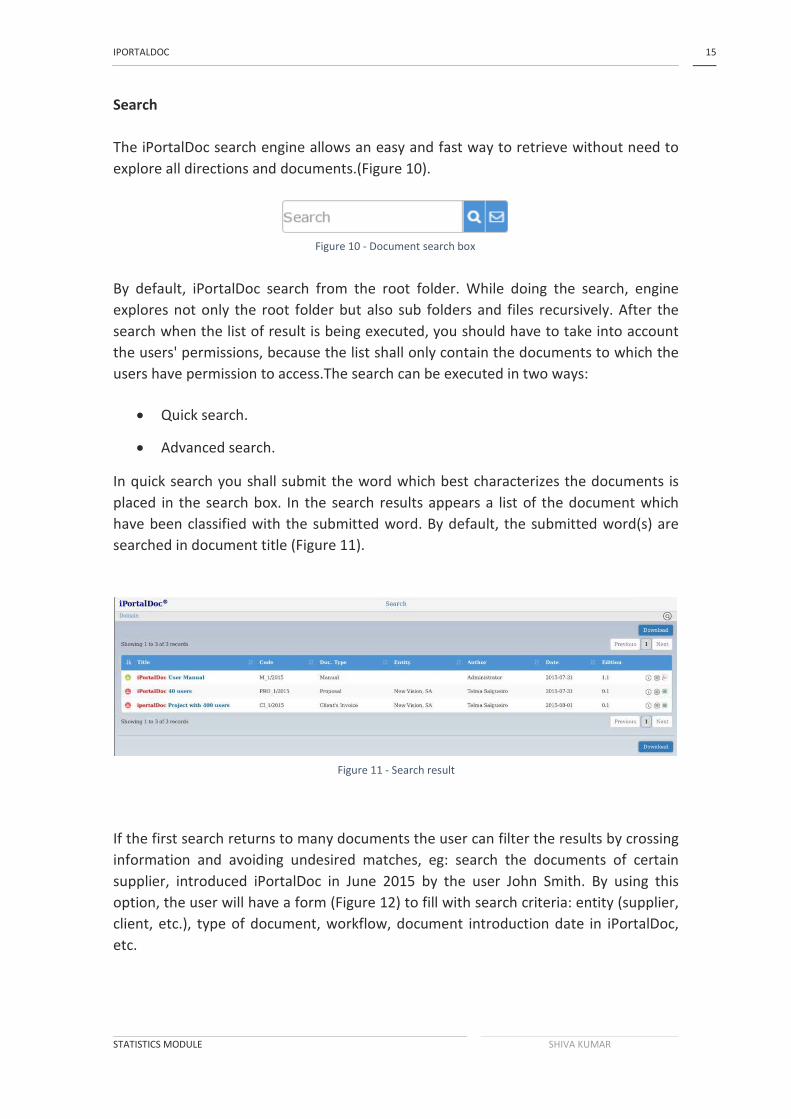
Figure 10 - Document search box
Figure 11 - Search result
Search The iPortalDoc search engine allows an easy and fast way to retrieve without need to explore all directions and documents.(Figure 10).
By default, iPortalDoc search from the root folder. While doing the search, engine explores not only the root folder but also sub folders and files recursively. After the search when the list of result is being executed, you should have to take into account the users' permissions, because the list shall only contain the documents to which the users have permission to access.The search can be executed in two ways:
• Quick search.
• Advanced search.
In quick search you shall submit the word which best characterizes the documents is placed in the search box. In the search results appears a list of the document which have been classified with the submitted word. By default, the submitted word(s) are searched in document title (Figure 11).
If the first search returns to many documents the user can filter the results by crossing information and avoiding undesired matches, eg: search the documents of certain supplier, introduced iPortalDoc in June 2015 by the user John Smith. By using this option, the user will have a form (Figure 12) to fill with search criteria: entity (supplier, client, etc.), type of document, workflow, document introduction date in iPortalDoc, etc.

IPORTALDOC 16
STATISTICS MODULE SHIVA KUMAR
Figure 12 - Advanced search form
Figure 13 - Users partition in the document management system
2.4.2 File system interface Besides the WEB interface, there is SMB interface(access to partitions) created to offer quick access to the documents, for the access to the documents through the network file systems are faster than WEB Accesses. This file management is made in the intranet. Visual aspect of this access is familiar to the many users, as you can see in the figure 13.
The Document Management System creates a network partition with the documents that the user access in iPortalDoc, according to the permissions to the WEB interface. In this interface on the left side of the screen, you can access the document hierarchy. This interact simplifies the copy of large quantity of documents and enables a friendly visualization to the users familiarized with this type environment.
The system creates automatically two single folders (Network Partitions). These folders have two types and have different functions:
• Insertion: It is a folder where we put the documents coming out of the system, for example, via digitalization, associating them to respective workflows(Figure 14).

IPORTALDOC 17
STATISTICS MODULE SHIVA KUMAR
Figure 14 - Folder Insertion
Figure 15- Insertion folder with iPortalDoc workflow folders
• Access: In this folder it is represented the document of hierarchy of iPortalDoc to which user can access through his permissions (Figure 13).
To access these folders, the following steps are necessary: • In windows operating system access to Windows-Explorer(My computer)
• Menu Tools option map network drive, There appears a dialog box where you put the unit to which you want to access to: Insertion folder or Access folder. You shall put the folder domain followed by and the folder name (Access or Insertion) where the system asks the folder to which you want to access to
As it already been mentioned, the insertion folder allows the introduction of documents in iPortalDoc and consequently it places them in respective document flow (Figure 15). The workflow folders are automatically from the moment the workflows are activated. However, the documents there do not permanently stay in these folders , for the system searches these folders looking for new documents, and when it finds them, it passes them into the access folder and thus to hierarchy of iPortalDoc.
IPORTALDOC 18
STATISTICS MODULE SHIVA KUMAR
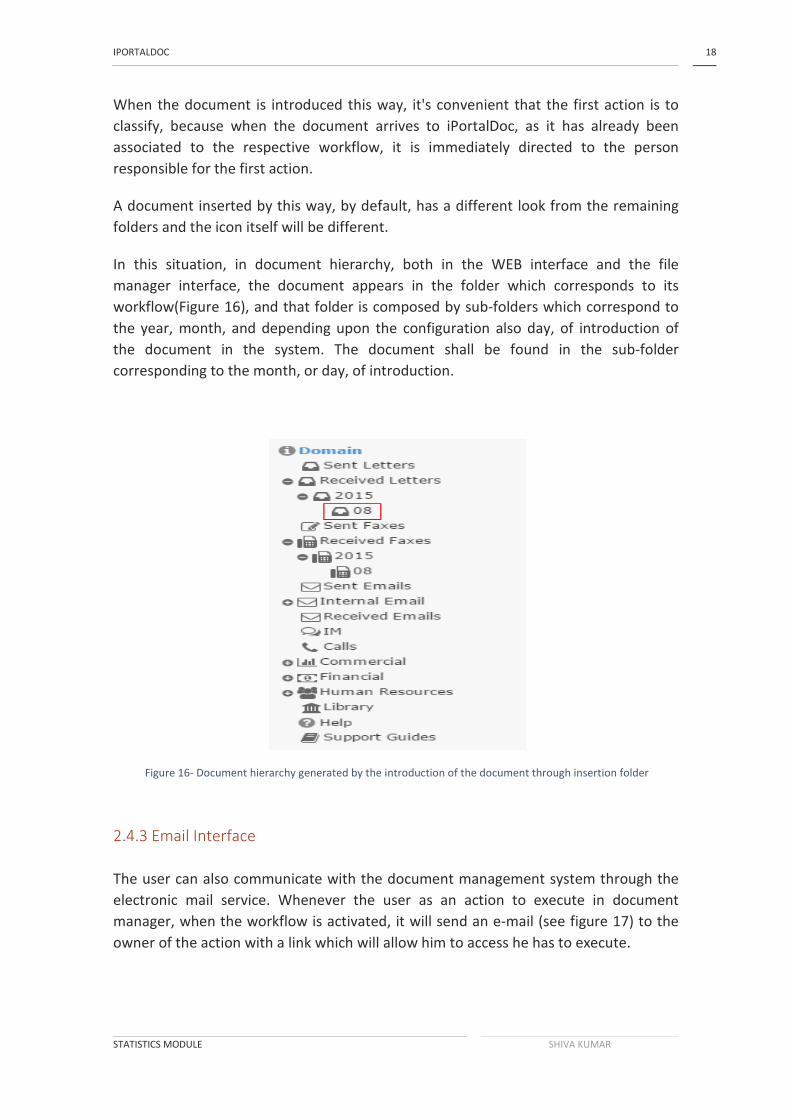
Figure 16- Document hierarchy generated by the introduction of the document through insertion folder
When the document is introduced this way, it's convenient that the first action is to classify, because when the document arrives to iPortalDoc, as it has already been associated to the respective workflow, it is immediately directed to the person responsible for the first action.
A document inserted by this way, by default, has a different look from the remaining folders and the icon itself will be different.
In this situation, in document hierarchy, both in the WEB interface and the file manager interface, the document appears in the folder which corresponds to its workflow(Figure 16), and that folder is composed by sub-folders which correspond to the year, month, and depending upon the configuration also day, of introduction of the document in the system. The document shall be found in the sub-folder corresponding to the month, or day, of introduction.
2.4.3 Email Interface The user can also communicate with the document management system through the electronic mail service. Whenever the user as an action to execute in document manager, when the workflow is activated, it will send an e-mail (see figure 17) to the owner of the action with a link which will allow him to access he has to execute.

IPORTALDOC 19
STATISTICS MODULE SHIVA KUMAR
Figure 17 - E-mail addressed to an iPortalDoc user
Afterwards, if the action has not yet been executed, the system shall send another e-mail to warn the owner of the action that he has an action to execute and that should have already been executed. On the day the term of action ends, the system shall send a notice to the owner of the action. If the term of action expires, and the action has been executed, the system shall send an email to the coordinator of the section and to the admin the following day. It should be taken into account that the frequency of actions depends on the term established to execute each action.
Besides this, the electronic mail interface, along with web interface, allows the user to associate the documents to e-mails. This functionality is useful to the user in order to have always a quick and organized access to the document, the e-mails and workflow associated to them.
Through the web interface, when selecting a document and acceding to the info action, you can access to the e-mails associated to the selected documents.
To access to the electronic mail interface the user only needs to use his e-mail account, and access to https://groupware.domain.com with his user name and password. This account is automatically created by IPBrick, when the users are inserted. This account is the type: [email protected]. With this account the user is notified about the actions he has to execute in iPortalDoc.
Note: This domain is company’s domain. Consequently, the domain varies according to the company.
All iPortalDoc components are built on open source technologies and only support Internet Engineering Task Force standard protocols. It ensures the maximum compatibility with any existing and future equipment.


21
<TÍTULO DA TESE> <NOME DO AUTOR>
BUSINESS INTELLIGENCE
TOOLS
3.1 PENTAHO COMMUNITY EDITION
3.2 SPAGOBI
3.3 PENTAHO MONDRIAN
3.4 TACTIC OPEN SOURCE

BUSINESS INTELLIGENCE TOOLS 23
STATISTICS MODULE SHIVA KUMAR
3 BUSINESS INTELLIGENCE TOOLS Most of the time, BI tools are standalone tools or suites of tools that are targeted to a specific industry. You might have heard them referred to as “data warehouse appliances”, or as a bunch of letters strung together into acronyms (ERP, OLAP, CPM, CRM, etc). The amount of data that is being collected is growing exponentially. Businesses need reporting tools that can help them analyze this data. And when it comes to using this data, visualizations and infographics are some of the best ways to present the data.
This chapter presents a review of BI tools available on the web, in particular, the Pentaho Community Edition, the SpagoBI, the Pentaho Mondrian and TACTIC Open Source
This review is based on the information available in the website of the BI tools studied, so the type of description depends on available information.
Before we begin the description of the BI tools studied in this work, it is important that we distinguish the concepts free and open BI and BA tools. According [3] BI tools enables, the collection and use of intelligence data through enrichment and augmentation. BI technologies provide historical, current and predictive views of business operations. The common function of business intelligence technologies are reporting, Online analytical process, data mining, process mining, business performance management, benchmarking and analytics.
3.1 PENTAHO COMMUNITY EDITION Pentaho [4] is a comprehensive Data Integration and Business Analytic Platform. It addresses the barriers that block your organization's ability to get value from all your data. Its platform simplifies preparing and blending any data and includes a spectrum of tools to easily analyze, visualize, explore, report and predict. Open, embeddable and extensible, Pentaho is architected to ensure that each member of your team from developers to business users can easily transfer data into value. Some of its features are explained below. 3.1.1 Big data Within a single platform, Pentaho solution provides big data tools to extract, prepare and blend your data, plus the visualization and analytics that will change the way you run your business. From Hadoop and Spark to NoSQL, Pentaho allows you to turn big data into big insights.

BUSINESS INTELLIGENCE TOOLS 24
STATISTICS MODULE SHIVA KUMAR
Blended big data analytics A tightly coupled data integration and business analytics platform accelerates the realization of value from blended big data.
• Full array of analytics: data access and integration to data visualization and predictive analytics;
• Empowers users to architect big data blends at the source and stream them directly for more complete and accurate analytics;
• Ability to spot check data in-flight with immediate access to analytics, including charts, visualization, and reporting, from any step in data preparation;
• Supports the broadest spectrum of big data source, taking advantage of the specific and unique capabilities of each technology;
• Open, standard based architecture makes it easy to integrate with or extend existing infrastructure.
Broad and adaptive big data integration Deep native connections and an adaptive big data layer accelerate access to the latest versions and capabilities of popular big data stores.
• Ability to access data once -and the process, combine and consume it anywhere;
• Greater flexibility, reduced risk, and insulation from changes in the big data ecosystem;
• Support for the latest Hadoop distributions from Cloudera, Hortonworks, MapR, and Amazon web services;
• Ability to access data for preparation via SQL on Spark and to orchestrate existing Spark application in Scala, Java and Python;
• Integration with NoSQL stores including MangoDB and Cassandra;
• Connectivity to analytic databases including HPE vertica, Amazon Redshift, SAP HANA and more.
Simplify handoop data integration and analytics An intuitive platform and industry-leading expertise to streamline Hadoop projects at enterprise scale.
• Balanced approach providing architects, developers, and analysts the right mix of agility and control over the cluster;

BUSINESS INTELLIGENCE TOOLS 25
STATISTICS MODULE SHIVA KUMAR
• Visual MapReduce design tools that empower 15 times faster development vs. Hand-coding and execute natively in-cluster;
• Broad ecosystem integration enabling elastic resource usage YARN, Spark job execution, SQL on Spark connectivity, Kafka access and more;
• Solution approach to deliver on-demand datasets from Hadoop, including governed self-service analytics for large production user bases;
• Deep services and implementation experience, proven use case design patterns, and a strong track record of customer success with Hadoop.
Interactive analysis, reporting, visualization and dashboards Pentaho empowers business users and analysts to visualize, analyze and report on data across multiple dimensions without depending on IT or developers.
• Interactive analysis, drill through, lasso filtering, zooming, and attribute highlighting for greater insight;
• Out-of-the box library of interactive visualizations;
• Extreme scale in-memory data caching for speed-of-thought analysis of large data volumes;
• Self-service interactive reporting to high volume, highly formatted enterprise reports;
• Dashboards from any big data source including enterprise;
• Flexibility to merge data integration with business intelligence service to simplify configuration, deployment and administration.
3.1.2 Data Integration
Pentaho Data integration [5] prepares and blends data to create a complete picture of your business that drives actionable insights. The platform delivers accurate, analytics-ready data to end users from any source. With visual tools to eliminate coding and complexity, Pentaho puts big data and all data sources at the fingertips of business and IT users. Ease of use with the power to integrate al the data Intuitive drag-and-drop data integration coupled with data agnostic connectivity spanning from flat files and RDBMS to Hadoop and beyond.
• Graphical Extract-Transform-Load (ETL) designer to simplify the creation of data pipelines;

BUSINESS INTELLIGENCE TOOLS 26
STATISTICS MODULE SHIVA KUMAR
• Rich library of pre-built components to access, prepare, and blend data from relational sources, big data stores, enterprise applications and more;
• Powerful orchestration capabilities to coordinate and combine transformations including notifications and alerts;
• Agile views for modelling and visualizing data on the fly during the data preparation process;
• Integrated enterprise scheduler for coordinating workflows and debugger for testing and tuning job execution.
Big data integration with zero coding required Pentaho's intuitive tool set accelerates the design and deployment of big data analytics by upto 15 times compared to hand-coding techniques.
• Complete visual big data integration tools eliminate manual programming and scripting from the process;
• Deep integration and Adaptive Big Data Layer accelerates access to the latest versions and capabilities of popular big data stores;
• Robust support for Hadoop distributions, Spark, NoSQL data stores and analytic databases;
• Empowers user to architect big data blends at the source, and stream them directly for more complete and accurate analytics;
• Integrate advanced analytic models from R, Python and weak to operationalize predictive models, while reducing data prep time.
Bringing analytic into data prep Pentaho is the only vendor on the market to deliver a visual data experience from anywhere in the database with single platform.
• Access any analytics, including charts, visualizations, and reporting, from any step in data preparation-shortening the cycle from data to analytics;
• ETL developers and data preparation can easily spot check analytics in-flight;
• Directly publish data sources for the business user creating a more collaborative process between business and IT;
• Data services to visualize transformations without staging, making data sets immediately available to reports and applications;
• Set up a self-service data prep environment with governed, on demand data sets.

BUSINESS INTELLIGENCE TOOLS 27
STATISTICS MODULE SHIVA KUMAR
Enterprise platform to accelerate the data pipeline Go beyond standard ETL to scalable and flexible management for end-to-end data flows.
• Dynamic and reusable data integration that drive massive time savings through dynamically creating transformations on the fly;
• Multi-threaded data integration engine architected to scale up and out, including deployment to clustered and cloud environments;
• Robust administration features including performance monitoring, job roll-back and restart, and operations mart for usage auditing;
• Enterprise-grade security including access and version controls as well as LDAP and Active Directory integration;
• Enterprise-level security for Cloudera and Hortonworks Hadoop clusters, with support for kerberos, Sentry and Ranger;
• Data quality and enrichment plug-ins from partner Melissa Data promote enhanced data management;
• Flexibility to merge data integration with business intelligence service to simplify configuration, deployment and administration.
3.1.3 Embedded Analytics Pentaho's flexible cloud-ready platform is purpose-built for embedding into and integrating into your applications, portals and processes. Pentaho's powerful analytics and extensive architecture ensure that you can get to market quickly, delight your customers, and future-proof your solution. Seamlessly deliver powerful customized analytics A full array of enterprise business analytics coupled with flexible data integration delivers insight when and where your customer need it.
• A complete platform for data access, integration, and discovery – including big data sources such as Hadoop and NoSQL;
• Compelling visualizations, interactive reporting, ad hoc analysis, and tailored Dashboards;
• Highly customizable web-based user interface to match your application's branding.look, and feel;
BUSINESS INTELLIGENCE TOOLS 28
STATISTICS MODULE SHIVA KUMAR
• Flexible multi-tenant capabilities for easy SaaS and cloud deployment;
• Rich integration with security authentication, and single sign-on frameworks.
A leading success methodology Leverage Pentaho's extensive embedded analytics experience to blade a rapid path to market and business growth.
• Kick starts the development cycle with training and strategy workshops tailored to your unique requirements;
• Full development support and access to technical experts for test and quality assurance cycles;
• Ensure success with an average go-to-market cycle of 8 weeks or fewer;
• Hundreds of successful embedded analytics customers like ExactTarget, Marketo, Ruckus wireless, and ABN Amro.
Open architecture and standards for broad extensibility Pentaho's highly flexible and extensible platform empowers you to launch the right analytics solution today and adapt to future needs and requirements.
• Modern, 100% Java platform built on industry standards like Restful web service interfaces for easy integration with any web application;
• Ability to work seamlessly with enterprise security frameworks and extend to third party charts and graphs via open API's;
• Easily embed sophisticated analytics into mobile and tablet applications;
• Visibility into product Roadmap, source code and components to meet ever changing customer needs.
Completely tailored and visualization experience Make your analytics vision a reality with completely custom interactive visualizations and user experience design.
• Advanced enterprise visualization, reports, and dashboards designed with specific scenario in mind;
• A powerful toolset to extend Pentaho platform for interactive, branded, and beautiful custom dashboard implementation;

BUSINESS INTELLIGENCE TOOLS 29
STATISTICS MODULE SHIVA KUMAR
• Dedicated services team that works closely with you to showcase your metrics your way.
3.1.4 Business Analytics
Pentaho's modern, simplified, and interactive approach empowers business users to access, discover and blend all types and sizes of data. With a spectrum of increasingly advanced analytics, from basic reports to predictive modelling, users can analyze and visualize data across multiple dimensions, all while minimizing dependence on IT. Interactive visual analysis Business users are self-reliant and can immediately access, analyze, and visualize any data.
• Interactive visual analysis with drill through, lasso filtering, zooming, and attribute highlighting for greater insight;
• Out-of-the-box library of interactive visualizations - including geo-mapping, heat grids and scatter/bubble charts;
• Specialized visualization plug-ins deliver “the art of possible” for advanced visualizations;
• Extreme scale in-memory data caching for speed-of-thought analysis of large data volumes.
Graphical and responsive dashboards Interactive dashboards offer business user key performance indicators in highly graphical visual interface to improve organizational performance.
• Web-based drag and drop dashboard design including rich navigation, drilling and a library of filter controls;
• Custom built dashboards uniquely tailored for your business;
• Portal and mash up integration seamlessly connects business analytics with other applications.
C omprehensive solutions for reporting Our reporting capabilities span the entire continuum for self-service interactive reporting to high volume, highly formatted enterprise reporting.

BUSINESS INTELLIGENCE TOOLS 30
STATISTICS MODULE SHIVA KUMAR
• Intuitive web-based interactive reporting for business users;
• Rich graphical enterprise report designers for power users;
• Output in popular formats: HTML, Excel, CSV, PDF and RTF;
• In-memory caching for fast results;
• First to market direct reporting for NoSQL.
Streamlined management and administration Management and administration enabled with ideal set of tools for efficient development, deployment and management in a streamlined user environment. Reports and analytics can be accesses from anywhere: desktop, laptops, or mobile.
• Analytics security, content permissions, versioning, locking and expiration;
• World class reliability, backup and recovery;
• Enterprise ready data integration with job restart and roll back;
• Performance monitory and auditing with built in reporting;
• Flexibility to merge data integration with business intelligence service to simplify configuration, deployment and administration.
3.1.5 Main advantages and disadvantages
Pentaho has a lot of Advanced features which is very useful for a professional and clear analysis of the data. But at the same Pentaho has only free trial version and a paid full version. 3.2 SPAGOBI SpagoBI [6] is a Business Intelligence suite developed by Italian firm engineering ‘Ingegneria Informatica’. The project was launched in 2005. SpagoBI is the only completely Open Source BI solution out there with a single stable release that includes 100% of the features.
It is complete suite offering all the features one can ask for a BI suite. Its strength lies in a fact that it offers multiple analytical solutions for end-users and large range of tools for developers, testers, and administrators. To cover the whole BI needs, SpagoBI integrates a large number of open source projects. SpagoBI is not simply an addition of solutions, It offers a powerful combination through its advanced model.

BUSINESS INTELLIGENCE TOOLS 31
STATISTICS MODULE SHIVA KUMAR
3.2.1 Specifications Reporting Realize structured reports and export them using the most suitable format (HTML, PDF, XLS, XML, TXT, CSV, RTF) Multi-dimensional Analysis (OLAP) Explore your data on different detail levels and from different perspectives, through drill-down, drill-across, slice-and-dice, drill-through processes. Charts Develop ready-to-use chart according to your single charts (e.g. Histograms, pie charts, bar charts, area charts, scatter diagrams, line charts, bubble charts, dispersion charts) and interactive ones (e.g. temporal sliders, add/delete series). Use it separately or aggregate them into a cockpit for a richer view on your data). KPIs SpagoBI offers a complete set of tools to create, manage, view and browse KPI hierarchy models [7], through different methods, calculation rules, thresholds and alarm rules. Interactive cockpits Aggregates different analyses into a single view. Set navigation paths, and explore your data a dynamic and graphical way. Ad-hoc reporting Self-create your multi-sheets reports, including, tables, cross-tables and chart. Location Intelligence Visualize your business data on maps (i.e. static map catalogues or web mapping/feature services) and interact dynamically to get instant views.

BUSINESS INTELLIGENCE TOOLS 32
STATISTICS MODULE SHIVA KUMAR
Free Inquiry A QbE (Query by Example) engine makes data exploration and navigation particularly intuitive and easy, thanks to an entirely graphical and web-based interface. Then save your queries for future use. Data mining Advance data analysis allowing you to extract knowledge from large volumes of data, to improve your decision-making business strategies. Network analysis Visualize and interpret relations among entities through specialized views. An entity can be animate (e.g. social media users) or inanimate (e.g. countries, companies, projects). ETL SpagoBI integrates the open source product TOS (Talent Open Studio), to load data into data ware house and managing them at your convenience. Collaboration Create structured report dossiers; enrich your analysis with personal notes and comments posted by users. Then share them through a collaborative workflow. Office automation Publish your personal document into BI environment, Integrating common Office Tools (Open office or MS office). Masterdata Management Users can write back to the database and modify table data through an intuitive user interface, whose behaviour can be set by means of simple configuration parameters, using predefined models. External Processes Manage your analytical processes, which can run in the background or be scheduled to start and stop at a scheduled time.

BUSINESS INTELLIGENCE TOOLS 33
STATISTICS MODULE SHIVA KUMAR
3.2.2 Self-service It is possible to self-build analytics not only on certified enterprise data but also private and unstructured data, contained in your personal CSV and XLS files. 3.2.3 Big data According to the emerging needs, SpagoBI can handle data of any format, allowing you to perform your analysis even on unstructured data, such as audio files, videos, and images. To this end, data sources range from analytical databases and appliances (such as Terradata, VectorWise, Netezza) to NoSQL databases (such as Hive, Hbase, Cassandra, OrientDB, MongoDB), as well from HDFS, in its enriched distributions (Hortonworks, Cloudera, Impala).
Results will be visualized in different formats according to your specific needs, such as charts, reports, thematic maps and cockpits, also on streaming data for real-time analysis.
3.2.4 What-if
SpagoBI what-if analysis allows you to simulate scenarios and predict the effects of potential changes in your business strategies.
Based on an OLAP [8] client, SpagoBI what-if tool makes multi-dimensional analysis quick and accessible to all, in order to meet emerging decision-making requirements. Instant insights on your data are enabled at different detail levels and from the different perspectives, also through drill-down, drill-across, slice-and-dice and drill-through processes.
3.2.5 Social Network Analysis
SpagoBI provides specific tools for social network listening and monitoring, crucial to make proper decisions and develop effective business strategies.
Thanks to a diversified set of insights, you can extract and analyze data flowing on social networks (i.e Twitter), including but not limited to keywords, hashtags, Followers, short-links and SpagoBI documents. Analysis can be performed on real-time data (stream of tweet data) or historic data (regarding a specific time period)
Here is an overview of the available features:
Summary – Overview dashboard including general information on total number of tweets, re tweets, and replies, as well as timelines, used devices and rankings.
Topics – tag clouds providing insights on hashtags and topic extracted out of twitter, analyzed through R.

BUSINESS INTELLIGENCE TOOLS 34
STATISTICS MODULE SHIVA KUMAR
Network – multiple insights on key influencers, mentions and users' interactions, visualized over charts or geographic maps.
Distribution – a world map capturing users' distribution, colored according to their density over countries/states.
Impact – time trend of followers and clicks on the monitored short-links.
Sentiment – analysis of tweet polarity (positive, negative and neutral) thanks to R. Topics are monitored and represented through radars and bar charts.
3.2.6 In Memory
In additional to traditional data warehouses, SpagoBI supports in-memory technologies, in order to analyze faster data insights and get the highest analytical efficiency.
SpagoBI enables data mash-up into interactive cockpits, which you can build by yourself. Navigate your data according to a dynamic and interactive approach, and make real-time decisions in all aspects of your business, even using extra-events and data.
3.2.7 Real time
Extract relevant information from streaming data and define effective business strategies. SpagoBI allows you to consistently monitor your business data and processes through a dynamic and flexible approach. New business opportunities are easily identified, while inefficiencies and bottlenecks are promptly faced. Results are the visualized through intuitive and rich analytics (e.g. reports, KPI's interactive charts) for informed decision-making, even combining historical data with real-time data. Monitor your business process and customize your real-time analytics no matter where you are. SpagoBI integrates the real-time technology available in the specialized 100% source eBAM – eclipse business activity monitoring (BAM) [9] – component, released on eclipse foundation. 3.2.8 Local Intelligence
Local intelligence combines spatial data (GIS- Geographical Information System) [10] with business data (BI), in order to gain critical insights, to adequately support decision-making and optimize business processes. SpagoBI provides different tools (GEO/GIS engines) to create your thematic maps, on which you can instantly and easily identify patterns, trends and/or critical areas to improve your business processes. The capture of spatial data is totally based on open standards approved by Open Geospacial Consortium (OGC) [11].

BUSINESS INTELLIGENCE TOOLS 35
STATISTICS MODULE SHIVA KUMAR
The GEO engine aggregates information according to geographical hierarchies. It can be used in the geographical domain or to give graphical representation to any other structure, such as process flow charts, topological schemas of hardware infrastructures.
The GIS engine ensures a high level interactivity, since it uses actual spacing systems (web map service and web feature service), e.g. Mapserver, OpenstreetMap, Google. Dynamic navigation is performed through showing/hiding layers, zooming, pan, distance and area measuring.
Maps can be developed as single views or integrated into a composite cockpit, and navigated through the cross navigation.
3.2.9 Mobile
Realize and tailor your business analytics no matter where you are with SpagoBI mobile. Now, you can explore any data from your tablet and smartphone through interactive reports, dashboards and cockpits.
Characterized by an entirely web-based and touch-enabled front-end, SpagoBI mobile enables:
• User authentication.
• Role-based document and data access.
• Data update.
• Scheduled analysis.
• Periodical and automatic access to identify possible alarms and notifications.
This technology also supports real-time to allow you to constantly monitor your business and data processes, easily identify new business opportunities and promptly inefficiencies and bottlenecks. 3.2.10 Main advantages and disadvantages
SpagoBI has basic features and some of the advanced features as well, more importantly it has a free full version. At the same time SpagoBI doesn’t have some of the advanced features which Pentaho has. 3.3 Pentaho Mondrian Mondrian [12] is a Online Analytical Processing server (OLAP) that allows business users to analyze large and complex amounts of data in real-time.

BUSINESS INTELLIGENCE TOOLS 36
STATISTICS MODULE SHIVA KUMAR
Analyze all data in real-time Analyzing huge quatities of data has never been that easy. With Mondrian, an open source written in JAVA, the system responds to queries fast enough to allow an interactive exploration of data – even if they have millions of records, occupying several gigabytes. It brings multi-dimensional analysis to the masses, allowing users to examine business data by drilling and cross-tabulating information. Main concepts Mondrian OLAP system uses Partitioned Cubes, allowing several fact tables. It consists of four layers; working from the eyes of the user to the inward of the data center. These are: the Presentation Layer, the Dimension Layer, the Star Layer, and the Storage Layer. Partitioned cubes Whereas the regular cube has single fact cable, a Partitioned cube has several fact tables, which are joined together. One partition might contain today's data, while another might hold historical data, giving a useful contribute for real-time analysis.
The Presentation Layer determines what's shown in the user's screen, and how he can interact to ask new questions. There are many ways to present multi-dimensional data sets, including pivot tables, pie, line or bar charts and advanced visualization tools such as clickable maps and dynamic graphics.
The Dimension Layer parses, validates and executes Multidimensional Expressions(MDx) queries. A query is evaluated in multiple phases and the axes are the first to be computed, right before the values of cells within the axes.
The Star Layer is responsible for maintaining an aggregate cache. An aggregation is a set of measure values(cells) in memory, qualified by a set of dimension column values.
The Storage Layer is a Relational Database Management System(RDBMS) and is responsible for providing aggregated cell data and members from dimension tables.

BUSINESS INTELLIGENCE TOOLS 37
STATISTICS MODULE SHIVA KUMAR
How to contribute Open source delivers better, faster and reliable products, empowered by an active and wider community. Developers, testers, writers, implementers and most of all users can make valuable contributions.
Whether you are a developer who's implementing the platform or a business analyst who needs to solve a particular problem while using it.
3.3.1 Main advantages and disadvantages Pentaho Mondrian has some basic features which allows business users to analyze large amount of data. But at the same time Pentaho Mondrian is a paid version. 3.4 TACTIC Open Source TACTIC is a flexible, open source web based framework used for building a wide variety of enterprise solutions that require Digital Asset Management and Workflow components. Building an end-user TACTIC deployment will usually take time (and other resources) to achieve a fully functioning business solution for any organization.
The TACTIC community site includes downloads, forum discussions and other important information to help you build the exact custom solution that serves specific needs. It is a variable resource for those wishing to build their own solution.
Southpaw Technology does offer professional services to support the development, deployment and maintenance of your custom solution.
3.4.1 What is TACTIC workflow? Work orders and deliverables: Manage your digital assets by creating work orders. Break projects into work orders with multiple deliverables. Each deliverable defines its own workflow with tasks, processes and digital assets.
Business process mapping: Visually create workflows using a built-in workflow editor. Interactively connect tasks with automated processes, key approvals and conditional requirements which together define the way you work.
Integrated workflow engine: The workflow engine is a workflow management system that drives the project using the defined workflow created in the Visual Workflow Editor.

BUSINESS INTELLIGENCE TOOLS 38
STATISTICS MODULE SHIVA KUMAR
Asset Tracking: Manage uploaded files in a digital library, a repository of finished assets. Work on assets using work orders and deliverables and publish completed assets back the Asset library.
Data Ingetion: Immediately batch import assests which automatically extract important meatadata. Asset organization with keywords, custom folders and collections can be created afterwards.
Business Intelligence tool: Focus on improving corporate performance with business process management features like built in reports and dashboards. Visualize, understand and act on the data you have.
3.4.2 Main advantages and disadvantages
TACTIC has been built to perform in highly complex infrastructures. At the same time, it doesn’t have much advanced features and most importantly it is a paid version.

39
<TÍTULO DA TESE> <NOME DO AUTOR>
SELECTING AN ADEQUATE BI
TOOL
4.1 COMPARISON BETWEEN DIFFERENT BI TOOLS
4.2 INSTALLING PENTAHO AND SPAGOBI TOOLS


SELECTING AN ADEQUATE BI TOOL 41
STATISTICS MODULE SHIVA KUMAR
4. SELECTING AN ADEQUATE BI TOOL This is the chapter where the main contributions of this work are presented. We begin by presenting the results of a comparative study among the 4 BI tools referred in the previous chapter. Next, we suggest, based on the comparative study, the best BI tools. The process of installing of the best 2 BI tools is described, presenting a reasoned choice of the BI tool to articulate with iPortalDoc. Finally, a description of the different types of databases supported by the BI tool is made.
4.1 COMPARISON BETWEEN DIFFERENT BI TOOLS Which is the best Business Intelligence (BI) tool? What makes it the best one? What do existing customers think of BI tools? Is the best business intelligence software also the right one for my business? Which criteria is the most important when comparing BI tools? Is superior functionality the main factor to consider?
Comparing BI tools is not an easy task [13]. Especially since there are so many business intelligence products in the market, all are promising, they will deliver all sorts of business benefits while the same time solving all manner of problems. Naturally, companies searching for a new business intelligence tool can become overwhelmed with all the choices and promises from vendors.
Below are the details about the features of different BI tools. Considering that features plays important role in selecting the best BI tool.

SELECTING AN ADEQUATE BI TOOL 42
STATISTICS MODULE SHIVA KUMAR
Table 1 - An overview of the features of the BI tools
Table 2 - Pricing of BI suite
Pricing
Pentaho Community Edition Free trial and paid version
Spago BI Free trial and free version
TACTIC Open source Free trail and paid version
Mondrian Free trail and paid version
Pentaho
Spago BI TACTIC Open
Mondrian
Feature 1 OLAP OLAP Budget Management
OLAP
Feature 2 Business Analytics
Reporting Bug Tracking Automated Aggression
Feature 3 Big data Analytics
Collaboration Collaboration J2EEE
Feature 4 Embedded Analytics
KPI's File sharing JDBC Data source
Feature 5 Cloud Analytics Charts Gantt charts
MDX and XML/A
Feature 6 Ad-Hoc Reporting
Ad-Hoc Reporting Idea Management 100% JAVA
Feature 7 Data Integration Location Intelligence
Milestone Tracking Interactive data
Feature 8 Predictive Analysis
Free Inquiry Resource Management
Ability to Slice and dice
Feature 9 User friendly interface
Data mining Status Tracking Drill down and Pivot
Feature 10 Ad hoc Analysis ETL Testing/QA Management
Ad hoc Analysis
Feature 11 Customizable features
Interactive cockpits
Project Management
Speed of thought
Feature 12 Performance Measurements
Office Automation
Percent-Complete Tracking

SELECTING AN ADEQUATE BI TOOL 43
STATISTICS MODULE SHIVA KUMAR
Table 3 - Comparison of BI tools with 14 important features
[1] [2] [3] [4] [5] [6] [7] [8] [9] [10] [11] [12] [13]
[14] Total
Pentaho
11
Spago BI 11
TACTIC 4
Mondrian 8
[1] Paid edition [2] Open source [3] Key Performance Indicators(KPI’s) [4] Charts [5] OLAP(Online Analytical Processing [6] Ad hoc reports [7] Ranking reports [8] Dashboards [9] Reporting [10] What-if analysis [11] Mapping applications [12] Intelligence alerts [13] Big data analysis [14] Collaboration According to Table 3, the tools Pentaho Community Edition and Spago BI present 11 of the 14 characteristics evaluated. The tool TACTIC Open source presents only 4 of these 14 characteristics, while BI tool Mondrian presents 8 of the 14 characteristics. Considering these results, out of the 4 BI tools, the SpagoBI and Pentaho are considered as the better ones than other two. Hence, both softwares are installed on IPBRICK OS to select an adequate out of these two practically. Sometimes the tool having greatest features may not be perfect after connecting with the database, so it is better to install both and compare how they work after installation just for making sure for not getting any trouble in the future. Finally, SpagoBI is an adequate BI tool over Pentaho because it is a free version.
4.2 INSTALLING PENTAHO AND SPAGOBI TOOLS In this section we present the steps allowed in the process of installing the tools Pentaho and SpagoBI on Linux Ubuntu. We decided to present the installation process in the form of a flow chart because they help visualize what is going on and thereby help understand a process in a easy way.
4.2.1 Installing Pentaho BI tool on Linux Ubuntu The following flowchart shows the steps followed in the process of installing the tool Pentaho on Linux Ubuntu. The installation guidelines were obtained [14]

SELECTING AN ADEQUATE BI TOOL 44
STATISTICS MODULE SHIVA KUMAR
Figure 18 - Flowchart of installation of Pentaho
Update server to latest version
Install
PostgreSQL
Prepare JAVA environment
Set up JAVA environment
Install
Pentaho BI
Run Pentaho
PostgreSQL
scripts
Start Pentaho BI server

SELECTING AN ADEQUATE BI TOOL 45
STATISTICS MODULE SHIVA KUMAR
4.2.2 Installing SpagoBI BI tool on Linux Ubuntu The following flowchart shows the steps followed in the process of installing the tool SpagoBI on Linux Unbuntu. The installation guidelines were obtained in [15].
Figure 19- Flowchart of installation of SpagoBI
4.2.3 Performance of the Two BI tools: A comparison After the comparison of features of Pentaho and SpagoBI, both seems to have a similar advanced feature. But after the installation of both BI tools, it is been found that the SpagoBI is more user friendly BI tool than Pentaho. Both BI tools works well with iPortalDoc, in fact Pentaho has slightly advanced features when compare to SpagoBI. If Pentaho was not a paid version, I would have chosen Pentaho as my best BI tool. But Pentaho is a paid version, our aim is to select a free open source. Hence, SpagoBI is an adequate BI tool when compare with Pentaho in all ways.
Update server to latest JAVA
version
Download
SpagoBI 5.0
Modify
Server.xml
Start SpagoBI

SELECTING AN ADEQUATE BI TOOL 46
STATISTICS MODULE SHIVA KUMAR
4.3 Connecting iPortalDoc with SpagoBI In previous section we have indicated SpagoBI as the best BI tool to linking with the document management tool iPortalDoc. It follows from a comparative study between 4 BI tools. In this section we outline the use of Spagobi BI tool with the tool iPortalDoc. 4.3.1 How to add your data source in SpagoBI The steps of the procedure to add data source in SpagoBI are outlined here below. The procedure implemented was based on the information available in [16]. Step1: Login to bi admin >>Resources>>Data source
Figure 20 - Opening page of SpagoBI
Step2: In Data Source area>> Add (right hand top corner)
Figure 21 - Add data source

SELECTING AN ADEQUATE BI TOOL 47
STATISTICS MODULE SHIVA KUMAR
Step3: In Data Source area>> Add PostgreSQL database details (iPortalDoc’s database system):
• Data Source connection string: • Label: dbdoc • Description: New Database • Dialect: PostgreSQL • Choose: Read only • Choose: JDBC • Url: jdbc:postgresql://172.31.4.15:5433/dbdoc • User: Userdbdoc • Password: linux4fbill • Driver: org.postgresql.Driver
Figure 22 - Database details
Step4: After updating all the required above values. Test your data source value by clicking T button at the top most right on SpagoBI.

SELECTING AN ADEQUATE BI TOOL 48
STATISTICS MODULE SHIVA KUMAR
Figure 23 - Testing Data source
Yes, Data source is tested correctly. Step6: See the below screen shot, your new data source has been created in SpagoBI.
Figure 24 - Creation of new data source

SELECTING AN ADEQUATE BI TOOL 49
STATISTICS MODULE SHIVA KUMAR
Once the new data source has been created in SpagoBI [17], the next step is to create a new data set. To create a new data set open the Data Set menu item under Resources>>Data Providers
Click on button + on the right corner of the Data Set list. Then fill in the data set definition form. SpagoBI supports dataset versioning. Therefore, each time you edit and save a data set, the older version is archived and is still accessible from the lower part of the detail panel.
Figure 25 - Data set menu
Figure 26 - Filling data set definition form
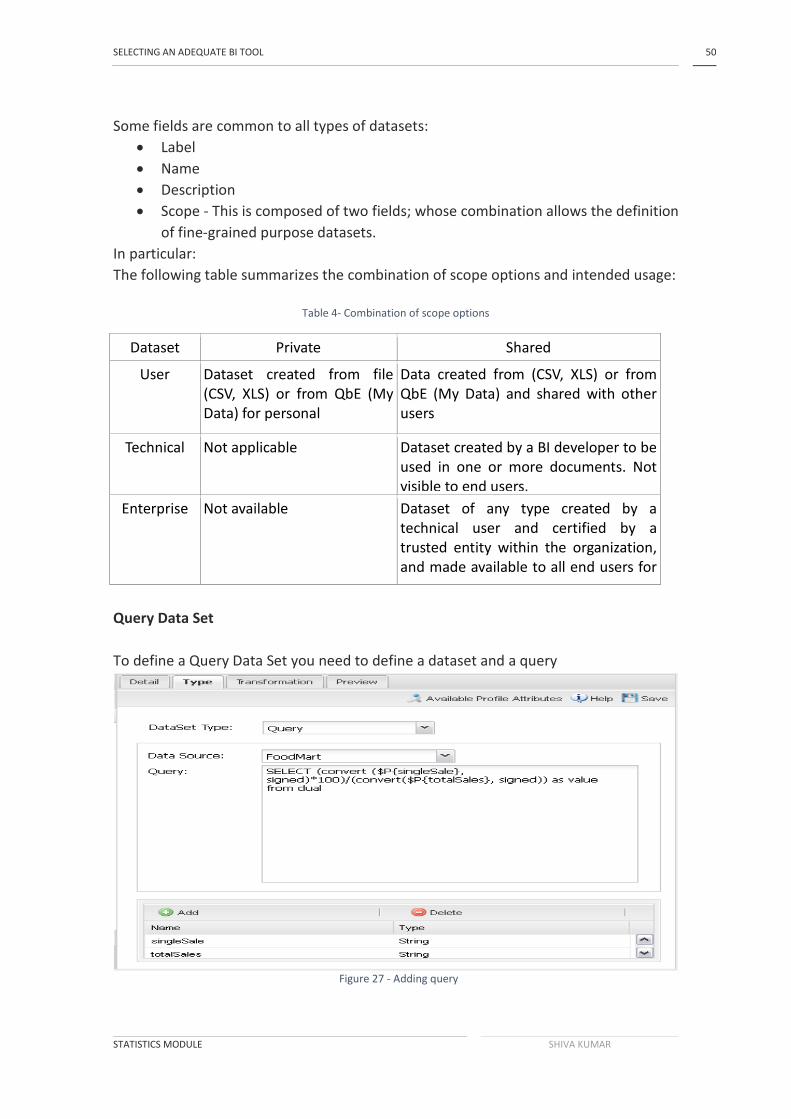
SELECTING AN ADEQUATE BI TOOL 50
STATISTICS MODULE SHIVA KUMAR
Some fields are common to all types of datasets:
• Label • Name • Description • Scope - This is composed of two fields; whose combination allows the definition
of fine-grained purpose datasets. In particular: The following table summarizes the combination of scope options and intended usage:
Table 4- Combination of scope options
Dataset Private Shared
User Dataset created from file (CSV, XLS) or from QbE (My Data) for personal
Data created from (CSV, XLS) or from QbE (My Data) and shared with other users
Technical Not applicable Dataset created by a BI developer to be used in one or more documents. Not visible to end users.
Enterprise Not available
Dataset of any type created by a technical user and certified by a trusted entity within the organization, and made available to all end users for
Query Data Set To define a Query Data Set you need to define a dataset and a query
Figure 27 - Adding query

SELECTING AN ADEQUATE BI TOOL 51
STATISTICS MODULE SHIVA KUMAR
Since, SpagoBI 5.0 it is also possible to define together with the base query a script that will be executed to modify the query at run time just before its execution. The script can be defined in JavaScript or in Groovy. The base query is bounded to the execution context of the script (variable query) together with its parameters (variable parameters) and the profile attributes of the user that are executing the dataset (variable attributes).
Query = query.replace(“LIMIT 5”,“LIMIT” + parameters.get('limit'));
Query.replace(“1name, fname”,”1name, fname, '[” + attributes.get('family') + “]'”);
Where base query is
SELECT 1name, fname
FROM customer
LIMIT 5
Query Data Set(Mongo)
The steps to create a Mongo dataset are:
Step1: Create a Mongo data source in the administrator console. Notes: the type must be JDBC and the value for class input field must be “Mongo”
JDBC: {unit_host}:{port}/${db}
CLASS: mongo
Step2: Now you can create a dataset. The procedure is the same as the datasets. The difference here is language.. JS instead of SQL. The script must respect some convention, in particular:
• The return value of the query must be assigned to a variable with name “query”. For example

SELECTING AN ADEQUATE BI TOOL 52
STATISTICS MODULE SHIVA KUMAR
var query = db.store.find();
• If the return value doesn't come from a query, for example it is a JS variable with name “sbiDatasetfixedResult”. The result will be managed by SpagoBI accordingly to the type of variable:
• If it is a primitive type the resulting dataset contains only a columns with name “result” and value equal to the value of the sbiDatasetfixedResult.
• If it is an object, the resulting dataset contains a column for each property of the object. Example:
Query
sbiDatasetfixedResult = {a:2, b:3}
Data Set
a b
2 3
• If it's a list then columns of the dataset are the union of the properties of all the objects contained in the list. Example:
Query
sbiDatasetfixedResult = [ {a:2 , b:3},{a:2, c:3}]
Data Set
a b c
2 3
2 3

SELECTING AN ADEQUATE BI TOOL 53
STATISTICS MODULE SHIVA KUMAR
The result of query in MongoDB can assume different shapes: Cursor, Document, List, fix value. SpagoBI can manage automatically the result of the query. The algorithm to understand how to manage the result is very simple
• If in the query it finds the variable sbiDatasetfixedResult the result will be managed as described as above.
• If in the query it finds a findOne the result will be managed as a single document.
• If in the query it finds an aggregate the result will be managed as an aggregation.
• In the either cases the result will be managed as a cursor. It's possible to force the behaviour. In particular the result stored in the variable query, will be managed:
• As cursor if in the script exist a variable with value LIST_DOCUMENT_QUERY. Example:
var retVal= “LIST_ DOCUMENTS_QUERY” • A document if in the script exist a variable with value
SINGLE_DOCUMENT_QUERY. Example var retVal= “SINGLE_ DOCUMENT_QUERY” Script Data Set To define script dataset you need to select the script language you want to use and write the script.
Figure 28-Script type

SELECTING AN ADEQUATE BI TOOL 54
STATISTICS MODULE SHIVA KUMAR
The script must be written using Groovy or Javascript languages. It must return an XML string containing a list of values with the syntax shown below. If the script instead returns a single value this is automatically enveloped in such XML. <ROWS>
<ROWS value=”value1” … />
<ROWS value=”value2” … />
…</ROWS>
SpagoBI provides some Groovy and Javascripts functions that can be used to return the value of a single or multi-value profile attribute. These functions are explained in the information window that can be opened from the dataset type tab. New custom function can be added in files predefinedGroovyScript.groovy and predefinedJavascript.js contained in the SpagoBIUtils.jar.
Starting SpagoBI 5.0 dataset parameters and all profile attributes of the user that are executing the dataset are bounded in the context of the script(variable parameters and variable attributes).
if(parameters.get('unitsSold') > attributes.get('personalTarget')) {
'OK'; } else { 'KO';
} File Data Set A dataset of type file reads data from an XLS or CSV file. O define a File Data Set select the File type, then upload the file and set the proper options for parsing it.
Figure 29 - File data set

SELECTING AN ADEQUATE BI TOOL 55
STATISTICS MODULE SHIVA KUMAR
Java Class Data Set To define a Java Class Data Set you need to define the java class that you want to use.
Qbe Data Set To define Qbe Data Set you need define the Data Source and Datamart that you want to use.
Figure 31 - Qbe data set
Figure 30 - Java class data set

SELECTING AN ADEQUATE BI TOOL 56
STATISTICS MODULE SHIVA KUMAR
Once chosen your Datamart you can click on the lookup button of the Qbe query field and a pop up window will appear showing a Qbe interface where you can easily define your query.
Flat Data Set A flat data set allows the retrieval and storage of an entire table from a data source. In other words, it replaces a dummy query like “select * from sales” by automatically retrieving all rows in the table. To create a flat dataset, simply enter the table and the data source name, as shown below:
Figure 32 - Query editor
Figure 33 - File data set

SELECTING AN ADEQUATE BI TOOL 57
STATISTICS MODULE SHIVA KUMAR
Parameters and profile attributes Parameters and profile attributes in SQL statements In a Data Set you can insert parameters or profile attributes, both single and multi-value. The correct syntax to insert a parameter or a profile attribute in a query or a script is the following one:
$P{name of the parameter}
While the syntax to insert a profile attribute is:
${name of the attribute}
As far as multi-value attributes are concerned, the behaviour is different if the user is defining a query or a script.
When inserting a parameter into a query or a script; the parameter must also be inserted in the table in dataset definition (in “type” tab), specifying its name (“parameter_ name” in the example above) and it types.
Possible type are:
• String: provides to add single quote (') at the beginning and end of the past value, if not already present.
• Number: The value is validated as the number; a number Format exception is throwed if it can be converted
• Raw: provides to remove single (') quote if present.
• Generic: The value is passed to the engine without any modification.
Note: For multi-value parameter (especially if they are STRING type), is better to specify the correct values configuration into the statement with the next syntax:
$P{<name of the parameter>(prefix;split_char;suffix)}
For example:
SELECT FAMILY, STORE ROOM … WHERE FAMILY IN ($Par_family (';,;')})
In this case the final statement will be:
SELECT FAMILY, STORE ROOM … WHERE FAMILY IN ('Drink','Food').

SELECTING AN ADEQUATE BI TOOL 58
STATISTICS MODULE SHIVA KUMAR
Parameters in Qbe datasets
Open the Qbe wizard and click on “Add” button on the “Parameters”
box in bottom-right corner: you have to specify the name of the parameter and the type. Then you can drag & drop it into a filter within the query designer panel. When previewing the query result, the Qbe wizard will ask you the value to be considered for the parameter. When closing the Qbe wizard, the parameters definition will be inherited at the dataset definition level, so you don't have to define them again. Last step: when using the dataset within an analytical document, you have to assign the document, you have to assign the document an analytical driver providing the parameter's name as the URL name for the document parameter.
Transformations You can use directly the result of the dataset, or you can process it. At the moment the unique transformation available is the pivot one.
This Operation allows you to switch rows and columns of your result set:
Figure 34 - Transformation type

SELECTING AN ADEQUATE BI TOOL 59
STATISTICS MODULE SHIVA KUMAR
Figure 35 - Result set
Sometimes this is necessary in order to execute correctly some document types like the charts. Eventually, it is possible to require an automatic numeration for the output column by clicking on 'Numbered column' check box. (i.e It can return columns called x1,y1,x2,y2,...where 'x' and 'y' are the names of the original columns). Advanced (persistent datasets) This tab is used to make a dataset persistent, i.e, to write it on default database. Making a dataset persistent may be useful in case dataset calculation takes a considerable amount of time. Instead of recalculating the dataset each time the document using it is executed, the dataset is calculated once and then retrieved from a table to improve performance.
In order to force the recalculation of the dataset, you should execute dataset preview again. This will store the newly generated data on database table.
Figure 36 - Persistent data set
Result You can see the result of your Data Set by going to the last tab called preview. There you can fill in eventually parameter values and then click on previous button.

SELECTING AN ADEQUATE BI TOOL 60
STATISTICS MODULE SHIVA KUMAR
Figure 37 - Preview
A pop up like the following one will appear with the result of your Data Set.
Figure 38 - Result of data set

61
<TÍTULO DA TESE> <NOME DO AUTOR>
ABOUT THE USE OF SPAGOBI
WITH IPORTALDOC
5.1 After the installation of SpagoBI BI suite(User Manual- Working on SpagoBI with iPortalDoc)


ABOUT THE USE OF SPAGOBI WITH IPORTALDOC 63
STATISTICS MODULE SHIVA KUMAR
5 About the use of SpagoBI with iPortalDoc In this final chapter we give a brief introduction to some statistical methodologies available in the tool SpagoBI. We also illustrate how this BI tool can be used jointly with the iPortalDoc, in to respect to statistical analysis. 5.1 After the installation of SpagoBI BI suite (User Manual- Working of SpagoBI
with iPortalDoc) After connecting to iPortalDoc’s database system [18], log in to iPortalDoc by an username and password as shown in the below figure
Figure 39 - Logging in iPortalDoc
Once the login is done, iPortalDoc will direct us to a window where modules are selected, then statistics and then either documents or workflows as shown in below figure.

ABOUT THE USE OF SPAGOBI WITH IPORTALDOC 64
STATISTICS MODULE SHIVA KUMAR
Figure 40- Selecting modules
For example, consider the “Documents” option. In this scenario, a window (Figure 40) will appear where the search fields should be completed according the needs.
Figure 41- Filling search fields
After filling the search fields, click on generate option on the right hand top end of the window produces a bar chart result for the interest period as shown in the figure 41. Despite this bar chart we have lot of other charts as well SpagoBI.

ABOUT THE USE OF SPAGOBI WITH IPORTALDOC 65
STATISTICS MODULE SHIVA KUMAR
Figure 42- Bar chart result
To check the queries of this output in iPortalDoc’s log which we need to enter inside the SpagoBI suite to get the result for the same.
To check query: Open the Konsole, enter your domain.
Type “vi /opt/dbdoc/log/iportaldoc.log”.
The statistics query should be searched as shown in the figure below.
Figure 43 - iPortalDoc log
The next step is to open the SpagoBI suite and select dataset option inside resources menu on left-hand corner and will fill the required fields to create a database by selecting the type as ‘query’ (Figure 43).
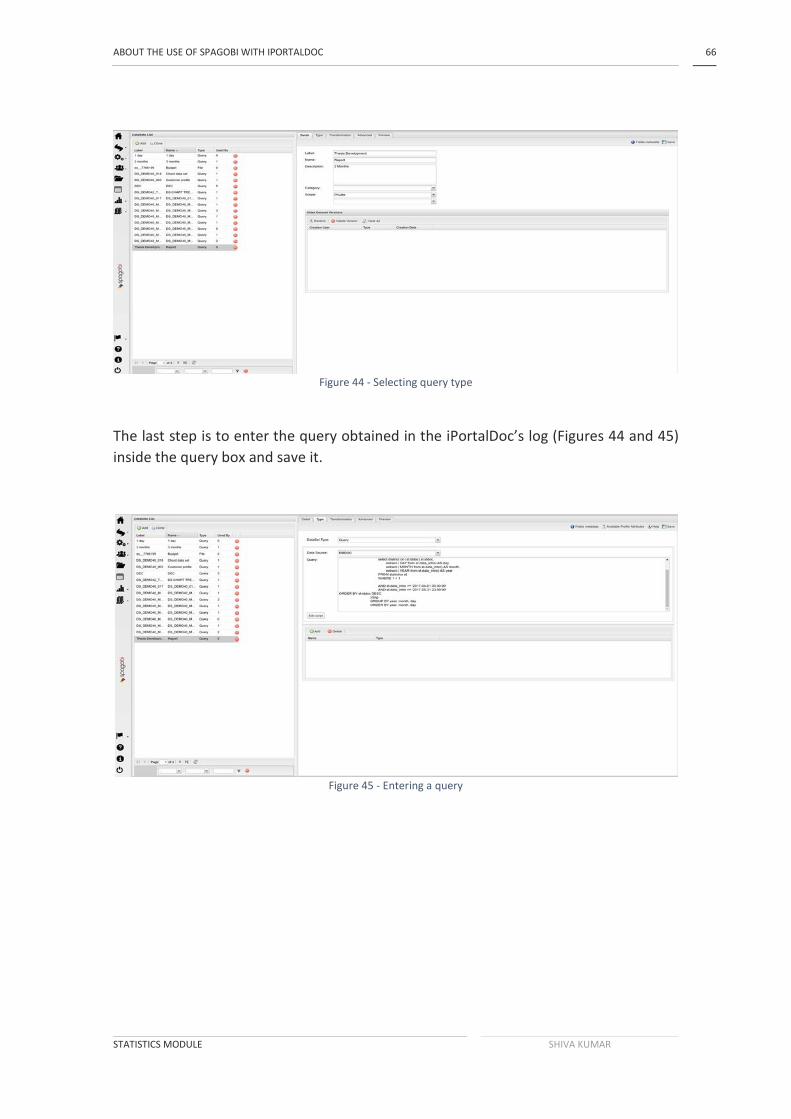
ABOUT THE USE OF SPAGOBI WITH IPORTALDOC 66
STATISTICS MODULE SHIVA KUMAR
Figure 44 - Selecting query type
The last step is to enter the query obtained in the iPortalDoc’s log (Figures 44 and 45) inside the query box and save it.
Figure 45 - Entering a query

ABOUT THE USE OF SPAGOBI WITH IPORTALDOC 67
STATISTICS MODULE SHIVA KUMAR
The save operation will be confirmed with a notified message ‘Operation succeeded’.
Figure 46 - Operation Succeeded
Change the field materials to measure from attribute (by default) which ever quantity you would like to measure.
Figure 47 - Changing fields materials

ABOUT THE USE OF SPAGOBI WITH IPORTALDOC 68
STATISTICS MODULE SHIVA KUMAR
By pressing the preview menu at the top, you will get a preview according to your information entered.
Figure 48 - Preview according to your information entered
Click on the folder menu (Document development) on the left side of the screen, go to create document and then click on cockpit as shown in the figures 48 and 49.
Figure 49- Document development
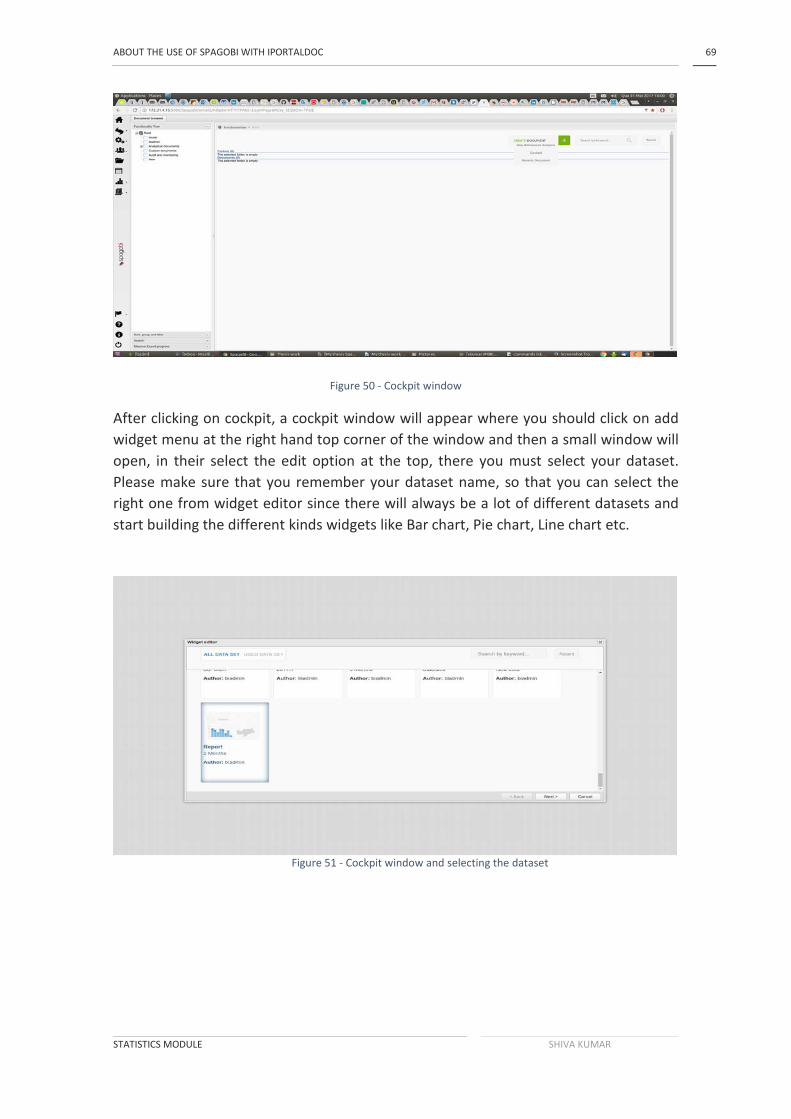
ABOUT THE USE OF SPAGOBI WITH IPORTALDOC 69
STATISTICS MODULE SHIVA KUMAR
Figure 50 - Cockpit window
After clicking on cockpit, a cockpit window will appear where you should click on add widget menu at the right hand top corner of the window and then a small window will open, in their select the edit option at the top, there you must select your dataset. Please make sure that you remember your dataset name, so that you can select the right one from widget editor since there will always be a lot of different datasets and start building the different kinds widgets like Bar chart, Pie chart, Line chart etc.
Figure 51 - Cockpit window and selecting the dataset

ABOUT THE USE OF SPAGOBI WITH IPORTALDOC 70
STATISTICS MODULE SHIVA KUMAR
Once the selected dataset which we like to see the results in different kinds of charts, which are available on custom configuration menu as shown below.
Below figure is an example of an overview of different types of widget available on SpagoBI based on the information or query entered inside the selected dataset.
Figure 52 - Custom configuration
Figure 53 - Overview of different kinds of charts

71
<TÍTULO DA TESE> <NOME DO AUTOR>
CONCLUSIONS
6.1 CONCLUSIONS
6.2 PROPOSALS FOR FUTURE WORKS


CONCLUSIONS AND PROPOSALS FOR FUTURE WORK 73
STATISTICS MODULE SHIVA KUMAR
6 CONCLUSIONS AND PROPOSALS FOR FUTURE WORK 6.1 CONCLUSIONS
Business Intelligence requires business analysts to gather, merge, and analyze considerable amounts of information in multiple formats and from heterogeneous sources. Information extraction technology is a key to identify in text key places of information to be used in BI tools.
The real business value for an organization to deploy a packaged BI Application solution is high. The question of whether to build or buy this application depends on several criteria. Given the cost, time-to-market, complexity and other factors involved to implement a robust and scalable BI Application solution that will meet current and future needs, the posit is to purchase a pre-built BI Application.
After comparing the features of various tools available in the market and select one or two best free and open sources having advanced and user-friendly features. Once, we install two of the BI tools that are having advanced features by looking at their features, which allows us to see the response of the BI suite with our database (iPortalDoc).
On this basis, it is recommended that SpagoBI (Business Intelligence) suite is having the advanced and user-friendly features when compare with others (Pentaho).
6.2 PROPOSALS FOR FUTURE WORKS Many executives now see business intelligence, or its abbreviated acronym BI, as a key buzzword. What does this mean the future of business?
Let’s start with the size of the business intelligence market. Just a year ago, experts were projecting a need for an additional 1.5 million data handling business intelligence professionals, just in the U.S., with a projected business intelligence and analytics market of over $20 billion within three years. Since then, we have seen some of these numbers borne out in the rapid trend towards business intelligence adoption.
With business intelligence tools so front and center in today’s marketplace, what will see happen to this sort of popular business methodology as we move forward into 2017 and beyond?

CONCLUSIONS AND PROPOSALS FOR FUTURE WORK 74
STATISTICS MODULE SHIVA KUMAR
• Collaborative Business Intelligence • Business Intelligence Actualization will drive insight and self-service • Data “Proactivity” – More passive users • Networks Advancements.

CONCLUSIONS AND PROPOSALS FOR FUTURE WORK 75
STATISTICS MODULE SHIVA KUMAR
REFERENCES AND OTHER
SOURCES OF INFORMATION
7.1 PAPERS IN INTERNATIONAL JOURNALS

REFERENCES AND OTHER SOURCES OF INFORMATION 76
STATISTICS MODULE SHIVA KUMAR

REFERENCES AND OTHER SOURCES OF INFORMATION 77
STATISTICS MODULE SHIVA KUMAR
7 REFERENCES AND OTHER SOURCE OF INFORMATION
1. DBMS. “Definition of DBMS” [Online] Available: http://searchsqlserver.techtarget.com/definition/database-management-system Accessed on 18-08-2017.
2. iPortalDoc. “iPortalDoc document management system” [Online] Available: http://www.ipbrick.com/iportaldoc-document-management-software/. Accessed on 20-08-2017
3. BI tools. “40 Open and free Business Intelligence softwares” [Online] Available: http://www.predictiveanalyticstoday.com/open-source-free-business-intelligence-solutions/. Accessed on 20-08-2017
4. Pentaho. “Pentaho Business Intelligence suite features” [Online] Available: http://www.pentaho.com/product/product-overview. Accessed on 22-08-2017
5. Data Integration “Data Integration information Pentaho” [Online] Available: http://www.pentaho.com/what-is -data-integration. Accessed on 22-08-2017
6. SpagoBI. “Overview of a SpagoBI Business Intelligence suite” [Online] Available: http://www.spagobi.org/. Accessed on 23-08-2017
7. KPI. “More examples of Key Performance Indicators” [Online] Available: http://www.klipfolio.com/resources/kpi-examples. Accessed on 24-08-2017
8. OLAP. “More information about Online Analytical Processing” [Online] Available: http://searchdatamanagement.techtarget.com/definition/OLAP. Accessed on 28-08-2017
9. eBAM. “extended Business Activity Monitoring” [Online] Available: http://www.eclipse.org/ebam/. Accessed on 30-08-2017
10. GIS. “Geographical Information Systems” [Online] Available: http://gisgeography.com/what-gis-geographic-information-systems/ . Accessed on 30-08-2017
11. OGC “Open Geospatial Consortium” [Online] Available: http://www.opengeospatial.org . Accessed on 30-08-2017
12. Mondrian. “Mondrian Business Intelligence suite features [Online] Available: http://community.pentaho.com/projects/mondrian/. Accessed on 02-09-2017
13. Comparison. “Business Intelligence tool comparison” [Online] Available: http://bi-servey.com/business-intelligence-software-comparison. Accessed on 03-09-2017

REFERENCES AND OTHER SOURCES OF INFORMATION 78
STATISTICS MODULE SHIVA KUMAR
14. Installation. “Install and configure Pentaho BI suite 5.1 CE on Linux” [Online] Available: http://www.schenkels.nl/2014/08/how-to-install-and-configure-pentaho-bi-suite-5-1-ce-ubuntu-14-04-postgresql-9-3/. Accessed on 04-09-2017
15. Installation. “Install and configure SpagoBI Business Intelligence Suite on Linux” [Online] Available: http://www.2daygeek.com/install-spagobi-business-intelligence-suite-on-ubuntu-centos-debian-fedora-mint-rhel-opensuse/. Accessed on 05-09-2017
16. Data source. “How to add a data source in SpagoBI” [Online] Available: http://www.2daygeek.com/how-to-add-data-source-in-spagobi/. Accessed on 04-09-2017
17. Types. “Two types of data sources available in SpagoBI” [Online] Available: http://wiki.spagobi.org/xwiki/bin/view/spagobi_server/data_set#H<del>WebServiceDataSet</del>2ADEPRECATED2A. Accessed on 05-09-2017
18. Manual. “SpagoBI user manual” [Online] Available: http://download.forge.ow2.org/spagobi/SpagoBI_suite-User_Manual_5.x.pdf. Accessed on 06-09-2017
19. Videos. “IPBrick and iPortalDoc videos to understand practically” [Online] Available: http://www.youtube.com/channel/UCRkd8bSF8nDDxCjNXUJ9tqQ. Accessed on 08-09-2017
20. BI tools. “54 best Business Intelligence tools” [Online] Available: http://www.docurated.com/all-things-productivity/50-best-busines-intelligence-tools. Accessed on 10-09-2017
21. One solution. “Document management Business Processes and communication in one solution” [Online] Available: https://www.ipbrick.com/iportaldoc-document-management-software/. Accessed on 11-09-2017
22. Demo. “SpagoBI suite demo” [Online] Available: https://demo.knowage-suite.com/knowage/servlet/AdapterHTTP?PAGE=LoginPage&NEW_SESSION=TRUE#. Accessed on 12-09-2017
23. Linux commands. “Most frequently used Linux commands” [Online] Available: http://www.thegeekstuff.com/2010/11/50-linux-commands/?utm_source=feedburner. Accessed on 13-09-2017
24. Top. “Top Business Intelligence tools available in market” [Online] Available: http://bigdata-madesimple.com/top-business-intelligence-bi-tools-in-the-market/. Accessed on 14-09-2017

REFERENCES AND OTHER SOURCES OF INFORMATION 79
STATISTICS MODULE SHIVA KUMAR
25. DBMS. “Need for Database Management Systems” [Online] Available: http://searchsqlserver.techtarget.com/definition/database-management-system. Accessed on 14-09-2017
26. IPBrick. “IPBrick usage visuals” [Online] Available: https://www.youtube.com/user/ipbrickinternational. Accessed on 16-09-2017
27. iPortalDoc. “More information about iPortalDoc” [Online] Available: http://www.ipbrick.com/iportaldoc/. Accessed on 16-09-2017
28. SpagoBI. “SpagoBI freelancers” [Online] Available: https://www.upwork.com/o/profiles/browse/?q=spagobi. Accessed on 17-09-2017
29. Demo. “Pentaho Online Demo” [Online] Available: http://www.pentaho.com/resource/pentaho-online-demo. Accessed on 18-09-2017
30. Open demos. “Pentaho Open demos” [Online] Available: http://community.pentaho.com/ctools/knowledge/cde-open-demos/. Accessed on 19-09-2017
31. Self demo “SpagoBI self demo” [Online] Available: https://www.youtube.com/watch?v=of9nPTrY1Pc. Accessed on 20-09-2017
32. Technical. “SpagoBI technical features” [Online] Available: http://www.stratebi.com/en_GB/spagobi. Accessed on 21-09-2017
33. Analysis. “Business Intelligence news and analysis” [Online] Available: http://www.computerworld.com/category/business-intelligence/. Accessed on 22-09-2017
34. Reporting. “Interactive reporting Business Intelligence suite” [Online} Available: http://www.interactivereporting.com/?gclid=CjwKCAjw47bLBRBkEiwABh-PkUZN1YB0vM2KVy13JF1yds0mjK1p67q9nCoFTCSlg4VbPrZhSUPQYxoCxWAQAvD_BwE. Accessed on 23-09-2017
35. Analytics. “Business Intelligence and analytics in 2017” [Online] Available: https://www.forbes.com/sites/louiscolumbus/2017/02/26/business-intelligence-and-analytics-in-the-cloud-2017/#59e2ebb2a289. Accessed on 24-09-2017
36. Trends. “Trends of Business Intelligence suites 2017” [Online] Available: https://bi-survey.com/top-business-intelligence-trends-2017. Accessed on 24-09-2017

REFERENCES AND OTHER SOURCES OF INFORMATION 80
STATISTICS MODULE SHIVA KUMAR
37. Dashboards. “SpagoBI tutorials dashboards and High charts” [Online] Available: https://spagolabs.wordpress.com/2013/04/25/spagobi-lesson-3-highchart-dashboards/. Accessed on 25-09-2017
38. Comparison “Pentaho vs SpagoBI comparison IT central station” [Online] Available: https://www.itcentralstation.com/products/comparisons/pentaho_vs_spagobi. Accessed on 26-09-2017
39. Summary. “SpagoBI vs Pentaho Comparison summary” [Online] Available: https://siftery.com/product-comparison/spagobi-vs-pentaho. Accessed on 28-09-2017
40. Commands. “Important Linux commands” [Online] Available: https://www-uxsup.csx.cam.ac.uk/pub/doc/suse/suse9.0/userguide-9.0/ch24s04.html. Accessed on 03-10-2017
41. IBM. “IBM iPortalDoc” [Online] Available: https://www.ibm.com/us-en/marketplace/4581. Accessed on 04-10-2017
42. iPortalDoc. “iPortalDoc Document and Process management” [Online] Available: http://edicopia.pt/iportaldoc-gestao-de-documentos-e-processos/. Accessed on 06-10-2017
43. OLAP tube. “SpagoBI OLAP tube” [Online] Available: https://www.youtube.com/watch?v=b9wfJqYtlCI. Accessed on 07-10-2017
44. Pentaho. “100 Pentaho Integration videos” [Online] Available: http://meta-guide.com/videography/100-best-pentaho-integration-videos. Accessed on 08-10-2017
45. Tutorials. “Linux Essential Tutorials” [Online] Available: https://factorpad.com/tech/linux-essentials/index.html?gclid=CjwKCAjw47bLBRBkEiwABh-Pke3hfHN1UtUTA2DBYZjfYVl6E05ahLmKQLBvC9EmlBu7n75VibLhTRoCucIQAvD_BwE. Accessed on 10-10-2017
46. Linux shell. “Learning tutorial for Linux Shell” [Online] Available: http://linuxcommand.org/. Accessed on 13-10-2017

REFERENCES AND OTHER SOURCES OF INFORMATION 81
STATISTICS MODULE SHIVA KUMAR
7.1 PAPERS IN INTERNATIONAL JOURNALS My thesis argues that Business Intelligence tools available in the market are not all free and open source, should identify the free and open source that has a lot of advanced features and also comparing with each other allows to judge the best one for iPortalDoc.
The real challenge was to identify the one that best responds to iPortalDoc needs and to adapt iPortalDoc statistics module. Eventually, was identified installing the selected software’s into the IPBrick OS and connecting them to the iPortalDoc’s database. Although, Pentaho has some advanced features compare to SpagoBI, it isn’t a free and open source.

REFERENCES AND OTHER SOURCES OF INFORMATION 82
STATISTICS MODULE SHIVA KUMAR

STATISTICS MODULE SHIVA KUMAR
ANNEXES

ANNEXES 84
STATISTICS MODULE SHIVA KUMAR
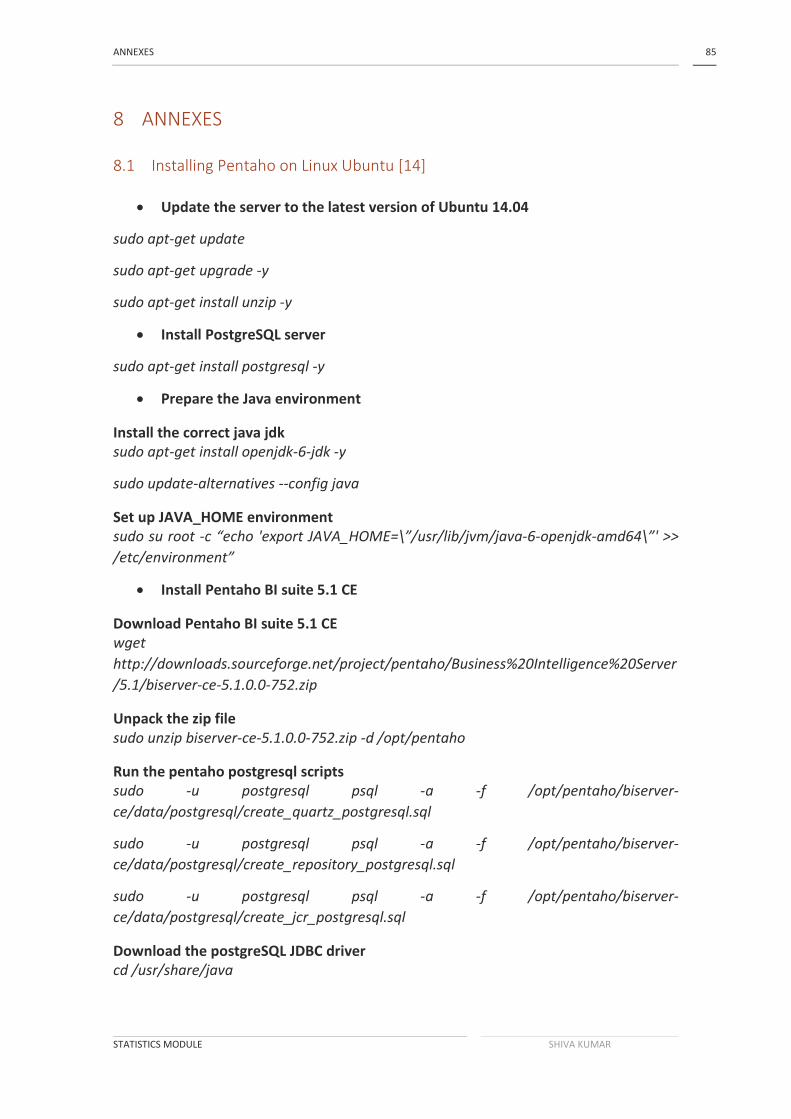
ANNEXES 85
STATISTICS MODULE SHIVA KUMAR
8 ANNEXES 8.1 Installing Pentaho on Linux Ubuntu [14]
• Update the server to the latest version of Ubuntu 14.04
sudo apt-get update
sudo apt-get upgrade -y
sudo apt-get install unzip -y
• Install PostgreSQL server
sudo apt-get install postgresql -y
• Prepare the Java environment
Install the correct java jdk sudo apt-get install openjdk-6-jdk -y
sudo update-alternatives --config java
Set up JAVA_HOME environment sudo su root -c “echo 'export JAVA_HOME=\”/usr/lib/jvm/java-6-openjdk-amd64\”' >> /etc/environment”
• Install Pentaho BI suite 5.1 CE
Download Pentaho BI suite 5.1 CE wget http://downloads.sourceforge.net/project/pentaho/Business%20Intelligence%20Server/5.1/biserver-ce-5.1.0.0-752.zip
Unpack the zip file sudo unzip biserver-ce-5.1.0.0-752.zip -d /opt/pentaho
Run the pentaho postgresql scripts sudo -u postgresql psql -a -f /opt/pentaho/biserver-ce/data/postgresql/create_quartz_postgresql.sql
sudo -u postgresql psql -a -f /opt/pentaho/biserver-ce/data/postgresql/create_repository_postgresql.sql
sudo -u postgresql psql -a -f /opt/pentaho/biserver-ce/data/postgresql/create_jcr_postgresql.sql
Download the postgreSQL JDBC driver cd /usr/share/java

ANNEXES 86
STATISTICS MODULE SHIVA KUMAR
wget jdbc.postgresql.org/download/postgresql-9.3-1102.jdbc4.jar
Make a symbolic link for naming ln -s postgresql-9.3-1102.jdbc4.jar postgresql-9.3-jdbc4.jar
cd /opt/pentaho/biserver-ce/tomcat/lib
ln -s /usr/share/java/postgresql-9.3-jdbc4.jar postgresql-9.3-jdbc4.jar
• Change Pentaho settings for using PostgreSQL database for backend
Change the pentaho tomcat context.xml file sudo sed -i s/”org.hsqldb.jdbcDriver”/”org.postgresql.Driver”/g/opt/pentaho/biserver-ce/tomcat/webapps/pentaho/META-INF/context.xml
sudo sed -i s/”jdbc:hsqldb:hsql:\/\/localhost\/hibernate”/”jdbc:postgresql:\/\/localhost:5433\/hibernate”/g/opt/pentaho/biserver-ce/tomcat/webapps/pentaho/META-INF/context.xml
sudo sed -i s/”select count(\*) from INFORMATION_SCHEMA.SYSTEM_SEQUENCES”/”select1”/g/opt/pentaho/biserver-ce/tomcat/webapps/pentaho/META-INF/context.xml
sudo sed -i s/”org.hsqldb.jdbcDriver”/”org.postgresqlDriver”/g/opt/pentaho/biserver-ce/tomcat/webapps/pentaho/META-INF/context.xml
sudo sed -i s/”jdbc:hsqldb:hsql:\/\/localhost\/quartz”/”jdbc:postgresql:\/\/localhost:5433\/quartz”/g/opt/pentaho/biserver-ce/tomcat/webapps/pentaho/META-INF/context.xml
sudo sed -i s/”select count(\*) from INFORMATION_SCHEMA.SYSTEM_SEQUENCES”/”select 1”/g/opt/pentaho/biserver-ce/tomcat/webapps/pentaho/META-INF/conext.xml
Change the hibernate config files(hibernate-properties) sudo sed -i s/"org.hsqldb.jdbcDriver"/"org.postgresql.Driver"/g /opt/pentaho/biserver-ce/pentaho-solutions/system/applicationContext-spring-security-hibernate.properties
sudo sed -i s/"jdbc:hsqldb:hsql:\/\/localhost\/hibernate"/"jdbc:postgresql:\/\/localhost:5432\/hibernate"/g /opt/pentaho/biserver-ce/pentaho-solutions/system/applicationContext-spring-security-hibernate.properties
Change the hibernate config fils(hibernate-settings.xml) sudo sed -i s/"system\/hibernate\/hsql.hibernate.cfg.xml"/"system\/hibernate\/postgresql.hibernate.cfg.xml"/g /opt/pentaho/biserver-ce/pentaho-solutions/system/hibernate/hibernate-settings.xml
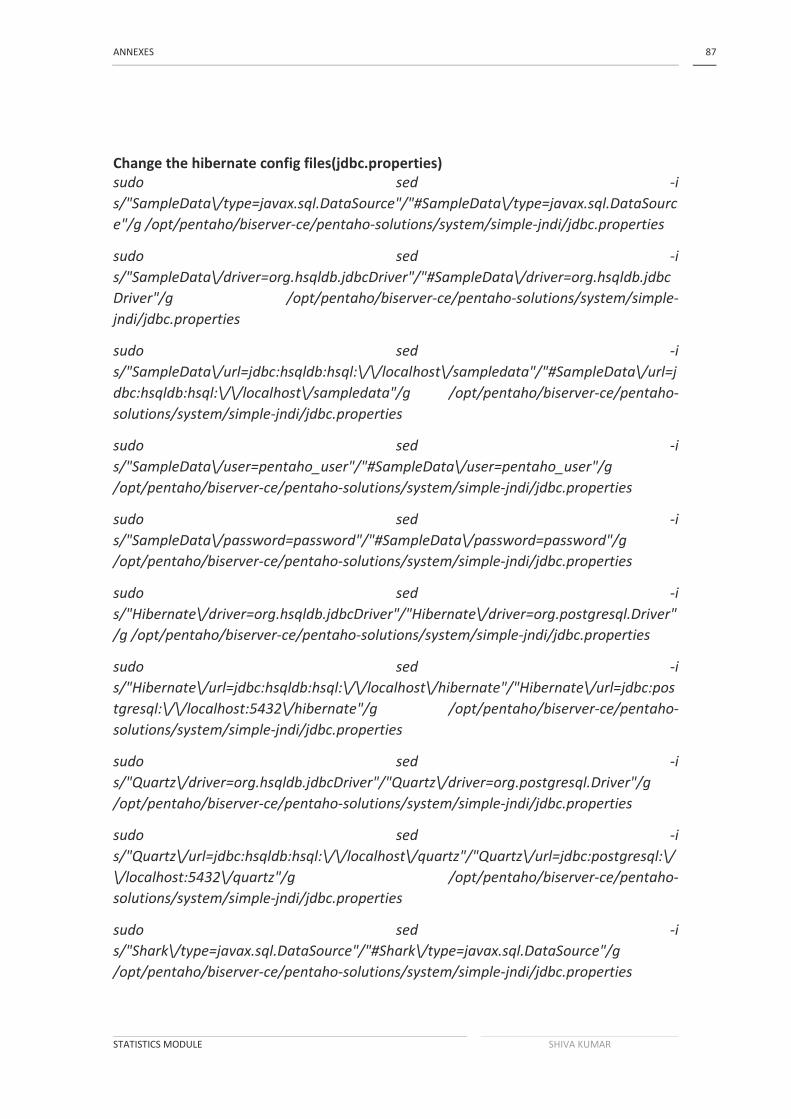
ANNEXES 87
STATISTICS MODULE SHIVA KUMAR
Change the hibernate config files(jdbc.properties) sudo sed -i s/"SampleData\/type=javax.sql.DataSource"/"#SampleData\/type=javax.sql.DataSource"/g /opt/pentaho/biserver-ce/pentaho-solutions/system/simple-jndi/jdbc.properties
sudo sed -i s/"SampleData\/driver=org.hsqldb.jdbcDriver"/"#SampleData\/driver=org.hsqldb.jdbcDriver"/g /opt/pentaho/biserver-ce/pentaho-solutions/system/simple-jndi/jdbc.properties
sudo sed -i s/"SampleData\/url=jdbc:hsqldb:hsql:\/\/localhost\/sampledata"/"#SampleData\/url=jdbc:hsqldb:hsql:\/\/localhost\/sampledata"/g /opt/pentaho/biserver-ce/pentaho-solutions/system/simple-jndi/jdbc.properties
sudo sed -i s/"SampleData\/user=pentaho_user"/"#SampleData\/user=pentaho_user"/g /opt/pentaho/biserver-ce/pentaho-solutions/system/simple-jndi/jdbc.properties
sudo sed -i s/"SampleData\/password=password"/"#SampleData\/password=password"/g /opt/pentaho/biserver-ce/pentaho-solutions/system/simple-jndi/jdbc.properties
sudo sed -i s/"Hibernate\/driver=org.hsqldb.jdbcDriver"/"Hibernate\/driver=org.postgresql.Driver"/g /opt/pentaho/biserver-ce/pentaho-solutions/system/simple-jndi/jdbc.properties
sudo sed -i s/"Hibernate\/url=jdbc:hsqldb:hsql:\/\/localhost\/hibernate"/"Hibernate\/url=jdbc:postgresql:\/\/localhost:5432\/hibernate"/g /opt/pentaho/biserver-ce/pentaho-solutions/system/simple-jndi/jdbc.properties
sudo sed -i s/"Quartz\/driver=org.hsqldb.jdbcDriver"/"Quartz\/driver=org.postgresql.Driver"/g /opt/pentaho/biserver-ce/pentaho-solutions/system/simple-jndi/jdbc.properties
sudo sed -i s/"Quartz\/url=jdbc:hsqldb:hsql:\/\/localhost\/quartz"/"Quartz\/url=jdbc:postgresql:\/\/localhost:5432\/quartz"/g /opt/pentaho/biserver-ce/pentaho-solutions/system/simple-jndi/jdbc.properties
sudo sed -i s/"Shark\/type=javax.sql.DataSource"/"#Shark\/type=javax.sql.DataSource"/g /opt/pentaho/biserver-ce/pentaho-solutions/system/simple-jndi/jdbc.properties

ANNEXES 88
STATISTICS MODULE SHIVA KUMAR
sudo sed -i s/"Shark\/driver=org.hsqldb.jdbcDriver"/"#Shark\/driver=org.hsqldb.jdbcDriver"/g /opt/pentaho/biserver-ce/pentaho-solutions/system/simple-jndi/jdbc.properties
sudo sed -i s/"Shark\/url=jdbc:hsqldb:hsql:\/\/localhost\/shark"/"#Shark\/url=jdbc:hsqldb:hsql:\/\/localhost\/shark"/g /opt/pentaho/biserver-ce/pentaho-solutions/system/simple-jndi/jdbc.properties
sudo sed -i s/"Shark\/user=sa"/"#Shark\/user=sa"/g /opt/pentaho/biserver-ce/pentaho-solutions/system/simple-jndi/jdbc.properties
sudo sed -i s/"Shark\/password="/"#Shark\/password="/g /opt/pentaho/biserver-ce/pentaho-solutions/system/simple-jndi/jdbc.properties
sudo sed -i s/"SampleDataAdmin\/type=javax.sql.DataSource"/"#SampleDataAdmin\/type=javax.sql.DataSource"/g /opt/pentaho/biserver-ce/pentaho-solutions/system/simple-jndi/jdbc.properties
sudo sed -i s/"SampleDataAdmin\/driver=org.hsqldb.jdbcDriver"/"#SampleDataAdmin\/driver=org.hsqldb.jdbcDriver"/g /opt/pentaho/biserver-ce/pentaho-solutions/system/simple-jndi/jdbc.properties
sudo sed -i s/"SampleDataAdmin\/url=jdbc:hsqldb:hsql:\/\/localhost\/sampledata"/"#SampleDataAdmin\/url=jdbc:hsqldb:hsql:\/\/localhost\/sampledata"/g /opt/pentaho/biserver-ce/pentaho-solutions/system/simple-jndi/jdbc.properties
sudo sed -i s/"SampleDataAdmin\/user=pentaho_admin"/"#SampleDataAdmin\/user=pentaho_admin"/g /opt/pentaho/biserver-ce/pentaho-solutions/system/simple-jndi/jdbc.properties
sudo sed -i s/"SampleDataAdmin\/password=password"/"#SampleDataAdmin\/password=password"/g /opt/pentaho/biserver-ce/pentaho-solutions/system/simple-jndi/jdbc.properties
• Start your Pentaho bi server
Make the .sh files executable sudo chmod +x /opt/pentaho/biserver-ce/*.sh
cd /opt/pentaho/biserver-ce
./start-pentaho.sh

ANNEXES 89
STATISTICS MODULE SHIVA KUMAR
• Go to your browser and enter
http://ipaddress-pentaho-server:8080
• Administrator login page
Figure 54- Pentaho Login page
Figure 55- Home page(Pentaho)

ANNEXES 90
STATISTICS MODULE SHIVA KUMAR
8.2 Installing SpagoBI on Linux Ubuntu [15]
• Prerequisites
Before proceeding to SpagoBI installation, check whether java(openjdk) has been installed in your system or not. (My JAVA version)
# java -version
java version “1.7.0_03”
OpenJDK Runtime environment (IcedTea7 2.1.7) (7u3-2.1.7-1)
OpenJDK 64-bit Server VM (build 22.0-b10, mixed mode)
• Download SpagoBI 5.0
# wget http://download.forge.ow2.org/spagobi/All-In-One-SpagoBI-5.0-01102014.zip
# Unzip All-In-One-SpagoBI-5.0-01101014.zip
# cd ../SpagoBI-Server-5.0-16092014/bin
#chmod +x*.sh
# cd ../SpagoBI-Server-5.0-16092014/database
#chmod +x*.sh
• Modify server.xml file
Open server.xml file under conf directory(find 8080) and add your ip address instead of localhost to access URL anywhere # cd ../SpagoBi-Server-5.0-16092014/conf
#vi server.xml
<Environment name=”spagobi_service_url” type=java.lang.string” value=”http://Your-IP:8080/SpagoBI”/>
<Environment name=”spagobi_host_url” type=java.lang.string” value=”http://Your-IP:8080”/>
• Start SpagoBI
# cd ../SpagoBI-Server-5.0-16092014/bin
#./SpagoBIStartup.sh

ANNEXES 91
STATISTICS MODULE SHIVA KUMAR
or
#./startup.sh
• Access the SpagoBI on browser
Navigate your browser to http://Your-IP:8080/SpagoBI/
• Administrator login page
Figure 57- Home page (SpagoBI)
Figure 56- SpagoBI login page

ANNEXES 92
STATISTICS MODULE SHIVA KUMAR
8.3 Some other different types of Business Intelligence tools available in market
[20] YELLOWFIN BI
Yellowfin BI offers business intelligence tools that are so easy to use, they become universal throughout a company. Yellowfin’s analytics are available in many different flavors – dashboards, data discovery, mobile BI, mapping, and collaborative business intelligence – that make it simple to assess, monitor and understand any bit of data related to your business. Features
• Interactive and intuitive filtering use check boxes, radio buttons and sliders to make it easy to dial-down your data
• Access your dashboards from anywhere: webpage, company intranet, wiki, or mobile device
• Share insights via simple scripts that can be uploaded, embedded, or sent to collaborators
Cost: Free trial; full version starting at $3000 a year for 5 users CLEAR ANALYTICS If you’re familiar with MS Excel, you’ll love Clear Analytics. This Excel-based business Analytics software serves up business intelligence with spreadsheet manageability – and centralizes all your data in the process. Clear Analytics allows your organization to continue with its business-as-usual Excel reporting, but adds BI must-haves like version control, administrative and sharing capabilities, reports scheduling, governance, and auditability. Features
• With the Logical Data Warehouse (LDW) approach, Clear Analytics eliminates the need for a data warehouse to pre-aggregate data
• Little learning curve: anyone who uses MS Excel can use Clear Analytics • Easy to trace and audit data, on ensure company-wide compliance
Cost: Free Personal Edition

ANNEXES 93
STATISTICS MODULE SHIVA KUMAR
SAP BUSINESS INTELLIGENCE For businesses that require a full, detailed picture of every company process, SAP NetWeaver BI steps in. This full-function tool is designed to cater to a diverse set of needs, satisfying the requirements of everyone in your organization – IT professionals, senior management, and end users included. The tool’s robust infrastructure hosts wide-ranging functionality in one integrated platform. Features
• A single, integrated platform pulls together applications and reporting to provide a detailed snapshot of your organization
• Visualization makes it easy to understand your data • Improve your company’s collective IQ by giving all collaborators insights
into data and performance indicators • Cost: Free Trial; contact for pricing
ORACLE HYPERION SYSTEM When it comes to BI tool comparisons, Oracle is one of the most well-known names in business, and its Hyperion Planning system is an agile business intelligence tool. Using mobile, desktop and MS Office Interfaces, Hyperion supports and enables enterprise-wide planning, budgeting and forecasting – mission-critical processes a company needs to develop accurate financial forecasts and generate cost-effective enterprise alignment. Features
• Deploy Hyperion independently, either in the cloud or on-site • Integrate Hyperion with other Oracle tools to create a robust and over-
arching business solution • Reduce budgeting and planning by days, weeks or months, depending on
the process
Cost: Contact for pricing
ANNEXES 94
STATISTICS MODULE SHIVA KUMAR
ORACLE BUSINESS INTELLIGENCE ENTERPRISE EDITION (OBIEE) For businesses with serious BI needs, OBIEE is an incredibly powerful business analytics software tool. The Enterprise Edition integrates many of Oracle’s most useful components, including BI server, BI Answers, BI Interactive Dashboards, BI Delivers, BI publisher, the MS Office Plug-in, Hyperion Interactive Reporting, Hyperion SQR Production Reporting, Hyperion Financial Reporting, and Hyperion Web Analysis. In other words, for almost any conceivable data measurement, visualization, reporting, or information manipulation, OBIEE has a solution. Features
• Comprehensive BI tools inform and inspire better decisions across your organization
• OBIEE allows for full collaboration within an organization • Interactive dashboards make reporting and data visualization simple
Cost: Contact for pricing MICROSTRATEGY MicroStrategy Business Intelligence has one primary goal: leverage data to help organizations find timely, informed answers to any question. Powerful dashboards and data analytics transform your company’s information into easy-to-understand reports designed to improve productivity, boost cost-efficiency, optimize revenue, monitor trends, forecast new opportunities, and fortify client relationships. Features
• MicroStrategy runs against data stored in ERP systems (e.g. SAP and Oracle), operational databases, and data warehouses
• Use MicroStrategy on your desktop or via mobile app • Save data on-site or in the cloud via Amazon Web Services
Cost: Free 30-Day Enterprise Evaluation Edition

ANNEXES 95
STATISTICS MODULE SHIVA KUMAR
SISENSE Sisense is business analytics software that aims to enable business users to easily prepare, analyze and visualize complex data. The software is mainly focused on user-friendliness and high performance for organizations that work with large or diverse datasets, and provides a single-stack solution for integrating many disparate data sources, performing queries and displaying results in interactive dashboards. Features
• End-to-end business intelligence for non-techies with little to no IT involvement required
• ETL and data preparation to integrate many disparate cloud and on-premise sources
• Interactive BI dashboards with a wide range of data visualization options
Cost: Free Trial; Contact for version pricing BOARD ALL-IN-ONE BUSINESS INTELLIGENCE BOARD’s AIO Business Intelligence tool kit offers all the capabilities and functions necessary to build a custom solution to corporate performance management. Bonus: no programming skills required. The tool kit approach makes it easy for end-users to interact with BOARD’s powerful interface, creating a self-service solution to analytics, reporting and understanding data. BOARD labels this integrated BI-performance management solution as “management Intelligence” Features
• BI functions include reporting, multi-dimensional analysis, ad hoc querying and “dashboarding”
• Corporate performance management allows for budgeting, planning, financial forecasting, profitability analysis, score carding and financial consolidation
• BOARD is single interface, thus eliminating the usual complications form forcibly patching together multiple BI tools

ANNEXES 96
STATISTICS MODULE SHIVA KUMAR
Cost: Free Demo; MICROSOFT BUSINESS INTELLIGENCE TOOLS Like BOARD, Microsoft’s BI solutions are billed as tools that require little IT involvement. The premise: if your employees know how to use Microsoft Office or Microsoft SharePoint Server, then they will intuitively understand MS business Intelligence. This full-service solution is quite powerful, integrating data from multiple sources to combine with current enterprise data that lives on-site or in the cloud – all while maintaining proper governance. Features
• MS BI allows any user to drill-down, analyze and visualize data through Excel
• Enable report-sharing and other collaborative features • Self-service capabilities that reduce the burden on IT
Cost: Free Trial; Contact for pricing JASPERSOFT Billed as one of the business world’s most used, most flexible and most affordable BI solutions, Jaspersoft empowers your organization with tools for better analytics and decision-making. This is self-service product, which means that it requires little IT intervention to generate powerful data insights that help your organization create actionable answers to any question. Features
• Can be integrated into any app or mobile device – scaled architecture that makes Jaspersoft available to anyone
• Available on-premise or in the cloud • Download for your device, or use as a web-scalable platform to embed
anywhere
Cost: Free Trial; Contact for pricing

ANNEXES 97
STATISTICS MODULE SHIVA KUMAR
QLIKVIEW When running BI tool comparisons, users find that QlikView is a real user-friendly platform that straddles the gap between tech-savvy BI software and traditional productivity apps, creating a solution that’s available to all. QlikView’s primary goal is to enable business users to leverage their data to discover new solutions and opportunities, and it does so with a clean and straightforward interface. Features
• This self-service tool allows for data analytics, insights and existing data manipulation
• Visually appealing dashboards present data in an easy-to-understand format
• Customized solutions by industry (banking, consumer products, high tech, insurance, etc.)
Cost: Free personal version; Enterprise Edition Server at $35000 per server 8.4 Most frequently used Linux commands Find command examples Find files using file-name (case in-sensitive find) #find -iname “SpagoBI” Execute commands on files found by the find command #find -iname “SpagoBI” -ecex mad5sum {}\; Find all empty files in home directory #find -empty Ssh command examples Login to remote host Ssh -l jsmith remotehost.example.com
ANNEXES 98
STATISTICS MODULE SHIVA KUMAR
Debug ssh client Ssh -v -l jsmith remotehost.example.com Display ssh client version Ssh -V OpenSSH_39.9pl, OpenSSl 9.0.7 Feb 19 2003 Ls command example Display file size in human readable format (e.g. KB, MB etc.) #ls -lh Order files based on last modified time (In reverse order) #ls -ltr Visual classification of files with special characters #ls -F To view hidden files #ls -a Chmod commands examples Chmod command is used to chand=ge the permissions for a file or directory. Give full access to user and group (i.e read, write and execute) on a specific file #chmod ug+rwx file.txt Revoke all access for the group (i.e read, write and execute) on a specific file #chmod g+rwx file.txt Apply the file permissions to all files in the sub-directories #chmod -R ug+rwx file.txt Tail command examples Print the last 10 lines of a file by default #tail filename.txt Print N number of lines from the file named filename.txt #tail -n N filename.txt View the content of the file in real time using tail-f. This is useful to view the log files, that keeps growing. The command can be terminated using CTRL-C #tail -f log-file Wget commands examples

ANNEXES 99
STATISTICS MODULE SHIVA KUMAR
The quick and effective method to download the software, music, video from the internet is using wget command #wget http://prdownloads.sourceforge.net/sourceforge/nagios/nagios-3.2.1.tar.gz Download and store it with a different name #wget -o taglist.zip http://www.vim.org/scripts/download_script.php?src_id=7701 rm command examples rm command is used to remove a file or directory. To remove a file you must have written permission on the directory where file reside #rm file1 Before deleting if you want a confirmation then you can use -i option #rm -i file1 rm: remove regular file ‘file1’? y To remove a directory and all the contents of it, you can use -r option Rm -r temp Above command will first recursively delete all files from directory and sub directory and then delete the temp directory itself Kill command example To kill running process you can use kill command, this command requires process id and that you can get from ps command #kill 19633

ANNEXES 100
STATISTICS MODULE SHIVA KUMAR


