BUSINESS-IT ALIGNMENT MATURITY: A GLOBAL PERSPECTIVE Executive Summary The challenge of aligning business and IT continues to be an elusive strategic initiative for organizations around the world. Since the late 1970’s, practitioners, academics, consultants, and research organizations have identified “attaining alignment between IT and business” as a pervasive and persistent problem. Although our latest research results showed that alignment is improving 1 , there are reasons why alignment continues to be a global issue – as will be elaborated on in this article. This article will present significant new global insights from Luftman’s evaluation of strategic alignment maturity (SAM). It is the result of assessments from 238 Global 1,000 organizations. While this article focuses on the global and industry differences among the respective alignment factors, the overarching findings that are the focus of this article are: 1. Most organizations today are still at Level 2 and Level 3 2. The strongest (receiving the highest maturity scores) alignment factors are: demonstrated contribution of IT to business, business sponsor/champion, IT ability to react/respond quickly to changing business needs, relationship/trust style, articulation of and compliance with IT standards and scope of IT systems. 3. The weakest (receiving the lowest maturity scores) alignment factors are: career cross-over, service level agreements, balanced metrics, education, cross-training, attract and retain best talent, IT metrics. 4. The consistently higher maturity scores for Indian IT service companies’ merits further discussion. 5. The relationship of IT business alignment maturity to firm performance is strongly supported. THE IMPORTANCE OF ACHIEVING IT-BUSINESS ALIGNMENT The global importance of alignment has remained on the top of information technology surveys for almost three decades. The lead author has previously presented some of the reasons why alignment persists, including: 1. Just focusing on how IT is aligned with the business, and not also leveraging how the business can be in harmony with IT. 2. The continuous pursuit of a silver bullet (not recognizing that there is no one factor that will improve the IT business relationship). 3. The lack of having an effective descriptive and prescriptive tool (until SAM, the Strategic Alignment Maturity assessment) that will assist 1 Luftman, J., and Kempaiah, R.,” An Update on Business-IT Alignment: “A Line” Has Been Drawn, MIS Quart erly Executive (6,3) September 2007, PP. 165-175.
Transcript
BUSINESS-IT ALIGNMENT MATURITY: A GLOBAL PERSPECTIVE
Executive Summary
The challenge of aligning business and IT continues to be an elusive strategic initiative for
organizations around the world. Since the late 1970’s, practitioners, academics,
consultants, and research organizations have identified “attaining alignment between IT
and business” as a pervasive and persistent problem. Although our latest research results
showed that alignment is improving1, there are reasons why alignment continues to be a
global issue – as will be elaborated on in this article.
This article will present significant new global insights from Luftman’s evaluation of
strategic alignment maturity (SAM). It is the result of assessments from 238 Global 1,000
organizations. While this article focuses on the global and industry differences among the
respective alignment factors, the overarching findings that are the focus of this article
are:
1. Most organizations today are still at Level 2 and Level 3
2. The strongest (receiving the highest maturity scores) alignment factors are:
demonstrated contribution of IT to business, business sponsor/champion, IT ability
to react/respond quickly to changing business needs, relationship/trust style,
articulation of and compliance with IT standards and scope of IT systems.
3. The weakest (receiving the lowest maturity scores) alignment factors are: career
cross-over, service level agreements, balanced metrics, education, cross-training,
attract and retain best talent, IT metrics.
4. The consistently higher maturity scores for Indian IT service companies’ merits
further discussion.
5. The relationship of IT business alignment maturity to firm performance is strongly
supported.
THE IMPORTANCE OF ACHIEVING IT-BUSINESS ALIGNMENT
The global importance of alignment has remained on the top of information technology
surveys for almost three decades. The lead author has previously presented some of the
reasons why alignment persists, including: 1. Just focusing on how IT is aligned with the
business, and not also leveraging how the business can be in harmony with IT. 2. The
continuous pursuit of a silver bullet (not recognizing that there is no one factor that will
improve the IT business relationship). 3. The lack of having an effective descriptive and
prescriptive tool (until SAM, the Strategic Alignment Maturity assessment) that will assist
1 Luftman, J., and Kempaiah, R.,” An Update on Business-IT Alignment: “A Line” Has Been Drawn, MIS Quarterly Executive (6,3) September 2007, PP. 165-175.
IT and business executives in dealing with the alignment conundrum. 4. Discussing the
importance of alignment but concentrating just on IT infrastructure considerations.
Alignment addresses both how IT is aligned with the business and how business should
or could be aligned with IT. Terms such as harmony, link, fuse, fit, match, meld,
converge, interwoven, and integrate are frequently used synonymously with the term
alignment (perhaps another reason why alignment has been so evasive). Whatever term
you prefer, it is a persistent/pervasive problem that demands an ongoing process to ensure
that IT and business strategies adapt effectively and efficiently together. Perhaps most
important is recognizing that there is significant research available that demonstrates the
relationship of alignment to firm performance (These findings as well as new industry
findings will be introduced later in this paper.).2
A STRATEGIC ALIGNMENT MATURITY TOOL
The Strategic Alignment Maturity (SAM) assessment tool comes from the lead author’s
work since 2000.3 SAM, which has been applied globally by organizations of all sizes,
evaluates six components (and 41 factors) of an organization to identify an alignment
maturity score and more importantly specific opportunities to improve the IT business
relationship. The six components (Communications, Value Metrics, Governance,
Partnership, Technology Scope, and Human Resources) for assessing alignment maturity
along with the 41 specific criteria/factors measured for each component are illustrated in
Figure 1 (X axis). Also illustrated in Figure 1 are the average overall scores and the
differences in the scores as assessed by business and IT leaders. The scores an
organization achieves for each of the 41 factors included in the six components of
maturity are based on a five-level maturity model. The model denotes the organization’s
IT-business alignment maturity, with Level 1 indicating the lowest maturity and Level 5
indicating exemplar maturity. The research process is described in the Appendix.
ANALYSIS OF THE ALIGNMENT MATURITY DATA
The research presented in this paper involved analyzing the responses of 1,960 business
and IT executives from 231 organizations; primarily Global 1,000 companies.4 Of the
238 organizations, 1375 were based in the United States, 42 were from Latin America
(the largest companies data are applied, although below the Global 1,000 level), 21 were
from Europe, and 38 were from India (more than half were in the IT service industry).
2 Luftman, J., and Kempaiah, R.,” An Update on Business-IT Alignment: “A Line” Has Been Drawn, MIS Quarterly Executive (6,3)
September 2007, PP. 165-175. 3 Luftman, J., “Assessing Business-IT Alignment Maturity,” CAIS, Volume 4, December 2000. 4 The six components of alignment maturity were initially validated by evaluating 25 Fortune 500
companies. Early studies included five companies that were invited to participate because of their exemplar
reputation; these companies were assessed at Level 5. Our procedure for assessing maturity is described in
the Appendix. Some two-thirds of the data was gathered from interviews or group discussions. The rest
came from questionnaires. 5 In the previous article published by the lead author in MISQE Sep 2007 edition, the database consisted of
197 organizations of which 124 organizations were from U.S.A., 38 from Latin America, 11 from Europe
and 24 organizations from India.
The 1,960 respondents are comprised of 915 from IT (112 CIOs, 10 CTOs and 793 other
IT leaders) and 1,045 from the business (88 CEOs, 97 CFOs, 217 VPs, and 643 other
business leaders)6. It is interesting to note (in Figure 1) that although IT executives’
assessment scores tend to be higher than business executives, their relative scores are
very similar.
Analyses of Variance (ANOVA) were carried out in order to detect significant
differences among the regions concerning SAM elements. IT was employed a level of
analysis of 0.05. Duncan post-hoc multiple comparisons were employed in order to
identify which groups presented differences.
Main Observations
Industries vary in their alignment maturity. As can be seen in Figure 2 (and in Figure
1), the average overall maturity score for all companies was 3.13 – shown by the
midpoint dark line. Most companies are still assessed with a level 2 or level 3 alignment
6 In the previous article published by the lead author in MISQE Sep 2007 edition, we had 1,527
respondents, with 727 from IT (105 CIOs, 10 CTOs and 612 other IT executives) and 800 from the
business (88 CEOs, (& CFOs, 169 VPs, and 456 other business executives)
maturity score. The six industries with the highest maturity scores – retail, transportation,
hotel/entertainment, services, manufacturing and insurance – were above the average
alignment maturity score of 3.13; however, the industry samples for retail, transportation,
and hotel/entertainment were quite small. The industries with the lowest maturity scores -
financial, healthcare, government, oil/gas/mining, utilities, pharmaceuticals, chemical and
educational institutions were below the average alignment maturity score of 3.12.
Similarities and Differences Among the Strongest and Weakest Six Factors
Figure 3, compares the alignment scores from the 231 Global 1,000 organizations from
the U.S.A., Latin America, Europe and India; it will be the focus of this section of the
paper. The next two subsections of this paper present the dozen (top six and bottom six)
most important factors, the global similarities/differences, and includes an illustrative
organizational vignette/example. Given that more than half of the Indian companies were
from the IT service industry, when presenting the highs there will be additional
discussion comparing IT service firms across geographies, as well as a discussion of the
relationship of SAM to firm performance in the IT service industry.
Strongest Maturity Factors
Overall level 4 IT organizations do exemplary within the company itself; where a level 5
IT organization extends their success externally to partners and customers/clients
(including partners of partners, and customers of customers). Although these six factors
received the highest average maturity scores, there is clearly still room for improvement.
Demonstrated Contribution of IT to Business: Overall, IT and business executives
agree that the contribution IT makes to the organization’s strategic goals is compelling.
Albeit, the rigor of the actual measurement of this contribution is relatively weak, as
demonstrated by the overall value component falling in fifth place among the six
alignment maturity components. IT assets are being leveraged across the organization and
the application systems are enabling/driving business process enhancements to obtain
competitive advantage. At a subjective level, IT is viewed as an innovative strategic
contributor to success; as will be seen when discussing the weakest factors; it is time to
ensure these opinions can be substantiated.
The contribution of IT to business maturity scores for the India (3.97), U.S.A. (3.71),
Europe (3.55), and suggest that these geographies are moderately strong in this area. One-
way Anova test was performed and no differences among the three areas were detected.
So it is not possible to say that Indian companies focus more this practice than USA or
Europe companies.
From Latin America we have only one company categorized as a retail company which
has a score of 4.5 for the contribution of IT to business. The conservative nature of Latin
American IT investments could have influenced this score. Latin business executives
prefer to invest in what they consider stable business areas instead of IT projects.
For example, a manufacturing company initially assed IT’s contribution to business to be
at a level 2.5. They implemented a balanced set of metrics that were established by IT
and business executives to evaluate the service provided to business functions. However,
they did not establish formal feedback mechanisms and their maturity score improved
only moderately because the dashboard alone lacked the focus of maintaining an open
communication path between business and IT; perhaps their next SAM assessment will
show an improvement?
Business Sponsor/Champion: The business sponsor is the highest level management
person engaged in the overall organization involved in the initiative. They can ensure that
the appropriate resources (e.g., financial, people) are committed to ensure the success of
the initiative, including making any process and organizational changes that are
necessary. The champion(s) is/are the initiative/project evangelist. They motivate
stakeholders to make the required change. Overall, IT and business executives agree that
IT based initiatives frequently have appropriate senior management performing the
proper roles necessary to ensure an initiatives success.
Maturity scores for “business sponsor/champions” in India (3.88), Latin America (3.54),
Europe (3.36), and the U.S.A. (3.21), suggest that IT based initiatives often have a senior
level IT and business sponsor/champion at the corporate level playing a major role in the
success of implementing IT based initiatives. Overall companies at level 3 suggest that a
business sponsor or champion(s) recognize and convey the importance of ensuring
change, resource allocation, and accountability.
For example, a large pharmaceutical firm assessed “business sponsor/champion” to be at
a level 3. The business saw IT as a key enabler for integrating the supply chain
management process across the company. Having a business sponsor at the corporate
headquarters level rather than from any of the functional business units was recognized as
fundamental to the success of the initiative. At the same time they ensured that the
respective business unit executives served as effective project champions that motivated
the business units to carry out the complex change across the organization. If/when this
company extends the reach of this system externally to its external partners it will be
closer to a Level 5.
One-way Anova test was performed and some differences among the three areas were
detected. The areas of Europe (3.36) and USA (3.21) forms a group that present averages
that are statistically bellow the other group formed by India (3.88). Latin America
companies belong to both groups presenting an intermediate average (3.54).
The role of “business sponsor/champion” maturity scores for IT service companies from
India (3.88) are significantly higher than the Europe (3.36) and USA (3.21). A level 2
maturity score suggests that IT initiatives frequently have just IT serving as project
sponsor and champion. Not having the appropriate business leaders engaged as sponsor
and champion(s) is a major obstacle for project success.
ITs ability to react/respond quickly: With an overall average maturity score of 3.37, IT
and business executives agree that the capacity of IT to react/respond quickly to changing
business needs is acceptable; it is neither weak nor strong. This is true for all of the
researched geographies with scores for India (3.82), U.S.A. (3.30), Europe (3.15), and
Latin America (3.13), and all falling within a level 3 maturity.
For example, a retail company originally assessed this factor at a level 3; IT and business
organizations worked together to make important changes to improve their overall
maturity to a level 4. Today business strategy and planning is managed across the
business and IT functions. They have a well defined governance process at strategic,
tactical, and operational levels with IT and business stakeholders working well together.
IT is treated as a contributing business partner and an important business process driver.
The CIO reports to the CEO. With effective processes in place, the company is quickly
able to identify, communicate, and react to changes across all organizations; including IT.
One-way Anova test was performed and two groups were detected. The first group is
formed by Latin America (3.13), Europe (3.15) and USA(3.30). The second group is
composed by only one region: India (3.82). So it is possible to say that India has a higher
focus in this practice than the first group. This indicates that Indian IT service companies
are quicker to react/respond to the changing business requirements. Most of these Indian
IT service companies are certified at CMMI level 5, which indicates that all key
processes are in place and that the best practices are disseminated across the entire
organization.
Relationship/Trust Style:
With an overall average maturity score of 3.35, IT is emerging as a valued service
provider. The next step firms should focus is on transforming this association in a
primarily a long-term partnership style of relationship. One-way Anova test was
performed and three groups were detected. The first group is formed by Europe (3.04)
and USA (3.24). The second group is composed by USA (3.24) and Latin American
(3.48). The third group is formed by Latin America and India (3.84).
Three conclusions can be drawn from these three groups. First, Europe (3.04) is the area
that focuses less on relationship/trust style practices in other words IT is beginning to
emerge as a valued service provider.
Second India(3.84) is the area that focus most on relationship/trust style practices in other
words although IT is emerging as a valued service provider it presents some traits of an
association between business and IT that is primarily a long-term partnership style of
relationship.
Third, Latin America (3.48) and USA(3.24) occupy an intermediate region between these
two extreme regions: Europe and India.
Standards Articulation and Compliance: Overall, IT standards articulation and
compliance is at a level 3, indicating that IT standards are defined and enforced at the
functional unit level, with emerging coordination across functional units. IT standards for
the India (3.93), Latin America (3.27), U.S.A. (3.25) and Europe (3.12) indicate that they
are defined and beginning to be enforced across functional units.
For example, a large U.S. service company is assessed at a level 3 moving to a level 4.
ERP systems are installed and all projects are monitored at an enterprise level. Standards
are integrated across the organization, and standards articulation is enforced across the
enterprise, but not externally to business partners and customers/clients.
One-way Anova test was performed and two groups were detected. The first group is
formed by Europe (3.12), USA (3.25) and Latin America (3.27). The second group is
formed by India (3.93). It can be stated with a certainty of 95% that Indian companies
focus more on “standards articulation and compliance” compared to companies of other
regions and have their IT standards defined and enforced across all functional units
within their organizations.
Scope of IT Systems: The scope of the IT systems refers to the impact that IT
applications have across the company, and externally to company partners and
customers/clients. Overall, IT and business executives agree that the scope of IT systems
is primarily business process enablers (IT supports business process change, as opposed
to drivers of the initiative) within the company.
The maturity scores for the India (3.77), Latin America (3.58), U.S.A. (3.18), Europe
(3.17), and suggest that that IT has begun to receive recognition as a process enabler. The
growing reliance on Enterprise Resource Planning (ERP) systems encourages support for
process changes that enable/drive business strategies.
For example, a large financial institution assessed their “scope of IT systems” to be at a
level 4. They implemented an internal customer relationship management system to
improve services to clients calling the company for assistance. Like the pharmaceutical
example above, when this company provides their clients with direct access to the
system, they will then be able to assess their maturity closer to a Level 5.
One-way Anova test was performed and two groups were detected. The first group is
formed by Europe (3.17) and USA (3.18) and the second group is formed by Latin
America(3.58) and Indian companies (3.77). It can be stated with a certainty of 95% that
Europe and USA companies focus less on “scope of IT systems” than Latin America and
Indian ones.
The “scope of IT systems” maturity score for Indian service companies is at a level 3.77
compared to Latin America (3.58), U.S.A. (3.18) and Europe (3.17) the suggesting that
Indian IT service companies are making better use of IT as a catalyst for business process
change across the firm. A level 2 organization focuses their IT services to back office
support.
Weakest Maturity Factors
These six factors received the lowest average maturity scores across all geographies and
industries, and have the largest opportunity for improvement.
Career Crossover: Career crossover is an excellent vehicle for educating, enhancing
communications, and improving relationships by preparing business and IT staffs with
perspectives that can generate trust, empathy, and enhance understanding across the
organizations.
One-way Anova test was performed and two groups were detected. The first group is
formed by Europe (2.81), USA (2.64) and Latin America (2.81) and the second group is
formed by Indian companies (3.65). It can be stated with a certainty of 95% that Europe,
USA and Latin companies focus less on “career crossover” than Indian ones.
Companies from India (3.65) indicate that career crossover opportunities among IT and
business professionals regularly occur for all position levels within functional units.
Companies from and Europe (2.81), Latin America (2.81) and USA (2.64) indicate that
job transfers between business and IT occur only occasionally. We know that the more
valuable IT professionals possess business, industry, interpersonal, and team oriented
skills as well as technical expertise. The irregular career crossover provides evidence (as
well as the low scores for education and cross training discussed next) supporting the
conclusion that management continues to under-emphasizing the importance of skills
enhancement.
Service Level Agreements: With the use of SLAs and an effective service level
management process both IT and business executives agree that they have SLAs which
are technically oriented.
One-way Anova test was performed and two groups were detected. The first group is
formed by Europe(2.45), Latin America (2.74) and USA(2.79) and the second group is
formed by Indian companies (3.60). It can be stated with a certainty of 95% that Europe,
Latin and USA companies focus less on “service level agreements” than Indian ones.
Indian companies have rated “service level agreements” at a level 3.60 indicating that
service level agreements are technically oriented and relationship oriented compared with
Europe (2.45), Latin America (2.74), the USA (2.79), and which are largely technically
focused. Service level agreements and processes provide important metrics for supporting
the understanding among IT and business stakeholders, obtaining agreement on important
considerations, and continuously learning about how to ensure IT services are attained
and improved.
For example, a finance company had defined systems availability to be 99.9%, which
provides for up to 8.8 hours of downtime during the entire year. An important system
was down for 2 hours one day, and the CIO was fired. Having effective communications
and understanding across the organizations is essential to a successful relationship.
Balanced Metrics: It is important to understand that there is no universal set of
measurements that would meet every organizations criterion. The metrics that are applied
should be agreed to among IT and business stakeholders and they should regularly be
reviewed and acted upon. It is important that these metrics include both quantitative and
non quantitative measurements that clearly demonstrate ITs contribution as an
enabler/driver of business value. As discussed above, having subjective measurements
alone is not sufficient.
One-way Anova test was performed and two groups were detected. The first group is
formed by Europe (2.53), Latin America (2.73) and USA (2.88) and the second group is
formed by Indian companies (3.63). It can be stated with a certainty of 95% that Europe,
Latin and USA companies focus less on “balanced metrics” than Indian ones.
The maturity score for balanced metrics for India (3.63) indicates that they measure IT’s
contribution to business by formally linking the value measurements of IT and business.
They have formal feedback processes in place to review and take action based on the
results and regularly assess the contribution across the functional organizations. The
lower scores for Europe (2.53), Latin America (2.73), the USA (2.88) suggest that
formalization and linkages between IT and business metrics remains incomplete. It also
indicates that formal processes and feedback reviews are used less frequently.
For example, a manufacturing company assessed “balanced metrics” at a level 2 because
they use cost efficiency (not effectiveness) methods across the business and within the
functional organizations; IT is a pure cost center. Benchmarking is not generally provided
and is informal. Formal assessments are sometimes performed to address problems
however minimum action is taken after the assessment.
Education, Cross-Training: Institutionalizing formal training for business stakeholders
regarding IT, and in turn requiring formal training for IT professionals in the operational
and management aspects of the business will enhance understanding, rapport, trust, and
communications among the communities. This in turn will result in improved
relationships and the opportunity to leverage IT across the business.
One-way Anova test was performed and two groups were detected. The first group is
formed by USA (2.75), Latin America (2.99), Europe(3.05), and the second group is
formed by Indian companies (3.61). It can be stated with a certainty of 95% that USA,
Latin America and Europe companies focus less on “educational, cross-training” than
Indian ones.
Maturity scores from USA (2.75), Latin America (2.99) and Europe (3.05) shows that
opportunities are dependent on the functional unit and formal programs are starting to be
practiced by all functional units. However India (3.61) demonstrates that formal
programs are in place and practiced by all functional units and across the organization.
Although some U.S. companies routinely implement executive training, the USA score of
2.75 remains well below average. The low U.S. performance contributes to the poor
understanding of IT by business and the poor understanding of the business by IT.
Companies attaining higher levels of maturity in this area tend to leverage their academic
partners to help identify and deliver effective programs to ensure employees have the
requisite expertise to ensure harmony across IT and business organizations. Again, this
should go beyond just the technical attributes.
Attract and Retain best talent
This element is about programs or policies designed to attract and retain key talent in the
IT area (H7). Effective IT organization needs a wide variety of capabilities ranging from
staffing the help desk to creating and integrating innovative business applications.
Traditionally, most organizations did as much as they could in-house. Today nearly all
the capabilities any company might want are available from a range of suppliers,
including low-cost IT specialists in India and elsewhere. Authors like Shpilberg et al.
(2007) reason that choosing the right source for a capability maximizing effectiveness
while minimizing costs is true a critical consideration. So instead of trying to retain key
talents in IT area it could be acceptable “right sourcing” talents.
One-way Anova test was performed and two groups were detected. The first group is
formed by USA (2.86), Latin America (2.86), Europe (2.97), and the second group is
formed by Indian companies (3.62). It can be stated with a certainty of 95% that USA,
Latin America and Europe companies focus less on “programs of attract and retain best
talents” than Indian ones. One possibility is that these regions prefer to right source
talents from regions like India.
In the first group IT hiring focus on technical expertise however this group is starting to
hiring IT focusing equally on technical and business expertise. One important thing to
note is that retention programs are in place.
On the second group (India companies) IT hiring is focused equally on technical and
business expertise. Differenttly from the previous group, formal programs are in place to
attract and retain the best IT professionals with both technical and business
IT Metrics
One-way Anova test was performed and three groups were detected. The first group is
formed by Europe (2.61) and USA (2.82). The second group is formed by USA and Latin
America (3.15), and the third group is formed by Indian companies (3.65). It can be
stated with a certainty of 95% that Europe focus less on programs of attract and retain
best talents than Latin America. Europe, USA and Latin America companies focus less
on “programs of attract and retain best talents” than Indian ones.
It can be seen in the first group that typical companies from Europe (2.61) and USA
(2.82) are equally concerned with technical and cost efficiency measures. However they
have a limited or no formal feedback processes in place to review and take action based
on the results of their measures.
The second group best represented by USA (2.82) and Latin America companies (3.15)
formally assesses technical and cost efficiency using traditional financial measures, such
as return on investment (ROI) and activity-based costing (ABC). This group is starting to
put formal feedback processes in place to review and take action based on the results of
their measures. It is important to note that Latin American companies (3.15) have a dual
role between the first and second group.
The third group represented by Indian (3.65) companies although these companies
present very similar practices with the second group. However its companies formally
assess technical, cost efficiency, and cost effectiveness using traditional financial
measures (e.g., ROI, ABC). They are starting to have formal feedback processes in place
to review and take action based on the results of our measures.
INDIAN IT SERVICE COMPANIES
Given the consistently higher SAM scores for Indian IT companies, the remainder of this
paper will elaborate on many of our observations from working with these firms, as well
as introduce research demonstrating the relationship of SAM to firm performance for IT
service companies.
Why is India Different
The India of today is no longer the India of a decade ago; it is no longer the land of tigers
and the Taj Mahal. India today is widely considered one of the most exciting and vibrant
emerging economies of the world. India’s economic success is far from new. The
country’s economy grew at 6 percent from 1980-2002 to 7.5 percent from 2002- 2006;
making it one of the world’s best-performing economies for a quarter century.
The rise of Indian service companies has been a notable success when measured against
standard indicators such as sales, exports, and employment. There is no single factor that
has contributed to the accomplishment of these firms but, factors such as legal
transparency, education, culture, population base, low labor costs, and quality have all
contributed to their success. The growth of IT service firms has been possible not just
because India is a less expensive alternative, but also because of the well planned strategy
of building and marketing the domain skills adopted by these companies. They have
taken steps for market penetration by expanding their global presence and by acquiring
strategically important companies abroad. The outsourced business model has
incorporated certain complementary organizational capabilities such as the human
resource ability to scale up quickly in response to growth in demand, software process
management capabilities, and the ability to manage global operations.
IT Metrics: Demonstrating process quality and expertise in IT service delivery are the
key factors driving India’s sustained leadership in global IT services. From the birth of
the industry, there has been a culture of quality. Various quality control and process
management tools have been improved and developed in India. Indian IT service firms
have been focusing on quality initiatives to align themselves with international standards.
ISO 9001, COPC, 6 Sigma are some of the established quality initiatives. In fact, 90 out
of the world’s 117 SEI CMM Level 5 companies are from India7; albeit their overall
SAM is at 3.7. This implies that while India is exemplary in tactical and operational
aspects of IT, they still have opportunities to improve in strategic areas.
Over the years, the Indian IT service industry has built robust processes and procedures
to offer world class IT software and technology related services by developing next-
generation tools, technology concepts, and standards. The quality of the software has not
only impacted India directly (e.g., making India a favored destination for IT enabled
services), it has also impacted the overall IT field by raising the software quality bar for
all IT applications and services.
Indian IT service firms have a reputation for better, faster, and cheaper project delivery.
These firms hire top talent who they immediately provide training in their SEI CMM
Level 5 standardized methodology. They follow rigorous processes, employing quality
management techniques and using the latest technology. They have developed a new
generation of project-management skills that enables work to be carried out from multiple
locations simultaneously. Core to this global delivery model is a heavy emphasis on
quality standards.
Human Resources/Skills: Low-cost, highly skilled IT professionals are widely believed
to be the key to India’s success story. India has the single largest pool of engineering
talent among the emerging countries. Over 50 percent of the population in India is less
than 25 years old. India’s young demographic profile is a unique advantage,
complemented by a vast network of academic infrastructure and the legacy effects of
British colonization. These have all contributed to an unmatched mix and scale of
educated, English speaking talent. 80 percent of the IT professionals have engineering
degrees. Having engineering degrees has helped IT service firms with problem solving
skills, a rigorous method of thinking logically, and in learning tools that helps in adapting
quickly with rapid changes in technology, domains, and tasks. This is in comparison to
the reduction of these engineering and related computer science skills in the United
States. Additionally, given the strong demand to have an appropriate balance of
technical, business/management, interpersonal (communications, teams), it is clear that
academic changes are required everywhere.
In-house testing and training has become a regular and significant component in the
Indian service firm hiring process. Companies have also established dedicated facilities
for employee skill enhancement initiatives. NASSCOM (National Association of
Software and Services Companies) has developed a comprehensive skill assessment and
certification program for entry-level IT talent. It also has implemented an image
enhancement program to create the awareness of opportunities in the field of IT. The HR
Skills maturity component for Indian Service companies is at an average score of 3.71.
Improvement in the quality of education system is being actively discussed at the highest
level of policy formulation in India. Educational curriculum is being upgraded to
7 NASSCOM Strategic Review 2007: See http://www.Nasscom.com
international standards at many institutions. When it comes to senior IT professionals or
managers, IT service companies are able to manage with either the local experienced IT
professionals or returning expatriates, whom IT service companies have found very
useful in bridging cultural gaps between local IT professionals and foreign clients.
Partnership: For Indian IT service companies’ cultural alignment and closer customer
relationships are keys to competing successfully in providing high-end services. Further,
immigration rules for obtaining work visas create project planning and management risks.
Recognizing these difficulties, Indian IT service companies are acquiring consulting
firms in United States and Europe, and are aggressively hiring hundreds of IT
professionals from within the US and Europe.
The irony, of course, is that as global companies from the West are trying to set up cheap
offshore delivery capability, the Indian IT service firms are building front-end
consultancy in the West. Major IT service companies such as IBM Global Services,
Accenture, EDS, and Ernst & Young are aggressively expanding their own operations in
India because of the considerations discussed above.
Governance: Indian IT service firms are enjoying minimal regulatory and policy
restrictions along with a range of incentives provided by both the state and the central
governments. Software Technology Parks of India (STPI) have also helped the growth of
IT service firms across the nation. Some of the major reforms such as rationalization of
international taxation policies, mutual trade agreements with partnering countries, and a
proactive and positive stance on international free trade are helping IT service firms to
grow.
India IT Service Case - WIPRO
Wipro is a global IT service company. Established in 1945, and headquartered in
Bangalore India. It entered into IT services in the 1980s. Its revenues have grown at a
CAGR of 21% over a six decade period. Today it is a U.S. $3.47 billion organization
with over 66,000 employees with operations in 19 countries.
It is the Worlds 1st PCMM Level 5 software company and the first IT service company
to use Six Sigma. Among the top 3 offshore BPO (Business Process Outsourcing) service
providers in the world, it has 592 + clients. Wipro is a strategic partner to five of the top
ten most innovative companies in the world. It is also the world’s first company outside
the U.S.A. to receive the IEEE software process award. It is the largest independent R&D
service provider in the world. It is the first Indian IT service provider to be awarded
Gold-Level status in Microsoft’s Windows Embedded Partner Programme. It is the first
to get the BS15000 certification for its global command centre. It has 46 development
centers across the globe. It is the pioneer in applying LEAN Manufacturing techniques to
IT services.
Communications: Wipro’s Foreign Language Initiative enables IT professionals to
communicate effectively with global clients. Employees are encouraged to learn one or
more foreign languages. The initiative also helps non-English speaking IT professionals
in the use of English effectively for communicating effectively with business executives.
Value Metrics: Wipro wishes to be the “Toyota of business services” and is on track to
becoming the world’s most efficient IT service provider8. It offers a full portfolio of IT
services including systems integration, package implementation, software application
development and maintenance, research and development services, and information
systems outsourcing across a range of industries delivering benefits for customers with
six sigma consistency for global organizations. Using their global delivery model, they
have international benchmarks in execution excellence that has translated in to
measurable results for their global customers which includes a 75 percent faster time-to-
market, 35 percent cost savings, and 35 percent productivity enhancements. Wipro is one
of the few Indian IT service firms having adopted web services as an independent
practice in its business plan. The IT capabilities are being built around web services-
oriented applications and services to its customers. In this context, the confidentiality,
security and integrity of organizations data is paramount, especially as data is exchanged
across the internet. Web service standards have gone a long way to address those
concerns.
Skills/HR: Wipro has opened centers in the U.S. (Atlanta, Georgia and Troy, Michigan)
in a continuing trend of “reverse outsourcing”. Cultural alignment and closer customer
relationships are keys to competing successfully in providing high-end consulting
services. The recruits for the Wipro’s centers will attend three months of training in India
before starting jobs in the U.S. in software development and project management. It is
also scouting for training sites in the U.S. Further, the opening of U.S. centers are also an
alternative to getting visas for workers, since getting work visa these days are getting
competitive. It has also earmarked as much as $250 million for expansion in Europe
through acquisition (mainly in Germany).
IT Service companies such as Wipro make sure that they are able to have a continuous
flow of new engineers and IT people by reaching into India’s “second-level” engineering
colleges to hire people before their last semester of study and then provide job-related
course materials and training for that last semester. International campus hiring has also
been initiated across the U.S.A., Europe, and Asia to attract top talent. By doing so,
Wipro is able to get commitment from students early on who are ready to take on the jobs
after graduation with less in-house training. Only 1 out of 10 candidates gets interviewed,
following a 1:50 ratio of resumes scanned, all enabled by IT.
HR counsels every employee on their strengths and weaknesses based on their profile by
providing a map of courses to take at Wipro. There is a 40-day “Project Readiness
Program” for new IT employees. Also, online study is encouraged. Wipro supplements
8 King, W., “Offshoring Decision Time Is At Hand”, Information Systems Management; Summer 2006; 23, 3, pp 102
continuing education program for those who choose to enroll at leading educational
institutes to provide special skill or training in areas such as project management. At the
leadership institute for senior managers, managers teach managers the business skills
needed. 5 percent of billable time is spent on training. The Chairman of Wipro himself
spends half a day of his personal time teaching in every leadership program. Wipro offers
100,000 person-days of training a year.
Partnership: At Wipro everyone is encouraged to come up with big or small ideas,
which would improve serving the customer. The idea is not to break new ground in basic
knowledge, but in improving customer service. As Wipro’s Chairman adds “If it isn’t
going to add to the success of our customers, we aren’t going to invest in it.9 Wipro ties
the rewards to performance. The entry level IT person moves onto a higher
salary/benefits curve as they progress in completing assigned course/seminars that are
geared to transform them from a computer science/engineering/business graduate into a
software engineer. “Wipro Equity Rewards Trust” plan gave Wiproites the benefits of
participating in the wealth creation back in the 80’s. The stock option along with
Quarterly Performance Linked Compensation (QPLC) provides innovative idea for
linking Wipro’s performance with employee compensation.
Governance: Wipro’s technical competency lies in the ability to apply strong
methodology to ensure on time delivery, in significant investments in accelerators, and in
partnerships and alliances. For Wipro the nature of client trust is very important. IT tries
to look at the problems the clients (internal and external) are experiencing and invites
them to discussions to identify opportunities for the future growth of the firm. They push
the business verticals to think seriously of the potential developments over the distant
horizon to prepare for the challenges the company might face tomorrow. They
continuously map new technologies coming into market and invest productively in IT and
skills. New knowledge is created by combining the existing knowledge assets from
multiple sources and is used before implementing new projects. Lessons learned are
disseminated across the organizations for after-action-reviews, which lead to further
insights for the future.
Technology Scope and Architecture: Wipro is very cognizant of the fact that they need
to remodel their processes and technical foundation to ensure that the IT infrastructure is
scalable. They have created autonomous structures combining IT, process, and
applications which will allow them to continue the same growth in the future, while
making sure that the data from the legacy systems are not lost by incorporating
middleware technologies. Mobile applications are also a top priority at Wipro. With more
than 50 offices in India and 30 offices abroad, scalability and flexibility are fundamental.
Different geographic locations have different IT requirement and Wipro’s IT
infrastructure conforms to each of the locations in a flexible manner to ensure
effectiveness/efficiency. The internet is the key enabler of their infrastructure. In addition
to physical security measures, frequent information audits are carried out to ensure a
secure environment. As Wipro keeps hiring more employees, IT enables scalability in the
HR process.
9 Chacko, G., “WIPRO: “From Coding to Consulting”, Management Research News, 2004 (24:7), pp.63
SAM Impact on Service Industry Firm Performance
Evidence of the relationship of alignment and firm performance continues to be strong.
Alignment has consistently demonstrated a positive association to firm performance. The
Appendix provides a summary of some new research and previous research relating SAM
and company performance.
This is once again demonstrated by the very strong correlation (.826) between SAM and
IT service firm performance (in this instance the Return on Assets). This research
supports the proposition that investing in aligning IT and business increases the firm’s
profitability. Thus, we suggest that IT and business leaders exercise the maximum effort
to align their IT and business organizations.
There were 19 IT service firms (14 Indian, 5 U.S.A) that participated in this evaluation.
The 95 respondents were comprised of 48 business executives and 47 IT executives.
CONCLUSIONS
Based on our research from the large organizations we examined from the USA, India,
Europe, and Latin America, although IT executives have rated alignment maturity
somewhat higher than their respective business executives, the relative scores are very
similar.
The “snapshots” of the four geographies showed that Indian companies have generally
scored higher when compared to the companies from the USA, Europe, and Latin
America. Although most of the Indian companies were from the IT service industry,
when just comparing IT service companies, India generally scored higher than the IT
service companies from the USA, Europe, and Latin America. However, with an overall
average alignment maturity score of 3.17, there are still significant opportunities to
improve.
Last, there continues to be demonstrable evidence that efforts to enhance IT business
alignment provide improved organizational performance.
REFERENCES
Shpilberg, D., Berez, S., Puryear, R. and Shah.S. (2007), Avoiding the Alignment Trap in
IT, 49, 1, 51-58
APPENDIX: THE RESEARCH PROCESS
The maturity levels for about two-thirds of the organizations in this study were gathered
from interviews or group (evaluation team) discussions; the data from the remaining one-
third were gathered from questionnaires (paper or online). The procedure using
“evaluation teams” was as follows.
1. Each of the criteria within the six components were first assessed individually by an
evaluation team that was typically comprised of leading IT and business executives from
the organization being assessed. All items for each component were rated on a 1-5 point
Likert scale, where “1” denoted very ineffective and “5” denoted very effective. Based on
these ratings, each of the 47 criteria (only the criterion used as maturity vehicles are
included in the figures) and the six components were categorized at Level 1, Level 2,
Level 3, Level 4, or Level 5. The figures do not include the criteria that did not affect the
maturity level (e.g., organization structure and IT reporting).
2. The evaluation team of IT and business executives (usually with an outside facilitator)
then used their individual ratings to converge on an overall assessment level/score of
maturity for the organization. This process applied the model as a descriptive tool.
3. The evaluation team then applied the next higher level of maturity as a prescriptive
roadmap to improve the alignment of IT and business by identifying specific
opportunities for moving to that next higher level.
APPENDIX: SAM IMPACT ON COMPANY PERFORMANCE
Alignment has consistently demonstrated a positive association to firm performance.
Regardless of culture, geographic location, or industry higher firm performance has been
repeatedly demonstrated to accompany higher alignment maturity. As displayed by the
strong correlation (.633) between SAM and firm performance for 78 organizations in our
repository from Pharmaceutical, Financial, Services, and Manufacturing companies
where Return on Assets (ROA) data was obtained, the relationship of SAM and firm
performance is strong. Of the 78 organizations, 64 were based in the United States and
14 were from India (all of the Indian firms in this discussion were from the IT service
industry). In this most research analysis, the ROA – is very significant. Return on Assets
represents company profitability relative to its total assets and is sometimes denoted as
return on investment.
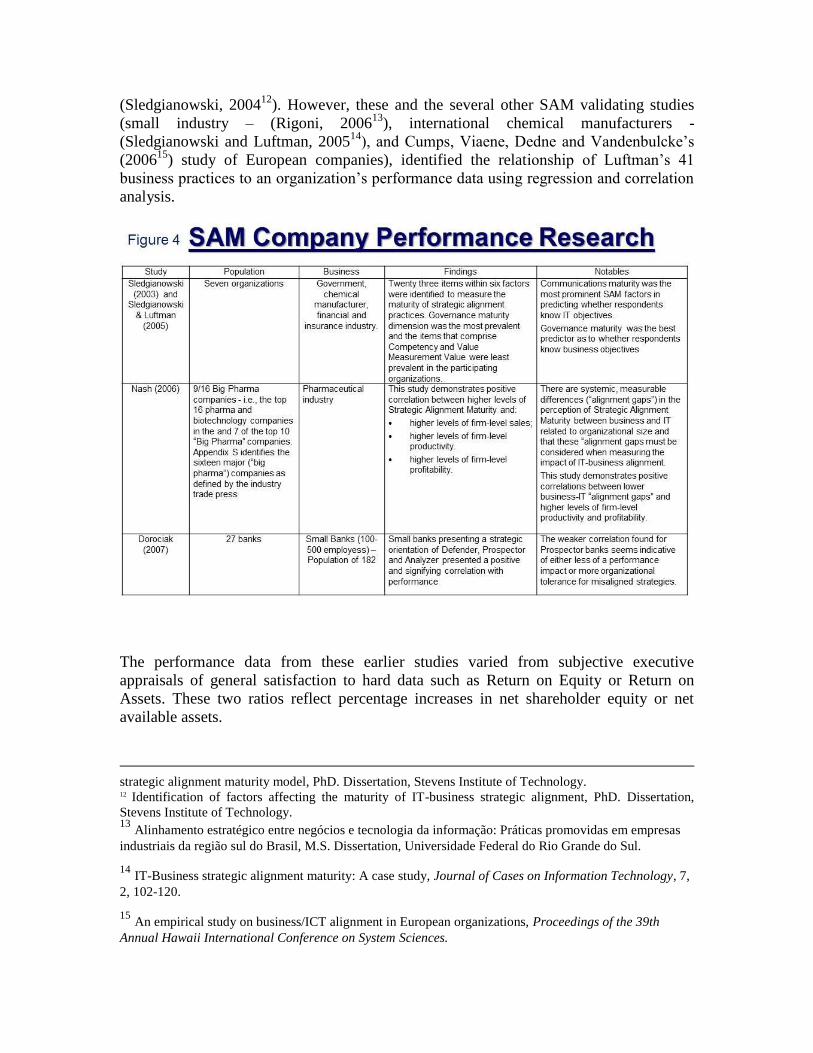
Previous SAM investigations (summarized in Figure 4) include the banking industry
(Dorociak, 200610
), pharmaceutical industry (Nash, 200611
), and government
10
The alignment between business and information systems strategies in small banks: An analysis of
performance impact, PhD. Dissertation, Capella University. 11 Assessing IT as a driver or enabler of transformation in the pharmaceutical industry employing the
(Sledgianowski, 200412
). However, these and the several other SAM validating studies
(small industry – (Rigoni, 200613
), international chemical manufacturers -
(Sledgianowski and Luftman, 200514
), and Cumps, Viaene, Dedne and Vandenbulcke’s
(200615
) study of European companies), identified the relationship of Luftman’s 41
business practices to an organization’s performance data using regression and correlation
analysis.
The performance data from these earlier studies varied from subjective executive
appraisals of general satisfaction to hard data such as Return on Equity or Return on
Assets. These two ratios reflect percentage increases in net shareholder equity or net
available assets.
strategic alignment maturity model, PhD. Dissertation, Stevens Institute of Technology. 12 Identification of factors affecting the maturity of IT-business strategic alignment, PhD. Dissertation,
Stevens Institute of Technology. 13
Alinhamento estratégico entre negócios e tecnologia da informação: Práticas promovidas em empresas
industriais da região sul do Brasil, M.S. Dissertation, Universidade Federal do Rio Grande do Sul. 14
IT-Business strategic alignment maturity: A case study, Journal of Cases on Information Technology, 7,
2, 102-120. 15
An empirical study on business/ICT alignment in European organizations, Proceedings of the 39th
Annual Hawaii International Conference on System Sciences.
SAM has been validated for multiple organization sizes, different industries, and the
public and private sectors. Each of the studies substantiated that higher SAM maturity
corresponded to increased organizational performance. That increased organizational
performance raises the businesses’ bottom line. To IT and business executives this means
that the firm should be actively pursuing activities with the goal of increasing alignment.
The cost benefit of SAM alignment seems highly favorable.


![LNBIP 112 - Strategic Alignment Maturity Model (SAMM) in a … · 2017-08-28 · more tiers. Balanced Scorecard (BSC) [1] is a widely used tool for business/IT alignment purposes.](https://static.documents.pub/doc/80x56/5f9ba39ac22e6d5d8b4903fd/lnbip-112-strategic-alignment-maturity-model-samm-in-a-2017-08-28-more-tiers.jpg)


