45
Business Opportunities in India - Clean Technology April 2014 Vibhav Kapoor Group Chief Investment Officer

Business Opportunities in India
-
Clean Technology April 2014
Vibhav Kapoor
Group Chief Investment Officer

Indian Infrastructure - Overview
• Twelfth five-year plan (2013 – 17), an inflexion point for expansive growth in Indian
Infrastructure
– FDI actively encouraged to achieve goals
– Propitious timing for sector focused investment
– A doubling of previous five-year plan target to $1 trillion
– Credit availability and long-term funding issues to be addressed
• PPP to increase to 50% of infrastructure spending, or $500 billion
• Loan growth in infrastructure at 30% in 2011-12
Source: Planning Commission

Indian Infrastructure - Opportunity
Housing Rapid urban migration to create massive demand
– Incremental 250 million urban population in 20 years
Transportation and Roads India currently has 4.3 million km of roads
35,000 km of highways to be built by 2014 - Estimated investment of $70 billion
Energy, Power and Utilities Total installed power generation capacity is 191 GW
Private sector used 40% of new capacity in 2007-12
Sea Ports/ Airports and Railways
Largest rail network in Asia - 64 thousand km and 1.4 mm employees
India has 12 major ports and over 200 minor ones
– Ports account for about 95% of foreign trade
Airports to handle 274 million passengers from 2013-17
$10 billion to be invested in airports in 2013-17
Water & Waste Management
68% household have access to safe drinking water
85% of population dependent on groundwater
$30 billion to be invested from 2012-2017
Waste levels to soar with urbanization and affluence
Education
World’s second largest higher education system
Colleges set up by state govt. or private institution
Around $70 billion education market
Environment
7th largest country in world with 3.3 million sq.km
150 million hectare has land degradation
$40 billion to be invested on environment projects 2013-17

Indian Infrastructure - Investments ($ in billions)
$500
$1,000
$456
11th FY Plan
(2007-12)
12th FY Plan
(2013-17)
Target Achieved
$165
$500
$291
$500
11th FY Plan
(2007-12)
12th FY Plan
(2013-17)
Private Public
($ in billions)
Other $91 Railways $71
Highway $65
Telecom $32
Ports $26
Power $160
Irrigation $18 Aviation $12
11th FY Plan: $456 billion
Bank Lending to Infrastructure
5%
14%
22%
25%
0%
6%
12%
18%
24%
30%
2000 2005 2010 2012
% o
f Tota
l Bank L
endin
g
Infrastructure Power Roads & Ports Total
Source: Planning Commission

IL&FS - Overview
• Established in 1987 and is the premier infrastructure and financial services firm delivering
innovative & practical solutions across India
• Pioneer of Public Private Partnership in India
• Servicing an outstanding portfolio of clients in the private and public sectors
• Strong team of ~ 1000 professionals
• Working on projects with an aggregate cost of US$ 25 bn
• Rated AAA by ICRA, India Ratings and CARE
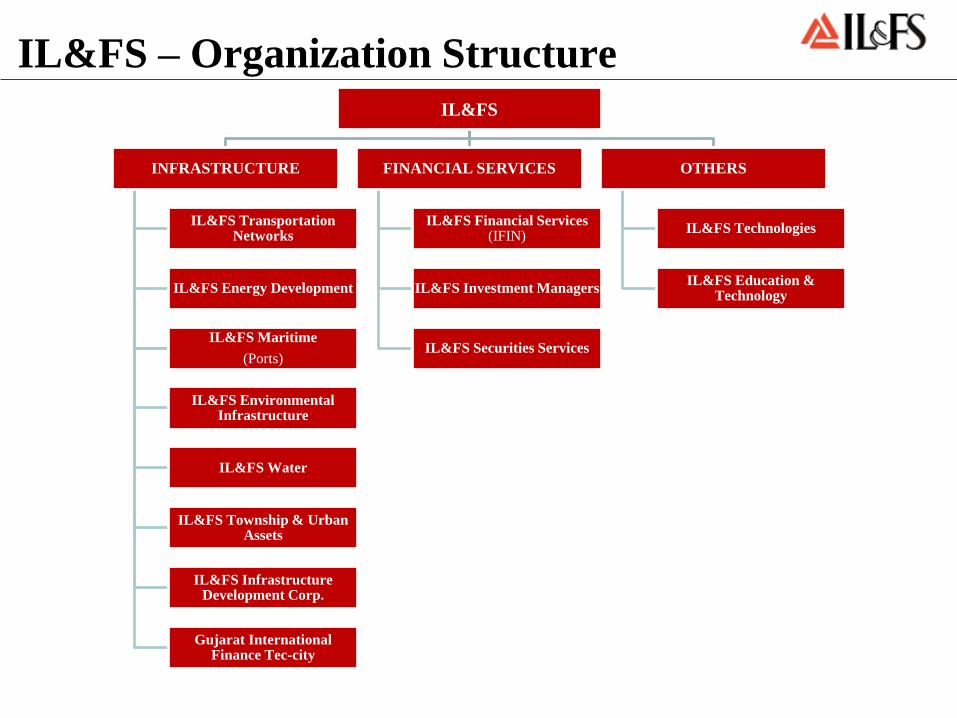
IL&FS – Organization Structure
IL&FS
INFRASTRUCTURE
IL&FS Transportation Networks
IL&FS Energy Development
IL&FS Maritime
(Ports)
IL&FS Environmental Infrastructure
IL&FS Water
IL&FS Township & Urban Assets
IL&FS Infrastructure Development Corp.
Gujarat International Finance Tec-city
FINANCIAL SERVICES
IL&FS Financial Services (IFIN)
IL&FS Investment Managers
IL&FS Securities Services
OTHERS
IL&FS Technologies
IL&FS Education & Technology
IL&FS in Infrastructure
IL&FS Transportation Networks:
• Leading surface transportation infrastructure company and the largest private sector BOT
road operator in India
• PAN India presence with around 13,161 lane kms spread over 26 BOT projects in 16 states
• Operational portfolio of 7,365 kms (17 road projects) of highways
• International operations – Spain, Portugal, Ukraine, Latin America, UAE and China
IL&FS Energy Development Company:
• Targeted Generation Capacity: 20,000 MW by 2020
• Presence in Clean Energy: through 100% subsidiary, “IL&FS Renewable Energy”
• Approx. 17,000 MW under implementation & development
– Operational capacity: 1,000 MW (incl. 500+ MW in Renewable Energy)
– Under Construction: 2100+ MW (expected by March’15)
– Under Development & In Pipeline: around 13,800 MW
IL&FS in Infrastructure…
IL&FS Township & Urban Assets:
Gujarat International Finance Tec-city (GIFT) – (50:50 JV between GUDC & IL&FS)
• Conceptualized as a global financial and IT services hub
• GIFT development is expected to become a contemporary model development in India,
advancing the ideas of sustainability and ecology
Model Economic Township (METCO)
GUDC: Gujarat Urban Development Company Ltd.
Clean Technology – India Perspective
• India ranks 136 in Human Development Index (HDI Report 2013)
• Energy remains of strategic importance for India
– Large dependence on imports to meet energy demand
– Fast growing economy
– Rising population
• Increasing urbanization – resulting in
– Increased pollution levels
– Reduction in forest areas, impacting environment
– Driving consumerism and in turn depletion of natural resources
• Conflict between Growth & Environmental issues

Developmental Challenge – India
• India is 4th largest consumer of oil & petroleum products
• Indian stands 3rd in total CO2 emissions
• As per Asian Development Study – 20 cities average water supply duration is 4.3 hours per
day
• Only around 27% of waste water is treated
• Around 70% of surface water and increasing number of ground water is being
contaminated
• Most of the Environmental issues entail higher costs of treatment
• Increased usage of insecticides and pesticides impacting yields of agricultural land
Positioning in Cleantech - India • Hi-tech and expensive technology like Industrial waste & affluent treatment – currently not
viable/affordable for developing country like India
• However, abundant alternate clean energy sources gives India opportunity to balance its
growth and meet environmental challenges economically.

Cleantech Opportunity – India
• India has vast untapped opportunity in renewable energy resources
• Large land mass with highest level of solar irradiation
• Extensive coastline and high wind velocity in many areas
• Numerous rivers and waterways
• Significant potential for energy generation from biomass of agricultural and forest residues
• Around 70 mn tons of Municipal Solid Waste generated per annum in Indian cities
Government Thrust – Sustainability • Indian Environment market is estimated to be growing at 9% per annum, Investment in
renewable energy was Euro 4.96 billion in 2012
• To reduce the intensity of emissions in its GDP by 20−25% from levels in 2005 by 2020,
[Government’s voluntary domestic commitment]
• India’s 12th five Year Plan (2012-2017), looks at reducing low-carbon inclusive growth
and aims to install 18.5 GW of renewable energy.
• Jawaharlal Nehru National Urban Renewal Mission (JNNURM): Encouraging reforms
and fast track planned development of 63 selected cities
• Focus on efficiency in urban infrastructure and accountability of Urban Local Bodies
• Investment of around Rs 150,000 cr
• Electricity Act 2003 allows power trading - encouraging Public Private Partnerships in
power generation, transmission, distribution and management
• 100% FDI in the renewable energy sector
Government Thrust - Favourable Policies
• Long term feed-in-tariffs
• Generation based incentives
• Tax incentives
– Income tax holiday
– Preferential tax rate
• Renewable purchase obligations (RPO)
• Tradable Renewable energy certificates (REC’s)
• Dedicated Ministry for renewable energy (MNRE)
• Providing financial assistance for renewable energy (IREDA)
• State level incentives like concessional wheeling charges, banking facility etc.
• Exemption from central sales tax and customs duty concessions on soft loans for the import
of material, components and equipment used in renewable energy projects
Indian Government released the National Action Plan on Climate Change (NAPCC) outlining
its strategy to meet the challenge of climate change.
MNRE: Ministry of New and Renewable Energy, IREDA: Indian Renewable Energy Development Agency

India’s Renewable Energy
• Installed Renewable Energy capacity in India: 12% of Total Capacity (Mar’13)
• Total Renewable Energy installed capacity in India: 31,205 MW (Jan’14)
Source: MNRE (figures are rounded to the nearest number)
Type (Grid & Off-Grid)
Installed Capacity (MW)
% of Renewable
Energy
Wind 20,299 65%
Small Hydro 3,774 12%
Biomass Power & Gasification 1,967 6%
Bagasse Cogeneration 2,513 8%
Solar 2,208 7%
Waste to Energy 219 1%
Others 225 1%
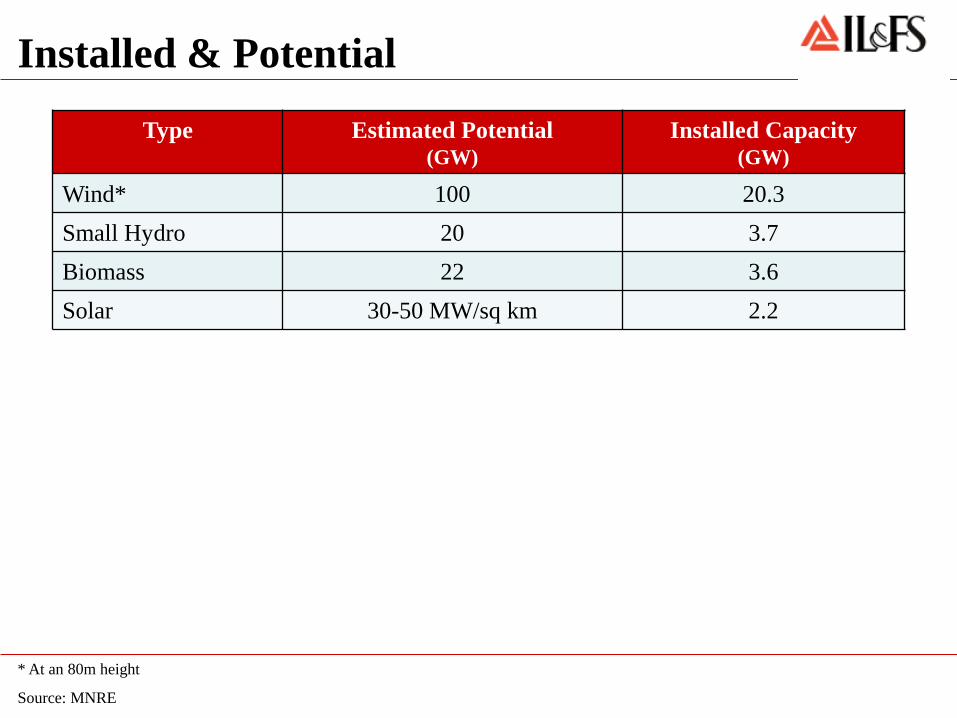
Installed & Potential
* At an 80m height
Source: MNRE
Type Estimated Potential (GW)
Installed Capacity (GW)
Wind* 100 20.3
Small Hydro 20 3.7
Biomass 22 3.6
Solar 30-50 MW/sq km 2.2
Wind Energy
• Installed Capacity of Wind Power in India: 20.3 GW (Jan’14)
• Share of Wind power to total renewable installed capacity: 65% (Jan’14)
– Accounted for about 3% of the country’s power generated in 2012-13.
• Advantages:
– Availability of large number of potential sites
– Modular nature of Wind farms and short construction period
– Establishment and rapid growth of Indian WEG Manufacturers
– Mature Technology
– Availability of experienced O & M Providers
• The incentives from Central and State governments for promotion of Renewable energy
have been the key growth drivers for Wind Energy.
– Enforcement of RPO’s and trading of REC’s are expected to support future wind power
installations
Source: MNRE, Crisil Research

Wind Energy - Rapid growth
Source:

Wind – Central Govt. initiatives
• In the union budget for 2013-14, Generation-based incentive (GBI) has been reintroduced
for wind energy projects (previously withdrawn for 2012 – 13)
• Ten-year income tax holiday under 80 IA of Income Tax act
• Budget 2013 has proposed that IREDA will provide low interest loans from the National
Clean Energy Fund for 5 years
• Concessional customs import duty on specified parts and components
• Excise duty relief
• Banks may soon consider a separate sectoral limit for renewable energy projects
IREDA: Indian Renewable Energy Development Agenecy
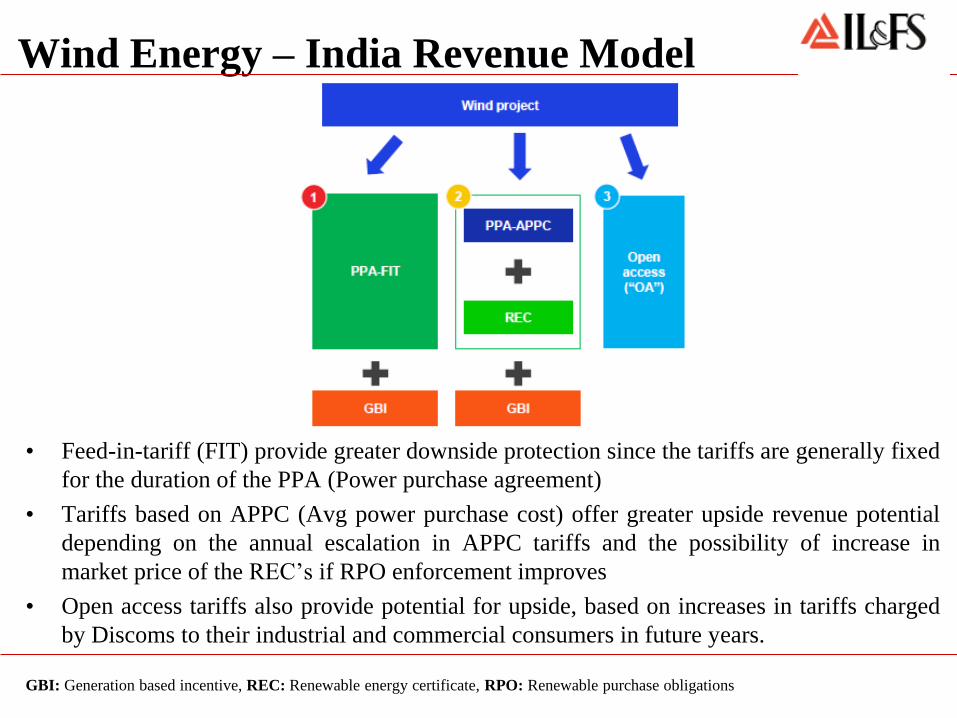
Wind Energy – India Revenue Model
• Feed-in-tariff (FIT) provide greater downside protection since the tariffs are generally fixed
for the duration of the PPA (Power purchase agreement)
• Tariffs based on APPC (Avg power purchase cost) offer greater upside revenue potential
depending on the annual escalation in APPC tariffs and the possibility of increase in
market price of the REC’s if RPO enforcement improves
• Open access tariffs also provide potential for upside, based on increases in tariffs charged
by Discoms to their industrial and commercial consumers in future years.
GBI: Generation based incentive, REC: Renewable energy certificate, RPO: Renewable purchase obligations

Wind Energy – all-India PLF Trend
• Higher rating turbines employed by the independent power producers resulted in better
Plant load factor in 2012-13, from a year earlier.
Source: CRISIL Research

Wind Energy – Expected IRR…
Key Assumptions:
• Approx. Capital Cost: Rs.60 million per MW
• Debt to Equity: 25 : 75
• PLF: 22%
• Interest Rate: 12%
• At a tariff of Rs.5.4/unit, one can expect an Equity IRR of 17 – 19%
• In addition to the above tariff, the project will get a “Generation based incentive” of
Rs.0.5/unit with a cap of Rs.10 million per MW, whichever is lower.
– The incentive will be available for longer period of 9 – 10 years
Source: MNRE, Crisil Research
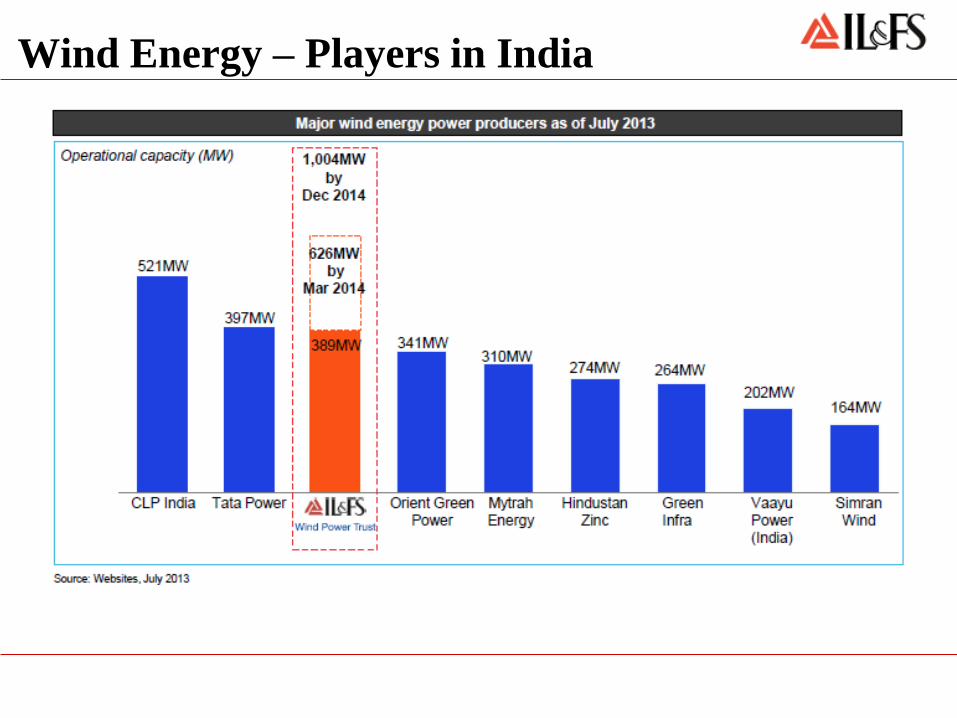
Wind Energy – Players in India

Solar Energy
• Total Installed Capacity: 2.2 GW (Jan’14)
• Gujarat & National Solar Mission contribute 70% of installations (1.4 GW)
• Total PPAs/MOUs signed by states: 4.4 GW
• Most of the states have declared Solar Renewable purchase obligations (RPO) between
0.35% to 3%
• 150 MW REC projects registered
Source: Company, CRISIL Research

Solar Energy…
• RPO installation achieved by select states: 1,416 MW (50% of target)
• National Solar Mission Program and State RPO driven programs are driving growth
• Parity Based Projects are becoming popular
• PLFs of 19 to 22% delivered
• Attractive states: Madhya Pradesh, Andhra Pradesh, Tamil Nadu, Karnataka, Punjab

Solar - Tariff
• Solar Power in the recently concluded JNNSM bid (open category) averaged Rs. 6.51/kWh
($10.5 c/Kwhr) and in Madhya Pradesh bid averaged Rs. 6.85/kWh ($11c/Kwhr)
• Economies of scale to reduce solar power to Rs. 5.5/kWh ($ 8.8 c/Kwhr) by FY2017/18
2,8 3,2 3,7 4,1 5,1 5,5 5,8
6,0 6,4 6,7 7,0 7,4
15,0
13,4
11,4
8,4 7,0 6,5
6,0
5,5 5,5 5,5 5,5 5,5
0,0
2,0
4,0
6,0
8,0
10,0
12,0
14,0
16,0
2009 2010 2011 2012 2013 2014 2015 2016 2017 2018 2019 2020
Rs./kWh
Tariff - Conventional vs. Solar
Conventional
Solar
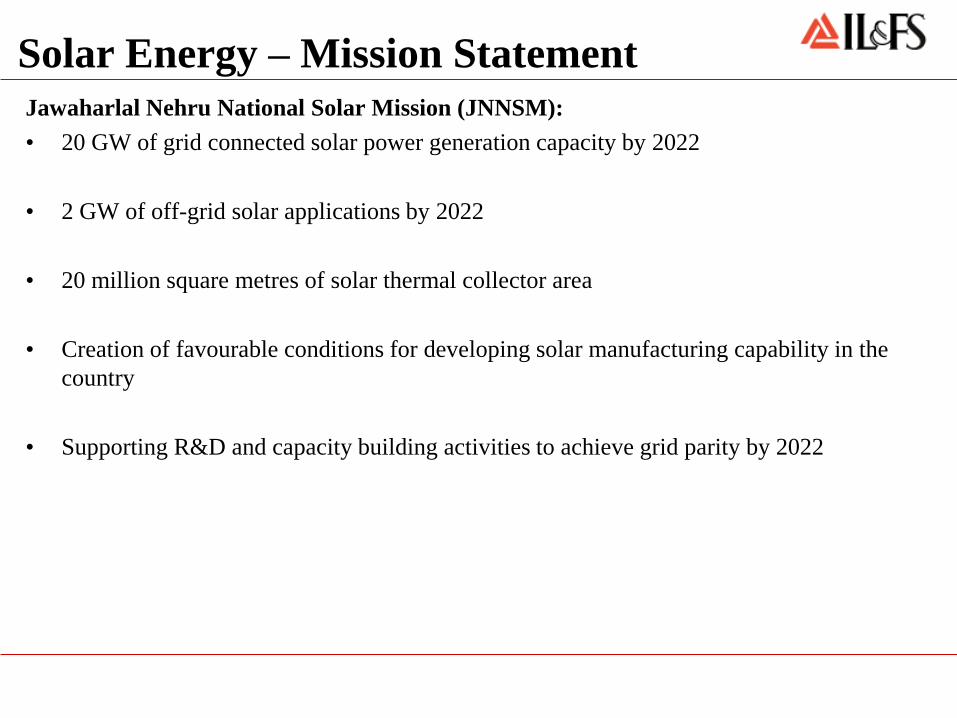
Solar Energy – Mission Statement
Jawaharlal Nehru National Solar Mission (JNNSM):
• 20 GW of grid connected solar power generation capacity by 2022
• 2 GW of off-grid solar applications by 2022
• 20 million square metres of solar thermal collector area
• Creation of favourable conditions for developing solar manufacturing capability in the
country
• Supporting R&D and capacity building activities to achieve grid parity by 2022
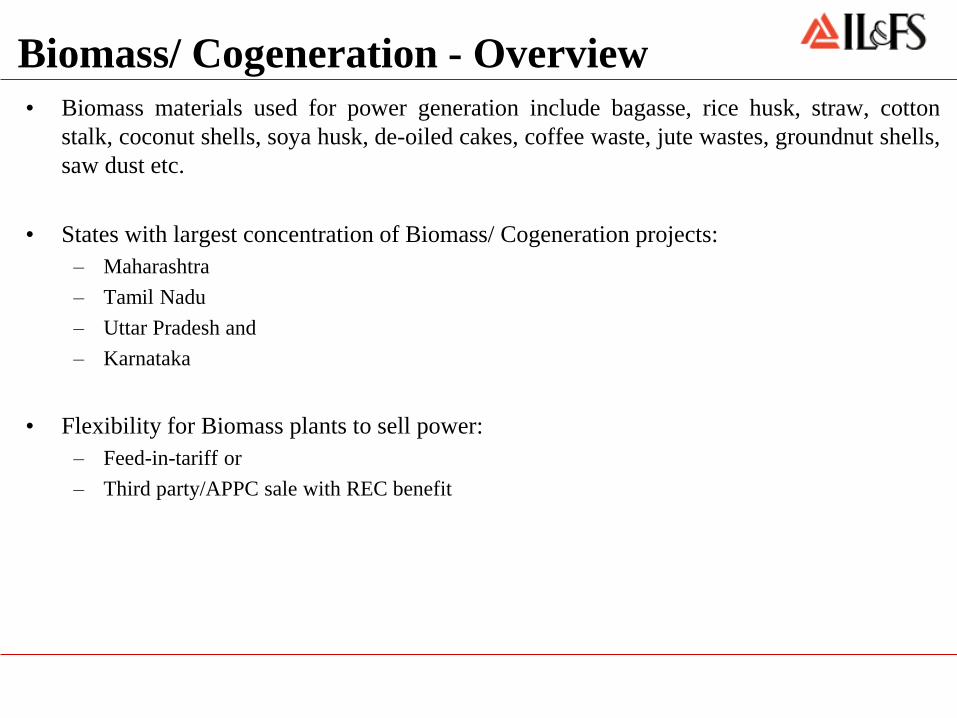
Biomass/ Cogeneration - Overview
• Biomass materials used for power generation include bagasse, rice husk, straw, cotton
stalk, coconut shells, soya husk, de-oiled cakes, coffee waste, jute wastes, groundnut shells,
saw dust etc.
• States with largest concentration of Biomass/ Cogeneration projects:
– Maharashtra
– Tamil Nadu
– Uttar Pradesh and
– Karnataka
• Flexibility for Biomass plants to sell power:
– Feed-in-tariff or
– Third party/APPC sale with REC benefit
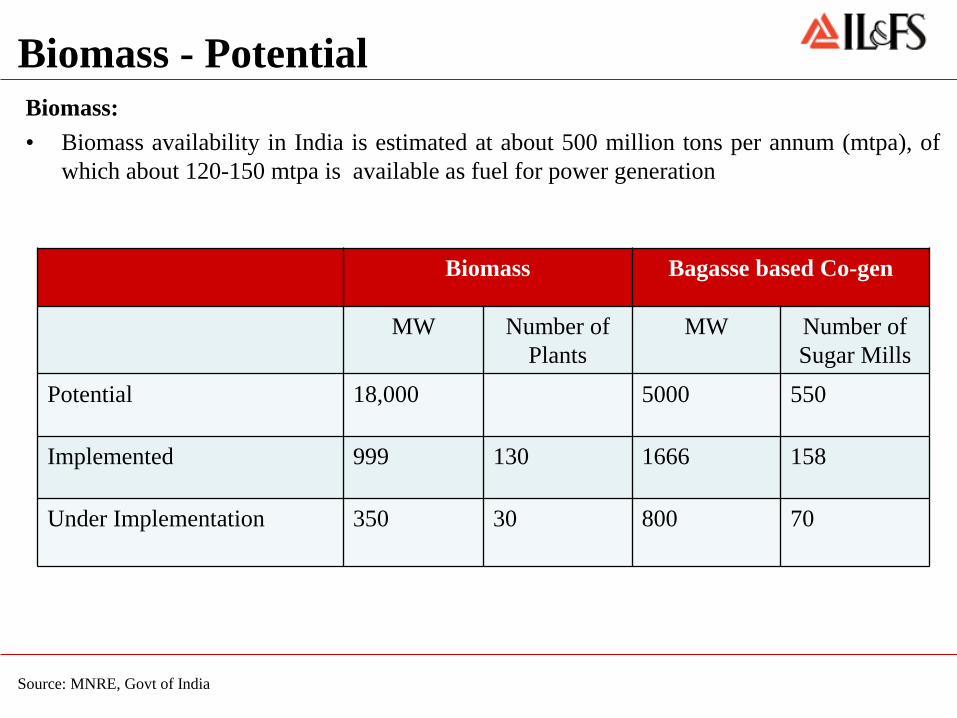
Biomass - Potential
Biomass:
• Biomass availability in India is estimated at about 500 million tons per annum (mtpa), of
which about 120-150 mtpa is available as fuel for power generation
Source: MNRE, Govt of India
Biomass Bagasse based Co-gen
MW Number of
Plants
MW Number of
Sugar Mills
Potential 18,000 5000 550
Implemented 999 130 1666 158
Under Implementation 350 30 800 70
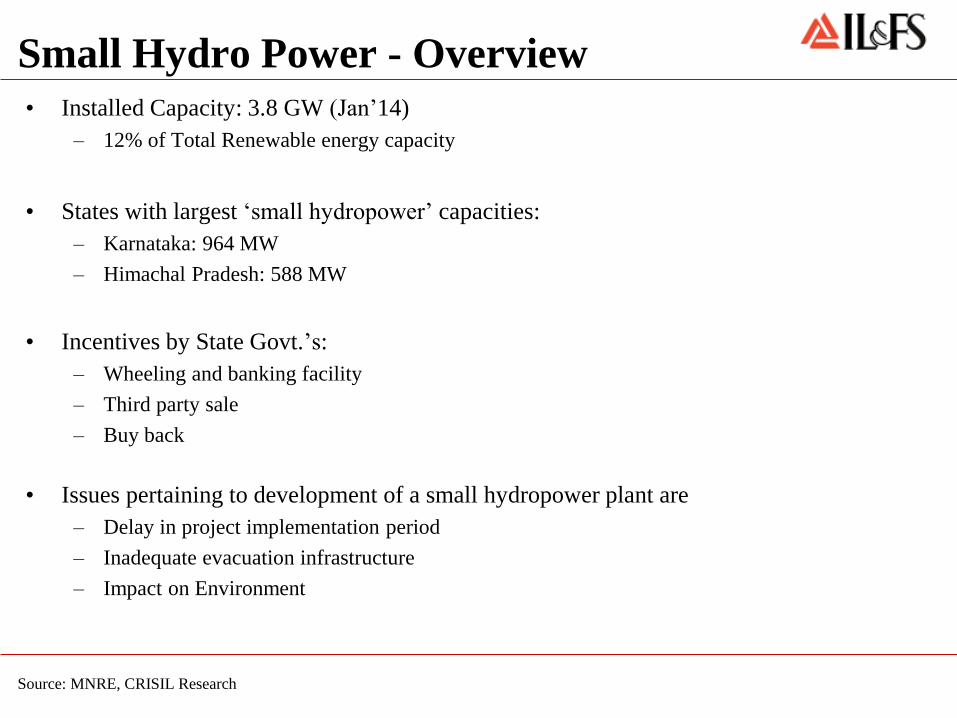
Small Hydro Power - Overview
• Installed Capacity: 3.8 GW (Jan’14)
– 12% of Total Renewable energy capacity
• States with largest ‘small hydropower’ capacities:
– Karnataka: 964 MW
– Himachal Pradesh: 588 MW
• Incentives by State Govt.’s:
– Wheeling and banking facility
– Third party sale
– Buy back
• Issues pertaining to development of a small hydropower plant are
– Delay in project implementation period
– Inadequate evacuation infrastructure
– Impact on Environment
Source: MNRE, CRISIL Research
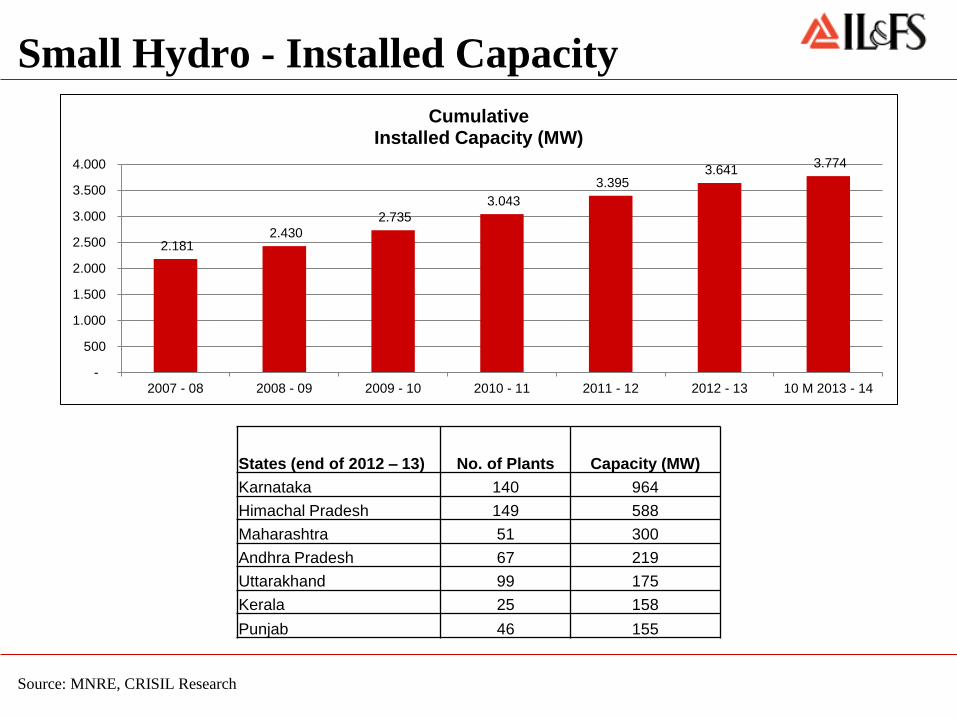
Small Hydro - Installed Capacity
Source: MNRE, CRISIL Research
2.181 2.430
2.735
3.043
3.395 3.641
3.774
-
500
1.000
1.500
2.000
2.500
3.000
3.500
4.000
2007 - 08 2008 - 09 2009 - 10 2010 - 11 2011 - 12 2012 - 13 10 M 2013 - 14
Cumulative Installed Capacity (MW)
States (end of 2012 – 13) No. of Plants Capacity (MW)
Karnataka 140 964
Himachal Pradesh 149 588
Maharashtra 51 300
Andhra Pradesh 67 219
Uttarakhand 99 175
Kerala 25 158
Punjab 46 155

Small Hydro - Potential
• Targeted capacity additions in the 12th five year plan: 2,100 MW
– Cumulative capacity potential: 19,749 MW.
• In the Northern region, Himachal Pradesh accounts for nearly 36% of total region's
potential capacity
• In the Southern region, Karnataka accounts for nearly 64% of total region’s potential
capacity
Source: MNRE, CRISIL Research
Capacity Potential (MW) 19,749
North 33%
North East 12%
East 7%
West 15%
South 33%
Waste Management
• Rapid urbanization and industrialization has resulted in increasing amount of hazardous
wastes every year
• Waste Management has become a major area of concern for Government and corporations
• Municipal Solid Waste Management includes efficiently handling:
– Institutional waste
– Dead animal waste at slaughter houses
– Demolition and construction wastes
– Wastes which gets accumulated on the roads
– Treated bio-medical waste
– Sludge from industries
– Commercial waste from market areas

India - Waste Scenario
• About 70 mn tons of Municipal Solid Waste (MSW) generated per annum in
Indian cities – estimated to go upto 260 mn tons in 2047 (TERI)
• Open dumping a common practise; no scientific closure of landfills – public
health menace, Green House Gas (GHG) emissions, etc.
• Sitting on an Urban catastrophe……….

Processing & Disposal: The Weakest Links
• No. of dumpsites in top-200 cities of India: 400
• 80% of Municipal Waste budgets focussed on collection and transportation
• Processing and Scientific disposal are the weakest links (less than 5% of the
MSW in India is disposed in a proper scientific manner)
• Land availability for disposal is a challenge
• Existing dumpsites are overflowing and pose a serious safety and health hazard
• Processing can reduce the volume of waste to landfill / dumpsite by 80% by
converting the waste into useful by-products

India’s unique proposition
• Wealth from Waste – organic fraction from MSW contains biodegradable matter ranging
from 30-55%, can be profitably converted into
– Compost – organic manure
– Methane gas – used for cooking, lighting, heating, production of energy
• Recycling of waste – plastics, paper, glass, metal, etc recycled to get useful resources
• Sanitary Landfilling – rejects from compost plant, recycling and other inorganic materials
like construction debris in MSW are sent to scientifically engineered landfills

India - Water Scenario
• Total annual utilizable water available in India: 1,123 billion cubic metres (bcm)
– Central Water Commission of Govt. of India
• However, as per Narsimhan (2008) observation, the total utilizable water for
human is calculated at 654 bcm, which is alarmingly close to current usage –
raising serious scarcity issue in future
• Per capita water availability per year: has fallen from 1820 cm to 1544 cm
– less than 1,700 cm indicates stress
• High level of organic and bacterial contaminants in surface water due to
inadequate sewage treatment

Cleantech Opportunity - Water
• Demand-supply imbalance creating opportunities with steady increase in demand from
rising population and industrial sector
– Water-related equipment makers in the irrigation and agriculture usage
– Increased supply coverage across the country
• Increased funding support from Central Govt.
– 11th 5 year plan: Rs. 1,267 billion
– 12th 5 year plan: Rs. 1,832 billion
• Ageing water supply infrastructure
• Increased awareness about quality of drinking water
– Water treatment equipment makers
• Reducing availability to drive reuse, recycling, desalination of water
– Vast coastline of the Indian shores, provide huge scope for desalination of water to meet the
higher demand
– Advanced technology for reuse and recycling of water
Water – Issues/Challenges
• Lack of uniformity in Institutional frameworks and tariff structures governing the
sector
• One has to not only deal with Central govt but also with State & Municipal
bodies
• Lack of viable projects on BOOT basis due to poor contract structuring
• Long gestation for PPP projects
• Non-utilizable water
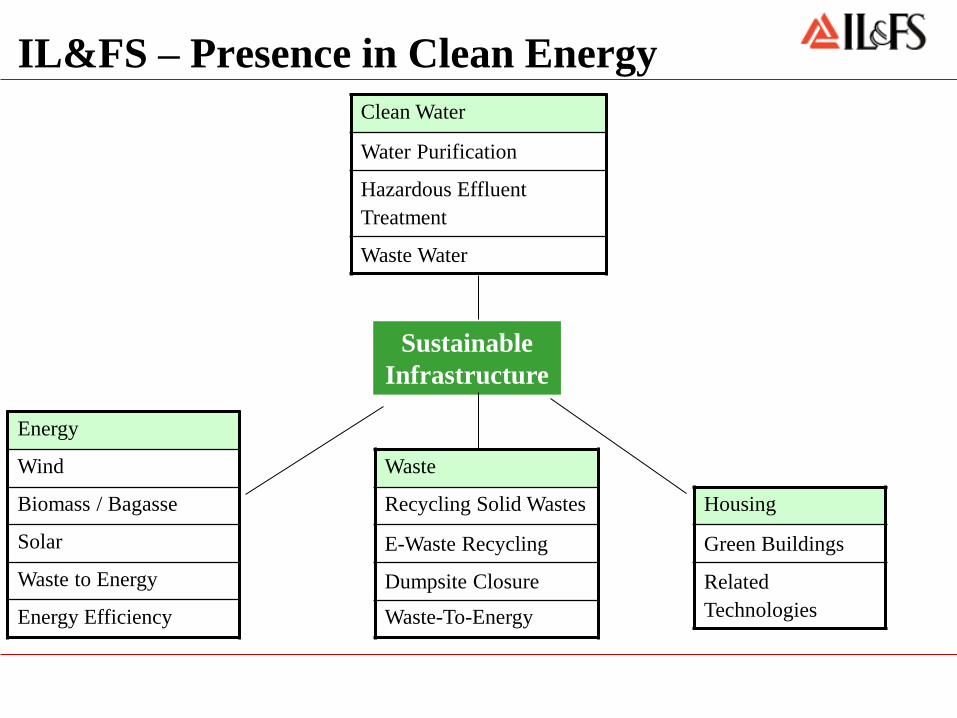
IL&FS – Presence in Clean Energy
Sustainable
Infrastructure
Clean Water
Water Purification
Hazardous Effluent
Treatment
Waste Water
Housing
Green Buildings
Related
Technologies
Energy
Wind
Biomass / Bagasse
Solar
Waste to Energy
Energy Efficiency
Waste
Recycling Solid Wastes
E-Waste Recycling
Dumpsite Closure
Waste-To-Energy

IL&FS – in Renewable Energy
Type Operational / Near Completion
(MW)
Pipeline
(MW)
Wind 626 3,000
Waste to Energy 12
Biomass/ Bagasse 105
Solar 1,350
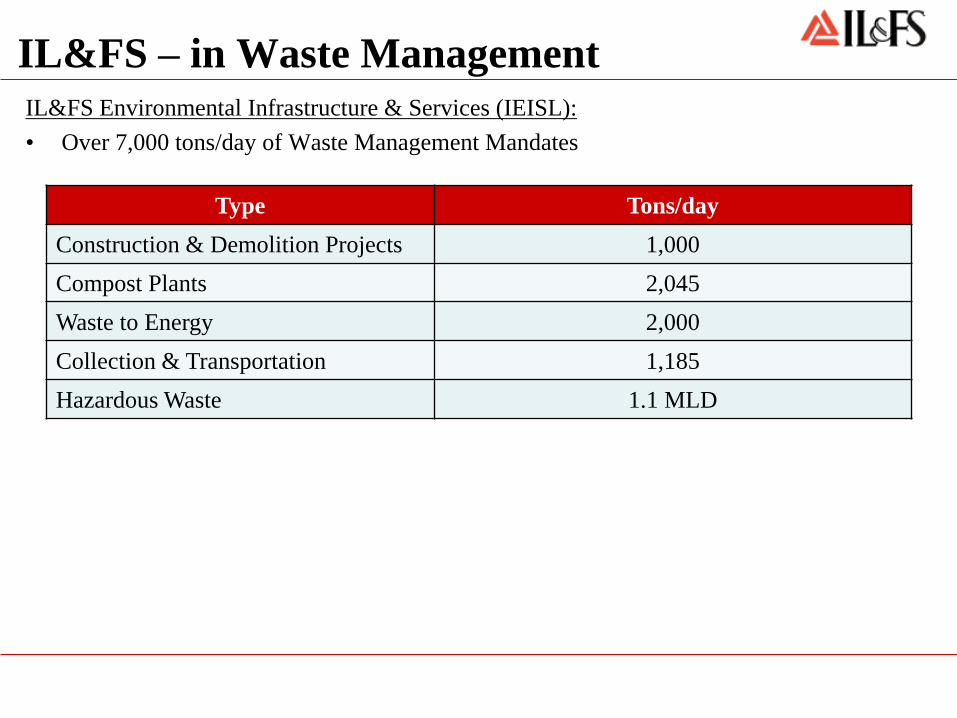
IL&FS – in Waste Management
IL&FS Environmental Infrastructure & Services (IEISL):
• Over 7,000 tons/day of Waste Management Mandates
Type Tons/day
Construction & Demolition Projects 1,000
Compost Plants 2,045
Waste to Energy 2,000
Collection & Transportation 1,185
Hazardous Waste 1.1 MLD

IL&FS – Waste Management Strategy
• Due to the current focus on consolidation and aggressive bidding environment in the
market, IEISL is participating very selectively in bids. Focus on O&M mandates to
conserve capital
• Diversifying client base by targeting environmental/waste management services for the
private sector (e.g. Coke, Pepsi) and townships
• Built a reputation of operating waste management facilities effectively, due to which we
are getting a number of enquiries from several state governments
• Focused on sell side of the business and on markets close to plants in an effort to reduce
transportation costs and enhance profitability
• Developed a hugely scalable model in waste processing which is increasingly independent
of municipal payment risk. The combination of higher net sales realization for compost,
RDF capability and carbon revenues will establish a rock solid foundation for profitability
IEISL: IL&FS Environmental Infrastructure & Services Ltd. (Subsidiary of IL&FS)

IL&FS – in Water
• Largest private sector water company in India with projects worth Rs.20 bn under PPP
model
• Implemented project for supply of 185/250 mld in Tirpur and similar in Orissa on BOOT
basis
• Working on a partnership with a Belgium company on 24X7 continuous water supply
system
• Was involved in the initial developmental phase of Desalination plant of 100 mld capacity
in Tamil Nadu
• Supply of sewage treated water

Thank You


