40
Business outlook in Azerbaijan Fourth Edition Deloitte CIS Research Centre 1H 2019

Business outlook in AzerbaijanFourth EditionDeloitte CIS Research Centre1H 2019
02
Brochure / report title goes here | Section title goes here
ContentsIntroduction 03
Azerbaijanin figures Macroeconomic outlook (GDP, inflation, currency rates etc.) 04
Keyindustriesofeconomy 12
Businessoutlookin Azerbaijan Research Centre analysis 22
Aboutrespondents 38
Contacts 39
Business outlook in Azerbaijan
03
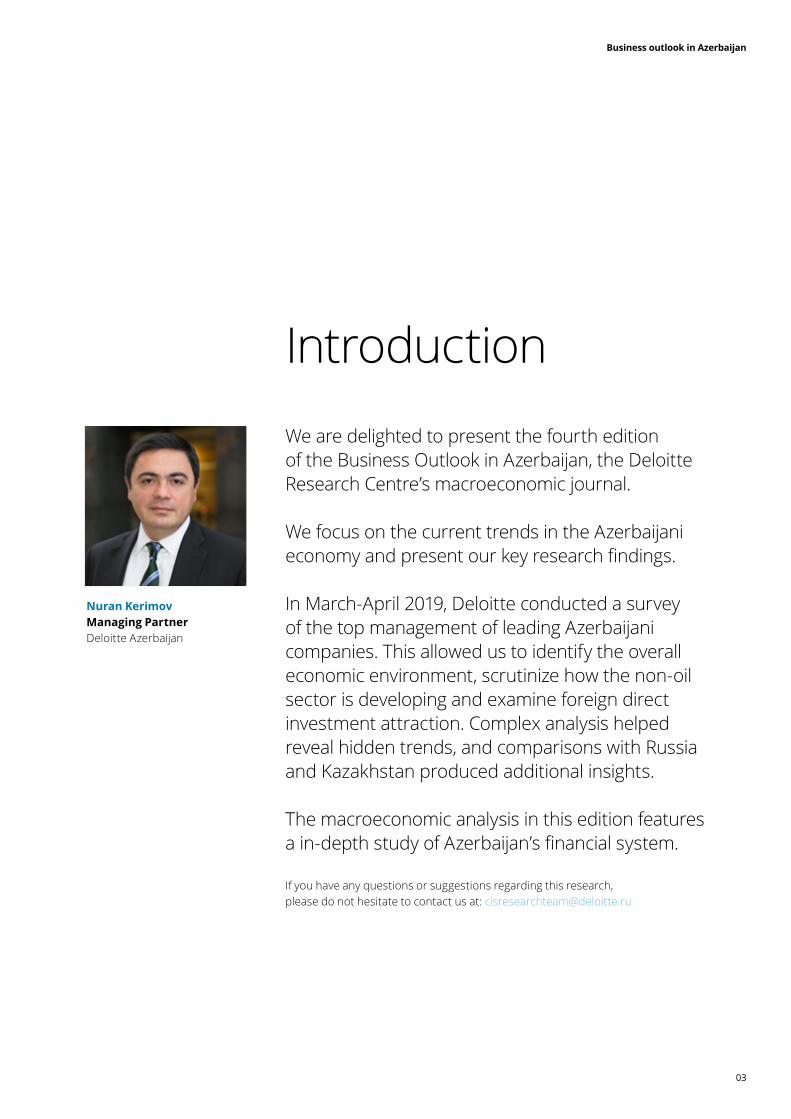
IntroductionWe are delighted to present the fourth edition of the Business Outlook in Azerbaijan, the Deloitte Research Centre’s macroeconomic journal.
We focus on the current trends in the Azerbaijani economy and present our key research findings.
In March-April 2019, Deloitte conducted a survey of the top management of leading Azerbaijani companies. This allowed us to identify the overall economic environment, scrutinize how the non-oil sector is developing and examine foreign direct investment attraction. Complex analysis helped reveal hidden trends, and comparisons with Russia and Kazakhstan produced additional insights.
The macroeconomic analysis in this edition features a in-depth study of Azerbaijan’s financial system.
If you have any questions or suggestions regarding this research, please do not hesitate to contact us at: [email protected]
NuranKerimovManagingPartnerDeloitte Azerbaijan

Business outlook in Azerbaijan
04
Azerbaijan in figures 01
Business outlook in Azerbaijan
05
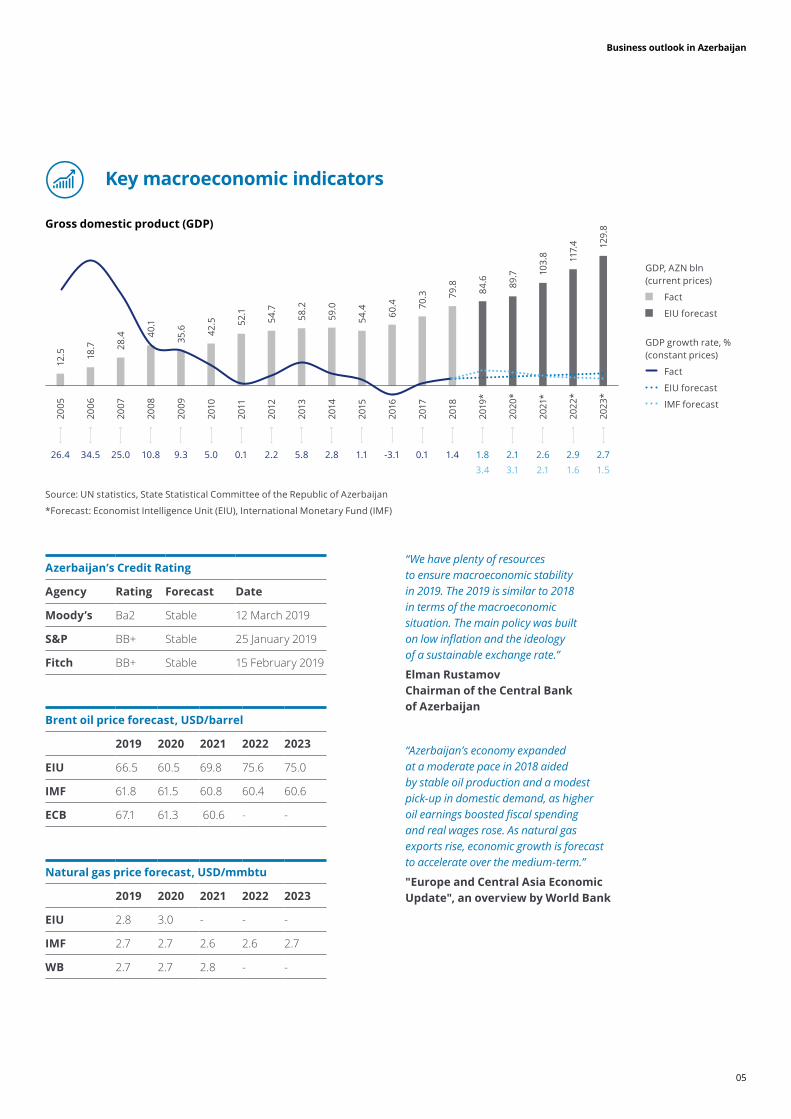
Grossdomesticproduct(GDP)
Keymacroeconomicindicators
Source: UN statistics, State Statistical Committee of the Republic of Azerbaijan
*Forecast: Economist Intelligence Unit (EIU), International Monetary Fund (IMF)
“We have plenty of resources to ensure macroeconomic stability in 2019. The 2019 is similar to 2018 in terms of the macroeconomic situation. The main policy was built on low inflation and the ideology of a sustainable exchange rate.”
ElmanRustamov ChairmanoftheCentralBankof Azerbaijan
“Azerbaijan’s economy expanded at a moderate pace in 2018 aided by stable oil production and a modest pick-up in domestic demand, as higher oil earnings boosted fiscal spending and real wages rose. As natural gas exports rise, economic growth is forecast to accelerate over the medium-term.”
"EuropeandCentralAsiaEconomicUpdate",anoverviewbyWorldBank
Azerbaijan’sCreditRating
Agency Rating Forecast Date
Moody’s Ba2 Stable 12 March 2019
S&P BB+ Stable 25 January 2019
Fitch BB+ Stable 15 February 2019
Brentoilpriceforecast,USD/barrel
2019 2020 2021 2022 2023
EIU 66.5 60.5 69.8 75.6 75.0
IMF 61.8 61.5 60.8 60.4 60.6
ECB 67.1 61.3 60.6 - -
Naturalgaspriceforecast,USD/mmbtu
2019 2020 2021 2022 2023
EIU 2.8 3.0 - - -
IMF 2.7 2.7 2.6 2.6 2.7
WB 2.7 2.7 2.8 - -
GDP, AZN bln (current prices)
Fact
EIU forecast
GDP growth rate, % (constant prices)
Fact
EIU forecast
IMF forecast
12.5
35.6
58.2 70
.3
103.
8
18.7
42.5 59
.0
79.8
117.
4
28.4
52.1
54.4
84.6
129.
8
40.1 54
.7 60.4
89.7
2005
2009
2013
2017
2021
*
2006
2010
2014
2018
2022
*
2007
2011
2015
2019
*
2023
*
2008
2012
2016
2020
*
34.5 5.0 2.8 1.410.8 2.2 -3.126.4 9.3 5.8 0.125.0 0.1 1.1 1.8 2.72.6 2.92.13.4 1.52.1 1.63.1
Business outlook in Azerbaijan
06
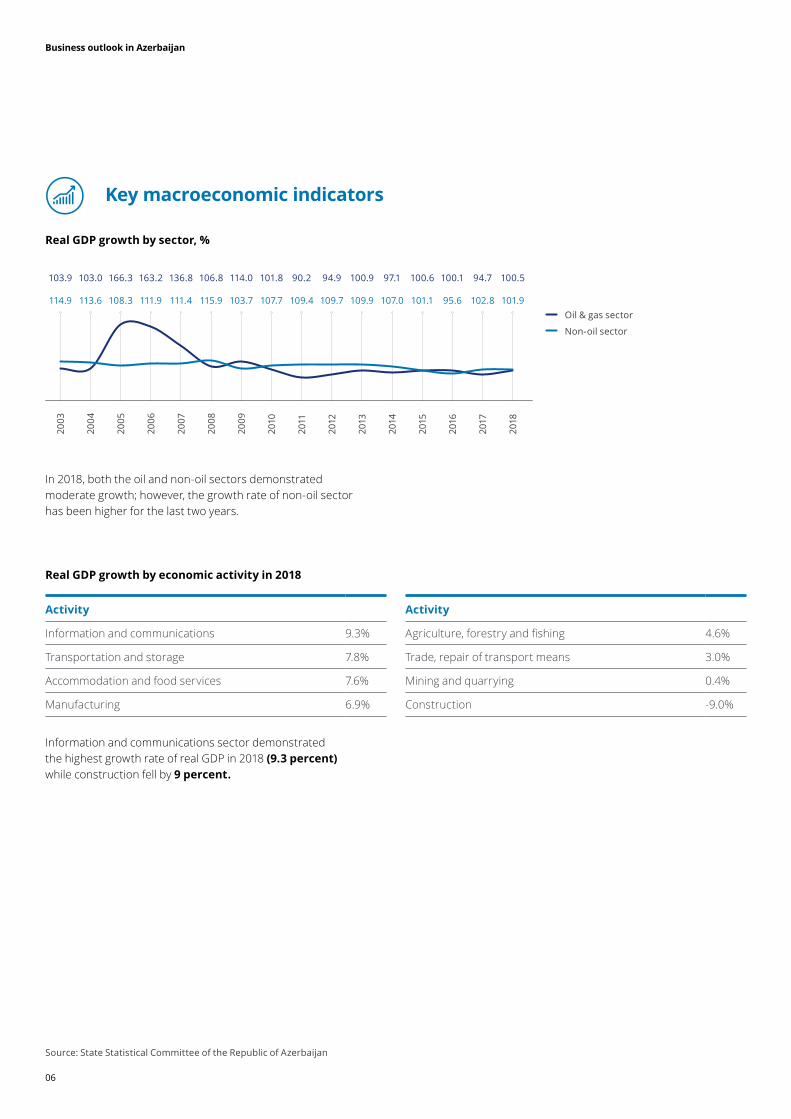
Information and communications sector demonstrated the highest growth rate of real GDP in 2018(9.3 percent)while construction fell by 9 percent.
Keymacroeconomicindicators
2003
2007
2011
2015
2004
2008
2012
2016
2005
2009
2013
2017
2006
2010
2014
2018
103.0 106.8 94.9 100.1163.2 101.8 97.1103.9 136.8 90.2 100.6166.3 114.0 100.9 94.7 100.5
113.6 115.9 109.7 95.6111.9 107.7 107.0114.9 111.4 109.4 101.1108.3 103.7 109.9 102.8 101.9 Oil & gas sector
Non-oil sector
RealGDPgrowthbyeconomicactivityin2018
RealGDPgrowthbysector,%
Activity
Information and communications 9.3%
Transportation and storage 7.8%
Accommodation and food services 7.6%
Manufacturing 6.9%
Activity
Agriculture, forestry and fishing 4.6%
Trade, repair of transport means 3.0%
Mining and quarrying 0.4%
Construction -9.0%
Source: State Statistical Committee of the Republic of Azerbaijan
In 2018, both the oil and non-oil sectors demonstrated moderate growth; however, the growth rate of non-oil sector has been higher for the last two years.
Business outlook in Azerbaijan
07
Exports of goods
Imports of goods
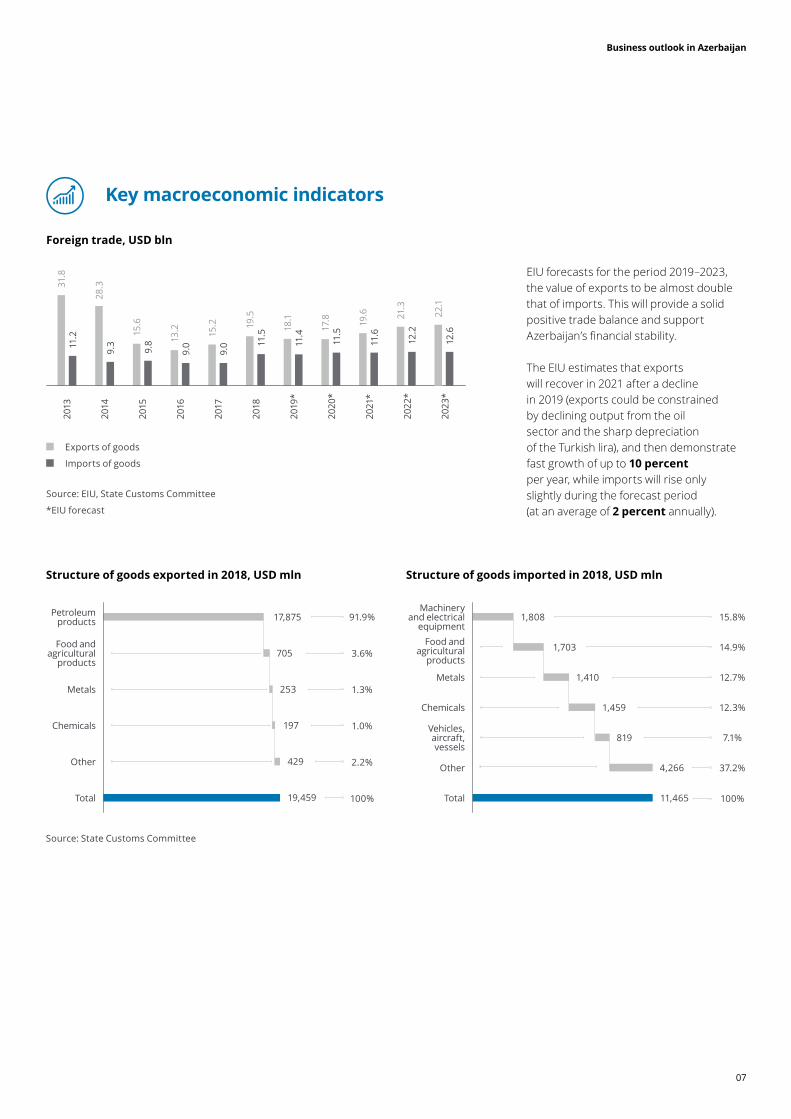
Source: State Customs Committee
Structureofgoodsexportedin2018,USDmln Structureofgoodsimportedin2018,USDmln
14.9%
37.2%
12.3%
15.8%
7.1%
12.7%
100%Total
Machinery and electrical
equipment
Vehicles, aircraft, vessels
Food and agricultural
products
Other
Metals
Chemicals
1,808
819
1,703
4,266
11,465
1,410
1,459
Petroleum products
Other
Food and agricultural
products
Total
Metals
Chemicals
3.6%
100%
1.0%
91.9%
2.2%
1.3%
17,875
429
705
19,459
253
197
Foreigntrade,USDbln
Source: EIU, State Customs Committee
*EIU forecast
EIU forecasts for the period 2019–2023, the value of exports to be almost double that of imports. This will provide a solid positive trade balance and support Azerbaijan’s financial stability.
The EIU estimates that exports will recover in 2021 after a decline in 2019 (exports could be constrained by declining output from the oil sector and the sharp depreciation of the Turkish lira), and then demonstrate fast growth of up to 10 percentper year, while imports will rise only slightly during the forecast period (at an average of 2 percent annually).
Keymacroeconomicindicators
2013
2017
2021
*
2014
2018
2022
*
2015
2019
*
2016
2020
*
31.8
15.2 19
.6
28.3
19.5 21
.3
15.6 18.1
13.2 17
.8
11.2
9.0 11
.6
9.3 11
.5
12.2
9.8 11
.4
9.0 11
.5
2023
*22
.112
.6
Business outlook in Azerbaijan
08
Keymacroeconomicindicators
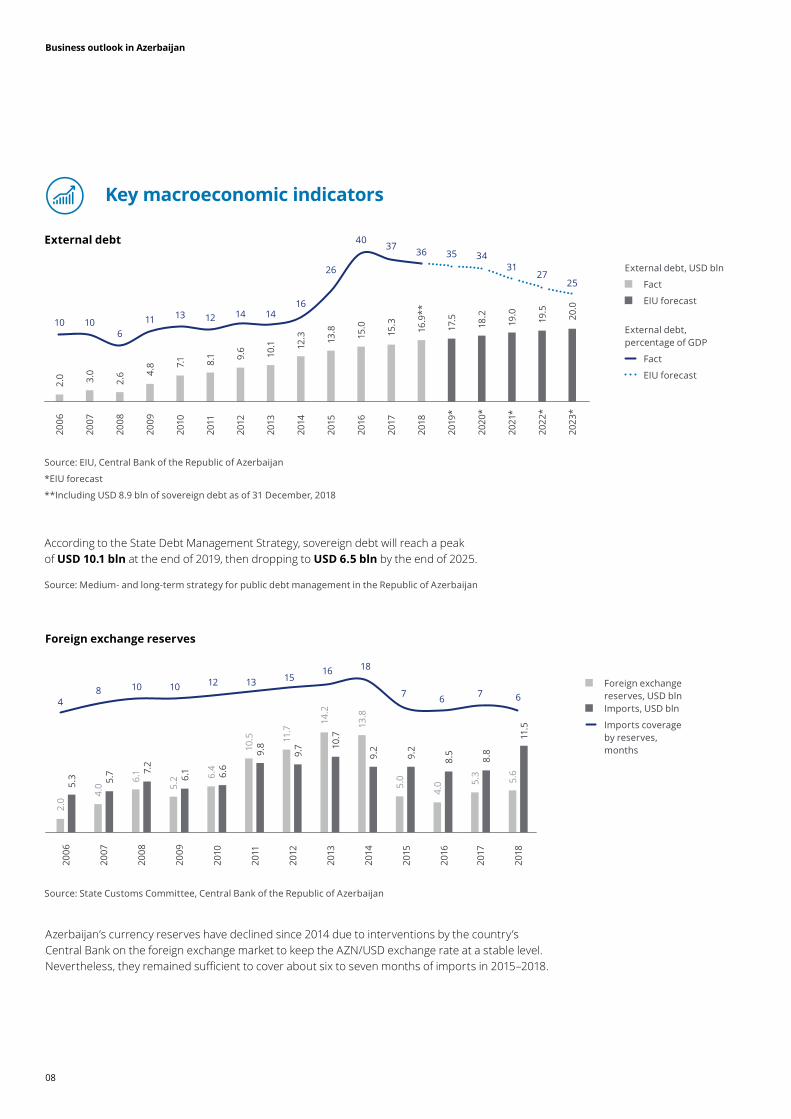
Azerbaijan’s currency reserves have declined since 2014 due to interventions by the country’s Central Bank on the foreign exchange market to keep the AZN/USD exchange rate at a stable level. Nevertheless, they remained sufficient to cover about six to seven months of imports in 2015–2018.
Foreignexchangereserves
Foreign exchange reserves, USD bln
Imports, USD bln
Imports coverage by reserves, months
813
710
16
74
12
18
610
15
6
2006
2010
2014
2007
2011
2015
2008
2012
2009
2013
2.0
6.4
13.8
4.0
10.5
5.06.
1
11.7
5.2
14.2
5.3 6.
6
9.2
5.7
9.8
9.2
7.2
9.7
6.1
10.7
2016
4.0
8.5
2017
2018
5.3
5.6
8.8
11.5
Source: State Customs Committee, Central Bank of the Republic of Azerbaijan
Source: EIU, Central Bank of the Republic of Azerbaijan
*EIU forecast
**Including USD 8.9 bln of sovereign debt as of 31 December, 2018
External debt, USD bln
Fact
EIU forecast
External debt, percentage of GDP
Fact
EIU forecast
2.0
7.1
12.3
16.9
**
19.5
3.0
8.1
13.8 17
.5 20.0
2.6
9.6
15.0 18
.2
4.8
10.1
15.3 19
.0
2006
2010
2014
2018
2022
*
2007
2011
2015
2019
*
2023
*
2008
2012
2016
2020
*
2009
2013
2017
2021
*
10 12
26
35
11 14
37
1013
16
36
6
14
40
34
2725
31
According to the State Debt Management Strategy, sovereign debt will reach a peak of USD 10.1blnat the end of 2019, then dropping to USD 6.5 bln by the end of 2025.
Source: Medium- and long-term strategy for public debt management in the Republic of Azerbaijan
Externaldebt
Business outlook in Azerbaijan
09
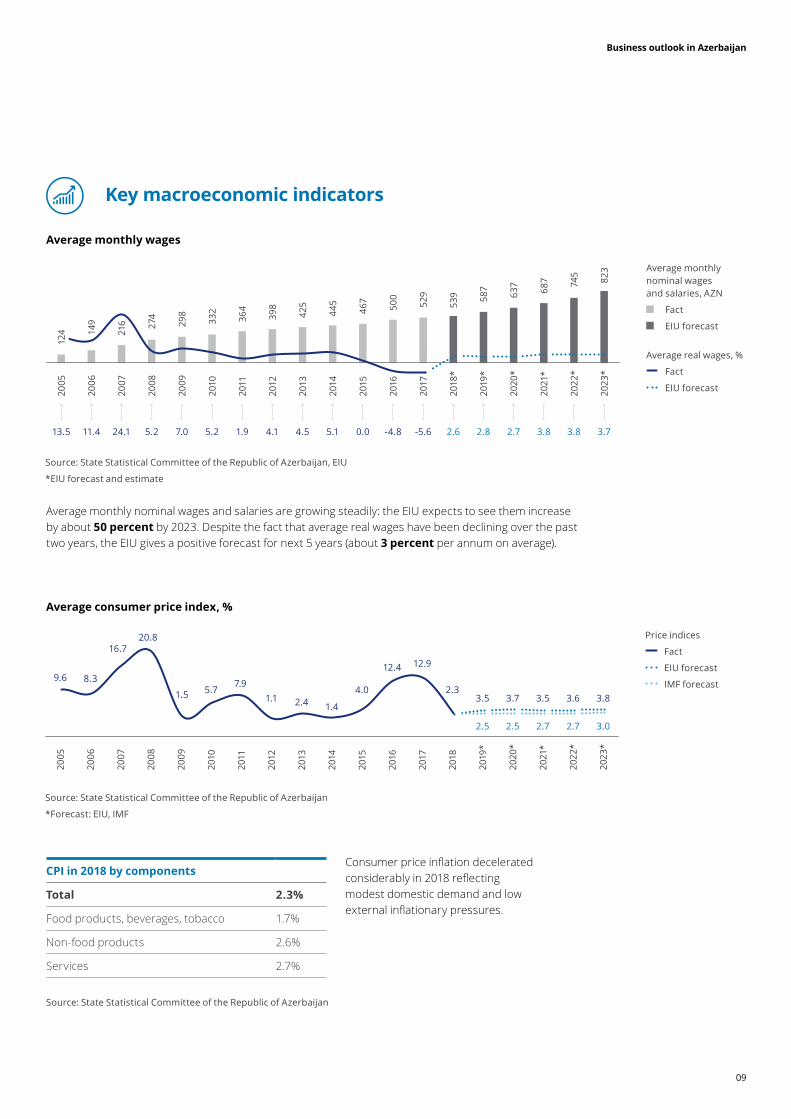
Average monthly nominal wages and salaries are growing steadily: the EIU expects to see them increase by about50percent by 2023. Despite the fact that average real wages have been declining over the past two years, the EIU gives a positive forecast for next 5 years (about 3percentper annum on average).
Consumer price inflation decelerated considerably in 2018 reflecting modest domestic demand and low external inflationary pressures.
Averagemonthlywages
Averageconsumerpriceindex,%
Keymacroeconomicindicators
Source: State Statistical Committee of the Republic of Azerbaijan
*Forecast: EIU, IMF
Average monthly nominal wages and salaries, AZN
Fact
EIU forecast
Average real wages, %
Fact
EIU forecast
Price indices
Fact
EIU forecast
IMF forecast
2005
2009
2013
2017
2021
*
2006
2010
2014
2018
2022
*
2007
2011
2015
2019
*
2023
*
2008
2012
2016
2020
*
8.35.7
1.4
2.3
20.8
1.1
12.49.6
1.52.4
12.916.7
7.94.0
3.5 3.83.5 3.63.7
2.5 3.02.7 2.72.5
CPIin2018bycomponents
Total 2.3%
Food products, beverages, tobacco 1.7%
Non-food products 2.6%
Services 2.7%
Source: State Statistical Committee of the Republic of Azerbaijan
Source: State Statistical Committee of the Republic of Azerbaijan, EIU
*EIU forecast and estimate
298
425
529
687
149
332
445
539
745
216
364
467
587
823
274
398
500
637
124
20
05
2009
2013
2017
2021
*
2006
2010
2014
2018
*
2022
*
2007
2011
2015
2019
*
2023
*
2008
2012
2016
2020
*
11.4 5.2 5.1 2.65.2 4.1 -4.813.5 7.0 4.5 -5.624.1 1.9 0.0 2.8 3.73.8 3.82.7
124
Business outlook in Azerbaijan
10
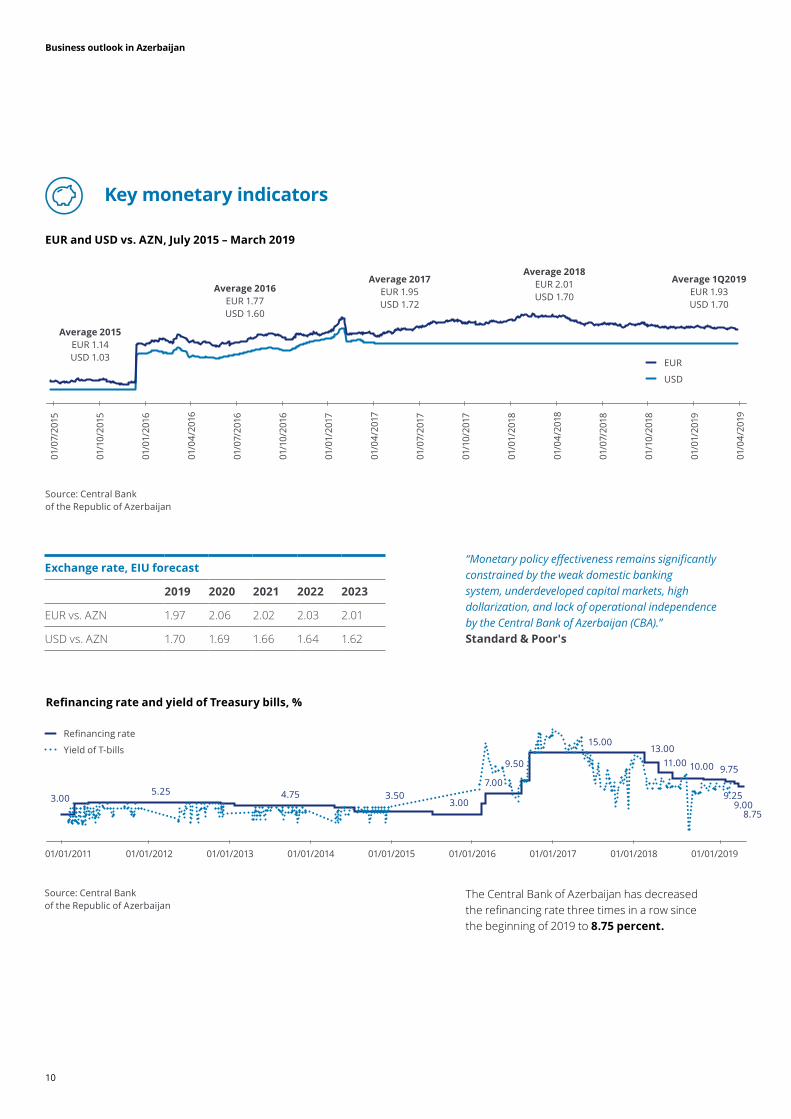
Keymonetaryindicators
The Central Bank of Azerbaijan has decreased the refinancing rate three times in a row since the beginning of 2019 to 8.75 percent.
“Monetary policy effectiveness remains significantly constrained by the weak domestic banking system, underdeveloped capital markets, high dollarization, and lack of operational independence by the Central Bank of Azerbaijan (CBA).”Standard&Poor's
Source: Central Bank of the Republic of Azerbaijan
Exchangerate,EIUforecast
2019 2020 2021 2022 2023
EUR vs. AZN 1.97 2.06 2.02 2.03 2.01
USD vs. AZN 1.70 1.69 1.66 1.64 1.62
RefinancingrateandyieldofTreasurybills,%
EURandUSDvs.AZN,July2015–March2019
Source: Central Bank of the Republic of Azerbaijan
Average2015EUR 1.14USD 1.03
Average2016EUR 1.77USD 1.60
Average2017EUR 1.95USD 1.72
EUR
USD
Average2018EUR 2.01USD 1.70
Average1Q2019EUR 1.93USD 1.70
01/0
7/20
15
01/0
7/20
16
01/0
7/20
17
01/1
0/20
15
01/1
0/20
16
01/1
0/20
17
01/0
1/20
16
01/0
1/20
17
01/0
1/20
18
01/0
4/20
16
01/0
4/20
17
01/0
4/20
18
01/0
7/20
18
01/1
0/20
18
01/0
1/20
19
01/0
4/20
19
5.253.00
15.00
3.00 3.504.757.00
Refinancing rate
Yield of T-bills9.50
13.0011.00 10.00 9.75
9.259.00
01/01/2011 01/01/201501/01/2012 01/01/201601/01/2013 01/01/201701/01/2014 01/01/2018 01/01/2019
8.75
Business outlook in Azerbaijan
11
Business outlook in Azerbaijan
12
Key industries of economy02
Banking
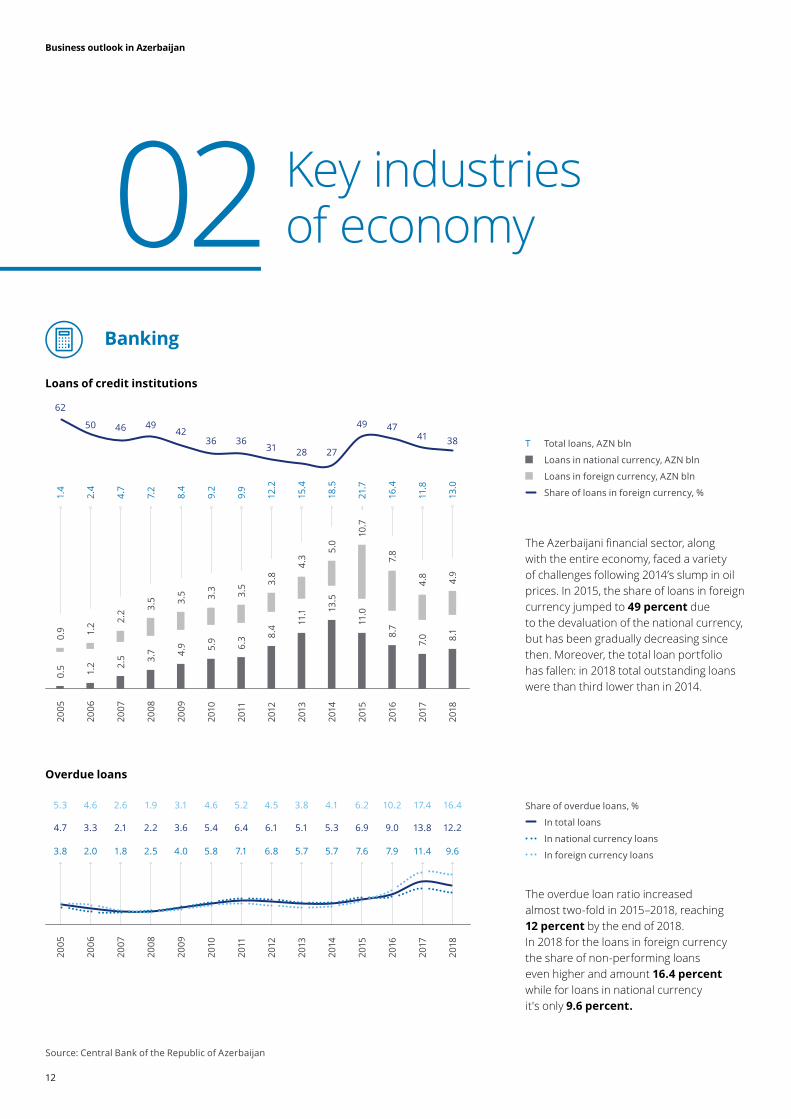
Loansofcreditinstitutions
Overdueloans
The Azerbaijani financial sector, along with the entire economy, faced a variety of challenges following 2014’s slump in oil prices. In 2015, the share of loans in foreign currency jumped to 49percent due to the devaluation of the national currency, but has been gradually decreasing since then. Moreover, the total loan portfolio has fallen: in 2018 total outstanding loans were than third lower than in 2014.
The overdue loan ratio increased almost two-fold in 2015–2018, reaching 12 percent by the end of 2018. In 2018 for the loans in foreign currency the share of non-performing loans even higher and amount 16.4percent while for loans in national currency it's only 9.6 percent.
Share of overdue loans, %
In total loans
In national currency loans
In foreign currency loans
Source: Central Bank of the Republic of Azerbaijan
T Total loans, AZN bln
Loans in national currency, AZN bln
Loans in foreign currency, AZN bln
Share of loans in foreign currency, %
0.5
4.9
11.1
7.0
1.2
5.9
13.5
8.1
2.5
6.3
11.0
3.7
8.4
8.7
2005
2009
2013
2017
2006
2010
2014
2007
2011
2015
2008
2012
2016
2018
1.4
8.4
15.4
11.8
2.4
9.2
18.5
13.0
4.7
9.9
21.7
7.2
12.2
16.4
0.9
3.5
4.3
4.8
1.2
3.3
5.0
4.9
2.2
3.5
10.7
3.5
3.8
7.8
50
3627
38
49
31
47
62
42
28
4146
36
49
2005
2009
2013
2017
2006
2010
2014
2018
2007
2011
2015
2008
2012
2016
4.6 4.6 4.1 16.41.9 4.5 10.25.3 3.1 3.8 17.42.6 5.2 6.2
3.3 5.4 5.3 12.22.2 6.1 9.04.7 3.6 5.1 13.82.1 6.4 6.9
2.0 5.8 5.7 9.62.5 6.8 7.93.8 4.0 5.7 11.41.8 7.1 7.6
Business outlook in Azerbaijan
13
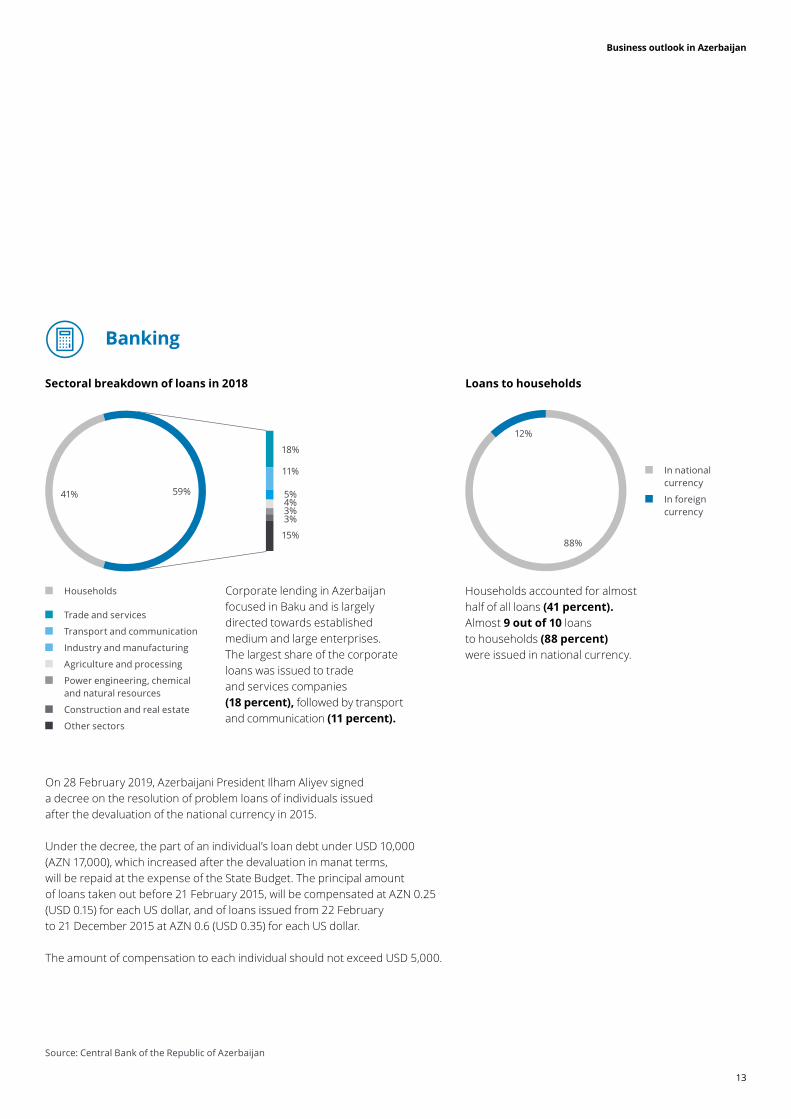
Sectoralbreakdownofloansin2018 Loanstohouseholds
Households accounted for almost half of all loans (41 percent). Almost 9 out of 10 loans to households (88 percent)were issued in national currency.
Corporate lending in Azerbaijan focused in Baku and is largely directed towards established medium and large enterprises.The largest share of the corporate loans was issued to trade and services companies (18 percent),followed by transport and communication (11percent).
Source: Central Bank of the Republic of Azerbaijan
41% 59%
18%
11%
5%4%3%3%
15%
Households
Trade and services
Transport and communication
Industry and manufacturing
Agriculture and processing
Power engineering, chemical and natural resources
Construction and real estate
Other sectors
In national currency
In foreign currency
12%
88%
Banking
On 28 February 2019, Azerbaijani President Ilham Aliyev signed a decree on the resolution of problem loans of individuals issued after the devaluation of the national currency in 2015.
Under the decree, the part of an individual’s loan debt under USD 10,000 (AZN 17,000), which increased after the devaluation in manat terms, will be repaid at the expense of the State Budget. The principal amount of loans taken out before 21 February 2015, will be compensated at AZN 0.25 (USD 0.15) for each US dollar, and of loans issued from 22 February to 21 December 2015 at AZN 0.6 (USD 0.35) for each US dollar.
The amount of compensation to each individual should not exceed USD 5,000.
Business outlook in Azerbaijan
14
Banking
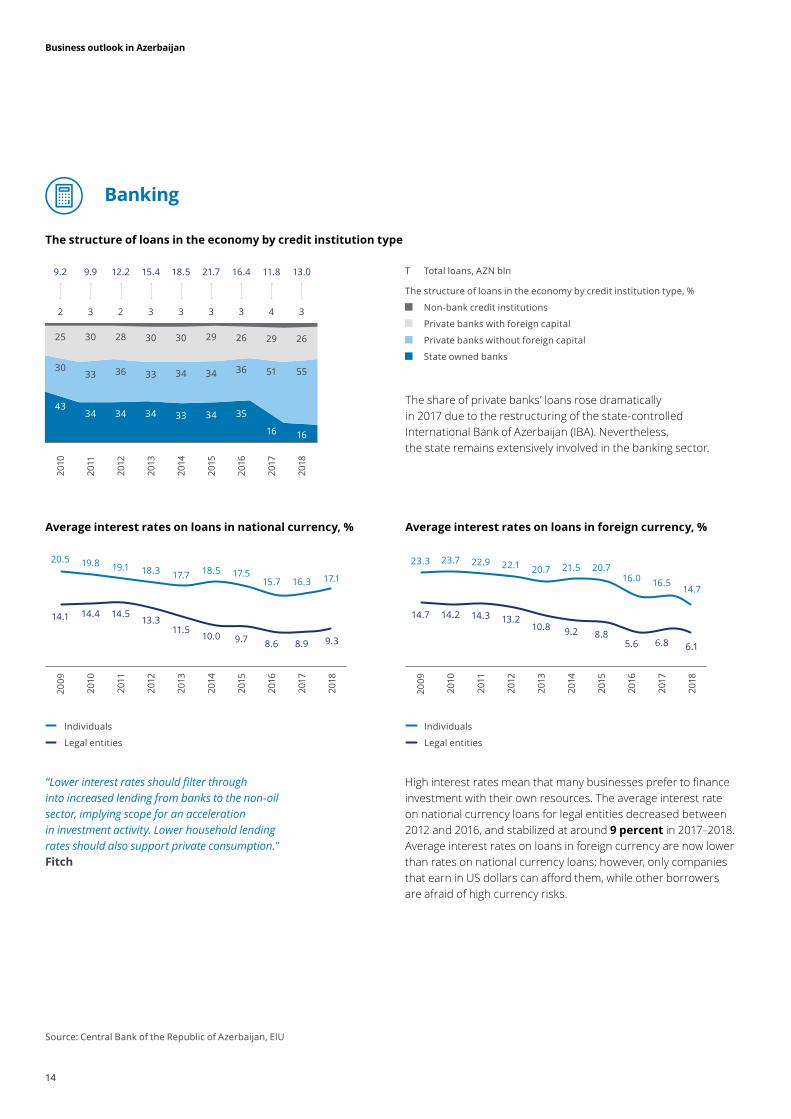
Thestructureofloansintheeconomybycreditinstitutiontype
Averageinterestratesonloansinnationalcurrency,% Averageinterestratesonloansinforeigncurrency,%
The share of private banks’ loans rose dramatically in 2017 due to the restructuring of the state-controlled International Bank of Azerbaijan (IBA). Nevertheless, the state remains extensively involved in the banking sector.
Source: Central Bank of the Republic of Azerbaijan, EIU
9.9 21.715.4 11.89.2 18.5 13.012.2 16.4
3 33 42 3 32 3
30 2930 2925 30 2628 26
33 3433 5130 34 5536 36
34 3434
16
4333
16
34 35
2010
2014
2018
2011
2015
2012
2016
2013
2017
14.4
10.0 9.3
13.3
8.6
14.111.5
8.9
14.5
9.7
2009
2013
2017
2010
2014
2018
2011
2015
2012
2016
19.818.5
17.118.3
15.7
20.5
17.716.3
19.1 17.5
Individuals
Legal entities
Individuals
Legal entities
14.2
9.26.1
13.2
5.6
14.710.8
6.8
14.3
8.8
2009
2013
2017
2010
2014
2018
2011
2015
2012
2016
23.721.5
14.7
22.116.0
23.320.7
16.5
22.9 20.7
High interest rates mean that many businesses prefer to finance investment with their own resources. The average interest rate on national currency loans for legal entities decreased between 2012 and 2016, and stabilized at around 9percentin 2017–2018. Average interest rates on loans in foreign currency are now lower than rates on national currency loans; however, only companies that earn in US dollars can afford them, while other borrowers are afraid of high currency risks.
T Total loans, AZN bln
The structure of loans in the economy by credit institution type, %
Non-bank credit institutions
Private banks with foreign capital
Private banks without foreign capital
State owned banks
“Lower interest rates should filter through into increased lending from banks to the non-oil sector, implying scope for an acceleration in investment activity. Lower household lending rates should also support private consumption.”Fitch
Business outlook in Azerbaijan
15
Banking
Averageinterestratesondepositsinnationalcurrency,% Averageinterestratesondepositsinforeigncurrency,%
Source: Central Bank of the Republic of Azerbaijan
Individuals Individuals
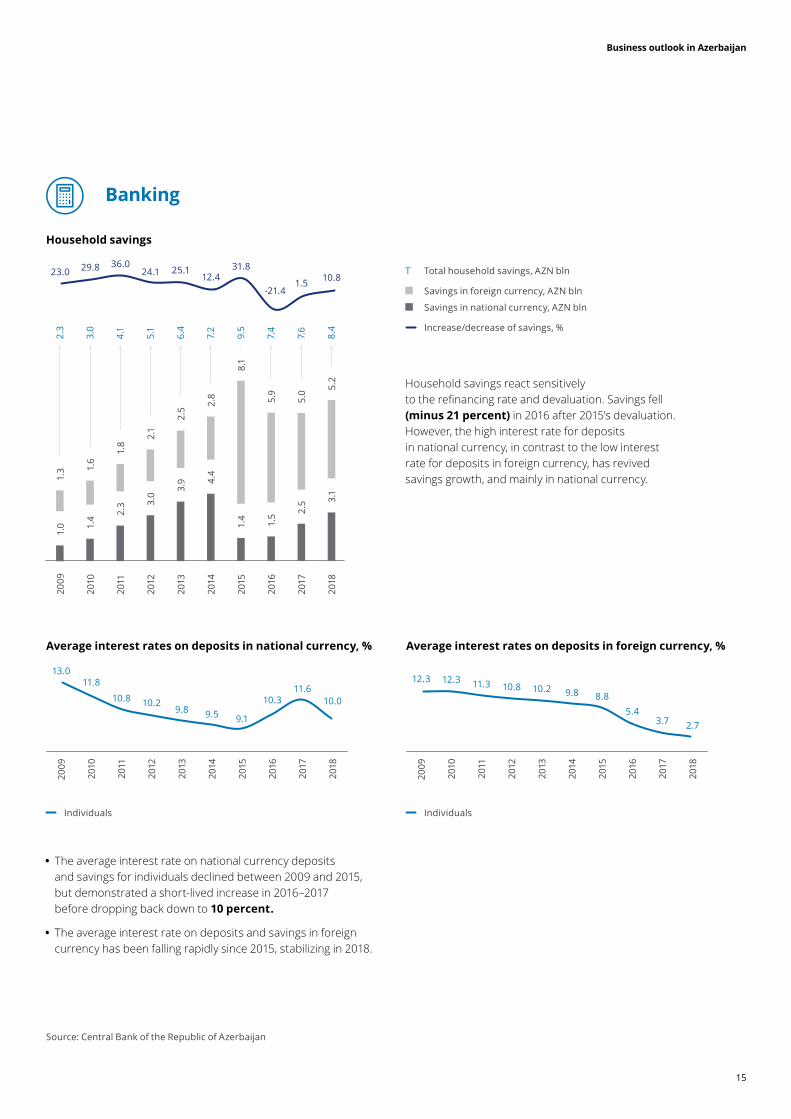
• The average interest rate on national currency deposits and savings for individuals declined between 2009 and 2015, but demonstrated a short-lived increase in 2016–2017 before dropping back down to 10percent.
• The average interest rate on deposits and savings in foreign currency has been falling rapidly since 2015, stabilizing in 2018.
Householdsavings
Household savings react sensitively to the refinancing rate and devaluation. Savings fell (minus 21 percent)in 2016 after 2015’s devaluation. However, the high interest rate for deposits in national currency, in contrast to the low interest rate for deposits in foreign currency, has revived savings growth, and mainly in national currency.
T Total household savings, AZN bln
Savings in foreign currency, AZN bln
Savings in national currency, AZN bln
Increase/decrease of savings, %
2.3
6.4
7.6
3.0
7.2
8.4
4.1
9.5
5.1
7.4
1.0
2.5
5.0
1.4
4.4
3.1
1.8
1.4
3.0
1.5
2009
2013
2017
2010
2014
2018
2011
2015
2012
2016
1.3
3.9
2.5
1.6
2.8
5.2
2.3
8.1
2.1
5.9
29.8
12.4 10.824.1
-21.4
23.0 25.1 1.5
36.0 31.8
2009
2013
2017
2010
2014
2018
2011
2015
2012
2016
11.8
9.510.010.2 10.3
13.0
9.8
11.610.8
9.1
2009
2013
2017
2010
2014
2018
2011
2015
2012
2016
12.39.8
2.7
10.8
5.4
12.310.2
3.7
11.38.8
Business outlook in Azerbaijan
16
Banking
Creditanddepositdollarization
TopfourbanksinAzerbaijaninIVQ2018,AZNmln
Source: Azerbaijani Banks Association
Source: Central Bank of the Republic of Azerbaijan
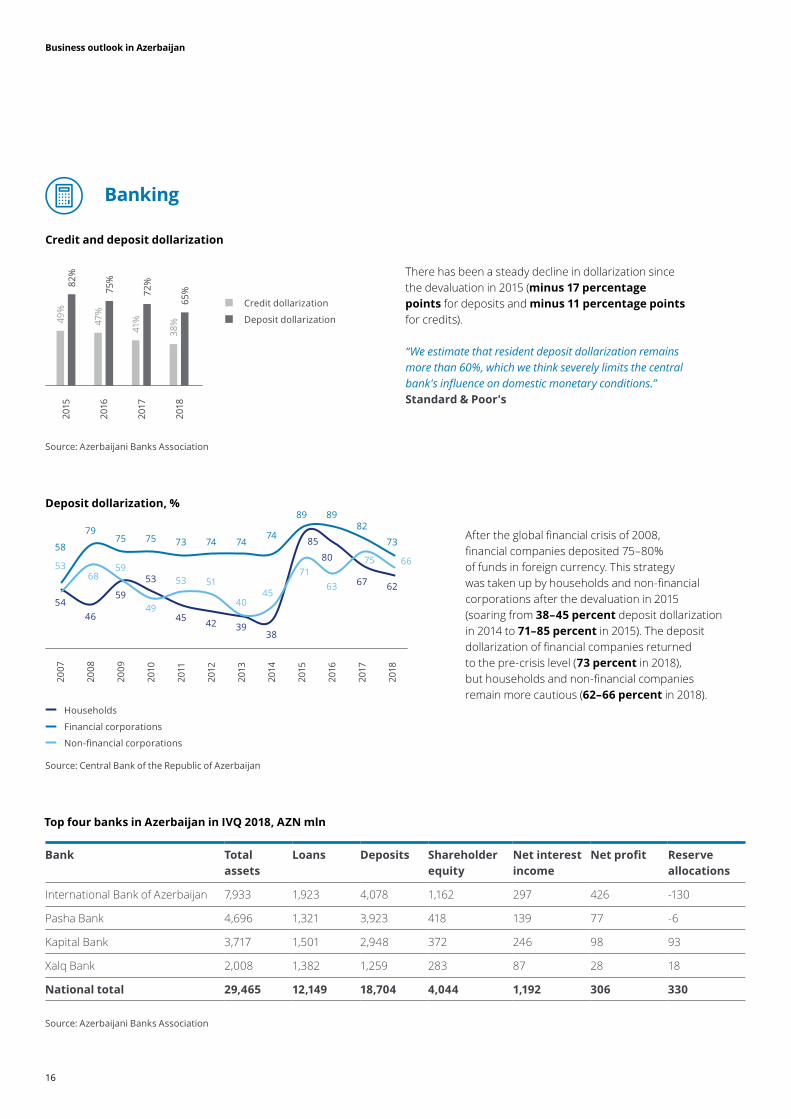
There has been a steady decline in dollarization since the devaluation in 2015 (minus17percentagepoints for deposits and minus 11 percentagepointsfor credits).
Credit dollarization
Deposit dollarization
2015
2016
2017
2018
49%
47%
41%
38%
82%
75%
72%
65%
“We estimate that resident deposit dollarization remains more than 60%, which we think severely limits the central bank's influence on domestic monetary conditions.”Standard&Poor's
Depositdollarization,%
After the global financial crisis of 2008, financial companies deposited 75–80% of funds in foreign currency. This strategy was taken up by households and non-financial corporations after the devaluation in 2015 (soaring from38–45 percentdeposit dollarization in 2014 to 71–85percentin 2015). The deposit dollarization of financial companies returned to the pre-crisis level (73percent in 2018), but households and non-financial companies remain more cautious (62–66percent in 2018).
Bank Totalassets
Loans Deposits Shareholderequity
Netinterestincome
Netprofit Reserveallocations
International Bank of Azerbaijan 7,933 1,923 4,078 1,162 297 426 -130
Pasha Bank 4,696 1,321 3,923 418 139 77 -6
Kapital Bank 3,717 1,501 2,948 372 246 98 93
Xalq Bank 2,008 1,382 1,259 283 87 28 18
Nationaltotal 29,465 12,149 18,704 4,044 1,192 306 330
Source: Azerbaijani Banks Association
Households
Financial corporations
Non-financial corporations
2007
2011
2015
2008
2012
2016
2009
2013
2017
2010
2014
2018
4642
80
53
38
62
5445
85
59
39
67
7974
89
75 747358 73
89
75 74
82
68 51 63
4945
665353
7159
40
75

Business outlook in Azerbaijan
17
Banking
Bankingsystemfinancialsustainabilityindicators
Bankingsystembreakdownbyassets
“Decisive steps are needed to finalise banking sector restructuring. Privatisation of the International Bank of Azerbaijan is one of the key priorities for lowering risk in the banking system and should be pursued without delay. The large stock of non-performing loans (NPLs) needs to be resolved, capital deficiencies in some banks addressed, and the independence and operations of the financial regulator (FIMSA) strengthened.”EuropeanBankforReconstructionandDevelopment
“The outlook for banking sector risk in the near term is stable on the CCC level, and a further rating downgrade is unlikely, as the score for many of these metrics is already low. A large share of loans is denominated in foreign currency and is now non-performing following two devaluations of the manat in 2015. Dollarization of the economy, while declining, is still high, exposing banks to ongoing exchange-rate risks.” EconomistIntelligenceUnit
The banking sector in Azerbaijan is quite consolidated. The largest bank, the International Bank of Azerbaijan, owns almost a quarter of assets (27 percent).Moreover, 62 percentof assets are concentrated in the four largest banks.
International Bank of Azerbaijan
Pasha Bank
Kapital Bank
Xalq Bank
Other
38%
16%
27%
7%12%
Bank Moody’s Fitch S&P
International Bank of Azerbaijan
Ba3 B- -
Pasha Bank - B+ BB-
Kapital Bank Ba2 BB- BB-
Xalq Bank B1 - -
Date TierICapitaladequacyratio,%
Aggregatecapitaladequacy ratio,%
Liquidassetsto total assets,%
Netopenposition in FXto capital,%
FXloansto totalloans, %
FXliabilities to total liabilities,%
31/12/2016 6.7 7.7 16.4 -314.4 47.9 66.8
31/03/2017 10.2 10.8 17.5 -201.8 48.3 71.1
30/06/2017 11.4 12.0 21.4 -182.3 44.6 72.5
30/09/2017 11.2 12.2 25.1 -117.2 43.7 68.1
31/12/2017 11.3 12.7 23.8 -112.0 41.3 67.1
31/03/2018 17.3 18.7 21.8 -71.7 39.9 64.1
30/06/2018 16.1 18.4 21.3 -66.9 39.0 63.1
30/09/2018 15.8 18.9 25.3 -57.6 39.0 61.7
31/12/2018 15.2 19.4 24.2 -42.5 38.5 59.9
31/03/2019 18.7 20.2 23.3 -46.5 37.2 60.4
Source: Financial Markets Supervisory Authority
Business outlook in Azerbaijan
18
Insurancepremiums Financialindicatorsof insurance companies
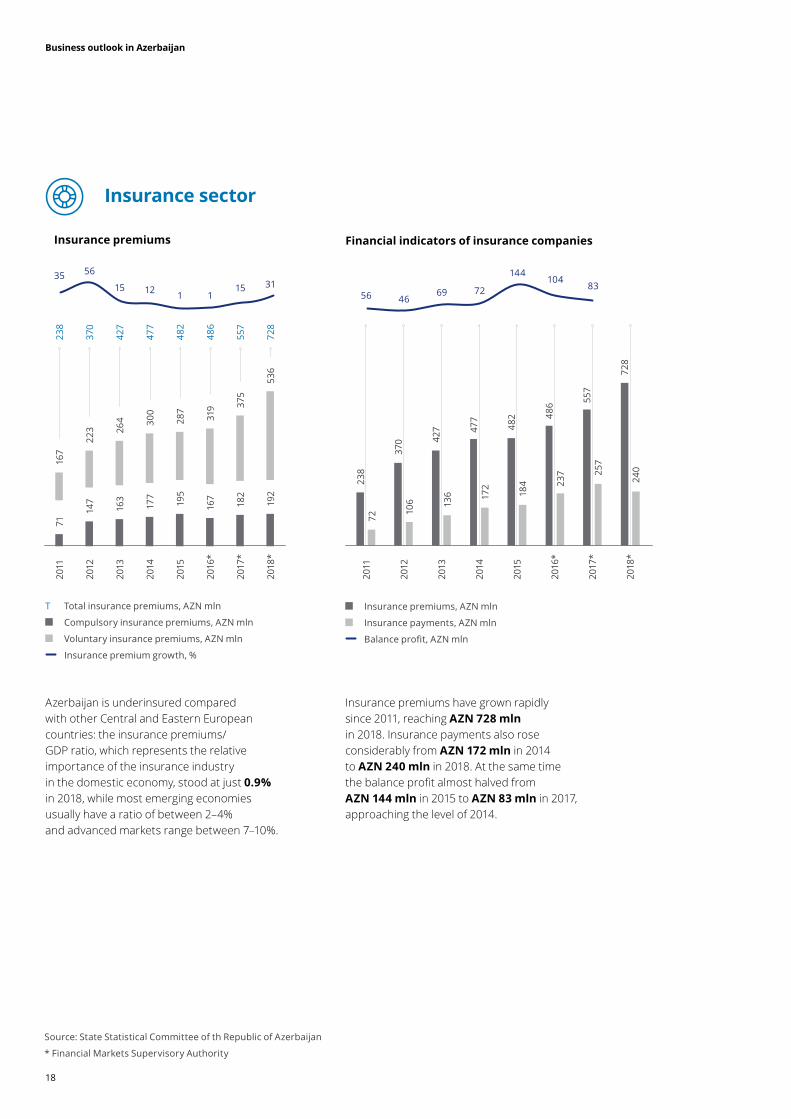
Azerbaijan is underinsured compared with other Central and Eastern European countries: the insurance premiums/GDP ratio, which represents the relative importance of the insurance industry in the domestic economy, stood at just0.9%in 2018, while most emerging economies usually have a ratio of between 2–4% and advanced markets range between 7–10%.
Insurance premiums have grown rapidly since 2011, reaching AZN728mln in 2018. Insurance payments also rose considerably from AZN172mln in 2014 toAZN240 mlnin 2018. At the same time the balance profit almost halved from AZN 144 mln in 2015 to AZN83mlnin 2017, approaching the level of 2014.
T Total insurance premiums, AZN mln
Compulsory insurance premiums, AZN mln
Voluntary insurance premiums, AZN mln
Insurance premium growth, %
Insurance premiums, AZN mln
Insurance payments, AZN mln
Balance profit, AZN mln
Insurancesector
71
195
147
167
163 182
177
192
2011
2015
2012
2016
*
2013
2017
*
2014
2018
*
238
482
370
486
427
557
477
728
167
287
223
319
264
375
300
536
56
112 3135
115 15
238
482
370
486
427
557
477
728
2011
2015
2012
2016
*
2013
2017
*
2014
2018
*
72
184
106
237
136
257
172
240
46
1047256
144
6983
Source: State Statistical Committee of th Republic of Azerbaijan
* Financial Markets Supervisory Authority
Business outlook in Azerbaijan
19
Life
Non-life
Life
Non-life
Voluntary
Compulsory
Voluntary
Compulsory
Insurancepremiumsstructurein2018 Insurancepaymentsstructurein2018
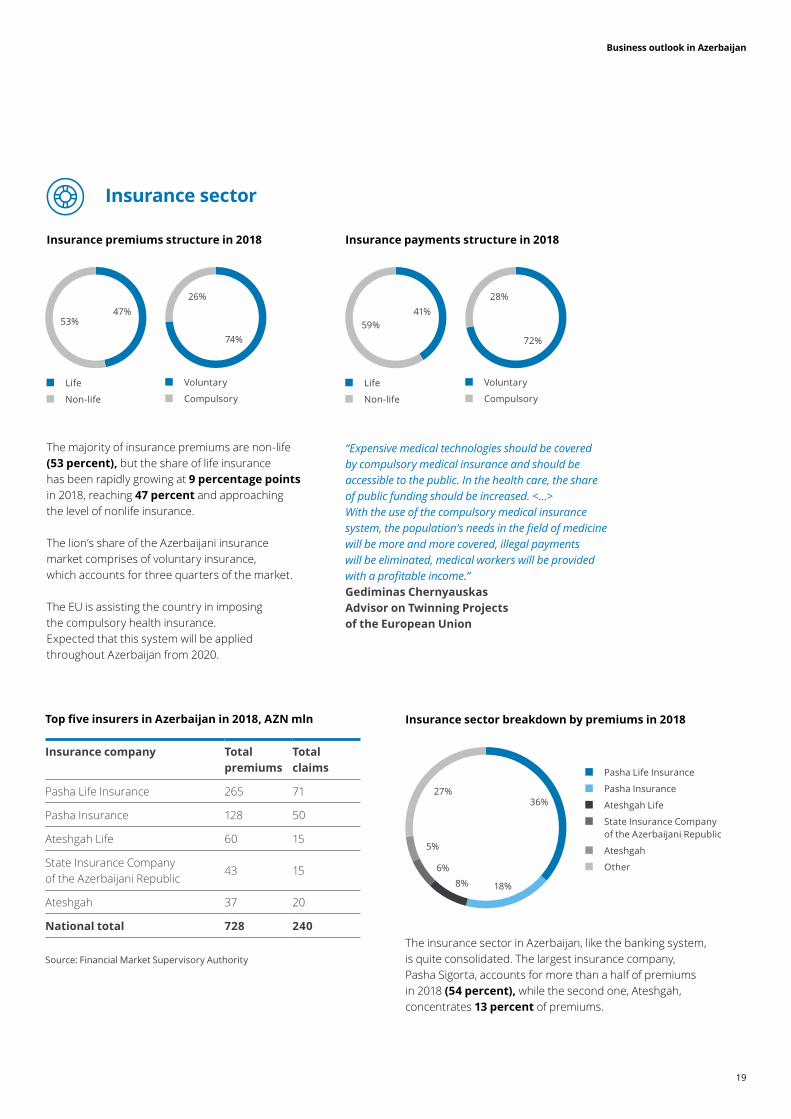
The majority of insurance premiums are non-life (53 percent),but the share of life insurance has been rapidly growing at9percentagepoints in 2018, reaching 47 percentand approaching the level of non life insurance.
The lion’s share of the Azerbaijani insurance market comprises of voluntary insurance, which accounts for three quarters of the market.
The EU is assisting the country in imposing the compulsory health insurance. Expected that this system will be applied throughout Azerbaijan from 2020.
Insurancesector
26%
74%
53%47%
59%41%
28%
72%
“Expensive medical technologies should be covered by compulsory medical insurance and should be accessible to the public. In the health care, the share of public funding should be increased. <…> With the use of the compulsory medical insurance system, the population’s needs in the field of medicine will be more and more covered, illegal payments will be eliminated, medical workers will be provided with a profitable income.” GediminasChernyauskasAdvisoronTwinningProjectsof the European Union
TopfiveinsurersinAzerbaijanin2018,AZNmln Insurancesectorbreakdownbypremiumsin2018
Insurancecompany Totalpremiums
Totalclaims
Pasha Life Insurance 265 71
Pasha Insurance 128 50
Ateshgah Life 60 15
State Insurance Company of the Azerbaijani Republic
43 15
Ateshgah 37 20
Nationaltotal 728 240
Source: Financial Market Supervisory Authority
The insurance sector in Azerbaijan, like the banking system, is quite consolidated. The largest insurance company, Pasha Sigorta, accounts for more than a half of premiums in 2018(54percent),while the second one, Ateshgah, concentrates 13 percent of premiums.
Pasha Life Insurance
Pasha Insurance
Ateshgah Life
State Insurance Company of the Azerbaijani Republic
Ateshgah
Other
18%
36%
6%
8%
5%
27%
Business outlook in Azerbaijan
20

Business outlook in Azerbaijan
21
BSEturnover,AZNbln TopbrokeragesinAzerbaijan, AZNmln(April2018–March2019)
BrokeragesinAzerbaijan
Name ofinstitution
Volumeof tradingoperations
Pasha Kapital 8,338
Unicapital 5,317
Invest AZ 4,605
AZ Finance 4,461
Xalq Kapital 1,951
PSG Kapital 542
Nationaltotal 25,214
The Azerbaijan securities market is relatively small with just AZN 23.5blnvolume of trading operations in 2018. There is only one stock exchange in Azerbaijan: Baku Stock Exchange (BSE), which supervised by Financial Market Supervisory Authority (FIMSA). FIMSA implements state policy and ensures the effective functioning of the financial markets, as well as protection of the rights of creditors, investors and insurers.
Six brokerages currently operate as active members of the BSE. The leading brokerage is Pasha Kapital, with nearly 33 percentof the market by annual turnover.
Pasha Kapital
Unicapital
Invest AZ
AZ Finance
Xalq Kapital
PSG Kapital
8%
21%
33%
18%
18%
2%
Financialmarkets
T Total
Derivatives
Repo
Debt instruments
Equity instruments
2013
2017
2014
2018
2015
1Q20
19
2016
8.5
9.6
13.0
23.5
8.5
4.6
5.7
7 0
1 0
0 4
4 1
4 4
4 1
1 9
140
0 6
2 0
01
40
0 4
1 0
Source: Baku Stock Exchange

Business outlook in Azerbaijan
22
Business outlook in Azerbaijan03
Deloitte Azerbaijan would like to thank everyone who participated in the survey we conducted in March–April 2019. We appreciate your time and interest in our research.
After recovering in 2017–2018, various sectors of the Azerbaijani economy are expecting growth. The non-oil sector is the primary driver of this trend. Leading companies are demonstrating interest in new opportunities, including attracting investment and taking full advantage of financial infrastructure.
The expert opinions collected in this survey allowed us to conduct an integrated analysis of Azerbaijan’s business environment, as well as to study the sentiment market participants and their expectations for the development of their companies and the market overall.
We are pleased to present the key findings of our research and hope that you will find this report useful and informative. We would be grateful if you would participate in our next survey.
Please feel free to contact us if you have any questions.

Business outlook in Azerbaijan
23
Howdoyouassessyourcompany’scurrentfinancialoutlookcomparedto the situationsix months ago?
Financialoutlook
TrendsRespondents’ assessment of their companies’ outlook became more conservative due to the high base of the preceding periods: the outlook of businesses that were already optimistic about their financial position remained unchanged.
Highlights
Total,%
138 7
11
1H20
19
2H20
17
1H20
18
2H20
18
33
1320
40
5479 73 49
+41
+71
+66
+38
Respondents’assessmentof the financialoutlookof theircompanies
Notably, Financial services is the most upbeat sector with64percent of optimistic responses (15percentagepoints above average).
Azerbaijani companies with annual revenues of less than AZN 10 mln have the most conservative outlook: 75 percent of respondents are not expecting significant changes.
Companies with annual revenues of between AZN 10 mln and AZN 100 mln are the most polarized: more than half are optimistic (58 percent),but a quarter are pessimistic.
The overall financial outlook of companies in Azerbaijan is more optimistic than in Russia, which has the most conservative assessment (by 15 percent), but less positive than in Kazakhstan (by 14percent).
However, no more than 13 percent of respondents in any country gave a pessimistic response.
Optimistic
Pessimistic
No significant change
Net balance
0
1117 17
Cons
umer
bu
sine
ss
Tota
l
Ener
gy,
Reso
urce
s &
In
dust
rial
s
Fina
ncia
l se
rvic
es
36
40 33
50
6449 50 33
Bysector,%Comparisonwithother countries,%Bycompanyrevenue,%
1111 13
Aze
rbai
jan
Russ
ia
Kaza
khst
an
26
40
51
6349 36
25
110
7O
ver
AZN
100
mln
Tota
l
Less
than
AZN
10
mln
AZN
10
mln
–
AZN
100
mln
1740
75
40
5849 25 53
Business outlook in Azerbaijan
24
BusinessenvironmentinAzerbaijan
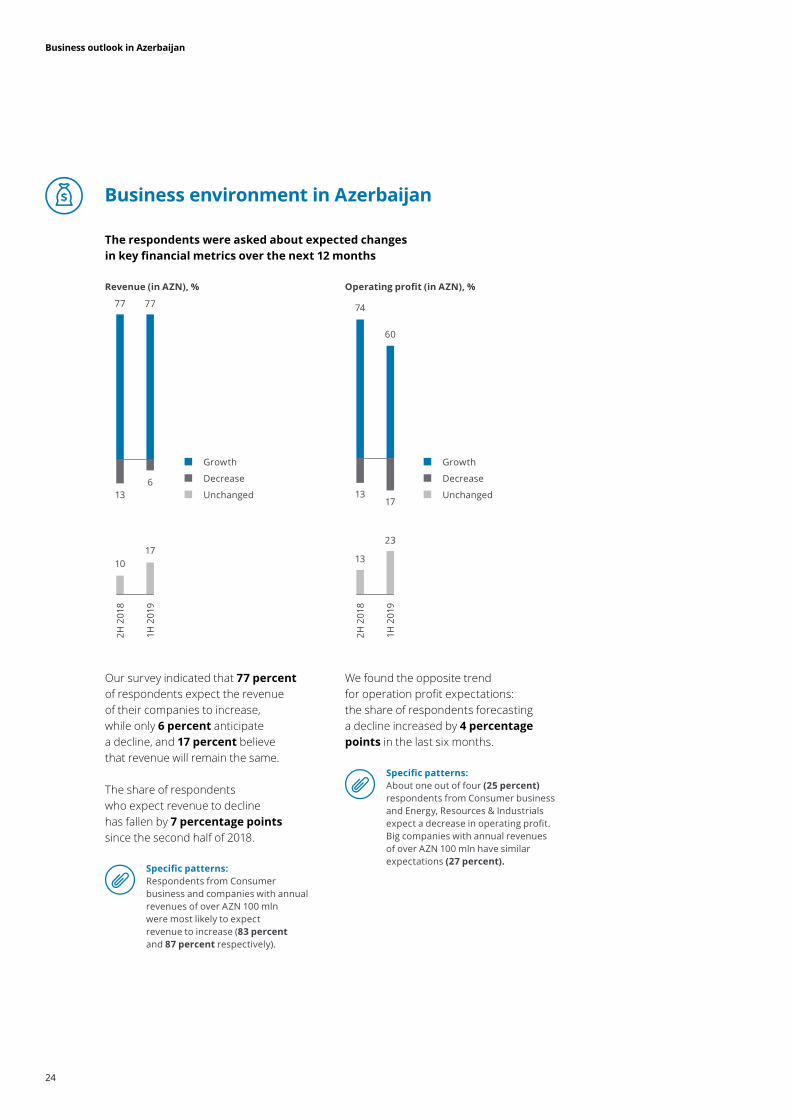
Therespondentswereaskedaboutexpectedchangesin key financial metrics overthenext12months
Revenue(inAZN),% Operatingprofit(inAZN),%
Growth
Decrease
Unchanged
Growth
Decrease
Unchanged
Our survey indicated that77percentof respondents expect the revenue of their companies to increase, while only 6percentanticipate a decline, and 17 percentbelieve that revenue will remain the same.
The share of respondents who expect revenue to decline has fallen by 7 percentagepointssince the second half of 2018.
We found the opposite trend for operation profit expectations: the share of respondents forecasting a decline increased by4percentagepointsin the last six months.
Specificpatterns:Respondents from Consumer business and companies with annual revenues of over AZN 100 mln were most likely to expect revenue to increase (83 percent and 87 percent respectively).
Specificpatterns:About one out of four(25percent)respondents from Consumer business and Energy, Resources & Industrials expect a decrease in operating profit. Big companies with annual revenues of over AZN 100 mln have similar expectations (27percent).
1H 2
019
2H 2
018
1317
74
60
13
23
1H 2
019
2H 2
018
136
77 77
1017

Business outlook in Azerbaijan
25
BusinessenvironmentinAzerbaijan
Therespondentswereaskedaboutexpectedchangesin key financial metrics overthenext12months
Growth
Decrease
Unchanged
Growth
Decrease
Unchanged
About half of respondents(46percent)expect that capex will remain unchanged. However, another43percent of surveyed experts forecast an increase in capex. Elevenpercent think that capex will decline.
Since the second half of 2018, the share of respondents, who expect an increase in capex, has risen by2percentagepoints.
Two third (69percent)expect an increase in operating costs, while 23percent of respondents anticipate a decline.
Specificpatterns:One out of four (25percent)Energy, Resources & Industrials company respondents expect a decrease in capex.
Specificpatterns:All respondents from Consumer business expect a increase in operating costs.
1H 2
019
2H 2
018
10
23
60
69
30
8
1H 2
019
2H 2
018
13 11
4143
46 46
Capex(inAZN),% Operatingcosts(inAZN),%
Business outlook in Azerbaijan
26
Growth
Decrease
Unchanged
Growth
Decrease
Unchanged
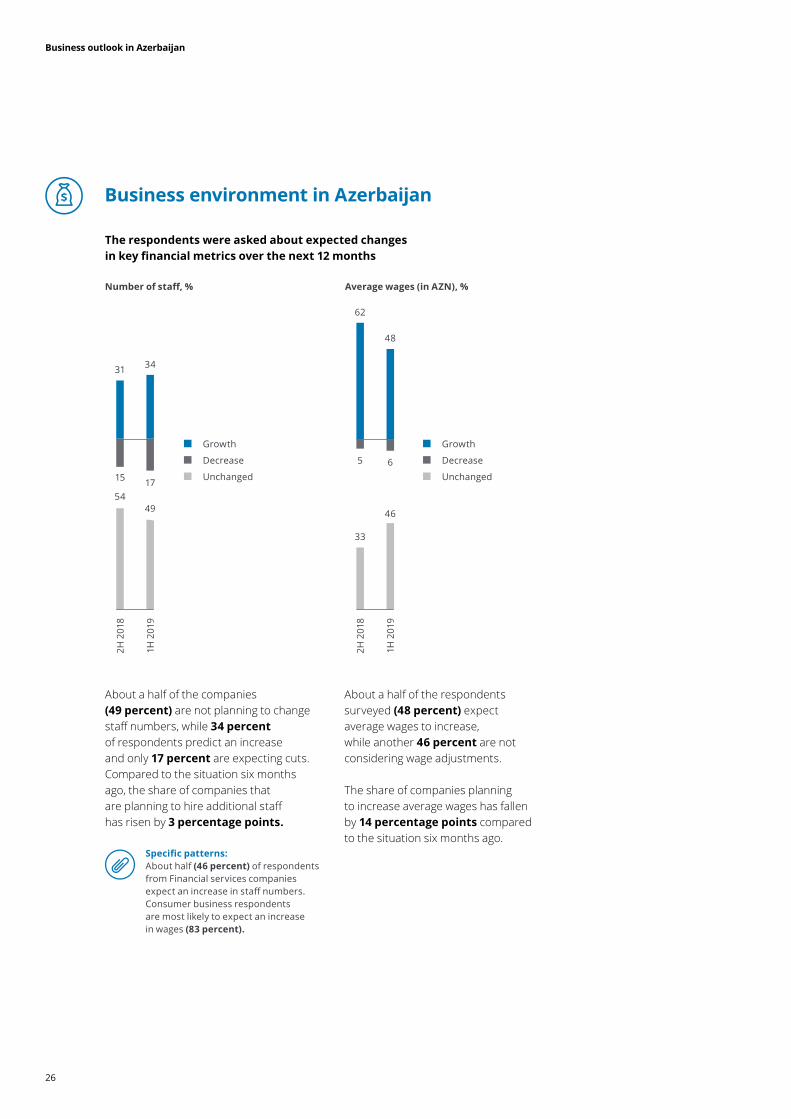
Therespondentswereaskedaboutexpectedchangesin key financial metricsoverthenext12months
Numberofstaff,% Averagewages(inAZN),%
About a half of the companies (49 percent)are not planning to change staff numbers, while 34percent of respondents predict an increase and only 17 percent are expecting cuts.Compared to the situation six months ago, the share of companies that are planning to hire additional staff has risen by 3 percentagepoints.
About a half of the respondents surveyed (48percent) expect average wages to increase, while another 46 percentare not considering wage adjustments.
The share of companies planning to increase average wages has fallen by 14 percentagepointscompared to the situation six months ago.
Specificpatterns:About half (46percent) of respondents from Financial services companies expect an increase in staff numbers.Consumer business respondents are most likely to expect an increase in wages(83percent).
1H 2
019
2H 2
018
15 17
31 34
5449
BusinessenvironmentinAzerbaijan
1H 2
019
2H 2
018
5 6
62
48
33
46
Business outlook in Azerbaijan
27
High degree of uncertainty
Low degree of uncertainty
Net uncertainty
Yes, it is an appropriate time
No, it is not an appropriate time
Risk appetite level
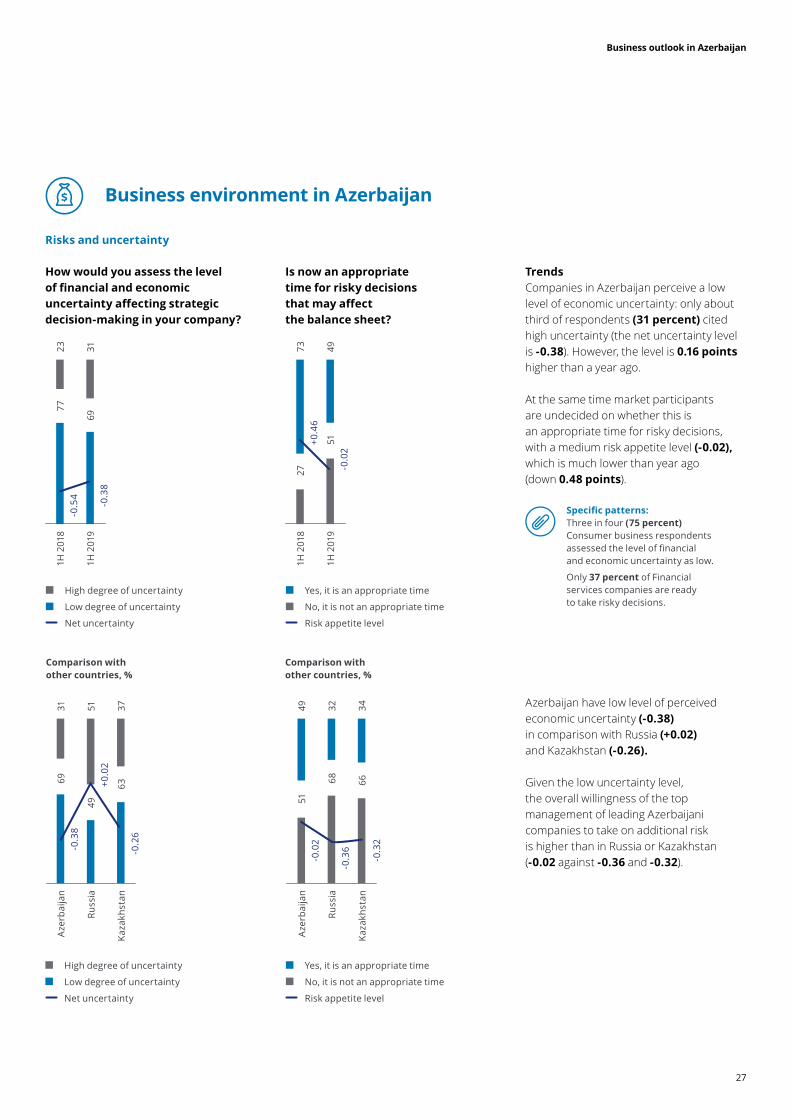
Howwouldyouassessthe levelof financialandeconomicuncertainty affectingstrategicdecision-makingin yourcompany?
Isnowanappropriatetimefor risky decisionsthatmay affectthe balance sheet?
Risksanduncertainty
TrendsCompanies in Azerbaijan perceive a low level of economic uncertainty: only about third of respondents(31percent)cited high uncertainty (the net uncertainty level is -0.38). However, the level is 0.16pointshigher than a year ago.
At the same time market participants are undecided on whether this is an appropriate time for risky decisions, with a medium risk appetite level (-0.02), which is much lower than year ago (down 0.48points).
Specificpatterns:Three in four(75percent)Consumer business respondents assessed the level of financial and economic uncertainty as low.
Only37percent of Financial services companies are ready to take risky decisions.
77
69
1H 2
018
1H 2
019
23 31-0
.38
-0.5
4
27
51
1H 2
018
1H 2
019
73 49-0
.02
+0.4
6
High degree of uncertainty
Low degree of uncertainty
Net uncertainty
Yes, it is an appropriate time
No, it is not an appropriate time
Risk appetite level
69
49
63
Aze
rbai
jan
Russ
ia
Kaza
khst
an
31 51 37
+0.0
2
-0.3
8
-0.2
6
51
68 66
Aze
rbai
jan
Russ
ia
Kaza
khst
an
49 32 34
-0.3
6
-0.0
2
-0.3
2
BusinessenvironmentinAzerbaijan
Azerbaijan have low level of perceived economic uncertainty(-0.38)in comparison with Russia(+0.02) and Kazakhstan(-0.26).
Given the low uncertainty level, the overall willingness of the top management of leading Azerbaijani companies to take on additional risk is higher than in Russia or Kazakhstan (-0.02 against -0.36 and -0.32).
Comparisonwithother countries,%
Comparisonwithother countries,%
Business outlook in Azerbaijan
28
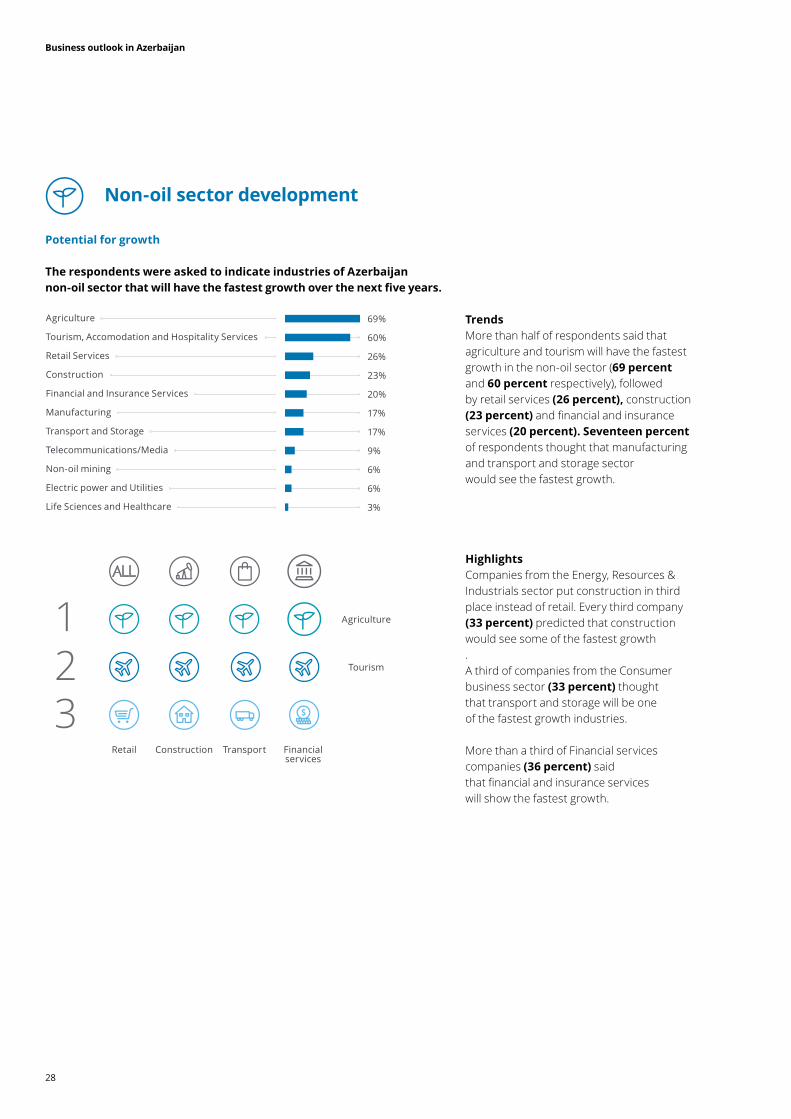
TherespondentswereaskedtoindicateindustriesofAzerbaijannon-oilsectorthatwillhavethefastestgrowthoverthenextfiveyears.
Non-oilsectordevelopment
Potentialforgrowth
Agriculture
Tourism, Accomodation and Hospitality Services
Retail Services
Construction
Financial and Insurance Services
Manufacturing
Transport and Storage
Telecommunications/Media
Non-oil mining
Electric power and Utilities
Life Sciences and Healthcare
69%
60%
26%
23%
20%
17%
17%
9%
6%
6%
3%
TrendsMore than half of respondents said that agriculture and tourism will have the fastest growth in the non-oil sector (69percentand 60percent respectively), followed by retail services (26percent),construction (23percent) and financial and insurance services (20percent).Seventeenpercentof respondents thought that manufacturing and transport and storage sector would see the fastest growth.
HighlightsCompanies from the Energy, Resources & Industrials sector put construction in third place instead of retail. Every third company (33 percent)predicted that construction would see some of the fastest growth.A third of companies from the Consumer business sector(33percent)thought that transport and storage will be one of the fastest growth industries.
More than a third of Financial services companies(36percent) said that financial and insurance services will show the fastest growth.
Retail Construction Transport
Agriculture
Tourism
Financial services
123
Business outlook in Azerbaijan
29
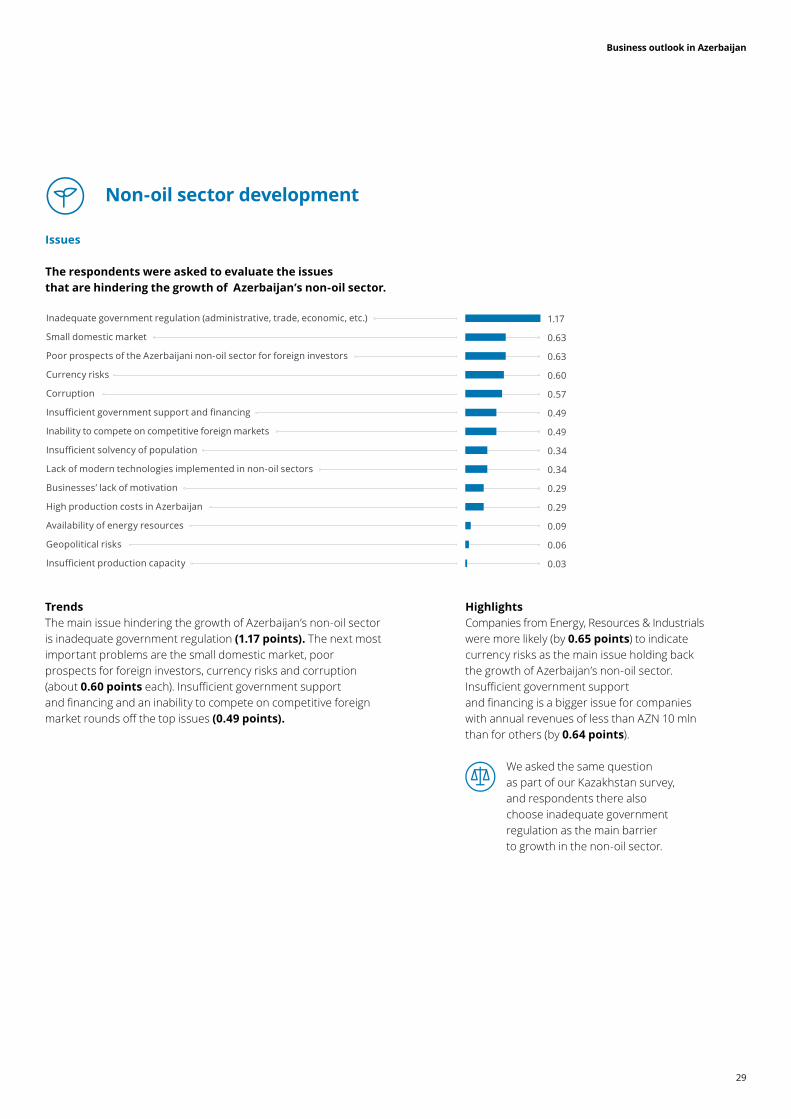
Therespondentswereaskedtoevaluatetheissuesthat are hindering the growth of Azerbaijan’snon-oilsector.
Non-oilsectordevelopment
Issues
TrendsThe main issue hindering the growth of Azerbaijan’s non-oil sector is inadequate government regulation(1.17points).The next most important problems are the small domestic market, poor prospects for foreign investors, currency risks and corruption (about 0.60points each). Insufficient government support and financing and an inability to compete on competitive foreign market rounds off the top issues (0.49 points).
HighlightsCompanies from Energy, Resources & Industrials were more likely (by0.65points) to indicate currency risks as the main issue holding back the growth of Azerbaijan’s non-oil sector.Insufficient government support and financing is a bigger issue for companies with annual revenues of less than AZN 10 mln than for others (by 0.64points).
We asked the same question as part of our Kazakhstan survey, and respondents there also choose inadequate government regulation as the main barrier to growth in the non-oil sector.
Inadequate government regulation (administrative, trade, economic, etc.)
Small domestic market
Poor prospects of the Azerbaijani non-oil sector for foreign investors
Currency risks
Corruption
Insufficient government support and financing
Inability to compete on competitive foreign markets
Insufficient solvency of population
Lack of modern technologies implemented in non-oil sectors
Businesses’ lack of motivation
High production costs in Azerbaijan
Availability of energy resources
Geopolitical risks
Insufficient production capacity
1.17
0.63
0.63
0.60
0.57
0.49
0.49
0.34
0.34
0.29
0.29
0.09
0.06
0.03

Business outlook in Azerbaijan
30
Therespondentswereaskedtoevaluatethemeasurescould stimulate growthinAzerbaijan’snon-oilsector.
TrendsRespondents selected tax and financial incentives (1.29points)and supporting foreign investment (1.11 points)as the most effective measures for stimulating growth in Azerbaijan’s non-oil sector. Support for innovation (0.94 points) and decreasing the share of state-owned companies(0.80 points) were in the second tier of possible measures. Finally, investments in infrastructure and creating industrial clusters and special economic zones were also popular possible measures for boosting non-oil sector growth (about 0.60points each).
HighlightsCompanies from Financial services were more likely (by 0.38points) to consider decreasing the share of state-owned companies as a good growth-stimulating measure. Companies without foreign capital in equity and companies with annual revenues of more than AZN 100 mln were more likely (by 0.28points) to choose investments in infrastructure.
We asked the same question as part of our Kazakhstan survey, and respondents there also choose inadequate government regulation as the main barrier to growth in the non-oil sector.
Tax and other financial incentives (subsidized interest on commerical loans)
Supporting foreign investment in the non-oil sector
Support for innovation
Decreasing the share of state-owned companies in the non-oil sector
Investments in infrastructure
Creating industrial clusters and special economic zones
Reducing export duties for some non-oil sector products
Government orders for goods/services produced by the sector
Creating a special non-budget fund for investment in the non-oil sector
Raising import duties for some non-oil sector products
Directly subsidizing non-oil companies from budget
Increasing of share of state-owned companies in the non-oil sector
1.29
1.11
0.94
0.80
0.60
0.57
0.20
0.14
0.14
0.14
0.06
0.00
Measures
Non-oilsectordevelopment
Business outlook in Azerbaijan
31
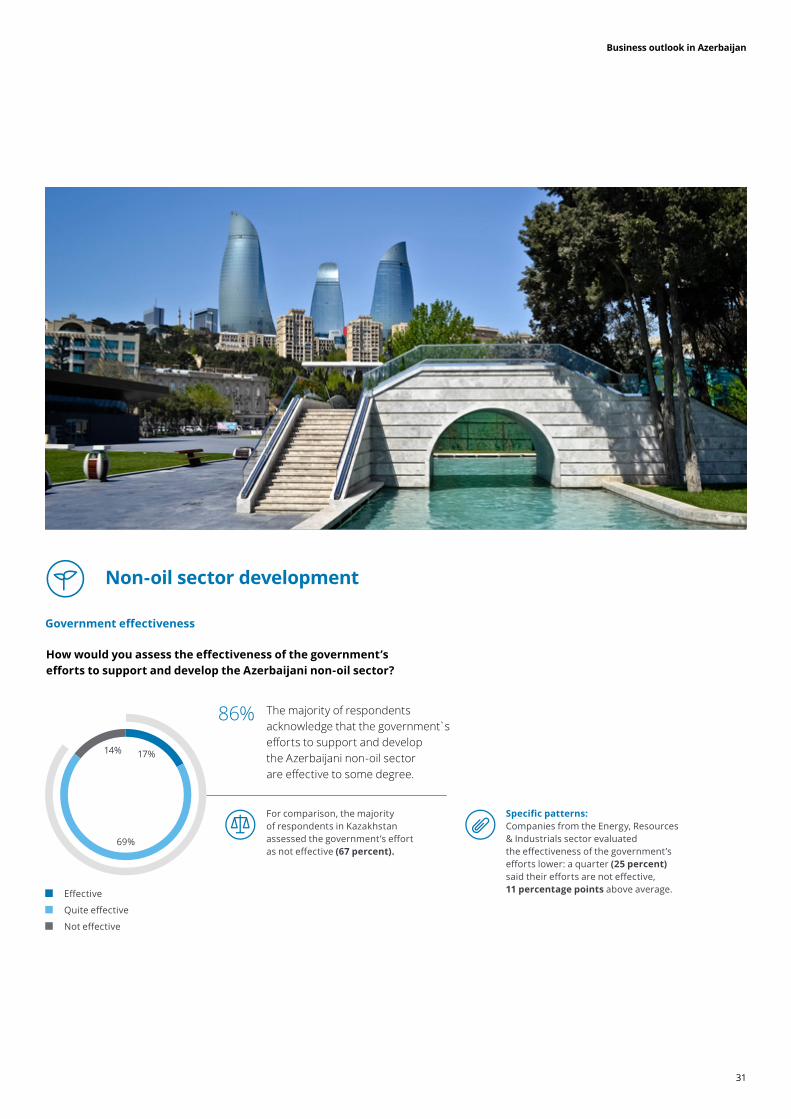
Howwouldyouassesstheeffectivenessofthegovernment’sefforts to supportanddeveloptheAzerbaijaninon-oilsector?
Specificpatterns:Companies from the Energy, Resources & Industrials sector evaluated the effectiveness of the government’s efforts lower: a quarter (25percent)said their efforts are not effective, 11 percentagepoints above average.
For comparison, the majority of respondents in Kazakhstan assessed the government’s effort as not effective (67percent).
Effective
Quite effective
Not effective
86% The majority of respondents acknowledge that the government̀ s efforts to support and develop the Azerbaijani non-oil sector are effective to some degree.
Governmenteffectiveness
Non-oilsectordevelopment
14%
69%
17%

Business outlook in Azerbaijan
32
Attractinginvestment
Attractiveness
Pleaseratetheattractivenessofthefinancingsourceslistedbelowfromthestandpointofyourbusinessdevelopmentgoals.
TrendsThe most attractive financing sources are state subsidies and Azerbaijani investment: 63percentof respondents rate them positively and only about 9 percent see them as unattractive. Equity issuance is the only financing source with more negative responses than positive (balance-0.03).
Highlights
• 73percent of Financial services companies said that loans from Azerbaijani banks was an attractive financing source, while only 42 percentof Consumer business respondents agreed with them.
• Respondents from Energy, Resources & Industrials companies considered equity issuance attractive (58percent), while this was an unattractive source for Consumer business companies.
• Every fourth Consumer business company (25percent)marked foreign investment as unattractive. Attravtive Unattractive Net balance
63%
49%
63%
49%
54%
49%
63%
60%
31%
Stat
e su
bsid
ies
Bor
row
ing
from
A
zerb
aija
ni b
anks
Equi
ty is
suan
ce
Aze
rbai
jani
inve
stm
ent
Deb
t fin
anci
ng
Fore
ign
inve
stm
ent
Bor
row
ing
from
fo
reig
n ba
nks
Inte
rnal
fina
ncin
g
Bon
d is
suan
ce
-9%
-14%
-14%
-23%
-9%
-31%
-9%
-20%
-34%
+0.5
4
+0.3
4 +0.4
9
+0.2
6 +0.4
6
+0.1
7
+0.5
4
+0.4
0
-0.0
3
Business outlook in Azerbaijan
33
Attractinginvestment
Plans
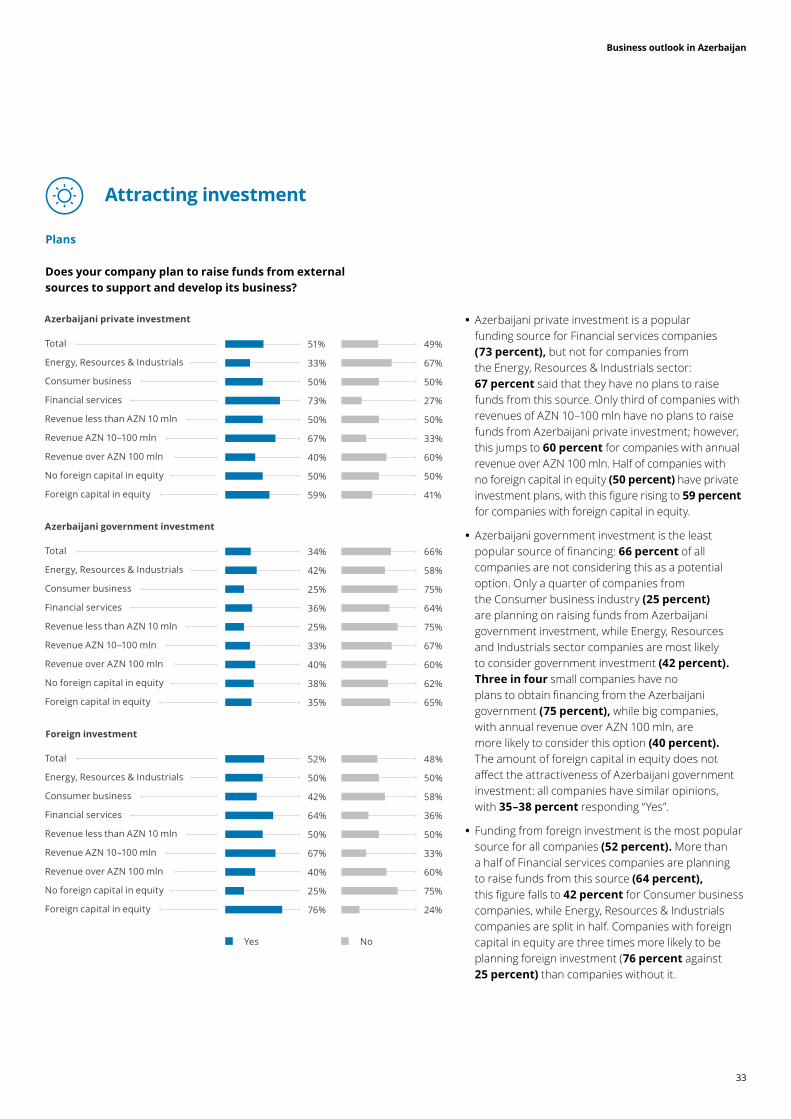
Doesyourcompanyplantoraisefundsfromexternalsources to supportanddevelopitsbusiness?
• Azerbaijani private investment is a popular funding source for Financial services companies (73 percent),but not for companies from the Energy, Resources & Industrials sector: 67 percentsaid that they have no plans to raise funds from this source. Only third of companies with revenues of AZN 10–100 mln have no plans to raise funds from Azerbaijani private investment; however, this jumps to 60percent for companies with annual revenue over AZN 100 mln. Half of companies with no foreign capital in equity(50percent)have private investment plans, with this figure rising to59 percentfor companies with foreign capital in equity.
• Azerbaijani government investment is the least popular source of financing:66percentof all companies are not considering this as a potential option. Only a quarter of companies from the Consumer business industry (25 percent)are planning on raising funds from Azerbaijani government investment, while Energy, Resources and Industrials sector companies are most likely to consider government investment (42 percent).Threein four small companies have no plans to obtain financing from the Azerbaijani government(75percent),while big companies, with annual revenue over AZN 100 mln, are more likely to consider this option (40 percent).The amount of foreign capital in equity does not affect the attractiveness of Azerbaijani government investment: all companies have similar opinions, with 35–38 percentresponding “Yes”.
• Funding from foreign investment is the most popular source for all companies(52percent).More than a half of Financial services companies are planning to raise funds from this source (64percent),this figure falls to 42percent for Consumer business companies, while Energy, Resources & Industrials companies are split in half. Companies with foreign capital in equity are three times more likely to be planning foreign investment (76percentagainst 25 percent) than companies without it.
Azerbaijaniprivateinvestment
Azerbaijanigovernmentinvestment
Foreigninvestment
Total
Energy, Resources & Industrials
Consumer business
Financial services
Revenue less than AZN 10 mln
Revenue AZN 10–100 mln
Revenue over AZN 100 mln
No foreign capital in equity
Foreign capital in equity
51%
33%
50%
73%
50%
67%
40%
50%
59%
49%
67%
50%
27%
50%
33%
60%
50%
41%
Total
Energy, Resources & Industrials
Consumer business
Financial services
Revenue less than AZN 10 mln
Revenue AZN 10–100 mln
Revenue over AZN 100 mln
No foreign capital in equity
Foreign capital in equity
34%
42%
25%
36%
25%
33%
40%
38%
35%
66%
58%
75%
64%
75%
67%
60%
62%
65%
Total
Energy, Resources & Industrials
Consumer business
Financial services
Revenue less than AZN 10 mln
Revenue AZN 10–100 mln
Revenue over AZN 100 mln
No foreign capital in equity
Foreign capital in equity
52%
50%
42%
64%
50%
67%
40%
25%
76%
48%
50%
58%
36%
50%
33%
60%
75%
24%
Yes No
Business outlook in Azerbaijan
34
Foreigninvestments
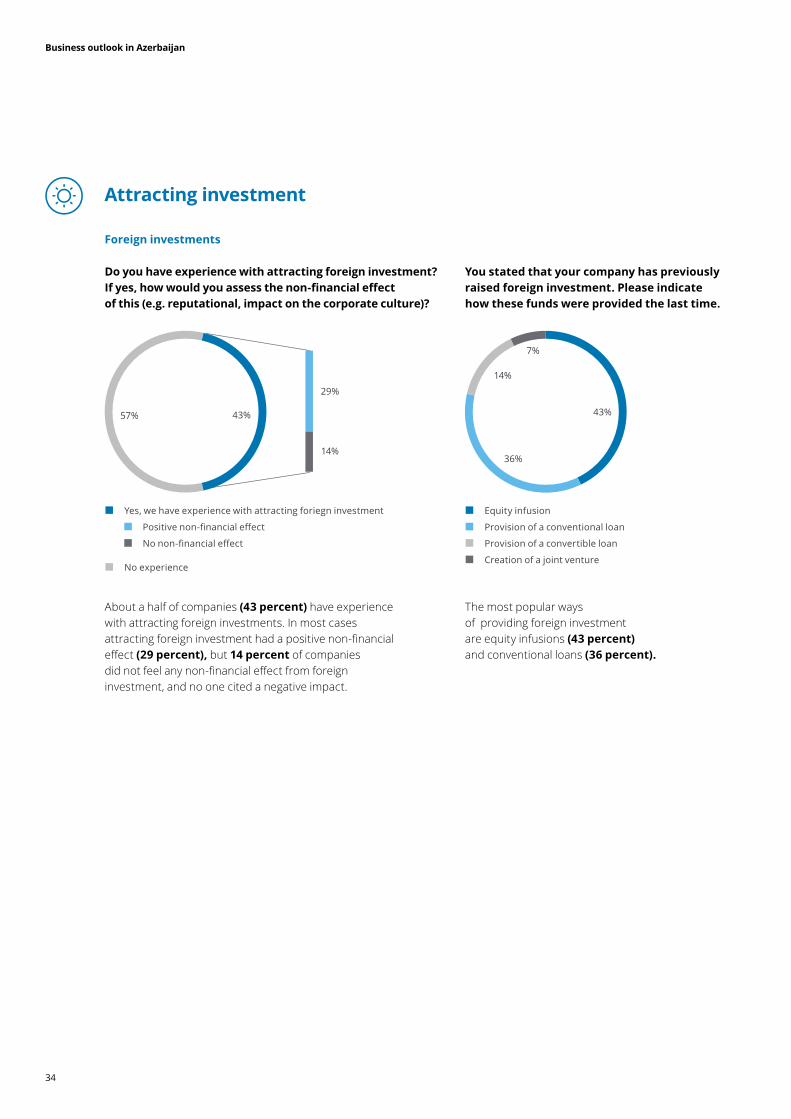
Doyouhaveexperiencewithattractingforeigninvestment?Ifyes,howwouldyouassessthenon-financialeffectof this (e.g. reputational, impactonthecorporateculture)?
Youstatedthatyourcompanyhaspreviouslyraisedforeigninvestment.Pleaseindicatehow thesefundswereprovidedthelasttime.
About a half of companies(43percent)have experience with attracting foreign investments. In most cases attracting foreign investment had a positive non-financial effect (29percent),but 14 percentof companies did not feel any non-financial effect from foreign investment, and no one cited a negative impact.
The most popular ways of providing foreign investment are equity infusions (43percent)and conventional loans (36 percent).
Yes, we have experience with attracting foriegn investment
Positive non-financial effect
No non-financial effect
No experience
Equity infusion
Provision of a conventional loan
Provision of a convertible loan
Creation of a joint venture
14%
36%
43%
7%
57% 43%
29%
14%
Attractinginvestment

Business outlook in Azerbaijan
35
Foreigninvestments
Whateffectdidforeign investmenthave on the ownershipstructureand managementof yourcompany?
Wherewerethelatestfundsthatyouraisedfrom foreignsources mainly allocated?
More than a half of companies(61 percent)saw no changes to the ownership structure or management after foreign investments. Another 39 percentof companies underwent ownership structure changes, with an equal share of companies seeing the controlling owner(s) change, the controlling owner(s) remain, and changes to the number and structure of executive directors on the board (13 percent).
A half of companies mainly allocated foreign investments to Capex. Just over one in five companies(21percent) principally allocated foreign investment to operational activities and the same share allocated it to implement a complex project. Only 8percent of companies used it for technology development.
There were changes to the company’s ownership structure, but the controlling owner(s) remained unchanged
There were changes to the company’s ownership structure and the controlling owner(s) changed
There were changes to the structure and/or number of executive directors on the board
There were no changes to the ownership structure or management of the company
Capex
Operational activities
Implementation of a complex project
Technology development
8%
21%
21%
50%61% 39%
13%
13%
13%
Attractinginvestment
Business outlook in Azerbaijan
36
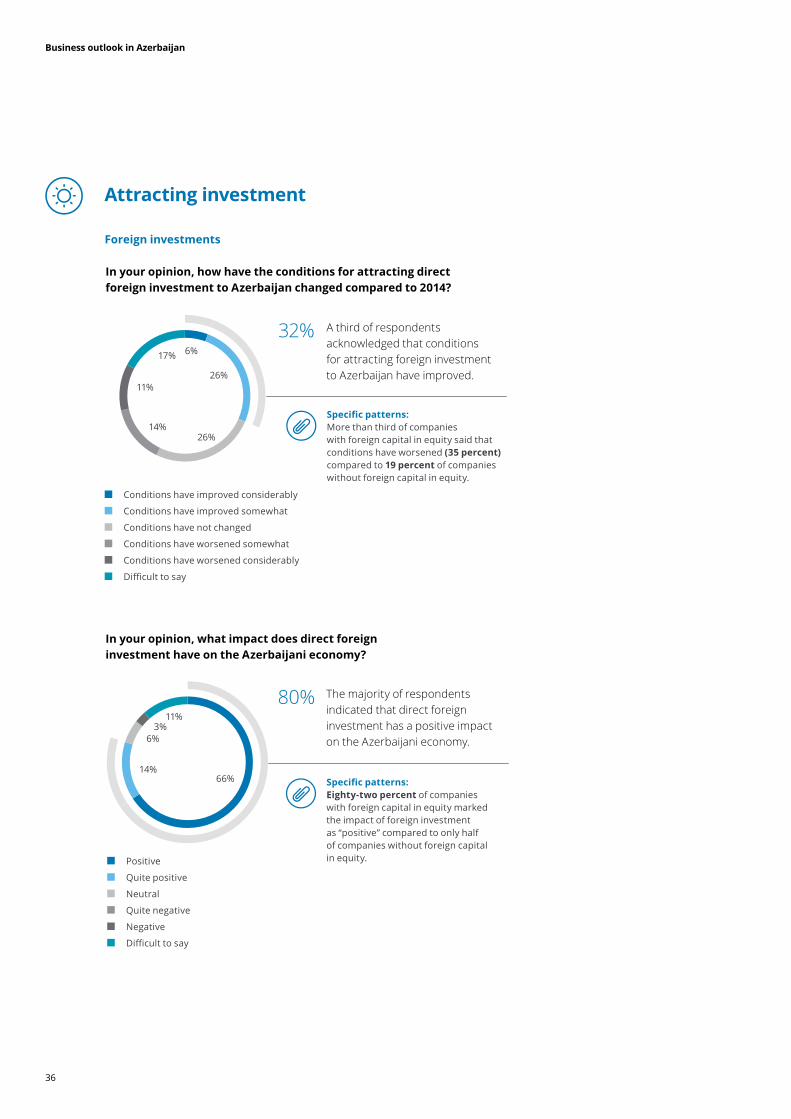
In youropinion,howhavetheconditionsforattractingdirectforeign investmenttoAzerbaijanchangedcomparedto2014?
Inyouropinion,whatimpactdoesdirectforeigninvestment have on theAzerbaijanieconomy?
Specificpatterns:More than third of companies with foreign capital in equity said that conditions have worsened(35percent)compared to19percent of companies without foreign capital in equity.
Positive
Quite positive
Neutral
Quite negative
Negative
Difficult to say
80% The majority of respondents indicated that direct foreign investment has a positive impact on the Azerbaijani economy.
Specificpatterns:Eighty-twopercent of companies with foreign capital in equity marked the impact of foreign investment as “positive” compared to only half of companies without foreign capital in equity.
11%
14%66%
6%3%
Conditions have improved considerably
Conditions have improved somewhat
Conditions have not changed
Conditions have worsened somewhat
Conditions have worsened considerably
Difficult to say
A third of respondents acknowledged that conditions for attracting foreign investment to Azerbaijan have improved.
17%
26%
6%
26%
14%
11%
32%
Foreigninvestments
Attractinginvestment

Business outlook in Azerbaijan
37
TherespondentswereaskedtoevaluatethemeasuresthatcouldincreaseAzerbaijan’s attractivenessasadestinationforforeigndirectinvestment.
Protecting the rights of investors
Improving the transparency and stability of tax and economic policies
Simplifying the regulatory framework for conducting business
Reducing duties, taxes and fees and/or providing tax breaks
Stepping up anti-corruption policies
Reducing currency risks
Improving the transparency of the law enforcement system
Improving the legal base (corporate, investment law, etc.)
Improving the telecoms and IT infrastructure
0.93
0.86
0.71
0.64
0.54
0.46
0.43
0.32
0.29
TrendsSurvey participants said that protecting the rights of investors(0.93points)and improving the transparency and stability of tax and economic policies (0.86points) are the best measures for increasing Azerbaijan’s attractiveness for foreign investment.
HighlightsRespondents from the Energy, Resources & Industrials sector and from companies with annual revenues of less than AZN 10 mln are most likely to see simplifying the regulatory framework for conducting business as the best measure (by 0.67 points and 0.43 pointsrespectively).
Foreigninvestments
Attractinginvestment
Business outlook in Azerbaijan
38
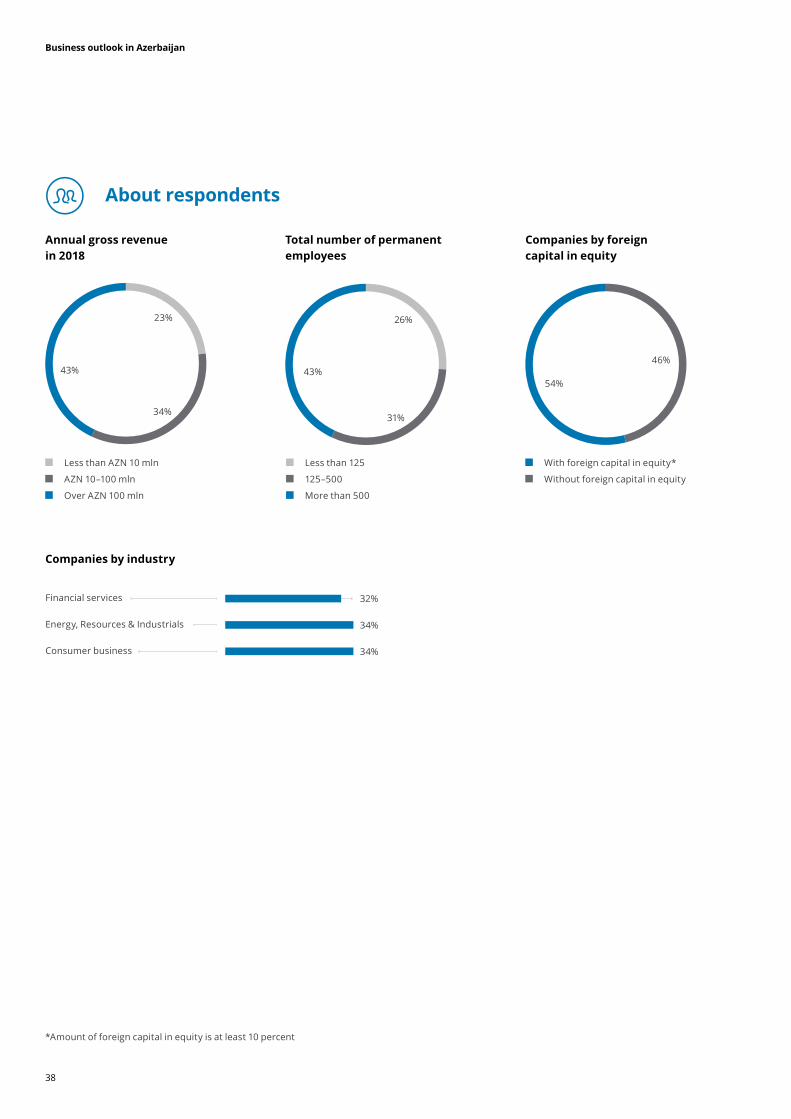
Totalnumberofpermanentemployees
Companiesbyforeigncapitalinequity
Companiesbyindustry
Less than 125
125–500
More than 500
With foreign capital in equity*
Without foreign capital in equity
Aboutrespondents
Financial services
Consumer business
Energy, Resources & Industrials
34%
34%
32%
Less than AZN 10 mln
AZN 10–100 mln
Over AZN 100 mln
Annualgrossrevenuein 2018
43%
23%
34%
43%
26%
31%
54%
46%
*Amount of foreign capital in equity is at least 10 percent

Brochure / report title goes here | Section title goes here
NuranKerimovManagingPartnerTax and LegalDeloitte [email protected]
KellyAllinPartnerAudit and AssuranceDeloitte [email protected]
JamalHasanovDirectorAudit and AssuranceDeloitte [email protected]
TuralHajiyevDirectorRisk Advisory Deloitte [email protected]
DaniyarAdigamovDirectorFinancial AdvisoryDeloitte [email protected]
FuadIbrahimovSeniorConsultantFinancial AdvisoryDeloitte [email protected]
MikhailGordeevHeadofresearchprojectsDeloitte [email protected]
Contacts
RomanKarikhAnalystDeloitte [email protected]
Authors:If you have any questions regarding the survey, please do not hesitate to contact us.
LoraNakoryakovaResearchCentreLeaderDeloitte [email protected]

deloitte.azAboutDeloitte
Deloitte refers to one or more of Deloitte Touche Tohmatsu Limited, a UK private company limited by guarantee (“DTTL”), its network of member firms, and their related entities. DTTL and each of its member firms are legally separate and independent entities. DTTL (also referred to as “Deloitte Global”) does not provide services to clients. Please see www.deloitte.com/about for a more detailed description of DTTL and its member firms.
Deloitte provides audit, consulting, financial advisory, risk management, tax and related services to public and private clients spanning multiple industries. Deloitte serves four out of five Fortune Global 500® companies through a globally connected network of member firms in more than 150 countries bringing world-class capabilities, insights, and high-quality service to address clients’ most complex business challenges. To learn more about how Deloitte’s approximately 286,000 professionals make an impact that matters, please connect with us on Facebook, LinkedIn, or Twitter.
This communication contains general information only, and none of Deloitte Touche Tohmatsu Limited, its member firms, or their related entities (collectively, the “Deloitte Network”) is, by means of this communication, rendering professional advice or services. Before making any decision or taking any action that may affect your finances or your business, you should consult a qualified professional adviser. No entity in the Deloitte Network shall be responsible for any loss whatsoever sustained by any person who relies on this communication.
© 2019 Deloitte & Touche LLC. All rights reserved.


![Business Outlook LQb$]HUEDLMDQ · 2020. 5. 21. · Business Outlook in Azerbaijan – 2017 Azerbaijan in figures 08 Price indices of consumer goods and paid services rendered to population](https://static.documents.pub/doc/80x56/5fe071b16eb76c27b01be29d/business-outlook-lqbhuedlmdq-2020-5-21-business-outlook-in-azerbaijan-a.jpg)