Township of South Frontenac Business Plan for Seniors Housing (Sydenham) f a c t r e c o n s u l t i n g BUSINESS PLAN FOR SENIORS HOUSING Township of South Frontenac February 2017 f a c t r e c o n s u l t i n g
Transcript
Township of South Frontenac
Business Plan for Seniors Housing (Sydenham)
f a c t r e
cc oo nn ss uu ll tt ii nn gg
BUSINESS PLAN
FOR SENIORS HOUSING Township of South Frontenac
February 2017
f a c tr ecc oo nn ss uu ll tt ii nn gg
Township of South Frontenac
Business Plan for Seniors Housing (Sydenham)
f a c t r e
cc oo nn ss uu ll tt ii nn gg
EXECUTIVE SUMMARY
As communities grow and age, the need for suitable seniors housing options is become more and more
prevalent. This is true of Frontenac County where seniors as a share of the overall population will continue
to rise over the next 20 years. As a result, County Council has designated seniors housing as a priority and
allocated funds to explore the feasibility of developing affordable housing projects to meet these needs
and to prepare business plans for such projects. This report for the Township of South Frontenac
represents the second such business plan prepared under this initiative.
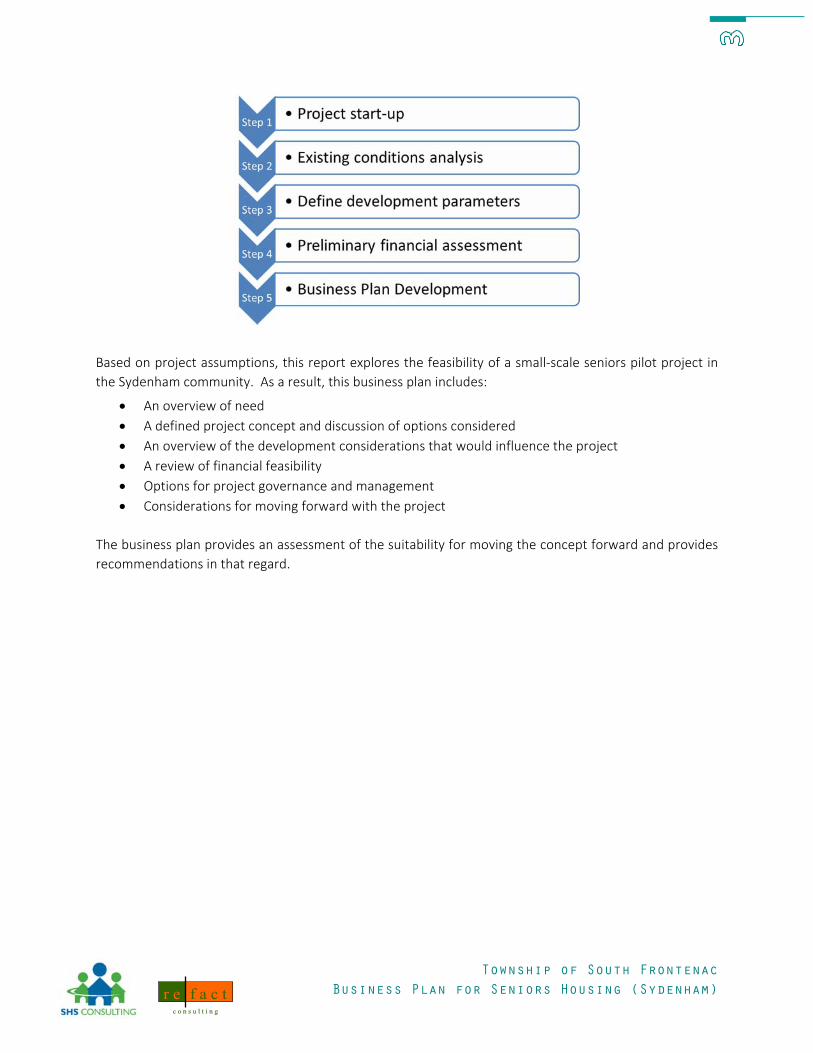
Using a multi‐step process, the need and viability of such a project was investigated for the Seniors Housing
Task Force that was established by the County. Based on demonstrated needs, community consultation
and business case analysis, the concept for a small scale seniors housing project situated in Sydenham has
been developed. This concept has been tested and found to be viable, subject to the assumptions outlined
in this report. Based on the proposed concept, the seniors housing project would:
Be modest in scale – 12 self‐contained apartment units (6 @ one bedroom, 6 @ two bedroom) plus
amenity space for a total buildable area of 10,600 sf (GFA)
Include basic amenity space ‐ laundry facilities (2 pair) and a small indoor common area for
gathering/socialization would be provided
Accommodate seniors mobility needs – providing a safe, indoor access to apartment units while
incorporating visitability and accessibility throughout units and common spaces
Support basic affordability – all units would be rental and offered at or below average market rent
level. Rents for the one bedroom units could be lowered to 80% of average market rent if IAH
funding is obtained from the City of Kingston.
Be procured as new construction – this approach would enable a single storey slab‐on‐grade
building, with a cost‐effective double‐loaded main corridor, wood frame structure and standard
sloped roof
Incorporate practical sustainability features that promote energy efficiency
Be situated adjacent to the Grace Centre on land currently owned by South Frontenac Community
Services Corporation, plus an adjacent parcel
Be procured through a formal design/tender process (stipulated price contract)
Be financed using a conventional mortgage that is CMHC‐insured, as well as an equity contribution
of $350,000 from the County and an additional equity contribution in the order of $350,000 for
the IAH‐funded option OR $1,095,000 in the non‐funded option
Be owned by a newly constituted non‐profit housing corporation
Be managed by Loughborough Housing Corporation, should they be agreeable to take on that role.
Township of South Frontenac
Business Plan for Seniors Housing (Sydenham)
f a c t r e
cc oo nn ss uu ll tt ii nn gg
As a result of the financial analysis, it has been determined that the project would be viable based on
preliminary cost estimates, anticipated revenues and assumed contributions. While a series of land use
approvals are required to permit the intended use, there do not appear to be any significant barriers to
securing these approvals. Prior to acquiring the project site, due diligence testing would be required to
ensure that no environmental concerns or project servicing impediments exist. Based on an initial scan of
current conditions and background information, no impediments are anticipated. Viable project
governance options exist, the most plausible of which would see the creation of a new non‐profit
corporation which would legally own and operate the project.
The Consulting team wishes to thank the Senior Housing Task Force for their
insights and guidance in the development of this Business Plan. The team
also wishes to express their thanks to County and Township staff who
assisted in facilitating various elements of the study and provided valuable
feedback.
Township of South Frontenac
Business Plan for Seniors Housing (Sydenham)
f a c t r e
cc oo nn ss uu ll tt ii nn gg
TABLE OF CONTENTS
EXECUTIVE SUMMARY ...................................................................................................................................... i
Context for business plan .................................................................................................................. 2
This report ............................................................................................................................................... 2
PROJECT NEED .................................................................................................................................................. 4
Local housing needs and market indicators .............................................................................. 4
Summary of analysis .............................................................................................................................. 17
Form and scale ..................................................................................................................................... 20
Unit mix and affordability ............................................................................................................... 20
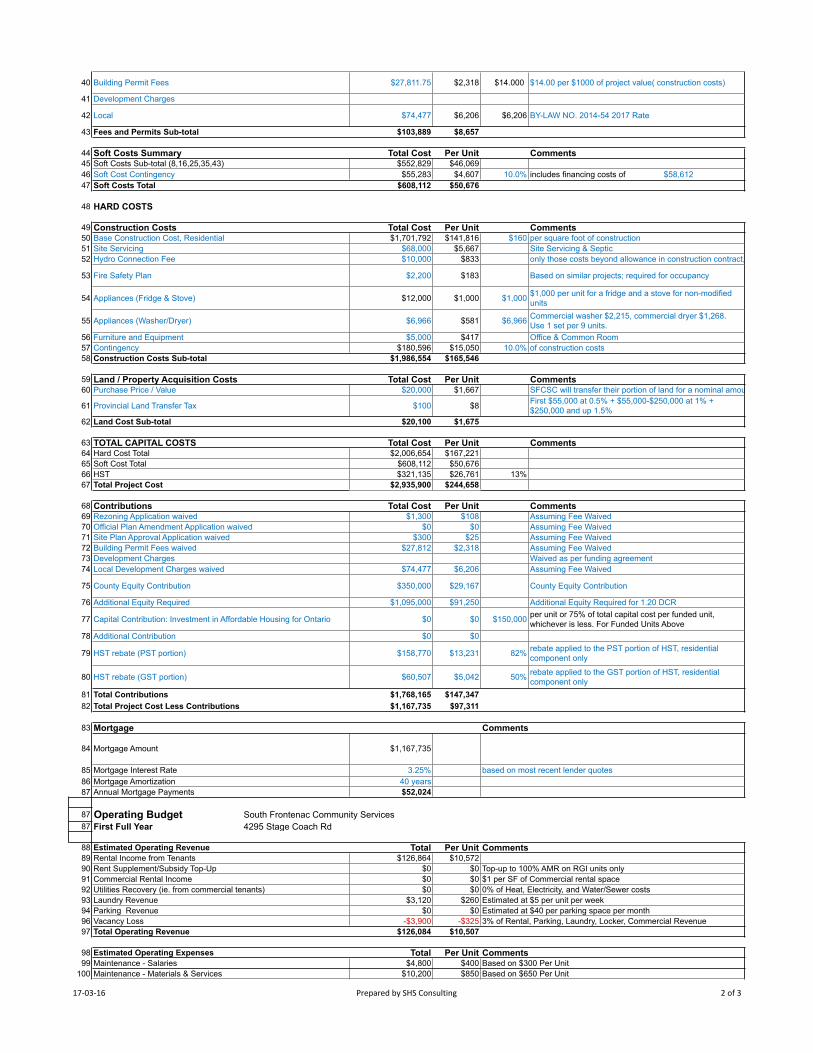
Hard Costs .............................................................................................................................................. 36
materials and services, HST and contributions to a long‐term capital replacement reserve fund.
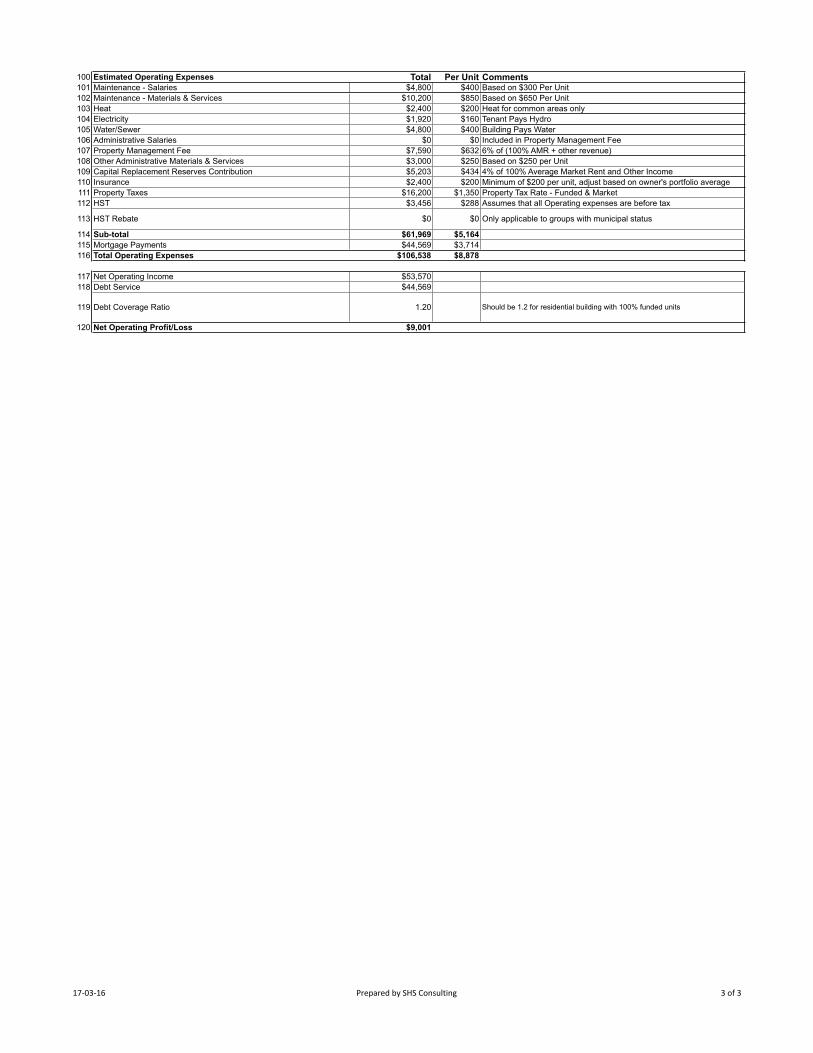
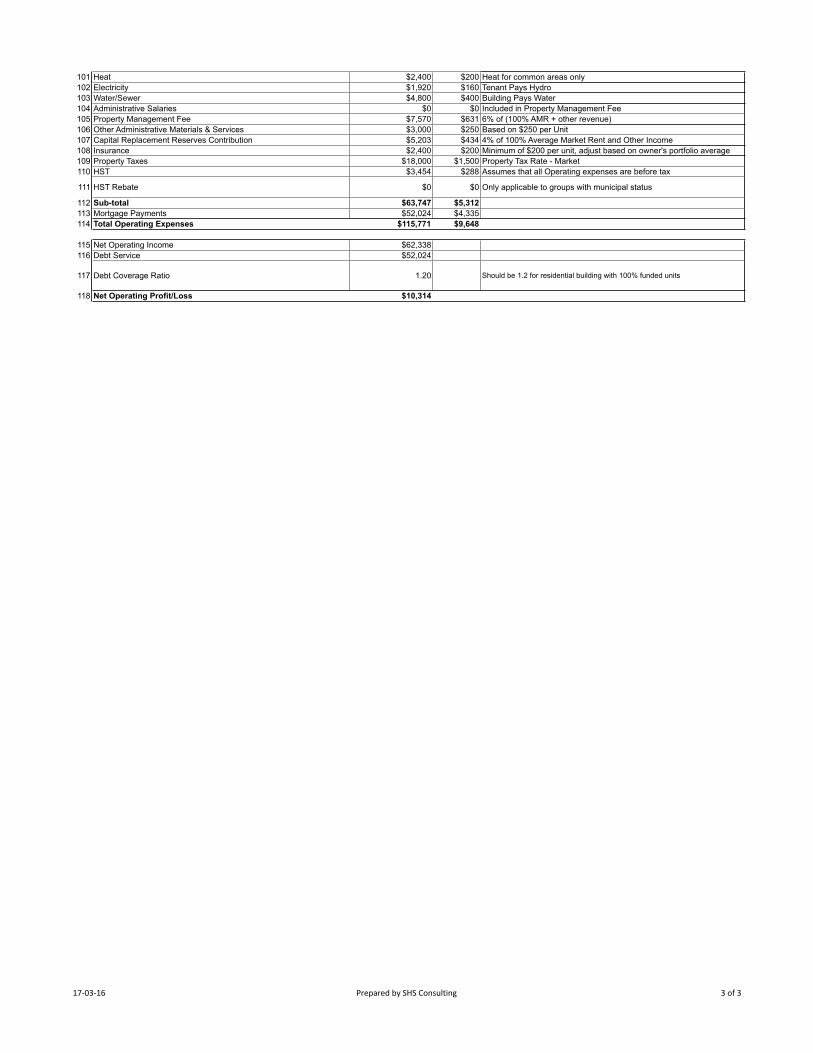
Estimates for operating expenses for the proposed project have been developed using data from projects
of a similar nature. The total operating expenses for the proposed project are estimated for the first year
to be $61,969 for option 1 and $63,747 for option 2 and are comprised of the following notable items:
Maintenance, administration, insurance and property management – Cost estimates are based on
average per unit costs in actual projects and assume the use of contract or part time staff for
necessary duties, given the small scale of the project.
Utilities – have been assumed for heat and hydro in common areas only as it is expected that heat
and hydro for individual units would be paid directly by tenants.
Capital Replacement reserves – in accordance with CMHC mortgage insurance requirements and
prudent practice, an annual contribution to the project’s capital reserve fund is assumed in an
amount equal to 4% of total operating revenue. This reserve would be used to fund future lifecycle
capital repair costs as needs arise.
Property taxes – property taxes are assumed at a reduced rate for funded units, equivalent to the
single residential rate, which is consistent with recent projects developed under affordable housing
programs. This would require a formal tax reduction by the Township and County. Property taxes
for non‐funded units have been assumed at the multiple residential rate.
Harmonized Sales Tax – applicable HST has been assumed as well as an associated rebate. The
rebate is equivalent to that permitted by non‐profit housing providers.
Mortgage payment – Option 1: An annual mortgage payment of $44,569 has been assumed based
on the projected lending amount ($1,000,397), a 40‐year amortization period and an interest rate
of 3.25%. Option 2: An annual mortgage payment of $52,024 has been assumed based on the
projected lending amount ($1,167,735), a 40‐year amortization period and an interest rate of
3.25%.
Preferred rates and amortization are assumed as the mortgage would be CMHC insured but held
with a private lender. Consideration could also be given for self‐financing by the Township or
County as this could result in savings to the project for financing costs.
While not expressed in the first year operating budget, expenses for maintenance, other administrative
materials and services, insurance and property taxes are assumed to increase by 2% per year. This is based
on the 5 year average rate of increase in the Consumer Price Index. Other expenses, such as heat and
hydro, are assumed to increase by 4.34% annually based on the five‐year average rate of increase in the
Consumer Price Index for utilities.
As part of the analysis, viability was also examined beyond the first year of operation. By applying the above
inflationary adjustments, costs and revenues were escalated over a five year period. The analysis showed
that the project remains viable over the analysis period.
Township of South Frontenac
Business Plan for Seniors Housing (Sydenham)
f a c t r e
cc oo nn ss uu ll tt ii nn gg
Funding/capital requirements
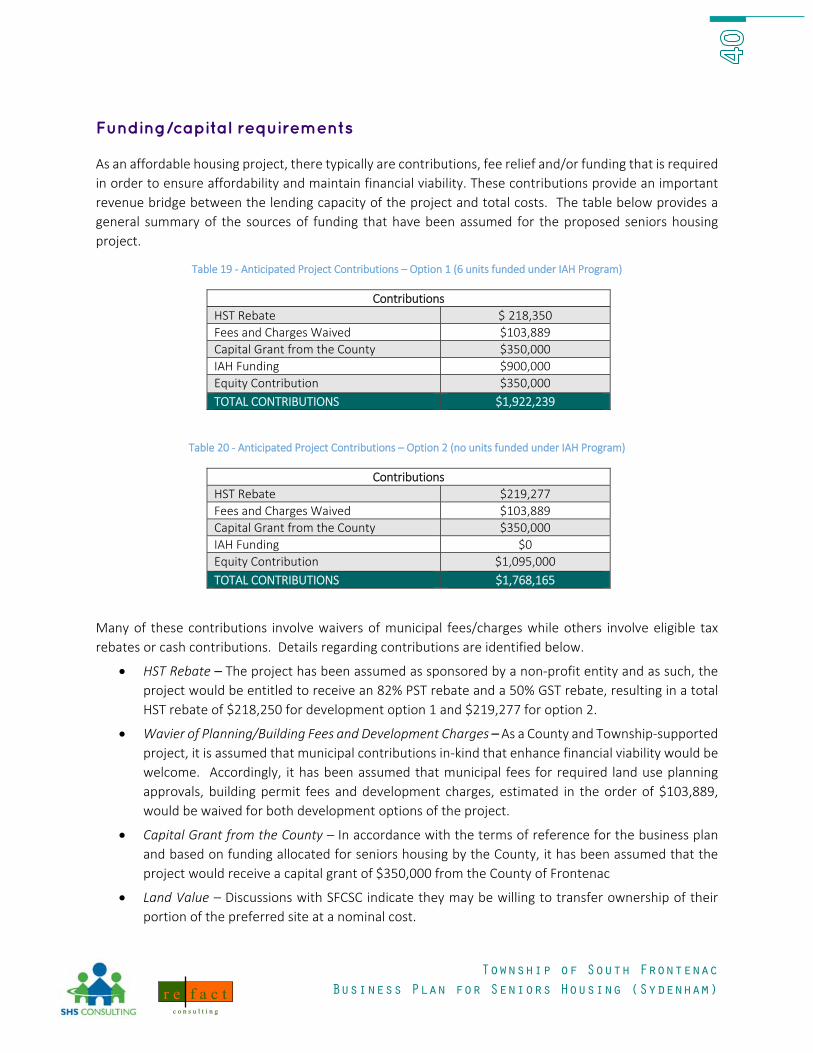
As an affordable housing project, there typically are contributions, fee relief and/or funding that is required
in order to ensure affordability and maintain financial viability. These contributions provide an important
revenue bridge between the lending capacity of the project and total costs. The table below provides a
general summary of the sources of funding that have been assumed for the proposed seniors housing
project.
Table 19 ‐ Anticipated Project Contributions – Option 1 (6 units funded under IAH Program)
Contributions
HST Rebate $ 218,350Fees and Charges Waived $103,889
Capital Grant from the County $350,000
IAH Funding $900,000
Equity Contribution $350,000
TOTAL CONTRIBUTIONS $1,922,239
Table 20 ‐ Anticipated Project Contributions – Option 2 (no units funded under IAH Program)
Contributions
HST Rebate $219,277
Fees and Charges Waived $103,889
Capital Grant from the County $350,000
IAH Funding $0
Equity Contribution $1,095,000
TOTAL CONTRIBUTIONS $1,768,165
Many of these contributions involve waivers of municipal fees/charges while others involve eligible tax
rebates or cash contributions. Details regarding contributions are identified below.
HST Rebate – The project has been assumed as sponsored by a non‐profit entity and as such, the
project would be entitled to receive an 82% PST rebate and a 50% GST rebate, resulting in a total
HST rebate of $218,250 for development option 1 and $219,277 for option 2.
Wavier of Planning/Building Fees and Development Charges – As a County and Township‐supported
project, it is assumed that municipal contributions in‐kind that enhance financial viability would be
welcome. Accordingly, it has been assumed that municipal fees for required land use planning
approvals, building permit fees and development charges, estimated in the order of $103,889,
would be waived for both development options of the project.
Capital Grant from the County – In accordance with the terms of reference for the business plan
and based on funding allocated for seniors housing by the County, it has been assumed that the
project would receive a capital grant of $350,000 from the County of Frontenac
Land Value – Discussions with SFCSC indicate they may be willing to transfer ownership of their
portion of the preferred site at a nominal cost.
Township of South Frontenac
Business Plan for Seniors Housing (Sydenham)
f a c t r e
cc oo nn ss uu ll tt ii nn gg
Equity Contribution – Based on current estimates of total project costs, potential contributions and
assumed debt service capacity, a projected capital shortfall of approximately $350,000 exists for
development option 1. In order to achieve financial feasibility, an equity injection of this amount
would be required to support the project. This equity could be secured in the form of fund raising,
an additional cash contribution, program funding or some combination of the above. Without IAH
funding, a larger equity contribution is required. For development option 2, a total equity
contribution of $1,095,000 is required to make the project financially viable.
Financial viability
The financial plan outlined above presents capital and operating budgets that result in a feasible and self‐
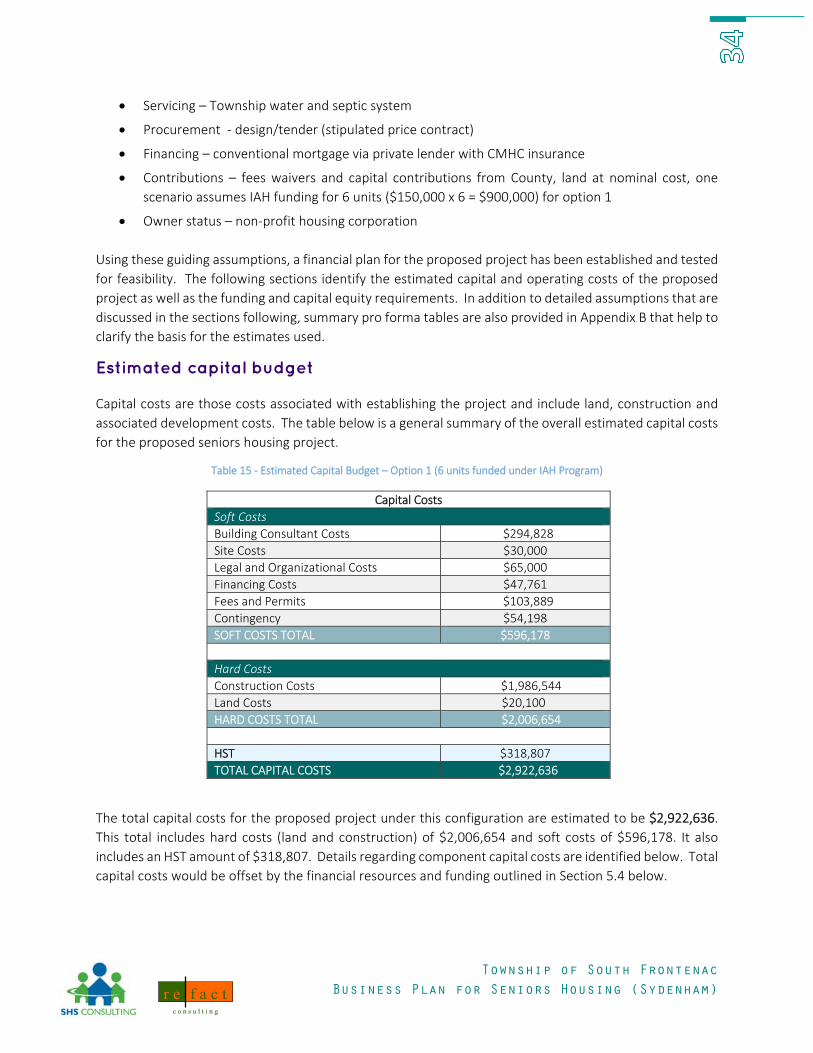
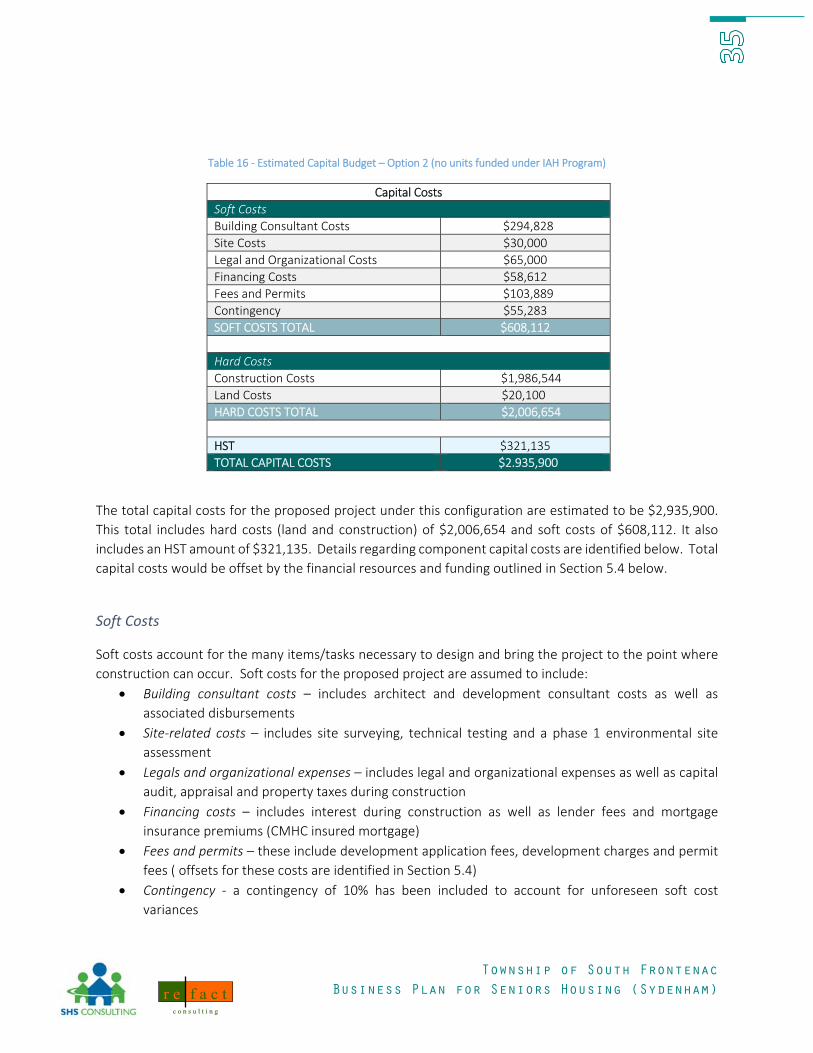
sustaining project based on current assumptions. Based on these estimates, total project costs would be
in the order of $2.92M for development option 1 and $2.93M for option 2. Funding for development costs
in option 1 would be provided through conventional financing of approximately $1,000,397, and a range of
project contributions/rebates totaling $1,922,239. For option 2, these costs include $1,167,735 in
mortgage costs and contributions and rebates totalling $1,768,165.
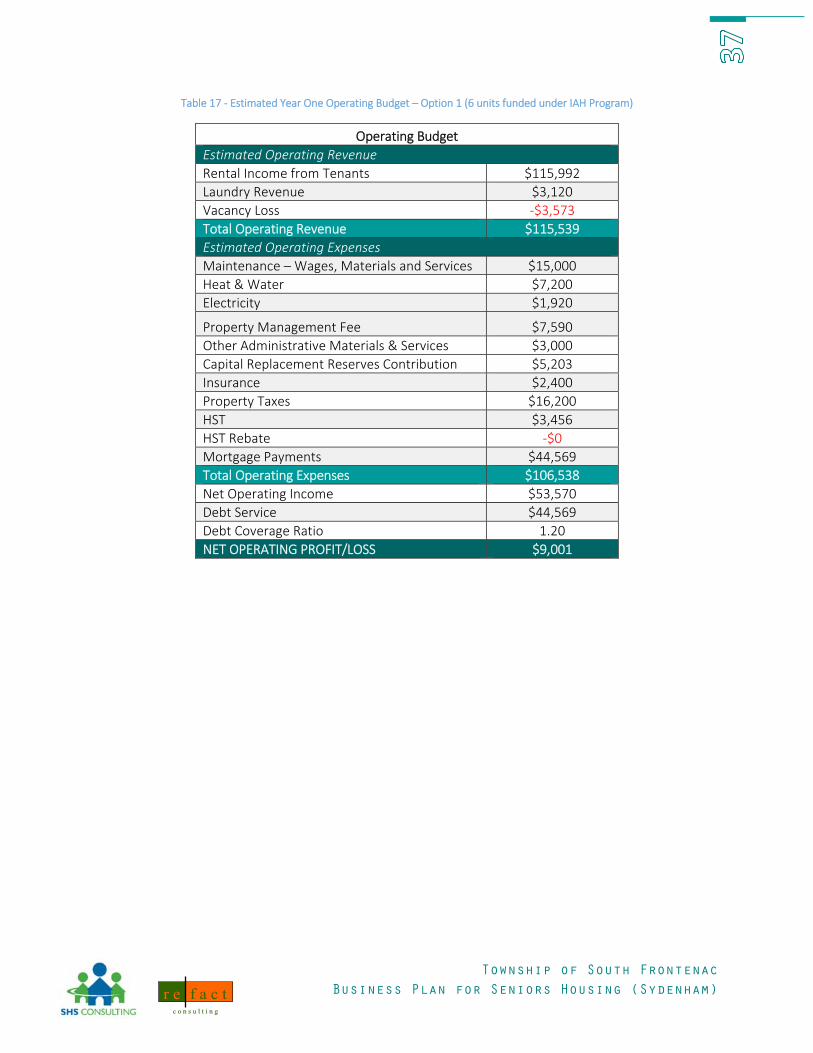
Operationally, development option 1 is estimated to have an initial annual operating cost of $106,538
which would be offset by rents and revenues in the order of almost $115,539. This would result in a modest
annual operating surplus of approximately $9,001. Calculations show that, based on this operating cost
structure, the project would achieve a debt coverage ratio of 1.2, demonstrating that it is financially viable.
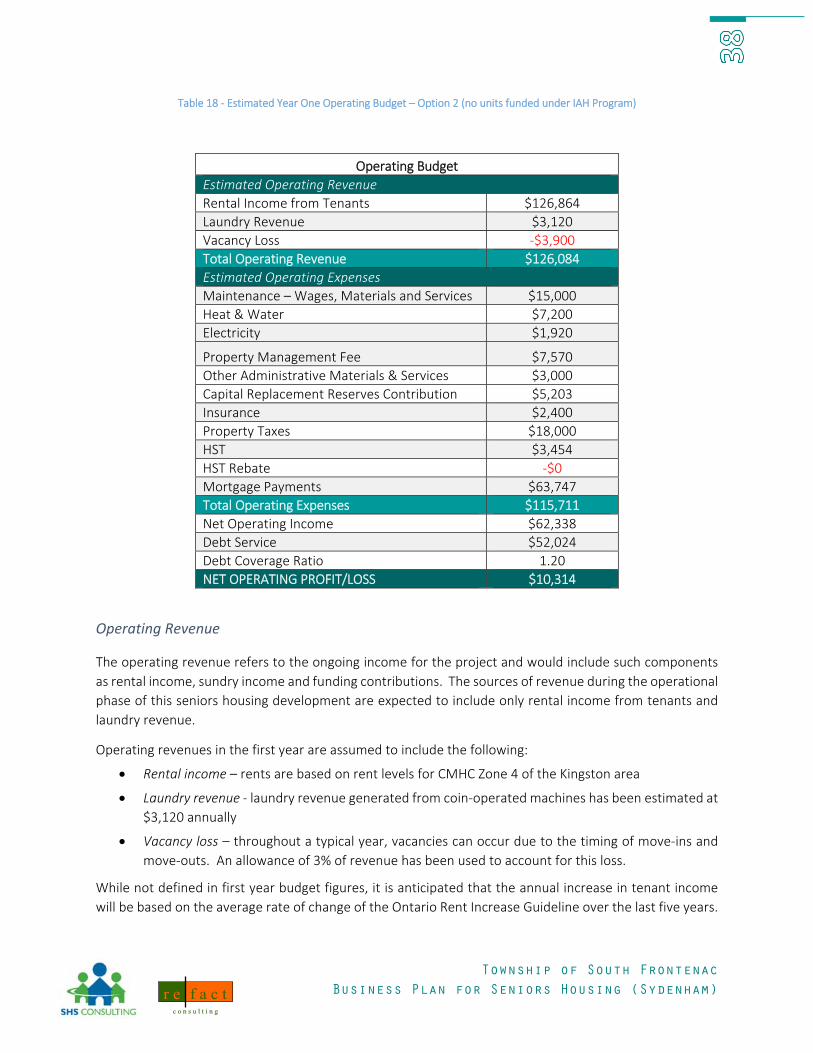
Development option 2 is estimated to have an initial annual operating cost of $115,771 which would be
offset by rents and revenues in the order of almost $126,084. This would result in a modest annual
operating surplus of approximately $10,314. Calculations show that, based on this operating cost structure,
the project would achieve a debt coverage ratio of 1.2, demonstrating that it is financially viable.
That said, viability assumptions do rely on a number of contributions and fee relief to help defray project
costs. These contributions would require the support of both the Township and the County in order to be
realized.
Going forward, it will be critical to re‐test assumptions as cost and revenue estimates are refined. This will
help ensure that as the project concept evolves, options to maintain financial viability can be considered
and applied as needed.
GOVERNANCE
An important consideration in moving forward with the proposed project is understanding how it will be
sponsored and operated on an on‐going basis. This has implications not only for basic operations and
sustainability but can have an impact the financial assumptions for the project. Following is a review of key
governance issues.
Township of South Frontenac
Business Plan for Seniors Housing (Sydenham)
f a c t r e
cc oo nn ss uu ll tt ii nn gg
Project ownership/oversight
The project sponsor – the owner – has a fundamental role in the development and long term success of
the project. Typically for a project of this nature, an established non‐profit housing organization would be
a prime sponsor. The experience they have in project operations and property management would be
highly beneficial.
The one local organization with experience in the ownership and management of affordable seniors rental
housing is Loughborough Housing Corporation, which owns and operates two such buildings in Sydenham.
Preliminary discussions have been held with the Corporation, who have indicated an interest in some form
of involvement in the project. Their expertise and experience in property management of affordable
seniors housing make them well suited to be retained as the property managers for the project. This should
be strongly considered. Any other form of involvement in the ownership of the building would need to be
discussed with their Board and senior staff.
The Township of Frontenac has no previous experience in the ownership and operation of seniors housing
of this nature and have expressed the view that, while they may be prepared to support the project in
various ways, they do not believe they would be suited to be the owners or managers of the building.
Similar views were expressed by South Frontenac Community Services Corporation, which is highly
interested in providing supports and services to seniors in the building (especially given the proposed
location adjacent to their Grace Centre), but has no experience or expertise in the ownership or
management of seniors housing.
One approach which may be suitable in view of the interest of all three organizations in the project would
be the creation of a separate, legally distinct non‐profit housing corporation that has representation from
all three organizations on its Board of Directors. This mix of representation on the Board of the corporation
would facilitate arm’s length local oversight while at the same time compartmentalizing liability and risks
associated with operations. The on‐going involvement of the Township would further help to provide
stability and continuity for the project. The stability of this approach is seen as highly desirable in getting
the project up and running.
Planned approach to management
As noted above, Loughborough Housing Corporation possesses the experience and expertise to undertake
the property management and maintenance of a building of this nature. Given the modest size of the
project, this involvement would be on a part‐time basis. They could be retained on this basis for an annual
property management fee which would be negotiated with the Board of Directors.
Township of South Frontenac
Business Plan for Seniors Housing (Sydenham)
f a c t r e
cc oo nn ss uu ll tt ii nn gg
MOVING FORWARD
Summary of preferred concept
Based on demonstrated needs, community consultation and business case analysis, the concept for a small
scale seniors housing project situated in Sydenham has been developed. This concept has been tested and
found to be viable, subject to the assumptions outlined in this report. Based on the proposed concept, the
seniors housing project would:
Be modest in scale – 12 self‐contained apartment units (6 @ one bedroom, 6 @ two bedroom) plus
amenity space for a total buildable area of 10,600 sf (GFA)
Include basic amenity space ‐ laundry facilities (2 pair) and a small indoor common area for
gathering/socialization would be provided
Accommodate seniors mobility needs – providing a safe, indoor access to apartment units while
incorporating visitability and accessibility throughout units and common spaces
Support basic affordability – all units would be rental and offered at or below average market rent
level. Rents for the one bedroom units could be lowered to 80% of average market rent if IAH
funding is obtained from the City of Kingston.
Be procured as new construction – this approach would enable a single storey slab‐on‐grade
building, with a cost‐effective double‐loaded main corridor, wood frame structure and standard
sloped roof
Incorporate practical sustainability features that promote energy efficiency
Be situated adjacent to the Grace Centre on land currently owned by South Frontenac Community
Services Corporation, plus an adjacent parcel
Be procured through a formal design/tender process (stipulated price contract)
Be financed using a conventional mortgage that is CMHC‐insured, as well as an equity contribution
of $350,000 from the County and an additional equity contribution in the order of $350,000 for
the IAH‐funded option OR $1,095,000 in the non‐funded option
Be owned by a newly constituted non‐profit housing corporation
Be managed by Loughborough Housing Corporation, should they be agreeable to take on that role.
As a result of the financial analysis, it has been determined that the project would be viable based on
preliminary cost estimates, anticipated revenues and assumed contributions. While a series of land use
approvals are required to permit the intended use, there do not appear to be any significant barriers to
securing these approvals. Prior to acquiring the project site, due diligence testing would be required to
ensure that no environmental concerns or project servicing impediments exist. Based on an initial scan of
current conditions and background information, no impediments are anticipated. Viable project
governance options exist, the most plausible of which would see the creation of a new non‐profit
corporation which would legally own and operate the project.
Township of South Frontenac
Business Plan for Seniors Housing (Sydenham)
f a c t r e
cc oo nn ss uu ll tt ii nn gg
Process/critical path
While preliminary feasibility of the project concept has been demonstrated, there are a number of steps
necessary to advance the project. Moving forward through these steps, there are a number of decision
points where the plausibility of advancing would need to be reconfirmed as the project concept is refined.
Initially, this would involve steps confirming the parameters for moving forward from the initial feasibility
testing, including the following tasks:
Confirm decision to move forward – in addition to endorsing the business plan, this task would
involve securing development consulting expertise to advance the project
Confirm decisions with regards governance/oversight – this would involve defining the Township
role in the project going forward, as well as pursuing incorporation of the sponsor entity (if this
approach is confirmed). Discussions would be required with the Boards of Loughborough Housing
Corporation and South Frontenac Community Services Corporation about potential representation
on the Board of Directors.
Enter into a conditional agreement re property – this would involve meeting the South Frontenac
Community Services Corporation to develop an agreement to lease or purchase the preferred
property and the adjacent parcel. This agreement would be conditional on all of the requirements
of the project being met
Enter into discussions with Loughborough Housing Corporation about property management – this
would involve meeting with Loughborough Housing Corporation to determine their interest in
assuming the role of property managers of the building
Confirm initial funding commitments – to enable project planning, County and Township
contributions would need to be confirmed. Access to financing would also need to be confirmed
on a preliminary basis as well as the funding/resources necessary to undertake the next stage of
pre‐development work. The City of Kingston would need to be approached regarding the
availability of IAH funding.
With these activities completed, a decision regarding proceeding/not would be made in order to move
forward to the pre‐development stage. Under this phase, the following activities would be required to
advance development of the project to the point of construction commitment:
Assemble technical/design team – this would involve identifying or recruiting development team
members, including a project architect and technical testing specialists
Formalize project design – preliminary design drawings would be developed for comment and
subsequent refinement in accordance with the finalized project concept
Complete due diligence for land – in order to finalize site acquisition, environmental and technical
testing would need to be conducted to formally confirm that no development constraints existed
Confirm specific service requirements – having confirmed technical parameters and preliminary
design, final servicing designs would be developed for septic systems and utilities into the site
Township of South Frontenac
Business Plan for Seniors Housing (Sydenham)
f a c t r e
cc oo nn ss uu ll tt ii nn gg
Re‐confirm costs, funding and mortgage financing – in addition to updated pro forma figures, a
conditional financing commitment would be secured to confirm financial parameters prior to
tendering
With these activities completed, a decision regarding proceeding/not would be made in order to move
forward to the construction stage. Under this phase, the following activities would be required:
Prepare contract documents for bidding – final design drawings and accompanying specification
would be developed for tendering purposes
Tendering for construction pricing – contract documents would be tendered for pricing to qualified
bidders and results would be evaluated against budgeted construction costs. Both conventional
contractors and modular contractors should be invited.
Reconfirm financing and project commitment – final budget adjustments would be made based on
tendered costs to secure final financing approvals, thereby enabling owner approval for project
commitment to proceed with construction
Negotiate construction contract and commence construction – with approval in hand, a standard
construction contract would be executed with the selected bidder
Construction monitoring – through the construction process, regular progress reviews would be
undertaken to track progress against the building schedule as well as costs versus budget.
Pre‐occupancy planning – during the construction phase, planning would be undertaken in order
to prepare for tenant move‐in and project operations
Post‐occupancy wrap‐up – with the conclusion of construction and the subsequent certification for
project occupancy, capital cost reconciliation, HST self‐assessment, warranty inspections, etc.
would be completed in order to close out the capital development phase of the project
Key elements & critical success factors
As noted, there are a number of tasks require to move the project forward through successive stages of
development. Each stage is punctuated with a decision point on whether to proceed or not to the next
stage. While this progressive process lays out a stepwise approach to move from initial viability through to
construction, there are some fundamental success factors that are key ingredients for realizing the
proposed project. Having these elements in place goes a long way to supporting project viability.
Key elements required for a successful project include:
Allocating sufficient resources – having the funds/resources to undertake pre‐development work
and advance through construction is essential to the success of the project
Having a clear governance/accountability framework – during development and after occupancy,
having a clear and straight‐forward decision‐making structure for oversight
Acquiring strong technical expertise – through the development process, a range of technical issues
must be addressed/overcome and having an experienced team is key to staying on track
Township of South Frontenac
Business Plan for Seniors Housing (Sydenham)
f a c t r e
cc oo nn ss uu ll tt ii nn gg
Firming up an agreement for the preferred property – a fundamental project requirement is
reaching agreement on the preferred property, which is currently owned by South Frontenac
Community Services Corporation and its neighbour
Securing access to financing – securing financing is a critical component to meeting the financial
obligations of development
Township of South Frontenac
Business Plan for Seniors Housing (Sydenham)
f a c t r e
cc oo nn ss uu ll tt ii nn gg
APPENDIX ‘A’ – NEEDS PROFILE The “Seniors Community Housing Pilot Project Study” completed for the County in 2012 contained a
comprehensive profile of housing and need indicators for the County and its constituent townships. This
profile was based on data available at the time. Since completion of the pilot study, additional Census and
market data have been released that serve to provide a more current picture of local conditions.
This appendix provides an abbreviated update of the original profile, highlighting key housing and need
indicators at the County level. Seniors‐based indicators are also examined at the County level and
summarized as part of this update. As a result, relevant local conditions in the Frontenac Islands have been
highlighted in the body of the report with regard for the broader analysis provided in this appendix.
County-wide Housing Needs and Market Indicators
Demographic Profile
Frontenac County
The County of Frontenac is rural in character, covering an expansive area of some 4,000 square kilometres.
The County has a permanent population of just over 26,000, complimented by a substantial number of
seasonal residents who cottage throughout the Frontenacs. The county is comprised of four townships ‐
North, Central and South Frontenac and Frontenac Islands. The majority of dwellings in the County are
single‐detached homes, located in one of the many small villages and hamlets or scattered throughout the
extensive rural area. As a result, the land use pattern for the County is very low density in nature.
Like other jurisdictions in Ontario, the County is experiencing aging in its population. In fact, the share of
the senior population in the County of Frontenac is actually increasing more rapidly than that of the
province as a whole.
General Population Trends
In 2011, the County of Frontenac had a permanent population of 26,375. The majority of this population
(68.7%) lives in South Frontenac. Central Frontenac accounts for 17.3% of the population while the rest of
the population is divided between Frontenac Islands (7.1%) and North Frontenac (7.0%).
Table 21. Population Counts, Frontenac County and the Townships of Frontenac Islands, South Frontenac, Central Frontenac and North Frontenac, 1996‐2036
Source: Statistics Canada 1996‐2011 Community and Census Profiles; Watson & Associates, Population, Housing and Employment Projections for the Frontenacs, June 2014
Township of South Frontenac
Business Plan for Seniors Housing (Sydenham)
f a c t r e
cc oo nn ss uu ll tt ii nn gg
Over the last 15 years the population of the County has increased by 11.0% overall, growing from a
population of 23,760 in 1996. From 2006 to 2011, the County’s population declined 1.1%. While the County
has experienced a slight decline recently, it is still important to note that the County’s population is
expected to grow and that based on projections by Watson and Associates undertaken in 2014, the
population is estimated to increase by some 6,000 people from 2011 to 2036 (23%). Locationally, the
population distribution is expected to remain the same, with 68.1% still expected to reside in South
Frontenac in 2036 (compared to 68.7% in 2011). The other Townships are also expected to maintain their
proportions, with Frontenac Islands’ share rising slightly from 7.1% in 2011 to 7.5% in 2036.
Figure 9. Population Growth and Decline Trends, Frontenac County and the Townships of Frontenac Islands, South Frontenac,
Central Frontenac and North Frontenac, 1996‐2036
Population by Age
When broken down by age range, Ministry of Finance data shows that the largest age group in the County
of Frontenac (including the City of Kingston)1 in 2011 was persons aged under 25 years, comprising nearly
a third (29.5%) of the population. The number of persons in this age group is expected to increase by 4,770
by 2036 (10.8%), but the age group’s proportion will drop to 24.7% of the total population.
All age groups are expected to increase in real numbers from 2011 to 2036, but senior age groups will see
the most sizable increases, with the 65 to 74 year old age group increasing by over 10,000 persons (76.0%
increase) and the 75 years and older group more than doubling (17,000+ persons or a 144.8% increase).
This compares to a 32.4% increase for the population as a whole.
1 Ministry of Finance figures do not disaggregate data for the County and City of Kingston. As such, figures are reported based on County + City totals.
Township of South Frontenac
Business Plan for Seniors Housing (Sydenham)
f a c t r e
cc oo nn ss uu ll tt ii nn gg
Also expected to experience notable growth us the 35 to 44 year age group, indicating there will be more
persons of working age in the County in a couple of decades. This could lead to an even greater increase in
seniors as this population group ages in the future.
Table 22. Population Counts and Trends by Age, Frontenac County (including the City of Kingston), 2011 and 2036
2011 2036 % Change 2011‐2036
Age # % # % %
0 ‐ 24 44,120 29.5% 48,890 24.7% 10.8%
25 ‐ 34 19,125 12.8% 23,910 12.1% 25.0%
35 ‐ 44 18,115 12.1% 26,360 13.3% 45.5%
45 ‐ 54 23,305 15.6% 26,380 13.3% 13.2%
55 ‐ 64 20,155 13.5% 20,720 10.5% 2.8%
65 ‐ 74 13,175 8.8% 23,190 11.7% 76.0%
75+ 11,745 7.8% 28,750 14.5% 144.8%
TOTAL 149,740 100.0% 198,200 100.0% 32.4%
Source: Statistics Canada, Community Profiles, 2011; Ontario Ministry of Finance, Population Projections Update,
2014
Households
In terms of household growth, the number of households in the County has grown 26.0% from 1996 to
2011, from 8,650 households to 10,900 in 2011. This rate of household growth is notably higher than the
population growth rate during the same time period, which is due in part to trending towards smaller, more
diverse household types. This is reinforced by the fact that even though the County’s population declined
1.1% from 2006 to 2011, households grew 6.2%.
Like population trends, the largest proportion of households is situated in South Frontenac, with 66.2% of
households. Another 17.5% are located in Central Frontenac with just 8.4% and 7.8% in North Frontenac
and Frontenac Islands, respectively.
It is projected that households will continue to grow at similar rates over the next 20 years, with an
expected increase of 26.6% from 2011 to 2036 for the County. Despite this overall trend, the rate of
household growth will be slower in South Frontenac and Frontenac Islands, and faster in North Frontenac
and especially in Central Frontenac. Geographical distribution of households amongst the Townships is
also expected to remain steady.
Township of South Frontenac
Business Plan for Seniors Housing (Sydenham)
f a c t r e
cc oo nn ss uu ll tt ii nn gg
Figure 10. Household Growth Trends, Frontenac County and the Townships of Frontenac Islands, South Frontenac, Central Frontenac and North Frontenac, 1996‐2036
Tenure
Along with population and household trends, tenure is also a key indicator for tracking housing trends.
Ownership continues to be very prominent throughout the County. As can be seen in the figure below, the
share of households with ownership tenure has been on the rise, with the proportion of owners rising from
85.9% in 1996 to 91.3% in 2011. In contrast, there was a decline in the proportion of renter households
during this same period to 8.7% in 2011. In real terms, the number of owners rose 33.0% during this time
period, while the number of actual renters declined 23.4%, in 2011, indicating that.
Figure 11. Tenure Trends, County of Frontenac, 1996 and 2011
Income
An important element in determining housing need is the economic capacity of a household. By examining
income trends and characteristics, it is possible to better identify the affordability limitations of households
and the impact these have on the housing options available to them.
Township of South Frontenac
Business Plan for Seniors Housing (Sydenham)
f a c t r e
cc oo nn ss uu ll tt ii nn gg
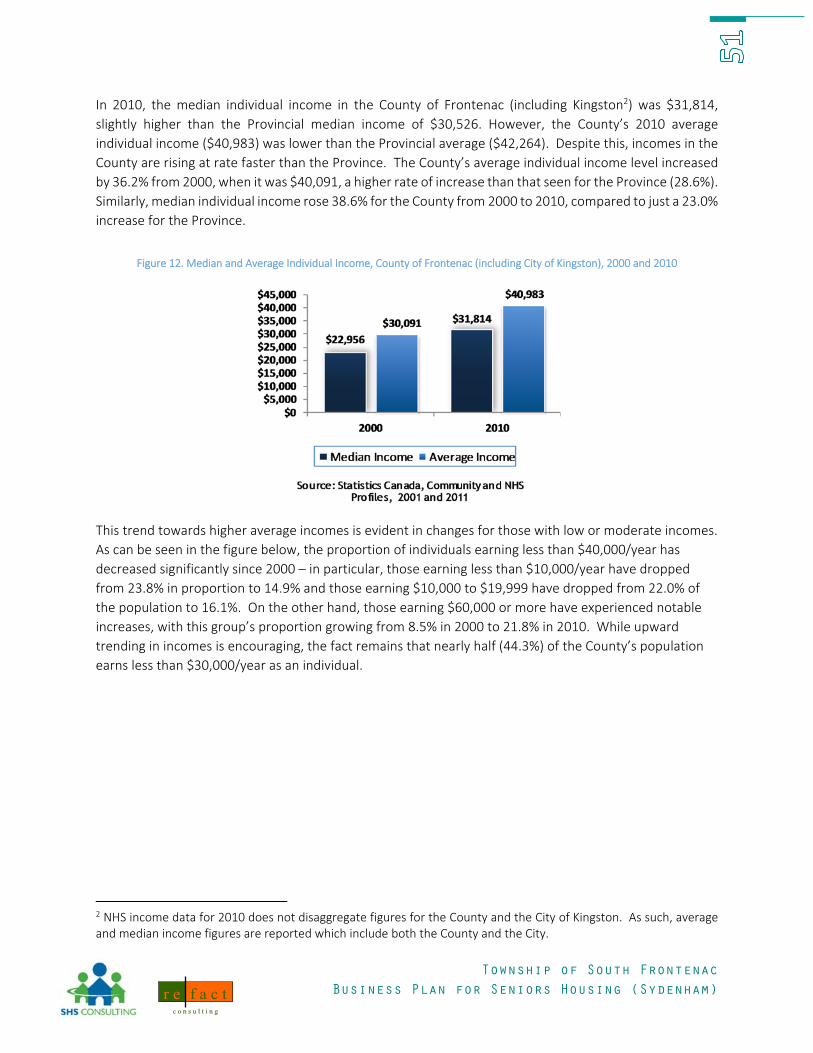
In 2010, the median individual income in the County of Frontenac (including Kingston2) was $31,814,
slightly higher than the Provincial median income of $30,526. However, the County’s 2010 average
individual income ($40,983) was lower than the Provincial average ($42,264). Despite this, incomes in the
County are rising at rate faster than the Province. The County’s average individual income level increased
by 36.2% from 2000, when it was $40,091, a higher rate of increase than that seen for the Province (28.6%).
Similarly, median individual income rose 38.6% for the County from 2000 to 2010, compared to just a 23.0%
increase for the Province.
Figure 12. Median and Average Individual Income, County of Frontenac (including City of Kingston), 2000 and 2010
This trend towards higher average incomes is evident in changes for those with low or moderate incomes.
As can be seen in the figure below, the proportion of individuals earning less than $40,000/year has
decreased significantly since 2000 – in particular, those earning less than $10,000/year have dropped
from 23.8% in proportion to 14.9% and those earning $10,000 to $19,999 have dropped from 22.0% of
the population to 16.1%. On the other hand, those earning $60,000 or more have experienced notable
increases, with this group’s proportion growing from 8.5% in 2000 to 21.8% in 2010. While upward
trending in incomes is encouraging, the fact remains that nearly half (44.3%) of the County’s population
earns less than $30,000/year as an individual.
2 NHS income data for 2010 does not disaggregate figures for the County and the City of Kingston. As such, average and median income figures are reported which include both the County and the City.
Township of South Frontenac
Business Plan for Seniors Housing (Sydenham)
f a c t r e
cc oo nn ss uu ll tt ii nn gg
Figure 13. Individual Income Ranges, County of Frontenac (including City of Kingston), 2000 and 2010
In terms of household income, the chart below shows that median and average household incomes have
been rising at a rate similar to those of individuals. For the County as a whole (including Kingston3), median
household income rose 32.1% from 2000 to 2010 and average household income 35.8%. In comparison,
median household income for the Province rose 23.7% to reach $66,358 in 2010, and average household
income 28.3% to reach $85,772. Like individual incomes, average and median household incomes for the
Province are higher than the County, but growth in household incomes is occurring at a faster rate in the
County.
Figure 4. Median and Average Household Income, County of Frontenac (including City of Kingston), 2000 and 2010
3 As previously noted, NHS income data for 2010 agglomerates figures for the County and the City of Kingston.
Township of South Frontenac
Business Plan for Seniors Housing (Sydenham)
f a c t r e
cc oo nn ss uu ll tt ii nn gg
Housing Profile
Housing supply is typically measured based on the availability of housing options for households within a
community. These housing options are then compared to housing demand to identify any gaps that may
exist. However, gaps in the market are not simply borne out of demand; they can also be driven by factors
which limit choices. Generally speaking, households with higher incomes and the ability to live
independently are able to exercise this choice in the housing market. By contrast, those with lower incomes
and higher care requirements will have much fewer choices. The private market traditionally supplies the
majority of housing in most communities and this is certainly the case in the County of Frontenac.
Dwellings
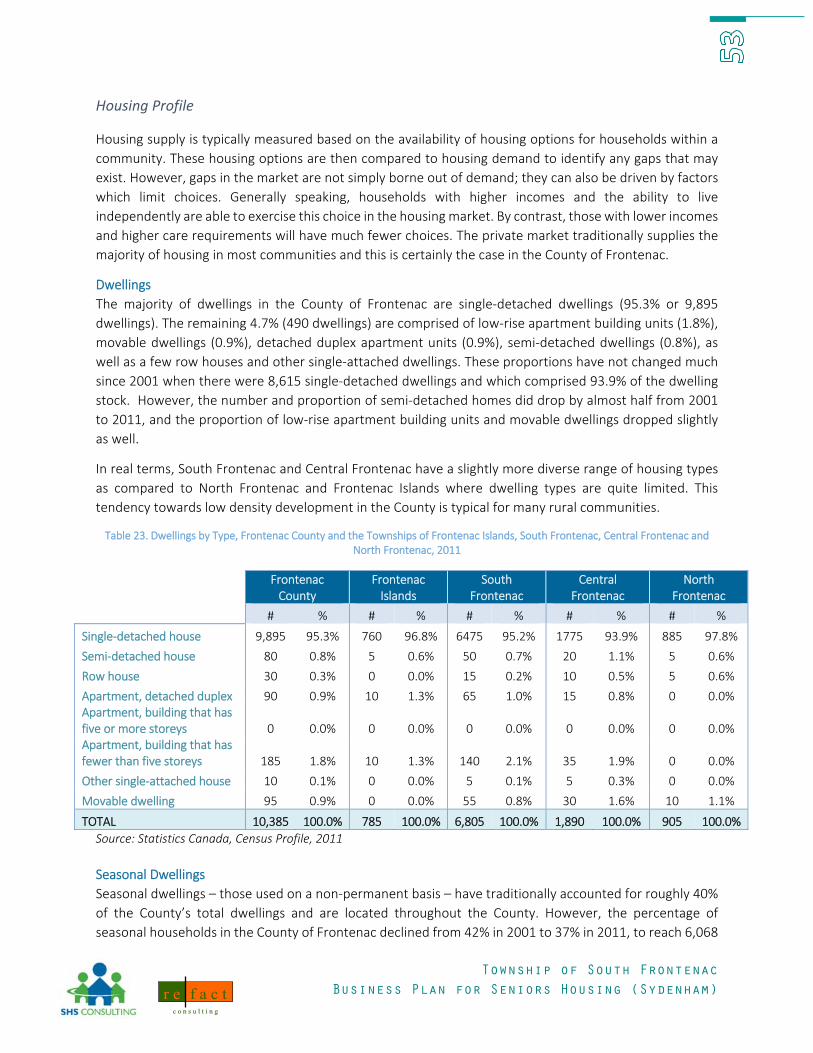
The majority of dwellings in the County of Frontenac are single‐detached dwellings (95.3% or 9,895
dwellings). The remaining 4.7% (490 dwellings) are comprised of low‐rise apartment building units (1.8%),
movable dwellings (0.9%), detached duplex apartment units (0.9%), semi‐detached dwellings (0.8%), as
well as a few row houses and other single‐attached dwellings. These proportions have not changed much
since 2001 when there were 8,615 single‐detached dwellings and which comprised 93.9% of the dwelling
stock. However, the number and proportion of semi‐detached homes did drop by almost half from 2001
to 2011, and the proportion of low‐rise apartment building units and movable dwellings dropped slightly
as well.
In real terms, South Frontenac and Central Frontenac have a slightly more diverse range of housing types
as compared to North Frontenac and Frontenac Islands where dwelling types are quite limited. This
tendency towards low density development in the County is typical for many rural communities.
Table 23. Dwellings by Type, Frontenac County and the Townships of Frontenac Islands, South Frontenac, Central Frontenac and North Frontenac, 2011
Apartment, detached duplex 90 0.9% 10 1.3% 65 1.0% 15 0.8% 0 0.0% Apartment, building that has five or more storeys 0 0.0% 0 0.0% 0 0.0% 0 0.0% 0 0.0% Apartment, building that has fewer than five storeys 185 1.8% 10 1.3% 140 2.1% 35 1.9% 0 0.0%
Other single‐attached house 10 0.1% 0 0.0% 5 0.1% 5 0.3% 0 0.0%
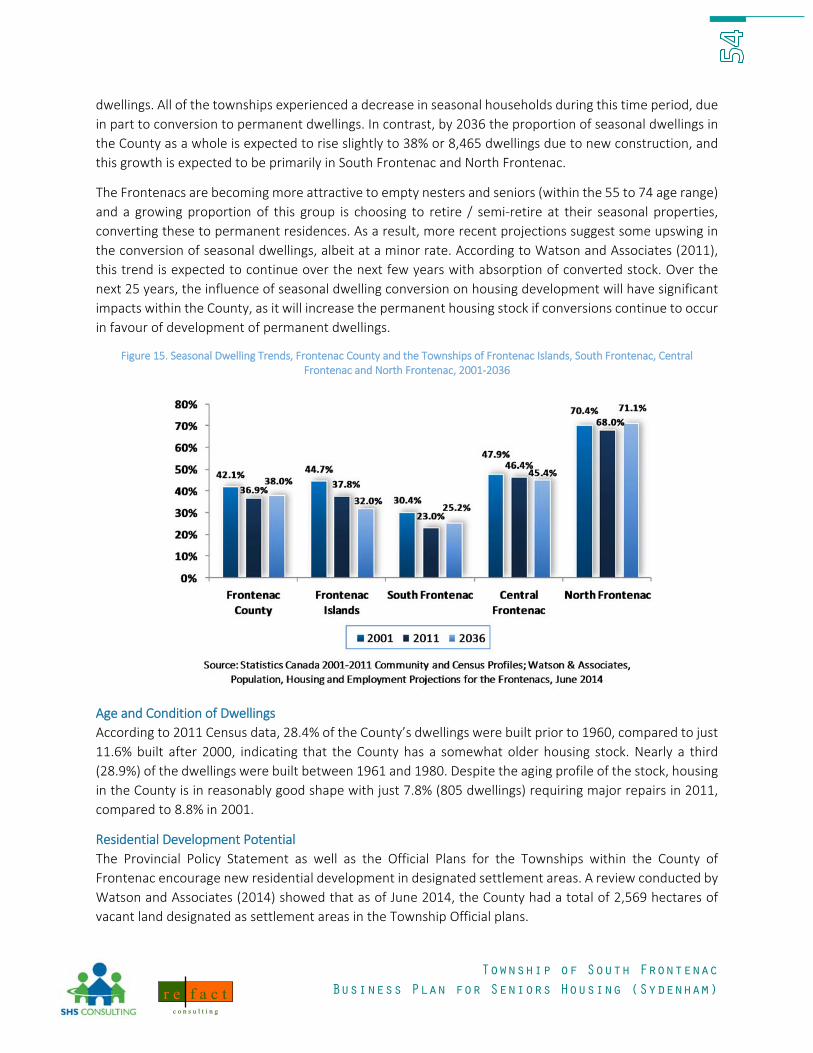
Seasonal dwellings – those used on a non‐permanent basis – have traditionally accounted for roughly 40%
of the County’s total dwellings and are located throughout the County. However, the percentage of
seasonal households in the County of Frontenac declined from 42% in 2001 to 37% in 2011, to reach 6,068
Township of South Frontenac
Business Plan for Seniors Housing (Sydenham)
f a c t r e
cc oo nn ss uu ll tt ii nn gg
dwellings. All of the townships experienced a decrease in seasonal households during this time period, due
in part to conversion to permanent dwellings. In contrast, by 2036 the proportion of seasonal dwellings in
the County as a whole is expected to rise slightly to 38% or 8,465 dwellings due to new construction, and
this growth is expected to be primarily in South Frontenac and North Frontenac.
The Frontenacs are becoming more attractive to empty nesters and seniors (within the 55 to 74 age range)
and a growing proportion of this group is choosing to retire / semi‐retire at their seasonal properties,
converting these to permanent residences. As a result, more recent projections suggest some upswing in
the conversion of seasonal dwellings, albeit at a minor rate. According to Watson and Associates (2011),
this trend is expected to continue over the next few years with absorption of converted stock. Over the
next 25 years, the influence of seasonal dwelling conversion on housing development will have significant
impacts within the County, as it will increase the permanent housing stock if conversions continue to occur
in favour of development of permanent dwellings.
Figure 15. Seasonal Dwelling Trends, Frontenac County and the Townships of Frontenac Islands, South Frontenac, Central Frontenac and North Frontenac, 2001‐2036
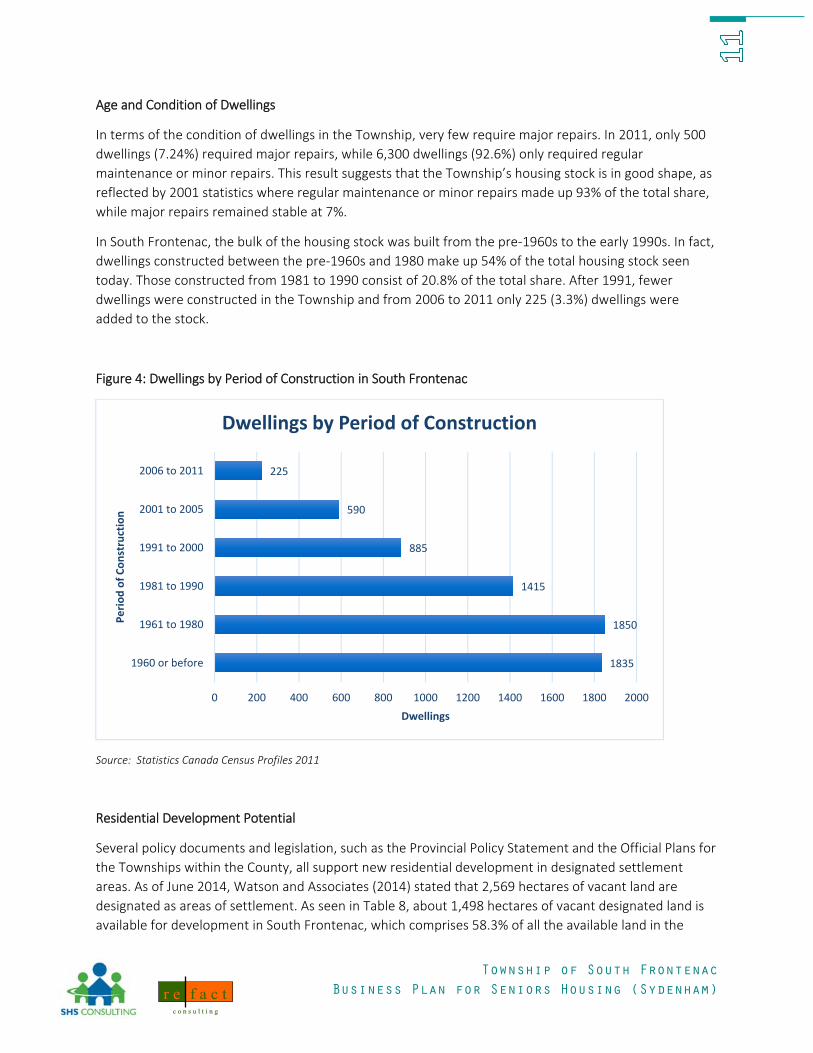
Age and Condition of Dwellings
According to 2011 Census data, 28.4% of the County’s dwellings were built prior to 1960, compared to just
11.6% built after 2000, indicating that the County has a somewhat older housing stock. Nearly a third
(28.9%) of the dwellings were built between 1961 and 1980. Despite the aging profile of the stock, housing
in the County is in reasonably good shape with just 7.8% (805 dwellings) requiring major repairs in 2011,
compared to 8.8% in 2001.
Residential Development Potential
The Provincial Policy Statement as well as the Official Plans for the Townships within the County of
Frontenac encourage new residential development in designated settlement areas. A review conducted by
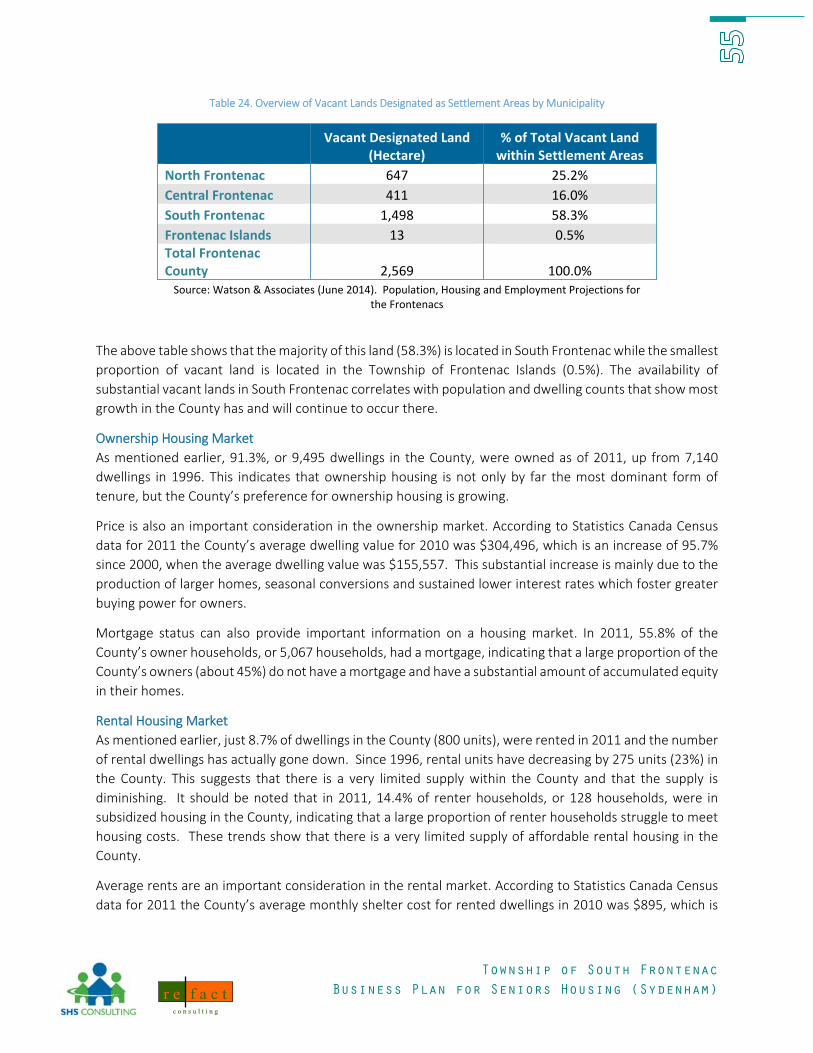
Watson and Associates (2014) showed that as of June 2014, the County had a total of 2,569 hectares of
vacant land designated as settlement areas in the Township Official plans.
Township of South Frontenac
Business Plan for Seniors Housing (Sydenham)
f a c t r e
cc oo nn ss uu ll tt ii nn gg
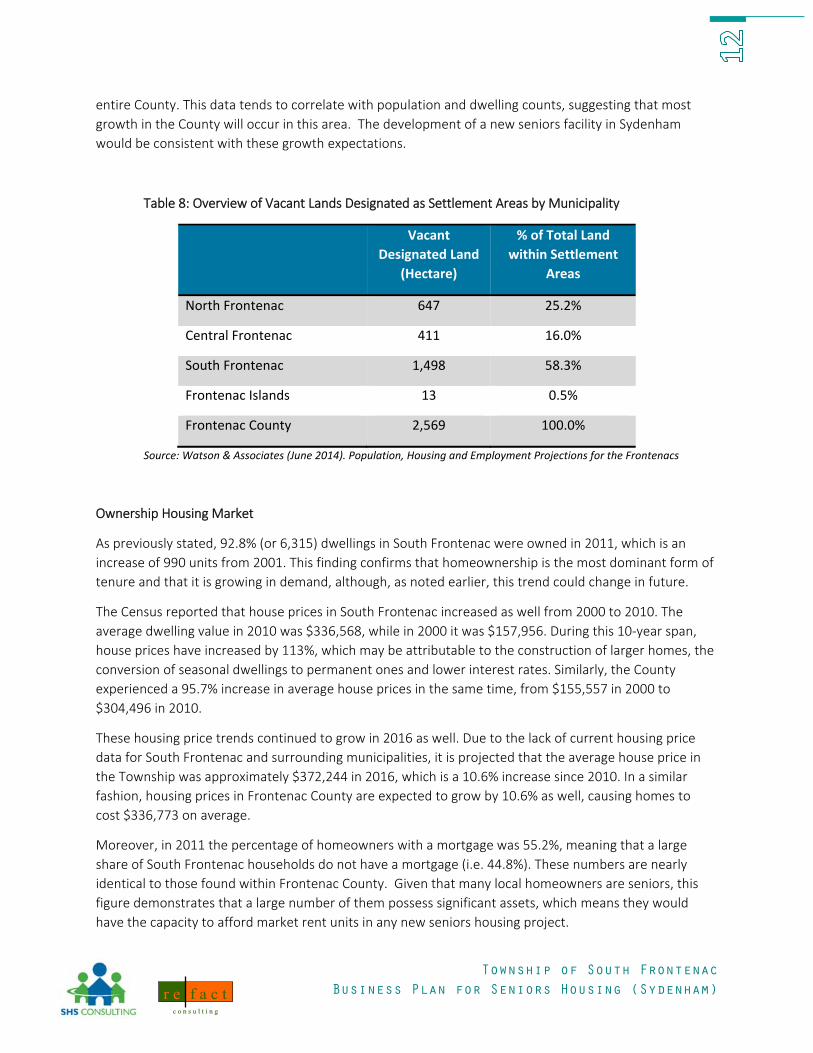
Table 24. Overview of Vacant Lands Designated as Settlement Areas by Municipality
Vacant Designated Land
(Hectare) % of Total Vacant Land within Settlement Areas
North Frontenac 647 25.2%
Central Frontenac 411 16.0%
South Frontenac 1,498 58.3%
Frontenac Islands 13 0.5% Total Frontenac County 2,569 100.0% Source: Watson & Associates (June 2014). Population, Housing and Employment Projections for
the Frontenacs
The above table shows that the majority of this land (58.3%) is located in South Frontenac while the smallest
proportion of vacant land is located in the Township of Frontenac Islands (0.5%). The availability of
substantial vacant lands in South Frontenac correlates with population and dwelling counts that show most
growth in the County has and will continue to occur there.
Ownership Housing Market
As mentioned earlier, 91.3%, or 9,495 dwellings in the County, were owned as of 2011, up from 7,140
dwellings in 1996. This indicates that ownership housing is not only by far the most dominant form of
tenure, but the County’s preference for ownership housing is growing.
Price is also an important consideration in the ownership market. According to Statistics Canada Census
data for 2011 the County’s average dwelling value for 2010 was $304,496, which is an increase of 95.7%
since 2000, when the average dwelling value was $155,557. This substantial increase is mainly due to the
production of larger homes, seasonal conversions and sustained lower interest rates which foster greater
buying power for owners.
Mortgage status can also provide important information on a housing market. In 2011, 55.8% of the
County’s owner households, or 5,067 households, had a mortgage, indicating that a large proportion of the
County’s owners (about 45%) do not have a mortgage and have a substantial amount of accumulated equity
in their homes.
Rental Housing Market
As mentioned earlier, just 8.7% of dwellings in the County (800 units), were rented in 2011 and the number
of rental dwellings has actually gone down. Since 1996, rental units have decreasing by 275 units (23%) in
the County. This suggests that there is a very limited supply within the County and that the supply is
diminishing. It should be noted that in 2011, 14.4% of renter households, or 128 households, were in
subsidized housing in the County, indicating that a large proportion of renter households struggle to meet
housing costs. These trends show that there is a very limited supply of affordable rental housing in the
County.
Average rents are an important consideration in the rental market. According to Statistics Canada Census
data for 2011 the County’s average monthly shelter cost for rented dwellings in 2010 was $895, which is
Township of South Frontenac
Business Plan for Seniors Housing (Sydenham)
f a c t r e
cc oo nn ss uu ll tt ii nn gg
an increase of 32.6% since 2000, when the average monthly shelter cost for rented dwellings was $675. It
is presumed that rising utility costs during this period would have had some influence on these increases.
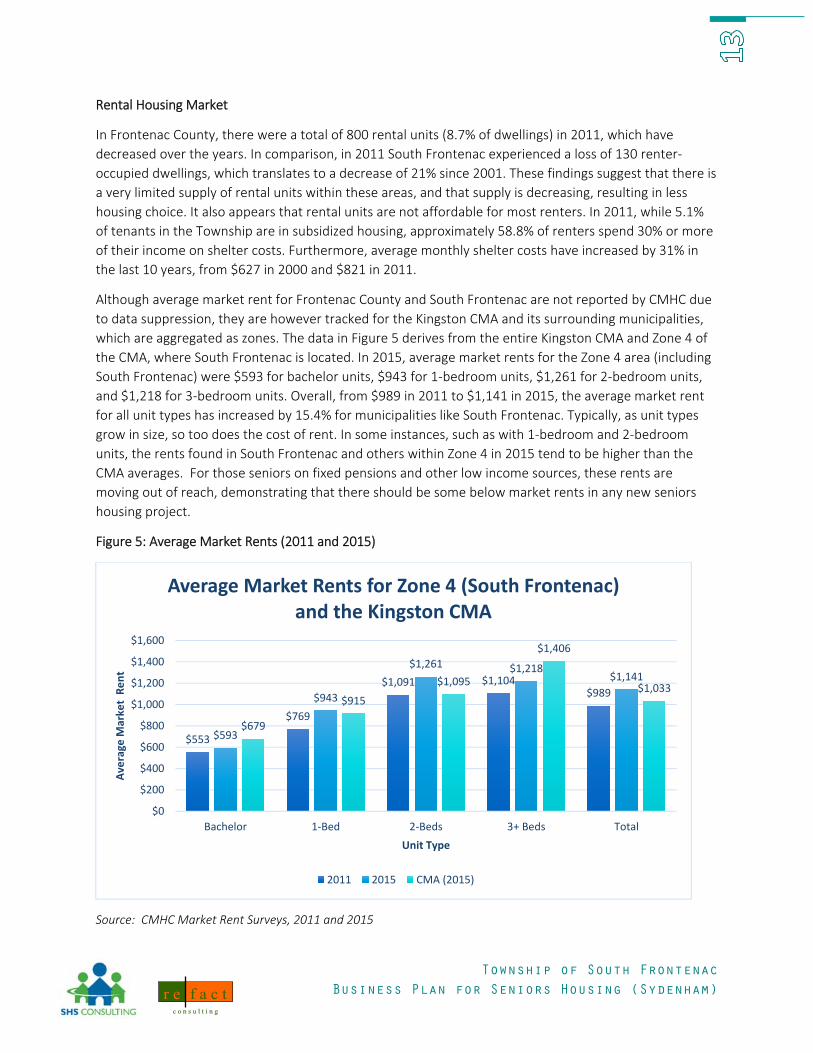
Average market rents for the entire County of Frontenac are not reported by CMHC but rents are monitored
for the Kingston CMA which includes South Frontenac, Frontenac Islands and Loyalist Township (Zone 4
within the CMA). In the last 9 years, overall average market rents in the CMA have increased by some
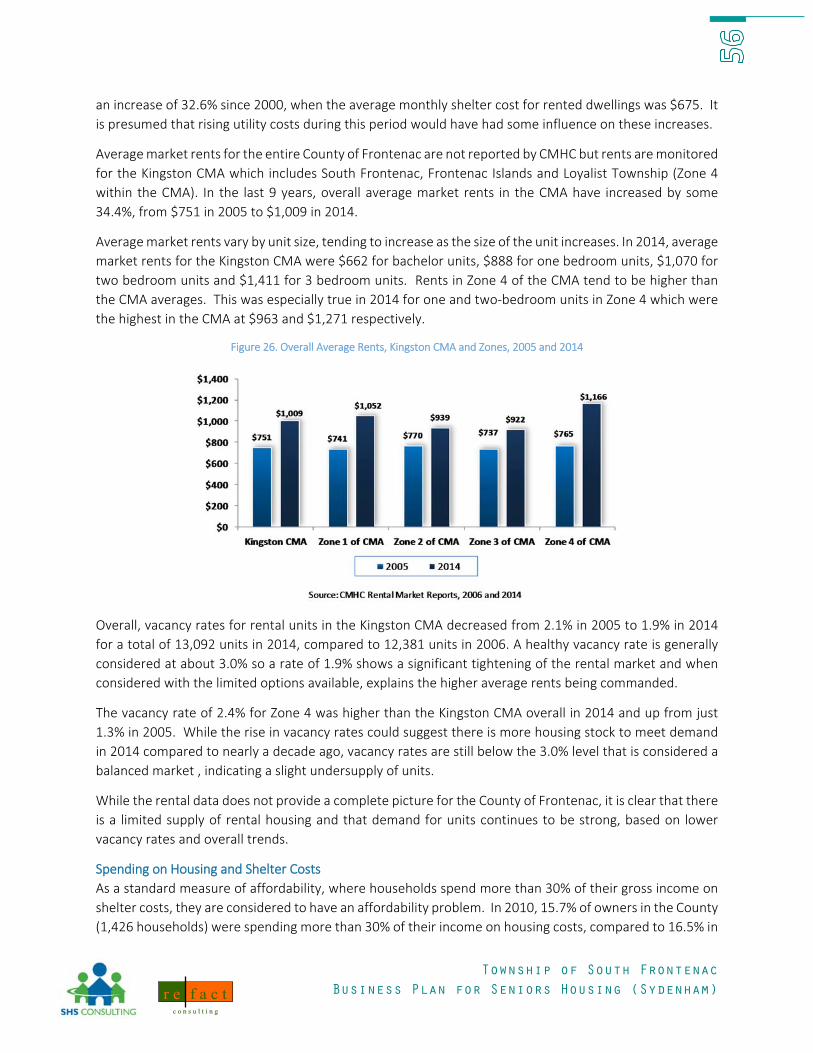
34.4%, from $751 in 2005 to $1,009 in 2014.
Average market rents vary by unit size, tending to increase as the size of the unit increases. In 2014, average
market rents for the Kingston CMA were $662 for bachelor units, $888 for one bedroom units, $1,070 for
two bedroom units and $1,411 for 3 bedroom units. Rents in Zone 4 of the CMA tend to be higher than
the CMA averages. This was especially true in 2014 for one and two‐bedroom units in Zone 4 which were
the highest in the CMA at $963 and $1,271 respectively.
Figure 26. Overall Average Rents, Kingston CMA and Zones, 2005 and 2014
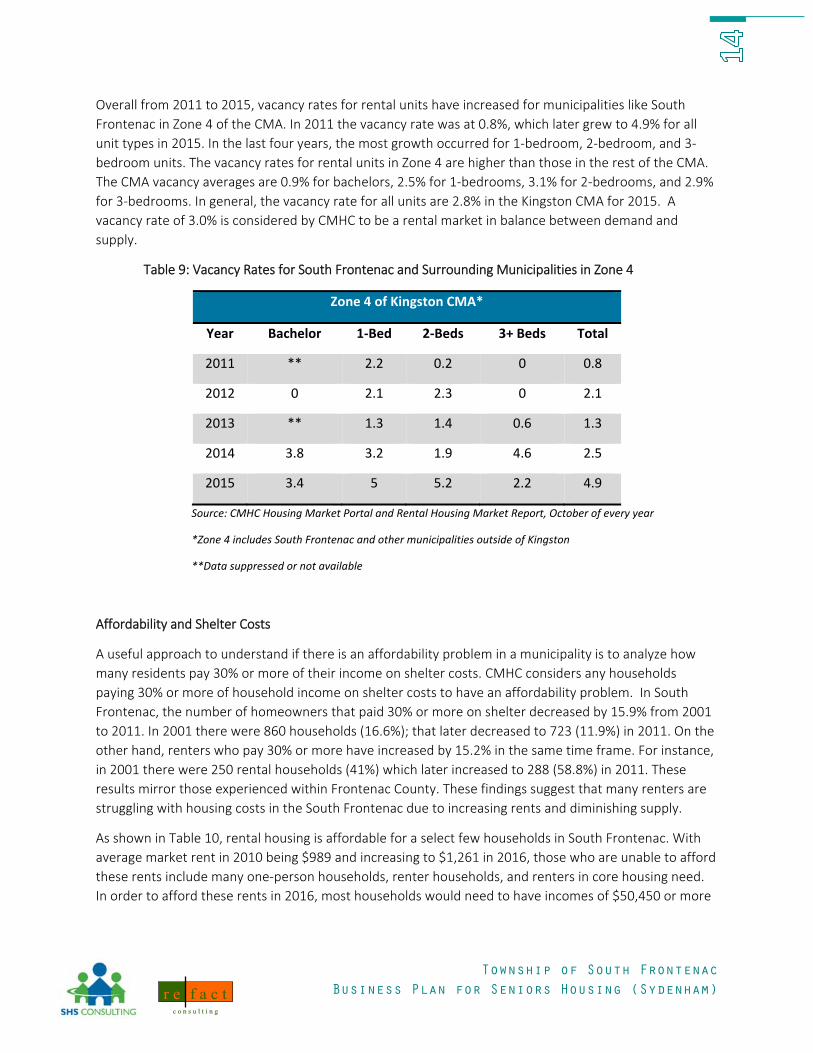
Overall, vacancy rates for rental units in the Kingston CMA decreased from 2.1% in 2005 to 1.9% in 2014
for a total of 13,092 units in 2014, compared to 12,381 units in 2006. A healthy vacancy rate is generally
considered at about 3.0% so a rate of 1.9% shows a significant tightening of the rental market and when
considered with the limited options available, explains the higher average rents being commanded.
The vacancy rate of 2.4% for Zone 4 was higher than the Kingston CMA overall in 2014 and up from just
1.3% in 2005. While the rise in vacancy rates could suggest there is more housing stock to meet demand
in 2014 compared to nearly a decade ago, vacancy rates are still below the 3.0% level that is considered a
balanced market , indicating a slight undersupply of units.
While the rental data does not provide a complete picture for the County of Frontenac, it is clear that there
is a limited supply of rental housing and that demand for units continues to be strong, based on lower
vacancy rates and overall trends.
Spending on Housing and Shelter Costs
As a standard measure of affordability, where households spend more than 30% of their gross income on
shelter costs, they are considered to have an affordability problem. In 2010, 15.7% of owners in the County
(1,426 households) were spending more than 30% of their income on housing costs, compared to 16.5% in
Township of South Frontenac
Business Plan for Seniors Housing (Sydenham)
f a c t r e
cc oo nn ss uu ll tt ii nn gg
2000 (1,305 households). While the real number of owners spending more than 30% has increased, their
proportion has actually decreased. This is in contrast to renters where both the number and proportion of
renters spending more than 30% of their income on housing costs increased from 2000 to 2010. In 2010,
47.9% of renter households (426) were spending more than 30% of their income on housing costs,
compared to 38.7% of renter households in (370). This data indicates that renters are increasingly struggling
with housing costs in the County due to limited supply and increasing rents.
Profile of Seniors Indicators
Population Trends
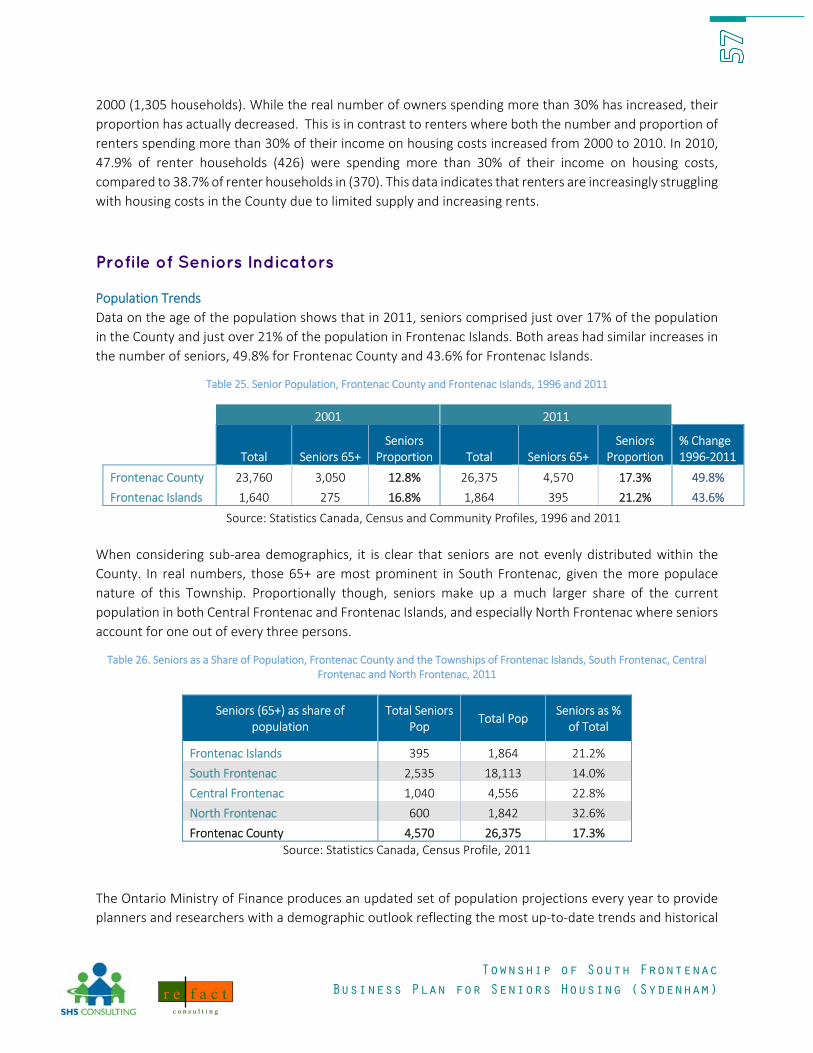
Data on the age of the population shows that in 2011, seniors comprised just over 17% of the population
in the County and just over 21% of the population in Frontenac Islands. Both areas had similar increases in
the number of seniors, 49.8% for Frontenac County and 43.6% for Frontenac Islands.
Table 25. Senior Population, Frontenac County and Frontenac Islands, 1996 and 2011
2001 2011
Total Seniors 65+ Seniors
Proportion Total Seniors 65+ Seniors
Proportion % Change 1996‐2011
Frontenac County 23,760 3,050 12.8% 26,375 4,570 17.3% 49.8%
Source: Statistics Canada, Census and Community Profiles, 1996 and 2011
When considering sub‐area demographics, it is clear that seniors are not evenly distributed within the
County. In real numbers, those 65+ are most prominent in South Frontenac, given the more populace
nature of this Township. Proportionally though, seniors make up a much larger share of the current
population in both Central Frontenac and Frontenac Islands, and especially North Frontenac where seniors
account for one out of every three persons.
Table 26. Seniors as a Share of Population, Frontenac County and the Townships of Frontenac Islands, South Frontenac, Central Frontenac and North Frontenac, 2011
Seniors (65+) as share of population
Total Seniors Pop
Total Pop Seniors as % of Total
Frontenac Islands 395 1,864 21.2%
South Frontenac 2,535 18,113 14.0%
Central Frontenac 1,040 4,556 22.8%
North Frontenac 600 1,842 32.6%
Frontenac County 4,570 26,375 17.3%
Source: Statistics Canada, Census Profile, 2011
The Ontario Ministry of Finance produces an updated set of population projections every year to provide
planners and researchers with a demographic outlook reflecting the most up‐to‐date trends and historical
Township of South Frontenac
Business Plan for Seniors Housing (Sydenham)
f a c t r e
cc oo nn ss uu ll tt ii nn gg
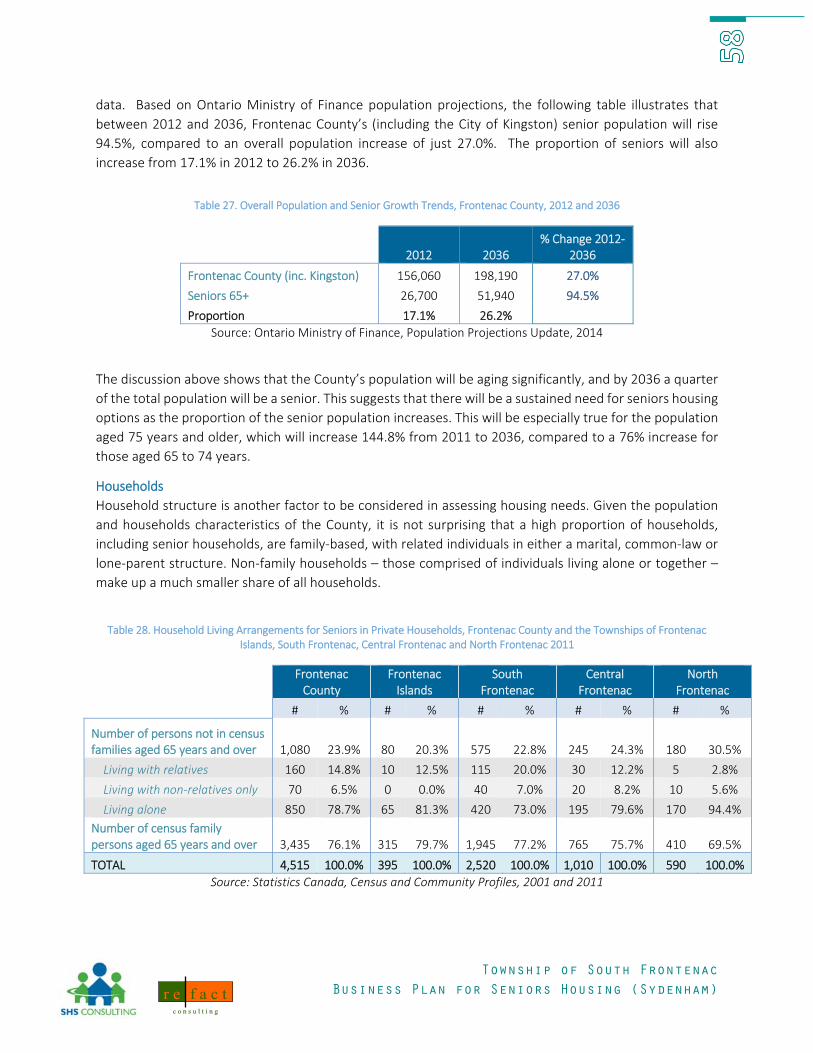
data. Based on Ontario Ministry of Finance population projections, the following table illustrates that
between 2012 and 2036, Frontenac County’s (including the City of Kingston) senior population will rise
94.5%, compared to an overall population increase of just 27.0%. The proportion of seniors will also
increase from 17.1% in 2012 to 26.2% in 2036.
Table 27. Overall Population and Senior Growth Trends, Frontenac County, 2012 and 2036
2012 2036 % Change 2012‐
2036
Frontenac County (inc. Kingston) 156,060 198,190 27.0%
Seniors 65+ 26,700 51,940 94.5%
Proportion 17.1% 26.2%
Source: Ontario Ministry of Finance, Population Projections Update, 2014
The discussion above shows that the County’s population will be aging significantly, and by 2036 a quarter
of the total population will be a senior. This suggests that there will be a sustained need for seniors housing
options as the proportion of the senior population increases. This will be especially true for the population
aged 75 years and older, which will increase 144.8% from 2011 to 2036, compared to a 76% increase for
those aged 65 to 74 years.
Households
Household structure is another factor to be considered in assessing housing needs. Given the population
and households characteristics of the County, it is not surprising that a high proportion of households,
including senior households, are family‐based, with related individuals in either a marital, common‐law or
lone‐parent structure. Non‐family households – those comprised of individuals living alone or together –
make up a much smaller share of all households.
Table 28. Household Living Arrangements for Seniors in Private Households, Frontenac County and the Townships of Frontenac
Islands, South Frontenac, Central Frontenac and North Frontenac 2011
Frontenac County
Frontenac Islands
South Frontenac
Central Frontenac
North Frontenac
# % # % # % # % # %
Number of persons not in census families aged 65 years and over 1,080 23.9% 80 20.3% 575 22.8% 245 24.3% 180 30.5%
Living with relatives 160 14.8% 10 12.5% 115 20.0% 30 12.2% 5 2.8%
Living with non‐relatives only 70 6.5% 0 0.0% 40 7.0% 20 8.2% 10 5.6%
Source: Statistics Canada, Census and Community Profiles, 2001 and 2011
Township of South Frontenac
Business Plan for Seniors Housing (Sydenham)
f a c t r e
cc oo nn ss uu ll tt ii nn gg
The majority of seniors in the County reside in a family structure (76.1%). The majority of the County
seniors’ not in a census family (78.7% of seniors not in a census family) were living alone. Proportions are
similar across the Townships, and especially for Frontenac Islands. These proportions have not changed
notably since 2001 although the proportion of seniors in census family structures has risen slightly for all
areas. For the County as a whole, the actual number of seniors in census families has increased as
compared to seniors not in census families during this period (40.5% versus 20.0%).
Tenure
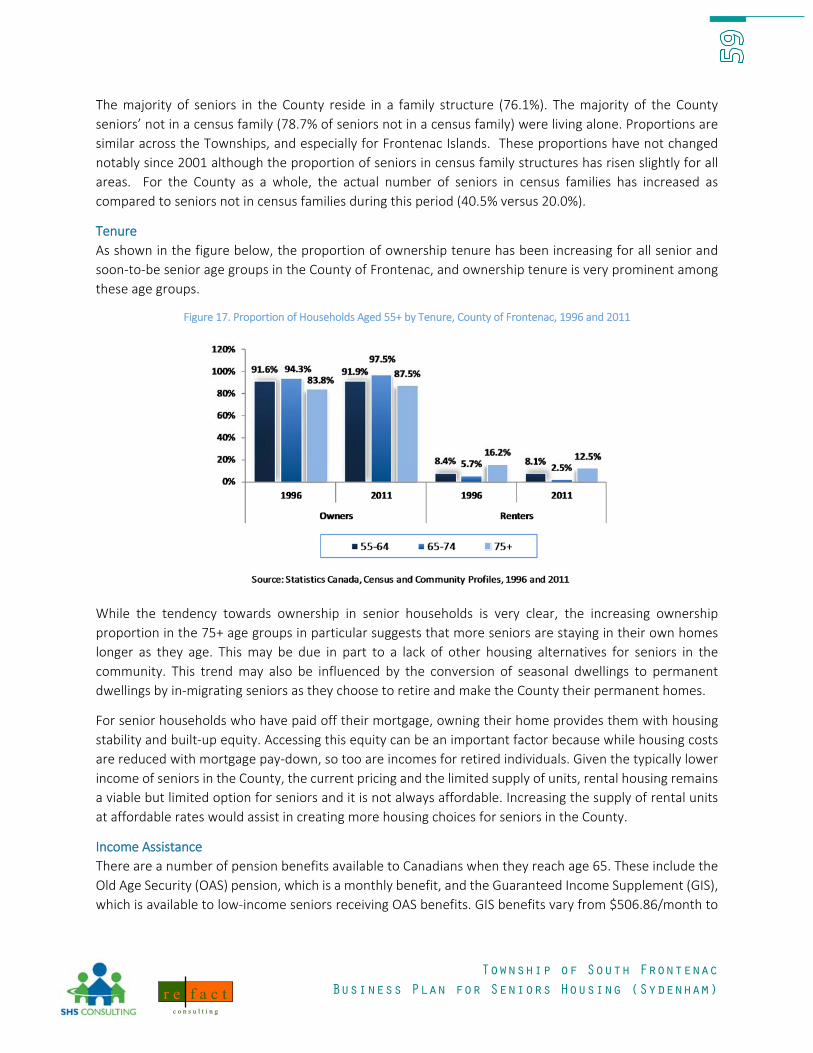
As shown in the figure below, the proportion of ownership tenure has been increasing for all senior and
soon‐to‐be senior age groups in the County of Frontenac, and ownership tenure is very prominent among
these age groups.
Figure 17. Proportion of Households Aged 55+ by Tenure, County of Frontenac, 1996 and 2011
While the tendency towards ownership in senior households is very clear, the increasing ownership
proportion in the 75+ age groups in particular suggests that more seniors are staying in their own homes
longer as they age. This may be due in part to a lack of other housing alternatives for seniors in the
community. This trend may also be influenced by the conversion of seasonal dwellings to permanent
dwellings by in‐migrating seniors as they choose to retire and make the County their permanent homes.
For senior households who have paid off their mortgage, owning their home provides them with housing
stability and built‐up equity. Accessing this equity can be an important factor because while housing costs
are reduced with mortgage pay‐down, so too are incomes for retired individuals. Given the typically lower
income of seniors in the County, the current pricing and the limited supply of units, rental housing remains
a viable but limited option for seniors and it is not always affordable. Increasing the supply of rental units
at affordable rates would assist in creating more housing choices for seniors in the County.
Income Assistance
There are a number of pension benefits available to Canadians when they reach age 65. These include the
Old Age Security (OAS) pension, which is a monthly benefit, and the Guaranteed Income Supplement (GIS),
which is available to low‐income seniors receiving OAS benefits. GIS benefits vary from $506.86/month to
Township of South Frontenac
Business Plan for Seniors Housing (Sydenham)
f a c t r e
cc oo nn ss uu ll tt ii nn gg
$764/month depending on if the recipient is single or has a spouse/partner that receives or does not
receive OAS pension.
In addition, the Guaranteed Annual Income System (GAINS) provides monthly payments to eligible Ontario
seniors on top of the OAS and GIS payments. The amount of GAINS benefit is directly linked to the GIS
monthly payments and ranges from $2.50 to $83 per month. The following table shows the maximum
monthly benefit that a senior living in Ontario can receive. This shows that if a single senior did not have a
private pension, they would receive a maximum of $16,934 a year or $1,411 a month.
Table 29. Maximum Monthly Benefits for Benefit Period October 1, 2014 to December 31, 2014
Benefit Program Single Qualified Couple
Per Month Per Year Per Month Per Year
OAS $563.74 $6,764.88 $1,127.48 $13,529.76
GIS $764.40 $9,172.80 $1,013.72 $12,164.64
GAINS $83.00 $996.00 $166.00 $1,992.00
Total $1,411.14 $16,933.68 $2,307.20 $27,686.40
Source: Ontario Ministry of Finance (2014). GAINS Benefit Rates
The maximum annual income for a person to receive OAS is $114,815, and for GIS it is $17,088. For a couple
where one person receives OAS it is $22,650 and for a couple that does not receive OAS it is $40,944.
Another benefit for seniors is the Canada Pension Plan (CPP) which provides a monthly taxable benefit to
retired seniors who worked and contributed to the plan. Beneficiaries have to be at least 65 years old or
between age 60 and 65 and meet the requirements of the work cessation test. The CPP pension is designed
to replace about 25% of a senior’s average pre‐retirement employment income. The following table
provides a summary of the CPP payment rates and shows that a senior would receive an average of $7,284
a year and a maximum of $12,456 a year when they retire.
Table 30. 2014 Canada Pension Plan Rates
Type of Benefit Average Benefit (June 2011)
Maximum Amount
Retirement (at age 65) $607.33 $1,038.33
Post Retirement Benefit (at age 65) $9.55 $25.96
Disability $901.40 $1,236.35
Survivor ‐ younger than 65 $409.26 $567.91
Survivor ‐ 65 and older $311.19 $623.00
Children of disabled contributors $230.72 $230.72
Children of deceased contributors $230.72 $230.72
Death (maximum one‐time payment) $2,294.07 $2,500.00
Combined benefits
Survivor / retirement (at age 65) $798.82 $1,038.33
Survivor / disability $1,009.71 $1,236.35
Source: Service Canada, Canada Pension Plan Payment Rates, January‐December 2014
Township of South Frontenac
Business Plan for Seniors Housing (Sydenham)
f a c t r e
cc oo nn ss uu ll tt ii nn gg
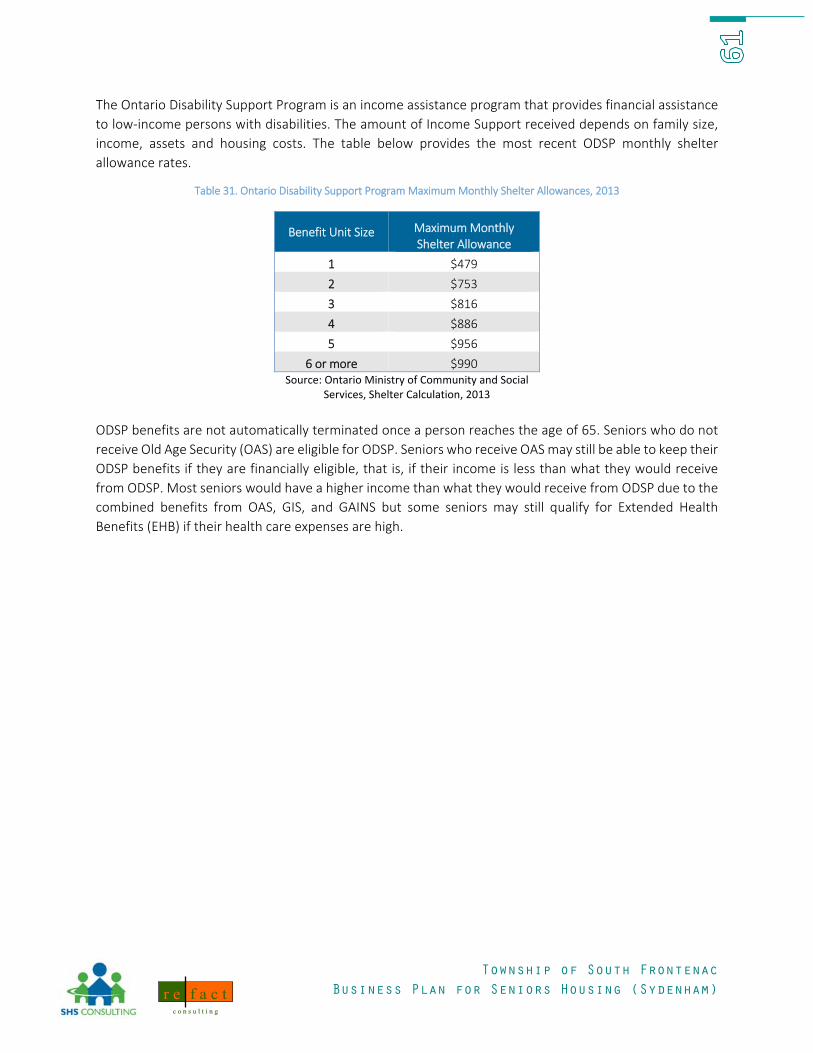
The Ontario Disability Support Program is an income assistance program that provides financial assistance
to low‐income persons with disabilities. The amount of Income Support received depends on family size,
income, assets and housing costs. The table below provides the most recent ODSP monthly shelter
allowance rates.
Table 31. Ontario Disability Support Program Maximum Monthly Shelter Allowances, 2013
Benefit Unit Size Maximum Monthly Shelter Allowance
1 $479
2 $753
3 $816
4 $886
5 $956
6 or more $990 Source: Ontario Ministry of Community and Social
Services, Shelter Calculation, 2013
ODSP benefits are not automatically terminated once a person reaches the age of 65. Seniors who do not
receive Old Age Security (OAS) are eligible for ODSP. Seniors who receive OAS may still be able to keep their
ODSP benefits if they are financially eligible, that is, if their income is less than what they would receive
from ODSP. Most seniors would have a higher income than what they would receive from ODSP due to the
combined benefits from OAS, GIS, and GAINS but some seniors may still qualify for Extended Health
Benefits (EHB) if their health care expenses are high.
Township of South Frontenac
Business Plan for Seniors Housing (Sydenham)
f a c t r e
cc oo nn ss uu ll tt ii nn gg
APPENDIX B – PRO FORMA DETAILS Option 1 – Assisted Model
Option 2 – Market Model
17-‐03-‐16 Prepared by SHS Consulting 1 of 3
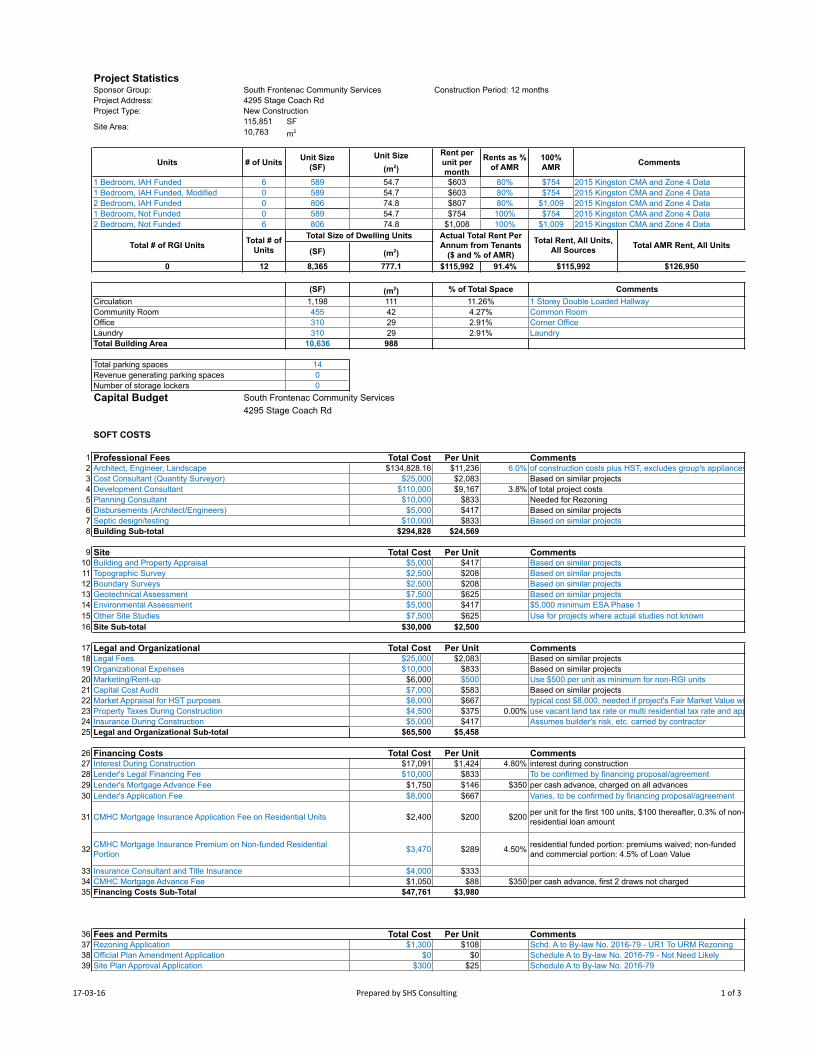
Project StatisticsSponsor Group: South Frontenac Community Services Construction Period: 12 monthsProject Address: 4295 Stage Coach RdProject Type: New Construction
of construction costs plus HST, excludes group's appliances and furniture and fixtures, includes municipal fees, excludes development chargesBased on similar projects
SOFT COSTS
Professional Fees
Total Rent, All Units, All Sources
$115,992
Total AMR Rent, All Units
$126,950
Based on similar projects
% of Total Space11.26%4.27%
Marketing/Rent-upCapital Cost AuditMarket Appraisal for HST purposes
Other Site StudiesSite Sub-total
Legal and Organizational Legal FeesOrganizational Expenses
Topographic Survey
Geotechnical AssessmentEnvironmental Assessment
Official Plan Amendment ApplicationSite Plan Approval Application
Property Taxes During ConstructionInsurance During Construction
Fees and Permits
Legal and Organizational Sub-total
Financing CostsInterest During ConstructionLender's Legal Financing Fee
Rezoning Application
CMHC Mortgage Insurance Premium on Non-funded Residential Portion
Insurance Consultant and Title InsuranceCMHC Mortgage Advance Fee
Schd. A to By-law No. 2016-79 - UR1 To URM RezoningSchedule A to By-law No. 2016-79 - Not Need Likely
Use for projects where actual studies not known
Comments
Comments
Comments
Comments
Comments
2015 Kingston CMA and Zone 4 Data2015 Kingston CMA and Zone 4 Data2015 Kingston CMA and Zone 4 Data
Based on similar projects
Assumes builder's risk, etc. carried by contractor
2015 Kingston CMA and Zone 4 Data
typical cost $8,000, needed if project's Fair Market Value will be higher than input tax creditsuse vacant land tax rate or multi residential tax rate and apply to land/property cost, remember to pro-rated based on ConstructionPeriod
2015 Kingston CMA and Zone 4 Data
Ken
Text Box
Option 1 - Assisted Model
17-‐03-‐16 Prepared by SHS Consulting 2 of 3
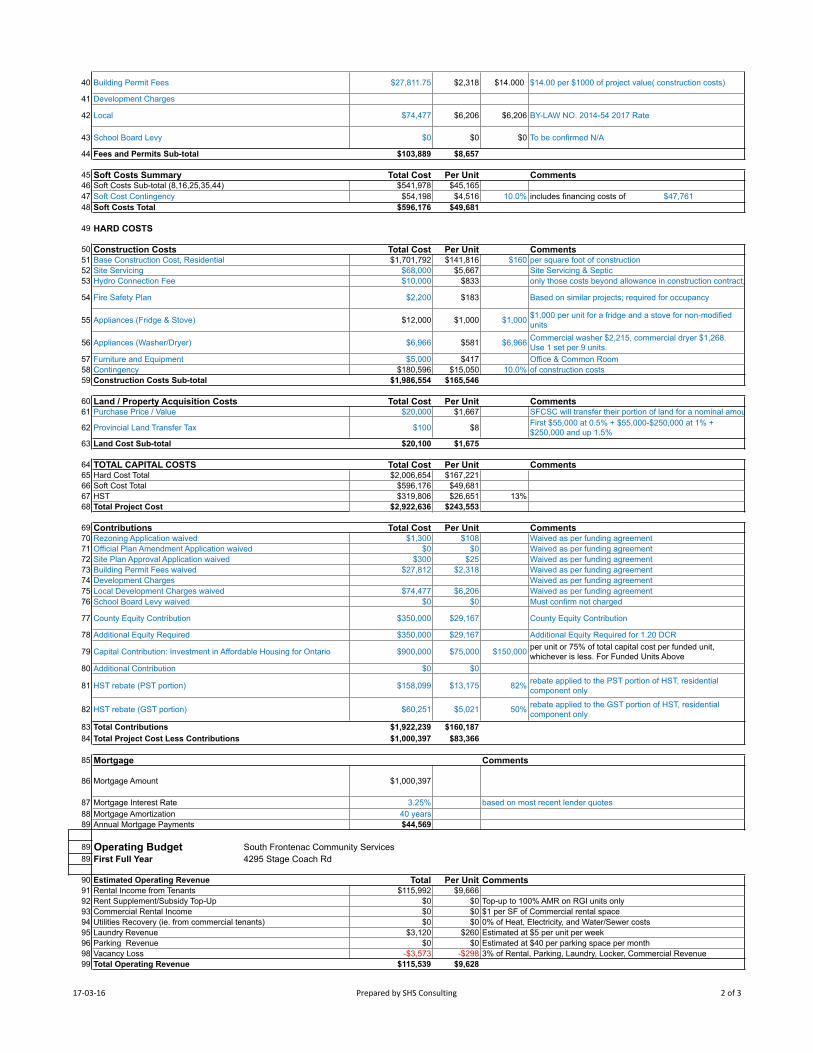
40 $27,811.75 $2,318 $14.000
41
42 $74,477 $6,206 $6,206
43 $0 $0 $0
44 $103,889 $8,657
45 Total Cost Per Unit46 $541,978 $45,16547 $54,198 $4,516 10.0% $47,76148 $596,176 $49,681
49
50 Total Cost Per Unit51 $1,701,792 $141,816 $16052 $68,000 $5,66753 $10,000 $833
64 Total Cost Per Unit65 $2,006,654 $167,22166 $596,176 $49,68167 $319,806 $26,651 13%68 $2,922,636 $243,553
69 Total Cost Per Unit70 $1,300 $10871 $0 $072 $300 $2573 $27,812 $2,3187475 $74,477 $6,20676 $0 $0
77 $350,000 $29,167
78 $350,000 $29,167
79 $900,000 $75,000 $150,000
80 $0 $0
81 $158,099 $13,175 82%
82 $60,251 $5,021 50%
83 $1,922,239 $160,18784 $1,000,397 $83,366
85
86 $1,000,397
87 3.25%88 40 years89 $44,569
89 Operating Budget South Frontenac Community Services89 First Full Year 4295 Stage Coach Rd
90 Total Per Unit91 $115,992 $9,66692 $0 $093 $0 $094 $0 $095 $3,120 $26096 $0 $098 -$3,573 -$29899 $115,539 $9,628
$1 per SF of Commercial rental space 0% of Heat, Electricity, and Water/Sewer costsEstimated at $5 per unit per weekEstimated at $40 per parking space per month
Comments
Top-up to 100% AMR on RGI units only
Utilities Recovery (ie. from commercial tenants)Laundry Revenue
Total Operating RevenueVacancy Loss
rebate applied to the GST portion of HST, residential component only
Waived as per funding agreementMust confirm not charged
Waived as per funding agreementWaived as per funding agreement
rebate applied to the PST portion of HST, residential component only
Waived as per funding agreementWaived as per funding agreement
Hydro Connection Fee
TOTAL CAPITAL COSTSHard Cost TotalSoft Cost Total
only those costs beyond allowance in construction contract, estimated based on similar projects
HSTTotal Project Cost
Land Cost Sub-total
HARD COSTS
per square foot of construction
$1,000 per unit for a fridge and a stove for non-modified units
Project StatisticsSponsor Group: South Frontenac Community Services Construction Period: 12 monthsProject Address: 4295 Stage Coach RdProject Type: New Construction
of construction costs plus HST, excludes group's appliances and furniture and fixtures, includes municipal fees, excludes development chargesBased on similar projects
SOFT COSTS
Professional Fees
Total Rent, All Units, All Sources
$126,864
Total AMR Rent, All Units
$126,950
Based on similar projects
% of Total Space11.26%4.27%
Marketing/Rent-upCapital Cost AuditMarket Appraisal for HST purposes
Other Site StudiesSite Sub-total
Legal and Organizational Legal FeesOrganizational Expenses
Topographic Survey
Geotechnical AssessmentEnvironmental Assessment
Official Plan Amendment ApplicationSite Plan Approval Application
Property Taxes During ConstructionInsurance During Construction
Fees and Permits
Legal and Organizational Sub-total
Financing CostsInterest During ConstructionLender's Legal Financing Fee
Rezoning Application
CMHC Mortgage Insurance Premium on Non-funded Residential Portion
Insurance Consultant and Title InsuranceCMHC Mortgage Advance Fee
Schd. A to By-law No. 2016-79 - UR1 To URM RezoningSchedule A to By-law No. 2016-79 - Not Need Likely
Use for projects where actual studies not known
Comments
Comments
Comments
Comments
Comments
2015 Kingston CMA and Zone 4 Data2015 Kingston CMA and Zone 4 Data2015 Kingston CMA and Zone 4 Data
Based on similar projects
Assumes builder's risk, etc. carried by contractor
2015 Kingston CMA and Zone 4 Data
typical cost $8,000, needed if project's Fair Market Value will be higher than input tax creditsuse vacant land tax rate or multi residential tax rate and apply to land/property cost, remember to pro-rated based on ConstructionPeriod
2015 Kingston CMA and Zone 4 Data
Ken
Text Box
Option 2 - Market Model
17-‐03-‐16 Prepared by SHS Consulting 2 of 3
40 $27,811.75 $2,318 $14.000
41
42 $74,477 $6,206 $6,206
43 $103,889 $8,657
44 Total Cost Per Unit45 $552,829 $46,06946 $55,283 $4,607 10.0% $58,61247 $608,112 $50,676
48
49 Total Cost Per Unit50 $1,701,792 $141,816 $16051 $68,000 $5,66752 $10,000 $833
63 Total Cost Per Unit64 $2,006,654 $167,22165 $608,112 $50,67666 $321,135 $26,761 13%67 $2,935,900 $244,658
68 Total Cost Per Unit69 $1,300 $10870 $0 $071 $300 $2572 $27,812 $2,3187374 $74,477 $6,206
75 $350,000 $29,167
76 $1,095,000 $91,250
77 $0 $0 $150,000
78 $0 $0
79 $158,770 $13,231 82%
80 $60,507 $5,042 50%
81 $1,768,165 $147,34782 $1,167,735 $97,311
83
84 $1,167,735
85 3.25%86 40 years87 $52,024
87 Operating Budget South Frontenac Community Services87 First Full Year 4295 Stage Coach Rd
88 Total Per Unit89 $126,864 $10,57290 $0 $091 $0 $092 $0 $093 $3,120 $26094 $0 $096 -$3,900 -$32597 $126,084 $10,507
98 Total Per Unit99 $4,800 $400
100 $10,200 $850Maintenance - Materials & Services Based on $650 Per Unit
$1 per SF of Commercial rental space 0% of Heat, Electricity, and Water/Sewer costsEstimated at $5 per unit per weekEstimated at $40 per parking space per month