34
Copyright©2009 OTSUKA CORPORATION All Rights Reserved. Business Results for the fiscal year ended December 31, 2008 Yuji Otsuka, President February 3, 2009 OTSUKA CORPORATION

Copyright©2009 OTSUKA CORPORATION All Rights Reserved.
Business Resultsfor the fiscal year ended December 31, 2008
Yuji Otsuka, President
February 3, 2009
OTSUKA CORPORATION

1Copyright©2009 OTSUKA CORPORATION All Rights Reserved.
Non-ConsolidatedConsolidated
13,900
25,974
25,215
437,103
Amount
92.1%
89.3%
88.2%
95.6%
Ratio to Plan
-24.2%
-8.3%
-9.2%
-0.1%
Change to Last Year
(Millions of yen)
89.7%
88.6%
87.7%
95.5%
Ratio to Plan
-0.5%467,154Net sales
-23.8%14,371Net income
-9.5%27,628Recurring profit
-9.9%27,089Operating income
Change toLast Year Amount
Summary of Business Results,January – December, 2008

2Copyright©2009 OTSUKA CORPORATION All Rights Reserved.
Others
799
663
4,294
6,019
37,313
1,729
8,453
4,324
FY 2008 Net sales(Millions of yen)
32
26
344
295
285
163
102
219
Number of employees
Sales and technology support for network-related equipmentNet World Corporation
Maintenance, body work and sale for automobiles, and commissioned sales of insuranceOtsuka Auto Service Co., Ltd
Creation and commissioned shipment of direct mail materials, data management and processing as well as commissioned creation of Websites
Otsuka Business Service Co., Ltd
Comprehensive service and support for network systemsAlpha Net Co., Ltd
Emergency repair of PC and peripheral equipment, disposal and data recovery serviceAlpha Techno Co., LtdS &
S
Consigned software development, packaged software development and ERP consulting businessAlpha System Co., LTD.
Electronic communications construction and interior constructionNet plan Co., LTD
Development and sale of packaged softwareOSK Co., LTD.
S I
Business domainCompany nameSegment
Consolidated subsidiaries

3Copyright©2009 OTSUKA CORPORATION All Rights Reserved.
467,154469,481433,617
27,08930,051
26,158
27,62830,520
26,494
15,62114,371
18,856
0
100,000
200,000
300,000
400,000
500,000
FY 2006 FY 2007 FY 20080
8,000
16,000
24,000
32,000
40,000
Net sales Operating incomeRecurring profit Net income
We recorded approximately¥4.3 billion as extraordinary gains
in FY 2007.
Net sales and ProfitsConsolidated
(Millions of yen)
Net salesOperating incomeRecurring profitNet income

4Copyright©2009 OTSUKA CORPORATION All Rights Reserved.
Entering a worldwide recession arising from financial crisis
Credit crunch and worsening of financing environment
Rapid decline of stock markets
Rapid appreciation of the yen
Greater sense of insecurity toward the future
There are needs of IT utilization, however, IT investments are being inhibited and postponed.
Market conditions are drastically changing since this autumn
External Environment

5Copyright©2009 OTSUKA CORPORATION All Rights Reserved.
• Enhancement of the “community-basedsales structure”
• Assessing the IT investment trend for each business enterprise size, promote the complex system proposals,total proposals
• Propose specific cost reductions
• Streamline the sales activities by enhancement of the“SPR” and the thorough use of the “Sales Support Center”
• Fortify promotion of the accumulated business
OTSUKA Group’s activities

6Copyright©2009 OTSUKA CORPORATION All Rights Reserved.
99.2 108.0109.4116.8 118.3
104.7122.6123.7
110.3
126.3 126.7
103.7
0
20
40
60
80
100
120
140
1Q 2Q 3Q 4Q
FY 2006 FY 2007 FY 2008
Consolidated Quarterly change of Net sales
(Billions of yen)
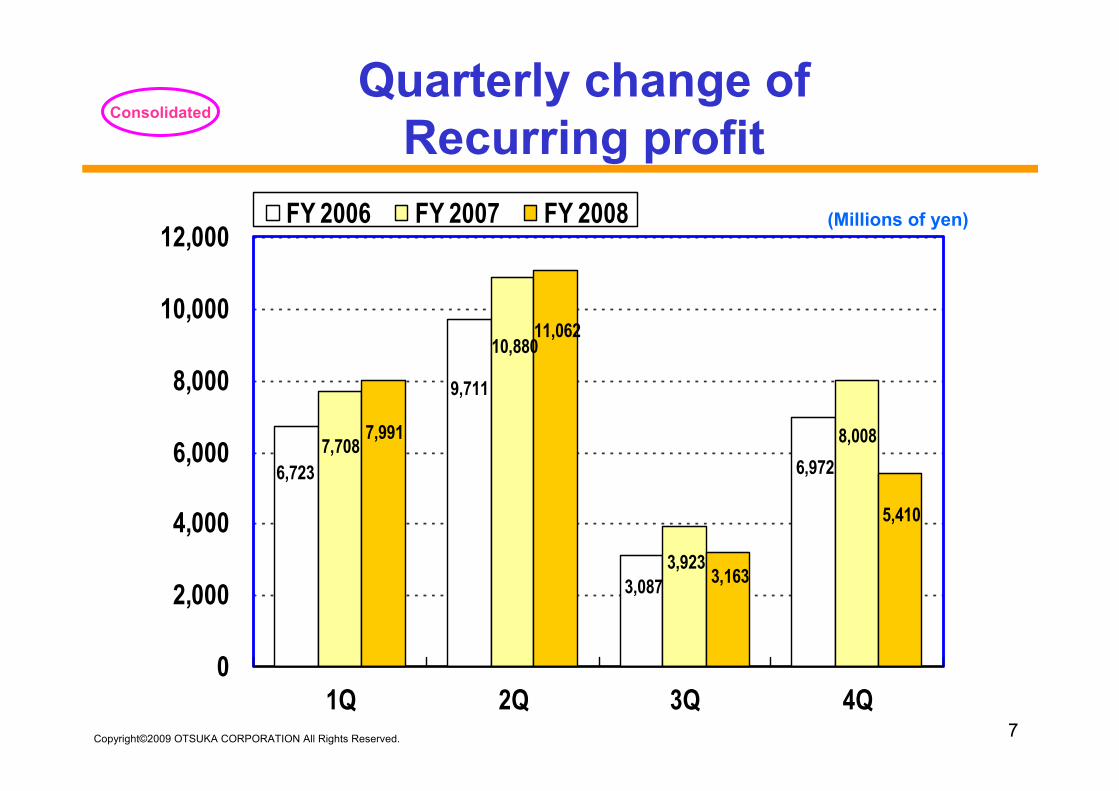
7Copyright©2009 OTSUKA CORPORATION All Rights Reserved.
6,723
9,711
3,087
6,972
10,880
7,708
3,923
8,008
5,410
3,163
11,062
7,991
0
2,000
4,000
6,000
8,000
10,000
12,000
1Q 2Q 3Q 4Q
FY 2006 FY 2007 FY 2008
Quarterly change of Recurring profit
Consolidated
(Millions of yen)
8Copyright©2009 OTSUKA CORPORATION All Rights Reserved.
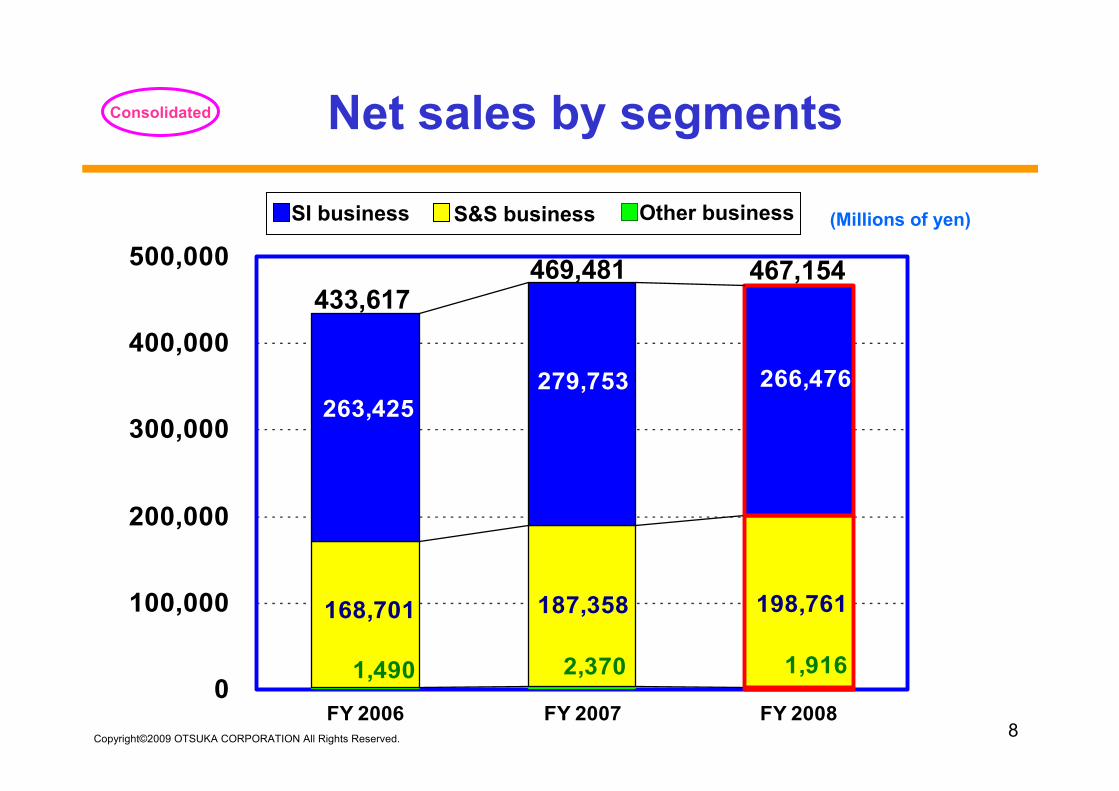
1,9162,3701,490
198,761187,358168,701
266,476279,753263,425
0
100,000
200,000
300,000
400,000
500,000
FY 2006 FY 2007 FY 2008
469,481433,617
467,154
Net sales by segmentsConsolidated
SI business S&S business Other business (Millions of yen)

9Copyright©2009 OTSUKA CORPORATION All Rights Reserved.
93,189 105,798100,679
88,35681,41970,899
33,89932,76727,447
211,348222,749 209,047
0
100,000
200,000
300,000
400,000
500,000
FY 2006 FY 2007 FY 2008
437,616402,886
437,103
Net sales by 4 segmentsNon-Consolidated
(Millions of yen)SI related products Custom-made software, etc.
Supplies
Maintenance, etc.
10Copyright©2009 OTSUKA CORPORATION All Rights Reserved.
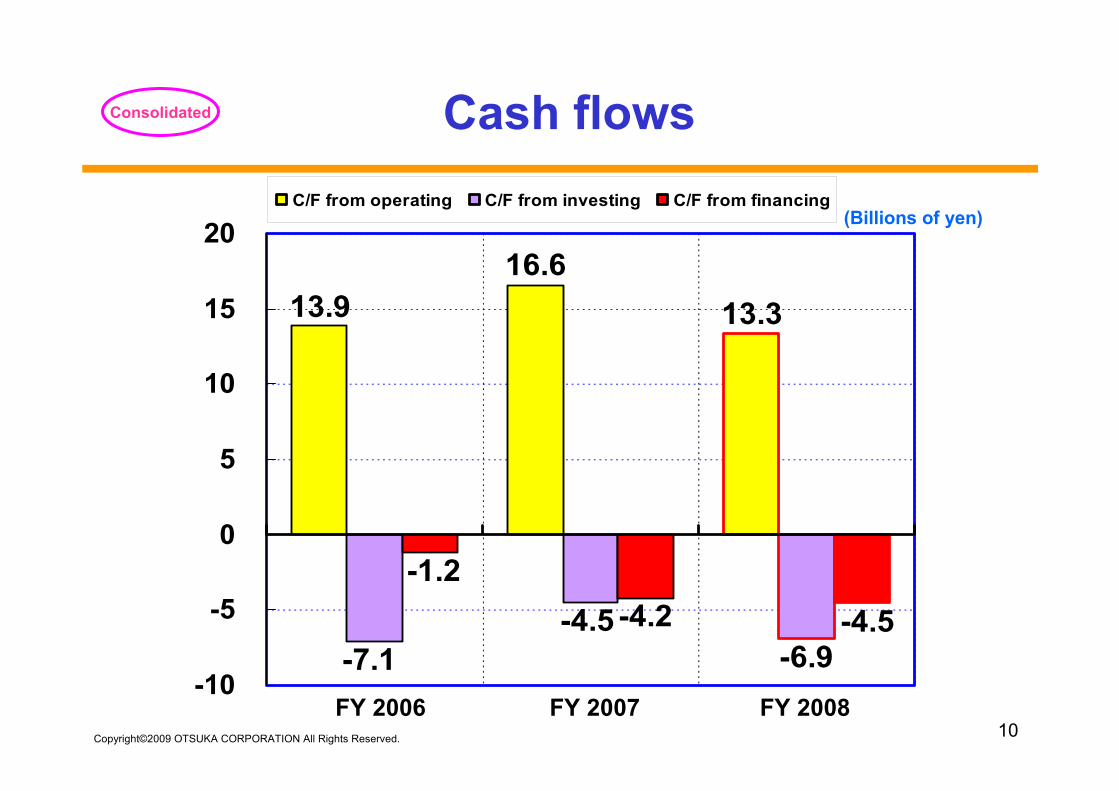
13.313.916.6
-6.9-7.1-4.5 -4.5
-1.2-4.2
-10
-5
0
5
10
15
20C/F from operating C/F from investing C/F from financing
FY 2006 FY 2007 FY 2008
Cash flowsConsolidated
(Billions of yen)
11Copyright©2009 OTSUKA CORPORATION All Rights Reserved.
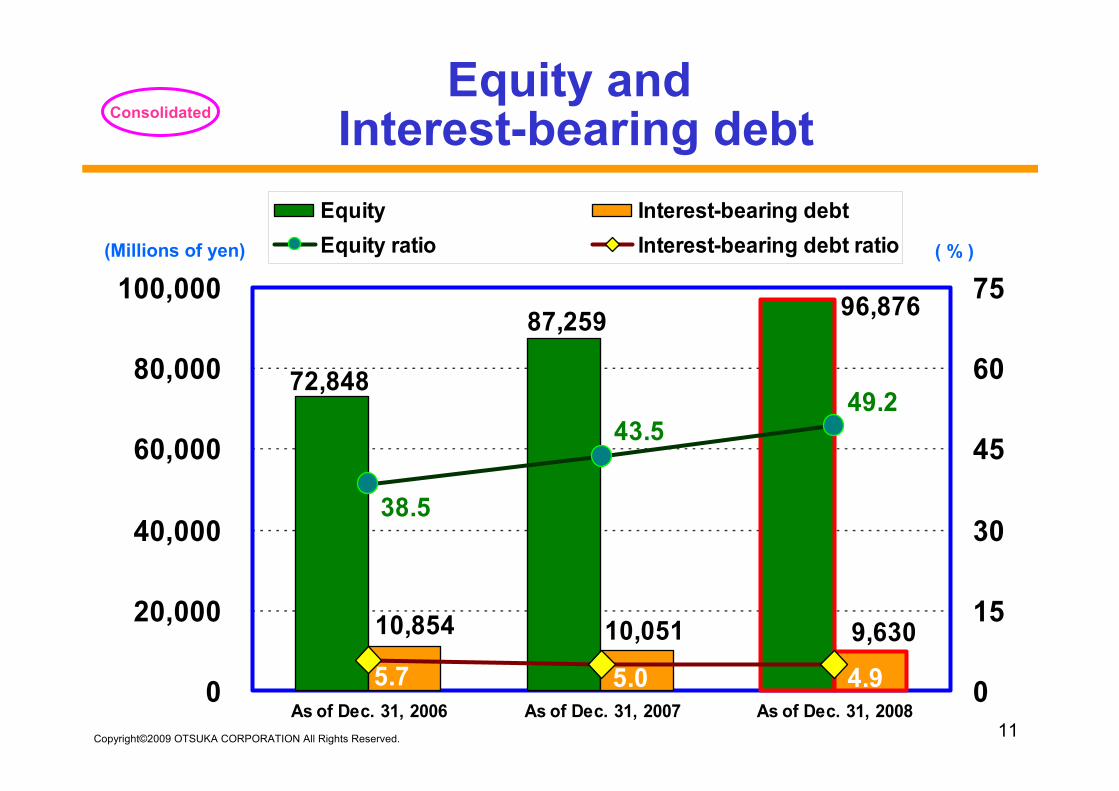
96,87687,259
72,848
10,854 10,051 9,630
49.243.5
38.5
4.95.05.70
20,000
40,000
60,000
80,000
100,000
As of Dec. 31, 2006 As of Dec. 31, 2007 As of Dec. 31, 20080
15
30
45
60
75
Equity Interest-bearing debtEquity ratio Interest-bearing debt ratio
Equity andInterest-bearing debtConsolidated
(Millions of yen) ( % )

12Copyright©2009 OTSUKA CORPORATION All Rights Reserved.
75.6 77.7
33.326.0
33.7
18.6
9.2 8.5 8.1 7.8
77.0
42.3
63.4
89.2
0.10.10.10.10.30.50.50.71.01.12.12.83.64.3 4.1%4.2%4.8%5.7%11.9%
21.9%
18.6%23.9%
26.6%
39.0%
45.3%46.0%45.4%
54.6%
0
20
40
60
80
100
1995 1996 1997 1998 1999 2000 2001 2002 2003 2004 2005 2006 2007 20080%
20%
40%
60%
80%Interest-bearing debt Non-operating expensesInterest-bearing debt ratio
Change of Interest-bearing debt and Non-operating expenses
Non-Consolidated
(Billions of yen)
Started NewAccounting
System
Full Operation“DAISENRYAKU”(Centralization)
IntroducedPC-LAN
Listed onTokyo Stock
Exchange
New HQBuilding
Operationof “SPR”
Full-fledgedoperation of
“SPR”

13Copyright©2009 OTSUKA CORPORATION All Rights Reserved.
28.87% 28.98% 42.15%
28.17% 28.23% 43.60%
26.87% 28.47% 44.66%
0% 20% 40% 60% 80% 100%
FY 2006
FY 2007
FY 2008
Less than 1 billion of yen 1 to less than 10 billions of yen 10 billions of yen and above
Net sales structure on customers’ total annual business scale
Non-Consolidated
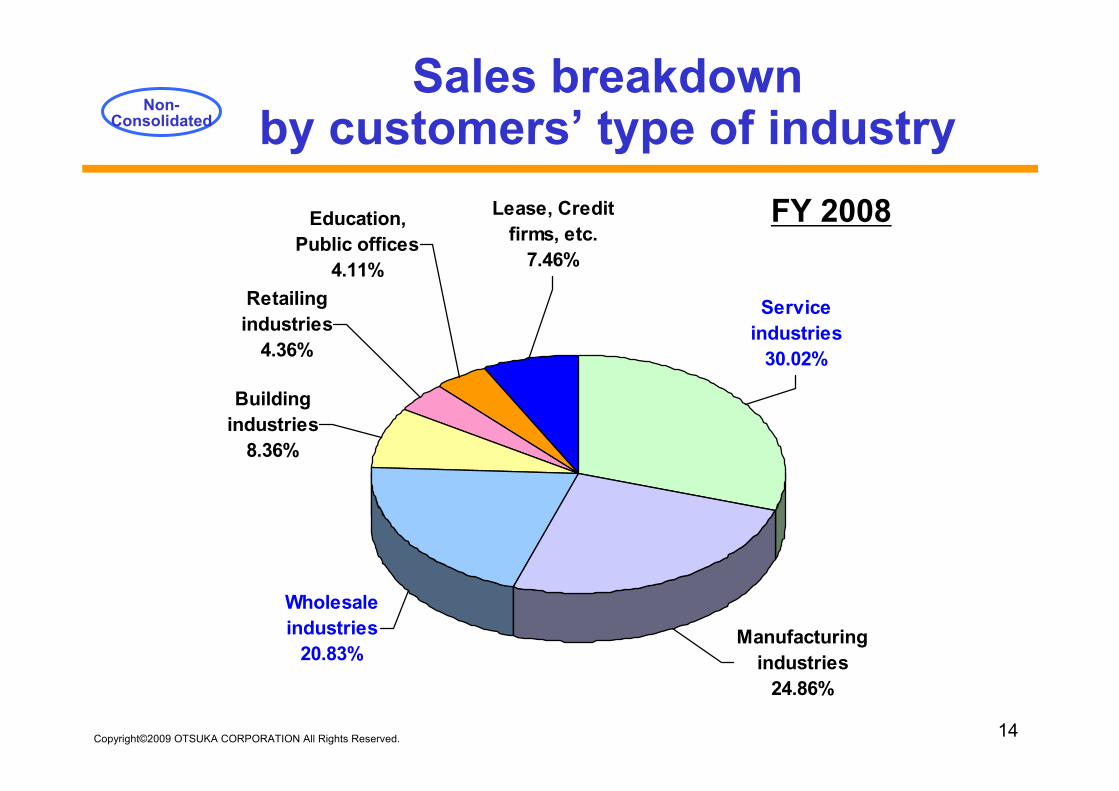
14Copyright©2009 OTSUKA CORPORATION All Rights Reserved.
Manufacturingindustries
24.86%
Wholesaleindustries
20.83%
Buildingindustries
8.36%
Retailingindustries
4.36%
Education,Public offices
4.11%
Serviceindustries
30.02%
Lease, Creditfirms, etc.
7.46%
FY 2008
Sales breakdown by customers’ type of industry
Non-Consolidated
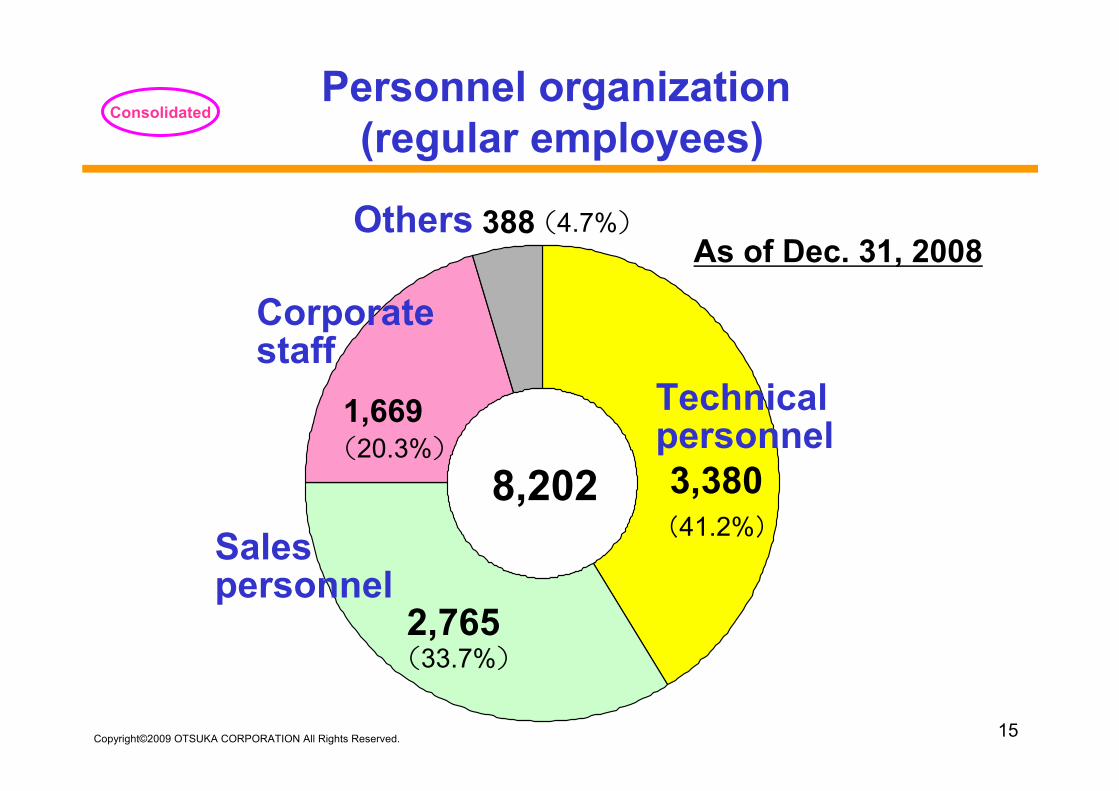
15Copyright©2009 OTSUKA CORPORATION All Rights Reserved.
2,765
3,380
1,669
388
8,202
(33.7%)
(41.2%)
(20.3%)
(4.7%)
Personnel organization(regular employees)
Consolidated
As of Dec. 31, 2008
Technical personnel
Sales personnel
Corporate staff
Others
16Copyright©2009 OTSUKA CORPORATION All Rights Reserved.
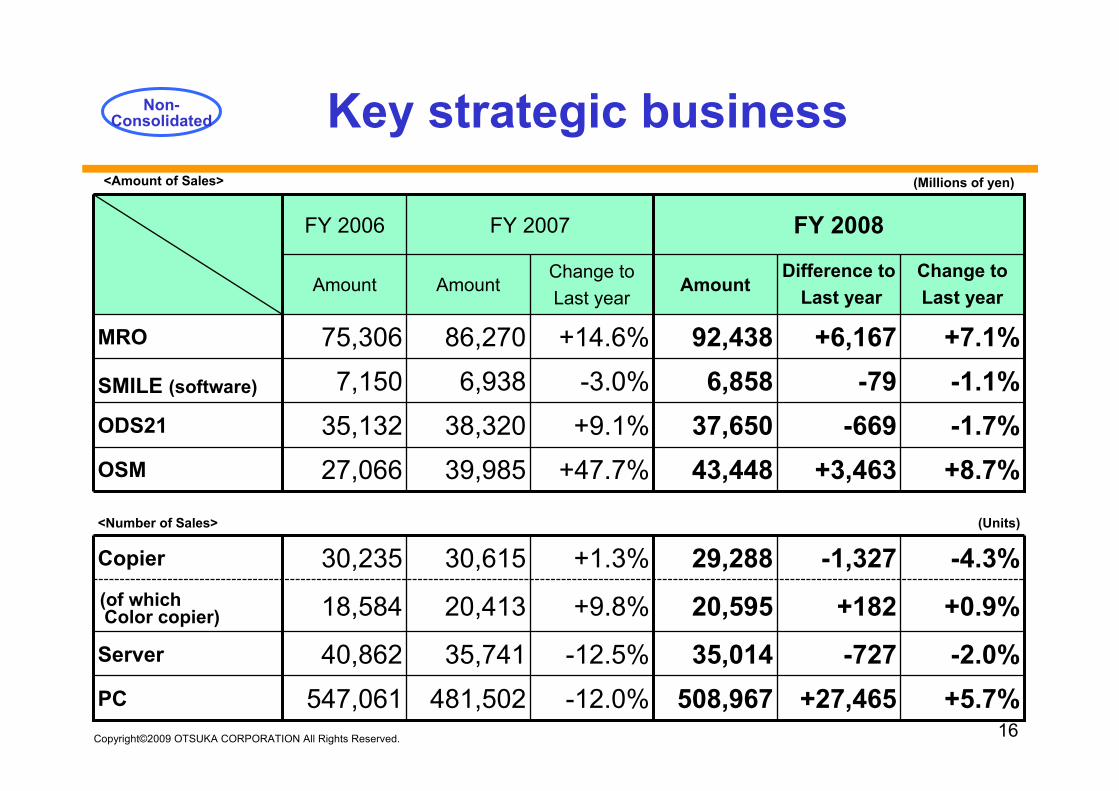
-12.0%
-12.5%
+9.8%
+1.3%
+47.7%+9.1%
-3.0%+14.6%
Change to Last year
481,502
35,741
20,413
30,615
39,98538,320
6,93886,270
Amount
FY 2007
547,061
40,862
18,584
30,235
27,06635,132
7,15075,306
Amount
FY 2006
+27,465-727
+182
-1,327
+3,463-669-79
+6,167
Difference toLast year
-1.1%6,858SMILE (software)
+5.7%508,967PC
-2.0%35,014Server
+0.9%20,595(of whichColor copier)
-4.3%29,288Copier
(Units)<Number of Sales>
-1.7%37,650ODS21
(Millions of yen)<Amount of Sales>
+8.7%
+7.1%
Change to Last year
43,448
92,438
Amount
FY 2008
OSM
MRO
Key strategic businessNon-Consolidated

17Copyright©2009 OTSUKA CORPORATION All Rights Reserved.
22,234
7,152
6,004
4,555
4,218
3,776
89,19282,493
71,088
59,062
46,369
33,036
19,885
9,6193,302545
3,245
11,335
16,76625,212
0
20,000
40,000
60,000
80,000
100,000
120,000
FY 1999 FY 2000 FY 2001 FY 2002 FY 2003 FY 2004 FY 2005 FY 2006 FY 2007 FY 2008
Accounts of “tanomail” 506 133,105 153,609 169,148 322,720 385,895 448,812 506,263 564,489 626,932
“MA tanomail”
“personal tanomail”
“tanomail plus”
TANOSEE
Procurement ASP service
Mail-order service for individual
Private brand
Started “tanomail”
Alliance withLION OFFICE PRODUCTS CORP.
Annual sales transition of MRO businessNon-Consolidated
(Millions of yen)
Non-“tanomail” MRO“tanomail”
Procurement service for large company
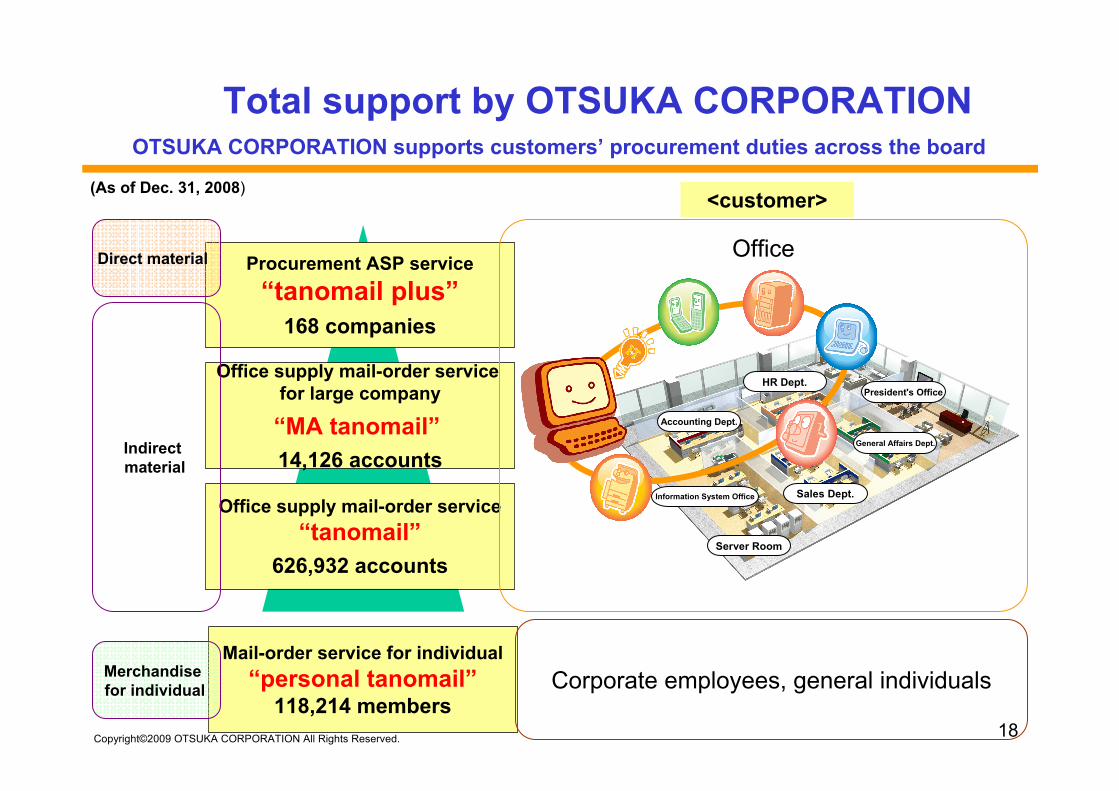
18Copyright©2009 OTSUKA CORPORATION All Rights Reserved.
<customer>
OTSUKA CORPORATION supports customers’ procurement duties across the board
Total support by OTSUKA CORPORATION
Information System Office
Server Room
Accounting Dept.
HR Dept.President's Office
General Affairs Dept.
Sales Dept.Office supply mail-order service
“tanomail”626,932 accounts
Procurement ASP service“tanomail plus”
168 companies
Office supply mail-order service for large company
“MA tanomail”14,126 accounts
Mail-order service for individual“personal tanomail”
118,214 membersMerchandisefor individual
Indirectmaterial
Corporate employees, general individuals
OfficeDirect material
(As of Dec. 31, 2008)
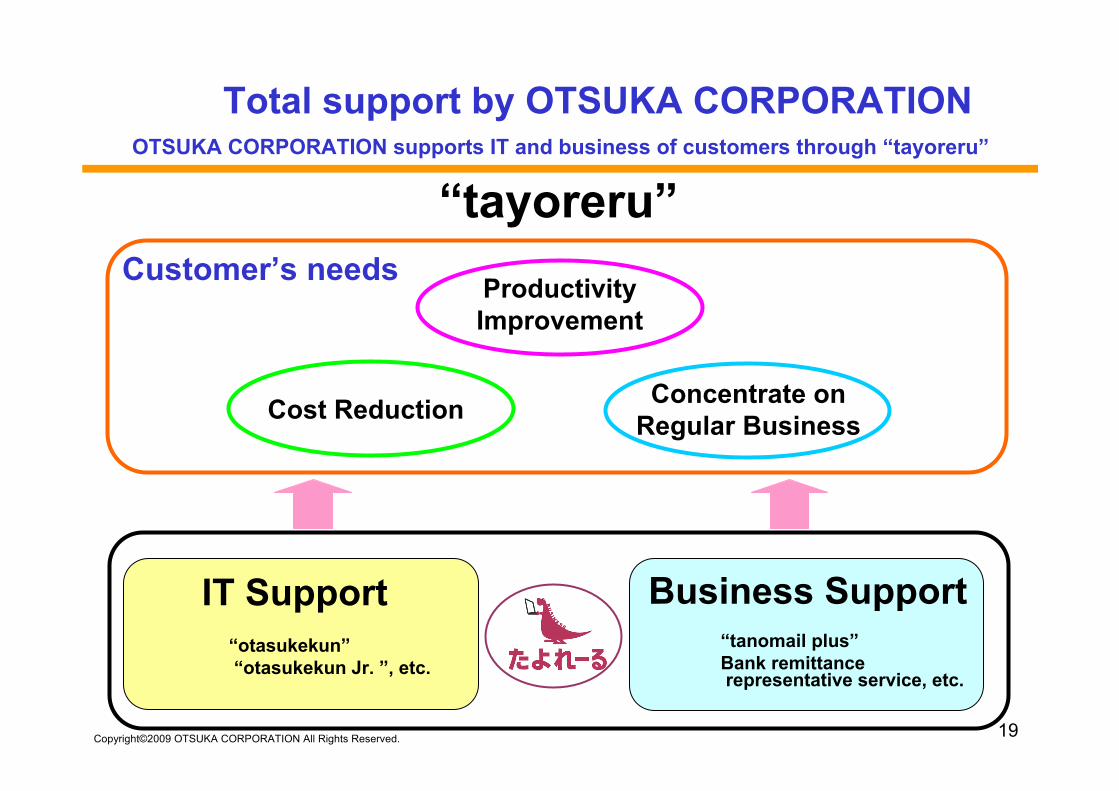
19Copyright©2009 OTSUKA CORPORATION All Rights Reserved.
IT Support Business Support
Cost Reduction
Productivity Improvement
Concentrate on Regular Business
Customer’s needs
“otasukekun”“otasukekun Jr. ”, etc.
“tanomail plus”Bank remittancerepresentative service, etc.
“tayoreru”
Total support by OTSUKA CORPORATIONOTSUKA CORPORATION supports IT and business of customers through “tayoreru”

20Copyright©2009 OTSUKA CORPORATION All Rights Reserved.
184.0170.8
151.7134.0
116.6102.0
89.783.681.585.280.088.8
70.463.557.852.950.0
42.139.0
37.735.2
34.032.230.1
27.525.928.927.4
24.222.124.125.126.125.0
0
50
100
150
200
250
1992 1993 1994 1995 1996 1997 1998 1999 2000 2001 2002 2003 2004 2005 2006 2007 20080
10
20
30
40
50Net sales of Supplies and Maintenance agreement
Accumulated business sales share
Accumulated business sales share (%)
Non-Consolidated Growth of accumulated business
Net sales of Supplies and Maintenance agreementAccumulated business sales share
As reference (1992-1999)
Net sales of Supplies and Maintenance agreement(Billions of yen)
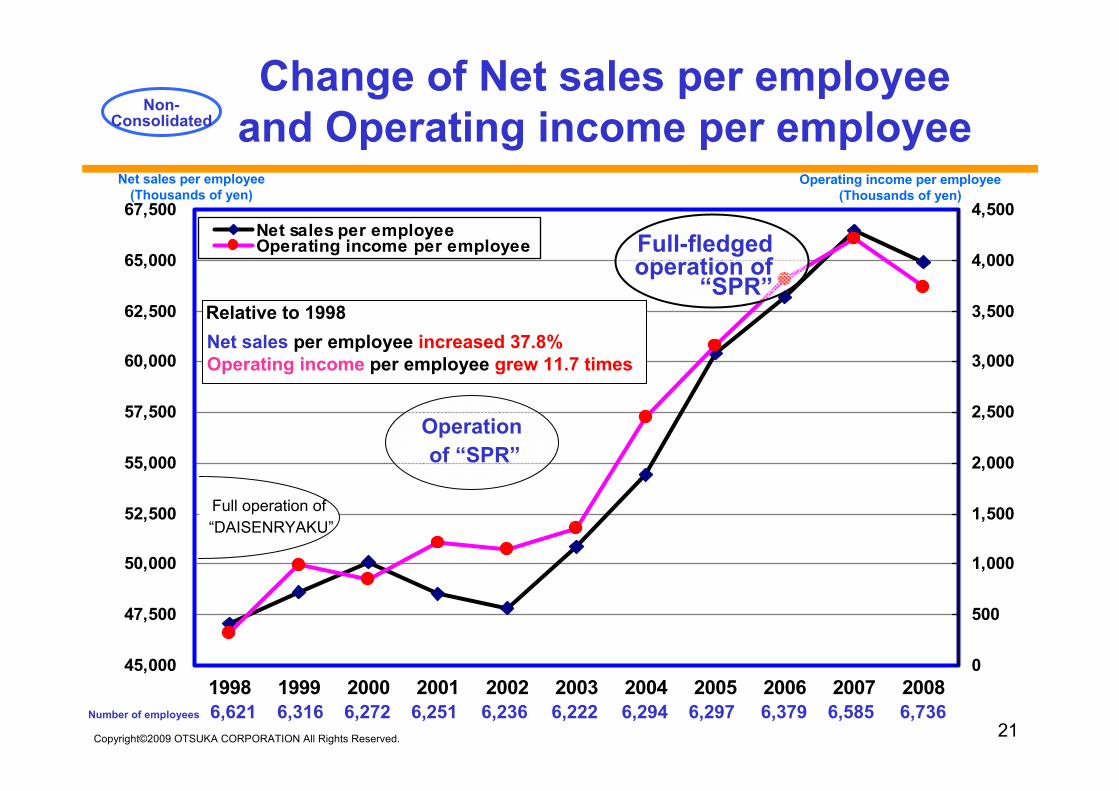
21Copyright©2009 OTSUKA CORPORATION All Rights Reserved.
45,000
47,500
50,000
52,500
55,000
57,500
60,000
62,500
65,000
67,500
1998 1999 2000 2001 2002 2003 2004 2005 2006 2007 20080
500
1,000
1,500
2,000
2,500
3,000
3,500
4,000
4,500Net sales per employeeOperating income per employee
Number of employees 6,621 6,316 6,272 6,251 6,236 6,222 6,294 6,297 6,379 6,585 6,736
Non-Consolidated
Change of Net sales per employee and Operating income per employee
Operating income per employee (Thousands of yen)
Net sales per employee (Thousands of yen)
Relative to 1998Net sales per employee increased 37.8%Operating income per employee grew 11.7 times
Operationof “SPR”
Full operation of“DAISENRYAKU”
Full-fledgedoperation of
“SPR”

Copyright©2009 OTSUKA CORPORATION All Rights Reserved.
Future Plans

23Copyright©2009 OTSUKA CORPORATION All Rights Reserved.
The Basic principle and Mid term plans
<Basic principle>・Grow with customers by realizing the Mission Statement
<Mid term plans>・Work-force basically remains flat・Strive for expanding business by revenue increase and
profit increaseChallenge 7% of the Operating income and Recurring profit rate
・Open up new demand with the help of the customerinformation
・Effective use of individuals/materials/money and per head productivity increase

24Copyright©2009 OTSUKA CORPORATION All Rights Reserved.
• Renew and expand business with theexisting 770,000 companies
• Ongoing conventional measuresEnhancement of “community-based sales structure”Fortify promotion of the accumulated business
• Enhancement of one-stop support structure
Future MeasuresFuture Measures
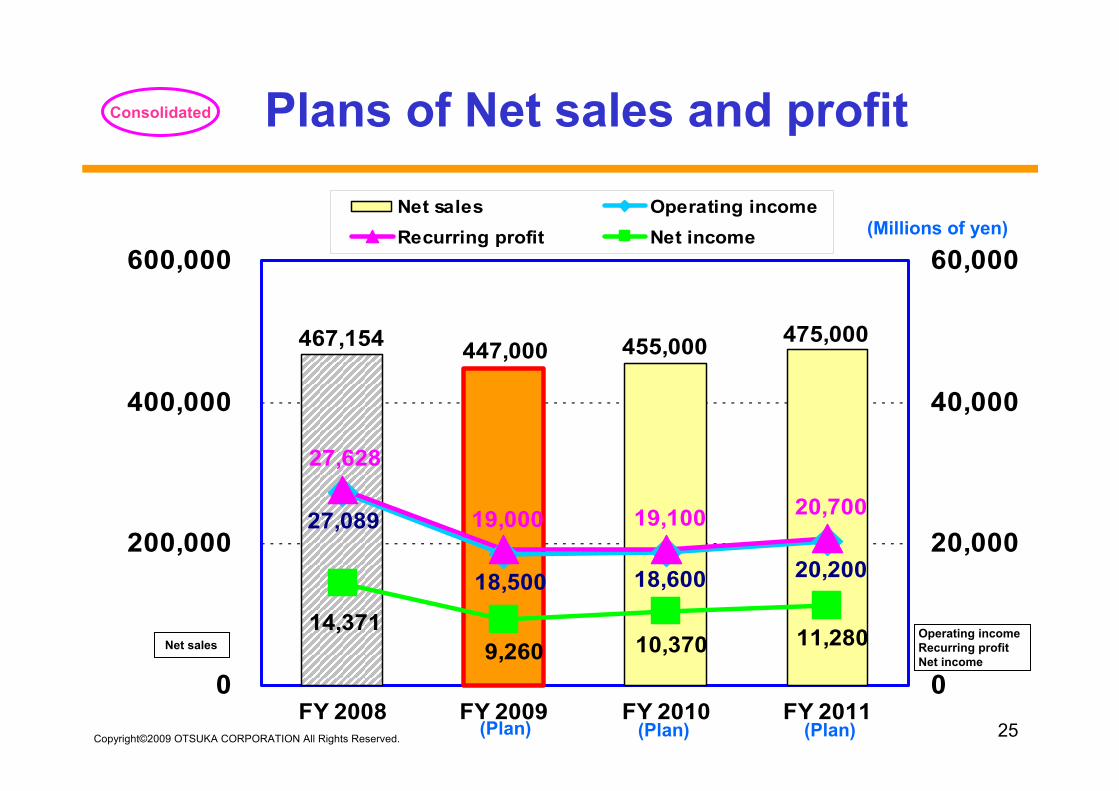
25Copyright©2009 OTSUKA CORPORATION All Rights Reserved.
475,000455,000447,000467,154
20,20018,60018,500
27,089 20,70019,10019,000
27,628
11,28014,37110,3709,260
0
200,000
400,000
600,000
FY 2008 FY 2009 FY 2010 FY 20110
20,000
40,000
60,000
Net sales Operating incomeRecurring profit Net income
Plans of Net sales and profitConsolidated
(Millions of yen)
Net salesOperating incomeRecurring profitNet income
(Plan) (Plan) (Plan)

26Copyright©2009 OTSUKA CORPORATION All Rights Reserved.
240,400
232,800
1,8001,7001,9901,916
221,200206,710198,761
232,100238,300266,476
0
200,000
400,000
600,000
FY 2008 FY 2009 FY 2010 FY 2011
SI business S&S business Other business
467,154 447,000 455,000475,000
(Millions of yen)
Plans of Net sales by segmentConsolidated
(Plan) (Plan) (Plan)

27Copyright©2009 OTSUKA CORPORATION All Rights Reserved.
+6.5%95,000+8.1%89,19282,493(of which “tanomail”)
(Units)
+5.7%-2.0%
+0.9%
-4.3%
+8.7%-1.7%-1.1%
+7.1%
Change to Last Year
508,96735,014
20,595
29,288
43,44837,650
6,858
92,438
Amount
FY 2008
481,50235,741
20,413
30,615
39,98538,320
6,938
86,270
Amount
FY 2007
+0.6%6,900SMILE (software)
+0.0%509,000PC
-0.0%35,000Server
+0.0%20,600(of whichColor copier)
-2.3%28,600Copier<Number of Sales>
+0.9%38,000ODS21
(Millions of yen)<Amount of Sales>
+10.5%
+6.0%
Change to Last Year
48,000
98,000
Amount
FY 2009 (Plan)
OSM
MRO
Plans of Key strategic businessNon-Consolidated

28Copyright©2009 OTSUKA CORPORATION All Rights Reserved.
Vitalize office via IT
Jissen (Practical) Solution Fair 2009
Place: Hotel Pacific Tokyo in ShinagawaDates: February 4th (Wed) – February 6th (Fri)

29Copyright©2009 OTSUKA CORPORATION All Rights Reserved.
Effects of alliance with LION OFFICE PRODUCTS CORP.
• = Navi + Lion
•Office design service
New BusinessNew Business

30Copyright©2009 OTSUKA CORPORATION All Rights Reserved.
LED:Light Emitting Diode
LED is Eco-friendly and Cost Saving
“Amendment Act on the Rational Use of Energy”effective April, 2009
Started Full-blown LED Lighting Business
Incandescent Fluorescent LED
36W 8W 4W1,000 hours 6,000 hours 40,000 hours
Power Consumption
Durable Hours
Light Type
Incandescent Lamp/Fluorescent Light/LED Comparison (example)
Ling life:Reduced
maintenance frequency
Reduced power
consumption& improved brightness
Price* 110 yen 839 yen 9,480 yen* Price is “tanomail” price
New BusinessNew Business

31Copyright©2009 OTSUKA CORPORATION All Rights Reserved.
Street light
Tunnel light Explosion-proof Lamp
General-purpose
Wide Range of LED Lighting

Copyright©2009 OTSUKA CORPORATION All Rights Reserved.
CommunityCommunity
EmployeesEmployees
Customers
ShareholdersShareholdersBusiness PartnersBusiness Partners
We live up to ourStakeholders’ confidence
33Copyright©2009 OTSUKA CORPORATION All Rights Reserved.
1. This material is intended to provide information about the business performance of fiscal year2008 and strategy of the OTSUKA CORPORATION and Group companies. It is not intended and should not be construed as an inducement to purchase or sell stocks ofOTSUKA CORPORATION.
2. Forward-looking statements in this material with respect to OTSUKA CORPORATION’s strategies,plans, beliefs, and other statements related to future trends and performance are not historicalfacts, and as such involve risks and uncertainties. Such statements are not guarantees of futureperformance. Actual results may differ considerably from projections due to unpredictable changes to the economic situation, and a number of factors. Key factors that could affect actual results aregeneral economic conditions, social trends, change of relative competitiveness in demand actionfor products and services provided by OTSUKA CORPORATION. Key factors that may affectbusiness performance are not limited to these items described here.
3. Statements in this document are based on the current beliefs, estimates and expectations ofmanagement. OTSUKA CORPORATION undertakes no obligation to update any forward-lookingstatements.
4. OTSUKA CORPORATION shall in no event be liable for any damages arising out of the use orinterpretation of this material.
Cautionary statement


