1 BUSINESS STUDENTS’ First Year Experience: A Campus-Wide Collaboration of Research and Reform For Student Success Presented at the Society for Teaching and Learning in Higher Education Conference Sydney, Nova Scotia, June 20, 2013 Wallace Lockhart Bruce Anderson Brian Schumacher Kate McGovern
Transcript
1
BUSINESS STUDENTS’ First Year Experience:
A Campus-Wide Collaboration
of Research and Reform For Student Success
Presented at the Society for Teaching and Learning in Higher Education Conference
Sydney, Nova Scotia, June 20, 2013
Wallace Lockhart
Bruce Anderson Brian Schumacher Kate McGovern
2
The Motivation Wally — Understand differences Brian — Accelerate the learning Kate — Build bridges – admin & faculty Bruce — Improve experience & success
3
Our Team Dr. Wallace Lockhart: PI, Faculty member, BUS100 Instructor Bruce Anderson: Centre for Management Development, BUS100
Instructor Brian Schumacher: Associate Dean, BUS100 Instructor Kate McGovern: Office of Resource Planning, data coordinator Don Balas: Grad student, high school teacher, part of the Sask Ed
writing assessment team. UofR Student Success Centre UofR Centre for Teaching and Learning
4
How We Came Together A passion for teaching & learning Intro to Business – pilot courses & new core
class Across UofR: shared values, focus on
student success, increasing student diversity
5
OUR STUDENTS: A PROFILE
6
6
Age differed between terms. So did student experience and need. We teach the course as an “Intro to University” Class. WE WILL CHANGE! Registration and winter teaching pedagogy will change.
7
Profile of Fall 2012 Undergraduate UR and Business 100 Students
Student Characteristic
All UR
Students (n=11,272)
All BUS 100 Students
(n=254)
Business 100 Classes Sec 001
(n=64)
Sec 002
(n=66)
Sec 003
(n=63)
Sec 004
(n=61)
Female 62% 48% 45% 42% 46% 57%
International 8% 12% 20% 6% 16% 5%
Full-time 81% 96% 97% 95% 94% 100%
Age (Avg) 20.6 18.8 18.8 18.6 19.4 18.5
Admit GPA 81.8% 80.8% 81.2% 80.1% 81.1% 80.8%
8
Our Students: Fall 2012 Undergraduate Students Admit GPA
Admit GPA Domestic Inter- national Female Male
All UR Students 82.0% 77.6% 83.0% 80.1% All BUS 100 Students 80.9% 79.2% 82.9% 78.8%
Fall 2012 Undergraduate Students Admit GPA and 201230 Term GPA
81.7 80.8 81.2 80.1 81.1 80.8
70.8 69.3 69.8 70.3 67.3
69.7
50
60
70
80
90
All UR Students
BUS 100 Students
Sec 001 Sec 002 Sec 003 Sec 004
Admit GPA Term GPA
10
Fall 2012 Undergraduate Students by Gender Admit GPA and Term GPA
82.9 80.1
82.9 78.8
71.8 69.2 70.3 68.5
50
60
70
80
90
Female UR
(11.0)
Male UR
(10.8)
Female BUS100
(12.7)
Male BUS100
(10.3)
Admit GPA Term GPA (Admit GPA-Term GPA)
11
Fall 2012 Undergraduate Students by International Status, Admit GPA and Term GPA
(Admit GPA-
80.9 79.2
70.4
60.8
50
55
60
65
70
75
80
85
Domestic (-10.42)
International (-18.39)
BUS 100 Students
Admit GPA Term GPA
81.9
77.6
71.3
66.1
50
55
60
65
70
75
80
85
Domestic (-10.62)
International (-11.49)
Other UR Students
Admit GPA Term GPA
12
Reasons for choosing this University1
Business Single most important reason U of R Other U. Wanted to live close to home 41% 18%
Quality of academic programs 5% 19%
University has a good reputation - 11% Total 5% 30%
12010 Cdn. University Survey Consortium data
CUSC 2010
13
No Time to Study
2010 Cdn. University Survey Consortium data
14
OUR RESEARCH PROJECT
15
Research Goals Student Diversity
• Does it matter? • What can we do about it?
Continuous Improvement • What to measure? • What levers work? • Support students through transition
16
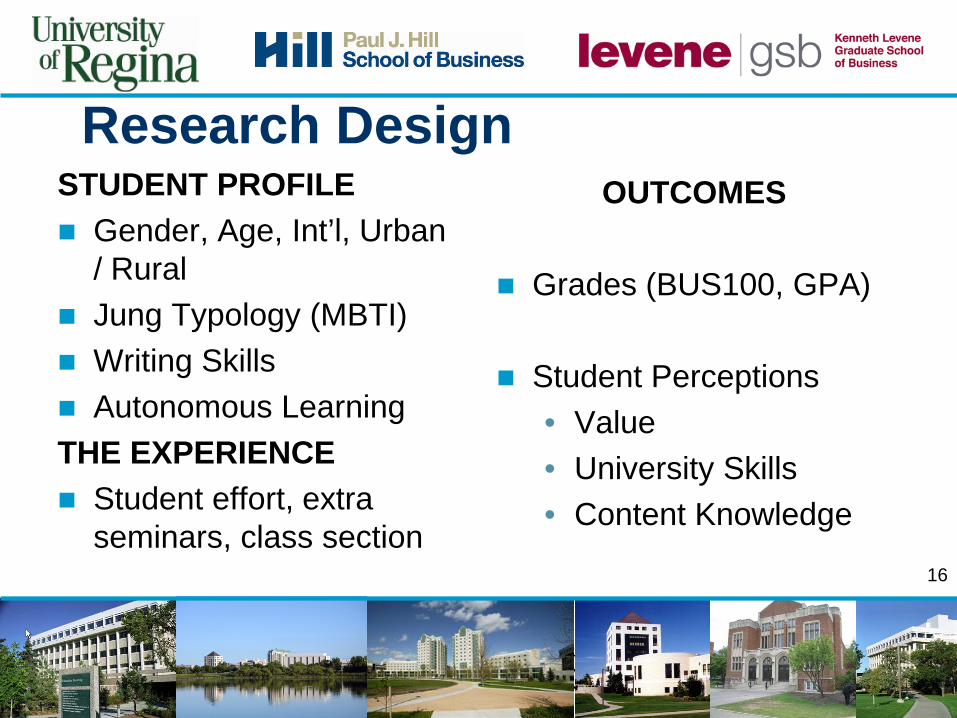
Research Design STUDENT PROFILE Gender, Age, Int’l, Urban
/ Rural Jung Typology (MBTI) Writing Skills Autonomous Learning THE EXPERIENCE Student effort, extra
seminars, class section
OUTCOMES Grades (BUS100, GPA)
Student Perceptions
• Value • University Skills • Content Knowledge
17
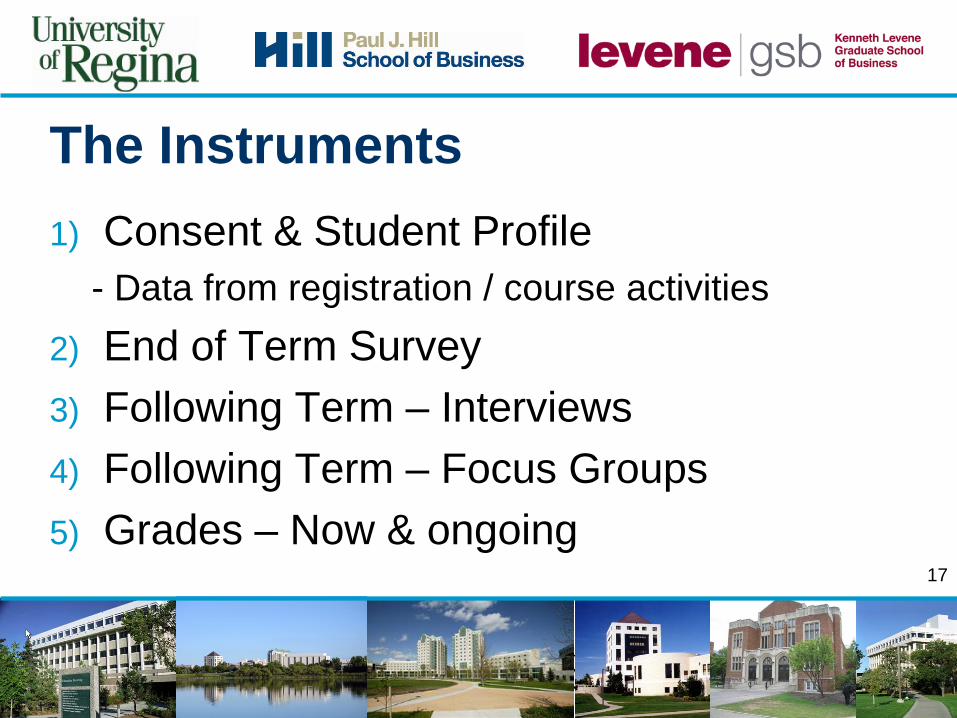
The Instruments 1) Consent & Student Profile
- Data from registration / course activities 2) End of Term Survey 3) Following Term – Interviews 4) Following Term – Focus Groups 5) Grades – Now & ongoing
18
Term of Research Project All BUS100 classes for 3 years
• Shouldn’t all SOTL projects do this?
19
The Expectations 1) Understand our students 2) Outcomes will improve over time 3) Many will use the data / results
admissions, support, faculty, competencies 4) Today’s research tomorrow’s routine
20
Pedagogy Meets Research Seminar Series: University Skills Core skills: Writing, Reading Understanding self:
• MBTI, autonomous learning, learning style
21
MBTI: Human Metrics: “Jung Typology Test”™ 72 questions – online – instant result Extras: Explanations, applications Permission granted to use the tool in our study
22
Autonomous Learning Ann Macaskill and Elissa Taylor – UK Simple: 12 likert scale questions The Autonomous Learning Scale is now a 12-item measure with two
subscales measuring: • Independence of Learning, I tend to be motivated to work by
assessment deadlines (item 10), and • Study habits, I frequently find excuses for not getting down to
work (item 2).
Permission granted to use the tool in our study. Macaskill, A., E. Taylor: “The development of a brief measure of learner autonomy in university students”.
Studies in Higher Education, Vol. 35, No. 3, May 2010 351-359
23
Learning Styles BW James – University of South Dakota Simple tool: 16 mx questions A-B-C Visual – Auditory – Kinesthetic Permission granted to use the tool in our study Source: http://people.usd.edu/~bwjames/tut/learning-style/index.html Adapted from Instructor
Writing Skills Saskatchewan Education Assessment for
Learning Program Grade 11 Writing Skills Assessment Tool Don Balas: Co-developer; grad student! 5 items. We use: Organization and Fluency Saskatchewan Education Assessment for Learning (AFL) Conceptual Framework for the Provincial Writing
“High Impact Practices” (Banff 11/2012) Hey … we do many of those things!
• Experiential Learning • Intellectual skills • Focus on outcomes • Knowledge of the world
26
The Literature - UofR Heather Ritenburg: Transitioning With Success (2011) Recommendations to Transitions Committee: 1. strengthen the University of Regina’s message of support during first year 2. familiarize parents to the experience of first year 3. consider if first-year university needs to be recognized as a unique year 4. consult, involve or include students in the ongoing work of the committee.
27
The Literature Mary Hoeft: “Why University Students Don’t Read: What Professors Can Do To
Increase Compliance” • International Journal for the Scholarship of Teaching and Learning
Sharon Clinebell & Mary Stecher: “Teaching Teams to be Teams: An Exercise Using the Miers-Briggs® Type Indicator and the Five-Factor Personality Traits
• Journal of Management Education 2003 27: 362 http://jme.sagepub.com/content/27/3/362
Christina Rideout & Susan Richardson: “A Teambuilding Model: Appreciating Differences Using the Myers-Briggs Type Indicator with Developmental Theory”
• Journal of Counselling and Development Vol 67, May 1989 529-533
There was a significant participant bias in Winter 2013 term. Non-participants (38%) earned lower grades.
We don’t know: How else did their experiences differ?
29
30
GRADE GPA VALUE U-SKILLS CONTENTGENDER X XAGEDOM/INT'L X X XURBAN/RURALMBTI E / IMBTI J / P XWRITING: ORG X XWRITING: FLU XALS INDEPENDENCE X XALS STUDY SKILLS X XHS AVERAGEHS PREP'D MECLASS SECTION X XFRIDAY SEMINARS X XMY EFFORT X X X
GRADES not affected by my effort? Oh my, dig deeper Wally GRADES not affected by seminars? I expected: High Int’l partic. YES … I did find the answers … both explained by Int’l student gaps. STUDENT PERCEPTION (RH 3 columns): Few X … good!
31
GRADE GPA VALUE U-SKILLS CONTENTGENDER X XAGEDOM/INT'L X X XURBAN/RURALMBTI E / IMBTI J / P XWRITING: ORG X XWRITING: FLU XALS INDEPENDENCE X XALS STUDY SKILLS X XHS AVERAGEHS PREP'D MECLASS SECTION X XFRIDAY SEMINARS X XMY EFFORT X X X
Blue Section: Student Characteristics NOTE: Between Group Differences in Grades & GPA But Very Few Differences in Student Perceptions of value, university skills and learning course content.
32
GRADE GPA VALUE U-SKILLS CONTENTGENDER X XAGEDOM/INT'L X X XURBAN/RURALMBTI E / IMBTI J / P XWRITING: ORG X XWRITING: FLU XALS INDEPENDENCE X XALS STUDY SKILLS X XHS AVERAGEHS PREP'D MECLASS SECTION X XFRIDAY SEMINARS X XMY EFFORT X X X
Bottom section: Student Experience Variables Note how differences are opposite: Class experience affects student perception of learning. Experience does not affect grades or GPA. NOT in design: Class section a key criteria in experience!
33
Fall 2012 results
X: SIGNIFICANTBUS100 Grade Fall GPA Value Univ Skills
Content Knowl.
GenderAgeDomestic / International XUrban vs RuralPersonality: E/IPersonality: J/P X X XWriting – Organization X XWriting – Fluency X XALS – Independence X XALS – Study Habits X X XHS Average Grade X XHS Prepared Me X XClass Section X XFriday Seminars X XMy Effort X X X X X
ALS STUDY HABITS ALS study habits: In winter 2013, only 2
participants scored in the “highest” group based on the scoring used in 201230. As a result I had to rejig the benchmarks for hi-med-lo. It also tells us: The winter group did not self-rate as having strong study habits.