Statements contained in this presentation about future performance including without limitation operating results capital expenditures rate base growth dividend policy financial outlook and other statements that are not purely historical are forward-looking statements These forward-looking statements reflect our current expectations however such statements involve risks and uncertainties Actual results could differ materially from current expectations These forward-looking statements represent our expectations only as of the date of this presentation and Edison International assumes no duty to update them to reflect new information events or circumstances Important factors that could cause different results include but are not limited to thebull ability of SCE to recover its costs through regulated rates including costs related to uninsured wildfire-related and mudslide-related liabilities and costs
incurred to prevent future wildfiresbull ability to obtain sufficient insurance at a reasonable cost including insurance relating to SCEs nuclear facilities and wildfire-related claims and to recover
the costs of such insurance or in the event liabilities exceed insured amounts the ability to recover uninsured losses from customers or other partiesbull risks associated with AB 1054 effectively mitigating the significant risk faced by California investor-owned utilities related to liability for damages arising
from catastrophic wildfires where utility facilities are a substantial cause including SCEs ability to maintain a valid safety certification SCEs ability to recover uninsured wildfire-related costs from the Wildfire Insurance Fund the longevity of the Wildfire Insurance Fund and the CPUCs interpretation of and actions under AB 1054
bull ability of SCE to implement its WMP including effectively implementing Public Safety Power Shut-Offs when appropriatebull decisions and other actions by the CPUC the FERC the NRC and other regulatory and legislative authorities including decisions and actions related to
determinations of authorized rates of return or return on equity the recoverability of wildfire-related and mudslide-related costs wildfire mitigation efforts and delays in regulatory and legislative actions
bull ability of Edison International or SCE to borrow funds and access the bank and capital markets on reasonable termsbull actions by credit rating agencies to downgrade Edison International or SCEs credit ratings or to place those ratings on negative watch or outlookbull risks associated with the decommissioning of San Onofre including those related to public opposition permitting governmental approvals on-site storage
of spent nuclear fuel delays contractual disputes and cost overrunsbull extreme weather-related incidents and other natural disasters (including earthquakes and events caused or exacerbated by climate change such as
wildfires) which could cause among other things public safety issues property damage and operational issuesbull risks associated with cost allocation resulting in higher rates for utility bundled service customers because of possible customer bypass or departure for
other electricity providers such as CCAs and Electric Service Providers bull risks inherent in SCEs transmission and distribution infrastructure investment program including those related to project site identification public
opposition environmental mitigation construction permitting power curtailment costs (payments due under power contracts in the event there is insufficient transmission to enable acceptance of power delivery) changes in the CAISOs transmission plans and governmental approvals and
bull risks associated with the operation of transmission and distribution assets and power generating facilities including public and employee safety issues the risk of utility assets causing or contributing to wildfires failure availability efficiency and output of equipment and facilities and availability and cost of spare parts
Other important factors are discussed under the headings ldquoForward-Looking Statementsrdquo ldquoRisk Factorsrdquo and ldquoManagementrsquos Discussion and Analysisrdquo in Edison Internationalrsquos Form 10-K and other reports filed with the Securities and Exchange Commission which are available on our website wwwedisoninvestorcom These filings also provide additional information on historical and other factual data contained in this presentation
Forward-Looking Statements
October 30 2019 1
Page
Updated (U) or New (N) from July 2019 Business
Update
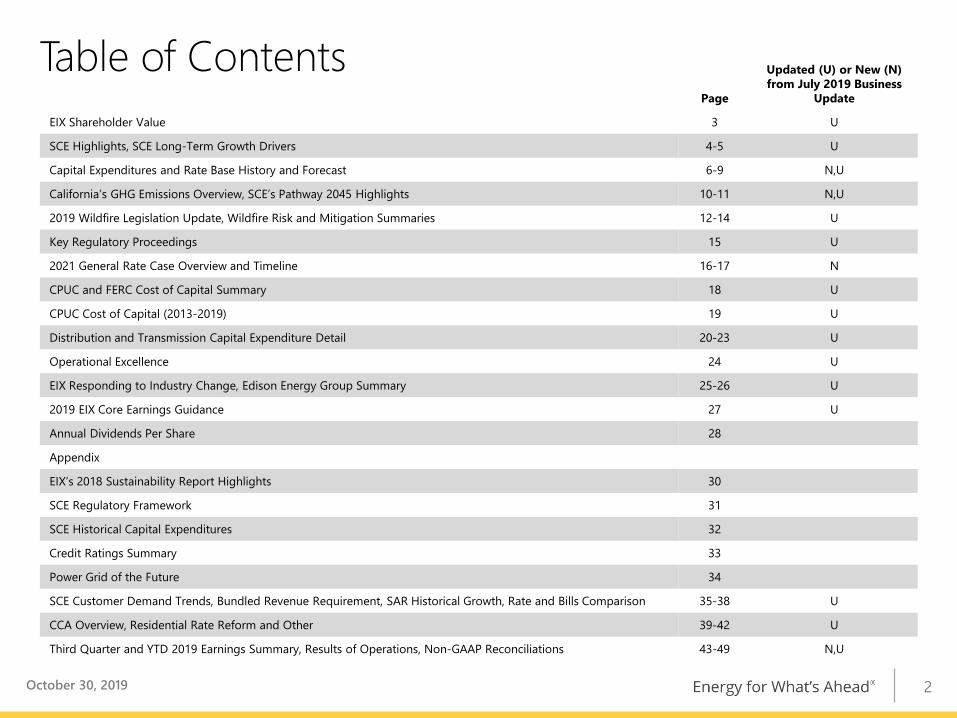
EIX Shareholder Value 3 U
SCE Highlights SCE Long-Term Growth Drivers 4-5 U
Capital Expenditures and Rate Base History and Forecast 6-9 NU
Californiarsquos GHG Emissions Overview SCErsquos Pathway 2045 Highlights 10-11 NU
2019 Wildfire Legislation Update Wildfire Risk and Mitigation Summaries 12-14 U
Key Regulatory Proceedings 15 U
2021 General Rate Case Overview and Timeline 16-17 N
CPUC and FERC Cost of Capital Summary 18 U
CPUC Cost of Capital (2013-2019) 19 U
Distribution and Transmission Capital Expenditure Detail 20-23 U
Operational Excellence 24 U
EIX Responding to Industry Change Edison Energy Group Summary 25-26 U
and reliabilitybull Grid resiliency and safetybull Grid modernization ndash Californiarsquos low-
carbon goalsbull Operational excellenceEdison Energy Strategybull Services for large commercial and
industrial customers
October 30 2019 3
One of the nationrsquos largest electric utilitiesbull 15 million residents in service territorybull 5 million customer accountsbull 50000 square-mile service area
Significant infrastructure investment
bull 14 million power polesbull 724000 transformersbull 127000 miles of distributiontransmission linesbull 3200 MW owned generation
Strong rate base growth driven bybull Safety and reliabilitybull Californiarsquos low-carbon objectives Grid modernization Transportation electrification Electric vehicle charging Energy storage
Limited Generation Exposurebull Own less than 20 of power generationbull Future needs via competitive solicitations
SCE Highlights
October 30 2019 4
SCE Long-Term Growth DriversDescription TimeframeRegulatory Process
Sustained level of infrastructure investment required until equilibrium replacement rates achieved and then maintained
bull Ongoing - current and future GRCs
Accelerate circuit upgrades automation communication and analytics capabilities at optimal locations to integrate distributed energy resources
bull 2018-2020 ndash Approximately $590 million of capital spending in 2018 GRC decision
bull 2021-2023 ndash Approximately $750 million of capital spending requested in 2021 GRC application
bull 2025 ndash CPUC target to complete grid modernization butmay take longer
Future transmission needs to meet 60 renewables mandate in 2030 100 cleanenergy by 2045 and to support reliability
bull 2017-2022 ndash Multiple projects approved by CAISO in permitting andor construction
bull 2023-2045 ndash Future needs largely driven by CAISO planning process
SCE-owned investment opportunities under existing CPUC proceedings
bull Today ndash Most commitments via contracts over 720 MW procured
bull 2019-2023 - $40 million of capital spending forecasted procurement target of 580 MW by 2020 as utility-owned or procured additional reliability proceeding ongoing
Utility investment in programs to build and support the expansion of transportation electrification in passenger and light- medium- and heavy-duty vehicles and potentially to support electrification of other sectors of the economy
bull 2018 ndash Medium- and Heavy-Duty (MDHD) Vehicle Transportation Electrification (TE) program approved totaling $356 million Charge Ready 2 application filed requesting $760 million Charge Ready Bridge Funding approved totaling $22 million
bull 2019-2030 ndash Potential investments to support electrification in other sectors of the economy
Utility investment and operational practices that mitigate increasing wildfire risk and bolster fire prevention activities
bull 2018 ndash Filed Grid Safety amp Resiliency application requesting $582 million of total costs (capital $407 million)
bull 2019 ndash Filed Wildfire Mitigation Planbull Ongoing ndash future GRCsbull First ~$16 billion fire risk mitigation capital spend will not
be added to rate base per AB 1054
Infrastructure Replacement
Grid Modernization
Electrification of Transportation and
Other Sectors
Energy Storage
Transmission
Wildfire Prevention and Mitigation
October 30 2019 5
SCE Historical Rate Base and Core Earnings($ billions except per share data)
Note Recorded rate base year-end basis See SCE Core EPS Non-GAAP Reconciliations and Use of Non-GAAP Financial Measures Since 2013 rate base excludes SONGS
$422$420$388 $468Core EPS $458
$211$233
$246$259
$278$296
2013 2014 2015 2016 2017 2018
$442
October 30 2019 6
SCE Capital Expenditure Forecast($ billions) $238 - $256 billion capital program
for 2019-2023bull This capital forecast includes 2018 GRC approved CPUC capital spend
for 2019-2020 2021 GRC requested CPUC capital spend
for 2021-2023 Non-GRC capital programs including
Charge Ready Pilot MDHD Transportation Electrification and 2019-2020 wildfire mitigation-related programs
FERC forecasted capital spendbull Long term growth drivers include Infrastructure Replacement Wildfire Mitigation Transportation Electrification Transmission Infrastructure
bull AuthorizedActual may differ from forecast previously authorized amounts in the last three GRC cycles were 89 92 and 922 of capital requested respectively
1 In accordance with Assembly Bill 1054 ~$16 billion of wildfire mitigation-related spend shall not earn an equity return See ldquoSCE Wildfire Capital Forecastrdquo slide for further information on wildfire-related capital spend
2 Approval percentage for the 2018 GRC excludes Grid Modernization and project approvals that were deferred to the next case for timing reasons3 The low end of the range for 2021-2023 reflects a 10 reduction on the total capital forecast using management judgment based on historical experience of previously authorized
amounts and potential for permitting delays and other operational considerations The low end of the range for 2020 reflects a 10 reduction applied only to FERC capital spending and non-GRC programs
1
Range Case3 $46 $48 $48 $48 $48
7
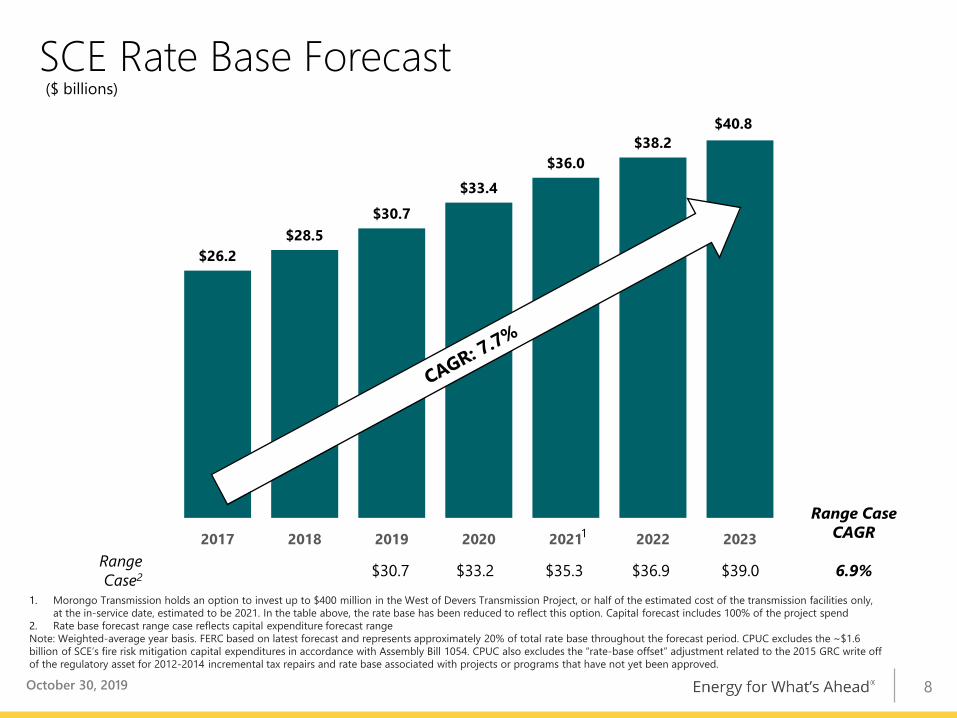
$262$285
$307$334
$360$382
2017 2018 2019 2020 2021 2022 2023
SCE Rate Base Forecast($ billions)
1 Morongo Transmission holds an option to invest up to $400 million in the West of Devers Transmission Project or half of the estimated cost of the transmission facilities only at the in-service date estimated to be 2021 In the table above the rate base has been reduced to reflect this option Capital forecast includes 100 of the project spend
2 Rate base forecast range case reflects capital expenditure forecast range Note Weighted-average year basis FERC based on latest forecast and represents approximately 20 of total rate base throughout the forecast period CPUC excludes the ~$16 billion of SCErsquos fire risk mitigation capital expenditures in accordance with Assembly Bill 1054 CPUC also excludes the ldquorate-base offsetrdquo adjustment related to the 2015 GRC write off of the regulatory asset for 2012-2014 incremental tax repairs and rate base associated with projects or programs that have not yet been approved
Range CaseCAGR
Range Case2 $307 $332 $353 $369 $390 69
October 30 2019
$408
1
8
bull Under AB 1054 ~$16 billion of SCErsquos fire risk capital expenditures per CPUC-approved Wildfire Mitigation Plan shall not earn an equity return SCE assumes all CPUC-jurisdictional wildfire-related
mitigation spend generally incurred after AB 1054 passage will be eligible to meet the requirement until the ~$16 billion has been incurred
Spending can be recovered from ratepayers through a securitizable dedicated-rate component
bull Main wildfire-related programs include Covered Conductor Program ndash Risk-prioritized
replacement of more than 6000 miles of bare conductor to covered conductor by 2023
Preventative Maintenance Program ndash Enhanced inspection program within High Fire Risk Areas (HFRAs) designed to proactively detect and timely remediate potential in-service failures
SCE Wildfire Capital Forecast($ billions)
$42 Billion Capital Request for 2019-20231
$03
$07$06$01
$03
$10$12
$04
$07
$09$10
$12
2019 2020 2021 2022 2023
All Other Wildfire-Related MitigationSpendWildfire-Related Mitigation Spend -AB1054
1
1 Includes FERC wildfire mitigation-related spending of $13 million $5 million $5 million $4 million and $4 million for each respective yearNote Totals may not foot due to rounding Forecast based on 2018 GRC request levelsOctober 30 2019 9
10
bull SB 350 requires a doubling of energy efficiency in existing buildings for California by 2030bull SB 32 requires statewide GHG emissions to be reduced to 40 below the 1990 level by 2030 Governor Order set a 2050
target of 80 below 1990 levelsbull SB 100 requires that 60 of energy sales to customers come from renewable power by 2030 and sets a 100 clean
electricity goal for the state and issued an executive order establishing a new target to achieve carbon neutrality both by2045
Californiarsquos GHG Emissions Overview
Commercial and Residential
12Electrical
Power15
Agriculture8
Industrial 24
Transportation41
SCE is taking a leading role to ensure that transportation and building electrification plays a major part in reducing GHG and criteria pollutant emissions in California
Source Data for both charts from California Air Resources Board California GHG Emissions data as of 2017
October 30 2019
State Carbon Emissions Reduction PathwayAnnual million metric tons (MMT)
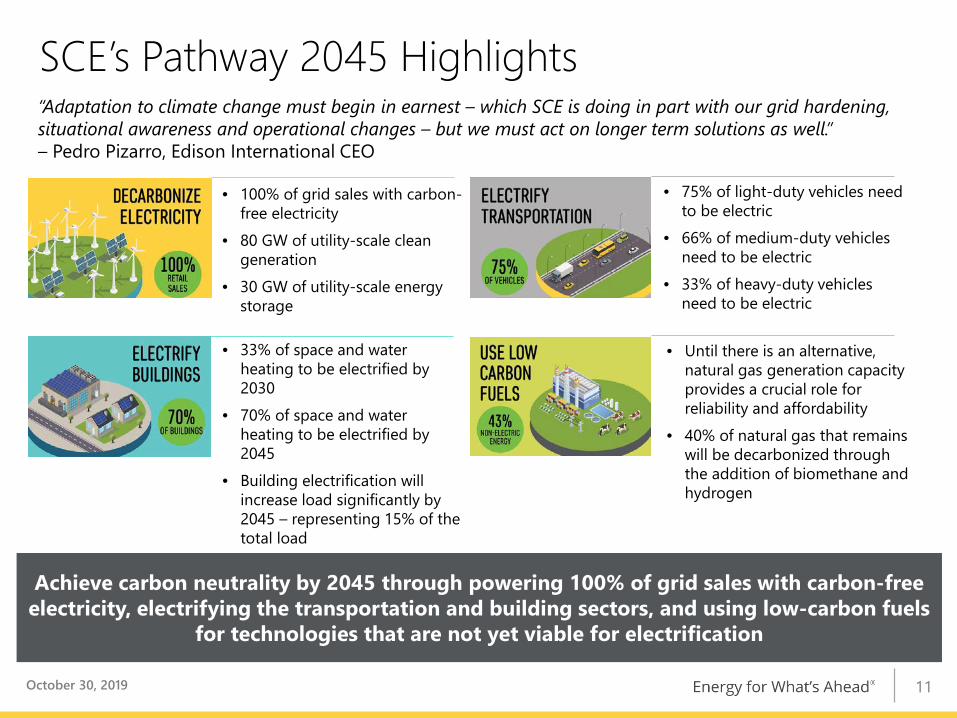
ldquoAdaptation to climate change must begin in earnest ndash which SCE is doing in part with our grid hardening situational awareness and operational changes ndash but we must act on longer term solutions as wellrdquo ndash Pedro Pizarro Edison International CEO
SCErsquos Pathway 2045 Highlights
October 30 2019
bull 100 of grid sales with carbon-free electricity
bull 80 GW of utility-scale clean generation
bull 30 GW of utility-scale energy storage
bull 33 of space and water heating to be electrified by 2030
bull 70 of space and water heating to be electrified by 2045
bull Building electrification will increase load significantly by 2045 ndash representing 15 of the total load
bull 75 of light-duty vehicles need to be electric
bull 66 of medium-duty vehicles need to be electric
bull 33 of heavy-duty vehicles need to be electric
bull Until there is an alternative natural gas generation capacity provides a crucial role for reliability and affordability
bull 40 of natural gas that remains will be decarbonized through the addition of biomethane and hydrogen
Achieve carbon neutrality by 2045 through powering 100 of grid sales with carbon-free electricity electrifying the transportation and building sectors and using low-carbon fuels
for technologies that are not yet viable for electrification
11
Summary of Assembly Bill 1054 and Assembly Bill 111
Safety Oversight and Certification
bull Creates Wildfire Safety Division1 to provide additional wildfire safety oversightbull Initial safety certification issued by CPUC Executive Director within 30 days of IOU request requires 1) an approved wildfire
mitigation plan 2) utility to be in good safety standing 3) established board safety committee with relevant safety experience and 4) board-level reporting to the CPUC on safety issues
bull Subsequent annual safety certifications issued by Wildfire Safety Division1 also require 5) approved executive compensation structure that promotes safety ensures public safety and utility financial stability 6) compensation limits on executive officer contracts and 7) implementation of and reporting to the CPUC on wildfire mitigation plans safety culture assessments and board safety committee recommendations
Cost Recovery Standard
bull Provided a utility is ldquosafety certifiedrdquo and elects to participate in the wildfire ldquoinsurancerdquo fund (described below) establishes a FERC-like prudence standard to guide recovery of costs arising from catastrophic wildfires occurring after bill enactment
bull Prudence is based on reasonable utility conduct with potential for full or partial recovery considering factors within and beyond a utilityrsquos control
bull FERC-like standard assumes utility is prudent unless intervenors create serious doubt shifting burden to the utility to prove prudence
Wildfire Fund
bull Establishes a wildfire fund to help wildfire victims and affected communities recover and rebuild more quicklybull Wildfire ldquoinsurancerdquo fund is an insurance-like fund that more broadly socializes wildfire costs utilities participation is voluntarybull Fund includes a $105 billion ratepayer contribution through the financing of a 15-year extension of the Department of Water
Resources bond charge wildfire insurance fund also includes $105 billion contribution from utility shareholdersbull All three IOUs have elected to participate PGampE must emerge from bankruptcy by June 30 2020 to participate SCErsquos shareholders initially contributed approximately $24 billion on September 10 and expect to contribute approximately
$95 million annually on January 1 for 10 years2
Mitigation CapEx
bull First $16 billion of SCErsquos fire risk mitigation capital expenditures as approved in wildfire mitigation plans shall not earn an equity return but can be recovered from ratepayers through a securitizable dedicated rate component2
Liability Cap bull While fund remains solvent wildfire cost disallowances capped over each trailing 3-year period to 20 of TampD equity rate basebull Must be safety certified and not found to be acting with willful or conscious disregard of the safety of others
October 30 2019
1 Wildfire Safety Division created within CPUC until duties transferred to newly formed Office of Energy Infrastructure Safety on or after July 2021 2 Excluded from measurement of regulatory capital structure
2019 Wildfire Legislation Update
12
Mitigating Catastrophic Wildfire RiskSCE plans to spend significant capital and OampM from 2019-2023 including ~$16 billion of AB 1054 spend with continued investments beyond our forecast periodbull SCErsquos comprehensive risk mitigation program focuses on three key areas Grid hardening Increase the use of fire-resistant poles composite cross-arms and
covered conductor in high fire risk areas evaluate design approaches and next-generation engineering technology to further enhance public safety
Increased situational awareness capabilities Expand meteorological monitoring and forecasting capabilities by installing additional weather stations and high-definition cameras to help SCE and fire agencies to better prepare mitigate and respond to reported fires
Enhanced operational practices Restrict certain types of work in High Fire Risk Areas (HFRAs) during elevated fire risk conditions increase overhead inspection of equipment in HFRAs reduce fire risk via a Public Safety Power Shutoff in HFRAs during elevated weather conditions increase tree trimming and removal to further mitigate safety risks posed by trees or debris
bull Will file next compliance plan (Wildfire Mitigation Plan) detailing the near- and longer-term actions that SCE is taking to significantly reduce the risk of fire ignitions and increase emergency response and grid resiliency against future impacts of climate change in early 2020
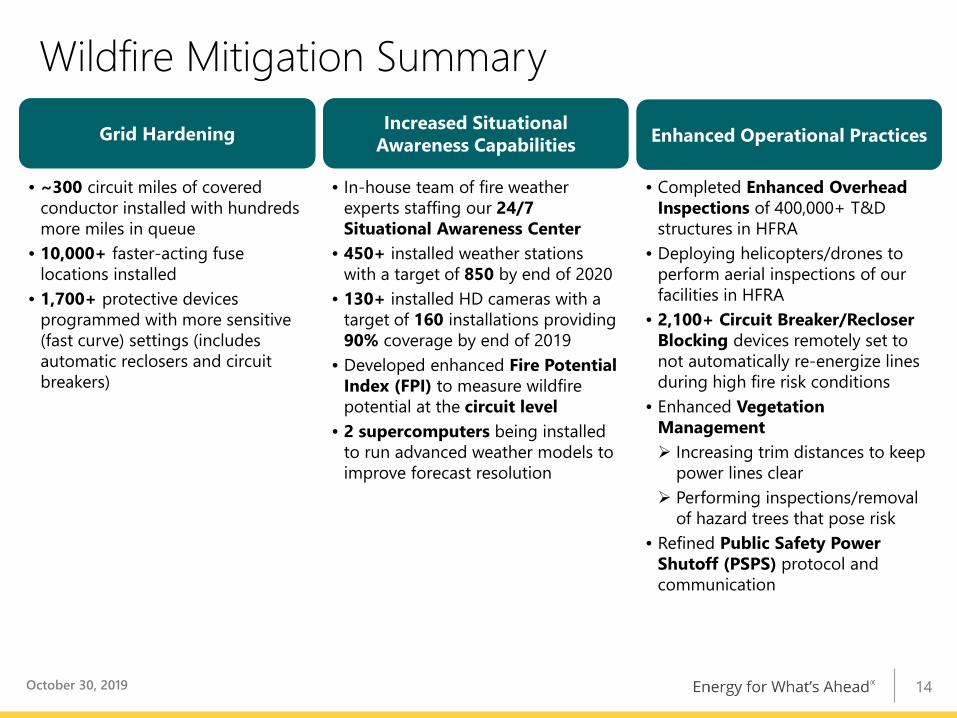
bull 1700+ protective devices programmed with more sensitive (fast curve) settings (includes automatic reclosers and circuit breakers)
bull In-house team of fire weather experts staffing our 247 Situational Awareness Center
bull 450+ installed weather stations with a target of 850 by end of 2020
bull 130+ installed HD cameras with a target of 160 installations providing 90 coverage by end of 2019
bull Developed enhanced Fire Potential Index (FPI) to measure wildfire potential at the circuit level
bull 2 supercomputers being installed to run advanced weather models to improve forecast resolution
bull Completed Enhanced Overhead Inspections of 400000+ TampD structures in HFRA
bull Deploying helicoptersdrones to perform aerial inspections of our facilities in HFRA
bull 2100+ Circuit BreakerRecloser Blocking devices remotely set to not automatically re-energize lines during high fire risk conditions
bull Enhanced Vegetation Management Increasing trim distances to keep
power lines clear Performing inspectionsremoval
of hazard trees that pose riskbull Refined Public Safety Power
Shutoff (PSPS) protocol and communication
14
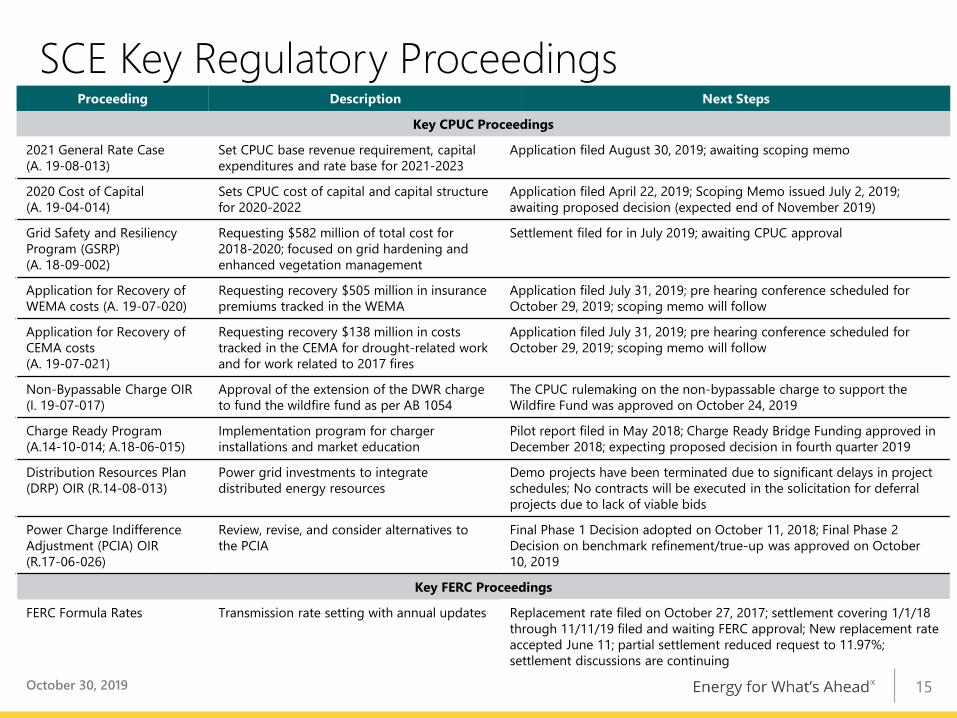
SCE Key Regulatory ProceedingsProceeding Description Next Steps
Key CPUC Proceedings
2021 General Rate Case (A 19-08-013)
Set CPUC base revenue requirement capital expenditures and rate base for 2021-2023
Application filed August 30 2019 awaiting scoping memo
2020 Cost of Capital(A 19-04-014)
Sets CPUC cost of capital and capital structurefor 2020-2022
Application filed April 22 2019 Scoping Memo issued July 2 2019 awaiting proposed decision (expected end of November 2019)
Grid Safety and Resiliency Program (GSRP) (A 18-09-002)
Requesting $582 million of total cost for 2018-2020 focused on grid hardening and enhanced vegetation management
Settlement filed for in July 2019 awaiting CPUC approval
Application for Recovery of WEMA costs (A 19-07-020)
Requesting recovery $505 million in insurance premiums tracked in the WEMA
Application filed July 31 2019 pre hearing conference scheduled for October 29 2019 scoping memo will follow
Application for Recovery of CEMA costs(A 19-07-021)
Requesting recovery $138 million in costs tracked in the CEMA for drought-related work and for work related to 2017 fires
Application filed July 31 2019 pre hearing conference scheduled for October 29 2019 scoping memo will follow
Non-Bypassable Charge OIR(I 19-07-017)
Approval of the extension of the DWR charge to fund the wildfire fund as per AB 1054
The CPUC rulemaking on the non-bypassable charge to support the Wildfire Fund was approved on October 24 2019
Charge Ready Program(A14-10-014 A18-06-015)
Implementation program for charger installations and market education
Pilot report filed in May 2018 Charge Ready Bridge Funding approved in December 2018 expecting proposed decision in fourth quarter 2019
Distribution Resources Plan (DRP) OIR (R14-08-013)
Power grid investments to integrate distributed energy resources
Demo projects have been terminated due to significant delays in project schedules No contracts will be executed in the solicitation for deferral projects due to lack of viable bids
Power Charge Indifference Adjustment (PCIA) OIR (R17-06-026)
Review revise and consider alternatives to the PCIA
Final Phase 1 Decision adopted on October 11 2018 Final Phase 2 Decision on benchmark refinementtrue-up was approved on October 10 2019
Key FERC Proceedings
FERC Formula Rates Transmission rate setting with annual updates Replacement rate filed on October 27 2017 settlement covering 1118 through 111119 filed and waiting FERC approval New replacement rate accepted June 11 partial settlement reduced request to 1197 settlement discussions are continuing
October 30 2019 15
Filed August 30 2019 SCErsquos 2021 GRC request balances the need to advance Californiarsquos ambitious decarbonization policy goals and address emergent wildfire public safety risks while continuing to provide safe reliable and affordable service to customersbull 2021 GRC Application (A 19-08-013) addresses major portion of CPUC-jurisdictional revenue
requirement for 2021-2023 Includes operating costs and capital investment Excludes CPUC jurisdictional costs such as fuel and purchased power cost of capital and other
discrete SCE capital projects (such as Charge Ready 2 ndash SCErsquos transportation electrification infrastructure program)
Excludes FERC-jurisdictional transmission revenue requirementbull Requests 2021 revenue requirement of $7601 billion $1155 billion increase over 2020 authorized revenue requirement a 127 increase over total rates1
Requests increases of $400 million in 2022 and $531 million in 2023bull Multi-track schedule proposed to approve 2021-2023 revenue requirement and reasonableness of
additional 2018-2020 recorded incremental amounts associated with the Fire Mitigation memorandum accounts (FMA)2 (See ldquoSCE 2021 General Rate Case Timelinerdquo for more information)
SCE 2021 General Rate Case Overview
October 30 2019
1 127 includes the impact of lower anticipated 2021 kWh sales and recoveries of $87 million of non-wildfire memo accounts2 Includes Wildfire Mitigation Plan Memo Account Fire Hazard Prevention Memo Account Grid Safety and Resiliency Program Memo Account and Fire Risk Mitigation Memo Account
16
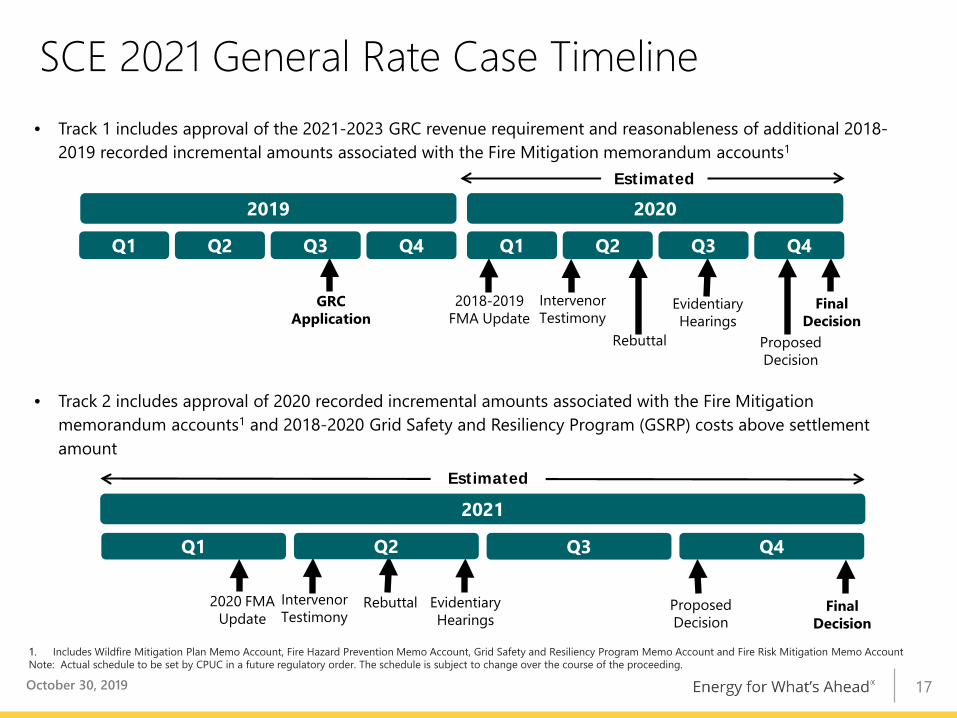
bull Track 1 includes approval of the 2021-2023 GRC revenue requirement and reasonableness of additional 2018-2019 recorded incremental amounts associated with the Fire Mitigation memorandum accounts1
bull Track 2 includes approval of 2020 recorded incremental amounts associated with the Fire Mitigation memorandum accounts1 and 2018-2020 Grid Safety and Resiliency Program (GSRP) costs above settlement amount
SCE 2021 General Rate Case Timeline
October 30 2019
1 Includes Wildfire Mitigation Plan Memo Account Fire Hazard Prevention Memo Account Grid Safety and Resiliency Program Memo Account and Fire Risk Mitigation Memo AccountNote Actual schedule to be set by CPUC in a future regulatory order The schedule is subject to change over the course of the proceeding
Estimated
2021
Q1
Rebuttal Final Decision
Intervenor Testimony
Proposed Decision
Evidentiary Hearings
2020 FMA Update
Q2 Q3 Q4
GRCApplication
Rebuttal
Final Decision
Intervenor Testimony
Proposed Decision
Evidentiary Hearings
2018-2019 FMA Update
2019 2020
Q1 Q2 Q3 Q4 Q1 Q2 Q3 Q4
Estimated
17
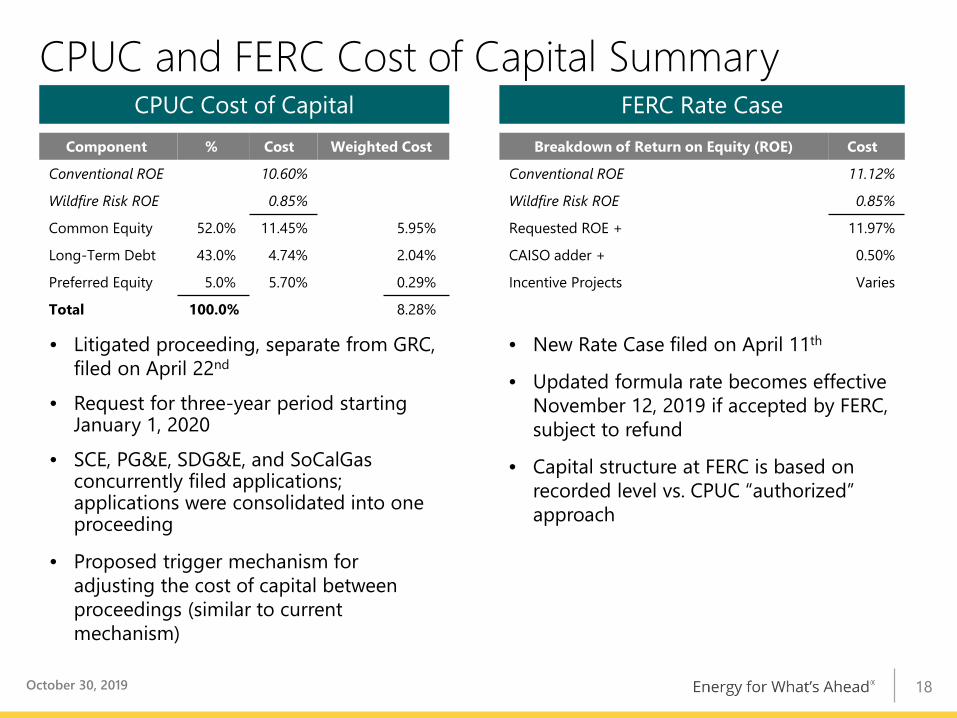
CPUC and FERC Cost of Capital Summary
bull Litigated proceeding separate from GRC filed on April 22nd
bull Request for three-year period starting January 1 2020
bull SCE PGampE SDGampE and SoCalGas concurrently filed applications applications were consolidated into one proceeding
bull Proposed trigger mechanism for adjusting the cost of capital between proceedings (similar to current mechanism)
CPUC Cost of Capital FERC Rate Case
bull New Rate Case filed on April 11th
bull Updated formula rate becomes effective November 12 2019 if accepted by FERC subject to refund
bull Capital structure at FERC is based on recorded level vs CPUC ldquoauthorizedrdquo approach
Component Cost Weighted Cost
Conventional ROE 1060
Wildfire Risk ROE 085
Common Equity 520 1145 595
Long-Term Debt 430 474 204
Preferred Equity 50 570 029
Total 1000 828
Breakdown of Return on Equity (ROE) Cost
Conventional ROE 1112
Wildfire Risk ROE 085
Requested ROE + 1197
CAISO adder + 050
Incentive Projects Varies
October 30 2019 18
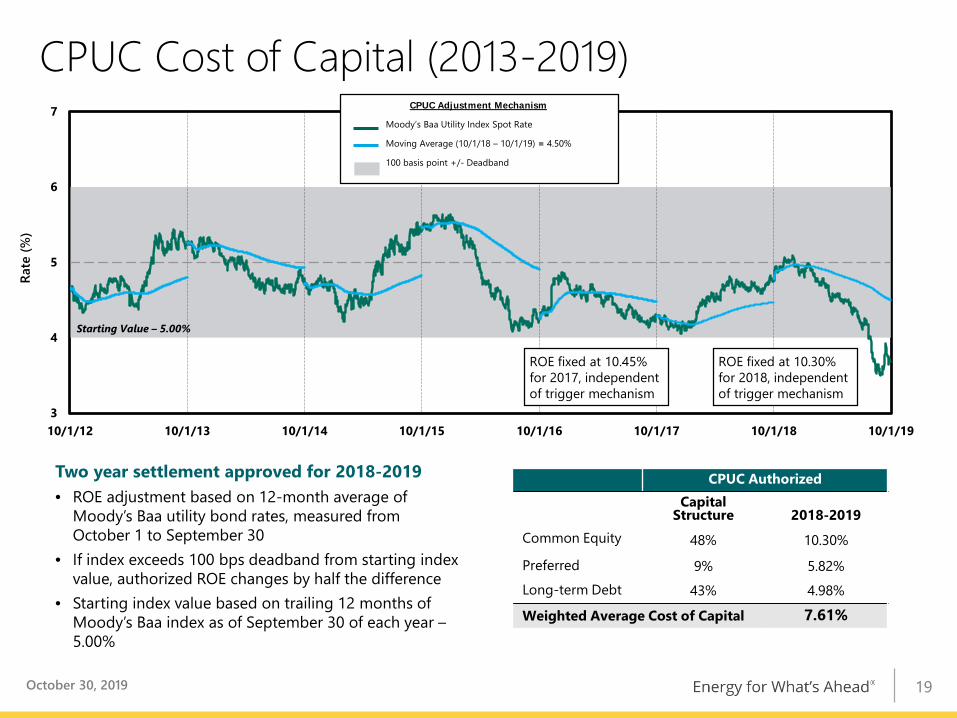
CPUC Cost of Capital (2013-2019)
Two year settlement approved for 2018-2019bull ROE adjustment based on 12-month average of
Moodyrsquos Baa utility bond rates measured from October 1 to September 30
bull If index exceeds 100 bps deadband from starting index value authorized ROE changes by half the difference
bull Starting index value based on trailing 12 months of Moodyrsquos Baa index as of September 30 of each year ndash500
CPUC Authorized Capital
Structure 2018-2019Common Equity 48 1030
Preferred 9 582Long-term Debt 43 498
Weighted Average Cost of Capital 761
October 30 2019 19
3
4
5
6
7
10112 10113 10114 10115 10116 10117 10118 10119
Rate
()
Starting Value ndash 500
CPUC Adjustment Mechanism
Moodyrsquos Baa Utility Index Spot Rate
Moving Average (10118 ndash 10119) = 450
100 basis point +- Deadband
ROE fixed at 1030 for 2018 independent of trigger mechanism
ROE fixed at 1045 for 2017 independent of trigger mechanism
SCE Distribution System Investments
1 Deferrals required with infrastructure replacement load growth and grid modernization programs2 Other includes among other things grid modernization emergency management customer requested system modifications and transportation electrification programsNote Forecast based on 2021 GRC request levels
Distribution Trendsbull Capital expenditures for certain programs deferred over
next five years to support reallocation of distribution resources to wildfire mitigation1 historical program funding levels will be reinstated in subsequent GRC periods in order to resume trajectory towards equilibrium replacement rate
bull Distribution grid requires upgrades to circuit capacity automation and control systems to support various grid resiliency and reliability objectives as well as increased use of distributed energy resources
2019 ndash 2023 Capital Spending Forecast for Distribution2 - $208 billion
2019-2023 Capital Spending Driversbull Automation of distribution circuitsbull Pole replacements bull Load growth upgradesbull Cable and overhead conductor replacementsbull Preventive and breakdown maintenancebull Circuit breaker transformer bank and relay
replacementsupgradesbull New Service Connections
October 30 2019
Load Growth
New Service Connections
Infrastructure Replacement
General Plant
Other
Wildfire
20
Charge Ready Bridge Funding and 2
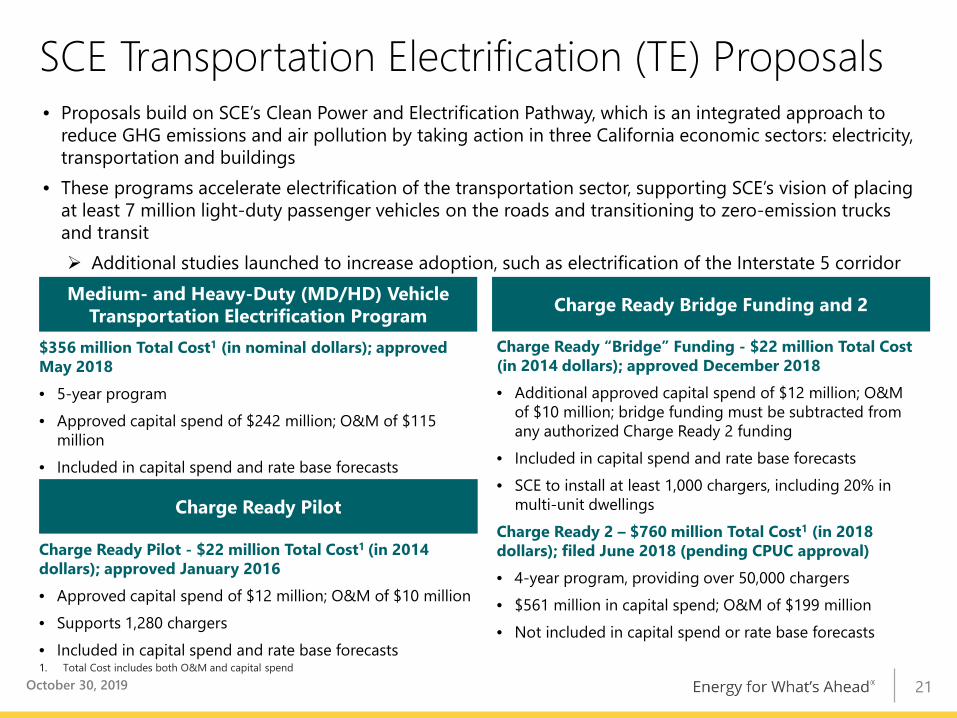
SCE Transportation Electrification (TE) Proposalsbull Proposals build on SCErsquos Clean Power and Electrification Pathway which is an integrated approach to
reduce GHG emissions and air pollution by taking action in three California economic sectors electricity transportation and buildings
bull These programs accelerate electrification of the transportation sector supporting SCErsquos vision of placing at least 7 million light-duty passenger vehicles on the roads and transitioning to zero-emission trucks and transit Additional studies launched to increase adoption such as electrification of the Interstate 5 corridorMedium- and Heavy-Duty (MDHD) Vehicle
Transportation Electrification Program
Charge Ready Pilot - $22 million Total Cost1 (in 2014 dollars) approved January 2016bull Approved capital spend of $12 million OampM of $10 millionbull Supports 1280 chargersbull Included in capital spend and rate base forecasts
$356 million Total Cost1 (in nominal dollars) approved May 2018 bull 5-year programbull Approved capital spend of $242 million OampM of $115
millionbull Included in capital spend and rate base forecasts
1 Total Cost includes both OampM and capital spend
Charge Ready ldquoBridgerdquo Funding - $22 million Total Cost (in 2014 dollars) approved December 2018bull Additional approved capital spend of $12 million OampM
of $10 million bridge funding must be subtracted from any authorized Charge Ready 2 funding
bull Included in capital spend and rate base forecastsbull SCE to install at least 1000 chargers including 20 in
multi-unit dwellingsCharge Ready 2 ndash $760 million Total Cost1 (in 2018 dollars) filed June 2018 (pending CPUC approval)bull 4-year program providing over 50000 chargersbull $561 million in capital spend OampM of $199 millionbull Not included in capital spend or rate base forecasts
Charge Ready Pilot
October 30 2019 21
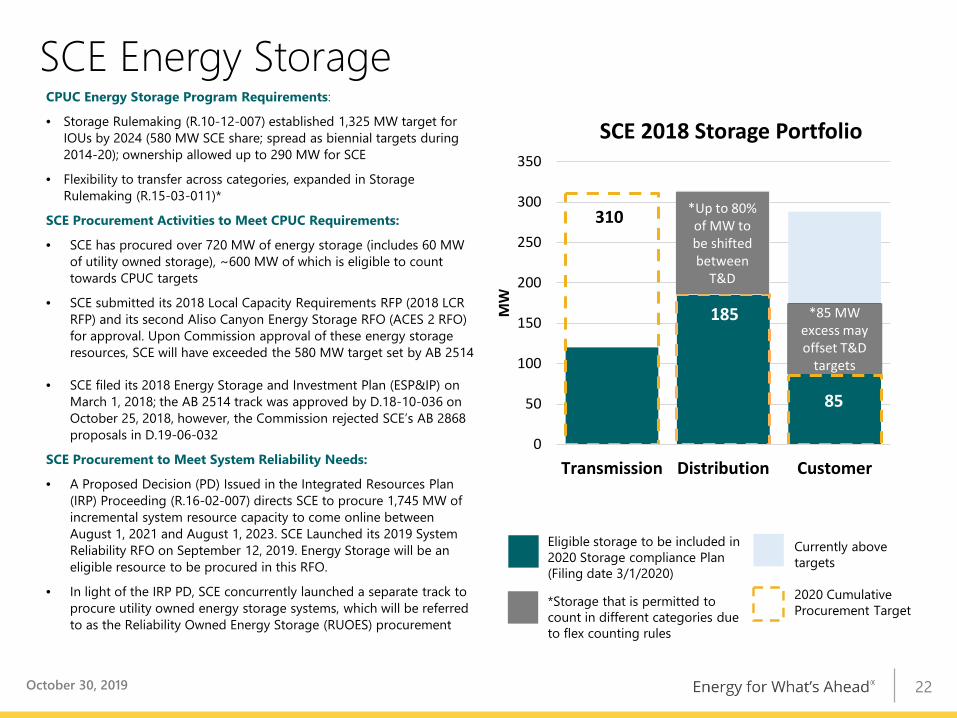
310
185
85
0
50
100
150
200
250
300
350
Transmission Distribution Customer
MW
SCE 2018 Storage Portfolio
Up to 80 of MW to be shifted between
TampD
85 MWexcess may offset TampD
targets
Eligible storage to be included in 2020 Storage compliance Plan (Filing date 312020)
Storage that is permitted to count in different categories due to flex counting rules
Currently above targets
2020 Cumulative Procurement Target
SCE Energy StorageCPUC Energy Storage Program Requirements
bull Storage Rulemaking (R10-12-007) established 1325 MW target for IOUs by 2024 (580 MW SCE share spread as biennial targets during 2014-20) ownership allowed up to 290 MW for SCE
bull Flexibility to transfer across categories expanded in Storage Rulemaking (R15-03-011)
SCE Procurement Activities to Meet CPUC Requirements
bull SCE has procured over 720 MW of energy storage (includes 60 MW of utility owned storage) ~600 MW of which is eligible to count towards CPUC targets
bull SCE submitted its 2018 Local Capacity Requirements RFP (2018 LCR RFP) and its second Aliso Canyon Energy Storage RFO (ACES 2 RFO) for approval Upon Commission approval of these energy storage resources SCE will have exceeded the 580 MW target set by AB 2514
bull SCE filed its 2018 Energy Storage and Investment Plan (ESPampIP) on March 1 2018 the AB 2514 track was approved by D18-10-036 on October 25 2018 however the Commission rejected SCErsquos AB 2868 proposals in D19-06-032
SCE Procurement to Meet System Reliability Needs
bull A Proposed Decision (PD) Issued in the Integrated Resources Plan (IRP) Proceeding (R16-02-007) directs SCE to procure 1745 MW of incremental system resource capacity to come online between August 1 2021 and August 1 2023 SCE Launched its 2019 System Reliability RFO on September 12 2019 Energy Storage will be an eligible resource to be procured in this RFO
bull In light of the IRP PD SCE concurrently launched a separate track to procure utility owned energy storage systems which will be referred to as the Reliability Owned Energy Storage (RUOES) procurement
October 30 2019 22
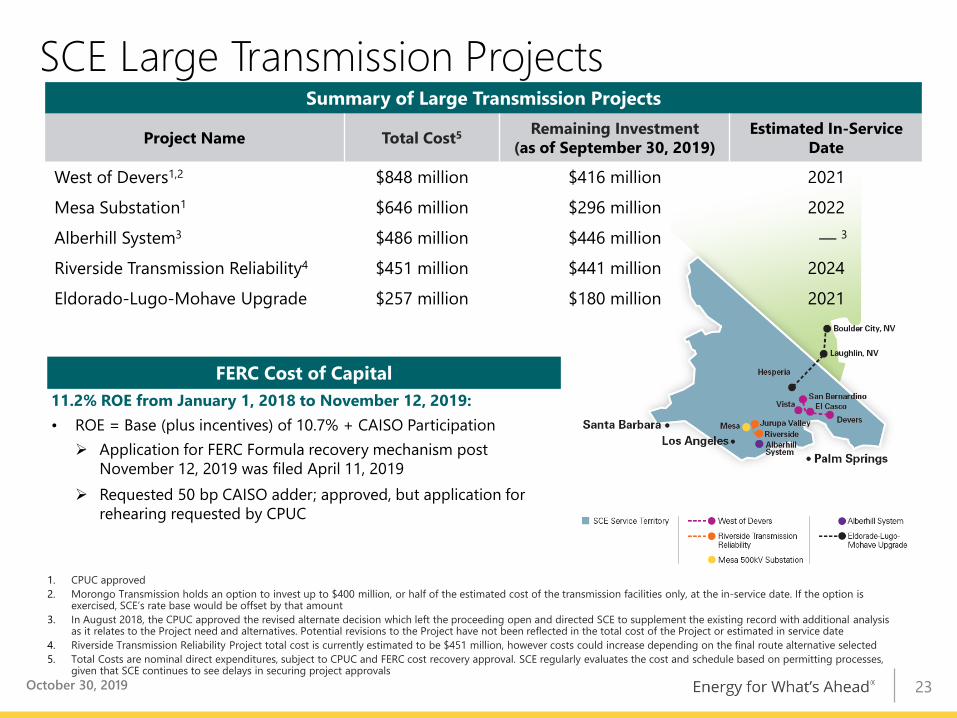
SCE Large Transmission Projects
FERC Cost of Capital112 ROE from January 1 2018 to November 12 2019bull ROE = Base (plus incentives) of 107 + CAISO Participation Application for FERC Formula recovery mechanism post
November 12 2019 was filed April 11 2019 Requested 50 bp CAISO adder approved but application for
rehearing requested by CPUC
Summary of Large Transmission Projects
Project Name Total Cost5 Remaining Investment(as of September 30 2019)
Estimated In-ServiceDate
West of Devers12 $848 million $416 million 2021
Mesa Substation1 $646 million $296 million 2022
Alberhill System3 $486 million $446 million mdash 3
Riverside Transmission Reliability4 $451 million $441 million 2024
Eldorado-Lugo-Mohave Upgrade $257 million $180 million 2021
1 CPUC approved2 Morongo Transmission holds an option to invest up to $400 million or half of the estimated cost of the transmission facilities only at the in-service date If the option is
exercised SCErsquos rate base would be offset by that amount 3 In August 2018 the CPUC approved the revised alternate decision which left the proceeding open and directed SCE to supplement the existing record with additional analysis
as it relates to the Project need and alternatives Potential revisions to the Project have not been reflected in the total cost of the Project or estimated in service date 4 Riverside Transmission Reliability Project total cost is currently estimated to be $451 million however costs could increase depending on the final route alternative selected5 Total Costs are nominal direct expenditures subject to CPUC and FERC cost recovery approval SCE regularly evaluates the cost and schedule based on permitting processes
given that SCE continues to see delays in securing project approvalsOctober 30 2019 23
SCE Operational Excellence
Top Quartilebull Safetybull Reliabilitybull Customer servicebull Cost efficiency
Optimizebull Capital productivitybull Purchased power costbull Digitization
High performing continuous improvement culture
Defining Excellence Measuring Excellence
bull Employee and public safety metrics
bull System performance and reliability (SAIDI and SAIFI)
bull Customer satisfaction calculation based on internal voice-of-customer surveys
bull OampM cost per customerbull Reduce system rate growth
with OampM purchased power cost reductions
Ongoing Operational Excellence
Efforts
October 30 2019 24
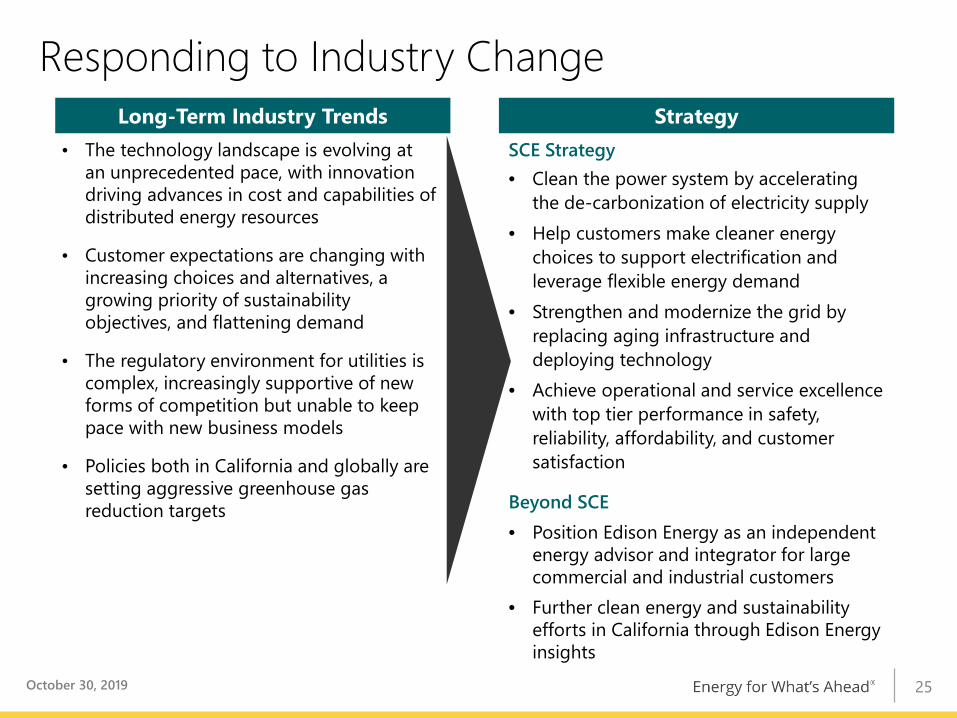
Responding to Industry ChangeLong-Term Industry Trends Strategy
bull The technology landscape is evolving at an unprecedented pace with innovation driving advances in cost and capabilities of distributed energy resources
bull Customer expectations are changing with increasing choices and alternatives a growing priority of sustainability objectives and flattening demand
bull The regulatory environment for utilities is complex increasingly supportive of new forms of competition but unable to keep pace with new business models
bull Policies both in California and globally are setting aggressive greenhouse gas reduction targets
SCE Strategybull Clean the power system by accelerating
the de-carbonization of electricity supplybull Help customers make cleaner energy
choices to support electrification and leverage flexible energy demand
bull Strengthen and modernize the grid by replacing aging infrastructure and deploying technology
bull Achieve operational and service excellence with top tier performance in safety reliability affordability and customer satisfaction
Beyond SCEbull Position Edison Energy as an independent
energy advisor and integrator for large commercial and industrial customers
bull Further clean energy and sustainability efforts in California through Edison Energy insights
October 30 2019 25
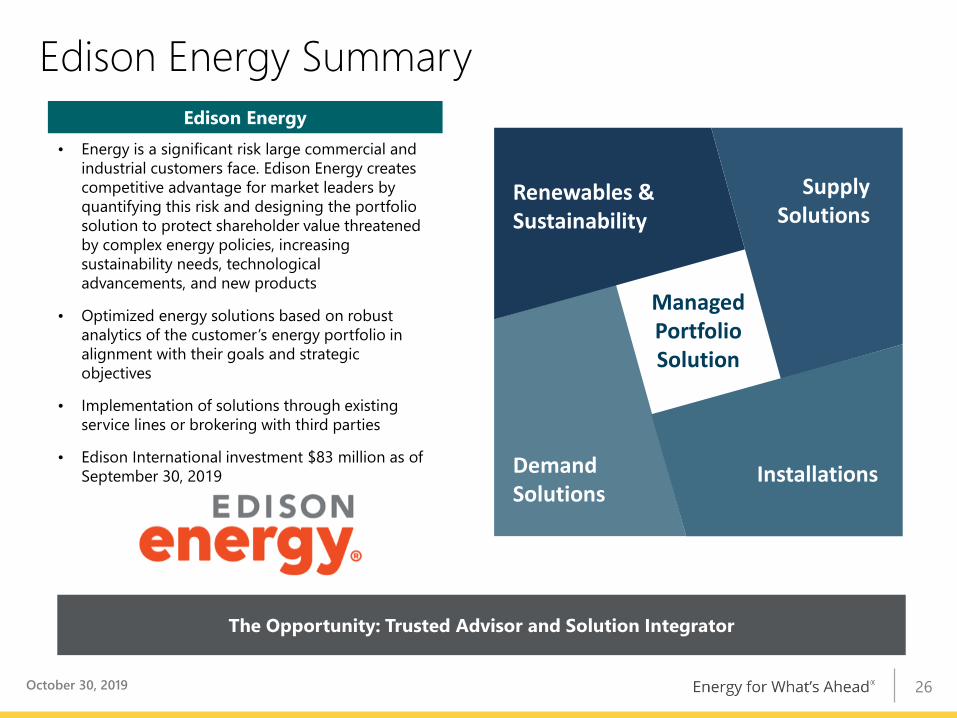
bull Energy is a significant risk large commercial and industrial customers face Edison Energy creates competitive advantage for market leaders by quantifying this risk and designing the portfolio solution to protect shareholder value threatened by complex energy policies increasing sustainability needs technological advancements and new products
bull Optimized energy solutions based on robust analytics of the customerrsquos energy portfolio in alignment with their goals and strategic objectives
bull Implementation of solutions through existing service lines or brokering with third parties
bull Edison International investment $83 million as of September 30 2019
Edison Energy
Edison Energy Summary
The Opportunity Trusted Advisor and Solution Integrator
Managed Portfolio Solution
Renewables amp Sustainability
Supply Solutions
Demand Solutions
Installations
October 30 2019 26
27
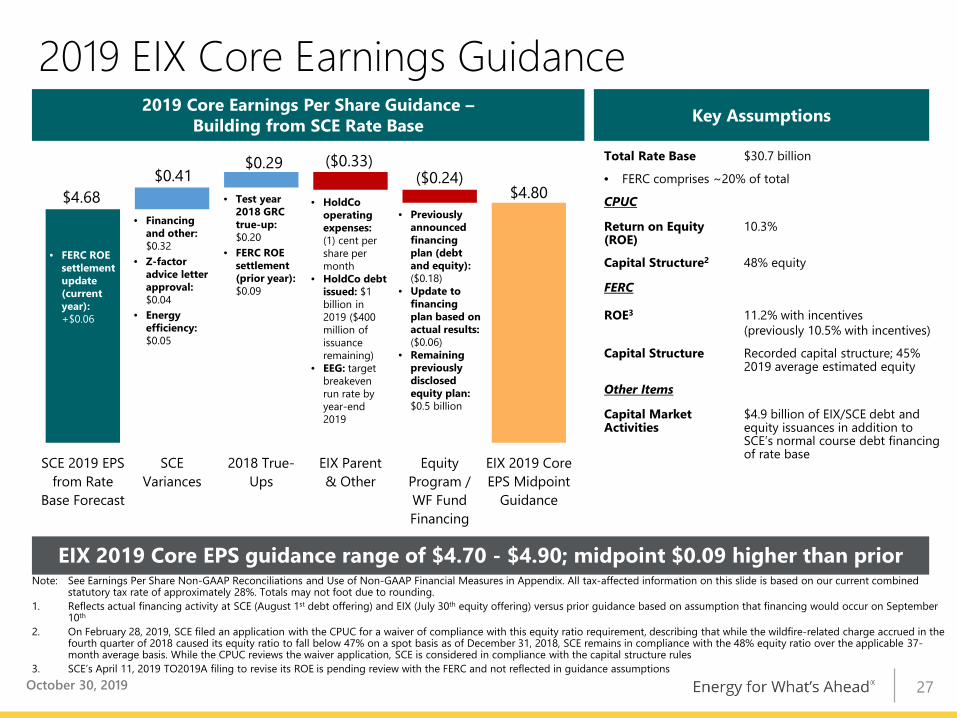
Total Rate Base $307 billion
bull FERC comprises ~20 of total
CPUC
Return on Equity (ROE)
103
Capital Structure2 48 equity
FERC
ROE3 112 with incentives(previously 105 with incentives)
Capital Structure Recorded capital structure 45 2019 average estimated equity
Other Items
Capital Market Activities
$49 billion of EIXSCE debt and equity issuances in addition to SCErsquos normal course debt financing of rate base
$468 $480
($033)($024)$041
$029
SCE 2019 EPSfrom Rate
Base Forecast
SCEVariances
2018 True-Ups
EIX Parentamp Other
EquityProgram WF FundFinancing
EIX 2019 CoreEPS Midpoint
Guidance
bull Financing and other$032
bull Z-factor advice letter approval $004
bull Energy efficiency $005
2019 Core Earnings Per Share Guidance ndashBuilding from SCE Rate Base
bull HoldCo operating expenses (1) cent per share per month
bull HoldCo debt issued $1 billion in 2019 ($400 million of issuance remaining)
bull EEG target breakeven run rate by year-end 2019
EIX 2019 Core EPS guidance range of $470 - $490 midpoint $009 higher than prior
Key Assumptions
Note See Earnings Per Share Non-GAAP Reconciliations and Use of Non-GAAP Financial Measures in Appendix All tax-affected information on this slide is based on our current combined statutory tax rate of approximately 28 Totals may not foot due to rounding
1 Reflects actual financing activity at SCE (August 1st debt offering) and EIX (July 30th equity offering) versus prior guidance based on assumption that financing would occur on September 10th
2 On February 28 2019 SCE filed an application with the CPUC for a waiver of compliance with this equity ratio requirement describing that while the wildfire-related charge accrued in the fourth quarter of 2018 caused its equity ratio to fall below 47 on a spot basis as of December 31 2018 SCE remains in compliance with the 48 equity ratio over the applicable 37-month average basis While the CPUC reviews the waiver application SCE is considered in compliance with the capital structure rules
3 SCErsquos April 11 2019 TO2019A filing to revise its ROE is pending review with the FERC and not reflected in guidance assumptions
2019 EIX Core Earnings Guidance
bull Test year 2018 GRC true-up $020
bull FERC ROE settlement (prior year)$009
bull Previously announced financing plan (debt and equity) ($018)
bull Update to financing plan based on actual results ($006)
bull Remaining previously disclosed equity plan $05 billion
1 2019 dividend annualized based on December 6 2018 declaration
Fifteen Consecutive Years of Dividend Growth
Target dividend growth within target payout ratio of 45-55 of SCErsquos earnings
1
October 30 2019 28
Appendix
October 30 2019 29
EIXrsquos 2018 Sustainability Report Highlights
Edison Energy is not the same company as Southern California Edison the utility and Edison Energy is not regulated by the California Public Utilities Commission Cumulative duration (in minutes) of sustained repair outages lasting longer than five minutes experienced by the average customer in a year (including major event days) In February 2019 the EIX board approved a $3 million donation to the Edison International Wildfire Assistance Fund to enhance community resiliency and wildfire prevention and
mitigation This affects the 2019 data year and is not reflected here
October 30 2019
ldquoAt Edison International we are leading the transformation of the electric power industry toward a clean energy future by focusing on opportunities in clean energy efficient electrification the grid of the future and customer choice As we pursue this vision sustainability remains at the core of who we are and what we dordquo ndash Pedro Pizarro Edison International CEO
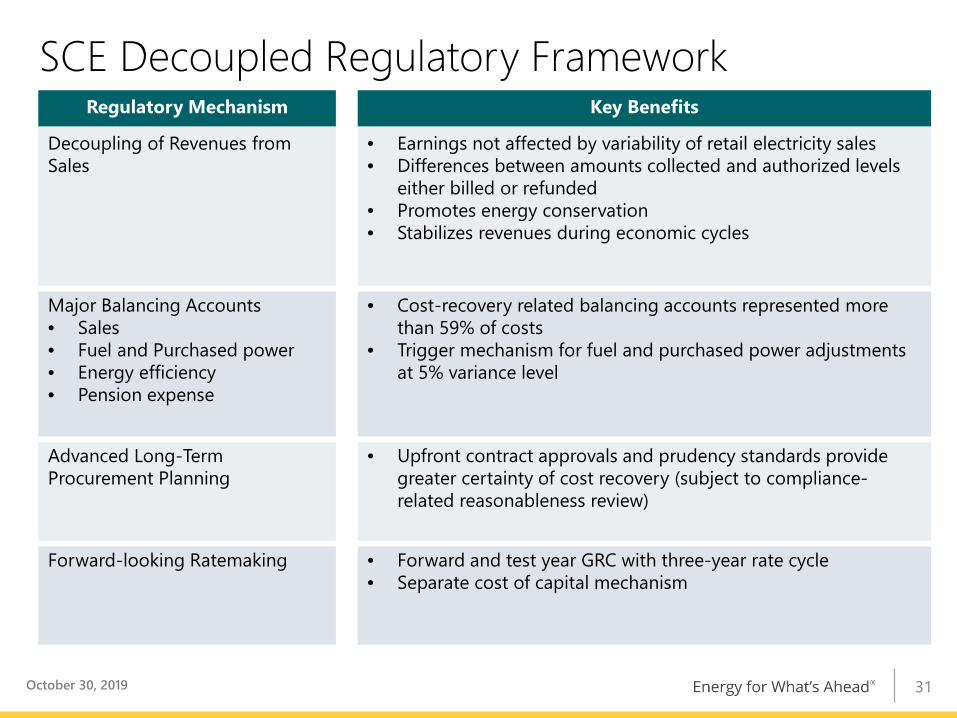
bull Earnings not affected by variability of retail electricity salesbull Differences between amounts collected and authorized levels
either billed or refundedbull Promotes energy conservationbull Stabilizes revenues during economic cycles
Major Balancing Accountsbull Salesbull Fuel and Purchased powerbull Energy efficiencybull Pension expense
bull Cost-recovery related balancing accounts represented more than 59 of costs
bull Trigger mechanism for fuel and purchased power adjustments at 5 variance level
Advanced Long-TermProcurement Planning
bull Upfront contract approvals and prudency standards provide greater certainty of cost recovery (subject to compliance-related reasonableness review)
Forward-looking Ratemaking bull Forward and test year GRC with three-year rate cycle bull Separate cost of capital mechanism
October 30 2019 31
SCE Historical Capital Expenditures($ billions)
$40 $39
$35$38
$44
2014 2015 2016 2017 2018
October 30 2019 32
Credit Ratings Summary
Date of Report July 26 2019 July 29 2019 July 29 2019
Edison InternationalCorporate Outlook BBBStable Baa3Stable BBB-StableSenior Unsecured BBB- Baa3 BBB-Commercial Paper A-2 P-3 F3
Southern California EdisonCorporate Outlook BBBStable Baa2Stable BBB-StableFirst Mortgage Bonds A- A3 BBB+Senior Unsecured BBB Baa2 BBBPreferred Securities BB+ Ba1 BB+Commercial Paper A-2 P-2 F3
FitchMoodyrsquosSampP
October 30 2019 33
4
ampCalibriRegularFINANCIAL AND STATISTICAL REPORTampCalibriRegularampA
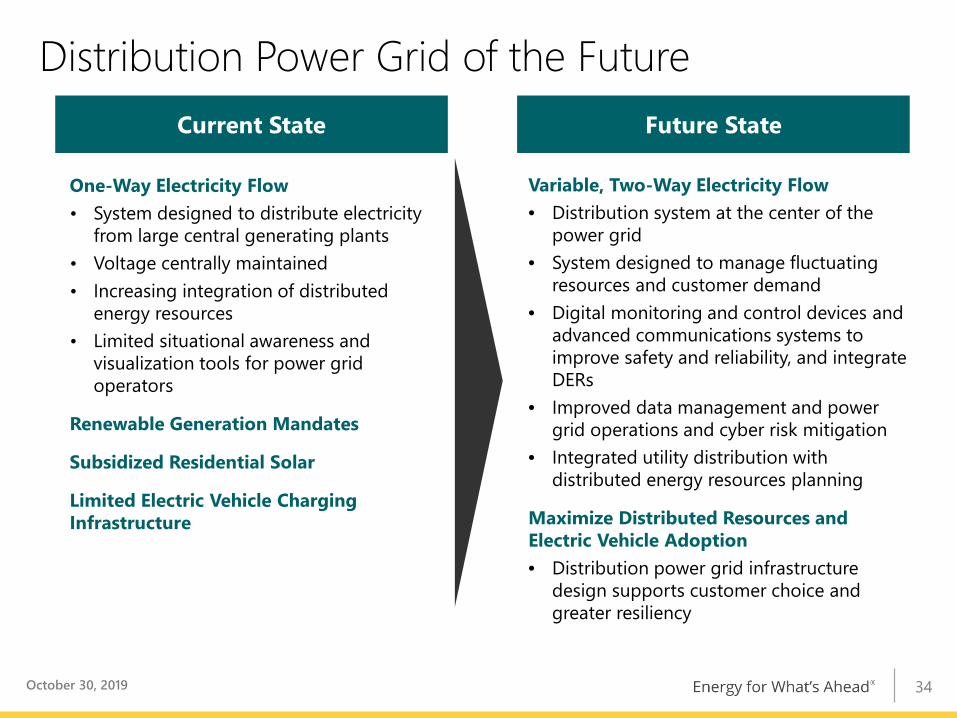
Distribution Power Grid of the Future
One-Way Electricity Flowbull System designed to distribute electricity
from large central generating plantsbull Voltage centrally maintainedbull Increasing integration of distributed
energy resourcesbull Limited situational awareness and
visualization tools for power grid operators
Renewable Generation Mandates
Subsidized Residential Solar
Limited Electric Vehicle Charging Infrastructure
Variable Two-Way Electricity Flowbull Distribution system at the center of the
power gridbull System designed to manage fluctuating
resources and customer demand bull Digital monitoring and control devices and
advanced communications systems to improve safety and reliability and integrate DERs
bull Improved data management and power grid operations and cyber risk mitigation
bull Integrated utility distribution with distributed energy resources planning
Maximize Distributed Resources and Electric Vehicle Adoptionbull Distribution power grid infrastructure
design supports customer choice and greater resiliency
Current State Future State
October 30 2019 34
SCE Customer Demand Trends
Note See Edison International Financial and Statistical Reports for 2017 for further information
Kilowatt-Hour Sales (millions of kWh) 2014 2015 2016 2017 2018
Residential 30027 30093 29579 30221 29865
Commercial 42004 42396 42189 42514 42369
Industrial 8392 7623 7162 6659 6786
Public authorities 4975 4795 4715 4711 4510
Agricultural and other 2019 1950 1803 1498 1745
Subtotal 87416 86857 85448 85602 85276
Resale 1308 1080 1794 1568 1867
Total Kilowatt-Hour Sales 88725 87937 87242 87170 87143
Total Number of Customers 5005401 5033330 5060528 5094818 5126985
Number of New Connections 29879 31653 38076 39621 39633
Area Peak Demand (MW) 23055 23079 23091 23508 23766
October 30 2019 35
SCE Bundled Revenue Requirement
Note Rates in effect as of July 26 2019 Represents bundled service which excludes Direct AccessCCA customers that do not receive generation services from SCE
SCE Systemwide Average Rate History (centkWh)
2010 2011 2012 2013 2014 2015 2016 2017 2018 2019
143 141 143 159 167 162 148 157 160 159
Fuel amp Purchased Power(47)
Distribution(38)
Transmission (8)
Generation(8)
Other (-1)
2019 Bundled Revenue
Requirement
$millions centkWh
Fuel amp Purchased Power ndash includes CDWR Bond Charge
4422 74
Distribution ndash poles wires substations service centers Edison SmartConnectreg
3628 61
Generation ndash owned generation investment and OampM 708 12
Transmission ndash greater than 220kV 789 13
Other ndash CPUC and legislative public purpose programs system reliability investments nuclear decommissioning and prior-year over collections
(116) (01)
Total Bundled Revenue Requirement ($millions) $9431
divide Bundled kWh (millions) 59396
= Bundled Systemwide Average Rate (centkWh) 159cent
October 30 2019 36
37
97cent
159cent
80cent
100cent
120cent
140cent
160cent
180cent
200cent
220cent
1990
1991
1992
1993
1994
1995
1996
1997
1998
1999
2000
2001
2002
2003
2004
2005
2006
2007
2008
2009
2010
2011
2012
2013
2014
2015
2016
2017
2018
2019
195cent
Rates reduced due to the implementation of 1) the SONGS Revised Settlement including NEIL insurance benefits 2) lower fuel amp purchased power costs and 3) a lower 2015 GRC revenue requirement that includes flow-through tax benefits
centkWh
System Average Rate Historical Growth
SCErsquos system average rate has grown less than inflation over the last 29 years
SCE System Average RateLos Angeles Area Inflation
Comparative System Average Rates
Delta to SCESCE 159cent --
PGampE 211cent1 33
SDGampE 246cent1 55
CAGR29-yr
(lsquo90-rsquo19)20-yr
(lsquo99-rsquo19)10-yr
(lsquo09-19)17 26 1124 25 20
Energy Crisis and return to normal
Higher gas price forecast post-Katrina leads to higher rates with subsequent refund of over collection
Delay in 2012 GRC leads to shorter ramp-up of rate increase
1 PGampE Advice 5644-E effective October 1 SDGampE Advice 3377-E effective June 1
October 30 2019
Data
SCE System Average Rate
1990199119921993199419951996199719981999200020012002200320042005200620072008200920102011201220132014201520162017201820199699999999999999310310610310510710110196969614214212412212614713913714314314114315916715940876786458386148350382761769171566871495475337116159CPI Los Angeles-Long Beach-Anaheim CA199019911992199319941995199619971998199920002001200220032004200520062007200820092010201120122013201420152016201720182019202096999999999999993100974239450441131046212585868498310726876840039228108738285083414611104041339548576811242695044160916114205839057899881158478900883218511856679342492612122475588812561061265926153091265513010279685966582133476140824337041379322865554462144095927379783561502417198233561515516495767909655160640840897938551593635512757601816127380397448466165581867639842851689511064769380217077830471050007173082233194307481746514628312063517794555998527898182917523920509811898939005269867419453007660169238SAR CPI (old)1990199119921993199419951996199719981999200020012002200320042005200620072008200920102011201220132014201520162017201820199699999999999999310108935518848128104164104853626311072574143759422111004139294598572113128515849244651164507302761853711917284265578923121016455131068581236705147011944127834109318192141314347216021390513353198545827113660054850437767140244467121649041449648574526591614963575483132515393112443397234159803525097292715929158237134114161898499904328691669815498437507617045100580396491729508329612907517573561579182243175943857388863061777863624593457518198880904395583186584452388557219152742489955948
195cent
CPI Workbook
image1png
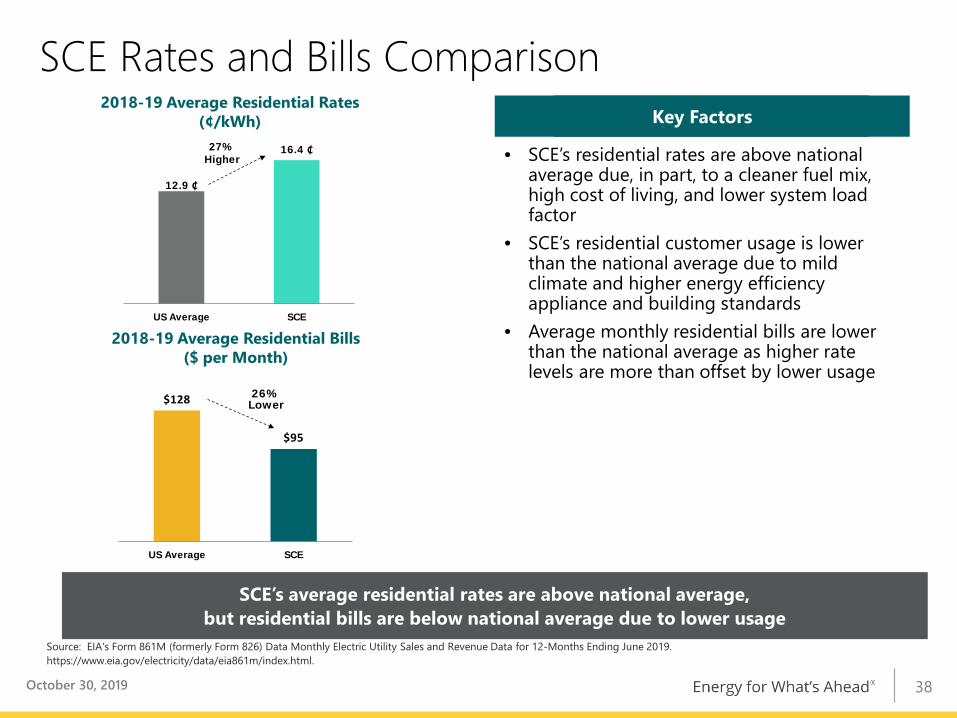
129 ₵
164 ₵
US Average SCE
27 Higher
SCE Rates and Bills Comparison
SCErsquos average residential rates are above national averagebut residential bills are below national average due to lower usage
bull SCErsquos residential rates are above national average due in part to a cleaner fuel mix high cost of living and lower system load factor
bull SCErsquos residential customer usage is lower than the national average due to mild climate and higher energy efficiency appliance and building standards
bull Average monthly residential bills are lower than the national average as higher rate levels are more than offset by lower usage
Key FactorsKey Factors
Source EIAs Form 861M (formerly Form 826) Data Monthly Electric Utility Sales and Revenue Data for 12-Months Ending June 2019 httpswwweiagovelectricitydataeia861mindexhtml
2018-19 Average Residential Rates (centkWh)
2018-19 Average Residential Bills ($ per Month)
$128
$95
US Average SCE
26 Lower
October 30 2019 38
Sheet1
Sheet1
129 ₵
164 ₵
Sheet2
27 Higher
Sheet3
Sheet1
Sheet1
$128
Sheet2
26 Lower
Sheet3
bull Assembly Bill 1171 permits cities and counties and Joint Powers Agencies (JPAs) to act as CCAs to purchase and sell electricity on behalf of the utility customers within their jurisdiction
bull An Order Instituting Rulemaking (OIR R17-06-026) was opened on June 29 2017 to review revise and consider alternatives to the ldquoPower Charge Indifference Adjustmentrdquo or PCIA The PCIA allocates a proportional share of above-market costs of SCErsquos
energy procurement portfolio to departing load customers to ensure remaining bundled service customers are indifferent
October 11 2018 Commission decision changes PCIA methodology and has substantially addressed the historical subsidy to departing load that materialized when renewables market prices declined over the past 4 yearso Decision also established a Phase 2 which is addressing utility
portfolio optimization PCIA ldquopre-paymentrdquo options for entities and individual departing load customers and implementation of the ldquotrue-uprdquo process for Resource Adequacy (RA) and Renewable Energy Credits (RECs) costs
o A Phase 2 final decision on the benchmark and true-up process was approved on October 10 2019 with the other Phase 2 activities to continue into 2020
bull On February 8 2018 the Commission approved Resolution E-4907 requiring CCAs to demonstrate compliance with annual Resource Adequacy (RA) requirements prior to commencing operations
bull Existing Direct Access and CCA load is expected to be ~35 of SCErsquos total load by the end of 2019
Investor-Owned Utility (IOU)
Community Choice Aggregator (CCA)
Community Choice Aggregator (CCA) Overview
Approximately 40 of SCErsquos bundled service load could be part of a CCA or Direct Access by the end of 2020
October 30 2019 39
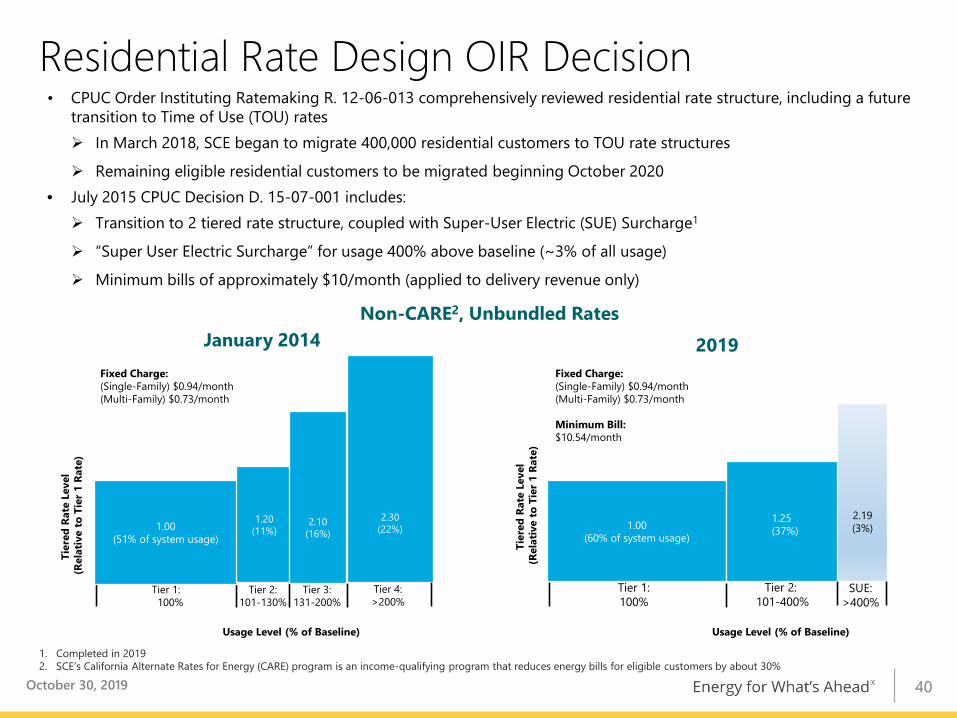
bull CPUC Order Instituting Ratemaking R 12-06-013 comprehensively reviewed residential rate structure including a future transition to Time of Use (TOU) rates In March 2018 SCE began to migrate 400000 residential customers to TOU rate structures
Remaining eligible residential customers to be migrated beginning October 2020bull July 2015 CPUC Decision D 15-07-001 includes Transition to 2 tiered rate structure coupled with Super-User Electric (SUE) Surcharge1
ldquoSuper User Electric Surchargerdquo for usage 400 above baseline (~3 of all usage)
Minimum bills of approximately $10month (applied to delivery revenue only)
January 2014 2019
100(60 of system usage)
219(3)
Tier 1100
Tier 2 101-400
SUEgt400
125(37)
Usage Level ( of Baseline)Usage Level ( of Baseline)
1 Completed in 20192 SCErsquos California Alternate Rates for Energy (CARE) program is an income-qualifying program that reduces energy bills for eligible customers by about 30
Winter Weekdays 8am-9pm Weekdays and Weekends 4-9pm
Off-Peak Summer Weekdays 11pm-8amWeekends All
Weekdays and Weekends All except 4-9pm
Winter Weekdays 9pm-8amWeekends All
Weekdays and Weekends 9pm-8am
Super Off-Peak Winter NA Weekdays and Weekends 8am-4pm
New Time-of-Use (TOU) Periods
bull On March 1 2019 SCE changed its basic TOU pricing period definition for the first time in over 30 years
bull Abundant mid-day renewable energy lowers prices from 8am-4pm (October - June)
bull Highest cost period is now 4pm-9pm all-days1
1 TOU pricing periods defined for non-residential customers per CPUC Decision D18-07-006 Similar residential TOU definitions were filed by SCE in A17-12-012
bull 998 solar projectsbull 320445 residential (71 of all residential customers) ndash 1756 MW bull 7333 non-residential ndash 977 MW bull Approximately 4775887 MWhyear generated
SCE Net Metering Statistics (919)
0
5
10
15
20
25
30
35
40
0
1000
2000
3000
4000
5000
6000
7000
2013 2014 2015 2016 2017 2018 2019
MW
Inst
alle
d
Num
ber o
f Sol
ar R
esid
entia
l Ins
talla
tions
Installations MW
July 1 2017bull Official start of NEM successor tariff customers are subject to
Mandatory TOU rate Non-bypassable charges Application fees
July 31 2017bull Residential customers who meet this deadline are grandfathered for
current TOU periods for maximum of 5 years (10 for non-residential)September 9 2017bull Smart Inverters required on all solar installationsJuly 25 2018bull Smart Inverters with Reactive Power Priority required on all solar
installationsNear Term Outlookbull Combination of a flatter tiered rate and the mandatory TOU NEM 20
rate structure has helped reduce the per customer cost shift further efforts to reduce the shift through new TOU pricing periods
bull Commission to revisit NEM Successor Tariff by July 2020 to evaluate the existing NEM tariffs and consider the development and adoption of successor tariffs
Key Dates
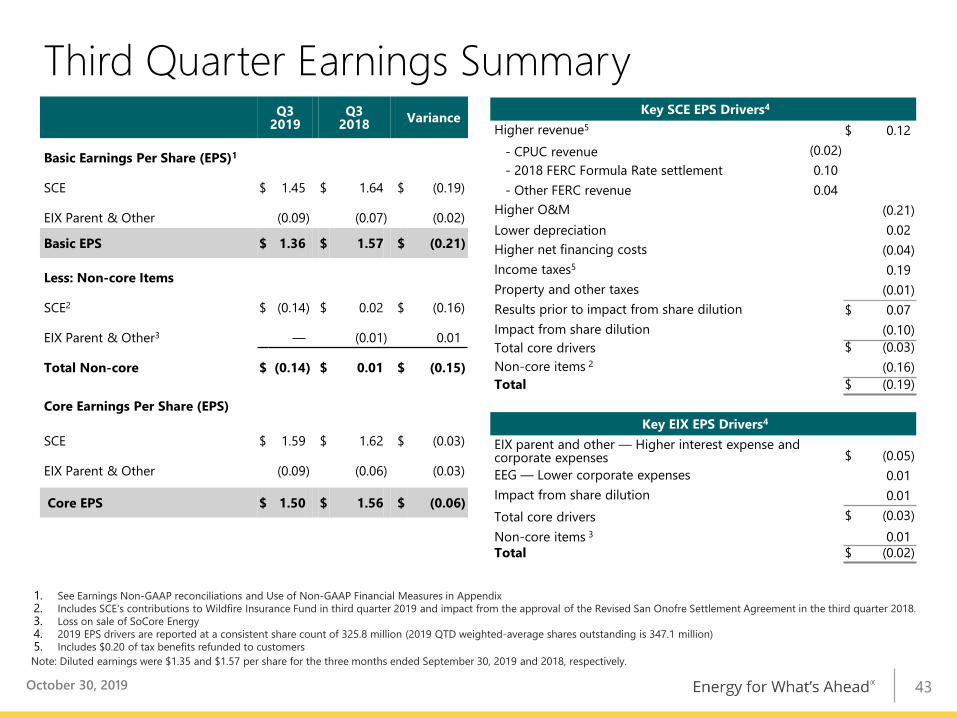
Third Quarter Earnings Summary
October 30 2019
Q32019
Q32018 Variance
Basic Earnings Per Share (EPS)1
SCE $ 145 $ 164 $ (019)
EIX Parent amp Other (009) (007) (002)
Basic EPS $ 136 $ 157 $ (021)
Less Non-core Items
SCE2 $ (014) $ 002 $ (016)
EIX Parent amp Other3 mdash (001) 001
Total Non-core $ (014) $ 001 $ (015)
Core Earnings Per Share (EPS)
SCE $ 159 $ 162 $ (003)
EIX Parent amp Other (009) (006) (003)
Core EPS $ 150 $ 156 $ (006)
Key SCE EPS Drivers4
Higher revenue5 $ 012- CPUC revenue (002)- 2018 FERC Formula Rate settlement 010- Other FERC revenue 004
Higher OampM (021)Lower depreciation 002Higher net financing costs (004)Income taxes5 019Property and other taxes (001)Results prior to impact from share dilution $ 007Impact from share dilution (010)Total core drivers $ (003)Non-core items 2 (016)Total $ (019)
Key EIX EPS Drivers4
EIX parent and other mdash Higher interest expense and corporate expenses $ (005)EEG mdash Lower corporate expenses 001Impact from share dilution 001Total core drivers $ (003)Non-core items 3 001Total $ (002)
1 See Earnings Non-GAAP reconciliations and Use of Non-GAAP Financial Measures in Appendix2 Includes SCEs contributions to Wildfire Insurance Fund in third quarter 2019 and impact from the approval of the Revised San Onofre Settlement Agreement in the third quarter 2018 3 Loss on sale of SoCore Energy4 2019 EPS drivers are reported at a consistent share count of 3258 million (2019 QTD weighted-average shares outstanding is 3471 million)5 Includes $020 of tax benefits refunded to customersNote Diluted earnings were $135 and $157 per share for the three months ended September 30 2019 and 2018 respectively
43
1 See Earnings Non-GAAP reconciliations and Use of Non-GAAP Financial Measures in Appendix2 Impact of 2018 GRC final decision related to impairment of utility property plant and equipment changes in allocation of deferred tax re-measurement between customers and
shareholders SCErsquos contributions to the Wildfire Insurance Fund gain from sale of nuclear fuel and impact from the approval of the Revised San Onofre Settlement Agreement3 Loss on sale of SoCore Energy and impact of hypothetical liquidation at book value (HLBV) accounting method4 2019 EPS drivers are reported at a consistent share count of 3258 million (2019 YTD weighted-average shares outstanding is 3330 million)5 Test Year 2018 GRC true-up of $020 includes revenue of $(034) OampM of $006 depreciation of $024 interest expense of $(001) property and other taxes of $001 and income taxes of
$0246 Includes $018 of tax benefits refunded to customersNote Diluted earnings were $342 and $308 per share for the nine months ended September 30 2019 and 2018 respectively
Year to Date Earnings Summary
October 30 2019
YTD 2019
YTD 2018 Variance
Basic Earnings Per Share (EPS)1
SCE $ 365 $ 343 $ 022
EIX Parent amp Other (022) (034) 012
Basic EPS $ 343 $ 309 $ 034
Less Non-core Items
SCE2 $ (030) $ 002 $ (032)
EIX Parent amp Other3 mdash (014) 014
Total Non-core $ (030) $ (012) $ (018)
Core Earnings Per Share (EPS)
SCE $ 395 $ 341 $ 054
EIX Parent amp Other (022) (020) (002)
Core EPS $ 373 $ 321 $ 052
Key SCE EPS Drivers4
Test Year 2018 GRC true-up5 $ 020Higher revenue6 055
- CPUC revenue 032- 2018 FERC Formula Rate settlement 010- FERC and other operating revenue 013
Higher OampM (026)Lower depreciation 005Higher net financing costs (012)Income taxes6 021Results prior to impact from share dilution $ 063Impact from share dilution (009)Total core drivers $ 054Non-core items2 (032)Total $ 022
Key EIX EPS Drivers4
EIX parent and other mdash Higher interest expense and corporate expenses $ (007)EEG mdash Lower corporate expenses and lower losses at the competitive business 004Impact from share dilution 001Total core drivers $ (002)Non-core items3 014Total $ 012
44
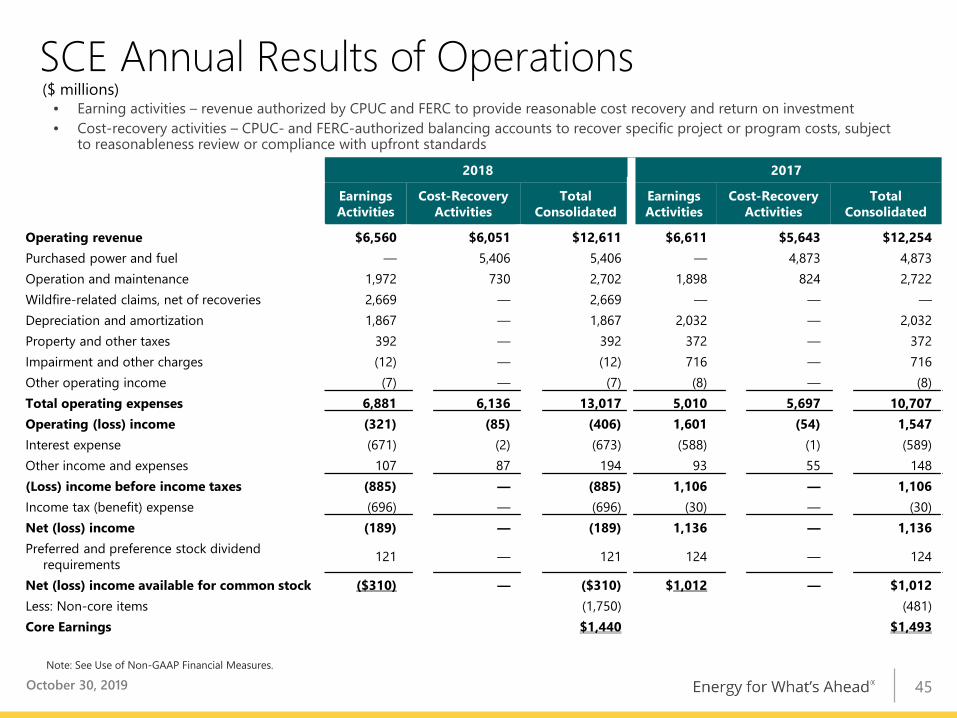
SCE Annual Results of Operationsbull Earning activities ndash revenue authorized by CPUC and FERC to provide reasonable cost recovery and return on investmentbull Cost-recovery activities ndash CPUC- and FERC-authorized balancing accounts to recover specific project or program costs subject
to reasonableness review or compliance with upfront standards
($ millions)
2018 2017
Earnings Activities
Cost-Recovery Activities
Total Consolidated
Earnings Activities
Cost-Recovery Activities
Total Consolidated
Operating revenue $6560 $6051 $12611 $6611 $5643 $12254Purchased power and fuel mdash 5406 5406 mdash 4873 4873Operation and maintenance 1972 730 2702 1898 824 2722Wildfire-related claims net of recoveries 2669 mdash 2669 ― ― ―Depreciation and amortization 1867 mdash 1867 2032 mdash 2032Property and other taxes 392 mdash 392 372 mdash 372Impairment and other charges (12) mdash (12) 716 mdash 716Other operating income (7) mdash (7) (8) mdash (8)Total operating expenses 6881 6136 13017 5010 5697 10707Operating (loss) income (321) (85) (406) 1601 (54) 1547Interest expense (671) (2) (673) (588) (1) (589)Other income and expenses 107 87 194 93 55 148(Loss) income before income taxes (885) mdash (885) 1106 mdash 1106Income tax (benefit) expense (696) mdash (696) (30) mdash (30)Net (loss) income (189) mdash (189) 1136 mdash 1136Preferred and preference stock dividend
requirements 121 mdash 121 124 mdash 124
Net (loss) income available for common stock ($310) mdash ($310) $1012 mdash $1012Less Non-core items (1750) (481)Core Earnings $1440 $1493
Note See Use of Non-GAAP Financial Measures
October 30 2019 45
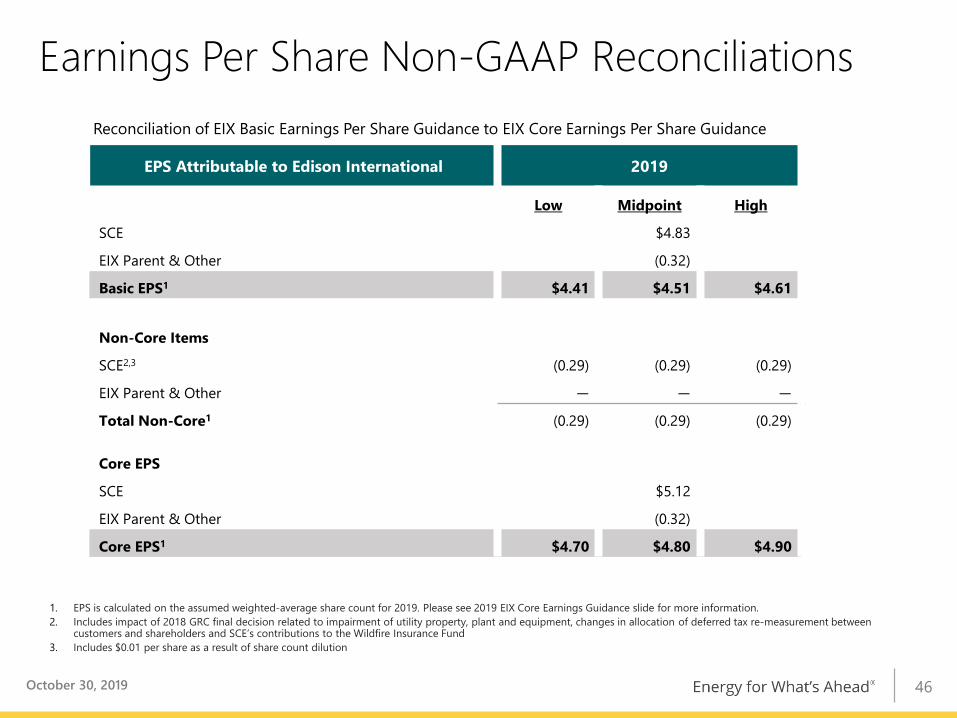
Reconciliation of EIX Basic Earnings Per Share Guidance to EIX Core Earnings Per Share Guidance
EPS Attributable to Edison International 2019
Low Midpoint High
SCE $483
EIX Parent amp Other (032)
Basic EPS1 $441 $451 $461
Non-Core Items
SCE23 (029) (029) (029)
EIX Parent amp Other mdash mdash mdash
Total Non-Core1 (029) (029) (029)
Core EPS
SCE $512
EIX Parent amp Other (032)
Core EPS1 $470 $480 $490
1 EPS is calculated on the assumed weighted-average share count for 2019 Please see 2019 EIX Core Earnings Guidance slide for more information 2 Includes impact of 2018 GRC final decision related to impairment of utility property plant and equipment changes in allocation of deferred tax re-measurement between
customers and shareholders and SCErsquos contributions to the Wildfire Insurance Fund3 Includes $001 per share as a result of share count dilution
October 30 2019
Earnings Per Share Non-GAAP Reconciliations
46
Earnings Non-GAAP Reconciliations
1 Impact of 2018 GRC final decision related to impairment of utility property plant and equipment changes in allocation of deferred tax re-measurement between customers and shareholders SCErsquos contributions to the Wildfire Insurance Fund gain from sale of nuclear fuel and impact from the approval of the Revised San Onofre Settlement Agreement
2 Loss on sale of SoCore Energy and impact of hypothetical liquidation at book value (HLBV) accounting method
($ millions)
Reconciliation of EIX GAAP Earnings to EIX Core Earnings
Earnings Attributable to Edison International Q32019
Q32018
YTD 2019
YTD 2018
SCE $503 $536 $1215 $1119
EIX Parent amp Other (32) (23) (74) (112)
Basic Earnings $471 $513 $1141 $1007
Non-Core Items
SCE 1 ($48) 7 ($99) 7
EIX Parent amp Other 2 mdash (4) mdash (46)
Total Non-Core ($48) $3 ($99) ($39)
Core Earnings
SCE $551 $529 $1314 $1112
EIX Parent amp Other (32) (19) (74) (66)
Core Earnings $519 $510 $1240 $1046
October 30 2019 47
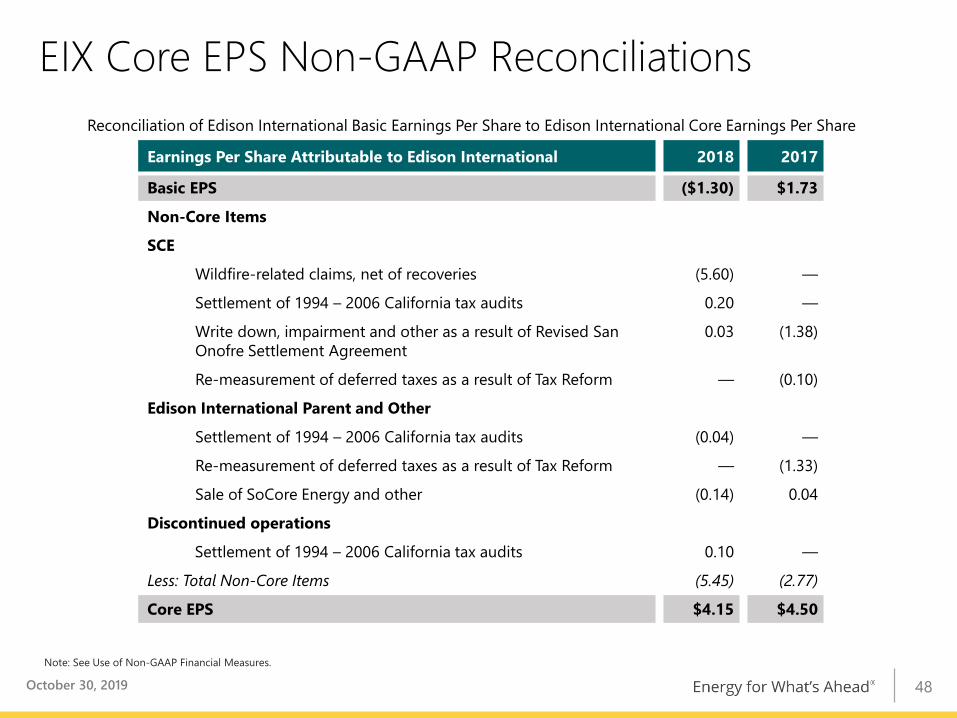
EIX Core EPS Non-GAAP ReconciliationsReconciliation of Edison International Basic Earnings Per Share to Edison International Core Earnings Per Share
Note See Use of Non-GAAP Financial Measures
Earnings Per Share Attributable to Edison International 2018 2017
Basic EPS ($130) $173
Non-Core Items
SCE
Wildfire-related claims net of recoveries (560) mdash
Settlement of 1994 ndash 2006 California tax audits 020 mdash
Write down impairment and other as a result of Revised San Onofre Settlement Agreement
003 (138)
Re-measurement of deferred taxes as a result of Tax Reform mdash (010)
Edison International Parent and Other
Settlement of 1994 ndash 2006 California tax audits (004) mdash
Re-measurement of deferred taxes as a result of Tax Reform mdash (133)
Sale of SoCore Energy and other (014) 004
Discontinued operations
Settlement of 1994 ndash 2006 California tax audits 010 mdash
Less Total Non-Core Items (545) (277)
Core EPS $415 $450
October 30 2019 48
Use of Non-GAAP Financial MeasuresEdison Internationals earnings are prepared in accordance with generally accepted accounting principles used in the United States Management uses core earnings internally for financial planning and for analysis of performance Core earnings are also used when communicating with investors and analysts regarding Edison Internationals earnings results to facilitate comparisons of the Companys performance from period to period Core earnings are a non-GAAP financial measure and may not be comparable to those of other companies Core earnings (or losses) are defined as earnings or losses attributable to Edison International shareholders less income or loss from discontinued operations and income or loss from significant discrete items that management does not consider representative of ongoing earnings such as exit activities including sale of certain assets and other activities that are no longer continuing asset impairments and certain tax regulatory or legal settlements or proceedings
A reconciliation of Non-GAAP information to GAAP information is included either on the slide where the information appears or on another slide referenced in this presentation
EIX Investor Relations Contact
Sam Ramraj Vice President (626) 302-2540 samramrajedisonintlcom
Allison Bahen Principal Manager (626) 302-5493 allisonbahenedisonintlcom
October 30 2019 49
Business Update
Slide Number 2
Table of Contents
EIX Strategy Should Produce Long-Term Value
SCE Highlights
Slide Number 6
SCE Historical Rate Base and Core Earnings
SCE Capital Expenditure Forecast
SCE Rate Base Forecast
Slide Number 10
Californiarsquos GHG Emissions Overview
SCErsquos Pathway 2045 Highlights
Slide Number 13
Slide Number 14
Slide Number 15
SCE Key Regulatory Proceedings
Slide Number 17
Slide Number 18
CPUC and FERC Cost of Capital Summary
CPUC Cost of Capital (2013-2019)
SCE Distribution System Investments
Slide Number 22
Slide Number 23
SCE Large Transmission Projects
SCE Operational Excellence
Responding to Industry Change
Slide Number 27
2019 EIX Core Earnings Guidance
EIX Annual Dividends Per Share
Appendix
EIXrsquos 2018 Sustainability Report Highlights
Slide Number 32
SCE Historical Capital Expenditures
Credit Ratings Summary
Distribution Power Grid of the Future
SCE Customer Demand Trends
SCE Bundled Revenue Requirement
Slide Number 38
SCE Rates and Bills Comparison
Slide Number 40
Slide Number 41
Slide Number 42
Slide Number 43
Slide Number 44
Slide Number 45
SCE Annual Results of Operations
Slide Number 47
Earnings Non-GAAP Reconciliations
EIX Core EPS Non-GAAP Reconciliations
Use of Non-GAAP Financial Measures
US Average
$134
SCE
$95
-291
US Average
128
SCE
164
higher
28
Created on Mon 6 Jun 2016 1250 PM EST (1750 GMT)
Concept
1990
1991
1992
1993
1994
1995
1996
1997
1998
1999
2000
2001
2002
2003
2004
2005
2006
2007
2008
2009
2010
2011
2012
2013
2014
2015
2016
2017
2018
2019
2020
2021
2022
2023
2024
2025
2026
Consumer Price Index All-Urban
131
136
140
144
148
152
157
161
163
167
172
177
180
184
189
195
202
207
215
215
218
225
230
233
237
237
239
245
251
258
265
272
279
286
293
300
306
422
304
297
260
281
294
234
155
219
337
282
160
230
267
337
322
287
381
-032
164
314
208
147
161
012
105
236
253
265
265
264
254
251
249
234
227
SOUTHERN CALIFORNIA EDISON
System Average Rate Forecast
Source Matt Sheriff
(centkWh)
SCE System Average Rate
SAR CPI (old)
SAR CPI (current)
CPI Los Angeles-Long Beach-Anaheim CA
Consumer Price Index All-Urban
0
1990
97cent
97cent
97cent
593
30
1
1991
103cent
101cent
101cent
410
422
2
1992
106cent
104cent
105cent
361
304
3
1993
103cent
107cent
107cent
253
297
4
1994
105cent
110cent
109cent
137
260
5
1995
107cent
113cent
110cent
153
281
25
6
1996
101cent
116cent
112cent
183
294
7
1997
101cent
119cent
114cent
158
234
8
1998
96cent
121cent
116cent
144
155
9
1999
96cent
124cent
119cent
235
219
10
2000
96cent
128cent
122cent
330
337
20
11
2001
142cent
131cent
127cent
336
282
12
2002
142cent
134cent
130cent
277
160
13
2003
124cent
137cent
133cent
259
230
14
2004
122cent
140cent
138cent
334
267
15
2005
126cent
145cent
144cent
447
337
16
2006
147cent
150cent
150cent
427
322
17
2007
139cent
154cent
155cent
328
287
18
2008
137cent
160cent
161cent
353
381
19
2009
143cent
159cent
159cent
-080
-032
20
2010
143cent
162cent
161cent
120
164
10
21
2011
141cent
167cent
166cent
267
314
22
2012
143cent
170cent
169cent
203
208
23
2013
159cent
173cent
171cent
108
147
24
2014
167cent
176cent
173cent
135
161
25
2015
159cent
176cent
175cent
091
012
5
26
2016
148cent
178cent
178cent
189
105
27
2017
157cent
182cent
183cent
279
236
29
20
10
28
2018
160cent
187cent
190cent
381
253
SCE
17
26
11
29
2019
159cent
192cent
195cent
244
265
LA
24
25
20
30
2020
194cent
197cent
199cent
219
265
36
31
2021
199cent
202cent
203cent
227
266
25
49
Created on Wed 23 Jan 2019 1245 PM EST (1745 GMT)
Mnemonic
Long Label
Last Update
Start Date
End Date
Frequency
1970
1971
1972
1973
1974
1975
1976
1977
1978
1979
1980
1981
1982
1983
1984
1985
1986
1987
1988
1989
1990
1991
1992
1993
1994
1995
1996
1997
1998
1999
2000
2001
2002
2003
2004
2005
2006
2007
2008
2009
2010
2011
2012
2013
2014
2015
2016
2017
2018
2019
2020
2021
2022
2023
2024
2025
2026
2027
2028
2029
2030
2031
2032
2033
2034
2035
2036
2037
2038
2039
2040
2041
2042
2043
2044
2045
2046
2047
2048
CPILANGAFRSM1
Los Angeles-Long Beach-Anaheim CA (MSA) [2013 Definition] FIPS Code 31080 Consumer Price Index for All Urban Consumers (1982-84=100) IHS MARKIT ECONOMICS December 2018 Forecast Source Bureau of Labor Statistics End of Historical Data 2017
122718
1970
2048
ANNUAL
3868
4011
4139
4374
4825
5334
5683
6080
6526
7233
8372
9184
9734
9907
10360
10838
11193
11667
12206
12826
13587
14143
14654
15025
15231
15464
15748
15997
16227
16608
17155
17732
18223
18696
19320
20183
21044
21734
22501
22322
22589
23193
23665
23921
24243
24463
24925
25621
26598
27248
27844
28475
29132
29806
30500
31165
31832
32533
33254
33985
34744
35508
36279
37061
37854
38640
39440
40278
41145
42043
42963
43898
44852
45825
46816
47822
48857
49934
51047
371
320
568
1031
1055
655
698
733
1083
1575
971
599
177
458
461
328
423
462
508
593
410
361
253
137
153
183
158
144
235
330
336
277
259
334
447
427
328
353
-080
120
267
203
108
135
091
189
279
381
244
219
227
231
231
233
218
214
220
222
220
223
220
217
215
214
208
207
213
215
218
219
218
217
217
216
215
216
220
223
Date of Report
July 26 2019
July 29 2019
July 29 2019
Edison International
Corporate Outlook
BBBStable
Baa3Stable
BBB-Stable
Senior Unsecured
BBB-
Baa3
BBB-
Commercial Paper
A-2
P-3
F3
Southern California Edison
Corporate Outlook
BBBStable
Baa2Stable
BBB-Stable
First Mortgage Bonds
A-
A3
BBB+
Senior Unsecured
BBB
Baa2
BBB
Preferred Securities
BB+
Ba1
BB+
Commercial Paper
A-2
P-2
F3
Statements contained in this presentation about future performance including without limitation operating results capital expenditures rate base growth dividend policy financial outlook and other statements that are not purely historical are forward-looking statements These forward-looking statements reflect our current expectations however such statements involve risks and uncertainties Actual results could differ materially from current expectations These forward-looking statements represent our expectations only as of the date of this presentation and Edison International assumes no duty to update them to reflect new information events or circumstances Important factors that could cause different results include but are not limited to thebull ability of SCE to recover its costs through regulated rates including costs related to uninsured wildfire-related and mudslide-related liabilities and costs
incurred to prevent future wildfiresbull ability to obtain sufficient insurance at a reasonable cost including insurance relating to SCEs nuclear facilities and wildfire-related claims and to recover
the costs of such insurance or in the event liabilities exceed insured amounts the ability to recover uninsured losses from customers or other partiesbull risks associated with AB 1054 effectively mitigating the significant risk faced by California investor-owned utilities related to liability for damages arising
from catastrophic wildfires where utility facilities are a substantial cause including SCEs ability to maintain a valid safety certification SCEs ability to recover uninsured wildfire-related costs from the Wildfire Insurance Fund the longevity of the Wildfire Insurance Fund and the CPUCs interpretation of and actions under AB 1054
bull ability of SCE to implement its WMP including effectively implementing Public Safety Power Shut-Offs when appropriatebull decisions and other actions by the CPUC the FERC the NRC and other regulatory and legislative authorities including decisions and actions related to
determinations of authorized rates of return or return on equity the recoverability of wildfire-related and mudslide-related costs wildfire mitigation efforts and delays in regulatory and legislative actions
bull ability of Edison International or SCE to borrow funds and access the bank and capital markets on reasonable termsbull actions by credit rating agencies to downgrade Edison International or SCEs credit ratings or to place those ratings on negative watch or outlookbull risks associated with the decommissioning of San Onofre including those related to public opposition permitting governmental approvals on-site storage
of spent nuclear fuel delays contractual disputes and cost overrunsbull extreme weather-related incidents and other natural disasters (including earthquakes and events caused or exacerbated by climate change such as
wildfires) which could cause among other things public safety issues property damage and operational issuesbull risks associated with cost allocation resulting in higher rates for utility bundled service customers because of possible customer bypass or departure for
other electricity providers such as CCAs and Electric Service Providers bull risks inherent in SCEs transmission and distribution infrastructure investment program including those related to project site identification public
opposition environmental mitigation construction permitting power curtailment costs (payments due under power contracts in the event there is insufficient transmission to enable acceptance of power delivery) changes in the CAISOs transmission plans and governmental approvals and
bull risks associated with the operation of transmission and distribution assets and power generating facilities including public and employee safety issues the risk of utility assets causing or contributing to wildfires failure availability efficiency and output of equipment and facilities and availability and cost of spare parts
Other important factors are discussed under the headings ldquoForward-Looking Statementsrdquo ldquoRisk Factorsrdquo and ldquoManagementrsquos Discussion and Analysisrdquo in Edison Internationalrsquos Form 10-K and other reports filed with the Securities and Exchange Commission which are available on our website wwwedisoninvestorcom These filings also provide additional information on historical and other factual data contained in this presentation
Forward-Looking Statements
October 30 2019 1
Page
Updated (U) or New (N) from July 2019 Business
Update
EIX Shareholder Value 3 U
SCE Highlights SCE Long-Term Growth Drivers 4-5 U
Capital Expenditures and Rate Base History and Forecast 6-9 NU
Californiarsquos GHG Emissions Overview SCErsquos Pathway 2045 Highlights 10-11 NU
2019 Wildfire Legislation Update Wildfire Risk and Mitigation Summaries 12-14 U
Key Regulatory Proceedings 15 U
2021 General Rate Case Overview and Timeline 16-17 N
CPUC and FERC Cost of Capital Summary 18 U
CPUC Cost of Capital (2013-2019) 19 U
Distribution and Transmission Capital Expenditure Detail 20-23 U
Operational Excellence 24 U
EIX Responding to Industry Change Edison Energy Group Summary 25-26 U
and reliabilitybull Grid resiliency and safetybull Grid modernization ndash Californiarsquos low-
carbon goalsbull Operational excellenceEdison Energy Strategybull Services for large commercial and
industrial customers
October 30 2019 3
One of the nationrsquos largest electric utilitiesbull 15 million residents in service territorybull 5 million customer accountsbull 50000 square-mile service area
Significant infrastructure investment
bull 14 million power polesbull 724000 transformersbull 127000 miles of distributiontransmission linesbull 3200 MW owned generation
Strong rate base growth driven bybull Safety and reliabilitybull Californiarsquos low-carbon objectives Grid modernization Transportation electrification Electric vehicle charging Energy storage
Limited Generation Exposurebull Own less than 20 of power generationbull Future needs via competitive solicitations
SCE Highlights
October 30 2019 4
SCE Long-Term Growth DriversDescription TimeframeRegulatory Process
Sustained level of infrastructure investment required until equilibrium replacement rates achieved and then maintained
bull Ongoing - current and future GRCs
Accelerate circuit upgrades automation communication and analytics capabilities at optimal locations to integrate distributed energy resources
bull 2018-2020 ndash Approximately $590 million of capital spending in 2018 GRC decision
bull 2021-2023 ndash Approximately $750 million of capital spending requested in 2021 GRC application
bull 2025 ndash CPUC target to complete grid modernization butmay take longer
Future transmission needs to meet 60 renewables mandate in 2030 100 cleanenergy by 2045 and to support reliability
bull 2017-2022 ndash Multiple projects approved by CAISO in permitting andor construction
bull 2023-2045 ndash Future needs largely driven by CAISO planning process
SCE-owned investment opportunities under existing CPUC proceedings
bull Today ndash Most commitments via contracts over 720 MW procured
bull 2019-2023 - $40 million of capital spending forecasted procurement target of 580 MW by 2020 as utility-owned or procured additional reliability proceeding ongoing
Utility investment in programs to build and support the expansion of transportation electrification in passenger and light- medium- and heavy-duty vehicles and potentially to support electrification of other sectors of the economy
bull 2018 ndash Medium- and Heavy-Duty (MDHD) Vehicle Transportation Electrification (TE) program approved totaling $356 million Charge Ready 2 application filed requesting $760 million Charge Ready Bridge Funding approved totaling $22 million
bull 2019-2030 ndash Potential investments to support electrification in other sectors of the economy
Utility investment and operational practices that mitigate increasing wildfire risk and bolster fire prevention activities
bull 2018 ndash Filed Grid Safety amp Resiliency application requesting $582 million of total costs (capital $407 million)
bull 2019 ndash Filed Wildfire Mitigation Planbull Ongoing ndash future GRCsbull First ~$16 billion fire risk mitigation capital spend will not
be added to rate base per AB 1054
Infrastructure Replacement
Grid Modernization
Electrification of Transportation and
Other Sectors
Energy Storage
Transmission
Wildfire Prevention and Mitigation
October 30 2019 5
SCE Historical Rate Base and Core Earnings($ billions except per share data)
Note Recorded rate base year-end basis See SCE Core EPS Non-GAAP Reconciliations and Use of Non-GAAP Financial Measures Since 2013 rate base excludes SONGS
$422$420$388 $468Core EPS $458
$211$233
$246$259
$278$296
2013 2014 2015 2016 2017 2018
$442
October 30 2019 6
SCE Capital Expenditure Forecast($ billions) $238 - $256 billion capital program
for 2019-2023bull This capital forecast includes 2018 GRC approved CPUC capital spend
for 2019-2020 2021 GRC requested CPUC capital spend
for 2021-2023 Non-GRC capital programs including
Charge Ready Pilot MDHD Transportation Electrification and 2019-2020 wildfire mitigation-related programs
FERC forecasted capital spendbull Long term growth drivers include Infrastructure Replacement Wildfire Mitigation Transportation Electrification Transmission Infrastructure
bull AuthorizedActual may differ from forecast previously authorized amounts in the last three GRC cycles were 89 92 and 922 of capital requested respectively
1 In accordance with Assembly Bill 1054 ~$16 billion of wildfire mitigation-related spend shall not earn an equity return See ldquoSCE Wildfire Capital Forecastrdquo slide for further information on wildfire-related capital spend
2 Approval percentage for the 2018 GRC excludes Grid Modernization and project approvals that were deferred to the next case for timing reasons3 The low end of the range for 2021-2023 reflects a 10 reduction on the total capital forecast using management judgment based on historical experience of previously authorized
amounts and potential for permitting delays and other operational considerations The low end of the range for 2020 reflects a 10 reduction applied only to FERC capital spending and non-GRC programs
1
Range Case3 $46 $48 $48 $48 $48
7
$262$285
$307$334
$360$382
2017 2018 2019 2020 2021 2022 2023
SCE Rate Base Forecast($ billions)
1 Morongo Transmission holds an option to invest up to $400 million in the West of Devers Transmission Project or half of the estimated cost of the transmission facilities only at the in-service date estimated to be 2021 In the table above the rate base has been reduced to reflect this option Capital forecast includes 100 of the project spend
2 Rate base forecast range case reflects capital expenditure forecast range Note Weighted-average year basis FERC based on latest forecast and represents approximately 20 of total rate base throughout the forecast period CPUC excludes the ~$16 billion of SCErsquos fire risk mitigation capital expenditures in accordance with Assembly Bill 1054 CPUC also excludes the ldquorate-base offsetrdquo adjustment related to the 2015 GRC write off of the regulatory asset for 2012-2014 incremental tax repairs and rate base associated with projects or programs that have not yet been approved
Range CaseCAGR
Range Case2 $307 $332 $353 $369 $390 69
October 30 2019
$408
1
8
bull Under AB 1054 ~$16 billion of SCErsquos fire risk capital expenditures per CPUC-approved Wildfire Mitigation Plan shall not earn an equity return SCE assumes all CPUC-jurisdictional wildfire-related
mitigation spend generally incurred after AB 1054 passage will be eligible to meet the requirement until the ~$16 billion has been incurred
Spending can be recovered from ratepayers through a securitizable dedicated-rate component
bull Main wildfire-related programs include Covered Conductor Program ndash Risk-prioritized
replacement of more than 6000 miles of bare conductor to covered conductor by 2023
Preventative Maintenance Program ndash Enhanced inspection program within High Fire Risk Areas (HFRAs) designed to proactively detect and timely remediate potential in-service failures
SCE Wildfire Capital Forecast($ billions)
$42 Billion Capital Request for 2019-20231
$03
$07$06$01
$03
$10$12
$04
$07
$09$10
$12
2019 2020 2021 2022 2023
All Other Wildfire-Related MitigationSpendWildfire-Related Mitigation Spend -AB1054
1
1 Includes FERC wildfire mitigation-related spending of $13 million $5 million $5 million $4 million and $4 million for each respective yearNote Totals may not foot due to rounding Forecast based on 2018 GRC request levelsOctober 30 2019 9
10
bull SB 350 requires a doubling of energy efficiency in existing buildings for California by 2030bull SB 32 requires statewide GHG emissions to be reduced to 40 below the 1990 level by 2030 Governor Order set a 2050
target of 80 below 1990 levelsbull SB 100 requires that 60 of energy sales to customers come from renewable power by 2030 and sets a 100 clean
electricity goal for the state and issued an executive order establishing a new target to achieve carbon neutrality both by2045
Californiarsquos GHG Emissions Overview
Commercial and Residential
12Electrical
Power15
Agriculture8
Industrial 24
Transportation41
SCE is taking a leading role to ensure that transportation and building electrification plays a major part in reducing GHG and criteria pollutant emissions in California
Source Data for both charts from California Air Resources Board California GHG Emissions data as of 2017
October 30 2019
State Carbon Emissions Reduction PathwayAnnual million metric tons (MMT)
ldquoAdaptation to climate change must begin in earnest ndash which SCE is doing in part with our grid hardening situational awareness and operational changes ndash but we must act on longer term solutions as wellrdquo ndash Pedro Pizarro Edison International CEO
SCErsquos Pathway 2045 Highlights
October 30 2019
bull 100 of grid sales with carbon-free electricity
bull 80 GW of utility-scale clean generation
bull 30 GW of utility-scale energy storage
bull 33 of space and water heating to be electrified by 2030
bull 70 of space and water heating to be electrified by 2045
bull Building electrification will increase load significantly by 2045 ndash representing 15 of the total load
bull 75 of light-duty vehicles need to be electric
bull 66 of medium-duty vehicles need to be electric
bull 33 of heavy-duty vehicles need to be electric
bull Until there is an alternative natural gas generation capacity provides a crucial role for reliability and affordability
bull 40 of natural gas that remains will be decarbonized through the addition of biomethane and hydrogen
Achieve carbon neutrality by 2045 through powering 100 of grid sales with carbon-free electricity electrifying the transportation and building sectors and using low-carbon fuels
for technologies that are not yet viable for electrification
11
Summary of Assembly Bill 1054 and Assembly Bill 111
Safety Oversight and Certification
bull Creates Wildfire Safety Division1 to provide additional wildfire safety oversightbull Initial safety certification issued by CPUC Executive Director within 30 days of IOU request requires 1) an approved wildfire
mitigation plan 2) utility to be in good safety standing 3) established board safety committee with relevant safety experience and 4) board-level reporting to the CPUC on safety issues
bull Subsequent annual safety certifications issued by Wildfire Safety Division1 also require 5) approved executive compensation structure that promotes safety ensures public safety and utility financial stability 6) compensation limits on executive officer contracts and 7) implementation of and reporting to the CPUC on wildfire mitigation plans safety culture assessments and board safety committee recommendations
Cost Recovery Standard
bull Provided a utility is ldquosafety certifiedrdquo and elects to participate in the wildfire ldquoinsurancerdquo fund (described below) establishes a FERC-like prudence standard to guide recovery of costs arising from catastrophic wildfires occurring after bill enactment
bull Prudence is based on reasonable utility conduct with potential for full or partial recovery considering factors within and beyond a utilityrsquos control
bull FERC-like standard assumes utility is prudent unless intervenors create serious doubt shifting burden to the utility to prove prudence
Wildfire Fund
bull Establishes a wildfire fund to help wildfire victims and affected communities recover and rebuild more quicklybull Wildfire ldquoinsurancerdquo fund is an insurance-like fund that more broadly socializes wildfire costs utilities participation is voluntarybull Fund includes a $105 billion ratepayer contribution through the financing of a 15-year extension of the Department of Water
Resources bond charge wildfire insurance fund also includes $105 billion contribution from utility shareholdersbull All three IOUs have elected to participate PGampE must emerge from bankruptcy by June 30 2020 to participate SCErsquos shareholders initially contributed approximately $24 billion on September 10 and expect to contribute approximately
$95 million annually on January 1 for 10 years2
Mitigation CapEx
bull First $16 billion of SCErsquos fire risk mitigation capital expenditures as approved in wildfire mitigation plans shall not earn an equity return but can be recovered from ratepayers through a securitizable dedicated rate component2
Liability Cap bull While fund remains solvent wildfire cost disallowances capped over each trailing 3-year period to 20 of TampD equity rate basebull Must be safety certified and not found to be acting with willful or conscious disregard of the safety of others
October 30 2019
1 Wildfire Safety Division created within CPUC until duties transferred to newly formed Office of Energy Infrastructure Safety on or after July 2021 2 Excluded from measurement of regulatory capital structure
2019 Wildfire Legislation Update
12
Mitigating Catastrophic Wildfire RiskSCE plans to spend significant capital and OampM from 2019-2023 including ~$16 billion of AB 1054 spend with continued investments beyond our forecast periodbull SCErsquos comprehensive risk mitigation program focuses on three key areas Grid hardening Increase the use of fire-resistant poles composite cross-arms and
covered conductor in high fire risk areas evaluate design approaches and next-generation engineering technology to further enhance public safety
Increased situational awareness capabilities Expand meteorological monitoring and forecasting capabilities by installing additional weather stations and high-definition cameras to help SCE and fire agencies to better prepare mitigate and respond to reported fires
Enhanced operational practices Restrict certain types of work in High Fire Risk Areas (HFRAs) during elevated fire risk conditions increase overhead inspection of equipment in HFRAs reduce fire risk via a Public Safety Power Shutoff in HFRAs during elevated weather conditions increase tree trimming and removal to further mitigate safety risks posed by trees or debris
bull Will file next compliance plan (Wildfire Mitigation Plan) detailing the near- and longer-term actions that SCE is taking to significantly reduce the risk of fire ignitions and increase emergency response and grid resiliency against future impacts of climate change in early 2020
bull 1700+ protective devices programmed with more sensitive (fast curve) settings (includes automatic reclosers and circuit breakers)
bull In-house team of fire weather experts staffing our 247 Situational Awareness Center
bull 450+ installed weather stations with a target of 850 by end of 2020
bull 130+ installed HD cameras with a target of 160 installations providing 90 coverage by end of 2019
bull Developed enhanced Fire Potential Index (FPI) to measure wildfire potential at the circuit level
bull 2 supercomputers being installed to run advanced weather models to improve forecast resolution
bull Completed Enhanced Overhead Inspections of 400000+ TampD structures in HFRA
bull Deploying helicoptersdrones to perform aerial inspections of our facilities in HFRA
bull 2100+ Circuit BreakerRecloser Blocking devices remotely set to not automatically re-energize lines during high fire risk conditions
bull Enhanced Vegetation Management Increasing trim distances to keep
power lines clear Performing inspectionsremoval
of hazard trees that pose riskbull Refined Public Safety Power
Shutoff (PSPS) protocol and communication
14
SCE Key Regulatory ProceedingsProceeding Description Next Steps
Key CPUC Proceedings
2021 General Rate Case (A 19-08-013)
Set CPUC base revenue requirement capital expenditures and rate base for 2021-2023
Application filed August 30 2019 awaiting scoping memo
2020 Cost of Capital(A 19-04-014)
Sets CPUC cost of capital and capital structurefor 2020-2022
Application filed April 22 2019 Scoping Memo issued July 2 2019 awaiting proposed decision (expected end of November 2019)
Grid Safety and Resiliency Program (GSRP) (A 18-09-002)
Requesting $582 million of total cost for 2018-2020 focused on grid hardening and enhanced vegetation management
Settlement filed for in July 2019 awaiting CPUC approval
Application for Recovery of WEMA costs (A 19-07-020)
Requesting recovery $505 million in insurance premiums tracked in the WEMA
Application filed July 31 2019 pre hearing conference scheduled for October 29 2019 scoping memo will follow
Application for Recovery of CEMA costs(A 19-07-021)
Requesting recovery $138 million in costs tracked in the CEMA for drought-related work and for work related to 2017 fires
Application filed July 31 2019 pre hearing conference scheduled for October 29 2019 scoping memo will follow
Non-Bypassable Charge OIR(I 19-07-017)
Approval of the extension of the DWR charge to fund the wildfire fund as per AB 1054
The CPUC rulemaking on the non-bypassable charge to support the Wildfire Fund was approved on October 24 2019
Charge Ready Program(A14-10-014 A18-06-015)
Implementation program for charger installations and market education
Pilot report filed in May 2018 Charge Ready Bridge Funding approved in December 2018 expecting proposed decision in fourth quarter 2019
Distribution Resources Plan (DRP) OIR (R14-08-013)
Power grid investments to integrate distributed energy resources
Demo projects have been terminated due to significant delays in project schedules No contracts will be executed in the solicitation for deferral projects due to lack of viable bids
Power Charge Indifference Adjustment (PCIA) OIR (R17-06-026)
Review revise and consider alternatives to the PCIA
Final Phase 1 Decision adopted on October 11 2018 Final Phase 2 Decision on benchmark refinementtrue-up was approved on October 10 2019
Key FERC Proceedings
FERC Formula Rates Transmission rate setting with annual updates Replacement rate filed on October 27 2017 settlement covering 1118 through 111119 filed and waiting FERC approval New replacement rate accepted June 11 partial settlement reduced request to 1197 settlement discussions are continuing
October 30 2019 15
Filed August 30 2019 SCErsquos 2021 GRC request balances the need to advance Californiarsquos ambitious decarbonization policy goals and address emergent wildfire public safety risks while continuing to provide safe reliable and affordable service to customersbull 2021 GRC Application (A 19-08-013) addresses major portion of CPUC-jurisdictional revenue
requirement for 2021-2023 Includes operating costs and capital investment Excludes CPUC jurisdictional costs such as fuel and purchased power cost of capital and other
discrete SCE capital projects (such as Charge Ready 2 ndash SCErsquos transportation electrification infrastructure program)
Excludes FERC-jurisdictional transmission revenue requirementbull Requests 2021 revenue requirement of $7601 billion $1155 billion increase over 2020 authorized revenue requirement a 127 increase over total rates1
Requests increases of $400 million in 2022 and $531 million in 2023bull Multi-track schedule proposed to approve 2021-2023 revenue requirement and reasonableness of
additional 2018-2020 recorded incremental amounts associated with the Fire Mitigation memorandum accounts (FMA)2 (See ldquoSCE 2021 General Rate Case Timelinerdquo for more information)
SCE 2021 General Rate Case Overview
October 30 2019
1 127 includes the impact of lower anticipated 2021 kWh sales and recoveries of $87 million of non-wildfire memo accounts2 Includes Wildfire Mitigation Plan Memo Account Fire Hazard Prevention Memo Account Grid Safety and Resiliency Program Memo Account and Fire Risk Mitigation Memo Account
16
bull Track 1 includes approval of the 2021-2023 GRC revenue requirement and reasonableness of additional 2018-2019 recorded incremental amounts associated with the Fire Mitigation memorandum accounts1
bull Track 2 includes approval of 2020 recorded incremental amounts associated with the Fire Mitigation memorandum accounts1 and 2018-2020 Grid Safety and Resiliency Program (GSRP) costs above settlement amount
SCE 2021 General Rate Case Timeline
October 30 2019
1 Includes Wildfire Mitigation Plan Memo Account Fire Hazard Prevention Memo Account Grid Safety and Resiliency Program Memo Account and Fire Risk Mitigation Memo AccountNote Actual schedule to be set by CPUC in a future regulatory order The schedule is subject to change over the course of the proceeding
Estimated
2021
Q1
Rebuttal Final Decision
Intervenor Testimony
Proposed Decision
Evidentiary Hearings
2020 FMA Update
Q2 Q3 Q4
GRCApplication
Rebuttal
Final Decision
Intervenor Testimony
Proposed Decision
Evidentiary Hearings
2018-2019 FMA Update
2019 2020
Q1 Q2 Q3 Q4 Q1 Q2 Q3 Q4
Estimated
17
CPUC and FERC Cost of Capital Summary
bull Litigated proceeding separate from GRC filed on April 22nd
bull Request for three-year period starting January 1 2020
bull SCE PGampE SDGampE and SoCalGas concurrently filed applications applications were consolidated into one proceeding
bull Proposed trigger mechanism for adjusting the cost of capital between proceedings (similar to current mechanism)
CPUC Cost of Capital FERC Rate Case
bull New Rate Case filed on April 11th
bull Updated formula rate becomes effective November 12 2019 if accepted by FERC subject to refund
bull Capital structure at FERC is based on recorded level vs CPUC ldquoauthorizedrdquo approach
Component Cost Weighted Cost
Conventional ROE 1060
Wildfire Risk ROE 085
Common Equity 520 1145 595
Long-Term Debt 430 474 204
Preferred Equity 50 570 029
Total 1000 828
Breakdown of Return on Equity (ROE) Cost
Conventional ROE 1112
Wildfire Risk ROE 085
Requested ROE + 1197
CAISO adder + 050
Incentive Projects Varies
October 30 2019 18
CPUC Cost of Capital (2013-2019)
Two year settlement approved for 2018-2019bull ROE adjustment based on 12-month average of
Moodyrsquos Baa utility bond rates measured from October 1 to September 30
bull If index exceeds 100 bps deadband from starting index value authorized ROE changes by half the difference
bull Starting index value based on trailing 12 months of Moodyrsquos Baa index as of September 30 of each year ndash500
CPUC Authorized Capital
Structure 2018-2019Common Equity 48 1030
Preferred 9 582Long-term Debt 43 498
Weighted Average Cost of Capital 761
October 30 2019 19
3
4
5
6
7
10112 10113 10114 10115 10116 10117 10118 10119
Rate
()
Starting Value ndash 500
CPUC Adjustment Mechanism
Moodyrsquos Baa Utility Index Spot Rate
Moving Average (10118 ndash 10119) = 450
100 basis point +- Deadband
ROE fixed at 1030 for 2018 independent of trigger mechanism
ROE fixed at 1045 for 2017 independent of trigger mechanism
SCE Distribution System Investments
1 Deferrals required with infrastructure replacement load growth and grid modernization programs2 Other includes among other things grid modernization emergency management customer requested system modifications and transportation electrification programsNote Forecast based on 2021 GRC request levels
Distribution Trendsbull Capital expenditures for certain programs deferred over
next five years to support reallocation of distribution resources to wildfire mitigation1 historical program funding levels will be reinstated in subsequent GRC periods in order to resume trajectory towards equilibrium replacement rate
bull Distribution grid requires upgrades to circuit capacity automation and control systems to support various grid resiliency and reliability objectives as well as increased use of distributed energy resources
2019 ndash 2023 Capital Spending Forecast for Distribution2 - $208 billion
2019-2023 Capital Spending Driversbull Automation of distribution circuitsbull Pole replacements bull Load growth upgradesbull Cable and overhead conductor replacementsbull Preventive and breakdown maintenancebull Circuit breaker transformer bank and relay
replacementsupgradesbull New Service Connections
October 30 2019
Load Growth
New Service Connections
Infrastructure Replacement
General Plant
Other
Wildfire
20
Charge Ready Bridge Funding and 2
SCE Transportation Electrification (TE) Proposalsbull Proposals build on SCErsquos Clean Power and Electrification Pathway which is an integrated approach to
reduce GHG emissions and air pollution by taking action in three California economic sectors electricity transportation and buildings
bull These programs accelerate electrification of the transportation sector supporting SCErsquos vision of placing at least 7 million light-duty passenger vehicles on the roads and transitioning to zero-emission trucks and transit Additional studies launched to increase adoption such as electrification of the Interstate 5 corridorMedium- and Heavy-Duty (MDHD) Vehicle
Transportation Electrification Program
Charge Ready Pilot - $22 million Total Cost1 (in 2014 dollars) approved January 2016bull Approved capital spend of $12 million OampM of $10 millionbull Supports 1280 chargersbull Included in capital spend and rate base forecasts
$356 million Total Cost1 (in nominal dollars) approved May 2018 bull 5-year programbull Approved capital spend of $242 million OampM of $115
millionbull Included in capital spend and rate base forecasts
1 Total Cost includes both OampM and capital spend
Charge Ready ldquoBridgerdquo Funding - $22 million Total Cost (in 2014 dollars) approved December 2018bull Additional approved capital spend of $12 million OampM
of $10 million bridge funding must be subtracted from any authorized Charge Ready 2 funding
bull Included in capital spend and rate base forecastsbull SCE to install at least 1000 chargers including 20 in
multi-unit dwellingsCharge Ready 2 ndash $760 million Total Cost1 (in 2018 dollars) filed June 2018 (pending CPUC approval)bull 4-year program providing over 50000 chargersbull $561 million in capital spend OampM of $199 millionbull Not included in capital spend or rate base forecasts
Charge Ready Pilot
October 30 2019 21
310
185
85
0
50
100
150
200
250
300
350
Transmission Distribution Customer
MW
SCE 2018 Storage Portfolio
Up to 80 of MW to be shifted between
TampD
85 MWexcess may offset TampD
targets
Eligible storage to be included in 2020 Storage compliance Plan (Filing date 312020)
Storage that is permitted to count in different categories due to flex counting rules
Currently above targets
2020 Cumulative Procurement Target
SCE Energy StorageCPUC Energy Storage Program Requirements
bull Storage Rulemaking (R10-12-007) established 1325 MW target for IOUs by 2024 (580 MW SCE share spread as biennial targets during 2014-20) ownership allowed up to 290 MW for SCE
bull Flexibility to transfer across categories expanded in Storage Rulemaking (R15-03-011)
SCE Procurement Activities to Meet CPUC Requirements
bull SCE has procured over 720 MW of energy storage (includes 60 MW of utility owned storage) ~600 MW of which is eligible to count towards CPUC targets
bull SCE submitted its 2018 Local Capacity Requirements RFP (2018 LCR RFP) and its second Aliso Canyon Energy Storage RFO (ACES 2 RFO) for approval Upon Commission approval of these energy storage resources SCE will have exceeded the 580 MW target set by AB 2514
bull SCE filed its 2018 Energy Storage and Investment Plan (ESPampIP) on March 1 2018 the AB 2514 track was approved by D18-10-036 on October 25 2018 however the Commission rejected SCErsquos AB 2868 proposals in D19-06-032
SCE Procurement to Meet System Reliability Needs
bull A Proposed Decision (PD) Issued in the Integrated Resources Plan (IRP) Proceeding (R16-02-007) directs SCE to procure 1745 MW of incremental system resource capacity to come online between August 1 2021 and August 1 2023 SCE Launched its 2019 System Reliability RFO on September 12 2019 Energy Storage will be an eligible resource to be procured in this RFO
bull In light of the IRP PD SCE concurrently launched a separate track to procure utility owned energy storage systems which will be referred to as the Reliability Owned Energy Storage (RUOES) procurement
October 30 2019 22
SCE Large Transmission Projects
FERC Cost of Capital112 ROE from January 1 2018 to November 12 2019bull ROE = Base (plus incentives) of 107 + CAISO Participation Application for FERC Formula recovery mechanism post
November 12 2019 was filed April 11 2019 Requested 50 bp CAISO adder approved but application for
rehearing requested by CPUC
Summary of Large Transmission Projects
Project Name Total Cost5 Remaining Investment(as of September 30 2019)
Estimated In-ServiceDate
West of Devers12 $848 million $416 million 2021
Mesa Substation1 $646 million $296 million 2022
Alberhill System3 $486 million $446 million mdash 3
Riverside Transmission Reliability4 $451 million $441 million 2024
Eldorado-Lugo-Mohave Upgrade $257 million $180 million 2021
1 CPUC approved2 Morongo Transmission holds an option to invest up to $400 million or half of the estimated cost of the transmission facilities only at the in-service date If the option is
exercised SCErsquos rate base would be offset by that amount 3 In August 2018 the CPUC approved the revised alternate decision which left the proceeding open and directed SCE to supplement the existing record with additional analysis
as it relates to the Project need and alternatives Potential revisions to the Project have not been reflected in the total cost of the Project or estimated in service date 4 Riverside Transmission Reliability Project total cost is currently estimated to be $451 million however costs could increase depending on the final route alternative selected5 Total Costs are nominal direct expenditures subject to CPUC and FERC cost recovery approval SCE regularly evaluates the cost and schedule based on permitting processes
given that SCE continues to see delays in securing project approvalsOctober 30 2019 23
SCE Operational Excellence
Top Quartilebull Safetybull Reliabilitybull Customer servicebull Cost efficiency
Optimizebull Capital productivitybull Purchased power costbull Digitization
High performing continuous improvement culture
Defining Excellence Measuring Excellence
bull Employee and public safety metrics
bull System performance and reliability (SAIDI and SAIFI)
bull Customer satisfaction calculation based on internal voice-of-customer surveys
bull OampM cost per customerbull Reduce system rate growth
with OampM purchased power cost reductions
Ongoing Operational Excellence
Efforts
October 30 2019 24
Responding to Industry ChangeLong-Term Industry Trends Strategy
bull The technology landscape is evolving at an unprecedented pace with innovation driving advances in cost and capabilities of distributed energy resources
bull Customer expectations are changing with increasing choices and alternatives a growing priority of sustainability objectives and flattening demand
bull The regulatory environment for utilities is complex increasingly supportive of new forms of competition but unable to keep pace with new business models
bull Policies both in California and globally are setting aggressive greenhouse gas reduction targets
SCE Strategybull Clean the power system by accelerating
the de-carbonization of electricity supplybull Help customers make cleaner energy
choices to support electrification and leverage flexible energy demand
bull Strengthen and modernize the grid by replacing aging infrastructure and deploying technology
bull Achieve operational and service excellence with top tier performance in safety reliability affordability and customer satisfaction
Beyond SCEbull Position Edison Energy as an independent
energy advisor and integrator for large commercial and industrial customers
bull Further clean energy and sustainability efforts in California through Edison Energy insights
October 30 2019 25
bull Energy is a significant risk large commercial and industrial customers face Edison Energy creates competitive advantage for market leaders by quantifying this risk and designing the portfolio solution to protect shareholder value threatened by complex energy policies increasing sustainability needs technological advancements and new products
bull Optimized energy solutions based on robust analytics of the customerrsquos energy portfolio in alignment with their goals and strategic objectives
bull Implementation of solutions through existing service lines or brokering with third parties
bull Edison International investment $83 million as of September 30 2019
Edison Energy
Edison Energy Summary
The Opportunity Trusted Advisor and Solution Integrator
Managed Portfolio Solution
Renewables amp Sustainability
Supply Solutions
Demand Solutions
Installations
October 30 2019 26
27
Total Rate Base $307 billion
bull FERC comprises ~20 of total
CPUC
Return on Equity (ROE)
103
Capital Structure2 48 equity
FERC
ROE3 112 with incentives(previously 105 with incentives)
Capital Structure Recorded capital structure 45 2019 average estimated equity
Other Items
Capital Market Activities
$49 billion of EIXSCE debt and equity issuances in addition to SCErsquos normal course debt financing of rate base
$468 $480
($033)($024)$041
$029
SCE 2019 EPSfrom Rate
Base Forecast
SCEVariances
2018 True-Ups
EIX Parentamp Other
EquityProgram WF FundFinancing
EIX 2019 CoreEPS Midpoint
Guidance
bull Financing and other$032
bull Z-factor advice letter approval $004
bull Energy efficiency $005
2019 Core Earnings Per Share Guidance ndashBuilding from SCE Rate Base
bull HoldCo operating expenses (1) cent per share per month
bull HoldCo debt issued $1 billion in 2019 ($400 million of issuance remaining)
bull EEG target breakeven run rate by year-end 2019
EIX 2019 Core EPS guidance range of $470 - $490 midpoint $009 higher than prior
Key Assumptions
Note See Earnings Per Share Non-GAAP Reconciliations and Use of Non-GAAP Financial Measures in Appendix All tax-affected information on this slide is based on our current combined statutory tax rate of approximately 28 Totals may not foot due to rounding
1 Reflects actual financing activity at SCE (August 1st debt offering) and EIX (July 30th equity offering) versus prior guidance based on assumption that financing would occur on September 10th
2 On February 28 2019 SCE filed an application with the CPUC for a waiver of compliance with this equity ratio requirement describing that while the wildfire-related charge accrued in the fourth quarter of 2018 caused its equity ratio to fall below 47 on a spot basis as of December 31 2018 SCE remains in compliance with the 48 equity ratio over the applicable 37-month average basis While the CPUC reviews the waiver application SCE is considered in compliance with the capital structure rules
3 SCErsquos April 11 2019 TO2019A filing to revise its ROE is pending review with the FERC and not reflected in guidance assumptions
2019 EIX Core Earnings Guidance
bull Test year 2018 GRC true-up $020
bull FERC ROE settlement (prior year)$009
bull Previously announced financing plan (debt and equity) ($018)
bull Update to financing plan based on actual results ($006)
bull Remaining previously disclosed equity plan $05 billion
1 2019 dividend annualized based on December 6 2018 declaration
Fifteen Consecutive Years of Dividend Growth
Target dividend growth within target payout ratio of 45-55 of SCErsquos earnings
1
October 30 2019 28
Appendix
October 30 2019 29
EIXrsquos 2018 Sustainability Report Highlights
Edison Energy is not the same company as Southern California Edison the utility and Edison Energy is not regulated by the California Public Utilities Commission Cumulative duration (in minutes) of sustained repair outages lasting longer than five minutes experienced by the average customer in a year (including major event days) In February 2019 the EIX board approved a $3 million donation to the Edison International Wildfire Assistance Fund to enhance community resiliency and wildfire prevention and
mitigation This affects the 2019 data year and is not reflected here
October 30 2019
ldquoAt Edison International we are leading the transformation of the electric power industry toward a clean energy future by focusing on opportunities in clean energy efficient electrification the grid of the future and customer choice As we pursue this vision sustainability remains at the core of who we are and what we dordquo ndash Pedro Pizarro Edison International CEO
bull Earnings not affected by variability of retail electricity salesbull Differences between amounts collected and authorized levels
either billed or refundedbull Promotes energy conservationbull Stabilizes revenues during economic cycles
Major Balancing Accountsbull Salesbull Fuel and Purchased powerbull Energy efficiencybull Pension expense
bull Cost-recovery related balancing accounts represented more than 59 of costs
bull Trigger mechanism for fuel and purchased power adjustments at 5 variance level
Advanced Long-TermProcurement Planning
bull Upfront contract approvals and prudency standards provide greater certainty of cost recovery (subject to compliance-related reasonableness review)
Forward-looking Ratemaking bull Forward and test year GRC with three-year rate cycle bull Separate cost of capital mechanism
October 30 2019 31
SCE Historical Capital Expenditures($ billions)
$40 $39
$35$38
$44
2014 2015 2016 2017 2018
October 30 2019 32
Credit Ratings Summary
Date of Report July 26 2019 July 29 2019 July 29 2019
Edison InternationalCorporate Outlook BBBStable Baa3Stable BBB-StableSenior Unsecured BBB- Baa3 BBB-Commercial Paper A-2 P-3 F3
Southern California EdisonCorporate Outlook BBBStable Baa2Stable BBB-StableFirst Mortgage Bonds A- A3 BBB+Senior Unsecured BBB Baa2 BBBPreferred Securities BB+ Ba1 BB+Commercial Paper A-2 P-2 F3
FitchMoodyrsquosSampP
October 30 2019 33
4
ampCalibriRegularFINANCIAL AND STATISTICAL REPORTampCalibriRegularampA
Distribution Power Grid of the Future
One-Way Electricity Flowbull System designed to distribute electricity
from large central generating plantsbull Voltage centrally maintainedbull Increasing integration of distributed
energy resourcesbull Limited situational awareness and
visualization tools for power grid operators
Renewable Generation Mandates
Subsidized Residential Solar
Limited Electric Vehicle Charging Infrastructure
Variable Two-Way Electricity Flowbull Distribution system at the center of the
power gridbull System designed to manage fluctuating
resources and customer demand bull Digital monitoring and control devices and
advanced communications systems to improve safety and reliability and integrate DERs
bull Improved data management and power grid operations and cyber risk mitigation
bull Integrated utility distribution with distributed energy resources planning
Maximize Distributed Resources and Electric Vehicle Adoptionbull Distribution power grid infrastructure
design supports customer choice and greater resiliency
Current State Future State
October 30 2019 34
SCE Customer Demand Trends
Note See Edison International Financial and Statistical Reports for 2017 for further information
Kilowatt-Hour Sales (millions of kWh) 2014 2015 2016 2017 2018
Residential 30027 30093 29579 30221 29865
Commercial 42004 42396 42189 42514 42369
Industrial 8392 7623 7162 6659 6786
Public authorities 4975 4795 4715 4711 4510
Agricultural and other 2019 1950 1803 1498 1745
Subtotal 87416 86857 85448 85602 85276
Resale 1308 1080 1794 1568 1867
Total Kilowatt-Hour Sales 88725 87937 87242 87170 87143
Total Number of Customers 5005401 5033330 5060528 5094818 5126985
Number of New Connections 29879 31653 38076 39621 39633
Area Peak Demand (MW) 23055 23079 23091 23508 23766
October 30 2019 35
SCE Bundled Revenue Requirement
Note Rates in effect as of July 26 2019 Represents bundled service which excludes Direct AccessCCA customers that do not receive generation services from SCE
SCE Systemwide Average Rate History (centkWh)
2010 2011 2012 2013 2014 2015 2016 2017 2018 2019
143 141 143 159 167 162 148 157 160 159
Fuel amp Purchased Power(47)
Distribution(38)
Transmission (8)
Generation(8)
Other (-1)
2019 Bundled Revenue
Requirement
$millions centkWh
Fuel amp Purchased Power ndash includes CDWR Bond Charge
4422 74
Distribution ndash poles wires substations service centers Edison SmartConnectreg
3628 61
Generation ndash owned generation investment and OampM 708 12
Transmission ndash greater than 220kV 789 13
Other ndash CPUC and legislative public purpose programs system reliability investments nuclear decommissioning and prior-year over collections
(116) (01)
Total Bundled Revenue Requirement ($millions) $9431
divide Bundled kWh (millions) 59396
= Bundled Systemwide Average Rate (centkWh) 159cent
October 30 2019 36
37
97cent
159cent
80cent
100cent
120cent
140cent
160cent
180cent
200cent
220cent
1990
1991
1992
1993
1994
1995
1996
1997
1998
1999
2000
2001
2002
2003
2004
2005
2006
2007
2008
2009
2010
2011
2012
2013
2014
2015
2016
2017
2018
2019
195cent
Rates reduced due to the implementation of 1) the SONGS Revised Settlement including NEIL insurance benefits 2) lower fuel amp purchased power costs and 3) a lower 2015 GRC revenue requirement that includes flow-through tax benefits
centkWh
System Average Rate Historical Growth
SCErsquos system average rate has grown less than inflation over the last 29 years
SCE System Average RateLos Angeles Area Inflation
Comparative System Average Rates
Delta to SCESCE 159cent --
PGampE 211cent1 33
SDGampE 246cent1 55
CAGR29-yr
(lsquo90-rsquo19)20-yr
(lsquo99-rsquo19)10-yr
(lsquo09-19)17 26 1124 25 20
Energy Crisis and return to normal
Higher gas price forecast post-Katrina leads to higher rates with subsequent refund of over collection
Delay in 2012 GRC leads to shorter ramp-up of rate increase
1 PGampE Advice 5644-E effective October 1 SDGampE Advice 3377-E effective June 1
October 30 2019
Data
SCE System Average Rate
1990199119921993199419951996199719981999200020012002200320042005200620072008200920102011201220132014201520162017201820199699999999999999310310610310510710110196969614214212412212614713913714314314114315916715940876786458386148350382761769171566871495475337116159CPI Los Angeles-Long Beach-Anaheim CA199019911992199319941995199619971998199920002001200220032004200520062007200820092010201120122013201420152016201720182019202096999999999999993100974239450441131046212585868498310726876840039228108738285083414611104041339548576811242695044160916114205839057899881158478900883218511856679342492612122475588812561061265926153091265513010279685966582133476140824337041379322865554462144095927379783561502417198233561515516495767909655160640840897938551593635512757601816127380397448466165581867639842851689511064769380217077830471050007173082233194307481746514628312063517794555998527898182917523920509811898939005269867419453007660169238SAR CPI (old)1990199119921993199419951996199719981999200020012002200320042005200620072008200920102011201220132014201520162017201820199699999999999999310108935518848128104164104853626311072574143759422111004139294598572113128515849244651164507302761853711917284265578923121016455131068581236705147011944127834109318192141314347216021390513353198545827113660054850437767140244467121649041449648574526591614963575483132515393112443397234159803525097292715929158237134114161898499904328691669815498437507617045100580396491729508329612907517573561579182243175943857388863061777863624593457518198880904395583186584452388557219152742489955948
195cent
CPI Workbook
image1png
129 ₵
164 ₵
US Average SCE
27 Higher
SCE Rates and Bills Comparison
SCErsquos average residential rates are above national averagebut residential bills are below national average due to lower usage
bull SCErsquos residential rates are above national average due in part to a cleaner fuel mix high cost of living and lower system load factor
bull SCErsquos residential customer usage is lower than the national average due to mild climate and higher energy efficiency appliance and building standards
bull Average monthly residential bills are lower than the national average as higher rate levels are more than offset by lower usage
Key FactorsKey Factors
Source EIAs Form 861M (formerly Form 826) Data Monthly Electric Utility Sales and Revenue Data for 12-Months Ending June 2019 httpswwweiagovelectricitydataeia861mindexhtml
2018-19 Average Residential Rates (centkWh)
2018-19 Average Residential Bills ($ per Month)
$128
$95
US Average SCE
26 Lower
October 30 2019 38
Sheet1
Sheet1
129 ₵
164 ₵
Sheet2
27 Higher
Sheet3
Sheet1
Sheet1
$128
Sheet2
26 Lower
Sheet3
bull Assembly Bill 1171 permits cities and counties and Joint Powers Agencies (JPAs) to act as CCAs to purchase and sell electricity on behalf of the utility customers within their jurisdiction
bull An Order Instituting Rulemaking (OIR R17-06-026) was opened on June 29 2017 to review revise and consider alternatives to the ldquoPower Charge Indifference Adjustmentrdquo or PCIA The PCIA allocates a proportional share of above-market costs of SCErsquos
energy procurement portfolio to departing load customers to ensure remaining bundled service customers are indifferent
October 11 2018 Commission decision changes PCIA methodology and has substantially addressed the historical subsidy to departing load that materialized when renewables market prices declined over the past 4 yearso Decision also established a Phase 2 which is addressing utility
portfolio optimization PCIA ldquopre-paymentrdquo options for entities and individual departing load customers and implementation of the ldquotrue-uprdquo process for Resource Adequacy (RA) and Renewable Energy Credits (RECs) costs
o A Phase 2 final decision on the benchmark and true-up process was approved on October 10 2019 with the other Phase 2 activities to continue into 2020
bull On February 8 2018 the Commission approved Resolution E-4907 requiring CCAs to demonstrate compliance with annual Resource Adequacy (RA) requirements prior to commencing operations
bull Existing Direct Access and CCA load is expected to be ~35 of SCErsquos total load by the end of 2019
Investor-Owned Utility (IOU)
Community Choice Aggregator (CCA)
Community Choice Aggregator (CCA) Overview
Approximately 40 of SCErsquos bundled service load could be part of a CCA or Direct Access by the end of 2020
October 30 2019 39
bull CPUC Order Instituting Ratemaking R 12-06-013 comprehensively reviewed residential rate structure including a future transition to Time of Use (TOU) rates In March 2018 SCE began to migrate 400000 residential customers to TOU rate structures
Remaining eligible residential customers to be migrated beginning October 2020bull July 2015 CPUC Decision D 15-07-001 includes Transition to 2 tiered rate structure coupled with Super-User Electric (SUE) Surcharge1
ldquoSuper User Electric Surchargerdquo for usage 400 above baseline (~3 of all usage)
Minimum bills of approximately $10month (applied to delivery revenue only)
January 2014 2019
100(60 of system usage)
219(3)
Tier 1100
Tier 2 101-400
SUEgt400
125(37)
Usage Level ( of Baseline)Usage Level ( of Baseline)
1 Completed in 20192 SCErsquos California Alternate Rates for Energy (CARE) program is an income-qualifying program that reduces energy bills for eligible customers by about 30
Winter Weekdays 8am-9pm Weekdays and Weekends 4-9pm
Off-Peak Summer Weekdays 11pm-8amWeekends All
Weekdays and Weekends All except 4-9pm
Winter Weekdays 9pm-8amWeekends All
Weekdays and Weekends 9pm-8am
Super Off-Peak Winter NA Weekdays and Weekends 8am-4pm
New Time-of-Use (TOU) Periods
bull On March 1 2019 SCE changed its basic TOU pricing period definition for the first time in over 30 years
bull Abundant mid-day renewable energy lowers prices from 8am-4pm (October - June)
bull Highest cost period is now 4pm-9pm all-days1
1 TOU pricing periods defined for non-residential customers per CPUC Decision D18-07-006 Similar residential TOU definitions were filed by SCE in A17-12-012
bull 998 solar projectsbull 320445 residential (71 of all residential customers) ndash 1756 MW bull 7333 non-residential ndash 977 MW bull Approximately 4775887 MWhyear generated
SCE Net Metering Statistics (919)
0
5
10
15
20
25
30
35
40
0
1000
2000
3000
4000
5000
6000
7000
2013 2014 2015 2016 2017 2018 2019
MW
Inst
alle
d
Num
ber o
f Sol
ar R
esid
entia
l Ins
talla
tions
Installations MW
July 1 2017bull Official start of NEM successor tariff customers are subject to
Mandatory TOU rate Non-bypassable charges Application fees
July 31 2017bull Residential customers who meet this deadline are grandfathered for
current TOU periods for maximum of 5 years (10 for non-residential)September 9 2017bull Smart Inverters required on all solar installationsJuly 25 2018bull Smart Inverters with Reactive Power Priority required on all solar
installationsNear Term Outlookbull Combination of a flatter tiered rate and the mandatory TOU NEM 20
rate structure has helped reduce the per customer cost shift further efforts to reduce the shift through new TOU pricing periods
bull Commission to revisit NEM Successor Tariff by July 2020 to evaluate the existing NEM tariffs and consider the development and adoption of successor tariffs
Key Dates
Third Quarter Earnings Summary
October 30 2019
Q32019
Q32018 Variance
Basic Earnings Per Share (EPS)1
SCE $ 145 $ 164 $ (019)
EIX Parent amp Other (009) (007) (002)
Basic EPS $ 136 $ 157 $ (021)
Less Non-core Items
SCE2 $ (014) $ 002 $ (016)
EIX Parent amp Other3 mdash (001) 001
Total Non-core $ (014) $ 001 $ (015)
Core Earnings Per Share (EPS)
SCE $ 159 $ 162 $ (003)
EIX Parent amp Other (009) (006) (003)
Core EPS $ 150 $ 156 $ (006)
Key SCE EPS Drivers4
Higher revenue5 $ 012- CPUC revenue (002)- 2018 FERC Formula Rate settlement 010- Other FERC revenue 004
Higher OampM (021)Lower depreciation 002Higher net financing costs (004)Income taxes5 019Property and other taxes (001)Results prior to impact from share dilution $ 007Impact from share dilution (010)Total core drivers $ (003)Non-core items 2 (016)Total $ (019)
Key EIX EPS Drivers4
EIX parent and other mdash Higher interest expense and corporate expenses $ (005)EEG mdash Lower corporate expenses 001Impact from share dilution 001Total core drivers $ (003)Non-core items 3 001Total $ (002)
1 See Earnings Non-GAAP reconciliations and Use of Non-GAAP Financial Measures in Appendix2 Includes SCEs contributions to Wildfire Insurance Fund in third quarter 2019 and impact from the approval of the Revised San Onofre Settlement Agreement in the third quarter 2018 3 Loss on sale of SoCore Energy4 2019 EPS drivers are reported at a consistent share count of 3258 million (2019 QTD weighted-average shares outstanding is 3471 million)5 Includes $020 of tax benefits refunded to customersNote Diluted earnings were $135 and $157 per share for the three months ended September 30 2019 and 2018 respectively
43
1 See Earnings Non-GAAP reconciliations and Use of Non-GAAP Financial Measures in Appendix2 Impact of 2018 GRC final decision related to impairment of utility property plant and equipment changes in allocation of deferred tax re-measurement between customers and
shareholders SCErsquos contributions to the Wildfire Insurance Fund gain from sale of nuclear fuel and impact from the approval of the Revised San Onofre Settlement Agreement3 Loss on sale of SoCore Energy and impact of hypothetical liquidation at book value (HLBV) accounting method4 2019 EPS drivers are reported at a consistent share count of 3258 million (2019 YTD weighted-average shares outstanding is 3330 million)5 Test Year 2018 GRC true-up of $020 includes revenue of $(034) OampM of $006 depreciation of $024 interest expense of $(001) property and other taxes of $001 and income taxes of
$0246 Includes $018 of tax benefits refunded to customersNote Diluted earnings were $342 and $308 per share for the nine months ended September 30 2019 and 2018 respectively
Year to Date Earnings Summary
October 30 2019
YTD 2019
YTD 2018 Variance
Basic Earnings Per Share (EPS)1
SCE $ 365 $ 343 $ 022
EIX Parent amp Other (022) (034) 012
Basic EPS $ 343 $ 309 $ 034
Less Non-core Items
SCE2 $ (030) $ 002 $ (032)
EIX Parent amp Other3 mdash (014) 014
Total Non-core $ (030) $ (012) $ (018)
Core Earnings Per Share (EPS)
SCE $ 395 $ 341 $ 054
EIX Parent amp Other (022) (020) (002)
Core EPS $ 373 $ 321 $ 052
Key SCE EPS Drivers4
Test Year 2018 GRC true-up5 $ 020Higher revenue6 055
- CPUC revenue 032- 2018 FERC Formula Rate settlement 010- FERC and other operating revenue 013
Higher OampM (026)Lower depreciation 005Higher net financing costs (012)Income taxes6 021Results prior to impact from share dilution $ 063Impact from share dilution (009)Total core drivers $ 054Non-core items2 (032)Total $ 022
Key EIX EPS Drivers4
EIX parent and other mdash Higher interest expense and corporate expenses $ (007)EEG mdash Lower corporate expenses and lower losses at the competitive business 004Impact from share dilution 001Total core drivers $ (002)Non-core items3 014Total $ 012
44
SCE Annual Results of Operationsbull Earning activities ndash revenue authorized by CPUC and FERC to provide reasonable cost recovery and return on investmentbull Cost-recovery activities ndash CPUC- and FERC-authorized balancing accounts to recover specific project or program costs subject
to reasonableness review or compliance with upfront standards
($ millions)
2018 2017
Earnings Activities
Cost-Recovery Activities
Total Consolidated
Earnings Activities
Cost-Recovery Activities
Total Consolidated
Operating revenue $6560 $6051 $12611 $6611 $5643 $12254Purchased power and fuel mdash 5406 5406 mdash 4873 4873Operation and maintenance 1972 730 2702 1898 824 2722Wildfire-related claims net of recoveries 2669 mdash 2669 ― ― ―Depreciation and amortization 1867 mdash 1867 2032 mdash 2032Property and other taxes 392 mdash 392 372 mdash 372Impairment and other charges (12) mdash (12) 716 mdash 716Other operating income (7) mdash (7) (8) mdash (8)Total operating expenses 6881 6136 13017 5010 5697 10707Operating (loss) income (321) (85) (406) 1601 (54) 1547Interest expense (671) (2) (673) (588) (1) (589)Other income and expenses 107 87 194 93 55 148(Loss) income before income taxes (885) mdash (885) 1106 mdash 1106Income tax (benefit) expense (696) mdash (696) (30) mdash (30)Net (loss) income (189) mdash (189) 1136 mdash 1136Preferred and preference stock dividend
requirements 121 mdash 121 124 mdash 124
Net (loss) income available for common stock ($310) mdash ($310) $1012 mdash $1012Less Non-core items (1750) (481)Core Earnings $1440 $1493
Note See Use of Non-GAAP Financial Measures
October 30 2019 45
Reconciliation of EIX Basic Earnings Per Share Guidance to EIX Core Earnings Per Share Guidance
EPS Attributable to Edison International 2019
Low Midpoint High
SCE $483
EIX Parent amp Other (032)
Basic EPS1 $441 $451 $461
Non-Core Items
SCE23 (029) (029) (029)
EIX Parent amp Other mdash mdash mdash
Total Non-Core1 (029) (029) (029)
Core EPS
SCE $512
EIX Parent amp Other (032)
Core EPS1 $470 $480 $490
1 EPS is calculated on the assumed weighted-average share count for 2019 Please see 2019 EIX Core Earnings Guidance slide for more information 2 Includes impact of 2018 GRC final decision related to impairment of utility property plant and equipment changes in allocation of deferred tax re-measurement between
customers and shareholders and SCErsquos contributions to the Wildfire Insurance Fund3 Includes $001 per share as a result of share count dilution
October 30 2019
Earnings Per Share Non-GAAP Reconciliations
46
Earnings Non-GAAP Reconciliations
1 Impact of 2018 GRC final decision related to impairment of utility property plant and equipment changes in allocation of deferred tax re-measurement between customers and shareholders SCErsquos contributions to the Wildfire Insurance Fund gain from sale of nuclear fuel and impact from the approval of the Revised San Onofre Settlement Agreement
2 Loss on sale of SoCore Energy and impact of hypothetical liquidation at book value (HLBV) accounting method
($ millions)
Reconciliation of EIX GAAP Earnings to EIX Core Earnings
Earnings Attributable to Edison International Q32019
Q32018
YTD 2019
YTD 2018
SCE $503 $536 $1215 $1119
EIX Parent amp Other (32) (23) (74) (112)
Basic Earnings $471 $513 $1141 $1007
Non-Core Items
SCE 1 ($48) 7 ($99) 7
EIX Parent amp Other 2 mdash (4) mdash (46)
Total Non-Core ($48) $3 ($99) ($39)
Core Earnings
SCE $551 $529 $1314 $1112
EIX Parent amp Other (32) (19) (74) (66)
Core Earnings $519 $510 $1240 $1046
October 30 2019 47
EIX Core EPS Non-GAAP ReconciliationsReconciliation of Edison International Basic Earnings Per Share to Edison International Core Earnings Per Share
Note See Use of Non-GAAP Financial Measures
Earnings Per Share Attributable to Edison International 2018 2017
Basic EPS ($130) $173
Non-Core Items
SCE
Wildfire-related claims net of recoveries (560) mdash
Settlement of 1994 ndash 2006 California tax audits 020 mdash
Write down impairment and other as a result of Revised San Onofre Settlement Agreement
003 (138)
Re-measurement of deferred taxes as a result of Tax Reform mdash (010)
Edison International Parent and Other
Settlement of 1994 ndash 2006 California tax audits (004) mdash
Re-measurement of deferred taxes as a result of Tax Reform mdash (133)
Sale of SoCore Energy and other (014) 004
Discontinued operations
Settlement of 1994 ndash 2006 California tax audits 010 mdash
Less Total Non-Core Items (545) (277)
Core EPS $415 $450
October 30 2019 48
Use of Non-GAAP Financial MeasuresEdison Internationals earnings are prepared in accordance with generally accepted accounting principles used in the United States Management uses core earnings internally for financial planning and for analysis of performance Core earnings are also used when communicating with investors and analysts regarding Edison Internationals earnings results to facilitate comparisons of the Companys performance from period to period Core earnings are a non-GAAP financial measure and may not be comparable to those of other companies Core earnings (or losses) are defined as earnings or losses attributable to Edison International shareholders less income or loss from discontinued operations and income or loss from significant discrete items that management does not consider representative of ongoing earnings such as exit activities including sale of certain assets and other activities that are no longer continuing asset impairments and certain tax regulatory or legal settlements or proceedings
A reconciliation of Non-GAAP information to GAAP information is included either on the slide where the information appears or on another slide referenced in this presentation
EIX Investor Relations Contact
Sam Ramraj Vice President (626) 302-2540 samramrajedisonintlcom
Allison Bahen Principal Manager (626) 302-5493 allisonbahenedisonintlcom
October 30 2019 49
Business Update
Slide Number 2
Table of Contents
EIX Strategy Should Produce Long-Term Value
SCE Highlights
Slide Number 6
SCE Historical Rate Base and Core Earnings
SCE Capital Expenditure Forecast
SCE Rate Base Forecast
Slide Number 10
Californiarsquos GHG Emissions Overview
SCErsquos Pathway 2045 Highlights
Slide Number 13
Slide Number 14
Slide Number 15
SCE Key Regulatory Proceedings
Slide Number 17
Slide Number 18
CPUC and FERC Cost of Capital Summary
CPUC Cost of Capital (2013-2019)
SCE Distribution System Investments
Slide Number 22
Slide Number 23
SCE Large Transmission Projects
SCE Operational Excellence
Responding to Industry Change
Slide Number 27
2019 EIX Core Earnings Guidance
EIX Annual Dividends Per Share
Appendix
EIXrsquos 2018 Sustainability Report Highlights
Slide Number 32
SCE Historical Capital Expenditures
Credit Ratings Summary
Distribution Power Grid of the Future
SCE Customer Demand Trends
SCE Bundled Revenue Requirement
Slide Number 38
SCE Rates and Bills Comparison
Slide Number 40
Slide Number 41
Slide Number 42
Slide Number 43
Slide Number 44
Slide Number 45
SCE Annual Results of Operations
Slide Number 47
Earnings Non-GAAP Reconciliations
EIX Core EPS Non-GAAP Reconciliations
Use of Non-GAAP Financial Measures
US Average
$134
SCE
$95
-291
US Average
128
SCE
164
higher
28
Created on Mon 6 Jun 2016 1250 PM EST (1750 GMT)
Concept
1990
1991
1992
1993
1994
1995
1996
1997
1998
1999
2000
2001
2002
2003
2004
2005
2006
2007
2008
2009
2010
2011
2012
2013
2014
2015
2016
2017
2018
2019
2020
2021
2022
2023
2024
2025
2026
Consumer Price Index All-Urban
131
136
140
144
148
152
157
161
163
167
172
177
180
184
189
195
202
207
215
215
218
225
230
233
237
237
239
245
251
258
265
272
279
286
293
300
306
422
304
297
260
281
294
234
155
219
337
282
160
230
267
337
322
287
381
-032
164
314
208
147
161
012
105
236
253
265
265
264
254
251
249
234
227
SOUTHERN CALIFORNIA EDISON
System Average Rate Forecast
Source Matt Sheriff
(centkWh)
SCE System Average Rate
SAR CPI (old)
SAR CPI (current)
CPI Los Angeles-Long Beach-Anaheim CA
Consumer Price Index All-Urban
0
1990
97cent
97cent
97cent
593
30
1
1991
103cent
101cent
101cent
410
422
2
1992
106cent
104cent
105cent
361
304
3
1993
103cent
107cent
107cent
253
297
4
1994
105cent
110cent
109cent
137
260
5
1995
107cent
113cent
110cent
153
281
25
6
1996
101cent
116cent
112cent
183
294
7
1997
101cent
119cent
114cent
158
234
8
1998
96cent
121cent
116cent
144
155
9
1999
96cent
124cent
119cent
235
219
10
2000
96cent
128cent
122cent
330
337
20
11
2001
142cent
131cent
127cent
336
282
12
2002
142cent
134cent
130cent
277
160
13
2003
124cent
137cent
133cent
259
230
14
2004
122cent
140cent
138cent
334
267
15
2005
126cent
145cent
144cent
447
337
16
2006
147cent
150cent
150cent
427
322
17
2007
139cent
154cent
155cent
328
287
18
2008
137cent
160cent
161cent
353
381
19
2009
143cent
159cent
159cent
-080
-032
20
2010
143cent
162cent
161cent
120
164
10
21
2011
141cent
167cent
166cent
267
314
22
2012
143cent
170cent
169cent
203
208
23
2013
159cent
173cent
171cent
108
147
24
2014
167cent
176cent
173cent
135
161
25
2015
159cent
176cent
175cent
091
012
5
26
2016
148cent
178cent
178cent
189
105
27
2017
157cent
182cent
183cent
279
236
29
20
10
28
2018
160cent
187cent
190cent
381
253
SCE
17
26
11
29
2019
159cent
192cent
195cent
244
265
LA
24
25
20
30
2020
194cent
197cent
199cent
219
265
36
31
2021
199cent
202cent
203cent
227
266
25
49
Created on Wed 23 Jan 2019 1245 PM EST (1745 GMT)
Mnemonic
Long Label
Last Update
Start Date
End Date
Frequency
1970
1971
1972
1973
1974
1975
1976
1977
1978
1979
1980
1981
1982
1983
1984
1985
1986
1987
1988
1989
1990
1991
1992
1993
1994
1995
1996
1997
1998
1999
2000
2001
2002
2003
2004
2005
2006
2007
2008
2009
2010
2011
2012
2013
2014
2015
2016
2017
2018
2019
2020
2021
2022
2023
2024
2025
2026
2027
2028
2029
2030
2031
2032
2033
2034
2035
2036
2037
2038
2039
2040
2041
2042
2043
2044
2045
2046
2047
2048
CPILANGAFRSM1
Los Angeles-Long Beach-Anaheim CA (MSA) [2013 Definition] FIPS Code 31080 Consumer Price Index for All Urban Consumers (1982-84=100) IHS MARKIT ECONOMICS December 2018 Forecast Source Bureau of Labor Statistics End of Historical Data 2017
122718
1970
2048
ANNUAL
3868
4011
4139
4374
4825
5334
5683
6080
6526
7233
8372
9184
9734
9907
10360
10838
11193
11667
12206
12826
13587
14143
14654
15025
15231
15464
15748
15997
16227
16608
17155
17732
18223
18696
19320
20183
21044
21734
22501
22322
22589
23193
23665
23921
24243
24463
24925
25621
26598
27248
27844
28475
29132
29806
30500
31165
31832
32533
33254
33985
34744
35508
36279
37061
37854
38640
39440
40278
41145
42043
42963
43898
44852
45825
46816
47822
48857
49934
51047
371
320
568
1031
1055
655
698
733
1083
1575
971
599
177
458
461
328
423
462
508
593
410
361
253
137
153
183
158
144
235
330
336
277
259
334
447
427
328
353
-080
120
267
203
108
135
091
189
279
381
244
219
227
231
231
233
218
214
220
222
220
223
220
217
215
214
208
207
213
215
218
219
218
217
217
216
215
216
220
223
Date of Report
July 26 2019
July 29 2019
July 29 2019
Edison International
Corporate Outlook
BBBStable
Baa3Stable
BBB-Stable
Senior Unsecured
BBB-
Baa3
BBB-
Commercial Paper
A-2
P-3
F3
Southern California Edison
Corporate Outlook
BBBStable
Baa2Stable
BBB-Stable
First Mortgage Bonds
A-
A3
BBB+
Senior Unsecured
BBB
Baa2
BBB
Preferred Securities
BB+
Ba1
BB+
Commercial Paper
A-2
P-2
F3
EIX Strategy Should Produce Long-Term ValueSustained Earnings and Dividend
Growth Led by SCE Electric-Led Clean Energy Future
SCE Rate Base Growth Drives Earningsbull 7-8 average annual rate base
growth through 2023bull SCE earnings expected to track rate
and reliabilitybull Grid resiliency and safetybull Grid modernization ndash Californiarsquos low-
carbon goalsbull Operational excellenceEdison Energy Strategybull Services for large commercial and
industrial customers
October 30 2019 3
One of the nationrsquos largest electric utilitiesbull 15 million residents in service territorybull 5 million customer accountsbull 50000 square-mile service area
Significant infrastructure investment
bull 14 million power polesbull 724000 transformersbull 127000 miles of distributiontransmission linesbull 3200 MW owned generation
Strong rate base growth driven bybull Safety and reliabilitybull Californiarsquos low-carbon objectives Grid modernization Transportation electrification Electric vehicle charging Energy storage
Limited Generation Exposurebull Own less than 20 of power generationbull Future needs via competitive solicitations
SCE Highlights
October 30 2019 4
SCE Long-Term Growth DriversDescription TimeframeRegulatory Process
Sustained level of infrastructure investment required until equilibrium replacement rates achieved and then maintained
bull Ongoing - current and future GRCs
Accelerate circuit upgrades automation communication and analytics capabilities at optimal locations to integrate distributed energy resources
bull 2018-2020 ndash Approximately $590 million of capital spending in 2018 GRC decision
bull 2021-2023 ndash Approximately $750 million of capital spending requested in 2021 GRC application
bull 2025 ndash CPUC target to complete grid modernization butmay take longer
Future transmission needs to meet 60 renewables mandate in 2030 100 cleanenergy by 2045 and to support reliability
bull 2017-2022 ndash Multiple projects approved by CAISO in permitting andor construction
bull 2023-2045 ndash Future needs largely driven by CAISO planning process
SCE-owned investment opportunities under existing CPUC proceedings
bull Today ndash Most commitments via contracts over 720 MW procured
bull 2019-2023 - $40 million of capital spending forecasted procurement target of 580 MW by 2020 as utility-owned or procured additional reliability proceeding ongoing
Utility investment in programs to build and support the expansion of transportation electrification in passenger and light- medium- and heavy-duty vehicles and potentially to support electrification of other sectors of the economy
bull 2018 ndash Medium- and Heavy-Duty (MDHD) Vehicle Transportation Electrification (TE) program approved totaling $356 million Charge Ready 2 application filed requesting $760 million Charge Ready Bridge Funding approved totaling $22 million
bull 2019-2030 ndash Potential investments to support electrification in other sectors of the economy
Utility investment and operational practices that mitigate increasing wildfire risk and bolster fire prevention activities
bull 2018 ndash Filed Grid Safety amp Resiliency application requesting $582 million of total costs (capital $407 million)
bull 2019 ndash Filed Wildfire Mitigation Planbull Ongoing ndash future GRCsbull First ~$16 billion fire risk mitigation capital spend will not
be added to rate base per AB 1054
Infrastructure Replacement
Grid Modernization
Electrification of Transportation and
Other Sectors
Energy Storage
Transmission
Wildfire Prevention and Mitigation
October 30 2019 5
SCE Historical Rate Base and Core Earnings($ billions except per share data)
Note Recorded rate base year-end basis See SCE Core EPS Non-GAAP Reconciliations and Use of Non-GAAP Financial Measures Since 2013 rate base excludes SONGS
$422$420$388 $468Core EPS $458
$211$233
$246$259
$278$296
2013 2014 2015 2016 2017 2018
$442
October 30 2019 6
SCE Capital Expenditure Forecast($ billions) $238 - $256 billion capital program
for 2019-2023bull This capital forecast includes 2018 GRC approved CPUC capital spend
for 2019-2020 2021 GRC requested CPUC capital spend
for 2021-2023 Non-GRC capital programs including
Charge Ready Pilot MDHD Transportation Electrification and 2019-2020 wildfire mitigation-related programs
FERC forecasted capital spendbull Long term growth drivers include Infrastructure Replacement Wildfire Mitigation Transportation Electrification Transmission Infrastructure
bull AuthorizedActual may differ from forecast previously authorized amounts in the last three GRC cycles were 89 92 and 922 of capital requested respectively
1 In accordance with Assembly Bill 1054 ~$16 billion of wildfire mitigation-related spend shall not earn an equity return See ldquoSCE Wildfire Capital Forecastrdquo slide for further information on wildfire-related capital spend
2 Approval percentage for the 2018 GRC excludes Grid Modernization and project approvals that were deferred to the next case for timing reasons3 The low end of the range for 2021-2023 reflects a 10 reduction on the total capital forecast using management judgment based on historical experience of previously authorized
amounts and potential for permitting delays and other operational considerations The low end of the range for 2020 reflects a 10 reduction applied only to FERC capital spending and non-GRC programs
1
Range Case3 $46 $48 $48 $48 $48
7
$262$285
$307$334
$360$382
2017 2018 2019 2020 2021 2022 2023
SCE Rate Base Forecast($ billions)
1 Morongo Transmission holds an option to invest up to $400 million in the West of Devers Transmission Project or half of the estimated cost of the transmission facilities only at the in-service date estimated to be 2021 In the table above the rate base has been reduced to reflect this option Capital forecast includes 100 of the project spend
2 Rate base forecast range case reflects capital expenditure forecast range Note Weighted-average year basis FERC based on latest forecast and represents approximately 20 of total rate base throughout the forecast period CPUC excludes the ~$16 billion of SCErsquos fire risk mitigation capital expenditures in accordance with Assembly Bill 1054 CPUC also excludes the ldquorate-base offsetrdquo adjustment related to the 2015 GRC write off of the regulatory asset for 2012-2014 incremental tax repairs and rate base associated with projects or programs that have not yet been approved
Range CaseCAGR
Range Case2 $307 $332 $353 $369 $390 69
October 30 2019
$408
1
8
bull Under AB 1054 ~$16 billion of SCErsquos fire risk capital expenditures per CPUC-approved Wildfire Mitigation Plan shall not earn an equity return SCE assumes all CPUC-jurisdictional wildfire-related
mitigation spend generally incurred after AB 1054 passage will be eligible to meet the requirement until the ~$16 billion has been incurred
Spending can be recovered from ratepayers through a securitizable dedicated-rate component
bull Main wildfire-related programs include Covered Conductor Program ndash Risk-prioritized
replacement of more than 6000 miles of bare conductor to covered conductor by 2023
Preventative Maintenance Program ndash Enhanced inspection program within High Fire Risk Areas (HFRAs) designed to proactively detect and timely remediate potential in-service failures
SCE Wildfire Capital Forecast($ billions)
$42 Billion Capital Request for 2019-20231
$03
$07$06$01
$03
$10$12
$04
$07
$09$10
$12
2019 2020 2021 2022 2023
All Other Wildfire-Related MitigationSpendWildfire-Related Mitigation Spend -AB1054
1
1 Includes FERC wildfire mitigation-related spending of $13 million $5 million $5 million $4 million and $4 million for each respective yearNote Totals may not foot due to rounding Forecast based on 2018 GRC request levelsOctober 30 2019 9
10
bull SB 350 requires a doubling of energy efficiency in existing buildings for California by 2030bull SB 32 requires statewide GHG emissions to be reduced to 40 below the 1990 level by 2030 Governor Order set a 2050
target of 80 below 1990 levelsbull SB 100 requires that 60 of energy sales to customers come from renewable power by 2030 and sets a 100 clean
electricity goal for the state and issued an executive order establishing a new target to achieve carbon neutrality both by2045
Californiarsquos GHG Emissions Overview
Commercial and Residential
12Electrical
Power15
Agriculture8
Industrial 24
Transportation41
SCE is taking a leading role to ensure that transportation and building electrification plays a major part in reducing GHG and criteria pollutant emissions in California
Source Data for both charts from California Air Resources Board California GHG Emissions data as of 2017
October 30 2019
State Carbon Emissions Reduction PathwayAnnual million metric tons (MMT)
ldquoAdaptation to climate change must begin in earnest ndash which SCE is doing in part with our grid hardening situational awareness and operational changes ndash but we must act on longer term solutions as wellrdquo ndash Pedro Pizarro Edison International CEO
SCErsquos Pathway 2045 Highlights
October 30 2019
bull 100 of grid sales with carbon-free electricity
bull 80 GW of utility-scale clean generation
bull 30 GW of utility-scale energy storage
bull 33 of space and water heating to be electrified by 2030
bull 70 of space and water heating to be electrified by 2045
bull Building electrification will increase load significantly by 2045 ndash representing 15 of the total load
bull 75 of light-duty vehicles need to be electric
bull 66 of medium-duty vehicles need to be electric
bull 33 of heavy-duty vehicles need to be electric
bull Until there is an alternative natural gas generation capacity provides a crucial role for reliability and affordability
bull 40 of natural gas that remains will be decarbonized through the addition of biomethane and hydrogen
Achieve carbon neutrality by 2045 through powering 100 of grid sales with carbon-free electricity electrifying the transportation and building sectors and using low-carbon fuels
for technologies that are not yet viable for electrification
11
Summary of Assembly Bill 1054 and Assembly Bill 111
Safety Oversight and Certification
bull Creates Wildfire Safety Division1 to provide additional wildfire safety oversightbull Initial safety certification issued by CPUC Executive Director within 30 days of IOU request requires 1) an approved wildfire
mitigation plan 2) utility to be in good safety standing 3) established board safety committee with relevant safety experience and 4) board-level reporting to the CPUC on safety issues
bull Subsequent annual safety certifications issued by Wildfire Safety Division1 also require 5) approved executive compensation structure that promotes safety ensures public safety and utility financial stability 6) compensation limits on executive officer contracts and 7) implementation of and reporting to the CPUC on wildfire mitigation plans safety culture assessments and board safety committee recommendations
Cost Recovery Standard
bull Provided a utility is ldquosafety certifiedrdquo and elects to participate in the wildfire ldquoinsurancerdquo fund (described below) establishes a FERC-like prudence standard to guide recovery of costs arising from catastrophic wildfires occurring after bill enactment
bull Prudence is based on reasonable utility conduct with potential for full or partial recovery considering factors within and beyond a utilityrsquos control
bull FERC-like standard assumes utility is prudent unless intervenors create serious doubt shifting burden to the utility to prove prudence
Wildfire Fund
bull Establishes a wildfire fund to help wildfire victims and affected communities recover and rebuild more quicklybull Wildfire ldquoinsurancerdquo fund is an insurance-like fund that more broadly socializes wildfire costs utilities participation is voluntarybull Fund includes a $105 billion ratepayer contribution through the financing of a 15-year extension of the Department of Water
Resources bond charge wildfire insurance fund also includes $105 billion contribution from utility shareholdersbull All three IOUs have elected to participate PGampE must emerge from bankruptcy by June 30 2020 to participate SCErsquos shareholders initially contributed approximately $24 billion on September 10 and expect to contribute approximately
$95 million annually on January 1 for 10 years2
Mitigation CapEx
bull First $16 billion of SCErsquos fire risk mitigation capital expenditures as approved in wildfire mitigation plans shall not earn an equity return but can be recovered from ratepayers through a securitizable dedicated rate component2
Liability Cap bull While fund remains solvent wildfire cost disallowances capped over each trailing 3-year period to 20 of TampD equity rate basebull Must be safety certified and not found to be acting with willful or conscious disregard of the safety of others
October 30 2019
1 Wildfire Safety Division created within CPUC until duties transferred to newly formed Office of Energy Infrastructure Safety on or after July 2021 2 Excluded from measurement of regulatory capital structure
2019 Wildfire Legislation Update
12
Mitigating Catastrophic Wildfire RiskSCE plans to spend significant capital and OampM from 2019-2023 including ~$16 billion of AB 1054 spend with continued investments beyond our forecast periodbull SCErsquos comprehensive risk mitigation program focuses on three key areas Grid hardening Increase the use of fire-resistant poles composite cross-arms and
covered conductor in high fire risk areas evaluate design approaches and next-generation engineering technology to further enhance public safety
Increased situational awareness capabilities Expand meteorological monitoring and forecasting capabilities by installing additional weather stations and high-definition cameras to help SCE and fire agencies to better prepare mitigate and respond to reported fires
Enhanced operational practices Restrict certain types of work in High Fire Risk Areas (HFRAs) during elevated fire risk conditions increase overhead inspection of equipment in HFRAs reduce fire risk via a Public Safety Power Shutoff in HFRAs during elevated weather conditions increase tree trimming and removal to further mitigate safety risks posed by trees or debris
bull Will file next compliance plan (Wildfire Mitigation Plan) detailing the near- and longer-term actions that SCE is taking to significantly reduce the risk of fire ignitions and increase emergency response and grid resiliency against future impacts of climate change in early 2020
bull 1700+ protective devices programmed with more sensitive (fast curve) settings (includes automatic reclosers and circuit breakers)
bull In-house team of fire weather experts staffing our 247 Situational Awareness Center
bull 450+ installed weather stations with a target of 850 by end of 2020
bull 130+ installed HD cameras with a target of 160 installations providing 90 coverage by end of 2019
bull Developed enhanced Fire Potential Index (FPI) to measure wildfire potential at the circuit level
bull 2 supercomputers being installed to run advanced weather models to improve forecast resolution
bull Completed Enhanced Overhead Inspections of 400000+ TampD structures in HFRA
bull Deploying helicoptersdrones to perform aerial inspections of our facilities in HFRA
bull 2100+ Circuit BreakerRecloser Blocking devices remotely set to not automatically re-energize lines during high fire risk conditions
bull Enhanced Vegetation Management Increasing trim distances to keep
power lines clear Performing inspectionsremoval
of hazard trees that pose riskbull Refined Public Safety Power
Shutoff (PSPS) protocol and communication
14
SCE Key Regulatory ProceedingsProceeding Description Next Steps
Key CPUC Proceedings
2021 General Rate Case (A 19-08-013)
Set CPUC base revenue requirement capital expenditures and rate base for 2021-2023
Application filed August 30 2019 awaiting scoping memo
2020 Cost of Capital(A 19-04-014)
Sets CPUC cost of capital and capital structurefor 2020-2022
Application filed April 22 2019 Scoping Memo issued July 2 2019 awaiting proposed decision (expected end of November 2019)
Grid Safety and Resiliency Program (GSRP) (A 18-09-002)
Requesting $582 million of total cost for 2018-2020 focused on grid hardening and enhanced vegetation management
Settlement filed for in July 2019 awaiting CPUC approval
Application for Recovery of WEMA costs (A 19-07-020)
Requesting recovery $505 million in insurance premiums tracked in the WEMA
Application filed July 31 2019 pre hearing conference scheduled for October 29 2019 scoping memo will follow
Application for Recovery of CEMA costs(A 19-07-021)
Requesting recovery $138 million in costs tracked in the CEMA for drought-related work and for work related to 2017 fires
Application filed July 31 2019 pre hearing conference scheduled for October 29 2019 scoping memo will follow
Non-Bypassable Charge OIR(I 19-07-017)
Approval of the extension of the DWR charge to fund the wildfire fund as per AB 1054
The CPUC rulemaking on the non-bypassable charge to support the Wildfire Fund was approved on October 24 2019
Charge Ready Program(A14-10-014 A18-06-015)
Implementation program for charger installations and market education
Pilot report filed in May 2018 Charge Ready Bridge Funding approved in December 2018 expecting proposed decision in fourth quarter 2019
Distribution Resources Plan (DRP) OIR (R14-08-013)
Power grid investments to integrate distributed energy resources
Demo projects have been terminated due to significant delays in project schedules No contracts will be executed in the solicitation for deferral projects due to lack of viable bids
Power Charge Indifference Adjustment (PCIA) OIR (R17-06-026)
Review revise and consider alternatives to the PCIA
Final Phase 1 Decision adopted on October 11 2018 Final Phase 2 Decision on benchmark refinementtrue-up was approved on October 10 2019
Key FERC Proceedings
FERC Formula Rates Transmission rate setting with annual updates Replacement rate filed on October 27 2017 settlement covering 1118 through 111119 filed and waiting FERC approval New replacement rate accepted June 11 partial settlement reduced request to 1197 settlement discussions are continuing
October 30 2019 15
Filed August 30 2019 SCErsquos 2021 GRC request balances the need to advance Californiarsquos ambitious decarbonization policy goals and address emergent wildfire public safety risks while continuing to provide safe reliable and affordable service to customersbull 2021 GRC Application (A 19-08-013) addresses major portion of CPUC-jurisdictional revenue
requirement for 2021-2023 Includes operating costs and capital investment Excludes CPUC jurisdictional costs such as fuel and purchased power cost of capital and other
discrete SCE capital projects (such as Charge Ready 2 ndash SCErsquos transportation electrification infrastructure program)
Excludes FERC-jurisdictional transmission revenue requirementbull Requests 2021 revenue requirement of $7601 billion $1155 billion increase over 2020 authorized revenue requirement a 127 increase over total rates1
Requests increases of $400 million in 2022 and $531 million in 2023bull Multi-track schedule proposed to approve 2021-2023 revenue requirement and reasonableness of
additional 2018-2020 recorded incremental amounts associated with the Fire Mitigation memorandum accounts (FMA)2 (See ldquoSCE 2021 General Rate Case Timelinerdquo for more information)
SCE 2021 General Rate Case Overview
October 30 2019
1 127 includes the impact of lower anticipated 2021 kWh sales and recoveries of $87 million of non-wildfire memo accounts2 Includes Wildfire Mitigation Plan Memo Account Fire Hazard Prevention Memo Account Grid Safety and Resiliency Program Memo Account and Fire Risk Mitigation Memo Account
16
bull Track 1 includes approval of the 2021-2023 GRC revenue requirement and reasonableness of additional 2018-2019 recorded incremental amounts associated with the Fire Mitigation memorandum accounts1
bull Track 2 includes approval of 2020 recorded incremental amounts associated with the Fire Mitigation memorandum accounts1 and 2018-2020 Grid Safety and Resiliency Program (GSRP) costs above settlement amount
SCE 2021 General Rate Case Timeline
October 30 2019
1 Includes Wildfire Mitigation Plan Memo Account Fire Hazard Prevention Memo Account Grid Safety and Resiliency Program Memo Account and Fire Risk Mitigation Memo AccountNote Actual schedule to be set by CPUC in a future regulatory order The schedule is subject to change over the course of the proceeding
Estimated
2021
Q1
Rebuttal Final Decision
Intervenor Testimony
Proposed Decision
Evidentiary Hearings
2020 FMA Update
Q2 Q3 Q4
GRCApplication
Rebuttal
Final Decision
Intervenor Testimony
Proposed Decision
Evidentiary Hearings
2018-2019 FMA Update
2019 2020
Q1 Q2 Q3 Q4 Q1 Q2 Q3 Q4
Estimated
17
CPUC and FERC Cost of Capital Summary
bull Litigated proceeding separate from GRC filed on April 22nd
bull Request for three-year period starting January 1 2020
bull SCE PGampE SDGampE and SoCalGas concurrently filed applications applications were consolidated into one proceeding
bull Proposed trigger mechanism for adjusting the cost of capital between proceedings (similar to current mechanism)
CPUC Cost of Capital FERC Rate Case
bull New Rate Case filed on April 11th
bull Updated formula rate becomes effective November 12 2019 if accepted by FERC subject to refund
bull Capital structure at FERC is based on recorded level vs CPUC ldquoauthorizedrdquo approach
Component Cost Weighted Cost
Conventional ROE 1060
Wildfire Risk ROE 085
Common Equity 520 1145 595
Long-Term Debt 430 474 204
Preferred Equity 50 570 029
Total 1000 828
Breakdown of Return on Equity (ROE) Cost
Conventional ROE 1112
Wildfire Risk ROE 085
Requested ROE + 1197
CAISO adder + 050
Incentive Projects Varies
October 30 2019 18
CPUC Cost of Capital (2013-2019)
Two year settlement approved for 2018-2019bull ROE adjustment based on 12-month average of
Moodyrsquos Baa utility bond rates measured from October 1 to September 30
bull If index exceeds 100 bps deadband from starting index value authorized ROE changes by half the difference
bull Starting index value based on trailing 12 months of Moodyrsquos Baa index as of September 30 of each year ndash500
CPUC Authorized Capital
Structure 2018-2019Common Equity 48 1030
Preferred 9 582Long-term Debt 43 498
Weighted Average Cost of Capital 761
October 30 2019 19
3
4
5
6
7
10112 10113 10114 10115 10116 10117 10118 10119
Rate
()
Starting Value ndash 500
CPUC Adjustment Mechanism
Moodyrsquos Baa Utility Index Spot Rate
Moving Average (10118 ndash 10119) = 450
100 basis point +- Deadband
ROE fixed at 1030 for 2018 independent of trigger mechanism
ROE fixed at 1045 for 2017 independent of trigger mechanism
SCE Distribution System Investments
1 Deferrals required with infrastructure replacement load growth and grid modernization programs2 Other includes among other things grid modernization emergency management customer requested system modifications and transportation electrification programsNote Forecast based on 2021 GRC request levels
Distribution Trendsbull Capital expenditures for certain programs deferred over
next five years to support reallocation of distribution resources to wildfire mitigation1 historical program funding levels will be reinstated in subsequent GRC periods in order to resume trajectory towards equilibrium replacement rate
bull Distribution grid requires upgrades to circuit capacity automation and control systems to support various grid resiliency and reliability objectives as well as increased use of distributed energy resources
2019 ndash 2023 Capital Spending Forecast for Distribution2 - $208 billion
2019-2023 Capital Spending Driversbull Automation of distribution circuitsbull Pole replacements bull Load growth upgradesbull Cable and overhead conductor replacementsbull Preventive and breakdown maintenancebull Circuit breaker transformer bank and relay
replacementsupgradesbull New Service Connections
October 30 2019
Load Growth
New Service Connections
Infrastructure Replacement
General Plant
Other
Wildfire
20
Charge Ready Bridge Funding and 2
SCE Transportation Electrification (TE) Proposalsbull Proposals build on SCErsquos Clean Power and Electrification Pathway which is an integrated approach to
reduce GHG emissions and air pollution by taking action in three California economic sectors electricity transportation and buildings
bull These programs accelerate electrification of the transportation sector supporting SCErsquos vision of placing at least 7 million light-duty passenger vehicles on the roads and transitioning to zero-emission trucks and transit Additional studies launched to increase adoption such as electrification of the Interstate 5 corridorMedium- and Heavy-Duty (MDHD) Vehicle
Transportation Electrification Program
Charge Ready Pilot - $22 million Total Cost1 (in 2014 dollars) approved January 2016bull Approved capital spend of $12 million OampM of $10 millionbull Supports 1280 chargersbull Included in capital spend and rate base forecasts
$356 million Total Cost1 (in nominal dollars) approved May 2018 bull 5-year programbull Approved capital spend of $242 million OampM of $115
millionbull Included in capital spend and rate base forecasts
1 Total Cost includes both OampM and capital spend
Charge Ready ldquoBridgerdquo Funding - $22 million Total Cost (in 2014 dollars) approved December 2018bull Additional approved capital spend of $12 million OampM
of $10 million bridge funding must be subtracted from any authorized Charge Ready 2 funding
bull Included in capital spend and rate base forecastsbull SCE to install at least 1000 chargers including 20 in
multi-unit dwellingsCharge Ready 2 ndash $760 million Total Cost1 (in 2018 dollars) filed June 2018 (pending CPUC approval)bull 4-year program providing over 50000 chargersbull $561 million in capital spend OampM of $199 millionbull Not included in capital spend or rate base forecasts
Charge Ready Pilot
October 30 2019 21
310
185
85
0
50
100
150
200
250
300
350
Transmission Distribution Customer
MW
SCE 2018 Storage Portfolio
Up to 80 of MW to be shifted between
TampD
85 MWexcess may offset TampD
targets
Eligible storage to be included in 2020 Storage compliance Plan (Filing date 312020)
Storage that is permitted to count in different categories due to flex counting rules
Currently above targets
2020 Cumulative Procurement Target
SCE Energy StorageCPUC Energy Storage Program Requirements
bull Storage Rulemaking (R10-12-007) established 1325 MW target for IOUs by 2024 (580 MW SCE share spread as biennial targets during 2014-20) ownership allowed up to 290 MW for SCE
bull Flexibility to transfer across categories expanded in Storage Rulemaking (R15-03-011)
SCE Procurement Activities to Meet CPUC Requirements
bull SCE has procured over 720 MW of energy storage (includes 60 MW of utility owned storage) ~600 MW of which is eligible to count towards CPUC targets
bull SCE submitted its 2018 Local Capacity Requirements RFP (2018 LCR RFP) and its second Aliso Canyon Energy Storage RFO (ACES 2 RFO) for approval Upon Commission approval of these energy storage resources SCE will have exceeded the 580 MW target set by AB 2514
bull SCE filed its 2018 Energy Storage and Investment Plan (ESPampIP) on March 1 2018 the AB 2514 track was approved by D18-10-036 on October 25 2018 however the Commission rejected SCErsquos AB 2868 proposals in D19-06-032
SCE Procurement to Meet System Reliability Needs
bull A Proposed Decision (PD) Issued in the Integrated Resources Plan (IRP) Proceeding (R16-02-007) directs SCE to procure 1745 MW of incremental system resource capacity to come online between August 1 2021 and August 1 2023 SCE Launched its 2019 System Reliability RFO on September 12 2019 Energy Storage will be an eligible resource to be procured in this RFO
bull In light of the IRP PD SCE concurrently launched a separate track to procure utility owned energy storage systems which will be referred to as the Reliability Owned Energy Storage (RUOES) procurement
October 30 2019 22
SCE Large Transmission Projects
FERC Cost of Capital112 ROE from January 1 2018 to November 12 2019bull ROE = Base (plus incentives) of 107 + CAISO Participation Application for FERC Formula recovery mechanism post
November 12 2019 was filed April 11 2019 Requested 50 bp CAISO adder approved but application for
rehearing requested by CPUC
Summary of Large Transmission Projects
Project Name Total Cost5 Remaining Investment(as of September 30 2019)
Estimated In-ServiceDate
West of Devers12 $848 million $416 million 2021
Mesa Substation1 $646 million $296 million 2022
Alberhill System3 $486 million $446 million mdash 3
Riverside Transmission Reliability4 $451 million $441 million 2024
Eldorado-Lugo-Mohave Upgrade $257 million $180 million 2021
1 CPUC approved2 Morongo Transmission holds an option to invest up to $400 million or half of the estimated cost of the transmission facilities only at the in-service date If the option is
exercised SCErsquos rate base would be offset by that amount 3 In August 2018 the CPUC approved the revised alternate decision which left the proceeding open and directed SCE to supplement the existing record with additional analysis
as it relates to the Project need and alternatives Potential revisions to the Project have not been reflected in the total cost of the Project or estimated in service date 4 Riverside Transmission Reliability Project total cost is currently estimated to be $451 million however costs could increase depending on the final route alternative selected5 Total Costs are nominal direct expenditures subject to CPUC and FERC cost recovery approval SCE regularly evaluates the cost and schedule based on permitting processes
given that SCE continues to see delays in securing project approvalsOctober 30 2019 23
SCE Operational Excellence
Top Quartilebull Safetybull Reliabilitybull Customer servicebull Cost efficiency
Optimizebull Capital productivitybull Purchased power costbull Digitization
High performing continuous improvement culture
Defining Excellence Measuring Excellence
bull Employee and public safety metrics
bull System performance and reliability (SAIDI and SAIFI)
bull Customer satisfaction calculation based on internal voice-of-customer surveys
bull OampM cost per customerbull Reduce system rate growth
with OampM purchased power cost reductions
Ongoing Operational Excellence
Efforts
October 30 2019 24
Responding to Industry ChangeLong-Term Industry Trends Strategy
bull The technology landscape is evolving at an unprecedented pace with innovation driving advances in cost and capabilities of distributed energy resources
bull Customer expectations are changing with increasing choices and alternatives a growing priority of sustainability objectives and flattening demand
bull The regulatory environment for utilities is complex increasingly supportive of new forms of competition but unable to keep pace with new business models
bull Policies both in California and globally are setting aggressive greenhouse gas reduction targets
SCE Strategybull Clean the power system by accelerating
the de-carbonization of electricity supplybull Help customers make cleaner energy
choices to support electrification and leverage flexible energy demand
bull Strengthen and modernize the grid by replacing aging infrastructure and deploying technology
bull Achieve operational and service excellence with top tier performance in safety reliability affordability and customer satisfaction
Beyond SCEbull Position Edison Energy as an independent
energy advisor and integrator for large commercial and industrial customers
bull Further clean energy and sustainability efforts in California through Edison Energy insights
October 30 2019 25
bull Energy is a significant risk large commercial and industrial customers face Edison Energy creates competitive advantage for market leaders by quantifying this risk and designing the portfolio solution to protect shareholder value threatened by complex energy policies increasing sustainability needs technological advancements and new products
bull Optimized energy solutions based on robust analytics of the customerrsquos energy portfolio in alignment with their goals and strategic objectives
bull Implementation of solutions through existing service lines or brokering with third parties
bull Edison International investment $83 million as of September 30 2019
Edison Energy
Edison Energy Summary
The Opportunity Trusted Advisor and Solution Integrator
Managed Portfolio Solution
Renewables amp Sustainability
Supply Solutions
Demand Solutions
Installations
October 30 2019 26
27
Total Rate Base $307 billion
bull FERC comprises ~20 of total
CPUC
Return on Equity (ROE)
103
Capital Structure2 48 equity
FERC
ROE3 112 with incentives(previously 105 with incentives)
Capital Structure Recorded capital structure 45 2019 average estimated equity
Other Items
Capital Market Activities
$49 billion of EIXSCE debt and equity issuances in addition to SCErsquos normal course debt financing of rate base
$468 $480
($033)($024)$041
$029
SCE 2019 EPSfrom Rate
Base Forecast
SCEVariances
2018 True-Ups
EIX Parentamp Other
EquityProgram WF FundFinancing
EIX 2019 CoreEPS Midpoint
Guidance
bull Financing and other$032
bull Z-factor advice letter approval $004
bull Energy efficiency $005
2019 Core Earnings Per Share Guidance ndashBuilding from SCE Rate Base
bull HoldCo operating expenses (1) cent per share per month
bull HoldCo debt issued $1 billion in 2019 ($400 million of issuance remaining)
bull EEG target breakeven run rate by year-end 2019
EIX 2019 Core EPS guidance range of $470 - $490 midpoint $009 higher than prior
Key Assumptions
Note See Earnings Per Share Non-GAAP Reconciliations and Use of Non-GAAP Financial Measures in Appendix All tax-affected information on this slide is based on our current combined statutory tax rate of approximately 28 Totals may not foot due to rounding
1 Reflects actual financing activity at SCE (August 1st debt offering) and EIX (July 30th equity offering) versus prior guidance based on assumption that financing would occur on September 10th
2 On February 28 2019 SCE filed an application with the CPUC for a waiver of compliance with this equity ratio requirement describing that while the wildfire-related charge accrued in the fourth quarter of 2018 caused its equity ratio to fall below 47 on a spot basis as of December 31 2018 SCE remains in compliance with the 48 equity ratio over the applicable 37-month average basis While the CPUC reviews the waiver application SCE is considered in compliance with the capital structure rules
3 SCErsquos April 11 2019 TO2019A filing to revise its ROE is pending review with the FERC and not reflected in guidance assumptions
2019 EIX Core Earnings Guidance
bull Test year 2018 GRC true-up $020
bull FERC ROE settlement (prior year)$009
bull Previously announced financing plan (debt and equity) ($018)
bull Update to financing plan based on actual results ($006)
bull Remaining previously disclosed equity plan $05 billion
1 2019 dividend annualized based on December 6 2018 declaration
Fifteen Consecutive Years of Dividend Growth
Target dividend growth within target payout ratio of 45-55 of SCErsquos earnings
1
October 30 2019 28
Appendix
October 30 2019 29
EIXrsquos 2018 Sustainability Report Highlights
Edison Energy is not the same company as Southern California Edison the utility and Edison Energy is not regulated by the California Public Utilities Commission Cumulative duration (in minutes) of sustained repair outages lasting longer than five minutes experienced by the average customer in a year (including major event days) In February 2019 the EIX board approved a $3 million donation to the Edison International Wildfire Assistance Fund to enhance community resiliency and wildfire prevention and
mitigation This affects the 2019 data year and is not reflected here
October 30 2019
ldquoAt Edison International we are leading the transformation of the electric power industry toward a clean energy future by focusing on opportunities in clean energy efficient electrification the grid of the future and customer choice As we pursue this vision sustainability remains at the core of who we are and what we dordquo ndash Pedro Pizarro Edison International CEO
bull Earnings not affected by variability of retail electricity salesbull Differences between amounts collected and authorized levels
either billed or refundedbull Promotes energy conservationbull Stabilizes revenues during economic cycles
Major Balancing Accountsbull Salesbull Fuel and Purchased powerbull Energy efficiencybull Pension expense
bull Cost-recovery related balancing accounts represented more than 59 of costs
bull Trigger mechanism for fuel and purchased power adjustments at 5 variance level
Advanced Long-TermProcurement Planning
bull Upfront contract approvals and prudency standards provide greater certainty of cost recovery (subject to compliance-related reasonableness review)
Forward-looking Ratemaking bull Forward and test year GRC with three-year rate cycle bull Separate cost of capital mechanism
October 30 2019 31
SCE Historical Capital Expenditures($ billions)
$40 $39
$35$38
$44
2014 2015 2016 2017 2018
October 30 2019 32
Credit Ratings Summary
Date of Report July 26 2019 July 29 2019 July 29 2019
Edison InternationalCorporate Outlook BBBStable Baa3Stable BBB-StableSenior Unsecured BBB- Baa3 BBB-Commercial Paper A-2 P-3 F3
Southern California EdisonCorporate Outlook BBBStable Baa2Stable BBB-StableFirst Mortgage Bonds A- A3 BBB+Senior Unsecured BBB Baa2 BBBPreferred Securities BB+ Ba1 BB+Commercial Paper A-2 P-2 F3
FitchMoodyrsquosSampP
October 30 2019 33
4
ampCalibriRegularFINANCIAL AND STATISTICAL REPORTampCalibriRegularampA
Distribution Power Grid of the Future
One-Way Electricity Flowbull System designed to distribute electricity
from large central generating plantsbull Voltage centrally maintainedbull Increasing integration of distributed
energy resourcesbull Limited situational awareness and
visualization tools for power grid operators
Renewable Generation Mandates
Subsidized Residential Solar
Limited Electric Vehicle Charging Infrastructure
Variable Two-Way Electricity Flowbull Distribution system at the center of the
power gridbull System designed to manage fluctuating
resources and customer demand bull Digital monitoring and control devices and
advanced communications systems to improve safety and reliability and integrate DERs
bull Improved data management and power grid operations and cyber risk mitigation
bull Integrated utility distribution with distributed energy resources planning
Maximize Distributed Resources and Electric Vehicle Adoptionbull Distribution power grid infrastructure
design supports customer choice and greater resiliency
Current State Future State
October 30 2019 34
SCE Customer Demand Trends
Note See Edison International Financial and Statistical Reports for 2017 for further information
Kilowatt-Hour Sales (millions of kWh) 2014 2015 2016 2017 2018
Residential 30027 30093 29579 30221 29865
Commercial 42004 42396 42189 42514 42369
Industrial 8392 7623 7162 6659 6786
Public authorities 4975 4795 4715 4711 4510
Agricultural and other 2019 1950 1803 1498 1745
Subtotal 87416 86857 85448 85602 85276
Resale 1308 1080 1794 1568 1867
Total Kilowatt-Hour Sales 88725 87937 87242 87170 87143
Total Number of Customers 5005401 5033330 5060528 5094818 5126985
Number of New Connections 29879 31653 38076 39621 39633
Area Peak Demand (MW) 23055 23079 23091 23508 23766
October 30 2019 35
SCE Bundled Revenue Requirement
Note Rates in effect as of July 26 2019 Represents bundled service which excludes Direct AccessCCA customers that do not receive generation services from SCE
SCE Systemwide Average Rate History (centkWh)
2010 2011 2012 2013 2014 2015 2016 2017 2018 2019
143 141 143 159 167 162 148 157 160 159
Fuel amp Purchased Power(47)
Distribution(38)
Transmission (8)
Generation(8)
Other (-1)
2019 Bundled Revenue
Requirement
$millions centkWh
Fuel amp Purchased Power ndash includes CDWR Bond Charge
4422 74
Distribution ndash poles wires substations service centers Edison SmartConnectreg
3628 61
Generation ndash owned generation investment and OampM 708 12
Transmission ndash greater than 220kV 789 13
Other ndash CPUC and legislative public purpose programs system reliability investments nuclear decommissioning and prior-year over collections
(116) (01)
Total Bundled Revenue Requirement ($millions) $9431
divide Bundled kWh (millions) 59396
= Bundled Systemwide Average Rate (centkWh) 159cent
October 30 2019 36
37
97cent
159cent
80cent
100cent
120cent
140cent
160cent
180cent
200cent
220cent
1990
1991
1992
1993
1994
1995
1996
1997
1998
1999
2000
2001
2002
2003
2004
2005
2006
2007
2008
2009
2010
2011
2012
2013
2014
2015
2016
2017
2018
2019
195cent
Rates reduced due to the implementation of 1) the SONGS Revised Settlement including NEIL insurance benefits 2) lower fuel amp purchased power costs and 3) a lower 2015 GRC revenue requirement that includes flow-through tax benefits
centkWh
System Average Rate Historical Growth
SCErsquos system average rate has grown less than inflation over the last 29 years
SCE System Average RateLos Angeles Area Inflation
Comparative System Average Rates
Delta to SCESCE 159cent --
PGampE 211cent1 33
SDGampE 246cent1 55
CAGR29-yr
(lsquo90-rsquo19)20-yr
(lsquo99-rsquo19)10-yr
(lsquo09-19)17 26 1124 25 20
Energy Crisis and return to normal
Higher gas price forecast post-Katrina leads to higher rates with subsequent refund of over collection
Delay in 2012 GRC leads to shorter ramp-up of rate increase
1 PGampE Advice 5644-E effective October 1 SDGampE Advice 3377-E effective June 1
October 30 2019
Data
SCE System Average Rate
1990199119921993199419951996199719981999200020012002200320042005200620072008200920102011201220132014201520162017201820199699999999999999310310610310510710110196969614214212412212614713913714314314114315916715940876786458386148350382761769171566871495475337116159CPI Los Angeles-Long Beach-Anaheim CA199019911992199319941995199619971998199920002001200220032004200520062007200820092010201120122013201420152016201720182019202096999999999999993100974239450441131046212585868498310726876840039228108738285083414611104041339548576811242695044160916114205839057899881158478900883218511856679342492612122475588812561061265926153091265513010279685966582133476140824337041379322865554462144095927379783561502417198233561515516495767909655160640840897938551593635512757601816127380397448466165581867639842851689511064769380217077830471050007173082233194307481746514628312063517794555998527898182917523920509811898939005269867419453007660169238SAR CPI (old)1990199119921993199419951996199719981999200020012002200320042005200620072008200920102011201220132014201520162017201820199699999999999999310108935518848128104164104853626311072574143759422111004139294598572113128515849244651164507302761853711917284265578923121016455131068581236705147011944127834109318192141314347216021390513353198545827113660054850437767140244467121649041449648574526591614963575483132515393112443397234159803525097292715929158237134114161898499904328691669815498437507617045100580396491729508329612907517573561579182243175943857388863061777863624593457518198880904395583186584452388557219152742489955948
195cent
CPI Workbook
image1png
129 ₵
164 ₵
US Average SCE
27 Higher
SCE Rates and Bills Comparison
SCErsquos average residential rates are above national averagebut residential bills are below national average due to lower usage
bull SCErsquos residential rates are above national average due in part to a cleaner fuel mix high cost of living and lower system load factor
bull SCErsquos residential customer usage is lower than the national average due to mild climate and higher energy efficiency appliance and building standards
bull Average monthly residential bills are lower than the national average as higher rate levels are more than offset by lower usage
Key FactorsKey Factors
Source EIAs Form 861M (formerly Form 826) Data Monthly Electric Utility Sales and Revenue Data for 12-Months Ending June 2019 httpswwweiagovelectricitydataeia861mindexhtml
2018-19 Average Residential Rates (centkWh)
2018-19 Average Residential Bills ($ per Month)
$128
$95
US Average SCE
26 Lower
October 30 2019 38
Sheet1
Sheet1
129 ₵
164 ₵
Sheet2
27 Higher
Sheet3
Sheet1
Sheet1
$128
Sheet2
26 Lower
Sheet3
bull Assembly Bill 1171 permits cities and counties and Joint Powers Agencies (JPAs) to act as CCAs to purchase and sell electricity on behalf of the utility customers within their jurisdiction
bull An Order Instituting Rulemaking (OIR R17-06-026) was opened on June 29 2017 to review revise and consider alternatives to the ldquoPower Charge Indifference Adjustmentrdquo or PCIA The PCIA allocates a proportional share of above-market costs of SCErsquos
energy procurement portfolio to departing load customers to ensure remaining bundled service customers are indifferent
October 11 2018 Commission decision changes PCIA methodology and has substantially addressed the historical subsidy to departing load that materialized when renewables market prices declined over the past 4 yearso Decision also established a Phase 2 which is addressing utility
portfolio optimization PCIA ldquopre-paymentrdquo options for entities and individual departing load customers and implementation of the ldquotrue-uprdquo process for Resource Adequacy (RA) and Renewable Energy Credits (RECs) costs
o A Phase 2 final decision on the benchmark and true-up process was approved on October 10 2019 with the other Phase 2 activities to continue into 2020
bull On February 8 2018 the Commission approved Resolution E-4907 requiring CCAs to demonstrate compliance with annual Resource Adequacy (RA) requirements prior to commencing operations
bull Existing Direct Access and CCA load is expected to be ~35 of SCErsquos total load by the end of 2019
Investor-Owned Utility (IOU)
Community Choice Aggregator (CCA)
Community Choice Aggregator (CCA) Overview
Approximately 40 of SCErsquos bundled service load could be part of a CCA or Direct Access by the end of 2020
October 30 2019 39
bull CPUC Order Instituting Ratemaking R 12-06-013 comprehensively reviewed residential rate structure including a future transition to Time of Use (TOU) rates In March 2018 SCE began to migrate 400000 residential customers to TOU rate structures
Remaining eligible residential customers to be migrated beginning October 2020bull July 2015 CPUC Decision D 15-07-001 includes Transition to 2 tiered rate structure coupled with Super-User Electric (SUE) Surcharge1
ldquoSuper User Electric Surchargerdquo for usage 400 above baseline (~3 of all usage)
Minimum bills of approximately $10month (applied to delivery revenue only)
January 2014 2019
100(60 of system usage)
219(3)
Tier 1100
Tier 2 101-400
SUEgt400
125(37)
Usage Level ( of Baseline)Usage Level ( of Baseline)
1 Completed in 20192 SCErsquos California Alternate Rates for Energy (CARE) program is an income-qualifying program that reduces energy bills for eligible customers by about 30
Winter Weekdays 8am-9pm Weekdays and Weekends 4-9pm
Off-Peak Summer Weekdays 11pm-8amWeekends All
Weekdays and Weekends All except 4-9pm
Winter Weekdays 9pm-8amWeekends All
Weekdays and Weekends 9pm-8am
Super Off-Peak Winter NA Weekdays and Weekends 8am-4pm
New Time-of-Use (TOU) Periods
bull On March 1 2019 SCE changed its basic TOU pricing period definition for the first time in over 30 years
bull Abundant mid-day renewable energy lowers prices from 8am-4pm (October - June)
bull Highest cost period is now 4pm-9pm all-days1
1 TOU pricing periods defined for non-residential customers per CPUC Decision D18-07-006 Similar residential TOU definitions were filed by SCE in A17-12-012
bull 998 solar projectsbull 320445 residential (71 of all residential customers) ndash 1756 MW bull 7333 non-residential ndash 977 MW bull Approximately 4775887 MWhyear generated
SCE Net Metering Statistics (919)
0
5
10
15
20
25
30
35
40
0
1000
2000
3000
4000
5000
6000
7000
2013 2014 2015 2016 2017 2018 2019
MW
Inst
alle
d
Num
ber o
f Sol
ar R
esid
entia
l Ins
talla
tions
Installations MW
July 1 2017bull Official start of NEM successor tariff customers are subject to
Mandatory TOU rate Non-bypassable charges Application fees
July 31 2017bull Residential customers who meet this deadline are grandfathered for
current TOU periods for maximum of 5 years (10 for non-residential)September 9 2017bull Smart Inverters required on all solar installationsJuly 25 2018bull Smart Inverters with Reactive Power Priority required on all solar
installationsNear Term Outlookbull Combination of a flatter tiered rate and the mandatory TOU NEM 20
rate structure has helped reduce the per customer cost shift further efforts to reduce the shift through new TOU pricing periods
bull Commission to revisit NEM Successor Tariff by July 2020 to evaluate the existing NEM tariffs and consider the development and adoption of successor tariffs
Key Dates
Third Quarter Earnings Summary
October 30 2019
Q32019
Q32018 Variance
Basic Earnings Per Share (EPS)1
SCE $ 145 $ 164 $ (019)
EIX Parent amp Other (009) (007) (002)
Basic EPS $ 136 $ 157 $ (021)
Less Non-core Items
SCE2 $ (014) $ 002 $ (016)
EIX Parent amp Other3 mdash (001) 001
Total Non-core $ (014) $ 001 $ (015)
Core Earnings Per Share (EPS)
SCE $ 159 $ 162 $ (003)
EIX Parent amp Other (009) (006) (003)
Core EPS $ 150 $ 156 $ (006)
Key SCE EPS Drivers4
Higher revenue5 $ 012- CPUC revenue (002)- 2018 FERC Formula Rate settlement 010- Other FERC revenue 004
Higher OampM (021)Lower depreciation 002Higher net financing costs (004)Income taxes5 019Property and other taxes (001)Results prior to impact from share dilution $ 007Impact from share dilution (010)Total core drivers $ (003)Non-core items 2 (016)Total $ (019)
Key EIX EPS Drivers4
EIX parent and other mdash Higher interest expense and corporate expenses $ (005)EEG mdash Lower corporate expenses 001Impact from share dilution 001Total core drivers $ (003)Non-core items 3 001Total $ (002)
1 See Earnings Non-GAAP reconciliations and Use of Non-GAAP Financial Measures in Appendix2 Includes SCEs contributions to Wildfire Insurance Fund in third quarter 2019 and impact from the approval of the Revised San Onofre Settlement Agreement in the third quarter 2018 3 Loss on sale of SoCore Energy4 2019 EPS drivers are reported at a consistent share count of 3258 million (2019 QTD weighted-average shares outstanding is 3471 million)5 Includes $020 of tax benefits refunded to customersNote Diluted earnings were $135 and $157 per share for the three months ended September 30 2019 and 2018 respectively
43
1 See Earnings Non-GAAP reconciliations and Use of Non-GAAP Financial Measures in Appendix2 Impact of 2018 GRC final decision related to impairment of utility property plant and equipment changes in allocation of deferred tax re-measurement between customers and
shareholders SCErsquos contributions to the Wildfire Insurance Fund gain from sale of nuclear fuel and impact from the approval of the Revised San Onofre Settlement Agreement3 Loss on sale of SoCore Energy and impact of hypothetical liquidation at book value (HLBV) accounting method4 2019 EPS drivers are reported at a consistent share count of 3258 million (2019 YTD weighted-average shares outstanding is 3330 million)5 Test Year 2018 GRC true-up of $020 includes revenue of $(034) OampM of $006 depreciation of $024 interest expense of $(001) property and other taxes of $001 and income taxes of
$0246 Includes $018 of tax benefits refunded to customersNote Diluted earnings were $342 and $308 per share for the nine months ended September 30 2019 and 2018 respectively
Year to Date Earnings Summary
October 30 2019
YTD 2019
YTD 2018 Variance
Basic Earnings Per Share (EPS)1
SCE $ 365 $ 343 $ 022
EIX Parent amp Other (022) (034) 012
Basic EPS $ 343 $ 309 $ 034
Less Non-core Items
SCE2 $ (030) $ 002 $ (032)
EIX Parent amp Other3 mdash (014) 014
Total Non-core $ (030) $ (012) $ (018)
Core Earnings Per Share (EPS)
SCE $ 395 $ 341 $ 054
EIX Parent amp Other (022) (020) (002)
Core EPS $ 373 $ 321 $ 052
Key SCE EPS Drivers4
Test Year 2018 GRC true-up5 $ 020Higher revenue6 055
- CPUC revenue 032- 2018 FERC Formula Rate settlement 010- FERC and other operating revenue 013
Higher OampM (026)Lower depreciation 005Higher net financing costs (012)Income taxes6 021Results prior to impact from share dilution $ 063Impact from share dilution (009)Total core drivers $ 054Non-core items2 (032)Total $ 022
Key EIX EPS Drivers4
EIX parent and other mdash Higher interest expense and corporate expenses $ (007)EEG mdash Lower corporate expenses and lower losses at the competitive business 004Impact from share dilution 001Total core drivers $ (002)Non-core items3 014Total $ 012
44
SCE Annual Results of Operationsbull Earning activities ndash revenue authorized by CPUC and FERC to provide reasonable cost recovery and return on investmentbull Cost-recovery activities ndash CPUC- and FERC-authorized balancing accounts to recover specific project or program costs subject
to reasonableness review or compliance with upfront standards
($ millions)
2018 2017
Earnings Activities
Cost-Recovery Activities
Total Consolidated
Earnings Activities
Cost-Recovery Activities
Total Consolidated
Operating revenue $6560 $6051 $12611 $6611 $5643 $12254Purchased power and fuel mdash 5406 5406 mdash 4873 4873Operation and maintenance 1972 730 2702 1898 824 2722Wildfire-related claims net of recoveries 2669 mdash 2669 ― ― ―Depreciation and amortization 1867 mdash 1867 2032 mdash 2032Property and other taxes 392 mdash 392 372 mdash 372Impairment and other charges (12) mdash (12) 716 mdash 716Other operating income (7) mdash (7) (8) mdash (8)Total operating expenses 6881 6136 13017 5010 5697 10707Operating (loss) income (321) (85) (406) 1601 (54) 1547Interest expense (671) (2) (673) (588) (1) (589)Other income and expenses 107 87 194 93 55 148(Loss) income before income taxes (885) mdash (885) 1106 mdash 1106Income tax (benefit) expense (696) mdash (696) (30) mdash (30)Net (loss) income (189) mdash (189) 1136 mdash 1136Preferred and preference stock dividend
requirements 121 mdash 121 124 mdash 124
Net (loss) income available for common stock ($310) mdash ($310) $1012 mdash $1012Less Non-core items (1750) (481)Core Earnings $1440 $1493
Note See Use of Non-GAAP Financial Measures
October 30 2019 45
Reconciliation of EIX Basic Earnings Per Share Guidance to EIX Core Earnings Per Share Guidance
EPS Attributable to Edison International 2019
Low Midpoint High
SCE $483
EIX Parent amp Other (032)
Basic EPS1 $441 $451 $461
Non-Core Items
SCE23 (029) (029) (029)
EIX Parent amp Other mdash mdash mdash
Total Non-Core1 (029) (029) (029)
Core EPS
SCE $512
EIX Parent amp Other (032)
Core EPS1 $470 $480 $490
1 EPS is calculated on the assumed weighted-average share count for 2019 Please see 2019 EIX Core Earnings Guidance slide for more information 2 Includes impact of 2018 GRC final decision related to impairment of utility property plant and equipment changes in allocation of deferred tax re-measurement between
customers and shareholders and SCErsquos contributions to the Wildfire Insurance Fund3 Includes $001 per share as a result of share count dilution
October 30 2019
Earnings Per Share Non-GAAP Reconciliations
46
Earnings Non-GAAP Reconciliations
1 Impact of 2018 GRC final decision related to impairment of utility property plant and equipment changes in allocation of deferred tax re-measurement between customers and shareholders SCErsquos contributions to the Wildfire Insurance Fund gain from sale of nuclear fuel and impact from the approval of the Revised San Onofre Settlement Agreement
2 Loss on sale of SoCore Energy and impact of hypothetical liquidation at book value (HLBV) accounting method
($ millions)
Reconciliation of EIX GAAP Earnings to EIX Core Earnings
Earnings Attributable to Edison International Q32019
Q32018
YTD 2019
YTD 2018
SCE $503 $536 $1215 $1119
EIX Parent amp Other (32) (23) (74) (112)
Basic Earnings $471 $513 $1141 $1007
Non-Core Items
SCE 1 ($48) 7 ($99) 7
EIX Parent amp Other 2 mdash (4) mdash (46)
Total Non-Core ($48) $3 ($99) ($39)
Core Earnings
SCE $551 $529 $1314 $1112
EIX Parent amp Other (32) (19) (74) (66)
Core Earnings $519 $510 $1240 $1046
October 30 2019 47
EIX Core EPS Non-GAAP ReconciliationsReconciliation of Edison International Basic Earnings Per Share to Edison International Core Earnings Per Share
Note See Use of Non-GAAP Financial Measures
Earnings Per Share Attributable to Edison International 2018 2017
Basic EPS ($130) $173
Non-Core Items
SCE
Wildfire-related claims net of recoveries (560) mdash
Settlement of 1994 ndash 2006 California tax audits 020 mdash
Write down impairment and other as a result of Revised San Onofre Settlement Agreement
003 (138)
Re-measurement of deferred taxes as a result of Tax Reform mdash (010)
Edison International Parent and Other
Settlement of 1994 ndash 2006 California tax audits (004) mdash
Re-measurement of deferred taxes as a result of Tax Reform mdash (133)
Sale of SoCore Energy and other (014) 004
Discontinued operations
Settlement of 1994 ndash 2006 California tax audits 010 mdash
Less Total Non-Core Items (545) (277)
Core EPS $415 $450
October 30 2019 48
Use of Non-GAAP Financial MeasuresEdison Internationals earnings are prepared in accordance with generally accepted accounting principles used in the United States Management uses core earnings internally for financial planning and for analysis of performance Core earnings are also used when communicating with investors and analysts regarding Edison Internationals earnings results to facilitate comparisons of the Companys performance from period to period Core earnings are a non-GAAP financial measure and may not be comparable to those of other companies Core earnings (or losses) are defined as earnings or losses attributable to Edison International shareholders less income or loss from discontinued operations and income or loss from significant discrete items that management does not consider representative of ongoing earnings such as exit activities including sale of certain assets and other activities that are no longer continuing asset impairments and certain tax regulatory or legal settlements or proceedings
A reconciliation of Non-GAAP information to GAAP information is included either on the slide where the information appears or on another slide referenced in this presentation
EIX Investor Relations Contact
Sam Ramraj Vice President (626) 302-2540 samramrajedisonintlcom
Allison Bahen Principal Manager (626) 302-5493 allisonbahenedisonintlcom
October 30 2019 49
Business Update
Slide Number 2
Table of Contents
EIX Strategy Should Produce Long-Term Value
SCE Highlights
Slide Number 6
SCE Historical Rate Base and Core Earnings
SCE Capital Expenditure Forecast
SCE Rate Base Forecast
Slide Number 10
Californiarsquos GHG Emissions Overview
SCErsquos Pathway 2045 Highlights
Slide Number 13
Slide Number 14
Slide Number 15
SCE Key Regulatory Proceedings
Slide Number 17
Slide Number 18
CPUC and FERC Cost of Capital Summary
CPUC Cost of Capital (2013-2019)
SCE Distribution System Investments
Slide Number 22
Slide Number 23
SCE Large Transmission Projects
SCE Operational Excellence
Responding to Industry Change
Slide Number 27
2019 EIX Core Earnings Guidance
EIX Annual Dividends Per Share
Appendix
EIXrsquos 2018 Sustainability Report Highlights
Slide Number 32
SCE Historical Capital Expenditures
Credit Ratings Summary
Distribution Power Grid of the Future
SCE Customer Demand Trends
SCE Bundled Revenue Requirement
Slide Number 38
SCE Rates and Bills Comparison
Slide Number 40
Slide Number 41
Slide Number 42
Slide Number 43
Slide Number 44
Slide Number 45
SCE Annual Results of Operations
Slide Number 47
Earnings Non-GAAP Reconciliations
EIX Core EPS Non-GAAP Reconciliations
Use of Non-GAAP Financial Measures
US Average
$134
SCE
$95
-291
US Average
128
SCE
164
higher
28
Created on Mon 6 Jun 2016 1250 PM EST (1750 GMT)
Concept
1990
1991
1992
1993
1994
1995
1996
1997
1998
1999
2000
2001
2002
2003
2004
2005
2006
2007
2008
2009
2010
2011
2012
2013
2014
2015
2016
2017
2018
2019
2020
2021
2022
2023
2024
2025
2026
Consumer Price Index All-Urban
131
136
140
144
148
152
157
161
163
167
172
177
180
184
189
195
202
207
215
215
218
225
230
233
237
237
239
245
251
258
265
272
279
286
293
300
306
422
304
297
260
281
294
234
155
219
337
282
160
230
267
337
322
287
381
-032
164
314
208
147
161
012
105
236
253
265
265
264
254
251
249
234
227
SOUTHERN CALIFORNIA EDISON
System Average Rate Forecast
Source Matt Sheriff
(centkWh)
SCE System Average Rate
SAR CPI (old)
SAR CPI (current)
CPI Los Angeles-Long Beach-Anaheim CA
Consumer Price Index All-Urban
0
1990
97cent
97cent
97cent
593
30
1
1991
103cent
101cent
101cent
410
422
2
1992
106cent
104cent
105cent
361
304
3
1993
103cent
107cent
107cent
253
297
4
1994
105cent
110cent
109cent
137
260
5
1995
107cent
113cent
110cent
153
281
25
6
1996
101cent
116cent
112cent
183
294
7
1997
101cent
119cent
114cent
158
234
8
1998
96cent
121cent
116cent
144
155
9
1999
96cent
124cent
119cent
235
219
10
2000
96cent
128cent
122cent
330
337
20
11
2001
142cent
131cent
127cent
336
282
12
2002
142cent
134cent
130cent
277
160
13
2003
124cent
137cent
133cent
259
230
14
2004
122cent
140cent
138cent
334
267
15
2005
126cent
145cent
144cent
447
337
16
2006
147cent
150cent
150cent
427
322
17
2007
139cent
154cent
155cent
328
287
18
2008
137cent
160cent
161cent
353
381
19
2009
143cent
159cent
159cent
-080
-032
20
2010
143cent
162cent
161cent
120
164
10
21
2011
141cent
167cent
166cent
267
314
22
2012
143cent
170cent
169cent
203
208
23
2013
159cent
173cent
171cent
108
147
24
2014
167cent
176cent
173cent
135
161
25
2015
159cent
176cent
175cent
091
012
5
26
2016
148cent
178cent
178cent
189
105
27
2017
157cent
182cent
183cent
279
236
29
20
10
28
2018
160cent
187cent
190cent
381
253
SCE
17
26
11
29
2019
159cent
192cent
195cent
244
265
LA
24
25
20
30
2020
194cent
197cent
199cent
219
265
36
31
2021
199cent
202cent
203cent
227
266
25
49
Created on Wed 23 Jan 2019 1245 PM EST (1745 GMT)
Mnemonic
Long Label
Last Update
Start Date
End Date
Frequency
1970
1971
1972
1973
1974
1975
1976
1977
1978
1979
1980
1981
1982
1983
1984
1985
1986
1987
1988
1989
1990
1991
1992
1993
1994
1995
1996
1997
1998
1999
2000
2001
2002
2003
2004
2005
2006
2007
2008
2009
2010
2011
2012
2013
2014
2015
2016
2017
2018
2019
2020
2021
2022
2023
2024
2025
2026
2027
2028
2029
2030
2031
2032
2033
2034
2035
2036
2037
2038
2039
2040
2041
2042
2043
2044
2045
2046
2047
2048
CPILANGAFRSM1
Los Angeles-Long Beach-Anaheim CA (MSA) [2013 Definition] FIPS Code 31080 Consumer Price Index for All Urban Consumers (1982-84=100) IHS MARKIT ECONOMICS December 2018 Forecast Source Bureau of Labor Statistics End of Historical Data 2017
122718
1970
2048
ANNUAL
3868
4011
4139
4374
4825
5334
5683
6080
6526
7233
8372
9184
9734
9907
10360
10838
11193
11667
12206
12826
13587
14143
14654
15025
15231
15464
15748
15997
16227
16608
17155
17732
18223
18696
19320
20183
21044
21734
22501
22322
22589
23193
23665
23921
24243
24463
24925
25621
26598
27248
27844
28475
29132
29806
30500
31165
31832
32533
33254
33985
34744
35508
36279
37061
37854
38640
39440
40278
41145
42043
42963
43898
44852
45825
46816
47822
48857
49934
51047
371
320
568
1031
1055
655
698
733
1083
1575
971
599
177
458
461
328
423
462
508
593
410
361
253
137
153
183
158
144
235
330
336
277
259
334
447
427
328
353
-080
120
267
203
108
135
091
189
279
381
244
219
227
231
231
233
218
214
220
222
220
223
220
217
215
214
208
207
213
215
218
219
218
217
217
216
215
216
220
223
Date of Report
July 26 2019
July 29 2019
July 29 2019
Edison International
Corporate Outlook
BBBStable
Baa3Stable
BBB-Stable
Senior Unsecured
BBB-
Baa3
BBB-
Commercial Paper
A-2
P-3
F3
Southern California Edison
Corporate Outlook
BBBStable
Baa2Stable
BBB-Stable
First Mortgage Bonds
A-
A3
BBB+
Senior Unsecured
BBB
Baa2
BBB
Preferred Securities
BB+
Ba1
BB+
Commercial Paper
A-2
P-2
F3
10
bull SB 350 requires a doubling of energy efficiency in existing buildings for California by 2030bull SB 32 requires statewide GHG emissions to be reduced to 40 below the 1990 level by 2030 Governor Order set a 2050
target of 80 below 1990 levelsbull SB 100 requires that 60 of energy sales to customers come from renewable power by 2030 and sets a 100 clean
electricity goal for the state and issued an executive order establishing a new target to achieve carbon neutrality both by2045
Californiarsquos GHG Emissions Overview
Commercial and Residential
12Electrical
Power15
Agriculture8
Industrial 24
Transportation41
SCE is taking a leading role to ensure that transportation and building electrification plays a major part in reducing GHG and criteria pollutant emissions in California
Source Data for both charts from California Air Resources Board California GHG Emissions data as of 2017
October 30 2019
State Carbon Emissions Reduction PathwayAnnual million metric tons (MMT)
ldquoAdaptation to climate change must begin in earnest ndash which SCE is doing in part with our grid hardening situational awareness and operational changes ndash but we must act on longer term solutions as wellrdquo ndash Pedro Pizarro Edison International CEO
SCErsquos Pathway 2045 Highlights
October 30 2019
bull 100 of grid sales with carbon-free electricity
bull 80 GW of utility-scale clean generation
bull 30 GW of utility-scale energy storage
bull 33 of space and water heating to be electrified by 2030
bull 70 of space and water heating to be electrified by 2045
bull Building electrification will increase load significantly by 2045 ndash representing 15 of the total load
bull 75 of light-duty vehicles need to be electric
bull 66 of medium-duty vehicles need to be electric
bull 33 of heavy-duty vehicles need to be electric
bull Until there is an alternative natural gas generation capacity provides a crucial role for reliability and affordability
bull 40 of natural gas that remains will be decarbonized through the addition of biomethane and hydrogen
Achieve carbon neutrality by 2045 through powering 100 of grid sales with carbon-free electricity electrifying the transportation and building sectors and using low-carbon fuels
for technologies that are not yet viable for electrification
11
Summary of Assembly Bill 1054 and Assembly Bill 111
Safety Oversight and Certification
bull Creates Wildfire Safety Division1 to provide additional wildfire safety oversightbull Initial safety certification issued by CPUC Executive Director within 30 days of IOU request requires 1) an approved wildfire
mitigation plan 2) utility to be in good safety standing 3) established board safety committee with relevant safety experience and 4) board-level reporting to the CPUC on safety issues
bull Subsequent annual safety certifications issued by Wildfire Safety Division1 also require 5) approved executive compensation structure that promotes safety ensures public safety and utility financial stability 6) compensation limits on executive officer contracts and 7) implementation of and reporting to the CPUC on wildfire mitigation plans safety culture assessments and board safety committee recommendations
Cost Recovery Standard
bull Provided a utility is ldquosafety certifiedrdquo and elects to participate in the wildfire ldquoinsurancerdquo fund (described below) establishes a FERC-like prudence standard to guide recovery of costs arising from catastrophic wildfires occurring after bill enactment
bull Prudence is based on reasonable utility conduct with potential for full or partial recovery considering factors within and beyond a utilityrsquos control
bull FERC-like standard assumes utility is prudent unless intervenors create serious doubt shifting burden to the utility to prove prudence
Wildfire Fund
bull Establishes a wildfire fund to help wildfire victims and affected communities recover and rebuild more quicklybull Wildfire ldquoinsurancerdquo fund is an insurance-like fund that more broadly socializes wildfire costs utilities participation is voluntarybull Fund includes a $105 billion ratepayer contribution through the financing of a 15-year extension of the Department of Water
Resources bond charge wildfire insurance fund also includes $105 billion contribution from utility shareholdersbull All three IOUs have elected to participate PGampE must emerge from bankruptcy by June 30 2020 to participate SCErsquos shareholders initially contributed approximately $24 billion on September 10 and expect to contribute approximately
$95 million annually on January 1 for 10 years2
Mitigation CapEx
bull First $16 billion of SCErsquos fire risk mitigation capital expenditures as approved in wildfire mitigation plans shall not earn an equity return but can be recovered from ratepayers through a securitizable dedicated rate component2
Liability Cap bull While fund remains solvent wildfire cost disallowances capped over each trailing 3-year period to 20 of TampD equity rate basebull Must be safety certified and not found to be acting with willful or conscious disregard of the safety of others
October 30 2019
1 Wildfire Safety Division created within CPUC until duties transferred to newly formed Office of Energy Infrastructure Safety on or after July 2021 2 Excluded from measurement of regulatory capital structure
2019 Wildfire Legislation Update
12
Mitigating Catastrophic Wildfire RiskSCE plans to spend significant capital and OampM from 2019-2023 including ~$16 billion of AB 1054 spend with continued investments beyond our forecast periodbull SCErsquos comprehensive risk mitigation program focuses on three key areas Grid hardening Increase the use of fire-resistant poles composite cross-arms and
covered conductor in high fire risk areas evaluate design approaches and next-generation engineering technology to further enhance public safety
Increased situational awareness capabilities Expand meteorological monitoring and forecasting capabilities by installing additional weather stations and high-definition cameras to help SCE and fire agencies to better prepare mitigate and respond to reported fires
Enhanced operational practices Restrict certain types of work in High Fire Risk Areas (HFRAs) during elevated fire risk conditions increase overhead inspection of equipment in HFRAs reduce fire risk via a Public Safety Power Shutoff in HFRAs during elevated weather conditions increase tree trimming and removal to further mitigate safety risks posed by trees or debris
bull Will file next compliance plan (Wildfire Mitigation Plan) detailing the near- and longer-term actions that SCE is taking to significantly reduce the risk of fire ignitions and increase emergency response and grid resiliency against future impacts of climate change in early 2020
bull 1700+ protective devices programmed with more sensitive (fast curve) settings (includes automatic reclosers and circuit breakers)
bull In-house team of fire weather experts staffing our 247 Situational Awareness Center
bull 450+ installed weather stations with a target of 850 by end of 2020
bull 130+ installed HD cameras with a target of 160 installations providing 90 coverage by end of 2019
bull Developed enhanced Fire Potential Index (FPI) to measure wildfire potential at the circuit level
bull 2 supercomputers being installed to run advanced weather models to improve forecast resolution
bull Completed Enhanced Overhead Inspections of 400000+ TampD structures in HFRA
bull Deploying helicoptersdrones to perform aerial inspections of our facilities in HFRA
bull 2100+ Circuit BreakerRecloser Blocking devices remotely set to not automatically re-energize lines during high fire risk conditions
bull Enhanced Vegetation Management Increasing trim distances to keep
power lines clear Performing inspectionsremoval
of hazard trees that pose riskbull Refined Public Safety Power
Shutoff (PSPS) protocol and communication
14
SCE Key Regulatory ProceedingsProceeding Description Next Steps
Key CPUC Proceedings
2021 General Rate Case (A 19-08-013)
Set CPUC base revenue requirement capital expenditures and rate base for 2021-2023
Application filed August 30 2019 awaiting scoping memo
2020 Cost of Capital(A 19-04-014)
Sets CPUC cost of capital and capital structurefor 2020-2022
Application filed April 22 2019 Scoping Memo issued July 2 2019 awaiting proposed decision (expected end of November 2019)
Grid Safety and Resiliency Program (GSRP) (A 18-09-002)
Requesting $582 million of total cost for 2018-2020 focused on grid hardening and enhanced vegetation management
Settlement filed for in July 2019 awaiting CPUC approval
Application for Recovery of WEMA costs (A 19-07-020)
Requesting recovery $505 million in insurance premiums tracked in the WEMA
Application filed July 31 2019 pre hearing conference scheduled for October 29 2019 scoping memo will follow
Application for Recovery of CEMA costs(A 19-07-021)
Requesting recovery $138 million in costs tracked in the CEMA for drought-related work and for work related to 2017 fires
Application filed July 31 2019 pre hearing conference scheduled for October 29 2019 scoping memo will follow
Non-Bypassable Charge OIR(I 19-07-017)
Approval of the extension of the DWR charge to fund the wildfire fund as per AB 1054
The CPUC rulemaking on the non-bypassable charge to support the Wildfire Fund was approved on October 24 2019
Charge Ready Program(A14-10-014 A18-06-015)
Implementation program for charger installations and market education
Pilot report filed in May 2018 Charge Ready Bridge Funding approved in December 2018 expecting proposed decision in fourth quarter 2019
Distribution Resources Plan (DRP) OIR (R14-08-013)
Power grid investments to integrate distributed energy resources
Demo projects have been terminated due to significant delays in project schedules No contracts will be executed in the solicitation for deferral projects due to lack of viable bids
Power Charge Indifference Adjustment (PCIA) OIR (R17-06-026)
Review revise and consider alternatives to the PCIA
Final Phase 1 Decision adopted on October 11 2018 Final Phase 2 Decision on benchmark refinementtrue-up was approved on October 10 2019
Key FERC Proceedings
FERC Formula Rates Transmission rate setting with annual updates Replacement rate filed on October 27 2017 settlement covering 1118 through 111119 filed and waiting FERC approval New replacement rate accepted June 11 partial settlement reduced request to 1197 settlement discussions are continuing
October 30 2019 15
Filed August 30 2019 SCErsquos 2021 GRC request balances the need to advance Californiarsquos ambitious decarbonization policy goals and address emergent wildfire public safety risks while continuing to provide safe reliable and affordable service to customersbull 2021 GRC Application (A 19-08-013) addresses major portion of CPUC-jurisdictional revenue
requirement for 2021-2023 Includes operating costs and capital investment Excludes CPUC jurisdictional costs such as fuel and purchased power cost of capital and other
discrete SCE capital projects (such as Charge Ready 2 ndash SCErsquos transportation electrification infrastructure program)
Excludes FERC-jurisdictional transmission revenue requirementbull Requests 2021 revenue requirement of $7601 billion $1155 billion increase over 2020 authorized revenue requirement a 127 increase over total rates1
Requests increases of $400 million in 2022 and $531 million in 2023bull Multi-track schedule proposed to approve 2021-2023 revenue requirement and reasonableness of
additional 2018-2020 recorded incremental amounts associated with the Fire Mitigation memorandum accounts (FMA)2 (See ldquoSCE 2021 General Rate Case Timelinerdquo for more information)
SCE 2021 General Rate Case Overview
October 30 2019
1 127 includes the impact of lower anticipated 2021 kWh sales and recoveries of $87 million of non-wildfire memo accounts2 Includes Wildfire Mitigation Plan Memo Account Fire Hazard Prevention Memo Account Grid Safety and Resiliency Program Memo Account and Fire Risk Mitigation Memo Account
16
bull Track 1 includes approval of the 2021-2023 GRC revenue requirement and reasonableness of additional 2018-2019 recorded incremental amounts associated with the Fire Mitigation memorandum accounts1
bull Track 2 includes approval of 2020 recorded incremental amounts associated with the Fire Mitigation memorandum accounts1 and 2018-2020 Grid Safety and Resiliency Program (GSRP) costs above settlement amount
SCE 2021 General Rate Case Timeline
October 30 2019
1 Includes Wildfire Mitigation Plan Memo Account Fire Hazard Prevention Memo Account Grid Safety and Resiliency Program Memo Account and Fire Risk Mitigation Memo AccountNote Actual schedule to be set by CPUC in a future regulatory order The schedule is subject to change over the course of the proceeding
Estimated
2021
Q1
Rebuttal Final Decision
Intervenor Testimony
Proposed Decision
Evidentiary Hearings
2020 FMA Update
Q2 Q3 Q4
GRCApplication
Rebuttal
Final Decision
Intervenor Testimony
Proposed Decision
Evidentiary Hearings
2018-2019 FMA Update
2019 2020
Q1 Q2 Q3 Q4 Q1 Q2 Q3 Q4
Estimated
17
CPUC and FERC Cost of Capital Summary
bull Litigated proceeding separate from GRC filed on April 22nd
bull Request for three-year period starting January 1 2020
bull SCE PGampE SDGampE and SoCalGas concurrently filed applications applications were consolidated into one proceeding
bull Proposed trigger mechanism for adjusting the cost of capital between proceedings (similar to current mechanism)
CPUC Cost of Capital FERC Rate Case
bull New Rate Case filed on April 11th
bull Updated formula rate becomes effective November 12 2019 if accepted by FERC subject to refund
bull Capital structure at FERC is based on recorded level vs CPUC ldquoauthorizedrdquo approach
Component Cost Weighted Cost
Conventional ROE 1060
Wildfire Risk ROE 085
Common Equity 520 1145 595
Long-Term Debt 430 474 204
Preferred Equity 50 570 029
Total 1000 828
Breakdown of Return on Equity (ROE) Cost
Conventional ROE 1112
Wildfire Risk ROE 085
Requested ROE + 1197
CAISO adder + 050
Incentive Projects Varies
October 30 2019 18
CPUC Cost of Capital (2013-2019)
Two year settlement approved for 2018-2019bull ROE adjustment based on 12-month average of
Moodyrsquos Baa utility bond rates measured from October 1 to September 30
bull If index exceeds 100 bps deadband from starting index value authorized ROE changes by half the difference
bull Starting index value based on trailing 12 months of Moodyrsquos Baa index as of September 30 of each year ndash500
CPUC Authorized Capital
Structure 2018-2019Common Equity 48 1030
Preferred 9 582Long-term Debt 43 498
Weighted Average Cost of Capital 761
October 30 2019 19
3
4
5
6
7
10112 10113 10114 10115 10116 10117 10118 10119
Rate
()
Starting Value ndash 500
CPUC Adjustment Mechanism
Moodyrsquos Baa Utility Index Spot Rate
Moving Average (10118 ndash 10119) = 450
100 basis point +- Deadband
ROE fixed at 1030 for 2018 independent of trigger mechanism
ROE fixed at 1045 for 2017 independent of trigger mechanism
SCE Distribution System Investments
1 Deferrals required with infrastructure replacement load growth and grid modernization programs2 Other includes among other things grid modernization emergency management customer requested system modifications and transportation electrification programsNote Forecast based on 2021 GRC request levels
Distribution Trendsbull Capital expenditures for certain programs deferred over
next five years to support reallocation of distribution resources to wildfire mitigation1 historical program funding levels will be reinstated in subsequent GRC periods in order to resume trajectory towards equilibrium replacement rate
bull Distribution grid requires upgrades to circuit capacity automation and control systems to support various grid resiliency and reliability objectives as well as increased use of distributed energy resources
2019 ndash 2023 Capital Spending Forecast for Distribution2 - $208 billion
2019-2023 Capital Spending Driversbull Automation of distribution circuitsbull Pole replacements bull Load growth upgradesbull Cable and overhead conductor replacementsbull Preventive and breakdown maintenancebull Circuit breaker transformer bank and relay
replacementsupgradesbull New Service Connections
October 30 2019
Load Growth
New Service Connections
Infrastructure Replacement
General Plant
Other
Wildfire
20
Charge Ready Bridge Funding and 2
SCE Transportation Electrification (TE) Proposalsbull Proposals build on SCErsquos Clean Power and Electrification Pathway which is an integrated approach to
reduce GHG emissions and air pollution by taking action in three California economic sectors electricity transportation and buildings
bull These programs accelerate electrification of the transportation sector supporting SCErsquos vision of placing at least 7 million light-duty passenger vehicles on the roads and transitioning to zero-emission trucks and transit Additional studies launched to increase adoption such as electrification of the Interstate 5 corridorMedium- and Heavy-Duty (MDHD) Vehicle
Transportation Electrification Program
Charge Ready Pilot - $22 million Total Cost1 (in 2014 dollars) approved January 2016bull Approved capital spend of $12 million OampM of $10 millionbull Supports 1280 chargersbull Included in capital spend and rate base forecasts
$356 million Total Cost1 (in nominal dollars) approved May 2018 bull 5-year programbull Approved capital spend of $242 million OampM of $115
millionbull Included in capital spend and rate base forecasts
1 Total Cost includes both OampM and capital spend
Charge Ready ldquoBridgerdquo Funding - $22 million Total Cost (in 2014 dollars) approved December 2018bull Additional approved capital spend of $12 million OampM
of $10 million bridge funding must be subtracted from any authorized Charge Ready 2 funding
bull Included in capital spend and rate base forecastsbull SCE to install at least 1000 chargers including 20 in
multi-unit dwellingsCharge Ready 2 ndash $760 million Total Cost1 (in 2018 dollars) filed June 2018 (pending CPUC approval)bull 4-year program providing over 50000 chargersbull $561 million in capital spend OampM of $199 millionbull Not included in capital spend or rate base forecasts
Charge Ready Pilot
October 30 2019 21
310
185
85
0
50
100
150
200
250
300
350
Transmission Distribution Customer
MW
SCE 2018 Storage Portfolio
Up to 80 of MW to be shifted between
TampD
85 MWexcess may offset TampD
targets
Eligible storage to be included in 2020 Storage compliance Plan (Filing date 312020)
Storage that is permitted to count in different categories due to flex counting rules
Currently above targets
2020 Cumulative Procurement Target
SCE Energy StorageCPUC Energy Storage Program Requirements
bull Storage Rulemaking (R10-12-007) established 1325 MW target for IOUs by 2024 (580 MW SCE share spread as biennial targets during 2014-20) ownership allowed up to 290 MW for SCE
bull Flexibility to transfer across categories expanded in Storage Rulemaking (R15-03-011)
SCE Procurement Activities to Meet CPUC Requirements
bull SCE has procured over 720 MW of energy storage (includes 60 MW of utility owned storage) ~600 MW of which is eligible to count towards CPUC targets
bull SCE submitted its 2018 Local Capacity Requirements RFP (2018 LCR RFP) and its second Aliso Canyon Energy Storage RFO (ACES 2 RFO) for approval Upon Commission approval of these energy storage resources SCE will have exceeded the 580 MW target set by AB 2514
bull SCE filed its 2018 Energy Storage and Investment Plan (ESPampIP) on March 1 2018 the AB 2514 track was approved by D18-10-036 on October 25 2018 however the Commission rejected SCErsquos AB 2868 proposals in D19-06-032
SCE Procurement to Meet System Reliability Needs
bull A Proposed Decision (PD) Issued in the Integrated Resources Plan (IRP) Proceeding (R16-02-007) directs SCE to procure 1745 MW of incremental system resource capacity to come online between August 1 2021 and August 1 2023 SCE Launched its 2019 System Reliability RFO on September 12 2019 Energy Storage will be an eligible resource to be procured in this RFO
bull In light of the IRP PD SCE concurrently launched a separate track to procure utility owned energy storage systems which will be referred to as the Reliability Owned Energy Storage (RUOES) procurement
October 30 2019 22
SCE Large Transmission Projects
FERC Cost of Capital112 ROE from January 1 2018 to November 12 2019bull ROE = Base (plus incentives) of 107 + CAISO Participation Application for FERC Formula recovery mechanism post
November 12 2019 was filed April 11 2019 Requested 50 bp CAISO adder approved but application for
rehearing requested by CPUC
Summary of Large Transmission Projects
Project Name Total Cost5 Remaining Investment(as of September 30 2019)
Estimated In-ServiceDate
West of Devers12 $848 million $416 million 2021
Mesa Substation1 $646 million $296 million 2022
Alberhill System3 $486 million $446 million mdash 3
Riverside Transmission Reliability4 $451 million $441 million 2024
Eldorado-Lugo-Mohave Upgrade $257 million $180 million 2021
1 CPUC approved2 Morongo Transmission holds an option to invest up to $400 million or half of the estimated cost of the transmission facilities only at the in-service date If the option is
exercised SCErsquos rate base would be offset by that amount 3 In August 2018 the CPUC approved the revised alternate decision which left the proceeding open and directed SCE to supplement the existing record with additional analysis
as it relates to the Project need and alternatives Potential revisions to the Project have not been reflected in the total cost of the Project or estimated in service date 4 Riverside Transmission Reliability Project total cost is currently estimated to be $451 million however costs could increase depending on the final route alternative selected5 Total Costs are nominal direct expenditures subject to CPUC and FERC cost recovery approval SCE regularly evaluates the cost and schedule based on permitting processes
given that SCE continues to see delays in securing project approvalsOctober 30 2019 23
SCE Operational Excellence
Top Quartilebull Safetybull Reliabilitybull Customer servicebull Cost efficiency
Optimizebull Capital productivitybull Purchased power costbull Digitization
High performing continuous improvement culture
Defining Excellence Measuring Excellence
bull Employee and public safety metrics
bull System performance and reliability (SAIDI and SAIFI)
bull Customer satisfaction calculation based on internal voice-of-customer surveys
bull OampM cost per customerbull Reduce system rate growth
with OampM purchased power cost reductions
Ongoing Operational Excellence
Efforts
October 30 2019 24
Responding to Industry ChangeLong-Term Industry Trends Strategy
bull The technology landscape is evolving at an unprecedented pace with innovation driving advances in cost and capabilities of distributed energy resources
bull Customer expectations are changing with increasing choices and alternatives a growing priority of sustainability objectives and flattening demand
bull The regulatory environment for utilities is complex increasingly supportive of new forms of competition but unable to keep pace with new business models
bull Policies both in California and globally are setting aggressive greenhouse gas reduction targets
SCE Strategybull Clean the power system by accelerating
the de-carbonization of electricity supplybull Help customers make cleaner energy
choices to support electrification and leverage flexible energy demand
bull Strengthen and modernize the grid by replacing aging infrastructure and deploying technology
bull Achieve operational and service excellence with top tier performance in safety reliability affordability and customer satisfaction
Beyond SCEbull Position Edison Energy as an independent
energy advisor and integrator for large commercial and industrial customers
bull Further clean energy and sustainability efforts in California through Edison Energy insights
October 30 2019 25
bull Energy is a significant risk large commercial and industrial customers face Edison Energy creates competitive advantage for market leaders by quantifying this risk and designing the portfolio solution to protect shareholder value threatened by complex energy policies increasing sustainability needs technological advancements and new products
bull Optimized energy solutions based on robust analytics of the customerrsquos energy portfolio in alignment with their goals and strategic objectives
bull Implementation of solutions through existing service lines or brokering with third parties
bull Edison International investment $83 million as of September 30 2019
Edison Energy
Edison Energy Summary
The Opportunity Trusted Advisor and Solution Integrator
Managed Portfolio Solution
Renewables amp Sustainability
Supply Solutions
Demand Solutions
Installations
October 30 2019 26
27
Total Rate Base $307 billion
bull FERC comprises ~20 of total
CPUC
Return on Equity (ROE)
103
Capital Structure2 48 equity
FERC
ROE3 112 with incentives(previously 105 with incentives)
Capital Structure Recorded capital structure 45 2019 average estimated equity
Other Items
Capital Market Activities
$49 billion of EIXSCE debt and equity issuances in addition to SCErsquos normal course debt financing of rate base
$468 $480
($033)($024)$041
$029
SCE 2019 EPSfrom Rate
Base Forecast
SCEVariances
2018 True-Ups
EIX Parentamp Other
EquityProgram WF FundFinancing
EIX 2019 CoreEPS Midpoint
Guidance
bull Financing and other$032
bull Z-factor advice letter approval $004
bull Energy efficiency $005
2019 Core Earnings Per Share Guidance ndashBuilding from SCE Rate Base
bull HoldCo operating expenses (1) cent per share per month
bull HoldCo debt issued $1 billion in 2019 ($400 million of issuance remaining)
bull EEG target breakeven run rate by year-end 2019
EIX 2019 Core EPS guidance range of $470 - $490 midpoint $009 higher than prior
Key Assumptions
Note See Earnings Per Share Non-GAAP Reconciliations and Use of Non-GAAP Financial Measures in Appendix All tax-affected information on this slide is based on our current combined statutory tax rate of approximately 28 Totals may not foot due to rounding
1 Reflects actual financing activity at SCE (August 1st debt offering) and EIX (July 30th equity offering) versus prior guidance based on assumption that financing would occur on September 10th
2 On February 28 2019 SCE filed an application with the CPUC for a waiver of compliance with this equity ratio requirement describing that while the wildfire-related charge accrued in the fourth quarter of 2018 caused its equity ratio to fall below 47 on a spot basis as of December 31 2018 SCE remains in compliance with the 48 equity ratio over the applicable 37-month average basis While the CPUC reviews the waiver application SCE is considered in compliance with the capital structure rules
3 SCErsquos April 11 2019 TO2019A filing to revise its ROE is pending review with the FERC and not reflected in guidance assumptions
2019 EIX Core Earnings Guidance
bull Test year 2018 GRC true-up $020
bull FERC ROE settlement (prior year)$009
bull Previously announced financing plan (debt and equity) ($018)
bull Update to financing plan based on actual results ($006)
bull Remaining previously disclosed equity plan $05 billion
1 2019 dividend annualized based on December 6 2018 declaration
Fifteen Consecutive Years of Dividend Growth
Target dividend growth within target payout ratio of 45-55 of SCErsquos earnings
1
October 30 2019 28
Appendix
October 30 2019 29
EIXrsquos 2018 Sustainability Report Highlights
Edison Energy is not the same company as Southern California Edison the utility and Edison Energy is not regulated by the California Public Utilities Commission Cumulative duration (in minutes) of sustained repair outages lasting longer than five minutes experienced by the average customer in a year (including major event days) In February 2019 the EIX board approved a $3 million donation to the Edison International Wildfire Assistance Fund to enhance community resiliency and wildfire prevention and
mitigation This affects the 2019 data year and is not reflected here
October 30 2019
ldquoAt Edison International we are leading the transformation of the electric power industry toward a clean energy future by focusing on opportunities in clean energy efficient electrification the grid of the future and customer choice As we pursue this vision sustainability remains at the core of who we are and what we dordquo ndash Pedro Pizarro Edison International CEO
bull Earnings not affected by variability of retail electricity salesbull Differences between amounts collected and authorized levels
either billed or refundedbull Promotes energy conservationbull Stabilizes revenues during economic cycles
Major Balancing Accountsbull Salesbull Fuel and Purchased powerbull Energy efficiencybull Pension expense
bull Cost-recovery related balancing accounts represented more than 59 of costs
bull Trigger mechanism for fuel and purchased power adjustments at 5 variance level
Advanced Long-TermProcurement Planning
bull Upfront contract approvals and prudency standards provide greater certainty of cost recovery (subject to compliance-related reasonableness review)
Forward-looking Ratemaking bull Forward and test year GRC with three-year rate cycle bull Separate cost of capital mechanism
October 30 2019 31
SCE Historical Capital Expenditures($ billions)
$40 $39
$35$38
$44
2014 2015 2016 2017 2018
October 30 2019 32
Credit Ratings Summary
Date of Report July 26 2019 July 29 2019 July 29 2019
Edison InternationalCorporate Outlook BBBStable Baa3Stable BBB-StableSenior Unsecured BBB- Baa3 BBB-Commercial Paper A-2 P-3 F3
Southern California EdisonCorporate Outlook BBBStable Baa2Stable BBB-StableFirst Mortgage Bonds A- A3 BBB+Senior Unsecured BBB Baa2 BBBPreferred Securities BB+ Ba1 BB+Commercial Paper A-2 P-2 F3
FitchMoodyrsquosSampP
October 30 2019 33
4
ampCalibriRegularFINANCIAL AND STATISTICAL REPORTampCalibriRegularampA
Distribution Power Grid of the Future
One-Way Electricity Flowbull System designed to distribute electricity
from large central generating plantsbull Voltage centrally maintainedbull Increasing integration of distributed
energy resourcesbull Limited situational awareness and
visualization tools for power grid operators
Renewable Generation Mandates
Subsidized Residential Solar
Limited Electric Vehicle Charging Infrastructure
Variable Two-Way Electricity Flowbull Distribution system at the center of the
power gridbull System designed to manage fluctuating
resources and customer demand bull Digital monitoring and control devices and
advanced communications systems to improve safety and reliability and integrate DERs
bull Improved data management and power grid operations and cyber risk mitigation
bull Integrated utility distribution with distributed energy resources planning
Maximize Distributed Resources and Electric Vehicle Adoptionbull Distribution power grid infrastructure
design supports customer choice and greater resiliency
Current State Future State
October 30 2019 34
SCE Customer Demand Trends
Note See Edison International Financial and Statistical Reports for 2017 for further information
Kilowatt-Hour Sales (millions of kWh) 2014 2015 2016 2017 2018
Residential 30027 30093 29579 30221 29865
Commercial 42004 42396 42189 42514 42369
Industrial 8392 7623 7162 6659 6786
Public authorities 4975 4795 4715 4711 4510
Agricultural and other 2019 1950 1803 1498 1745
Subtotal 87416 86857 85448 85602 85276
Resale 1308 1080 1794 1568 1867
Total Kilowatt-Hour Sales 88725 87937 87242 87170 87143
Total Number of Customers 5005401 5033330 5060528 5094818 5126985
Number of New Connections 29879 31653 38076 39621 39633
Area Peak Demand (MW) 23055 23079 23091 23508 23766
October 30 2019 35
SCE Bundled Revenue Requirement
Note Rates in effect as of July 26 2019 Represents bundled service which excludes Direct AccessCCA customers that do not receive generation services from SCE
SCE Systemwide Average Rate History (centkWh)
2010 2011 2012 2013 2014 2015 2016 2017 2018 2019
143 141 143 159 167 162 148 157 160 159
Fuel amp Purchased Power(47)
Distribution(38)
Transmission (8)
Generation(8)
Other (-1)
2019 Bundled Revenue
Requirement
$millions centkWh
Fuel amp Purchased Power ndash includes CDWR Bond Charge
4422 74
Distribution ndash poles wires substations service centers Edison SmartConnectreg
3628 61
Generation ndash owned generation investment and OampM 708 12
Transmission ndash greater than 220kV 789 13
Other ndash CPUC and legislative public purpose programs system reliability investments nuclear decommissioning and prior-year over collections
(116) (01)
Total Bundled Revenue Requirement ($millions) $9431
divide Bundled kWh (millions) 59396
= Bundled Systemwide Average Rate (centkWh) 159cent
October 30 2019 36
37
97cent
159cent
80cent
100cent
120cent
140cent
160cent
180cent
200cent
220cent
1990
1991
1992
1993
1994
1995
1996
1997
1998
1999
2000
2001
2002
2003
2004
2005
2006
2007
2008
2009
2010
2011
2012
2013
2014
2015
2016
2017
2018
2019
195cent
Rates reduced due to the implementation of 1) the SONGS Revised Settlement including NEIL insurance benefits 2) lower fuel amp purchased power costs and 3) a lower 2015 GRC revenue requirement that includes flow-through tax benefits
centkWh
System Average Rate Historical Growth
SCErsquos system average rate has grown less than inflation over the last 29 years
SCE System Average RateLos Angeles Area Inflation
Comparative System Average Rates
Delta to SCESCE 159cent --
PGampE 211cent1 33
SDGampE 246cent1 55
CAGR29-yr
(lsquo90-rsquo19)20-yr
(lsquo99-rsquo19)10-yr
(lsquo09-19)17 26 1124 25 20
Energy Crisis and return to normal
Higher gas price forecast post-Katrina leads to higher rates with subsequent refund of over collection
Delay in 2012 GRC leads to shorter ramp-up of rate increase
1 PGampE Advice 5644-E effective October 1 SDGampE Advice 3377-E effective June 1
October 30 2019
Data
SCE System Average Rate
1990199119921993199419951996199719981999200020012002200320042005200620072008200920102011201220132014201520162017201820199699999999999999310310610310510710110196969614214212412212614713913714314314114315916715940876786458386148350382761769171566871495475337116159CPI Los Angeles-Long Beach-Anaheim CA199019911992199319941995199619971998199920002001200220032004200520062007200820092010201120122013201420152016201720182019202096999999999999993100974239450441131046212585868498310726876840039228108738285083414611104041339548576811242695044160916114205839057899881158478900883218511856679342492612122475588812561061265926153091265513010279685966582133476140824337041379322865554462144095927379783561502417198233561515516495767909655160640840897938551593635512757601816127380397448466165581867639842851689511064769380217077830471050007173082233194307481746514628312063517794555998527898182917523920509811898939005269867419453007660169238SAR CPI (old)1990199119921993199419951996199719981999200020012002200320042005200620072008200920102011201220132014201520162017201820199699999999999999310108935518848128104164104853626311072574143759422111004139294598572113128515849244651164507302761853711917284265578923121016455131068581236705147011944127834109318192141314347216021390513353198545827113660054850437767140244467121649041449648574526591614963575483132515393112443397234159803525097292715929158237134114161898499904328691669815498437507617045100580396491729508329612907517573561579182243175943857388863061777863624593457518198880904395583186584452388557219152742489955948
195cent
CPI Workbook
image1png
129 ₵
164 ₵
US Average SCE
27 Higher
SCE Rates and Bills Comparison
SCErsquos average residential rates are above national averagebut residential bills are below national average due to lower usage
bull SCErsquos residential rates are above national average due in part to a cleaner fuel mix high cost of living and lower system load factor
bull SCErsquos residential customer usage is lower than the national average due to mild climate and higher energy efficiency appliance and building standards
bull Average monthly residential bills are lower than the national average as higher rate levels are more than offset by lower usage
Key FactorsKey Factors
Source EIAs Form 861M (formerly Form 826) Data Monthly Electric Utility Sales and Revenue Data for 12-Months Ending June 2019 httpswwweiagovelectricitydataeia861mindexhtml
2018-19 Average Residential Rates (centkWh)
2018-19 Average Residential Bills ($ per Month)
$128
$95
US Average SCE
26 Lower
October 30 2019 38
Sheet1
Sheet1
129 ₵
164 ₵
Sheet2
27 Higher
Sheet3
Sheet1
Sheet1
$128
Sheet2
26 Lower
Sheet3
bull Assembly Bill 1171 permits cities and counties and Joint Powers Agencies (JPAs) to act as CCAs to purchase and sell electricity on behalf of the utility customers within their jurisdiction
bull An Order Instituting Rulemaking (OIR R17-06-026) was opened on June 29 2017 to review revise and consider alternatives to the ldquoPower Charge Indifference Adjustmentrdquo or PCIA The PCIA allocates a proportional share of above-market costs of SCErsquos
energy procurement portfolio to departing load customers to ensure remaining bundled service customers are indifferent
October 11 2018 Commission decision changes PCIA methodology and has substantially addressed the historical subsidy to departing load that materialized when renewables market prices declined over the past 4 yearso Decision also established a Phase 2 which is addressing utility
portfolio optimization PCIA ldquopre-paymentrdquo options for entities and individual departing load customers and implementation of the ldquotrue-uprdquo process for Resource Adequacy (RA) and Renewable Energy Credits (RECs) costs
o A Phase 2 final decision on the benchmark and true-up process was approved on October 10 2019 with the other Phase 2 activities to continue into 2020
bull On February 8 2018 the Commission approved Resolution E-4907 requiring CCAs to demonstrate compliance with annual Resource Adequacy (RA) requirements prior to commencing operations
bull Existing Direct Access and CCA load is expected to be ~35 of SCErsquos total load by the end of 2019
Investor-Owned Utility (IOU)
Community Choice Aggregator (CCA)
Community Choice Aggregator (CCA) Overview
Approximately 40 of SCErsquos bundled service load could be part of a CCA or Direct Access by the end of 2020
October 30 2019 39
bull CPUC Order Instituting Ratemaking R 12-06-013 comprehensively reviewed residential rate structure including a future transition to Time of Use (TOU) rates In March 2018 SCE began to migrate 400000 residential customers to TOU rate structures
Remaining eligible residential customers to be migrated beginning October 2020bull July 2015 CPUC Decision D 15-07-001 includes Transition to 2 tiered rate structure coupled with Super-User Electric (SUE) Surcharge1
ldquoSuper User Electric Surchargerdquo for usage 400 above baseline (~3 of all usage)
Minimum bills of approximately $10month (applied to delivery revenue only)
January 2014 2019
100(60 of system usage)
219(3)
Tier 1100
Tier 2 101-400
SUEgt400
125(37)
Usage Level ( of Baseline)Usage Level ( of Baseline)
1 Completed in 20192 SCErsquos California Alternate Rates for Energy (CARE) program is an income-qualifying program that reduces energy bills for eligible customers by about 30
Winter Weekdays 8am-9pm Weekdays and Weekends 4-9pm
Off-Peak Summer Weekdays 11pm-8amWeekends All
Weekdays and Weekends All except 4-9pm
Winter Weekdays 9pm-8amWeekends All
Weekdays and Weekends 9pm-8am
Super Off-Peak Winter NA Weekdays and Weekends 8am-4pm
New Time-of-Use (TOU) Periods
bull On March 1 2019 SCE changed its basic TOU pricing period definition for the first time in over 30 years
bull Abundant mid-day renewable energy lowers prices from 8am-4pm (October - June)
bull Highest cost period is now 4pm-9pm all-days1
1 TOU pricing periods defined for non-residential customers per CPUC Decision D18-07-006 Similar residential TOU definitions were filed by SCE in A17-12-012
bull 998 solar projectsbull 320445 residential (71 of all residential customers) ndash 1756 MW bull 7333 non-residential ndash 977 MW bull Approximately 4775887 MWhyear generated
SCE Net Metering Statistics (919)
0
5
10
15
20
25
30
35
40
0
1000
2000
3000
4000
5000
6000
7000
2013 2014 2015 2016 2017 2018 2019
MW
Inst
alle
d
Num
ber o
f Sol
ar R
esid
entia
l Ins
talla
tions
Installations MW
July 1 2017bull Official start of NEM successor tariff customers are subject to
Mandatory TOU rate Non-bypassable charges Application fees
July 31 2017bull Residential customers who meet this deadline are grandfathered for
current TOU periods for maximum of 5 years (10 for non-residential)September 9 2017bull Smart Inverters required on all solar installationsJuly 25 2018bull Smart Inverters with Reactive Power Priority required on all solar
installationsNear Term Outlookbull Combination of a flatter tiered rate and the mandatory TOU NEM 20
rate structure has helped reduce the per customer cost shift further efforts to reduce the shift through new TOU pricing periods
bull Commission to revisit NEM Successor Tariff by July 2020 to evaluate the existing NEM tariffs and consider the development and adoption of successor tariffs
Key Dates
Third Quarter Earnings Summary
October 30 2019
Q32019
Q32018 Variance
Basic Earnings Per Share (EPS)1
SCE $ 145 $ 164 $ (019)
EIX Parent amp Other (009) (007) (002)
Basic EPS $ 136 $ 157 $ (021)
Less Non-core Items
SCE2 $ (014) $ 002 $ (016)
EIX Parent amp Other3 mdash (001) 001
Total Non-core $ (014) $ 001 $ (015)
Core Earnings Per Share (EPS)
SCE $ 159 $ 162 $ (003)
EIX Parent amp Other (009) (006) (003)
Core EPS $ 150 $ 156 $ (006)
Key SCE EPS Drivers4
Higher revenue5 $ 012- CPUC revenue (002)- 2018 FERC Formula Rate settlement 010- Other FERC revenue 004
Higher OampM (021)Lower depreciation 002Higher net financing costs (004)Income taxes5 019Property and other taxes (001)Results prior to impact from share dilution $ 007Impact from share dilution (010)Total core drivers $ (003)Non-core items 2 (016)Total $ (019)
Key EIX EPS Drivers4
EIX parent and other mdash Higher interest expense and corporate expenses $ (005)EEG mdash Lower corporate expenses 001Impact from share dilution 001Total core drivers $ (003)Non-core items 3 001Total $ (002)
1 See Earnings Non-GAAP reconciliations and Use of Non-GAAP Financial Measures in Appendix2 Includes SCEs contributions to Wildfire Insurance Fund in third quarter 2019 and impact from the approval of the Revised San Onofre Settlement Agreement in the third quarter 2018 3 Loss on sale of SoCore Energy4 2019 EPS drivers are reported at a consistent share count of 3258 million (2019 QTD weighted-average shares outstanding is 3471 million)5 Includes $020 of tax benefits refunded to customersNote Diluted earnings were $135 and $157 per share for the three months ended September 30 2019 and 2018 respectively
43
1 See Earnings Non-GAAP reconciliations and Use of Non-GAAP Financial Measures in Appendix2 Impact of 2018 GRC final decision related to impairment of utility property plant and equipment changes in allocation of deferred tax re-measurement between customers and
shareholders SCErsquos contributions to the Wildfire Insurance Fund gain from sale of nuclear fuel and impact from the approval of the Revised San Onofre Settlement Agreement3 Loss on sale of SoCore Energy and impact of hypothetical liquidation at book value (HLBV) accounting method4 2019 EPS drivers are reported at a consistent share count of 3258 million (2019 YTD weighted-average shares outstanding is 3330 million)5 Test Year 2018 GRC true-up of $020 includes revenue of $(034) OampM of $006 depreciation of $024 interest expense of $(001) property and other taxes of $001 and income taxes of
$0246 Includes $018 of tax benefits refunded to customersNote Diluted earnings were $342 and $308 per share for the nine months ended September 30 2019 and 2018 respectively
Year to Date Earnings Summary
October 30 2019
YTD 2019
YTD 2018 Variance
Basic Earnings Per Share (EPS)1
SCE $ 365 $ 343 $ 022
EIX Parent amp Other (022) (034) 012
Basic EPS $ 343 $ 309 $ 034
Less Non-core Items
SCE2 $ (030) $ 002 $ (032)
EIX Parent amp Other3 mdash (014) 014
Total Non-core $ (030) $ (012) $ (018)
Core Earnings Per Share (EPS)
SCE $ 395 $ 341 $ 054
EIX Parent amp Other (022) (020) (002)
Core EPS $ 373 $ 321 $ 052
Key SCE EPS Drivers4
Test Year 2018 GRC true-up5 $ 020Higher revenue6 055
- CPUC revenue 032- 2018 FERC Formula Rate settlement 010- FERC and other operating revenue 013
Higher OampM (026)Lower depreciation 005Higher net financing costs (012)Income taxes6 021Results prior to impact from share dilution $ 063Impact from share dilution (009)Total core drivers $ 054Non-core items2 (032)Total $ 022
Key EIX EPS Drivers4
EIX parent and other mdash Higher interest expense and corporate expenses $ (007)EEG mdash Lower corporate expenses and lower losses at the competitive business 004Impact from share dilution 001Total core drivers $ (002)Non-core items3 014Total $ 012
44
SCE Annual Results of Operationsbull Earning activities ndash revenue authorized by CPUC and FERC to provide reasonable cost recovery and return on investmentbull Cost-recovery activities ndash CPUC- and FERC-authorized balancing accounts to recover specific project or program costs subject
to reasonableness review or compliance with upfront standards
($ millions)
2018 2017
Earnings Activities
Cost-Recovery Activities
Total Consolidated
Earnings Activities
Cost-Recovery Activities
Total Consolidated
Operating revenue $6560 $6051 $12611 $6611 $5643 $12254Purchased power and fuel mdash 5406 5406 mdash 4873 4873Operation and maintenance 1972 730 2702 1898 824 2722Wildfire-related claims net of recoveries 2669 mdash 2669 ― ― ―Depreciation and amortization 1867 mdash 1867 2032 mdash 2032Property and other taxes 392 mdash 392 372 mdash 372Impairment and other charges (12) mdash (12) 716 mdash 716Other operating income (7) mdash (7) (8) mdash (8)Total operating expenses 6881 6136 13017 5010 5697 10707Operating (loss) income (321) (85) (406) 1601 (54) 1547Interest expense (671) (2) (673) (588) (1) (589)Other income and expenses 107 87 194 93 55 148(Loss) income before income taxes (885) mdash (885) 1106 mdash 1106Income tax (benefit) expense (696) mdash (696) (30) mdash (30)Net (loss) income (189) mdash (189) 1136 mdash 1136Preferred and preference stock dividend
requirements 121 mdash 121 124 mdash 124
Net (loss) income available for common stock ($310) mdash ($310) $1012 mdash $1012Less Non-core items (1750) (481)Core Earnings $1440 $1493
Note See Use of Non-GAAP Financial Measures
October 30 2019 45
Reconciliation of EIX Basic Earnings Per Share Guidance to EIX Core Earnings Per Share Guidance
EPS Attributable to Edison International 2019
Low Midpoint High
SCE $483
EIX Parent amp Other (032)
Basic EPS1 $441 $451 $461
Non-Core Items
SCE23 (029) (029) (029)
EIX Parent amp Other mdash mdash mdash
Total Non-Core1 (029) (029) (029)
Core EPS
SCE $512
EIX Parent amp Other (032)
Core EPS1 $470 $480 $490
1 EPS is calculated on the assumed weighted-average share count for 2019 Please see 2019 EIX Core Earnings Guidance slide for more information 2 Includes impact of 2018 GRC final decision related to impairment of utility property plant and equipment changes in allocation of deferred tax re-measurement between
customers and shareholders and SCErsquos contributions to the Wildfire Insurance Fund3 Includes $001 per share as a result of share count dilution
October 30 2019
Earnings Per Share Non-GAAP Reconciliations
46
Earnings Non-GAAP Reconciliations
1 Impact of 2018 GRC final decision related to impairment of utility property plant and equipment changes in allocation of deferred tax re-measurement between customers and shareholders SCErsquos contributions to the Wildfire Insurance Fund gain from sale of nuclear fuel and impact from the approval of the Revised San Onofre Settlement Agreement
2 Loss on sale of SoCore Energy and impact of hypothetical liquidation at book value (HLBV) accounting method
($ millions)
Reconciliation of EIX GAAP Earnings to EIX Core Earnings
Earnings Attributable to Edison International Q32019
Q32018
YTD 2019
YTD 2018
SCE $503 $536 $1215 $1119
EIX Parent amp Other (32) (23) (74) (112)
Basic Earnings $471 $513 $1141 $1007
Non-Core Items
SCE 1 ($48) 7 ($99) 7
EIX Parent amp Other 2 mdash (4) mdash (46)
Total Non-Core ($48) $3 ($99) ($39)
Core Earnings
SCE $551 $529 $1314 $1112
EIX Parent amp Other (32) (19) (74) (66)
Core Earnings $519 $510 $1240 $1046
October 30 2019 47
EIX Core EPS Non-GAAP ReconciliationsReconciliation of Edison International Basic Earnings Per Share to Edison International Core Earnings Per Share
Note See Use of Non-GAAP Financial Measures
Earnings Per Share Attributable to Edison International 2018 2017
Basic EPS ($130) $173
Non-Core Items
SCE
Wildfire-related claims net of recoveries (560) mdash
Settlement of 1994 ndash 2006 California tax audits 020 mdash
Write down impairment and other as a result of Revised San Onofre Settlement Agreement
003 (138)
Re-measurement of deferred taxes as a result of Tax Reform mdash (010)
Edison International Parent and Other
Settlement of 1994 ndash 2006 California tax audits (004) mdash
Re-measurement of deferred taxes as a result of Tax Reform mdash (133)
Sale of SoCore Energy and other (014) 004
Discontinued operations
Settlement of 1994 ndash 2006 California tax audits 010 mdash
Less Total Non-Core Items (545) (277)
Core EPS $415 $450
October 30 2019 48
Use of Non-GAAP Financial MeasuresEdison Internationals earnings are prepared in accordance with generally accepted accounting principles used in the United States Management uses core earnings internally for financial planning and for analysis of performance Core earnings are also used when communicating with investors and analysts regarding Edison Internationals earnings results to facilitate comparisons of the Companys performance from period to period Core earnings are a non-GAAP financial measure and may not be comparable to those of other companies Core earnings (or losses) are defined as earnings or losses attributable to Edison International shareholders less income or loss from discontinued operations and income or loss from significant discrete items that management does not consider representative of ongoing earnings such as exit activities including sale of certain assets and other activities that are no longer continuing asset impairments and certain tax regulatory or legal settlements or proceedings
A reconciliation of Non-GAAP information to GAAP information is included either on the slide where the information appears or on another slide referenced in this presentation
EIX Investor Relations Contact
Sam Ramraj Vice President (626) 302-2540 samramrajedisonintlcom
Allison Bahen Principal Manager (626) 302-5493 allisonbahenedisonintlcom
October 30 2019 49
Business Update
Slide Number 2
Table of Contents
EIX Strategy Should Produce Long-Term Value
SCE Highlights
Slide Number 6
SCE Historical Rate Base and Core Earnings
SCE Capital Expenditure Forecast
SCE Rate Base Forecast
Slide Number 10
Californiarsquos GHG Emissions Overview
SCErsquos Pathway 2045 Highlights
Slide Number 13
Slide Number 14
Slide Number 15
SCE Key Regulatory Proceedings
Slide Number 17
Slide Number 18
CPUC and FERC Cost of Capital Summary
CPUC Cost of Capital (2013-2019)
SCE Distribution System Investments
Slide Number 22
Slide Number 23
SCE Large Transmission Projects
SCE Operational Excellence
Responding to Industry Change
Slide Number 27
2019 EIX Core Earnings Guidance
EIX Annual Dividends Per Share
Appendix
EIXrsquos 2018 Sustainability Report Highlights
Slide Number 32
SCE Historical Capital Expenditures
Credit Ratings Summary
Distribution Power Grid of the Future
SCE Customer Demand Trends
SCE Bundled Revenue Requirement
Slide Number 38
SCE Rates and Bills Comparison
Slide Number 40
Slide Number 41
Slide Number 42
Slide Number 43
Slide Number 44
Slide Number 45
SCE Annual Results of Operations
Slide Number 47
Earnings Non-GAAP Reconciliations
EIX Core EPS Non-GAAP Reconciliations
Use of Non-GAAP Financial Measures
US Average
$134
SCE
$95
-291
US Average
128
SCE
164
higher
28
Created on Mon 6 Jun 2016 1250 PM EST (1750 GMT)
Concept
1990
1991
1992
1993
1994
1995
1996
1997
1998
1999
2000
2001
2002
2003
2004
2005
2006
2007
2008
2009
2010
2011
2012
2013
2014
2015
2016
2017
2018
2019
2020
2021
2022
2023
2024
2025
2026
Consumer Price Index All-Urban
131
136
140
144
148
152
157
161
163
167
172
177
180
184
189
195
202
207
215
215
218
225
230
233
237
237
239
245
251
258
265
272
279
286
293
300
306
422
304
297
260
281
294
234
155
219
337
282
160
230
267
337
322
287
381
-032
164
314
208
147
161
012
105
236
253
265
265
264
254
251
249
234
227
SOUTHERN CALIFORNIA EDISON
System Average Rate Forecast
Source Matt Sheriff
(centkWh)
SCE System Average Rate
SAR CPI (old)
SAR CPI (current)
CPI Los Angeles-Long Beach-Anaheim CA
Consumer Price Index All-Urban
0
1990
97cent
97cent
97cent
593
30
1
1991
103cent
101cent
101cent
410
422
2
1992
106cent
104cent
105cent
361
304
3
1993
103cent
107cent
107cent
253
297
4
1994
105cent
110cent
109cent
137
260
5
1995
107cent
113cent
110cent
153
281
25
6
1996
101cent
116cent
112cent
183
294
7
1997
101cent
119cent
114cent
158
234
8
1998
96cent
121cent
116cent
144
155
9
1999
96cent
124cent
119cent
235
219
10
2000
96cent
128cent
122cent
330
337
20
11
2001
142cent
131cent
127cent
336
282
12
2002
142cent
134cent
130cent
277
160
13
2003
124cent
137cent
133cent
259
230
14
2004
122cent
140cent
138cent
334
267
15
2005
126cent
145cent
144cent
447
337
16
2006
147cent
150cent
150cent
427
322
17
2007
139cent
154cent
155cent
328
287
18
2008
137cent
160cent
161cent
353
381
19
2009
143cent
159cent
159cent
-080
-032
20
2010
143cent
162cent
161cent
120
164
10
21
2011
141cent
167cent
166cent
267
314
22
2012
143cent
170cent
169cent
203
208
23
2013
159cent
173cent
171cent
108
147
24
2014
167cent
176cent
173cent
135
161
25
2015
159cent
176cent
175cent
091
012
5
26
2016
148cent
178cent
178cent
189
105
27
2017
157cent
182cent
183cent
279
236
29
20
10
28
2018
160cent
187cent
190cent
381
253
SCE
17
26
11
29
2019
159cent
192cent
195cent
244
265
LA
24
25
20
30
2020
194cent
197cent
199cent
219
265
36
31
2021
199cent
202cent
203cent
227
266
25
49
Created on Wed 23 Jan 2019 1245 PM EST (1745 GMT)
Mnemonic
Long Label
Last Update
Start Date
End Date
Frequency
1970
1971
1972
1973
1974
1975
1976
1977
1978
1979
1980
1981
1982
1983
1984
1985
1986
1987
1988
1989
1990
1991
1992
1993
1994
1995
1996
1997
1998
1999
2000
2001
2002
2003
2004
2005
2006
2007
2008
2009
2010
2011
2012
2013
2014
2015
2016
2017
2018
2019
2020
2021
2022
2023
2024
2025
2026
2027
2028
2029
2030
2031
2032
2033
2034
2035
2036
2037
2038
2039
2040
2041
2042
2043
2044
2045
2046
2047
2048
CPILANGAFRSM1
Los Angeles-Long Beach-Anaheim CA (MSA) [2013 Definition] FIPS Code 31080 Consumer Price Index for All Urban Consumers (1982-84=100) IHS MARKIT ECONOMICS December 2018 Forecast Source Bureau of Labor Statistics End of Historical Data 2017
122718
1970
2048
ANNUAL
3868
4011
4139
4374
4825
5334
5683
6080
6526
7233
8372
9184
9734
9907
10360
10838
11193
11667
12206
12826
13587
14143
14654
15025
15231
15464
15748
15997
16227
16608
17155
17732
18223
18696
19320
20183
21044
21734
22501
22322
22589
23193
23665
23921
24243
24463
24925
25621
26598
27248
27844
28475
29132
29806
30500
31165
31832
32533
33254
33985
34744
35508
36279
37061
37854
38640
39440
40278
41145
42043
42963
43898
44852
45825
46816
47822
48857
49934
51047
371
320
568
1031
1055
655
698
733
1083
1575
971
599
177
458
461
328
423
462
508
593
410
361
253
137
153
183
158
144
235
330
336
277
259
334
447
427
328
353
-080
120
267
203
108
135
091
189
279
381
244
219
227
231
231
233
218
214
220
222
220
223
220
217
215
214
208
207
213
215
218
219
218
217
217
216
215
216
220
223
Date of Report
July 26 2019
July 29 2019
July 29 2019
Edison International
Corporate Outlook
BBBStable
Baa3Stable
BBB-Stable
Senior Unsecured
BBB-
Baa3
BBB-
Commercial Paper
A-2
P-3
F3
Southern California Edison
Corporate Outlook
BBBStable
Baa2Stable
BBB-Stable
First Mortgage Bonds
A-
A3
BBB+
Senior Unsecured
BBB
Baa2
BBB
Preferred Securities
BB+
Ba1
BB+
Commercial Paper
A-2
P-2
F3
Mitigating Catastrophic Wildfire RiskSCE plans to spend significant capital and OampM from 2019-2023 including ~$16 billion of AB 1054 spend with continued investments beyond our forecast periodbull SCErsquos comprehensive risk mitigation program focuses on three key areas Grid hardening Increase the use of fire-resistant poles composite cross-arms and
covered conductor in high fire risk areas evaluate design approaches and next-generation engineering technology to further enhance public safety
Increased situational awareness capabilities Expand meteorological monitoring and forecasting capabilities by installing additional weather stations and high-definition cameras to help SCE and fire agencies to better prepare mitigate and respond to reported fires
Enhanced operational practices Restrict certain types of work in High Fire Risk Areas (HFRAs) during elevated fire risk conditions increase overhead inspection of equipment in HFRAs reduce fire risk via a Public Safety Power Shutoff in HFRAs during elevated weather conditions increase tree trimming and removal to further mitigate safety risks posed by trees or debris
bull Will file next compliance plan (Wildfire Mitigation Plan) detailing the near- and longer-term actions that SCE is taking to significantly reduce the risk of fire ignitions and increase emergency response and grid resiliency against future impacts of climate change in early 2020
bull 1700+ protective devices programmed with more sensitive (fast curve) settings (includes automatic reclosers and circuit breakers)
bull In-house team of fire weather experts staffing our 247 Situational Awareness Center
bull 450+ installed weather stations with a target of 850 by end of 2020
bull 130+ installed HD cameras with a target of 160 installations providing 90 coverage by end of 2019
bull Developed enhanced Fire Potential Index (FPI) to measure wildfire potential at the circuit level
bull 2 supercomputers being installed to run advanced weather models to improve forecast resolution
bull Completed Enhanced Overhead Inspections of 400000+ TampD structures in HFRA
bull Deploying helicoptersdrones to perform aerial inspections of our facilities in HFRA
bull 2100+ Circuit BreakerRecloser Blocking devices remotely set to not automatically re-energize lines during high fire risk conditions
bull Enhanced Vegetation Management Increasing trim distances to keep
power lines clear Performing inspectionsremoval
of hazard trees that pose riskbull Refined Public Safety Power
Shutoff (PSPS) protocol and communication
14
SCE Key Regulatory ProceedingsProceeding Description Next Steps
Key CPUC Proceedings
2021 General Rate Case (A 19-08-013)
Set CPUC base revenue requirement capital expenditures and rate base for 2021-2023
Application filed August 30 2019 awaiting scoping memo
2020 Cost of Capital(A 19-04-014)
Sets CPUC cost of capital and capital structurefor 2020-2022
Application filed April 22 2019 Scoping Memo issued July 2 2019 awaiting proposed decision (expected end of November 2019)
Grid Safety and Resiliency Program (GSRP) (A 18-09-002)
Requesting $582 million of total cost for 2018-2020 focused on grid hardening and enhanced vegetation management
Settlement filed for in July 2019 awaiting CPUC approval
Application for Recovery of WEMA costs (A 19-07-020)
Requesting recovery $505 million in insurance premiums tracked in the WEMA
Application filed July 31 2019 pre hearing conference scheduled for October 29 2019 scoping memo will follow
Application for Recovery of CEMA costs(A 19-07-021)
Requesting recovery $138 million in costs tracked in the CEMA for drought-related work and for work related to 2017 fires
Application filed July 31 2019 pre hearing conference scheduled for October 29 2019 scoping memo will follow
Non-Bypassable Charge OIR(I 19-07-017)
Approval of the extension of the DWR charge to fund the wildfire fund as per AB 1054
The CPUC rulemaking on the non-bypassable charge to support the Wildfire Fund was approved on October 24 2019
Charge Ready Program(A14-10-014 A18-06-015)
Implementation program for charger installations and market education
Pilot report filed in May 2018 Charge Ready Bridge Funding approved in December 2018 expecting proposed decision in fourth quarter 2019
Distribution Resources Plan (DRP) OIR (R14-08-013)
Power grid investments to integrate distributed energy resources
Demo projects have been terminated due to significant delays in project schedules No contracts will be executed in the solicitation for deferral projects due to lack of viable bids
Power Charge Indifference Adjustment (PCIA) OIR (R17-06-026)
Review revise and consider alternatives to the PCIA
Final Phase 1 Decision adopted on October 11 2018 Final Phase 2 Decision on benchmark refinementtrue-up was approved on October 10 2019
Key FERC Proceedings
FERC Formula Rates Transmission rate setting with annual updates Replacement rate filed on October 27 2017 settlement covering 1118 through 111119 filed and waiting FERC approval New replacement rate accepted June 11 partial settlement reduced request to 1197 settlement discussions are continuing
October 30 2019 15
Filed August 30 2019 SCErsquos 2021 GRC request balances the need to advance Californiarsquos ambitious decarbonization policy goals and address emergent wildfire public safety risks while continuing to provide safe reliable and affordable service to customersbull 2021 GRC Application (A 19-08-013) addresses major portion of CPUC-jurisdictional revenue
requirement for 2021-2023 Includes operating costs and capital investment Excludes CPUC jurisdictional costs such as fuel and purchased power cost of capital and other
discrete SCE capital projects (such as Charge Ready 2 ndash SCErsquos transportation electrification infrastructure program)
Excludes FERC-jurisdictional transmission revenue requirementbull Requests 2021 revenue requirement of $7601 billion $1155 billion increase over 2020 authorized revenue requirement a 127 increase over total rates1
Requests increases of $400 million in 2022 and $531 million in 2023bull Multi-track schedule proposed to approve 2021-2023 revenue requirement and reasonableness of
additional 2018-2020 recorded incremental amounts associated with the Fire Mitigation memorandum accounts (FMA)2 (See ldquoSCE 2021 General Rate Case Timelinerdquo for more information)
SCE 2021 General Rate Case Overview
October 30 2019
1 127 includes the impact of lower anticipated 2021 kWh sales and recoveries of $87 million of non-wildfire memo accounts2 Includes Wildfire Mitigation Plan Memo Account Fire Hazard Prevention Memo Account Grid Safety and Resiliency Program Memo Account and Fire Risk Mitigation Memo Account
16
bull Track 1 includes approval of the 2021-2023 GRC revenue requirement and reasonableness of additional 2018-2019 recorded incremental amounts associated with the Fire Mitigation memorandum accounts1
bull Track 2 includes approval of 2020 recorded incremental amounts associated with the Fire Mitigation memorandum accounts1 and 2018-2020 Grid Safety and Resiliency Program (GSRP) costs above settlement amount
SCE 2021 General Rate Case Timeline
October 30 2019
1 Includes Wildfire Mitigation Plan Memo Account Fire Hazard Prevention Memo Account Grid Safety and Resiliency Program Memo Account and Fire Risk Mitigation Memo AccountNote Actual schedule to be set by CPUC in a future regulatory order The schedule is subject to change over the course of the proceeding
Estimated
2021
Q1
Rebuttal Final Decision
Intervenor Testimony
Proposed Decision
Evidentiary Hearings
2020 FMA Update
Q2 Q3 Q4
GRCApplication
Rebuttal
Final Decision
Intervenor Testimony
Proposed Decision
Evidentiary Hearings
2018-2019 FMA Update
2019 2020
Q1 Q2 Q3 Q4 Q1 Q2 Q3 Q4
Estimated
17
CPUC and FERC Cost of Capital Summary
bull Litigated proceeding separate from GRC filed on April 22nd
bull Request for three-year period starting January 1 2020
bull SCE PGampE SDGampE and SoCalGas concurrently filed applications applications were consolidated into one proceeding
bull Proposed trigger mechanism for adjusting the cost of capital between proceedings (similar to current mechanism)
CPUC Cost of Capital FERC Rate Case
bull New Rate Case filed on April 11th
bull Updated formula rate becomes effective November 12 2019 if accepted by FERC subject to refund
bull Capital structure at FERC is based on recorded level vs CPUC ldquoauthorizedrdquo approach
Component Cost Weighted Cost
Conventional ROE 1060
Wildfire Risk ROE 085
Common Equity 520 1145 595
Long-Term Debt 430 474 204
Preferred Equity 50 570 029
Total 1000 828
Breakdown of Return on Equity (ROE) Cost
Conventional ROE 1112
Wildfire Risk ROE 085
Requested ROE + 1197
CAISO adder + 050
Incentive Projects Varies
October 30 2019 18
CPUC Cost of Capital (2013-2019)
Two year settlement approved for 2018-2019bull ROE adjustment based on 12-month average of
Moodyrsquos Baa utility bond rates measured from October 1 to September 30
bull If index exceeds 100 bps deadband from starting index value authorized ROE changes by half the difference
bull Starting index value based on trailing 12 months of Moodyrsquos Baa index as of September 30 of each year ndash500
CPUC Authorized Capital
Structure 2018-2019Common Equity 48 1030
Preferred 9 582Long-term Debt 43 498
Weighted Average Cost of Capital 761
October 30 2019 19
3
4
5
6
7
10112 10113 10114 10115 10116 10117 10118 10119
Rate
()
Starting Value ndash 500
CPUC Adjustment Mechanism
Moodyrsquos Baa Utility Index Spot Rate
Moving Average (10118 ndash 10119) = 450
100 basis point +- Deadband
ROE fixed at 1030 for 2018 independent of trigger mechanism
ROE fixed at 1045 for 2017 independent of trigger mechanism
SCE Distribution System Investments
1 Deferrals required with infrastructure replacement load growth and grid modernization programs2 Other includes among other things grid modernization emergency management customer requested system modifications and transportation electrification programsNote Forecast based on 2021 GRC request levels
Distribution Trendsbull Capital expenditures for certain programs deferred over
next five years to support reallocation of distribution resources to wildfire mitigation1 historical program funding levels will be reinstated in subsequent GRC periods in order to resume trajectory towards equilibrium replacement rate
bull Distribution grid requires upgrades to circuit capacity automation and control systems to support various grid resiliency and reliability objectives as well as increased use of distributed energy resources
2019 ndash 2023 Capital Spending Forecast for Distribution2 - $208 billion
2019-2023 Capital Spending Driversbull Automation of distribution circuitsbull Pole replacements bull Load growth upgradesbull Cable and overhead conductor replacementsbull Preventive and breakdown maintenancebull Circuit breaker transformer bank and relay
replacementsupgradesbull New Service Connections
October 30 2019
Load Growth
New Service Connections
Infrastructure Replacement
General Plant
Other
Wildfire
20
Charge Ready Bridge Funding and 2
SCE Transportation Electrification (TE) Proposalsbull Proposals build on SCErsquos Clean Power and Electrification Pathway which is an integrated approach to
reduce GHG emissions and air pollution by taking action in three California economic sectors electricity transportation and buildings
bull These programs accelerate electrification of the transportation sector supporting SCErsquos vision of placing at least 7 million light-duty passenger vehicles on the roads and transitioning to zero-emission trucks and transit Additional studies launched to increase adoption such as electrification of the Interstate 5 corridorMedium- and Heavy-Duty (MDHD) Vehicle
Transportation Electrification Program
Charge Ready Pilot - $22 million Total Cost1 (in 2014 dollars) approved January 2016bull Approved capital spend of $12 million OampM of $10 millionbull Supports 1280 chargersbull Included in capital spend and rate base forecasts
$356 million Total Cost1 (in nominal dollars) approved May 2018 bull 5-year programbull Approved capital spend of $242 million OampM of $115
millionbull Included in capital spend and rate base forecasts
1 Total Cost includes both OampM and capital spend
Charge Ready ldquoBridgerdquo Funding - $22 million Total Cost (in 2014 dollars) approved December 2018bull Additional approved capital spend of $12 million OampM
of $10 million bridge funding must be subtracted from any authorized Charge Ready 2 funding
bull Included in capital spend and rate base forecastsbull SCE to install at least 1000 chargers including 20 in
multi-unit dwellingsCharge Ready 2 ndash $760 million Total Cost1 (in 2018 dollars) filed June 2018 (pending CPUC approval)bull 4-year program providing over 50000 chargersbull $561 million in capital spend OampM of $199 millionbull Not included in capital spend or rate base forecasts
Charge Ready Pilot
October 30 2019 21
310
185
85
0
50
100
150
200
250
300
350
Transmission Distribution Customer
MW
SCE 2018 Storage Portfolio
Up to 80 of MW to be shifted between
TampD
85 MWexcess may offset TampD
targets
Eligible storage to be included in 2020 Storage compliance Plan (Filing date 312020)
Storage that is permitted to count in different categories due to flex counting rules
Currently above targets
2020 Cumulative Procurement Target
SCE Energy StorageCPUC Energy Storage Program Requirements
bull Storage Rulemaking (R10-12-007) established 1325 MW target for IOUs by 2024 (580 MW SCE share spread as biennial targets during 2014-20) ownership allowed up to 290 MW for SCE
bull Flexibility to transfer across categories expanded in Storage Rulemaking (R15-03-011)
SCE Procurement Activities to Meet CPUC Requirements
bull SCE has procured over 720 MW of energy storage (includes 60 MW of utility owned storage) ~600 MW of which is eligible to count towards CPUC targets
bull SCE submitted its 2018 Local Capacity Requirements RFP (2018 LCR RFP) and its second Aliso Canyon Energy Storage RFO (ACES 2 RFO) for approval Upon Commission approval of these energy storage resources SCE will have exceeded the 580 MW target set by AB 2514
bull SCE filed its 2018 Energy Storage and Investment Plan (ESPampIP) on March 1 2018 the AB 2514 track was approved by D18-10-036 on October 25 2018 however the Commission rejected SCErsquos AB 2868 proposals in D19-06-032
SCE Procurement to Meet System Reliability Needs
bull A Proposed Decision (PD) Issued in the Integrated Resources Plan (IRP) Proceeding (R16-02-007) directs SCE to procure 1745 MW of incremental system resource capacity to come online between August 1 2021 and August 1 2023 SCE Launched its 2019 System Reliability RFO on September 12 2019 Energy Storage will be an eligible resource to be procured in this RFO
bull In light of the IRP PD SCE concurrently launched a separate track to procure utility owned energy storage systems which will be referred to as the Reliability Owned Energy Storage (RUOES) procurement
October 30 2019 22
SCE Large Transmission Projects
FERC Cost of Capital112 ROE from January 1 2018 to November 12 2019bull ROE = Base (plus incentives) of 107 + CAISO Participation Application for FERC Formula recovery mechanism post
November 12 2019 was filed April 11 2019 Requested 50 bp CAISO adder approved but application for
rehearing requested by CPUC
Summary of Large Transmission Projects
Project Name Total Cost5 Remaining Investment(as of September 30 2019)
Estimated In-ServiceDate
West of Devers12 $848 million $416 million 2021
Mesa Substation1 $646 million $296 million 2022
Alberhill System3 $486 million $446 million mdash 3
Riverside Transmission Reliability4 $451 million $441 million 2024
Eldorado-Lugo-Mohave Upgrade $257 million $180 million 2021
1 CPUC approved2 Morongo Transmission holds an option to invest up to $400 million or half of the estimated cost of the transmission facilities only at the in-service date If the option is
exercised SCErsquos rate base would be offset by that amount 3 In August 2018 the CPUC approved the revised alternate decision which left the proceeding open and directed SCE to supplement the existing record with additional analysis
as it relates to the Project need and alternatives Potential revisions to the Project have not been reflected in the total cost of the Project or estimated in service date 4 Riverside Transmission Reliability Project total cost is currently estimated to be $451 million however costs could increase depending on the final route alternative selected5 Total Costs are nominal direct expenditures subject to CPUC and FERC cost recovery approval SCE regularly evaluates the cost and schedule based on permitting processes
given that SCE continues to see delays in securing project approvalsOctober 30 2019 23
SCE Operational Excellence
Top Quartilebull Safetybull Reliabilitybull Customer servicebull Cost efficiency
Optimizebull Capital productivitybull Purchased power costbull Digitization
High performing continuous improvement culture
Defining Excellence Measuring Excellence
bull Employee and public safety metrics
bull System performance and reliability (SAIDI and SAIFI)
bull Customer satisfaction calculation based on internal voice-of-customer surveys
bull OampM cost per customerbull Reduce system rate growth
with OampM purchased power cost reductions
Ongoing Operational Excellence
Efforts
October 30 2019 24
Responding to Industry ChangeLong-Term Industry Trends Strategy
bull The technology landscape is evolving at an unprecedented pace with innovation driving advances in cost and capabilities of distributed energy resources
bull Customer expectations are changing with increasing choices and alternatives a growing priority of sustainability objectives and flattening demand
bull The regulatory environment for utilities is complex increasingly supportive of new forms of competition but unable to keep pace with new business models
bull Policies both in California and globally are setting aggressive greenhouse gas reduction targets
SCE Strategybull Clean the power system by accelerating
the de-carbonization of electricity supplybull Help customers make cleaner energy
choices to support electrification and leverage flexible energy demand
bull Strengthen and modernize the grid by replacing aging infrastructure and deploying technology
bull Achieve operational and service excellence with top tier performance in safety reliability affordability and customer satisfaction
Beyond SCEbull Position Edison Energy as an independent
energy advisor and integrator for large commercial and industrial customers
bull Further clean energy and sustainability efforts in California through Edison Energy insights
October 30 2019 25
bull Energy is a significant risk large commercial and industrial customers face Edison Energy creates competitive advantage for market leaders by quantifying this risk and designing the portfolio solution to protect shareholder value threatened by complex energy policies increasing sustainability needs technological advancements and new products
bull Optimized energy solutions based on robust analytics of the customerrsquos energy portfolio in alignment with their goals and strategic objectives
bull Implementation of solutions through existing service lines or brokering with third parties
bull Edison International investment $83 million as of September 30 2019
Edison Energy
Edison Energy Summary
The Opportunity Trusted Advisor and Solution Integrator
Managed Portfolio Solution
Renewables amp Sustainability
Supply Solutions
Demand Solutions
Installations
October 30 2019 26
27
Total Rate Base $307 billion
bull FERC comprises ~20 of total
CPUC
Return on Equity (ROE)
103
Capital Structure2 48 equity
FERC
ROE3 112 with incentives(previously 105 with incentives)
Capital Structure Recorded capital structure 45 2019 average estimated equity
Other Items
Capital Market Activities
$49 billion of EIXSCE debt and equity issuances in addition to SCErsquos normal course debt financing of rate base
$468 $480
($033)($024)$041
$029
SCE 2019 EPSfrom Rate
Base Forecast
SCEVariances
2018 True-Ups
EIX Parentamp Other
EquityProgram WF FundFinancing
EIX 2019 CoreEPS Midpoint
Guidance
bull Financing and other$032
bull Z-factor advice letter approval $004
bull Energy efficiency $005
2019 Core Earnings Per Share Guidance ndashBuilding from SCE Rate Base
bull HoldCo operating expenses (1) cent per share per month
bull HoldCo debt issued $1 billion in 2019 ($400 million of issuance remaining)
bull EEG target breakeven run rate by year-end 2019
EIX 2019 Core EPS guidance range of $470 - $490 midpoint $009 higher than prior
Key Assumptions
Note See Earnings Per Share Non-GAAP Reconciliations and Use of Non-GAAP Financial Measures in Appendix All tax-affected information on this slide is based on our current combined statutory tax rate of approximately 28 Totals may not foot due to rounding
1 Reflects actual financing activity at SCE (August 1st debt offering) and EIX (July 30th equity offering) versus prior guidance based on assumption that financing would occur on September 10th
2 On February 28 2019 SCE filed an application with the CPUC for a waiver of compliance with this equity ratio requirement describing that while the wildfire-related charge accrued in the fourth quarter of 2018 caused its equity ratio to fall below 47 on a spot basis as of December 31 2018 SCE remains in compliance with the 48 equity ratio over the applicable 37-month average basis While the CPUC reviews the waiver application SCE is considered in compliance with the capital structure rules
3 SCErsquos April 11 2019 TO2019A filing to revise its ROE is pending review with the FERC and not reflected in guidance assumptions
2019 EIX Core Earnings Guidance
bull Test year 2018 GRC true-up $020
bull FERC ROE settlement (prior year)$009
bull Previously announced financing plan (debt and equity) ($018)
bull Update to financing plan based on actual results ($006)
bull Remaining previously disclosed equity plan $05 billion
1 2019 dividend annualized based on December 6 2018 declaration
Fifteen Consecutive Years of Dividend Growth
Target dividend growth within target payout ratio of 45-55 of SCErsquos earnings
1
October 30 2019 28
Appendix
October 30 2019 29
EIXrsquos 2018 Sustainability Report Highlights
Edison Energy is not the same company as Southern California Edison the utility and Edison Energy is not regulated by the California Public Utilities Commission Cumulative duration (in minutes) of sustained repair outages lasting longer than five minutes experienced by the average customer in a year (including major event days) In February 2019 the EIX board approved a $3 million donation to the Edison International Wildfire Assistance Fund to enhance community resiliency and wildfire prevention and
mitigation This affects the 2019 data year and is not reflected here
October 30 2019
ldquoAt Edison International we are leading the transformation of the electric power industry toward a clean energy future by focusing on opportunities in clean energy efficient electrification the grid of the future and customer choice As we pursue this vision sustainability remains at the core of who we are and what we dordquo ndash Pedro Pizarro Edison International CEO
bull Earnings not affected by variability of retail electricity salesbull Differences between amounts collected and authorized levels
either billed or refundedbull Promotes energy conservationbull Stabilizes revenues during economic cycles
Major Balancing Accountsbull Salesbull Fuel and Purchased powerbull Energy efficiencybull Pension expense
bull Cost-recovery related balancing accounts represented more than 59 of costs
bull Trigger mechanism for fuel and purchased power adjustments at 5 variance level
Advanced Long-TermProcurement Planning
bull Upfront contract approvals and prudency standards provide greater certainty of cost recovery (subject to compliance-related reasonableness review)
Forward-looking Ratemaking bull Forward and test year GRC with three-year rate cycle bull Separate cost of capital mechanism
October 30 2019 31
SCE Historical Capital Expenditures($ billions)
$40 $39
$35$38
$44
2014 2015 2016 2017 2018
October 30 2019 32
Credit Ratings Summary
Date of Report July 26 2019 July 29 2019 July 29 2019
Edison InternationalCorporate Outlook BBBStable Baa3Stable BBB-StableSenior Unsecured BBB- Baa3 BBB-Commercial Paper A-2 P-3 F3
Southern California EdisonCorporate Outlook BBBStable Baa2Stable BBB-StableFirst Mortgage Bonds A- A3 BBB+Senior Unsecured BBB Baa2 BBBPreferred Securities BB+ Ba1 BB+Commercial Paper A-2 P-2 F3
FitchMoodyrsquosSampP
October 30 2019 33
4
ampCalibriRegularFINANCIAL AND STATISTICAL REPORTampCalibriRegularampA
Distribution Power Grid of the Future
One-Way Electricity Flowbull System designed to distribute electricity
from large central generating plantsbull Voltage centrally maintainedbull Increasing integration of distributed
energy resourcesbull Limited situational awareness and
visualization tools for power grid operators
Renewable Generation Mandates
Subsidized Residential Solar
Limited Electric Vehicle Charging Infrastructure
Variable Two-Way Electricity Flowbull Distribution system at the center of the
power gridbull System designed to manage fluctuating
resources and customer demand bull Digital monitoring and control devices and
advanced communications systems to improve safety and reliability and integrate DERs
bull Improved data management and power grid operations and cyber risk mitigation
bull Integrated utility distribution with distributed energy resources planning
Maximize Distributed Resources and Electric Vehicle Adoptionbull Distribution power grid infrastructure
design supports customer choice and greater resiliency
Current State Future State
October 30 2019 34
SCE Customer Demand Trends
Note See Edison International Financial and Statistical Reports for 2017 for further information
Kilowatt-Hour Sales (millions of kWh) 2014 2015 2016 2017 2018
Residential 30027 30093 29579 30221 29865
Commercial 42004 42396 42189 42514 42369
Industrial 8392 7623 7162 6659 6786
Public authorities 4975 4795 4715 4711 4510
Agricultural and other 2019 1950 1803 1498 1745
Subtotal 87416 86857 85448 85602 85276
Resale 1308 1080 1794 1568 1867
Total Kilowatt-Hour Sales 88725 87937 87242 87170 87143
Total Number of Customers 5005401 5033330 5060528 5094818 5126985
Number of New Connections 29879 31653 38076 39621 39633
Area Peak Demand (MW) 23055 23079 23091 23508 23766
October 30 2019 35
SCE Bundled Revenue Requirement
Note Rates in effect as of July 26 2019 Represents bundled service which excludes Direct AccessCCA customers that do not receive generation services from SCE
SCE Systemwide Average Rate History (centkWh)
2010 2011 2012 2013 2014 2015 2016 2017 2018 2019
143 141 143 159 167 162 148 157 160 159
Fuel amp Purchased Power(47)
Distribution(38)
Transmission (8)
Generation(8)
Other (-1)
2019 Bundled Revenue
Requirement
$millions centkWh
Fuel amp Purchased Power ndash includes CDWR Bond Charge
4422 74
Distribution ndash poles wires substations service centers Edison SmartConnectreg
3628 61
Generation ndash owned generation investment and OampM 708 12
Transmission ndash greater than 220kV 789 13
Other ndash CPUC and legislative public purpose programs system reliability investments nuclear decommissioning and prior-year over collections
(116) (01)
Total Bundled Revenue Requirement ($millions) $9431
divide Bundled kWh (millions) 59396
= Bundled Systemwide Average Rate (centkWh) 159cent
October 30 2019 36
37
97cent
159cent
80cent
100cent
120cent
140cent
160cent
180cent
200cent
220cent
1990
1991
1992
1993
1994
1995
1996
1997
1998
1999
2000
2001
2002
2003
2004
2005
2006
2007
2008
2009
2010
2011
2012
2013
2014
2015
2016
2017
2018
2019
195cent
Rates reduced due to the implementation of 1) the SONGS Revised Settlement including NEIL insurance benefits 2) lower fuel amp purchased power costs and 3) a lower 2015 GRC revenue requirement that includes flow-through tax benefits
centkWh
System Average Rate Historical Growth
SCErsquos system average rate has grown less than inflation over the last 29 years
SCE System Average RateLos Angeles Area Inflation
Comparative System Average Rates
Delta to SCESCE 159cent --
PGampE 211cent1 33
SDGampE 246cent1 55
CAGR29-yr
(lsquo90-rsquo19)20-yr
(lsquo99-rsquo19)10-yr
(lsquo09-19)17 26 1124 25 20
Energy Crisis and return to normal
Higher gas price forecast post-Katrina leads to higher rates with subsequent refund of over collection
Delay in 2012 GRC leads to shorter ramp-up of rate increase
1 PGampE Advice 5644-E effective October 1 SDGampE Advice 3377-E effective June 1
October 30 2019
Data
SCE System Average Rate
1990199119921993199419951996199719981999200020012002200320042005200620072008200920102011201220132014201520162017201820199699999999999999310310610310510710110196969614214212412212614713913714314314114315916715940876786458386148350382761769171566871495475337116159CPI Los Angeles-Long Beach-Anaheim CA199019911992199319941995199619971998199920002001200220032004200520062007200820092010201120122013201420152016201720182019202096999999999999993100974239450441131046212585868498310726876840039228108738285083414611104041339548576811242695044160916114205839057899881158478900883218511856679342492612122475588812561061265926153091265513010279685966582133476140824337041379322865554462144095927379783561502417198233561515516495767909655160640840897938551593635512757601816127380397448466165581867639842851689511064769380217077830471050007173082233194307481746514628312063517794555998527898182917523920509811898939005269867419453007660169238SAR CPI (old)1990199119921993199419951996199719981999200020012002200320042005200620072008200920102011201220132014201520162017201820199699999999999999310108935518848128104164104853626311072574143759422111004139294598572113128515849244651164507302761853711917284265578923121016455131068581236705147011944127834109318192141314347216021390513353198545827113660054850437767140244467121649041449648574526591614963575483132515393112443397234159803525097292715929158237134114161898499904328691669815498437507617045100580396491729508329612907517573561579182243175943857388863061777863624593457518198880904395583186584452388557219152742489955948
195cent
CPI Workbook
image1png
129 ₵
164 ₵
US Average SCE
27 Higher
SCE Rates and Bills Comparison
SCErsquos average residential rates are above national averagebut residential bills are below national average due to lower usage
bull SCErsquos residential rates are above national average due in part to a cleaner fuel mix high cost of living and lower system load factor
bull SCErsquos residential customer usage is lower than the national average due to mild climate and higher energy efficiency appliance and building standards
bull Average monthly residential bills are lower than the national average as higher rate levels are more than offset by lower usage
Key FactorsKey Factors
Source EIAs Form 861M (formerly Form 826) Data Monthly Electric Utility Sales and Revenue Data for 12-Months Ending June 2019 httpswwweiagovelectricitydataeia861mindexhtml
2018-19 Average Residential Rates (centkWh)
2018-19 Average Residential Bills ($ per Month)
$128
$95
US Average SCE
26 Lower
October 30 2019 38
Sheet1
Sheet1
129 ₵
164 ₵
Sheet2
27 Higher
Sheet3
Sheet1
Sheet1
$128
Sheet2
26 Lower
Sheet3
bull Assembly Bill 1171 permits cities and counties and Joint Powers Agencies (JPAs) to act as CCAs to purchase and sell electricity on behalf of the utility customers within their jurisdiction
bull An Order Instituting Rulemaking (OIR R17-06-026) was opened on June 29 2017 to review revise and consider alternatives to the ldquoPower Charge Indifference Adjustmentrdquo or PCIA The PCIA allocates a proportional share of above-market costs of SCErsquos
energy procurement portfolio to departing load customers to ensure remaining bundled service customers are indifferent
October 11 2018 Commission decision changes PCIA methodology and has substantially addressed the historical subsidy to departing load that materialized when renewables market prices declined over the past 4 yearso Decision also established a Phase 2 which is addressing utility
portfolio optimization PCIA ldquopre-paymentrdquo options for entities and individual departing load customers and implementation of the ldquotrue-uprdquo process for Resource Adequacy (RA) and Renewable Energy Credits (RECs) costs
o A Phase 2 final decision on the benchmark and true-up process was approved on October 10 2019 with the other Phase 2 activities to continue into 2020
bull On February 8 2018 the Commission approved Resolution E-4907 requiring CCAs to demonstrate compliance with annual Resource Adequacy (RA) requirements prior to commencing operations
bull Existing Direct Access and CCA load is expected to be ~35 of SCErsquos total load by the end of 2019
Investor-Owned Utility (IOU)
Community Choice Aggregator (CCA)
Community Choice Aggregator (CCA) Overview
Approximately 40 of SCErsquos bundled service load could be part of a CCA or Direct Access by the end of 2020
October 30 2019 39
bull CPUC Order Instituting Ratemaking R 12-06-013 comprehensively reviewed residential rate structure including a future transition to Time of Use (TOU) rates In March 2018 SCE began to migrate 400000 residential customers to TOU rate structures
Remaining eligible residential customers to be migrated beginning October 2020bull July 2015 CPUC Decision D 15-07-001 includes Transition to 2 tiered rate structure coupled with Super-User Electric (SUE) Surcharge1
ldquoSuper User Electric Surchargerdquo for usage 400 above baseline (~3 of all usage)
Minimum bills of approximately $10month (applied to delivery revenue only)
January 2014 2019
100(60 of system usage)
219(3)
Tier 1100
Tier 2 101-400
SUEgt400
125(37)
Usage Level ( of Baseline)Usage Level ( of Baseline)
1 Completed in 20192 SCErsquos California Alternate Rates for Energy (CARE) program is an income-qualifying program that reduces energy bills for eligible customers by about 30
Winter Weekdays 8am-9pm Weekdays and Weekends 4-9pm
Off-Peak Summer Weekdays 11pm-8amWeekends All
Weekdays and Weekends All except 4-9pm
Winter Weekdays 9pm-8amWeekends All
Weekdays and Weekends 9pm-8am
Super Off-Peak Winter NA Weekdays and Weekends 8am-4pm
New Time-of-Use (TOU) Periods
bull On March 1 2019 SCE changed its basic TOU pricing period definition for the first time in over 30 years
bull Abundant mid-day renewable energy lowers prices from 8am-4pm (October - June)
bull Highest cost period is now 4pm-9pm all-days1
1 TOU pricing periods defined for non-residential customers per CPUC Decision D18-07-006 Similar residential TOU definitions were filed by SCE in A17-12-012
bull 998 solar projectsbull 320445 residential (71 of all residential customers) ndash 1756 MW bull 7333 non-residential ndash 977 MW bull Approximately 4775887 MWhyear generated
SCE Net Metering Statistics (919)
0
5
10
15
20
25
30
35
40
0
1000
2000
3000
4000
5000
6000
7000
2013 2014 2015 2016 2017 2018 2019
MW
Inst
alle
d
Num
ber o
f Sol
ar R
esid
entia
l Ins
talla
tions
Installations MW
July 1 2017bull Official start of NEM successor tariff customers are subject to
Mandatory TOU rate Non-bypassable charges Application fees
July 31 2017bull Residential customers who meet this deadline are grandfathered for
current TOU periods for maximum of 5 years (10 for non-residential)September 9 2017bull Smart Inverters required on all solar installationsJuly 25 2018bull Smart Inverters with Reactive Power Priority required on all solar
installationsNear Term Outlookbull Combination of a flatter tiered rate and the mandatory TOU NEM 20
rate structure has helped reduce the per customer cost shift further efforts to reduce the shift through new TOU pricing periods
bull Commission to revisit NEM Successor Tariff by July 2020 to evaluate the existing NEM tariffs and consider the development and adoption of successor tariffs
Key Dates
Third Quarter Earnings Summary
October 30 2019
Q32019
Q32018 Variance
Basic Earnings Per Share (EPS)1
SCE $ 145 $ 164 $ (019)
EIX Parent amp Other (009) (007) (002)
Basic EPS $ 136 $ 157 $ (021)
Less Non-core Items
SCE2 $ (014) $ 002 $ (016)
EIX Parent amp Other3 mdash (001) 001
Total Non-core $ (014) $ 001 $ (015)
Core Earnings Per Share (EPS)
SCE $ 159 $ 162 $ (003)
EIX Parent amp Other (009) (006) (003)
Core EPS $ 150 $ 156 $ (006)
Key SCE EPS Drivers4
Higher revenue5 $ 012- CPUC revenue (002)- 2018 FERC Formula Rate settlement 010- Other FERC revenue 004
Higher OampM (021)Lower depreciation 002Higher net financing costs (004)Income taxes5 019Property and other taxes (001)Results prior to impact from share dilution $ 007Impact from share dilution (010)Total core drivers $ (003)Non-core items 2 (016)Total $ (019)
Key EIX EPS Drivers4
EIX parent and other mdash Higher interest expense and corporate expenses $ (005)EEG mdash Lower corporate expenses 001Impact from share dilution 001Total core drivers $ (003)Non-core items 3 001Total $ (002)
1 See Earnings Non-GAAP reconciliations and Use of Non-GAAP Financial Measures in Appendix2 Includes SCEs contributions to Wildfire Insurance Fund in third quarter 2019 and impact from the approval of the Revised San Onofre Settlement Agreement in the third quarter 2018 3 Loss on sale of SoCore Energy4 2019 EPS drivers are reported at a consistent share count of 3258 million (2019 QTD weighted-average shares outstanding is 3471 million)5 Includes $020 of tax benefits refunded to customersNote Diluted earnings were $135 and $157 per share for the three months ended September 30 2019 and 2018 respectively
43
1 See Earnings Non-GAAP reconciliations and Use of Non-GAAP Financial Measures in Appendix2 Impact of 2018 GRC final decision related to impairment of utility property plant and equipment changes in allocation of deferred tax re-measurement between customers and
shareholders SCErsquos contributions to the Wildfire Insurance Fund gain from sale of nuclear fuel and impact from the approval of the Revised San Onofre Settlement Agreement3 Loss on sale of SoCore Energy and impact of hypothetical liquidation at book value (HLBV) accounting method4 2019 EPS drivers are reported at a consistent share count of 3258 million (2019 YTD weighted-average shares outstanding is 3330 million)5 Test Year 2018 GRC true-up of $020 includes revenue of $(034) OampM of $006 depreciation of $024 interest expense of $(001) property and other taxes of $001 and income taxes of
$0246 Includes $018 of tax benefits refunded to customersNote Diluted earnings were $342 and $308 per share for the nine months ended September 30 2019 and 2018 respectively
Year to Date Earnings Summary
October 30 2019
YTD 2019
YTD 2018 Variance
Basic Earnings Per Share (EPS)1
SCE $ 365 $ 343 $ 022
EIX Parent amp Other (022) (034) 012
Basic EPS $ 343 $ 309 $ 034
Less Non-core Items
SCE2 $ (030) $ 002 $ (032)
EIX Parent amp Other3 mdash (014) 014
Total Non-core $ (030) $ (012) $ (018)
Core Earnings Per Share (EPS)
SCE $ 395 $ 341 $ 054
EIX Parent amp Other (022) (020) (002)
Core EPS $ 373 $ 321 $ 052
Key SCE EPS Drivers4
Test Year 2018 GRC true-up5 $ 020Higher revenue6 055
- CPUC revenue 032- 2018 FERC Formula Rate settlement 010- FERC and other operating revenue 013
Higher OampM (026)Lower depreciation 005Higher net financing costs (012)Income taxes6 021Results prior to impact from share dilution $ 063Impact from share dilution (009)Total core drivers $ 054Non-core items2 (032)Total $ 022
Key EIX EPS Drivers4
EIX parent and other mdash Higher interest expense and corporate expenses $ (007)EEG mdash Lower corporate expenses and lower losses at the competitive business 004Impact from share dilution 001Total core drivers $ (002)Non-core items3 014Total $ 012
44
SCE Annual Results of Operationsbull Earning activities ndash revenue authorized by CPUC and FERC to provide reasonable cost recovery and return on investmentbull Cost-recovery activities ndash CPUC- and FERC-authorized balancing accounts to recover specific project or program costs subject
to reasonableness review or compliance with upfront standards
($ millions)
2018 2017
Earnings Activities
Cost-Recovery Activities
Total Consolidated
Earnings Activities
Cost-Recovery Activities
Total Consolidated
Operating revenue $6560 $6051 $12611 $6611 $5643 $12254Purchased power and fuel mdash 5406 5406 mdash 4873 4873Operation and maintenance 1972 730 2702 1898 824 2722Wildfire-related claims net of recoveries 2669 mdash 2669 ― ― ―Depreciation and amortization 1867 mdash 1867 2032 mdash 2032Property and other taxes 392 mdash 392 372 mdash 372Impairment and other charges (12) mdash (12) 716 mdash 716Other operating income (7) mdash (7) (8) mdash (8)Total operating expenses 6881 6136 13017 5010 5697 10707Operating (loss) income (321) (85) (406) 1601 (54) 1547Interest expense (671) (2) (673) (588) (1) (589)Other income and expenses 107 87 194 93 55 148(Loss) income before income taxes (885) mdash (885) 1106 mdash 1106Income tax (benefit) expense (696) mdash (696) (30) mdash (30)Net (loss) income (189) mdash (189) 1136 mdash 1136Preferred and preference stock dividend
requirements 121 mdash 121 124 mdash 124
Net (loss) income available for common stock ($310) mdash ($310) $1012 mdash $1012Less Non-core items (1750) (481)Core Earnings $1440 $1493
Note See Use of Non-GAAP Financial Measures
October 30 2019 45
Reconciliation of EIX Basic Earnings Per Share Guidance to EIX Core Earnings Per Share Guidance
EPS Attributable to Edison International 2019
Low Midpoint High
SCE $483
EIX Parent amp Other (032)
Basic EPS1 $441 $451 $461
Non-Core Items
SCE23 (029) (029) (029)
EIX Parent amp Other mdash mdash mdash
Total Non-Core1 (029) (029) (029)
Core EPS
SCE $512
EIX Parent amp Other (032)
Core EPS1 $470 $480 $490
1 EPS is calculated on the assumed weighted-average share count for 2019 Please see 2019 EIX Core Earnings Guidance slide for more information 2 Includes impact of 2018 GRC final decision related to impairment of utility property plant and equipment changes in allocation of deferred tax re-measurement between
customers and shareholders and SCErsquos contributions to the Wildfire Insurance Fund3 Includes $001 per share as a result of share count dilution
October 30 2019
Earnings Per Share Non-GAAP Reconciliations
46
Earnings Non-GAAP Reconciliations
1 Impact of 2018 GRC final decision related to impairment of utility property plant and equipment changes in allocation of deferred tax re-measurement between customers and shareholders SCErsquos contributions to the Wildfire Insurance Fund gain from sale of nuclear fuel and impact from the approval of the Revised San Onofre Settlement Agreement
2 Loss on sale of SoCore Energy and impact of hypothetical liquidation at book value (HLBV) accounting method
($ millions)
Reconciliation of EIX GAAP Earnings to EIX Core Earnings
Earnings Attributable to Edison International Q32019
Q32018
YTD 2019
YTD 2018
SCE $503 $536 $1215 $1119
EIX Parent amp Other (32) (23) (74) (112)
Basic Earnings $471 $513 $1141 $1007
Non-Core Items
SCE 1 ($48) 7 ($99) 7
EIX Parent amp Other 2 mdash (4) mdash (46)
Total Non-Core ($48) $3 ($99) ($39)
Core Earnings
SCE $551 $529 $1314 $1112
EIX Parent amp Other (32) (19) (74) (66)
Core Earnings $519 $510 $1240 $1046
October 30 2019 47
EIX Core EPS Non-GAAP ReconciliationsReconciliation of Edison International Basic Earnings Per Share to Edison International Core Earnings Per Share
Note See Use of Non-GAAP Financial Measures
Earnings Per Share Attributable to Edison International 2018 2017
Basic EPS ($130) $173
Non-Core Items
SCE
Wildfire-related claims net of recoveries (560) mdash
Settlement of 1994 ndash 2006 California tax audits 020 mdash
Write down impairment and other as a result of Revised San Onofre Settlement Agreement
003 (138)
Re-measurement of deferred taxes as a result of Tax Reform mdash (010)
Edison International Parent and Other
Settlement of 1994 ndash 2006 California tax audits (004) mdash
Re-measurement of deferred taxes as a result of Tax Reform mdash (133)
Sale of SoCore Energy and other (014) 004
Discontinued operations
Settlement of 1994 ndash 2006 California tax audits 010 mdash
Less Total Non-Core Items (545) (277)
Core EPS $415 $450
October 30 2019 48
Use of Non-GAAP Financial MeasuresEdison Internationals earnings are prepared in accordance with generally accepted accounting principles used in the United States Management uses core earnings internally for financial planning and for analysis of performance Core earnings are also used when communicating with investors and analysts regarding Edison Internationals earnings results to facilitate comparisons of the Companys performance from period to period Core earnings are a non-GAAP financial measure and may not be comparable to those of other companies Core earnings (or losses) are defined as earnings or losses attributable to Edison International shareholders less income or loss from discontinued operations and income or loss from significant discrete items that management does not consider representative of ongoing earnings such as exit activities including sale of certain assets and other activities that are no longer continuing asset impairments and certain tax regulatory or legal settlements or proceedings
A reconciliation of Non-GAAP information to GAAP information is included either on the slide where the information appears or on another slide referenced in this presentation
EIX Investor Relations Contact
Sam Ramraj Vice President (626) 302-2540 samramrajedisonintlcom
Allison Bahen Principal Manager (626) 302-5493 allisonbahenedisonintlcom
October 30 2019 49
Business Update
Slide Number 2
Table of Contents
EIX Strategy Should Produce Long-Term Value
SCE Highlights
Slide Number 6
SCE Historical Rate Base and Core Earnings
SCE Capital Expenditure Forecast
SCE Rate Base Forecast
Slide Number 10
Californiarsquos GHG Emissions Overview
SCErsquos Pathway 2045 Highlights
Slide Number 13
Slide Number 14
Slide Number 15
SCE Key Regulatory Proceedings
Slide Number 17
Slide Number 18
CPUC and FERC Cost of Capital Summary
CPUC Cost of Capital (2013-2019)
SCE Distribution System Investments
Slide Number 22
Slide Number 23
SCE Large Transmission Projects
SCE Operational Excellence
Responding to Industry Change
Slide Number 27
2019 EIX Core Earnings Guidance
EIX Annual Dividends Per Share
Appendix
EIXrsquos 2018 Sustainability Report Highlights
Slide Number 32
SCE Historical Capital Expenditures
Credit Ratings Summary
Distribution Power Grid of the Future
SCE Customer Demand Trends
SCE Bundled Revenue Requirement
Slide Number 38
SCE Rates and Bills Comparison
Slide Number 40
Slide Number 41
Slide Number 42
Slide Number 43
Slide Number 44
Slide Number 45
SCE Annual Results of Operations
Slide Number 47
Earnings Non-GAAP Reconciliations
EIX Core EPS Non-GAAP Reconciliations
Use of Non-GAAP Financial Measures
US Average
$134
SCE
$95
-291
US Average
128
SCE
164
higher
28
Created on Mon 6 Jun 2016 1250 PM EST (1750 GMT)
Concept
1990
1991
1992
1993
1994
1995
1996
1997
1998
1999
2000
2001
2002
2003
2004
2005
2006
2007
2008
2009
2010
2011
2012
2013
2014
2015
2016
2017
2018
2019
2020
2021
2022
2023
2024
2025
2026
Consumer Price Index All-Urban
131
136
140
144
148
152
157
161
163
167
172
177
180
184
189
195
202
207
215
215
218
225
230
233
237
237
239
245
251
258
265
272
279
286
293
300
306
422
304
297
260
281
294
234
155
219
337
282
160
230
267
337
322
287
381
-032
164
314
208
147
161
012
105
236
253
265
265
264
254
251
249
234
227
SOUTHERN CALIFORNIA EDISON
System Average Rate Forecast
Source Matt Sheriff
(centkWh)
SCE System Average Rate
SAR CPI (old)
SAR CPI (current)
CPI Los Angeles-Long Beach-Anaheim CA
Consumer Price Index All-Urban
0
1990
97cent
97cent
97cent
593
30
1
1991
103cent
101cent
101cent
410
422
2
1992
106cent
104cent
105cent
361
304
3
1993
103cent
107cent
107cent
253
297
4
1994
105cent
110cent
109cent
137
260
5
1995
107cent
113cent
110cent
153
281
25
6
1996
101cent
116cent
112cent
183
294
7
1997
101cent
119cent
114cent
158
234
8
1998
96cent
121cent
116cent
144
155
9
1999
96cent
124cent
119cent
235
219
10
2000
96cent
128cent
122cent
330
337
20
11
2001
142cent
131cent
127cent
336
282
12
2002
142cent
134cent
130cent
277
160
13
2003
124cent
137cent
133cent
259
230
14
2004
122cent
140cent
138cent
334
267
15
2005
126cent
145cent
144cent
447
337
16
2006
147cent
150cent
150cent
427
322
17
2007
139cent
154cent
155cent
328
287
18
2008
137cent
160cent
161cent
353
381
19
2009
143cent
159cent
159cent
-080
-032
20
2010
143cent
162cent
161cent
120
164
10
21
2011
141cent
167cent
166cent
267
314
22
2012
143cent
170cent
169cent
203
208
23
2013
159cent
173cent
171cent
108
147
24
2014
167cent
176cent
173cent
135
161
25
2015
159cent
176cent
175cent
091
012
5
26
2016
148cent
178cent
178cent
189
105
27
2017
157cent
182cent
183cent
279
236
29
20
10
28
2018
160cent
187cent
190cent
381
253
SCE
17
26
11
29
2019
159cent
192cent
195cent
244
265
LA
24
25
20
30
2020
194cent
197cent
199cent
219
265
36
31
2021
199cent
202cent
203cent
227
266
25
49
Created on Wed 23 Jan 2019 1245 PM EST (1745 GMT)
Mnemonic
Long Label
Last Update
Start Date
End Date
Frequency
1970
1971
1972
1973
1974
1975
1976
1977
1978
1979
1980
1981
1982
1983
1984
1985
1986
1987
1988
1989
1990
1991
1992
1993
1994
1995
1996
1997
1998
1999
2000
2001
2002
2003
2004
2005
2006
2007
2008
2009
2010
2011
2012
2013
2014
2015
2016
2017
2018
2019
2020
2021
2022
2023
2024
2025
2026
2027
2028
2029
2030
2031
2032
2033
2034
2035
2036
2037
2038
2039
2040
2041
2042
2043
2044
2045
2046
2047
2048
CPILANGAFRSM1
Los Angeles-Long Beach-Anaheim CA (MSA) [2013 Definition] FIPS Code 31080 Consumer Price Index for All Urban Consumers (1982-84=100) IHS MARKIT ECONOMICS December 2018 Forecast Source Bureau of Labor Statistics End of Historical Data 2017
122718
1970
2048
ANNUAL
3868
4011
4139
4374
4825
5334
5683
6080
6526
7233
8372
9184
9734
9907
10360
10838
11193
11667
12206
12826
13587
14143
14654
15025
15231
15464
15748
15997
16227
16608
17155
17732
18223
18696
19320
20183
21044
21734
22501
22322
22589
23193
23665
23921
24243
24463
24925
25621
26598
27248
27844
28475
29132
29806
30500
31165
31832
32533
33254
33985
34744
35508
36279
37061
37854
38640
39440
40278
41145
42043
42963
43898
44852
45825
46816
47822
48857
49934
51047
371
320
568
1031
1055
655
698
733
1083
1575
971
599
177
458
461
328
423
462
508
593
410
361
253
137
153
183
158
144
235
330
336
277
259
334
447
427
328
353
-080
120
267
203
108
135
091
189
279
381
244
219
227
231
231
233
218
214
220
222
220
223
220
217
215
214
208
207
213
215
218
219
218
217
217
216
215
216
220
223
Date of Report
July 26 2019
July 29 2019
July 29 2019
Edison International
Corporate Outlook
BBBStable
Baa3Stable
BBB-Stable
Senior Unsecured
BBB-
Baa3
BBB-
Commercial Paper
A-2
P-3
F3
Southern California Edison
Corporate Outlook
BBBStable
Baa2Stable
BBB-Stable
First Mortgage Bonds
A-
A3
BBB+
Senior Unsecured
BBB
Baa2
BBB
Preferred Securities
BB+
Ba1
BB+
Commercial Paper
A-2
P-2
F3
CPUC and FERC Cost of Capital Summary
bull Litigated proceeding separate from GRC filed on April 22nd
bull Request for three-year period starting January 1 2020
bull SCE PGampE SDGampE and SoCalGas concurrently filed applications applications were consolidated into one proceeding
bull Proposed trigger mechanism for adjusting the cost of capital between proceedings (similar to current mechanism)
CPUC Cost of Capital FERC Rate Case
bull New Rate Case filed on April 11th
bull Updated formula rate becomes effective November 12 2019 if accepted by FERC subject to refund
bull Capital structure at FERC is based on recorded level vs CPUC ldquoauthorizedrdquo approach
Component Cost Weighted Cost
Conventional ROE 1060
Wildfire Risk ROE 085
Common Equity 520 1145 595
Long-Term Debt 430 474 204
Preferred Equity 50 570 029
Total 1000 828
Breakdown of Return on Equity (ROE) Cost
Conventional ROE 1112
Wildfire Risk ROE 085
Requested ROE + 1197
CAISO adder + 050
Incentive Projects Varies
October 30 2019 18
CPUC Cost of Capital (2013-2019)
Two year settlement approved for 2018-2019bull ROE adjustment based on 12-month average of
Moodyrsquos Baa utility bond rates measured from October 1 to September 30
bull If index exceeds 100 bps deadband from starting index value authorized ROE changes by half the difference
bull Starting index value based on trailing 12 months of Moodyrsquos Baa index as of September 30 of each year ndash500
CPUC Authorized Capital
Structure 2018-2019Common Equity 48 1030
Preferred 9 582Long-term Debt 43 498
Weighted Average Cost of Capital 761
October 30 2019 19
3
4
5
6
7
10112 10113 10114 10115 10116 10117 10118 10119
Rate
()
Starting Value ndash 500
CPUC Adjustment Mechanism
Moodyrsquos Baa Utility Index Spot Rate
Moving Average (10118 ndash 10119) = 450
100 basis point +- Deadband
ROE fixed at 1030 for 2018 independent of trigger mechanism
ROE fixed at 1045 for 2017 independent of trigger mechanism
SCE Distribution System Investments
1 Deferrals required with infrastructure replacement load growth and grid modernization programs2 Other includes among other things grid modernization emergency management customer requested system modifications and transportation electrification programsNote Forecast based on 2021 GRC request levels
Distribution Trendsbull Capital expenditures for certain programs deferred over
next five years to support reallocation of distribution resources to wildfire mitigation1 historical program funding levels will be reinstated in subsequent GRC periods in order to resume trajectory towards equilibrium replacement rate
bull Distribution grid requires upgrades to circuit capacity automation and control systems to support various grid resiliency and reliability objectives as well as increased use of distributed energy resources
2019 ndash 2023 Capital Spending Forecast for Distribution2 - $208 billion
2019-2023 Capital Spending Driversbull Automation of distribution circuitsbull Pole replacements bull Load growth upgradesbull Cable and overhead conductor replacementsbull Preventive and breakdown maintenancebull Circuit breaker transformer bank and relay
replacementsupgradesbull New Service Connections
October 30 2019
Load Growth
New Service Connections
Infrastructure Replacement
General Plant
Other
Wildfire
20
Charge Ready Bridge Funding and 2
SCE Transportation Electrification (TE) Proposalsbull Proposals build on SCErsquos Clean Power and Electrification Pathway which is an integrated approach to
reduce GHG emissions and air pollution by taking action in three California economic sectors electricity transportation and buildings
bull These programs accelerate electrification of the transportation sector supporting SCErsquos vision of placing at least 7 million light-duty passenger vehicles on the roads and transitioning to zero-emission trucks and transit Additional studies launched to increase adoption such as electrification of the Interstate 5 corridorMedium- and Heavy-Duty (MDHD) Vehicle
Transportation Electrification Program
Charge Ready Pilot - $22 million Total Cost1 (in 2014 dollars) approved January 2016bull Approved capital spend of $12 million OampM of $10 millionbull Supports 1280 chargersbull Included in capital spend and rate base forecasts
$356 million Total Cost1 (in nominal dollars) approved May 2018 bull 5-year programbull Approved capital spend of $242 million OampM of $115
millionbull Included in capital spend and rate base forecasts
1 Total Cost includes both OampM and capital spend
Charge Ready ldquoBridgerdquo Funding - $22 million Total Cost (in 2014 dollars) approved December 2018bull Additional approved capital spend of $12 million OampM
of $10 million bridge funding must be subtracted from any authorized Charge Ready 2 funding
bull Included in capital spend and rate base forecastsbull SCE to install at least 1000 chargers including 20 in
multi-unit dwellingsCharge Ready 2 ndash $760 million Total Cost1 (in 2018 dollars) filed June 2018 (pending CPUC approval)bull 4-year program providing over 50000 chargersbull $561 million in capital spend OampM of $199 millionbull Not included in capital spend or rate base forecasts
Charge Ready Pilot
October 30 2019 21
310
185
85
0
50
100
150
200
250
300
350
Transmission Distribution Customer
MW
SCE 2018 Storage Portfolio
Up to 80 of MW to be shifted between
TampD
85 MWexcess may offset TampD
targets
Eligible storage to be included in 2020 Storage compliance Plan (Filing date 312020)
Storage that is permitted to count in different categories due to flex counting rules
Currently above targets
2020 Cumulative Procurement Target
SCE Energy StorageCPUC Energy Storage Program Requirements
bull Storage Rulemaking (R10-12-007) established 1325 MW target for IOUs by 2024 (580 MW SCE share spread as biennial targets during 2014-20) ownership allowed up to 290 MW for SCE
bull Flexibility to transfer across categories expanded in Storage Rulemaking (R15-03-011)
SCE Procurement Activities to Meet CPUC Requirements
bull SCE has procured over 720 MW of energy storage (includes 60 MW of utility owned storage) ~600 MW of which is eligible to count towards CPUC targets
bull SCE submitted its 2018 Local Capacity Requirements RFP (2018 LCR RFP) and its second Aliso Canyon Energy Storage RFO (ACES 2 RFO) for approval Upon Commission approval of these energy storage resources SCE will have exceeded the 580 MW target set by AB 2514
bull SCE filed its 2018 Energy Storage and Investment Plan (ESPampIP) on March 1 2018 the AB 2514 track was approved by D18-10-036 on October 25 2018 however the Commission rejected SCErsquos AB 2868 proposals in D19-06-032
SCE Procurement to Meet System Reliability Needs
bull A Proposed Decision (PD) Issued in the Integrated Resources Plan (IRP) Proceeding (R16-02-007) directs SCE to procure 1745 MW of incremental system resource capacity to come online between August 1 2021 and August 1 2023 SCE Launched its 2019 System Reliability RFO on September 12 2019 Energy Storage will be an eligible resource to be procured in this RFO
bull In light of the IRP PD SCE concurrently launched a separate track to procure utility owned energy storage systems which will be referred to as the Reliability Owned Energy Storage (RUOES) procurement
October 30 2019 22
SCE Large Transmission Projects
FERC Cost of Capital112 ROE from January 1 2018 to November 12 2019bull ROE = Base (plus incentives) of 107 + CAISO Participation Application for FERC Formula recovery mechanism post
November 12 2019 was filed April 11 2019 Requested 50 bp CAISO adder approved but application for
rehearing requested by CPUC
Summary of Large Transmission Projects
Project Name Total Cost5 Remaining Investment(as of September 30 2019)
Estimated In-ServiceDate
West of Devers12 $848 million $416 million 2021
Mesa Substation1 $646 million $296 million 2022
Alberhill System3 $486 million $446 million mdash 3
Riverside Transmission Reliability4 $451 million $441 million 2024
Eldorado-Lugo-Mohave Upgrade $257 million $180 million 2021
1 CPUC approved2 Morongo Transmission holds an option to invest up to $400 million or half of the estimated cost of the transmission facilities only at the in-service date If the option is
exercised SCErsquos rate base would be offset by that amount 3 In August 2018 the CPUC approved the revised alternate decision which left the proceeding open and directed SCE to supplement the existing record with additional analysis
as it relates to the Project need and alternatives Potential revisions to the Project have not been reflected in the total cost of the Project or estimated in service date 4 Riverside Transmission Reliability Project total cost is currently estimated to be $451 million however costs could increase depending on the final route alternative selected5 Total Costs are nominal direct expenditures subject to CPUC and FERC cost recovery approval SCE regularly evaluates the cost and schedule based on permitting processes
given that SCE continues to see delays in securing project approvalsOctober 30 2019 23
SCE Operational Excellence
Top Quartilebull Safetybull Reliabilitybull Customer servicebull Cost efficiency
Optimizebull Capital productivitybull Purchased power costbull Digitization
High performing continuous improvement culture
Defining Excellence Measuring Excellence
bull Employee and public safety metrics
bull System performance and reliability (SAIDI and SAIFI)
bull Customer satisfaction calculation based on internal voice-of-customer surveys
bull OampM cost per customerbull Reduce system rate growth
with OampM purchased power cost reductions
Ongoing Operational Excellence
Efforts
October 30 2019 24
Responding to Industry ChangeLong-Term Industry Trends Strategy
bull The technology landscape is evolving at an unprecedented pace with innovation driving advances in cost and capabilities of distributed energy resources
bull Customer expectations are changing with increasing choices and alternatives a growing priority of sustainability objectives and flattening demand
bull The regulatory environment for utilities is complex increasingly supportive of new forms of competition but unable to keep pace with new business models
bull Policies both in California and globally are setting aggressive greenhouse gas reduction targets
SCE Strategybull Clean the power system by accelerating
the de-carbonization of electricity supplybull Help customers make cleaner energy
choices to support electrification and leverage flexible energy demand
bull Strengthen and modernize the grid by replacing aging infrastructure and deploying technology
bull Achieve operational and service excellence with top tier performance in safety reliability affordability and customer satisfaction
Beyond SCEbull Position Edison Energy as an independent
energy advisor and integrator for large commercial and industrial customers
bull Further clean energy and sustainability efforts in California through Edison Energy insights
October 30 2019 25
bull Energy is a significant risk large commercial and industrial customers face Edison Energy creates competitive advantage for market leaders by quantifying this risk and designing the portfolio solution to protect shareholder value threatened by complex energy policies increasing sustainability needs technological advancements and new products
bull Optimized energy solutions based on robust analytics of the customerrsquos energy portfolio in alignment with their goals and strategic objectives
bull Implementation of solutions through existing service lines or brokering with third parties
bull Edison International investment $83 million as of September 30 2019
Edison Energy
Edison Energy Summary
The Opportunity Trusted Advisor and Solution Integrator
Managed Portfolio Solution
Renewables amp Sustainability
Supply Solutions
Demand Solutions
Installations
October 30 2019 26
27
Total Rate Base $307 billion
bull FERC comprises ~20 of total
CPUC
Return on Equity (ROE)
103
Capital Structure2 48 equity
FERC
ROE3 112 with incentives(previously 105 with incentives)
Capital Structure Recorded capital structure 45 2019 average estimated equity
Other Items
Capital Market Activities
$49 billion of EIXSCE debt and equity issuances in addition to SCErsquos normal course debt financing of rate base
$468 $480
($033)($024)$041
$029
SCE 2019 EPSfrom Rate
Base Forecast
SCEVariances
2018 True-Ups
EIX Parentamp Other
EquityProgram WF FundFinancing
EIX 2019 CoreEPS Midpoint
Guidance
bull Financing and other$032
bull Z-factor advice letter approval $004
bull Energy efficiency $005
2019 Core Earnings Per Share Guidance ndashBuilding from SCE Rate Base
bull HoldCo operating expenses (1) cent per share per month
bull HoldCo debt issued $1 billion in 2019 ($400 million of issuance remaining)
bull EEG target breakeven run rate by year-end 2019
EIX 2019 Core EPS guidance range of $470 - $490 midpoint $009 higher than prior
Key Assumptions
Note See Earnings Per Share Non-GAAP Reconciliations and Use of Non-GAAP Financial Measures in Appendix All tax-affected information on this slide is based on our current combined statutory tax rate of approximately 28 Totals may not foot due to rounding
1 Reflects actual financing activity at SCE (August 1st debt offering) and EIX (July 30th equity offering) versus prior guidance based on assumption that financing would occur on September 10th
2 On February 28 2019 SCE filed an application with the CPUC for a waiver of compliance with this equity ratio requirement describing that while the wildfire-related charge accrued in the fourth quarter of 2018 caused its equity ratio to fall below 47 on a spot basis as of December 31 2018 SCE remains in compliance with the 48 equity ratio over the applicable 37-month average basis While the CPUC reviews the waiver application SCE is considered in compliance with the capital structure rules
3 SCErsquos April 11 2019 TO2019A filing to revise its ROE is pending review with the FERC and not reflected in guidance assumptions
2019 EIX Core Earnings Guidance
bull Test year 2018 GRC true-up $020
bull FERC ROE settlement (prior year)$009
bull Previously announced financing plan (debt and equity) ($018)
bull Update to financing plan based on actual results ($006)
bull Remaining previously disclosed equity plan $05 billion
1 2019 dividend annualized based on December 6 2018 declaration
Fifteen Consecutive Years of Dividend Growth
Target dividend growth within target payout ratio of 45-55 of SCErsquos earnings
1
October 30 2019 28
Appendix
October 30 2019 29
EIXrsquos 2018 Sustainability Report Highlights
Edison Energy is not the same company as Southern California Edison the utility and Edison Energy is not regulated by the California Public Utilities Commission Cumulative duration (in minutes) of sustained repair outages lasting longer than five minutes experienced by the average customer in a year (including major event days) In February 2019 the EIX board approved a $3 million donation to the Edison International Wildfire Assistance Fund to enhance community resiliency and wildfire prevention and
mitigation This affects the 2019 data year and is not reflected here
October 30 2019
ldquoAt Edison International we are leading the transformation of the electric power industry toward a clean energy future by focusing on opportunities in clean energy efficient electrification the grid of the future and customer choice As we pursue this vision sustainability remains at the core of who we are and what we dordquo ndash Pedro Pizarro Edison International CEO
bull Earnings not affected by variability of retail electricity salesbull Differences between amounts collected and authorized levels
either billed or refundedbull Promotes energy conservationbull Stabilizes revenues during economic cycles
Major Balancing Accountsbull Salesbull Fuel and Purchased powerbull Energy efficiencybull Pension expense
bull Cost-recovery related balancing accounts represented more than 59 of costs
bull Trigger mechanism for fuel and purchased power adjustments at 5 variance level
Advanced Long-TermProcurement Planning
bull Upfront contract approvals and prudency standards provide greater certainty of cost recovery (subject to compliance-related reasonableness review)
Forward-looking Ratemaking bull Forward and test year GRC with three-year rate cycle bull Separate cost of capital mechanism
October 30 2019 31
SCE Historical Capital Expenditures($ billions)
$40 $39
$35$38
$44
2014 2015 2016 2017 2018
October 30 2019 32
Credit Ratings Summary
Date of Report July 26 2019 July 29 2019 July 29 2019
Edison InternationalCorporate Outlook BBBStable Baa3Stable BBB-StableSenior Unsecured BBB- Baa3 BBB-Commercial Paper A-2 P-3 F3
Southern California EdisonCorporate Outlook BBBStable Baa2Stable BBB-StableFirst Mortgage Bonds A- A3 BBB+Senior Unsecured BBB Baa2 BBBPreferred Securities BB+ Ba1 BB+Commercial Paper A-2 P-2 F3
FitchMoodyrsquosSampP
October 30 2019 33
4
ampCalibriRegularFINANCIAL AND STATISTICAL REPORTampCalibriRegularampA
Distribution Power Grid of the Future
One-Way Electricity Flowbull System designed to distribute electricity
from large central generating plantsbull Voltage centrally maintainedbull Increasing integration of distributed
energy resourcesbull Limited situational awareness and
visualization tools for power grid operators
Renewable Generation Mandates
Subsidized Residential Solar
Limited Electric Vehicle Charging Infrastructure
Variable Two-Way Electricity Flowbull Distribution system at the center of the
power gridbull System designed to manage fluctuating
resources and customer demand bull Digital monitoring and control devices and
advanced communications systems to improve safety and reliability and integrate DERs
bull Improved data management and power grid operations and cyber risk mitigation
bull Integrated utility distribution with distributed energy resources planning
Maximize Distributed Resources and Electric Vehicle Adoptionbull Distribution power grid infrastructure
design supports customer choice and greater resiliency
Current State Future State
October 30 2019 34
SCE Customer Demand Trends
Note See Edison International Financial and Statistical Reports for 2017 for further information
Kilowatt-Hour Sales (millions of kWh) 2014 2015 2016 2017 2018
Residential 30027 30093 29579 30221 29865
Commercial 42004 42396 42189 42514 42369
Industrial 8392 7623 7162 6659 6786
Public authorities 4975 4795 4715 4711 4510
Agricultural and other 2019 1950 1803 1498 1745
Subtotal 87416 86857 85448 85602 85276
Resale 1308 1080 1794 1568 1867
Total Kilowatt-Hour Sales 88725 87937 87242 87170 87143
Total Number of Customers 5005401 5033330 5060528 5094818 5126985
Number of New Connections 29879 31653 38076 39621 39633
Area Peak Demand (MW) 23055 23079 23091 23508 23766
October 30 2019 35
SCE Bundled Revenue Requirement
Note Rates in effect as of July 26 2019 Represents bundled service which excludes Direct AccessCCA customers that do not receive generation services from SCE
SCE Systemwide Average Rate History (centkWh)
2010 2011 2012 2013 2014 2015 2016 2017 2018 2019
143 141 143 159 167 162 148 157 160 159
Fuel amp Purchased Power(47)
Distribution(38)
Transmission (8)
Generation(8)
Other (-1)
2019 Bundled Revenue
Requirement
$millions centkWh
Fuel amp Purchased Power ndash includes CDWR Bond Charge
4422 74
Distribution ndash poles wires substations service centers Edison SmartConnectreg
3628 61
Generation ndash owned generation investment and OampM 708 12
Transmission ndash greater than 220kV 789 13
Other ndash CPUC and legislative public purpose programs system reliability investments nuclear decommissioning and prior-year over collections
(116) (01)
Total Bundled Revenue Requirement ($millions) $9431
divide Bundled kWh (millions) 59396
= Bundled Systemwide Average Rate (centkWh) 159cent
October 30 2019 36
37
97cent
159cent
80cent
100cent
120cent
140cent
160cent
180cent
200cent
220cent
1990
1991
1992
1993
1994
1995
1996
1997
1998
1999
2000
2001
2002
2003
2004
2005
2006
2007
2008
2009
2010
2011
2012
2013
2014
2015
2016
2017
2018
2019
195cent
Rates reduced due to the implementation of 1) the SONGS Revised Settlement including NEIL insurance benefits 2) lower fuel amp purchased power costs and 3) a lower 2015 GRC revenue requirement that includes flow-through tax benefits
centkWh
System Average Rate Historical Growth
SCErsquos system average rate has grown less than inflation over the last 29 years
SCE System Average RateLos Angeles Area Inflation
Comparative System Average Rates
Delta to SCESCE 159cent --
PGampE 211cent1 33
SDGampE 246cent1 55
CAGR29-yr
(lsquo90-rsquo19)20-yr
(lsquo99-rsquo19)10-yr
(lsquo09-19)17 26 1124 25 20
Energy Crisis and return to normal
Higher gas price forecast post-Katrina leads to higher rates with subsequent refund of over collection
Delay in 2012 GRC leads to shorter ramp-up of rate increase
1 PGampE Advice 5644-E effective October 1 SDGampE Advice 3377-E effective June 1
October 30 2019
Data
SCE System Average Rate
1990199119921993199419951996199719981999200020012002200320042005200620072008200920102011201220132014201520162017201820199699999999999999310310610310510710110196969614214212412212614713913714314314114315916715940876786458386148350382761769171566871495475337116159CPI Los Angeles-Long Beach-Anaheim CA199019911992199319941995199619971998199920002001200220032004200520062007200820092010201120122013201420152016201720182019202096999999999999993100974239450441131046212585868498310726876840039228108738285083414611104041339548576811242695044160916114205839057899881158478900883218511856679342492612122475588812561061265926153091265513010279685966582133476140824337041379322865554462144095927379783561502417198233561515516495767909655160640840897938551593635512757601816127380397448466165581867639842851689511064769380217077830471050007173082233194307481746514628312063517794555998527898182917523920509811898939005269867419453007660169238SAR CPI (old)1990199119921993199419951996199719981999200020012002200320042005200620072008200920102011201220132014201520162017201820199699999999999999310108935518848128104164104853626311072574143759422111004139294598572113128515849244651164507302761853711917284265578923121016455131068581236705147011944127834109318192141314347216021390513353198545827113660054850437767140244467121649041449648574526591614963575483132515393112443397234159803525097292715929158237134114161898499904328691669815498437507617045100580396491729508329612907517573561579182243175943857388863061777863624593457518198880904395583186584452388557219152742489955948
195cent
CPI Workbook
image1png
129 ₵
164 ₵
US Average SCE
27 Higher
SCE Rates and Bills Comparison
SCErsquos average residential rates are above national averagebut residential bills are below national average due to lower usage
bull SCErsquos residential rates are above national average due in part to a cleaner fuel mix high cost of living and lower system load factor
bull SCErsquos residential customer usage is lower than the national average due to mild climate and higher energy efficiency appliance and building standards
bull Average monthly residential bills are lower than the national average as higher rate levels are more than offset by lower usage
Key FactorsKey Factors
Source EIAs Form 861M (formerly Form 826) Data Monthly Electric Utility Sales and Revenue Data for 12-Months Ending June 2019 httpswwweiagovelectricitydataeia861mindexhtml
2018-19 Average Residential Rates (centkWh)
2018-19 Average Residential Bills ($ per Month)
$128
$95
US Average SCE
26 Lower
October 30 2019 38
Sheet1
Sheet1
129 ₵
164 ₵
Sheet2
27 Higher
Sheet3
Sheet1
Sheet1
$128
Sheet2
26 Lower
Sheet3
bull Assembly Bill 1171 permits cities and counties and Joint Powers Agencies (JPAs) to act as CCAs to purchase and sell electricity on behalf of the utility customers within their jurisdiction
bull An Order Instituting Rulemaking (OIR R17-06-026) was opened on June 29 2017 to review revise and consider alternatives to the ldquoPower Charge Indifference Adjustmentrdquo or PCIA The PCIA allocates a proportional share of above-market costs of SCErsquos
energy procurement portfolio to departing load customers to ensure remaining bundled service customers are indifferent
October 11 2018 Commission decision changes PCIA methodology and has substantially addressed the historical subsidy to departing load that materialized when renewables market prices declined over the past 4 yearso Decision also established a Phase 2 which is addressing utility
portfolio optimization PCIA ldquopre-paymentrdquo options for entities and individual departing load customers and implementation of the ldquotrue-uprdquo process for Resource Adequacy (RA) and Renewable Energy Credits (RECs) costs
o A Phase 2 final decision on the benchmark and true-up process was approved on October 10 2019 with the other Phase 2 activities to continue into 2020
bull On February 8 2018 the Commission approved Resolution E-4907 requiring CCAs to demonstrate compliance with annual Resource Adequacy (RA) requirements prior to commencing operations
bull Existing Direct Access and CCA load is expected to be ~35 of SCErsquos total load by the end of 2019
Investor-Owned Utility (IOU)
Community Choice Aggregator (CCA)
Community Choice Aggregator (CCA) Overview
Approximately 40 of SCErsquos bundled service load could be part of a CCA or Direct Access by the end of 2020
October 30 2019 39
bull CPUC Order Instituting Ratemaking R 12-06-013 comprehensively reviewed residential rate structure including a future transition to Time of Use (TOU) rates In March 2018 SCE began to migrate 400000 residential customers to TOU rate structures
Remaining eligible residential customers to be migrated beginning October 2020bull July 2015 CPUC Decision D 15-07-001 includes Transition to 2 tiered rate structure coupled with Super-User Electric (SUE) Surcharge1
ldquoSuper User Electric Surchargerdquo for usage 400 above baseline (~3 of all usage)
Minimum bills of approximately $10month (applied to delivery revenue only)
January 2014 2019
100(60 of system usage)
219(3)
Tier 1100
Tier 2 101-400
SUEgt400
125(37)
Usage Level ( of Baseline)Usage Level ( of Baseline)
1 Completed in 20192 SCErsquos California Alternate Rates for Energy (CARE) program is an income-qualifying program that reduces energy bills for eligible customers by about 30
Winter Weekdays 8am-9pm Weekdays and Weekends 4-9pm
Off-Peak Summer Weekdays 11pm-8amWeekends All
Weekdays and Weekends All except 4-9pm
Winter Weekdays 9pm-8amWeekends All
Weekdays and Weekends 9pm-8am
Super Off-Peak Winter NA Weekdays and Weekends 8am-4pm
New Time-of-Use (TOU) Periods
bull On March 1 2019 SCE changed its basic TOU pricing period definition for the first time in over 30 years
bull Abundant mid-day renewable energy lowers prices from 8am-4pm (October - June)
bull Highest cost period is now 4pm-9pm all-days1
1 TOU pricing periods defined for non-residential customers per CPUC Decision D18-07-006 Similar residential TOU definitions were filed by SCE in A17-12-012
bull 998 solar projectsbull 320445 residential (71 of all residential customers) ndash 1756 MW bull 7333 non-residential ndash 977 MW bull Approximately 4775887 MWhyear generated
SCE Net Metering Statistics (919)
0
5
10
15
20
25
30
35
40
0
1000
2000
3000
4000
5000
6000
7000
2013 2014 2015 2016 2017 2018 2019
MW
Inst
alle
d
Num
ber o
f Sol
ar R
esid
entia
l Ins
talla
tions
Installations MW
July 1 2017bull Official start of NEM successor tariff customers are subject to
Mandatory TOU rate Non-bypassable charges Application fees
July 31 2017bull Residential customers who meet this deadline are grandfathered for
current TOU periods for maximum of 5 years (10 for non-residential)September 9 2017bull Smart Inverters required on all solar installationsJuly 25 2018bull Smart Inverters with Reactive Power Priority required on all solar
installationsNear Term Outlookbull Combination of a flatter tiered rate and the mandatory TOU NEM 20
rate structure has helped reduce the per customer cost shift further efforts to reduce the shift through new TOU pricing periods
bull Commission to revisit NEM Successor Tariff by July 2020 to evaluate the existing NEM tariffs and consider the development and adoption of successor tariffs
Key Dates
Third Quarter Earnings Summary
October 30 2019
Q32019
Q32018 Variance
Basic Earnings Per Share (EPS)1
SCE $ 145 $ 164 $ (019)
EIX Parent amp Other (009) (007) (002)
Basic EPS $ 136 $ 157 $ (021)
Less Non-core Items
SCE2 $ (014) $ 002 $ (016)
EIX Parent amp Other3 mdash (001) 001
Total Non-core $ (014) $ 001 $ (015)
Core Earnings Per Share (EPS)
SCE $ 159 $ 162 $ (003)
EIX Parent amp Other (009) (006) (003)
Core EPS $ 150 $ 156 $ (006)
Key SCE EPS Drivers4
Higher revenue5 $ 012- CPUC revenue (002)- 2018 FERC Formula Rate settlement 010- Other FERC revenue 004
Higher OampM (021)Lower depreciation 002Higher net financing costs (004)Income taxes5 019Property and other taxes (001)Results prior to impact from share dilution $ 007Impact from share dilution (010)Total core drivers $ (003)Non-core items 2 (016)Total $ (019)
Key EIX EPS Drivers4
EIX parent and other mdash Higher interest expense and corporate expenses $ (005)EEG mdash Lower corporate expenses 001Impact from share dilution 001Total core drivers $ (003)Non-core items 3 001Total $ (002)
1 See Earnings Non-GAAP reconciliations and Use of Non-GAAP Financial Measures in Appendix2 Includes SCEs contributions to Wildfire Insurance Fund in third quarter 2019 and impact from the approval of the Revised San Onofre Settlement Agreement in the third quarter 2018 3 Loss on sale of SoCore Energy4 2019 EPS drivers are reported at a consistent share count of 3258 million (2019 QTD weighted-average shares outstanding is 3471 million)5 Includes $020 of tax benefits refunded to customersNote Diluted earnings were $135 and $157 per share for the three months ended September 30 2019 and 2018 respectively
43
1 See Earnings Non-GAAP reconciliations and Use of Non-GAAP Financial Measures in Appendix2 Impact of 2018 GRC final decision related to impairment of utility property plant and equipment changes in allocation of deferred tax re-measurement between customers and
shareholders SCErsquos contributions to the Wildfire Insurance Fund gain from sale of nuclear fuel and impact from the approval of the Revised San Onofre Settlement Agreement3 Loss on sale of SoCore Energy and impact of hypothetical liquidation at book value (HLBV) accounting method4 2019 EPS drivers are reported at a consistent share count of 3258 million (2019 YTD weighted-average shares outstanding is 3330 million)5 Test Year 2018 GRC true-up of $020 includes revenue of $(034) OampM of $006 depreciation of $024 interest expense of $(001) property and other taxes of $001 and income taxes of
$0246 Includes $018 of tax benefits refunded to customersNote Diluted earnings were $342 and $308 per share for the nine months ended September 30 2019 and 2018 respectively
Year to Date Earnings Summary
October 30 2019
YTD 2019
YTD 2018 Variance
Basic Earnings Per Share (EPS)1
SCE $ 365 $ 343 $ 022
EIX Parent amp Other (022) (034) 012
Basic EPS $ 343 $ 309 $ 034
Less Non-core Items
SCE2 $ (030) $ 002 $ (032)
EIX Parent amp Other3 mdash (014) 014
Total Non-core $ (030) $ (012) $ (018)
Core Earnings Per Share (EPS)
SCE $ 395 $ 341 $ 054
EIX Parent amp Other (022) (020) (002)
Core EPS $ 373 $ 321 $ 052
Key SCE EPS Drivers4
Test Year 2018 GRC true-up5 $ 020Higher revenue6 055
- CPUC revenue 032- 2018 FERC Formula Rate settlement 010- FERC and other operating revenue 013
Higher OampM (026)Lower depreciation 005Higher net financing costs (012)Income taxes6 021Results prior to impact from share dilution $ 063Impact from share dilution (009)Total core drivers $ 054Non-core items2 (032)Total $ 022
Key EIX EPS Drivers4
EIX parent and other mdash Higher interest expense and corporate expenses $ (007)EEG mdash Lower corporate expenses and lower losses at the competitive business 004Impact from share dilution 001Total core drivers $ (002)Non-core items3 014Total $ 012
44
SCE Annual Results of Operationsbull Earning activities ndash revenue authorized by CPUC and FERC to provide reasonable cost recovery and return on investmentbull Cost-recovery activities ndash CPUC- and FERC-authorized balancing accounts to recover specific project or program costs subject
to reasonableness review or compliance with upfront standards
($ millions)
2018 2017
Earnings Activities
Cost-Recovery Activities
Total Consolidated
Earnings Activities
Cost-Recovery Activities
Total Consolidated
Operating revenue $6560 $6051 $12611 $6611 $5643 $12254Purchased power and fuel mdash 5406 5406 mdash 4873 4873Operation and maintenance 1972 730 2702 1898 824 2722Wildfire-related claims net of recoveries 2669 mdash 2669 ― ― ―Depreciation and amortization 1867 mdash 1867 2032 mdash 2032Property and other taxes 392 mdash 392 372 mdash 372Impairment and other charges (12) mdash (12) 716 mdash 716Other operating income (7) mdash (7) (8) mdash (8)Total operating expenses 6881 6136 13017 5010 5697 10707Operating (loss) income (321) (85) (406) 1601 (54) 1547Interest expense (671) (2) (673) (588) (1) (589)Other income and expenses 107 87 194 93 55 148(Loss) income before income taxes (885) mdash (885) 1106 mdash 1106Income tax (benefit) expense (696) mdash (696) (30) mdash (30)Net (loss) income (189) mdash (189) 1136 mdash 1136Preferred and preference stock dividend
requirements 121 mdash 121 124 mdash 124
Net (loss) income available for common stock ($310) mdash ($310) $1012 mdash $1012Less Non-core items (1750) (481)Core Earnings $1440 $1493
Note See Use of Non-GAAP Financial Measures
October 30 2019 45
Reconciliation of EIX Basic Earnings Per Share Guidance to EIX Core Earnings Per Share Guidance
EPS Attributable to Edison International 2019
Low Midpoint High
SCE $483
EIX Parent amp Other (032)
Basic EPS1 $441 $451 $461
Non-Core Items
SCE23 (029) (029) (029)
EIX Parent amp Other mdash mdash mdash
Total Non-Core1 (029) (029) (029)
Core EPS
SCE $512
EIX Parent amp Other (032)
Core EPS1 $470 $480 $490
1 EPS is calculated on the assumed weighted-average share count for 2019 Please see 2019 EIX Core Earnings Guidance slide for more information 2 Includes impact of 2018 GRC final decision related to impairment of utility property plant and equipment changes in allocation of deferred tax re-measurement between
customers and shareholders and SCErsquos contributions to the Wildfire Insurance Fund3 Includes $001 per share as a result of share count dilution
October 30 2019
Earnings Per Share Non-GAAP Reconciliations
46
Earnings Non-GAAP Reconciliations
1 Impact of 2018 GRC final decision related to impairment of utility property plant and equipment changes in allocation of deferred tax re-measurement between customers and shareholders SCErsquos contributions to the Wildfire Insurance Fund gain from sale of nuclear fuel and impact from the approval of the Revised San Onofre Settlement Agreement
2 Loss on sale of SoCore Energy and impact of hypothetical liquidation at book value (HLBV) accounting method
($ millions)
Reconciliation of EIX GAAP Earnings to EIX Core Earnings
Earnings Attributable to Edison International Q32019
Q32018
YTD 2019
YTD 2018
SCE $503 $536 $1215 $1119
EIX Parent amp Other (32) (23) (74) (112)
Basic Earnings $471 $513 $1141 $1007
Non-Core Items
SCE 1 ($48) 7 ($99) 7
EIX Parent amp Other 2 mdash (4) mdash (46)
Total Non-Core ($48) $3 ($99) ($39)
Core Earnings
SCE $551 $529 $1314 $1112
EIX Parent amp Other (32) (19) (74) (66)
Core Earnings $519 $510 $1240 $1046
October 30 2019 47
EIX Core EPS Non-GAAP ReconciliationsReconciliation of Edison International Basic Earnings Per Share to Edison International Core Earnings Per Share
Note See Use of Non-GAAP Financial Measures
Earnings Per Share Attributable to Edison International 2018 2017
Basic EPS ($130) $173
Non-Core Items
SCE
Wildfire-related claims net of recoveries (560) mdash
Settlement of 1994 ndash 2006 California tax audits 020 mdash
Write down impairment and other as a result of Revised San Onofre Settlement Agreement
003 (138)
Re-measurement of deferred taxes as a result of Tax Reform mdash (010)
Edison International Parent and Other
Settlement of 1994 ndash 2006 California tax audits (004) mdash
Re-measurement of deferred taxes as a result of Tax Reform mdash (133)
Sale of SoCore Energy and other (014) 004
Discontinued operations
Settlement of 1994 ndash 2006 California tax audits 010 mdash
Less Total Non-Core Items (545) (277)
Core EPS $415 $450
October 30 2019 48
Use of Non-GAAP Financial MeasuresEdison Internationals earnings are prepared in accordance with generally accepted accounting principles used in the United States Management uses core earnings internally for financial planning and for analysis of performance Core earnings are also used when communicating with investors and analysts regarding Edison Internationals earnings results to facilitate comparisons of the Companys performance from period to period Core earnings are a non-GAAP financial measure and may not be comparable to those of other companies Core earnings (or losses) are defined as earnings or losses attributable to Edison International shareholders less income or loss from discontinued operations and income or loss from significant discrete items that management does not consider representative of ongoing earnings such as exit activities including sale of certain assets and other activities that are no longer continuing asset impairments and certain tax regulatory or legal settlements or proceedings
A reconciliation of Non-GAAP information to GAAP information is included either on the slide where the information appears or on another slide referenced in this presentation
EIX Investor Relations Contact
Sam Ramraj Vice President (626) 302-2540 samramrajedisonintlcom
Allison Bahen Principal Manager (626) 302-5493 allisonbahenedisonintlcom
October 30 2019 49
Business Update
Slide Number 2
Table of Contents
EIX Strategy Should Produce Long-Term Value
SCE Highlights
Slide Number 6
SCE Historical Rate Base and Core Earnings
SCE Capital Expenditure Forecast
SCE Rate Base Forecast
Slide Number 10
Californiarsquos GHG Emissions Overview
SCErsquos Pathway 2045 Highlights
Slide Number 13
Slide Number 14
Slide Number 15
SCE Key Regulatory Proceedings
Slide Number 17
Slide Number 18
CPUC and FERC Cost of Capital Summary
CPUC Cost of Capital (2013-2019)
SCE Distribution System Investments
Slide Number 22
Slide Number 23
SCE Large Transmission Projects
SCE Operational Excellence
Responding to Industry Change
Slide Number 27
2019 EIX Core Earnings Guidance
EIX Annual Dividends Per Share
Appendix
EIXrsquos 2018 Sustainability Report Highlights
Slide Number 32
SCE Historical Capital Expenditures
Credit Ratings Summary
Distribution Power Grid of the Future
SCE Customer Demand Trends
SCE Bundled Revenue Requirement
Slide Number 38
SCE Rates and Bills Comparison
Slide Number 40
Slide Number 41
Slide Number 42
Slide Number 43
Slide Number 44
Slide Number 45
SCE Annual Results of Operations
Slide Number 47
Earnings Non-GAAP Reconciliations
EIX Core EPS Non-GAAP Reconciliations
Use of Non-GAAP Financial Measures
US Average
$134
SCE
$95
-291
US Average
128
SCE
164
higher
28
Created on Mon 6 Jun 2016 1250 PM EST (1750 GMT)
Concept
1990
1991
1992
1993
1994
1995
1996
1997
1998
1999
2000
2001
2002
2003
2004
2005
2006
2007
2008
2009
2010
2011
2012
2013
2014
2015
2016
2017
2018
2019
2020
2021
2022
2023
2024
2025
2026
Consumer Price Index All-Urban
131
136
140
144
148
152
157
161
163
167
172
177
180
184
189
195
202
207
215
215
218
225
230
233
237
237
239
245
251
258
265
272
279
286
293
300
306
422
304
297
260
281
294
234
155
219
337
282
160
230
267
337
322
287
381
-032
164
314
208
147
161
012
105
236
253
265
265
264
254
251
249
234
227
SOUTHERN CALIFORNIA EDISON
System Average Rate Forecast
Source Matt Sheriff
(centkWh)
SCE System Average Rate
SAR CPI (old)
SAR CPI (current)
CPI Los Angeles-Long Beach-Anaheim CA
Consumer Price Index All-Urban
0
1990
97cent
97cent
97cent
593
30
1
1991
103cent
101cent
101cent
410
422
2
1992
106cent
104cent
105cent
361
304
3
1993
103cent
107cent
107cent
253
297
4
1994
105cent
110cent
109cent
137
260
5
1995
107cent
113cent
110cent
153
281
25
6
1996
101cent
116cent
112cent
183
294
7
1997
101cent
119cent
114cent
158
234
8
1998
96cent
121cent
116cent
144
155
9
1999
96cent
124cent
119cent
235
219
10
2000
96cent
128cent
122cent
330
337
20
11
2001
142cent
131cent
127cent
336
282
12
2002
142cent
134cent
130cent
277
160
13
2003
124cent
137cent
133cent
259
230
14
2004
122cent
140cent
138cent
334
267
15
2005
126cent
145cent
144cent
447
337
16
2006
147cent
150cent
150cent
427
322
17
2007
139cent
154cent
155cent
328
287
18
2008
137cent
160cent
161cent
353
381
19
2009
143cent
159cent
159cent
-080
-032
20
2010
143cent
162cent
161cent
120
164
10
21
2011
141cent
167cent
166cent
267
314
22
2012
143cent
170cent
169cent
203
208
23
2013
159cent
173cent
171cent
108
147
24
2014
167cent
176cent
173cent
135
161
25
2015
159cent
176cent
175cent
091
012
5
26
2016
148cent
178cent
178cent
189
105
27
2017
157cent
182cent
183cent
279
236
29
20
10
28
2018
160cent
187cent
190cent
381
253
SCE
17
26
11
29
2019
159cent
192cent
195cent
244
265
LA
24
25
20
30
2020
194cent
197cent
199cent
219
265
36
31
2021
199cent
202cent
203cent
227
266
25
49
Created on Wed 23 Jan 2019 1245 PM EST (1745 GMT)
Mnemonic
Long Label
Last Update
Start Date
End Date
Frequency
1970
1971
1972
1973
1974
1975
1976
1977
1978
1979
1980
1981
1982
1983
1984
1985
1986
1987
1988
1989
1990
1991
1992
1993
1994
1995
1996
1997
1998
1999
2000
2001
2002
2003
2004
2005
2006
2007
2008
2009
2010
2011
2012
2013
2014
2015
2016
2017
2018
2019
2020
2021
2022
2023
2024
2025
2026
2027
2028
2029
2030
2031
2032
2033
2034
2035
2036
2037
2038
2039
2040
2041
2042
2043
2044
2045
2046
2047
2048
CPILANGAFRSM1
Los Angeles-Long Beach-Anaheim CA (MSA) [2013 Definition] FIPS Code 31080 Consumer Price Index for All Urban Consumers (1982-84=100) IHS MARKIT ECONOMICS December 2018 Forecast Source Bureau of Labor Statistics End of Historical Data 2017
122718
1970
2048
ANNUAL
3868
4011
4139
4374
4825
5334
5683
6080
6526
7233
8372
9184
9734
9907
10360
10838
11193
11667
12206
12826
13587
14143
14654
15025
15231
15464
15748
15997
16227
16608
17155
17732
18223
18696
19320
20183
21044
21734
22501
22322
22589
23193
23665
23921
24243
24463
24925
25621
26598
27248
27844
28475
29132
29806
30500
31165
31832
32533
33254
33985
34744
35508
36279
37061
37854
38640
39440
40278
41145
42043
42963
43898
44852
45825
46816
47822
48857
49934
51047
371
320
568
1031
1055
655
698
733
1083
1575
971
599
177
458
461
328
423
462
508
593
410
361
253
137
153
183
158
144
235
330
336
277
259
334
447
427
328
353
-080
120
267
203
108
135
091
189
279
381
244
219
227
231
231
233
218
214
220
222
220
223
220
217
215
214
208
207
213
215
218
219
218
217
217
216
215
216
220
223
Date of Report
July 26 2019
July 29 2019
July 29 2019
Edison International
Corporate Outlook
BBBStable
Baa3Stable
BBB-Stable
Senior Unsecured
BBB-
Baa3
BBB-
Commercial Paper
A-2
P-3
F3
Southern California Edison
Corporate Outlook
BBBStable
Baa2Stable
BBB-Stable
First Mortgage Bonds
A-
A3
BBB+
Senior Unsecured
BBB
Baa2
BBB
Preferred Securities
BB+
Ba1
BB+
Commercial Paper
A-2
P-2
F3
CPUC Cost of Capital (2013-2019)
Two year settlement approved for 2018-2019bull ROE adjustment based on 12-month average of
Moodyrsquos Baa utility bond rates measured from October 1 to September 30
bull If index exceeds 100 bps deadband from starting index value authorized ROE changes by half the difference
bull Starting index value based on trailing 12 months of Moodyrsquos Baa index as of September 30 of each year ndash500
CPUC Authorized Capital
Structure 2018-2019Common Equity 48 1030
Preferred 9 582Long-term Debt 43 498
Weighted Average Cost of Capital 761
October 30 2019 19
3
4
5
6
7
10112 10113 10114 10115 10116 10117 10118 10119
Rate
()
Starting Value ndash 500
CPUC Adjustment Mechanism
Moodyrsquos Baa Utility Index Spot Rate
Moving Average (10118 ndash 10119) = 450
100 basis point +- Deadband
ROE fixed at 1030 for 2018 independent of trigger mechanism
ROE fixed at 1045 for 2017 independent of trigger mechanism
SCE Distribution System Investments
1 Deferrals required with infrastructure replacement load growth and grid modernization programs2 Other includes among other things grid modernization emergency management customer requested system modifications and transportation electrification programsNote Forecast based on 2021 GRC request levels
Distribution Trendsbull Capital expenditures for certain programs deferred over
next five years to support reallocation of distribution resources to wildfire mitigation1 historical program funding levels will be reinstated in subsequent GRC periods in order to resume trajectory towards equilibrium replacement rate
bull Distribution grid requires upgrades to circuit capacity automation and control systems to support various grid resiliency and reliability objectives as well as increased use of distributed energy resources
2019 ndash 2023 Capital Spending Forecast for Distribution2 - $208 billion
2019-2023 Capital Spending Driversbull Automation of distribution circuitsbull Pole replacements bull Load growth upgradesbull Cable and overhead conductor replacementsbull Preventive and breakdown maintenancebull Circuit breaker transformer bank and relay
replacementsupgradesbull New Service Connections
October 30 2019
Load Growth
New Service Connections
Infrastructure Replacement
General Plant
Other
Wildfire
20
Charge Ready Bridge Funding and 2
SCE Transportation Electrification (TE) Proposalsbull Proposals build on SCErsquos Clean Power and Electrification Pathway which is an integrated approach to
reduce GHG emissions and air pollution by taking action in three California economic sectors electricity transportation and buildings
bull These programs accelerate electrification of the transportation sector supporting SCErsquos vision of placing at least 7 million light-duty passenger vehicles on the roads and transitioning to zero-emission trucks and transit Additional studies launched to increase adoption such as electrification of the Interstate 5 corridorMedium- and Heavy-Duty (MDHD) Vehicle
Transportation Electrification Program
Charge Ready Pilot - $22 million Total Cost1 (in 2014 dollars) approved January 2016bull Approved capital spend of $12 million OampM of $10 millionbull Supports 1280 chargersbull Included in capital spend and rate base forecasts
$356 million Total Cost1 (in nominal dollars) approved May 2018 bull 5-year programbull Approved capital spend of $242 million OampM of $115
millionbull Included in capital spend and rate base forecasts
1 Total Cost includes both OampM and capital spend
Charge Ready ldquoBridgerdquo Funding - $22 million Total Cost (in 2014 dollars) approved December 2018bull Additional approved capital spend of $12 million OampM
of $10 million bridge funding must be subtracted from any authorized Charge Ready 2 funding
bull Included in capital spend and rate base forecastsbull SCE to install at least 1000 chargers including 20 in
multi-unit dwellingsCharge Ready 2 ndash $760 million Total Cost1 (in 2018 dollars) filed June 2018 (pending CPUC approval)bull 4-year program providing over 50000 chargersbull $561 million in capital spend OampM of $199 millionbull Not included in capital spend or rate base forecasts
Charge Ready Pilot
October 30 2019 21
310
185
85
0
50
100
150
200
250
300
350
Transmission Distribution Customer
MW
SCE 2018 Storage Portfolio
Up to 80 of MW to be shifted between
TampD
85 MWexcess may offset TampD
targets
Eligible storage to be included in 2020 Storage compliance Plan (Filing date 312020)
Storage that is permitted to count in different categories due to flex counting rules
Currently above targets
2020 Cumulative Procurement Target
SCE Energy StorageCPUC Energy Storage Program Requirements
bull Storage Rulemaking (R10-12-007) established 1325 MW target for IOUs by 2024 (580 MW SCE share spread as biennial targets during 2014-20) ownership allowed up to 290 MW for SCE
bull Flexibility to transfer across categories expanded in Storage Rulemaking (R15-03-011)
SCE Procurement Activities to Meet CPUC Requirements
bull SCE has procured over 720 MW of energy storage (includes 60 MW of utility owned storage) ~600 MW of which is eligible to count towards CPUC targets
bull SCE submitted its 2018 Local Capacity Requirements RFP (2018 LCR RFP) and its second Aliso Canyon Energy Storage RFO (ACES 2 RFO) for approval Upon Commission approval of these energy storage resources SCE will have exceeded the 580 MW target set by AB 2514
bull SCE filed its 2018 Energy Storage and Investment Plan (ESPampIP) on March 1 2018 the AB 2514 track was approved by D18-10-036 on October 25 2018 however the Commission rejected SCErsquos AB 2868 proposals in D19-06-032
SCE Procurement to Meet System Reliability Needs
bull A Proposed Decision (PD) Issued in the Integrated Resources Plan (IRP) Proceeding (R16-02-007) directs SCE to procure 1745 MW of incremental system resource capacity to come online between August 1 2021 and August 1 2023 SCE Launched its 2019 System Reliability RFO on September 12 2019 Energy Storage will be an eligible resource to be procured in this RFO
bull In light of the IRP PD SCE concurrently launched a separate track to procure utility owned energy storage systems which will be referred to as the Reliability Owned Energy Storage (RUOES) procurement
October 30 2019 22
SCE Large Transmission Projects
FERC Cost of Capital112 ROE from January 1 2018 to November 12 2019bull ROE = Base (plus incentives) of 107 + CAISO Participation Application for FERC Formula recovery mechanism post
November 12 2019 was filed April 11 2019 Requested 50 bp CAISO adder approved but application for
rehearing requested by CPUC
Summary of Large Transmission Projects
Project Name Total Cost5 Remaining Investment(as of September 30 2019)
Estimated In-ServiceDate
West of Devers12 $848 million $416 million 2021
Mesa Substation1 $646 million $296 million 2022
Alberhill System3 $486 million $446 million mdash 3
Riverside Transmission Reliability4 $451 million $441 million 2024
Eldorado-Lugo-Mohave Upgrade $257 million $180 million 2021
1 CPUC approved2 Morongo Transmission holds an option to invest up to $400 million or half of the estimated cost of the transmission facilities only at the in-service date If the option is
exercised SCErsquos rate base would be offset by that amount 3 In August 2018 the CPUC approved the revised alternate decision which left the proceeding open and directed SCE to supplement the existing record with additional analysis
as it relates to the Project need and alternatives Potential revisions to the Project have not been reflected in the total cost of the Project or estimated in service date 4 Riverside Transmission Reliability Project total cost is currently estimated to be $451 million however costs could increase depending on the final route alternative selected5 Total Costs are nominal direct expenditures subject to CPUC and FERC cost recovery approval SCE regularly evaluates the cost and schedule based on permitting processes
given that SCE continues to see delays in securing project approvalsOctober 30 2019 23
SCE Operational Excellence
Top Quartilebull Safetybull Reliabilitybull Customer servicebull Cost efficiency
Optimizebull Capital productivitybull Purchased power costbull Digitization
High performing continuous improvement culture
Defining Excellence Measuring Excellence
bull Employee and public safety metrics
bull System performance and reliability (SAIDI and SAIFI)
bull Customer satisfaction calculation based on internal voice-of-customer surveys
bull OampM cost per customerbull Reduce system rate growth
with OampM purchased power cost reductions
Ongoing Operational Excellence
Efforts
October 30 2019 24
Responding to Industry ChangeLong-Term Industry Trends Strategy
bull The technology landscape is evolving at an unprecedented pace with innovation driving advances in cost and capabilities of distributed energy resources
bull Customer expectations are changing with increasing choices and alternatives a growing priority of sustainability objectives and flattening demand
bull The regulatory environment for utilities is complex increasingly supportive of new forms of competition but unable to keep pace with new business models
bull Policies both in California and globally are setting aggressive greenhouse gas reduction targets
SCE Strategybull Clean the power system by accelerating
the de-carbonization of electricity supplybull Help customers make cleaner energy
choices to support electrification and leverage flexible energy demand
bull Strengthen and modernize the grid by replacing aging infrastructure and deploying technology
bull Achieve operational and service excellence with top tier performance in safety reliability affordability and customer satisfaction
Beyond SCEbull Position Edison Energy as an independent
energy advisor and integrator for large commercial and industrial customers
bull Further clean energy and sustainability efforts in California through Edison Energy insights
October 30 2019 25
bull Energy is a significant risk large commercial and industrial customers face Edison Energy creates competitive advantage for market leaders by quantifying this risk and designing the portfolio solution to protect shareholder value threatened by complex energy policies increasing sustainability needs technological advancements and new products
bull Optimized energy solutions based on robust analytics of the customerrsquos energy portfolio in alignment with their goals and strategic objectives
bull Implementation of solutions through existing service lines or brokering with third parties
bull Edison International investment $83 million as of September 30 2019
Edison Energy
Edison Energy Summary
The Opportunity Trusted Advisor and Solution Integrator
Managed Portfolio Solution
Renewables amp Sustainability
Supply Solutions
Demand Solutions
Installations
October 30 2019 26
27
Total Rate Base $307 billion
bull FERC comprises ~20 of total
CPUC
Return on Equity (ROE)
103
Capital Structure2 48 equity
FERC
ROE3 112 with incentives(previously 105 with incentives)
Capital Structure Recorded capital structure 45 2019 average estimated equity
Other Items
Capital Market Activities
$49 billion of EIXSCE debt and equity issuances in addition to SCErsquos normal course debt financing of rate base
$468 $480
($033)($024)$041
$029
SCE 2019 EPSfrom Rate
Base Forecast
SCEVariances
2018 True-Ups
EIX Parentamp Other
EquityProgram WF FundFinancing
EIX 2019 CoreEPS Midpoint
Guidance
bull Financing and other$032
bull Z-factor advice letter approval $004
bull Energy efficiency $005
2019 Core Earnings Per Share Guidance ndashBuilding from SCE Rate Base
bull HoldCo operating expenses (1) cent per share per month
bull HoldCo debt issued $1 billion in 2019 ($400 million of issuance remaining)
bull EEG target breakeven run rate by year-end 2019
EIX 2019 Core EPS guidance range of $470 - $490 midpoint $009 higher than prior
Key Assumptions
Note See Earnings Per Share Non-GAAP Reconciliations and Use of Non-GAAP Financial Measures in Appendix All tax-affected information on this slide is based on our current combined statutory tax rate of approximately 28 Totals may not foot due to rounding
1 Reflects actual financing activity at SCE (August 1st debt offering) and EIX (July 30th equity offering) versus prior guidance based on assumption that financing would occur on September 10th
2 On February 28 2019 SCE filed an application with the CPUC for a waiver of compliance with this equity ratio requirement describing that while the wildfire-related charge accrued in the fourth quarter of 2018 caused its equity ratio to fall below 47 on a spot basis as of December 31 2018 SCE remains in compliance with the 48 equity ratio over the applicable 37-month average basis While the CPUC reviews the waiver application SCE is considered in compliance with the capital structure rules
3 SCErsquos April 11 2019 TO2019A filing to revise its ROE is pending review with the FERC and not reflected in guidance assumptions
2019 EIX Core Earnings Guidance
bull Test year 2018 GRC true-up $020
bull FERC ROE settlement (prior year)$009
bull Previously announced financing plan (debt and equity) ($018)
bull Update to financing plan based on actual results ($006)
bull Remaining previously disclosed equity plan $05 billion
1 2019 dividend annualized based on December 6 2018 declaration
Fifteen Consecutive Years of Dividend Growth
Target dividend growth within target payout ratio of 45-55 of SCErsquos earnings
1
October 30 2019 28
Appendix
October 30 2019 29
EIXrsquos 2018 Sustainability Report Highlights
Edison Energy is not the same company as Southern California Edison the utility and Edison Energy is not regulated by the California Public Utilities Commission Cumulative duration (in minutes) of sustained repair outages lasting longer than five minutes experienced by the average customer in a year (including major event days) In February 2019 the EIX board approved a $3 million donation to the Edison International Wildfire Assistance Fund to enhance community resiliency and wildfire prevention and
mitigation This affects the 2019 data year and is not reflected here
October 30 2019
ldquoAt Edison International we are leading the transformation of the electric power industry toward a clean energy future by focusing on opportunities in clean energy efficient electrification the grid of the future and customer choice As we pursue this vision sustainability remains at the core of who we are and what we dordquo ndash Pedro Pizarro Edison International CEO
bull Earnings not affected by variability of retail electricity salesbull Differences between amounts collected and authorized levels
either billed or refundedbull Promotes energy conservationbull Stabilizes revenues during economic cycles
Major Balancing Accountsbull Salesbull Fuel and Purchased powerbull Energy efficiencybull Pension expense
bull Cost-recovery related balancing accounts represented more than 59 of costs
bull Trigger mechanism for fuel and purchased power adjustments at 5 variance level
Advanced Long-TermProcurement Planning
bull Upfront contract approvals and prudency standards provide greater certainty of cost recovery (subject to compliance-related reasonableness review)
Forward-looking Ratemaking bull Forward and test year GRC with three-year rate cycle bull Separate cost of capital mechanism
October 30 2019 31
SCE Historical Capital Expenditures($ billions)
$40 $39
$35$38
$44
2014 2015 2016 2017 2018
October 30 2019 32
Credit Ratings Summary
Date of Report July 26 2019 July 29 2019 July 29 2019
Edison InternationalCorporate Outlook BBBStable Baa3Stable BBB-StableSenior Unsecured BBB- Baa3 BBB-Commercial Paper A-2 P-3 F3
Southern California EdisonCorporate Outlook BBBStable Baa2Stable BBB-StableFirst Mortgage Bonds A- A3 BBB+Senior Unsecured BBB Baa2 BBBPreferred Securities BB+ Ba1 BB+Commercial Paper A-2 P-2 F3
FitchMoodyrsquosSampP
October 30 2019 33
4
ampCalibriRegularFINANCIAL AND STATISTICAL REPORTampCalibriRegularampA
Distribution Power Grid of the Future
One-Way Electricity Flowbull System designed to distribute electricity
from large central generating plantsbull Voltage centrally maintainedbull Increasing integration of distributed
energy resourcesbull Limited situational awareness and
visualization tools for power grid operators
Renewable Generation Mandates
Subsidized Residential Solar
Limited Electric Vehicle Charging Infrastructure
Variable Two-Way Electricity Flowbull Distribution system at the center of the
power gridbull System designed to manage fluctuating
resources and customer demand bull Digital monitoring and control devices and
advanced communications systems to improve safety and reliability and integrate DERs
bull Improved data management and power grid operations and cyber risk mitigation
bull Integrated utility distribution with distributed energy resources planning
Maximize Distributed Resources and Electric Vehicle Adoptionbull Distribution power grid infrastructure
design supports customer choice and greater resiliency
Current State Future State
October 30 2019 34
SCE Customer Demand Trends
Note See Edison International Financial and Statistical Reports for 2017 for further information
Kilowatt-Hour Sales (millions of kWh) 2014 2015 2016 2017 2018
Residential 30027 30093 29579 30221 29865
Commercial 42004 42396 42189 42514 42369
Industrial 8392 7623 7162 6659 6786
Public authorities 4975 4795 4715 4711 4510
Agricultural and other 2019 1950 1803 1498 1745
Subtotal 87416 86857 85448 85602 85276
Resale 1308 1080 1794 1568 1867
Total Kilowatt-Hour Sales 88725 87937 87242 87170 87143
Total Number of Customers 5005401 5033330 5060528 5094818 5126985
Number of New Connections 29879 31653 38076 39621 39633
Area Peak Demand (MW) 23055 23079 23091 23508 23766
October 30 2019 35
SCE Bundled Revenue Requirement
Note Rates in effect as of July 26 2019 Represents bundled service which excludes Direct AccessCCA customers that do not receive generation services from SCE
SCE Systemwide Average Rate History (centkWh)
2010 2011 2012 2013 2014 2015 2016 2017 2018 2019
143 141 143 159 167 162 148 157 160 159
Fuel amp Purchased Power(47)
Distribution(38)
Transmission (8)
Generation(8)
Other (-1)
2019 Bundled Revenue
Requirement
$millions centkWh
Fuel amp Purchased Power ndash includes CDWR Bond Charge
4422 74
Distribution ndash poles wires substations service centers Edison SmartConnectreg
3628 61
Generation ndash owned generation investment and OampM 708 12
Transmission ndash greater than 220kV 789 13
Other ndash CPUC and legislative public purpose programs system reliability investments nuclear decommissioning and prior-year over collections
(116) (01)
Total Bundled Revenue Requirement ($millions) $9431
divide Bundled kWh (millions) 59396
= Bundled Systemwide Average Rate (centkWh) 159cent
October 30 2019 36
37
97cent
159cent
80cent
100cent
120cent
140cent
160cent
180cent
200cent
220cent
1990
1991
1992
1993
1994
1995
1996
1997
1998
1999
2000
2001
2002
2003
2004
2005
2006
2007
2008
2009
2010
2011
2012
2013
2014
2015
2016
2017
2018
2019
195cent
Rates reduced due to the implementation of 1) the SONGS Revised Settlement including NEIL insurance benefits 2) lower fuel amp purchased power costs and 3) a lower 2015 GRC revenue requirement that includes flow-through tax benefits
centkWh
System Average Rate Historical Growth
SCErsquos system average rate has grown less than inflation over the last 29 years
SCE System Average RateLos Angeles Area Inflation
Comparative System Average Rates
Delta to SCESCE 159cent --
PGampE 211cent1 33
SDGampE 246cent1 55
CAGR29-yr
(lsquo90-rsquo19)20-yr
(lsquo99-rsquo19)10-yr
(lsquo09-19)17 26 1124 25 20
Energy Crisis and return to normal
Higher gas price forecast post-Katrina leads to higher rates with subsequent refund of over collection
Delay in 2012 GRC leads to shorter ramp-up of rate increase
1 PGampE Advice 5644-E effective October 1 SDGampE Advice 3377-E effective June 1
October 30 2019
Data
SCE System Average Rate
1990199119921993199419951996199719981999200020012002200320042005200620072008200920102011201220132014201520162017201820199699999999999999310310610310510710110196969614214212412212614713913714314314114315916715940876786458386148350382761769171566871495475337116159CPI Los Angeles-Long Beach-Anaheim CA199019911992199319941995199619971998199920002001200220032004200520062007200820092010201120122013201420152016201720182019202096999999999999993100974239450441131046212585868498310726876840039228108738285083414611104041339548576811242695044160916114205839057899881158478900883218511856679342492612122475588812561061265926153091265513010279685966582133476140824337041379322865554462144095927379783561502417198233561515516495767909655160640840897938551593635512757601816127380397448466165581867639842851689511064769380217077830471050007173082233194307481746514628312063517794555998527898182917523920509811898939005269867419453007660169238SAR CPI (old)1990199119921993199419951996199719981999200020012002200320042005200620072008200920102011201220132014201520162017201820199699999999999999310108935518848128104164104853626311072574143759422111004139294598572113128515849244651164507302761853711917284265578923121016455131068581236705147011944127834109318192141314347216021390513353198545827113660054850437767140244467121649041449648574526591614963575483132515393112443397234159803525097292715929158237134114161898499904328691669815498437507617045100580396491729508329612907517573561579182243175943857388863061777863624593457518198880904395583186584452388557219152742489955948
195cent
CPI Workbook
image1png
129 ₵
164 ₵
US Average SCE
27 Higher
SCE Rates and Bills Comparison
SCErsquos average residential rates are above national averagebut residential bills are below national average due to lower usage
bull SCErsquos residential rates are above national average due in part to a cleaner fuel mix high cost of living and lower system load factor
bull SCErsquos residential customer usage is lower than the national average due to mild climate and higher energy efficiency appliance and building standards
bull Average monthly residential bills are lower than the national average as higher rate levels are more than offset by lower usage
Key FactorsKey Factors
Source EIAs Form 861M (formerly Form 826) Data Monthly Electric Utility Sales and Revenue Data for 12-Months Ending June 2019 httpswwweiagovelectricitydataeia861mindexhtml
2018-19 Average Residential Rates (centkWh)
2018-19 Average Residential Bills ($ per Month)
$128
$95
US Average SCE
26 Lower
October 30 2019 38
Sheet1
Sheet1
129 ₵
164 ₵
Sheet2
27 Higher
Sheet3
Sheet1
Sheet1
$128
Sheet2
26 Lower
Sheet3
bull Assembly Bill 1171 permits cities and counties and Joint Powers Agencies (JPAs) to act as CCAs to purchase and sell electricity on behalf of the utility customers within their jurisdiction
bull An Order Instituting Rulemaking (OIR R17-06-026) was opened on June 29 2017 to review revise and consider alternatives to the ldquoPower Charge Indifference Adjustmentrdquo or PCIA The PCIA allocates a proportional share of above-market costs of SCErsquos
energy procurement portfolio to departing load customers to ensure remaining bundled service customers are indifferent
October 11 2018 Commission decision changes PCIA methodology and has substantially addressed the historical subsidy to departing load that materialized when renewables market prices declined over the past 4 yearso Decision also established a Phase 2 which is addressing utility
portfolio optimization PCIA ldquopre-paymentrdquo options for entities and individual departing load customers and implementation of the ldquotrue-uprdquo process for Resource Adequacy (RA) and Renewable Energy Credits (RECs) costs
o A Phase 2 final decision on the benchmark and true-up process was approved on October 10 2019 with the other Phase 2 activities to continue into 2020
bull On February 8 2018 the Commission approved Resolution E-4907 requiring CCAs to demonstrate compliance with annual Resource Adequacy (RA) requirements prior to commencing operations
bull Existing Direct Access and CCA load is expected to be ~35 of SCErsquos total load by the end of 2019
Investor-Owned Utility (IOU)
Community Choice Aggregator (CCA)
Community Choice Aggregator (CCA) Overview
Approximately 40 of SCErsquos bundled service load could be part of a CCA or Direct Access by the end of 2020
October 30 2019 39
bull CPUC Order Instituting Ratemaking R 12-06-013 comprehensively reviewed residential rate structure including a future transition to Time of Use (TOU) rates In March 2018 SCE began to migrate 400000 residential customers to TOU rate structures
Remaining eligible residential customers to be migrated beginning October 2020bull July 2015 CPUC Decision D 15-07-001 includes Transition to 2 tiered rate structure coupled with Super-User Electric (SUE) Surcharge1
ldquoSuper User Electric Surchargerdquo for usage 400 above baseline (~3 of all usage)
Minimum bills of approximately $10month (applied to delivery revenue only)
January 2014 2019
100(60 of system usage)
219(3)
Tier 1100
Tier 2 101-400
SUEgt400
125(37)
Usage Level ( of Baseline)Usage Level ( of Baseline)
1 Completed in 20192 SCErsquos California Alternate Rates for Energy (CARE) program is an income-qualifying program that reduces energy bills for eligible customers by about 30
Winter Weekdays 8am-9pm Weekdays and Weekends 4-9pm
Off-Peak Summer Weekdays 11pm-8amWeekends All
Weekdays and Weekends All except 4-9pm
Winter Weekdays 9pm-8amWeekends All
Weekdays and Weekends 9pm-8am
Super Off-Peak Winter NA Weekdays and Weekends 8am-4pm
New Time-of-Use (TOU) Periods
bull On March 1 2019 SCE changed its basic TOU pricing period definition for the first time in over 30 years
bull Abundant mid-day renewable energy lowers prices from 8am-4pm (October - June)
bull Highest cost period is now 4pm-9pm all-days1
1 TOU pricing periods defined for non-residential customers per CPUC Decision D18-07-006 Similar residential TOU definitions were filed by SCE in A17-12-012
bull 998 solar projectsbull 320445 residential (71 of all residential customers) ndash 1756 MW bull 7333 non-residential ndash 977 MW bull Approximately 4775887 MWhyear generated
SCE Net Metering Statistics (919)
0
5
10
15
20
25
30
35
40
0
1000
2000
3000
4000
5000
6000
7000
2013 2014 2015 2016 2017 2018 2019
MW
Inst
alle
d
Num
ber o
f Sol
ar R
esid
entia
l Ins
talla
tions
Installations MW
July 1 2017bull Official start of NEM successor tariff customers are subject to
Mandatory TOU rate Non-bypassable charges Application fees
July 31 2017bull Residential customers who meet this deadline are grandfathered for
current TOU periods for maximum of 5 years (10 for non-residential)September 9 2017bull Smart Inverters required on all solar installationsJuly 25 2018bull Smart Inverters with Reactive Power Priority required on all solar
installationsNear Term Outlookbull Combination of a flatter tiered rate and the mandatory TOU NEM 20
rate structure has helped reduce the per customer cost shift further efforts to reduce the shift through new TOU pricing periods
bull Commission to revisit NEM Successor Tariff by July 2020 to evaluate the existing NEM tariffs and consider the development and adoption of successor tariffs
Key Dates
Third Quarter Earnings Summary
October 30 2019
Q32019
Q32018 Variance
Basic Earnings Per Share (EPS)1
SCE $ 145 $ 164 $ (019)
EIX Parent amp Other (009) (007) (002)
Basic EPS $ 136 $ 157 $ (021)
Less Non-core Items
SCE2 $ (014) $ 002 $ (016)
EIX Parent amp Other3 mdash (001) 001
Total Non-core $ (014) $ 001 $ (015)
Core Earnings Per Share (EPS)
SCE $ 159 $ 162 $ (003)
EIX Parent amp Other (009) (006) (003)
Core EPS $ 150 $ 156 $ (006)
Key SCE EPS Drivers4
Higher revenue5 $ 012- CPUC revenue (002)- 2018 FERC Formula Rate settlement 010- Other FERC revenue 004
Higher OampM (021)Lower depreciation 002Higher net financing costs (004)Income taxes5 019Property and other taxes (001)Results prior to impact from share dilution $ 007Impact from share dilution (010)Total core drivers $ (003)Non-core items 2 (016)Total $ (019)
Key EIX EPS Drivers4
EIX parent and other mdash Higher interest expense and corporate expenses $ (005)EEG mdash Lower corporate expenses 001Impact from share dilution 001Total core drivers $ (003)Non-core items 3 001Total $ (002)
1 See Earnings Non-GAAP reconciliations and Use of Non-GAAP Financial Measures in Appendix2 Includes SCEs contributions to Wildfire Insurance Fund in third quarter 2019 and impact from the approval of the Revised San Onofre Settlement Agreement in the third quarter 2018 3 Loss on sale of SoCore Energy4 2019 EPS drivers are reported at a consistent share count of 3258 million (2019 QTD weighted-average shares outstanding is 3471 million)5 Includes $020 of tax benefits refunded to customersNote Diluted earnings were $135 and $157 per share for the three months ended September 30 2019 and 2018 respectively
43
1 See Earnings Non-GAAP reconciliations and Use of Non-GAAP Financial Measures in Appendix2 Impact of 2018 GRC final decision related to impairment of utility property plant and equipment changes in allocation of deferred tax re-measurement between customers and
shareholders SCErsquos contributions to the Wildfire Insurance Fund gain from sale of nuclear fuel and impact from the approval of the Revised San Onofre Settlement Agreement3 Loss on sale of SoCore Energy and impact of hypothetical liquidation at book value (HLBV) accounting method4 2019 EPS drivers are reported at a consistent share count of 3258 million (2019 YTD weighted-average shares outstanding is 3330 million)5 Test Year 2018 GRC true-up of $020 includes revenue of $(034) OampM of $006 depreciation of $024 interest expense of $(001) property and other taxes of $001 and income taxes of
$0246 Includes $018 of tax benefits refunded to customersNote Diluted earnings were $342 and $308 per share for the nine months ended September 30 2019 and 2018 respectively
Year to Date Earnings Summary
October 30 2019
YTD 2019
YTD 2018 Variance
Basic Earnings Per Share (EPS)1
SCE $ 365 $ 343 $ 022
EIX Parent amp Other (022) (034) 012
Basic EPS $ 343 $ 309 $ 034
Less Non-core Items
SCE2 $ (030) $ 002 $ (032)
EIX Parent amp Other3 mdash (014) 014
Total Non-core $ (030) $ (012) $ (018)
Core Earnings Per Share (EPS)
SCE $ 395 $ 341 $ 054
EIX Parent amp Other (022) (020) (002)
Core EPS $ 373 $ 321 $ 052
Key SCE EPS Drivers4
Test Year 2018 GRC true-up5 $ 020Higher revenue6 055
- CPUC revenue 032- 2018 FERC Formula Rate settlement 010- FERC and other operating revenue 013
Higher OampM (026)Lower depreciation 005Higher net financing costs (012)Income taxes6 021Results prior to impact from share dilution $ 063Impact from share dilution (009)Total core drivers $ 054Non-core items2 (032)Total $ 022
Key EIX EPS Drivers4
EIX parent and other mdash Higher interest expense and corporate expenses $ (007)EEG mdash Lower corporate expenses and lower losses at the competitive business 004Impact from share dilution 001Total core drivers $ (002)Non-core items3 014Total $ 012
44
SCE Annual Results of Operationsbull Earning activities ndash revenue authorized by CPUC and FERC to provide reasonable cost recovery and return on investmentbull Cost-recovery activities ndash CPUC- and FERC-authorized balancing accounts to recover specific project or program costs subject
to reasonableness review or compliance with upfront standards
($ millions)
2018 2017
Earnings Activities
Cost-Recovery Activities
Total Consolidated
Earnings Activities
Cost-Recovery Activities
Total Consolidated
Operating revenue $6560 $6051 $12611 $6611 $5643 $12254Purchased power and fuel mdash 5406 5406 mdash 4873 4873Operation and maintenance 1972 730 2702 1898 824 2722Wildfire-related claims net of recoveries 2669 mdash 2669 ― ― ―Depreciation and amortization 1867 mdash 1867 2032 mdash 2032Property and other taxes 392 mdash 392 372 mdash 372Impairment and other charges (12) mdash (12) 716 mdash 716Other operating income (7) mdash (7) (8) mdash (8)Total operating expenses 6881 6136 13017 5010 5697 10707Operating (loss) income (321) (85) (406) 1601 (54) 1547Interest expense (671) (2) (673) (588) (1) (589)Other income and expenses 107 87 194 93 55 148(Loss) income before income taxes (885) mdash (885) 1106 mdash 1106Income tax (benefit) expense (696) mdash (696) (30) mdash (30)Net (loss) income (189) mdash (189) 1136 mdash 1136Preferred and preference stock dividend
requirements 121 mdash 121 124 mdash 124
Net (loss) income available for common stock ($310) mdash ($310) $1012 mdash $1012Less Non-core items (1750) (481)Core Earnings $1440 $1493
Note See Use of Non-GAAP Financial Measures
October 30 2019 45
Reconciliation of EIX Basic Earnings Per Share Guidance to EIX Core Earnings Per Share Guidance
EPS Attributable to Edison International 2019
Low Midpoint High
SCE $483
EIX Parent amp Other (032)
Basic EPS1 $441 $451 $461
Non-Core Items
SCE23 (029) (029) (029)
EIX Parent amp Other mdash mdash mdash
Total Non-Core1 (029) (029) (029)
Core EPS
SCE $512
EIX Parent amp Other (032)
Core EPS1 $470 $480 $490
1 EPS is calculated on the assumed weighted-average share count for 2019 Please see 2019 EIX Core Earnings Guidance slide for more information 2 Includes impact of 2018 GRC final decision related to impairment of utility property plant and equipment changes in allocation of deferred tax re-measurement between
customers and shareholders and SCErsquos contributions to the Wildfire Insurance Fund3 Includes $001 per share as a result of share count dilution
October 30 2019
Earnings Per Share Non-GAAP Reconciliations
46
Earnings Non-GAAP Reconciliations
1 Impact of 2018 GRC final decision related to impairment of utility property plant and equipment changes in allocation of deferred tax re-measurement between customers and shareholders SCErsquos contributions to the Wildfire Insurance Fund gain from sale of nuclear fuel and impact from the approval of the Revised San Onofre Settlement Agreement
2 Loss on sale of SoCore Energy and impact of hypothetical liquidation at book value (HLBV) accounting method
($ millions)
Reconciliation of EIX GAAP Earnings to EIX Core Earnings
Earnings Attributable to Edison International Q32019
Q32018
YTD 2019
YTD 2018
SCE $503 $536 $1215 $1119
EIX Parent amp Other (32) (23) (74) (112)
Basic Earnings $471 $513 $1141 $1007
Non-Core Items
SCE 1 ($48) 7 ($99) 7
EIX Parent amp Other 2 mdash (4) mdash (46)
Total Non-Core ($48) $3 ($99) ($39)
Core Earnings
SCE $551 $529 $1314 $1112
EIX Parent amp Other (32) (19) (74) (66)
Core Earnings $519 $510 $1240 $1046
October 30 2019 47
EIX Core EPS Non-GAAP ReconciliationsReconciliation of Edison International Basic Earnings Per Share to Edison International Core Earnings Per Share
Note See Use of Non-GAAP Financial Measures
Earnings Per Share Attributable to Edison International 2018 2017
Basic EPS ($130) $173
Non-Core Items
SCE
Wildfire-related claims net of recoveries (560) mdash
Settlement of 1994 ndash 2006 California tax audits 020 mdash
Write down impairment and other as a result of Revised San Onofre Settlement Agreement
003 (138)
Re-measurement of deferred taxes as a result of Tax Reform mdash (010)
Edison International Parent and Other
Settlement of 1994 ndash 2006 California tax audits (004) mdash
Re-measurement of deferred taxes as a result of Tax Reform mdash (133)
Sale of SoCore Energy and other (014) 004
Discontinued operations
Settlement of 1994 ndash 2006 California tax audits 010 mdash
Less Total Non-Core Items (545) (277)
Core EPS $415 $450
October 30 2019 48
Use of Non-GAAP Financial MeasuresEdison Internationals earnings are prepared in accordance with generally accepted accounting principles used in the United States Management uses core earnings internally for financial planning and for analysis of performance Core earnings are also used when communicating with investors and analysts regarding Edison Internationals earnings results to facilitate comparisons of the Companys performance from period to period Core earnings are a non-GAAP financial measure and may not be comparable to those of other companies Core earnings (or losses) are defined as earnings or losses attributable to Edison International shareholders less income or loss from discontinued operations and income or loss from significant discrete items that management does not consider representative of ongoing earnings such as exit activities including sale of certain assets and other activities that are no longer continuing asset impairments and certain tax regulatory or legal settlements or proceedings
A reconciliation of Non-GAAP information to GAAP information is included either on the slide where the information appears or on another slide referenced in this presentation
EIX Investor Relations Contact
Sam Ramraj Vice President (626) 302-2540 samramrajedisonintlcom
Allison Bahen Principal Manager (626) 302-5493 allisonbahenedisonintlcom
October 30 2019 49
Business Update
Slide Number 2
Table of Contents
EIX Strategy Should Produce Long-Term Value
SCE Highlights
Slide Number 6
SCE Historical Rate Base and Core Earnings
SCE Capital Expenditure Forecast
SCE Rate Base Forecast
Slide Number 10
Californiarsquos GHG Emissions Overview
SCErsquos Pathway 2045 Highlights
Slide Number 13
Slide Number 14
Slide Number 15
SCE Key Regulatory Proceedings
Slide Number 17
Slide Number 18
CPUC and FERC Cost of Capital Summary
CPUC Cost of Capital (2013-2019)
SCE Distribution System Investments
Slide Number 22
Slide Number 23
SCE Large Transmission Projects
SCE Operational Excellence
Responding to Industry Change
Slide Number 27
2019 EIX Core Earnings Guidance
EIX Annual Dividends Per Share
Appendix
EIXrsquos 2018 Sustainability Report Highlights
Slide Number 32
SCE Historical Capital Expenditures
Credit Ratings Summary
Distribution Power Grid of the Future
SCE Customer Demand Trends
SCE Bundled Revenue Requirement
Slide Number 38
SCE Rates and Bills Comparison
Slide Number 40
Slide Number 41
Slide Number 42
Slide Number 43
Slide Number 44
Slide Number 45
SCE Annual Results of Operations
Slide Number 47
Earnings Non-GAAP Reconciliations
EIX Core EPS Non-GAAP Reconciliations
Use of Non-GAAP Financial Measures
US Average
$134
SCE
$95
-291
US Average
128
SCE
164
higher
28
Created on Mon 6 Jun 2016 1250 PM EST (1750 GMT)
Concept
1990
1991
1992
1993
1994
1995
1996
1997
1998
1999
2000
2001
2002
2003
2004
2005
2006
2007
2008
2009
2010
2011
2012
2013
2014
2015
2016
2017
2018
2019
2020
2021
2022
2023
2024
2025
2026
Consumer Price Index All-Urban
131
136
140
144
148
152
157
161
163
167
172
177
180
184
189
195
202
207
215
215
218
225
230
233
237
237
239
245
251
258
265
272
279
286
293
300
306
422
304
297
260
281
294
234
155
219
337
282
160
230
267
337
322
287
381
-032
164
314
208
147
161
012
105
236
253
265
265
264
254
251
249
234
227
SOUTHERN CALIFORNIA EDISON
System Average Rate Forecast
Source Matt Sheriff
(centkWh)
SCE System Average Rate
SAR CPI (old)
SAR CPI (current)
CPI Los Angeles-Long Beach-Anaheim CA
Consumer Price Index All-Urban
0
1990
97cent
97cent
97cent
593
30
1
1991
103cent
101cent
101cent
410
422
2
1992
106cent
104cent
105cent
361
304
3
1993
103cent
107cent
107cent
253
297
4
1994
105cent
110cent
109cent
137
260
5
1995
107cent
113cent
110cent
153
281
25
6
1996
101cent
116cent
112cent
183
294
7
1997
101cent
119cent
114cent
158
234
8
1998
96cent
121cent
116cent
144
155
9
1999
96cent
124cent
119cent
235
219
10
2000
96cent
128cent
122cent
330
337
20
11
2001
142cent
131cent
127cent
336
282
12
2002
142cent
134cent
130cent
277
160
13
2003
124cent
137cent
133cent
259
230
14
2004
122cent
140cent
138cent
334
267
15
2005
126cent
145cent
144cent
447
337
16
2006
147cent
150cent
150cent
427
322
17
2007
139cent
154cent
155cent
328
287
18
2008
137cent
160cent
161cent
353
381
19
2009
143cent
159cent
159cent
-080
-032
20
2010
143cent
162cent
161cent
120
164
10
21
2011
141cent
167cent
166cent
267
314
22
2012
143cent
170cent
169cent
203
208
23
2013
159cent
173cent
171cent
108
147
24
2014
167cent
176cent
173cent
135
161
25
2015
159cent
176cent
175cent
091
012
5
26
2016
148cent
178cent
178cent
189
105
27
2017
157cent
182cent
183cent
279
236
29
20
10
28
2018
160cent
187cent
190cent
381
253
SCE
17
26
11
29
2019
159cent
192cent
195cent
244
265
LA
24
25
20
30
2020
194cent
197cent
199cent
219
265
36
31
2021
199cent
202cent
203cent
227
266
25
49
Created on Wed 23 Jan 2019 1245 PM EST (1745 GMT)
Mnemonic
Long Label
Last Update
Start Date
End Date
Frequency
1970
1971
1972
1973
1974
1975
1976
1977
1978
1979
1980
1981
1982
1983
1984
1985
1986
1987
1988
1989
1990
1991
1992
1993
1994
1995
1996
1997
1998
1999
2000
2001
2002
2003
2004
2005
2006
2007
2008
2009
2010
2011
2012
2013
2014
2015
2016
2017
2018
2019
2020
2021
2022
2023
2024
2025
2026
2027
2028
2029
2030
2031
2032
2033
2034
2035
2036
2037
2038
2039
2040
2041
2042
2043
2044
2045
2046
2047
2048
CPILANGAFRSM1
Los Angeles-Long Beach-Anaheim CA (MSA) [2013 Definition] FIPS Code 31080 Consumer Price Index for All Urban Consumers (1982-84=100) IHS MARKIT ECONOMICS December 2018 Forecast Source Bureau of Labor Statistics End of Historical Data 2017
122718
1970
2048
ANNUAL
3868
4011
4139
4374
4825
5334
5683
6080
6526
7233
8372
9184
9734
9907
10360
10838
11193
11667
12206
12826
13587
14143
14654
15025
15231
15464
15748
15997
16227
16608
17155
17732
18223
18696
19320
20183
21044
21734
22501
22322
22589
23193
23665
23921
24243
24463
24925
25621
26598
27248
27844
28475
29132
29806
30500
31165
31832
32533
33254
33985
34744
35508
36279
37061
37854
38640
39440
40278
41145
42043
42963
43898
44852
45825
46816
47822
48857
49934
51047
371
320
568
1031
1055
655
698
733
1083
1575
971
599
177
458
461
328
423
462
508
593
410
361
253
137
153
183
158
144
235
330
336
277
259
334
447
427
328
353
-080
120
267
203
108
135
091
189
279
381
244
219
227
231
231
233
218
214
220
222
220
223
220
217
215
214
208
207
213
215
218
219
218
217
217
216
215
216
220
223
Date of Report
July 26 2019
July 29 2019
July 29 2019
Edison International
Corporate Outlook
BBBStable
Baa3Stable
BBB-Stable
Senior Unsecured
BBB-
Baa3
BBB-
Commercial Paper
A-2
P-3
F3
Southern California Edison
Corporate Outlook
BBBStable
Baa2Stable
BBB-Stable
First Mortgage Bonds
A-
A3
BBB+
Senior Unsecured
BBB
Baa2
BBB
Preferred Securities
BB+
Ba1
BB+
Commercial Paper
A-2
P-2
F3
SCE Distribution System Investments
1 Deferrals required with infrastructure replacement load growth and grid modernization programs2 Other includes among other things grid modernization emergency management customer requested system modifications and transportation electrification programsNote Forecast based on 2021 GRC request levels
Distribution Trendsbull Capital expenditures for certain programs deferred over
next five years to support reallocation of distribution resources to wildfire mitigation1 historical program funding levels will be reinstated in subsequent GRC periods in order to resume trajectory towards equilibrium replacement rate
bull Distribution grid requires upgrades to circuit capacity automation and control systems to support various grid resiliency and reliability objectives as well as increased use of distributed energy resources
2019 ndash 2023 Capital Spending Forecast for Distribution2 - $208 billion
2019-2023 Capital Spending Driversbull Automation of distribution circuitsbull Pole replacements bull Load growth upgradesbull Cable and overhead conductor replacementsbull Preventive and breakdown maintenancebull Circuit breaker transformer bank and relay
replacementsupgradesbull New Service Connections
October 30 2019
Load Growth
New Service Connections
Infrastructure Replacement
General Plant
Other
Wildfire
20
Charge Ready Bridge Funding and 2
SCE Transportation Electrification (TE) Proposalsbull Proposals build on SCErsquos Clean Power and Electrification Pathway which is an integrated approach to
reduce GHG emissions and air pollution by taking action in three California economic sectors electricity transportation and buildings
bull These programs accelerate electrification of the transportation sector supporting SCErsquos vision of placing at least 7 million light-duty passenger vehicles on the roads and transitioning to zero-emission trucks and transit Additional studies launched to increase adoption such as electrification of the Interstate 5 corridorMedium- and Heavy-Duty (MDHD) Vehicle
Transportation Electrification Program
Charge Ready Pilot - $22 million Total Cost1 (in 2014 dollars) approved January 2016bull Approved capital spend of $12 million OampM of $10 millionbull Supports 1280 chargersbull Included in capital spend and rate base forecasts
$356 million Total Cost1 (in nominal dollars) approved May 2018 bull 5-year programbull Approved capital spend of $242 million OampM of $115
millionbull Included in capital spend and rate base forecasts
1 Total Cost includes both OampM and capital spend
Charge Ready ldquoBridgerdquo Funding - $22 million Total Cost (in 2014 dollars) approved December 2018bull Additional approved capital spend of $12 million OampM
of $10 million bridge funding must be subtracted from any authorized Charge Ready 2 funding
bull Included in capital spend and rate base forecastsbull SCE to install at least 1000 chargers including 20 in
multi-unit dwellingsCharge Ready 2 ndash $760 million Total Cost1 (in 2018 dollars) filed June 2018 (pending CPUC approval)bull 4-year program providing over 50000 chargersbull $561 million in capital spend OampM of $199 millionbull Not included in capital spend or rate base forecasts
Charge Ready Pilot
October 30 2019 21
310
185
85
0
50
100
150
200
250
300
350
Transmission Distribution Customer
MW
SCE 2018 Storage Portfolio
Up to 80 of MW to be shifted between
TampD
85 MWexcess may offset TampD
targets
Eligible storage to be included in 2020 Storage compliance Plan (Filing date 312020)
Storage that is permitted to count in different categories due to flex counting rules
Currently above targets
2020 Cumulative Procurement Target
SCE Energy StorageCPUC Energy Storage Program Requirements
bull Storage Rulemaking (R10-12-007) established 1325 MW target for IOUs by 2024 (580 MW SCE share spread as biennial targets during 2014-20) ownership allowed up to 290 MW for SCE
bull Flexibility to transfer across categories expanded in Storage Rulemaking (R15-03-011)
SCE Procurement Activities to Meet CPUC Requirements
bull SCE has procured over 720 MW of energy storage (includes 60 MW of utility owned storage) ~600 MW of which is eligible to count towards CPUC targets
bull SCE submitted its 2018 Local Capacity Requirements RFP (2018 LCR RFP) and its second Aliso Canyon Energy Storage RFO (ACES 2 RFO) for approval Upon Commission approval of these energy storage resources SCE will have exceeded the 580 MW target set by AB 2514
bull SCE filed its 2018 Energy Storage and Investment Plan (ESPampIP) on March 1 2018 the AB 2514 track was approved by D18-10-036 on October 25 2018 however the Commission rejected SCErsquos AB 2868 proposals in D19-06-032
SCE Procurement to Meet System Reliability Needs
bull A Proposed Decision (PD) Issued in the Integrated Resources Plan (IRP) Proceeding (R16-02-007) directs SCE to procure 1745 MW of incremental system resource capacity to come online between August 1 2021 and August 1 2023 SCE Launched its 2019 System Reliability RFO on September 12 2019 Energy Storage will be an eligible resource to be procured in this RFO
bull In light of the IRP PD SCE concurrently launched a separate track to procure utility owned energy storage systems which will be referred to as the Reliability Owned Energy Storage (RUOES) procurement
October 30 2019 22
SCE Large Transmission Projects
FERC Cost of Capital112 ROE from January 1 2018 to November 12 2019bull ROE = Base (plus incentives) of 107 + CAISO Participation Application for FERC Formula recovery mechanism post
November 12 2019 was filed April 11 2019 Requested 50 bp CAISO adder approved but application for
rehearing requested by CPUC
Summary of Large Transmission Projects
Project Name Total Cost5 Remaining Investment(as of September 30 2019)
Estimated In-ServiceDate
West of Devers12 $848 million $416 million 2021
Mesa Substation1 $646 million $296 million 2022
Alberhill System3 $486 million $446 million mdash 3
Riverside Transmission Reliability4 $451 million $441 million 2024
Eldorado-Lugo-Mohave Upgrade $257 million $180 million 2021
1 CPUC approved2 Morongo Transmission holds an option to invest up to $400 million or half of the estimated cost of the transmission facilities only at the in-service date If the option is
exercised SCErsquos rate base would be offset by that amount 3 In August 2018 the CPUC approved the revised alternate decision which left the proceeding open and directed SCE to supplement the existing record with additional analysis
as it relates to the Project need and alternatives Potential revisions to the Project have not been reflected in the total cost of the Project or estimated in service date 4 Riverside Transmission Reliability Project total cost is currently estimated to be $451 million however costs could increase depending on the final route alternative selected5 Total Costs are nominal direct expenditures subject to CPUC and FERC cost recovery approval SCE regularly evaluates the cost and schedule based on permitting processes
given that SCE continues to see delays in securing project approvalsOctober 30 2019 23
SCE Operational Excellence
Top Quartilebull Safetybull Reliabilitybull Customer servicebull Cost efficiency
Optimizebull Capital productivitybull Purchased power costbull Digitization
High performing continuous improvement culture
Defining Excellence Measuring Excellence
bull Employee and public safety metrics
bull System performance and reliability (SAIDI and SAIFI)
bull Customer satisfaction calculation based on internal voice-of-customer surveys
bull OampM cost per customerbull Reduce system rate growth
with OampM purchased power cost reductions
Ongoing Operational Excellence
Efforts
October 30 2019 24
Responding to Industry ChangeLong-Term Industry Trends Strategy
bull The technology landscape is evolving at an unprecedented pace with innovation driving advances in cost and capabilities of distributed energy resources
bull Customer expectations are changing with increasing choices and alternatives a growing priority of sustainability objectives and flattening demand
bull The regulatory environment for utilities is complex increasingly supportive of new forms of competition but unable to keep pace with new business models
bull Policies both in California and globally are setting aggressive greenhouse gas reduction targets
SCE Strategybull Clean the power system by accelerating
the de-carbonization of electricity supplybull Help customers make cleaner energy
choices to support electrification and leverage flexible energy demand
bull Strengthen and modernize the grid by replacing aging infrastructure and deploying technology
bull Achieve operational and service excellence with top tier performance in safety reliability affordability and customer satisfaction
Beyond SCEbull Position Edison Energy as an independent
energy advisor and integrator for large commercial and industrial customers
bull Further clean energy and sustainability efforts in California through Edison Energy insights
October 30 2019 25
bull Energy is a significant risk large commercial and industrial customers face Edison Energy creates competitive advantage for market leaders by quantifying this risk and designing the portfolio solution to protect shareholder value threatened by complex energy policies increasing sustainability needs technological advancements and new products
bull Optimized energy solutions based on robust analytics of the customerrsquos energy portfolio in alignment with their goals and strategic objectives
bull Implementation of solutions through existing service lines or brokering with third parties
bull Edison International investment $83 million as of September 30 2019
Edison Energy
Edison Energy Summary
The Opportunity Trusted Advisor and Solution Integrator
Managed Portfolio Solution
Renewables amp Sustainability
Supply Solutions
Demand Solutions
Installations
October 30 2019 26
27
Total Rate Base $307 billion
bull FERC comprises ~20 of total
CPUC
Return on Equity (ROE)
103
Capital Structure2 48 equity
FERC
ROE3 112 with incentives(previously 105 with incentives)
Capital Structure Recorded capital structure 45 2019 average estimated equity
Other Items
Capital Market Activities
$49 billion of EIXSCE debt and equity issuances in addition to SCErsquos normal course debt financing of rate base
$468 $480
($033)($024)$041
$029
SCE 2019 EPSfrom Rate
Base Forecast
SCEVariances
2018 True-Ups
EIX Parentamp Other
EquityProgram WF FundFinancing
EIX 2019 CoreEPS Midpoint
Guidance
bull Financing and other$032
bull Z-factor advice letter approval $004
bull Energy efficiency $005
2019 Core Earnings Per Share Guidance ndashBuilding from SCE Rate Base
bull HoldCo operating expenses (1) cent per share per month
bull HoldCo debt issued $1 billion in 2019 ($400 million of issuance remaining)
bull EEG target breakeven run rate by year-end 2019
EIX 2019 Core EPS guidance range of $470 - $490 midpoint $009 higher than prior
Key Assumptions
Note See Earnings Per Share Non-GAAP Reconciliations and Use of Non-GAAP Financial Measures in Appendix All tax-affected information on this slide is based on our current combined statutory tax rate of approximately 28 Totals may not foot due to rounding
1 Reflects actual financing activity at SCE (August 1st debt offering) and EIX (July 30th equity offering) versus prior guidance based on assumption that financing would occur on September 10th
2 On February 28 2019 SCE filed an application with the CPUC for a waiver of compliance with this equity ratio requirement describing that while the wildfire-related charge accrued in the fourth quarter of 2018 caused its equity ratio to fall below 47 on a spot basis as of December 31 2018 SCE remains in compliance with the 48 equity ratio over the applicable 37-month average basis While the CPUC reviews the waiver application SCE is considered in compliance with the capital structure rules
3 SCErsquos April 11 2019 TO2019A filing to revise its ROE is pending review with the FERC and not reflected in guidance assumptions
2019 EIX Core Earnings Guidance
bull Test year 2018 GRC true-up $020
bull FERC ROE settlement (prior year)$009
bull Previously announced financing plan (debt and equity) ($018)
bull Update to financing plan based on actual results ($006)
bull Remaining previously disclosed equity plan $05 billion
1 2019 dividend annualized based on December 6 2018 declaration
Fifteen Consecutive Years of Dividend Growth
Target dividend growth within target payout ratio of 45-55 of SCErsquos earnings
1
October 30 2019 28
Appendix
October 30 2019 29
EIXrsquos 2018 Sustainability Report Highlights
Edison Energy is not the same company as Southern California Edison the utility and Edison Energy is not regulated by the California Public Utilities Commission Cumulative duration (in minutes) of sustained repair outages lasting longer than five minutes experienced by the average customer in a year (including major event days) In February 2019 the EIX board approved a $3 million donation to the Edison International Wildfire Assistance Fund to enhance community resiliency and wildfire prevention and
mitigation This affects the 2019 data year and is not reflected here
October 30 2019
ldquoAt Edison International we are leading the transformation of the electric power industry toward a clean energy future by focusing on opportunities in clean energy efficient electrification the grid of the future and customer choice As we pursue this vision sustainability remains at the core of who we are and what we dordquo ndash Pedro Pizarro Edison International CEO
bull Earnings not affected by variability of retail electricity salesbull Differences between amounts collected and authorized levels
either billed or refundedbull Promotes energy conservationbull Stabilizes revenues during economic cycles
Major Balancing Accountsbull Salesbull Fuel and Purchased powerbull Energy efficiencybull Pension expense
bull Cost-recovery related balancing accounts represented more than 59 of costs
bull Trigger mechanism for fuel and purchased power adjustments at 5 variance level
Advanced Long-TermProcurement Planning
bull Upfront contract approvals and prudency standards provide greater certainty of cost recovery (subject to compliance-related reasonableness review)
Forward-looking Ratemaking bull Forward and test year GRC with three-year rate cycle bull Separate cost of capital mechanism
October 30 2019 31
SCE Historical Capital Expenditures($ billions)
$40 $39
$35$38
$44
2014 2015 2016 2017 2018
October 30 2019 32
Credit Ratings Summary
Date of Report July 26 2019 July 29 2019 July 29 2019
Edison InternationalCorporate Outlook BBBStable Baa3Stable BBB-StableSenior Unsecured BBB- Baa3 BBB-Commercial Paper A-2 P-3 F3
Southern California EdisonCorporate Outlook BBBStable Baa2Stable BBB-StableFirst Mortgage Bonds A- A3 BBB+Senior Unsecured BBB Baa2 BBBPreferred Securities BB+ Ba1 BB+Commercial Paper A-2 P-2 F3
FitchMoodyrsquosSampP
October 30 2019 33
4
ampCalibriRegularFINANCIAL AND STATISTICAL REPORTampCalibriRegularampA
Distribution Power Grid of the Future
One-Way Electricity Flowbull System designed to distribute electricity
from large central generating plantsbull Voltage centrally maintainedbull Increasing integration of distributed
energy resourcesbull Limited situational awareness and
visualization tools for power grid operators
Renewable Generation Mandates
Subsidized Residential Solar
Limited Electric Vehicle Charging Infrastructure
Variable Two-Way Electricity Flowbull Distribution system at the center of the
power gridbull System designed to manage fluctuating
resources and customer demand bull Digital monitoring and control devices and
advanced communications systems to improve safety and reliability and integrate DERs
bull Improved data management and power grid operations and cyber risk mitigation
bull Integrated utility distribution with distributed energy resources planning
Maximize Distributed Resources and Electric Vehicle Adoptionbull Distribution power grid infrastructure
design supports customer choice and greater resiliency
Current State Future State
October 30 2019 34
SCE Customer Demand Trends
Note See Edison International Financial and Statistical Reports for 2017 for further information
Kilowatt-Hour Sales (millions of kWh) 2014 2015 2016 2017 2018
Residential 30027 30093 29579 30221 29865
Commercial 42004 42396 42189 42514 42369
Industrial 8392 7623 7162 6659 6786
Public authorities 4975 4795 4715 4711 4510
Agricultural and other 2019 1950 1803 1498 1745
Subtotal 87416 86857 85448 85602 85276
Resale 1308 1080 1794 1568 1867
Total Kilowatt-Hour Sales 88725 87937 87242 87170 87143
Total Number of Customers 5005401 5033330 5060528 5094818 5126985
Number of New Connections 29879 31653 38076 39621 39633
Area Peak Demand (MW) 23055 23079 23091 23508 23766
October 30 2019 35
SCE Bundled Revenue Requirement
Note Rates in effect as of July 26 2019 Represents bundled service which excludes Direct AccessCCA customers that do not receive generation services from SCE
SCE Systemwide Average Rate History (centkWh)
2010 2011 2012 2013 2014 2015 2016 2017 2018 2019
143 141 143 159 167 162 148 157 160 159
Fuel amp Purchased Power(47)
Distribution(38)
Transmission (8)
Generation(8)
Other (-1)
2019 Bundled Revenue
Requirement
$millions centkWh
Fuel amp Purchased Power ndash includes CDWR Bond Charge
4422 74
Distribution ndash poles wires substations service centers Edison SmartConnectreg
3628 61
Generation ndash owned generation investment and OampM 708 12
Transmission ndash greater than 220kV 789 13
Other ndash CPUC and legislative public purpose programs system reliability investments nuclear decommissioning and prior-year over collections
(116) (01)
Total Bundled Revenue Requirement ($millions) $9431
divide Bundled kWh (millions) 59396
= Bundled Systemwide Average Rate (centkWh) 159cent
October 30 2019 36
37
97cent
159cent
80cent
100cent
120cent
140cent
160cent
180cent
200cent
220cent
1990
1991
1992
1993
1994
1995
1996
1997
1998
1999
2000
2001
2002
2003
2004
2005
2006
2007
2008
2009
2010
2011
2012
2013
2014
2015
2016
2017
2018
2019
195cent
Rates reduced due to the implementation of 1) the SONGS Revised Settlement including NEIL insurance benefits 2) lower fuel amp purchased power costs and 3) a lower 2015 GRC revenue requirement that includes flow-through tax benefits
centkWh
System Average Rate Historical Growth
SCErsquos system average rate has grown less than inflation over the last 29 years
SCE System Average RateLos Angeles Area Inflation
Comparative System Average Rates
Delta to SCESCE 159cent --
PGampE 211cent1 33
SDGampE 246cent1 55
CAGR29-yr
(lsquo90-rsquo19)20-yr
(lsquo99-rsquo19)10-yr
(lsquo09-19)17 26 1124 25 20
Energy Crisis and return to normal
Higher gas price forecast post-Katrina leads to higher rates with subsequent refund of over collection
Delay in 2012 GRC leads to shorter ramp-up of rate increase
1 PGampE Advice 5644-E effective October 1 SDGampE Advice 3377-E effective June 1
October 30 2019
Data
SCE System Average Rate
1990199119921993199419951996199719981999200020012002200320042005200620072008200920102011201220132014201520162017201820199699999999999999310310610310510710110196969614214212412212614713913714314314114315916715940876786458386148350382761769171566871495475337116159CPI Los Angeles-Long Beach-Anaheim CA199019911992199319941995199619971998199920002001200220032004200520062007200820092010201120122013201420152016201720182019202096999999999999993100974239450441131046212585868498310726876840039228108738285083414611104041339548576811242695044160916114205839057899881158478900883218511856679342492612122475588812561061265926153091265513010279685966582133476140824337041379322865554462144095927379783561502417198233561515516495767909655160640840897938551593635512757601816127380397448466165581867639842851689511064769380217077830471050007173082233194307481746514628312063517794555998527898182917523920509811898939005269867419453007660169238SAR CPI (old)1990199119921993199419951996199719981999200020012002200320042005200620072008200920102011201220132014201520162017201820199699999999999999310108935518848128104164104853626311072574143759422111004139294598572113128515849244651164507302761853711917284265578923121016455131068581236705147011944127834109318192141314347216021390513353198545827113660054850437767140244467121649041449648574526591614963575483132515393112443397234159803525097292715929158237134114161898499904328691669815498437507617045100580396491729508329612907517573561579182243175943857388863061777863624593457518198880904395583186584452388557219152742489955948
195cent
CPI Workbook
image1png
129 ₵
164 ₵
US Average SCE
27 Higher
SCE Rates and Bills Comparison
SCErsquos average residential rates are above national averagebut residential bills are below national average due to lower usage
bull SCErsquos residential rates are above national average due in part to a cleaner fuel mix high cost of living and lower system load factor
bull SCErsquos residential customer usage is lower than the national average due to mild climate and higher energy efficiency appliance and building standards
bull Average monthly residential bills are lower than the national average as higher rate levels are more than offset by lower usage
Key FactorsKey Factors
Source EIAs Form 861M (formerly Form 826) Data Monthly Electric Utility Sales and Revenue Data for 12-Months Ending June 2019 httpswwweiagovelectricitydataeia861mindexhtml
2018-19 Average Residential Rates (centkWh)
2018-19 Average Residential Bills ($ per Month)
$128
$95
US Average SCE
26 Lower
October 30 2019 38
Sheet1
Sheet1
129 ₵
164 ₵
Sheet2
27 Higher
Sheet3
Sheet1
Sheet1
$128
Sheet2
26 Lower
Sheet3
bull Assembly Bill 1171 permits cities and counties and Joint Powers Agencies (JPAs) to act as CCAs to purchase and sell electricity on behalf of the utility customers within their jurisdiction
bull An Order Instituting Rulemaking (OIR R17-06-026) was opened on June 29 2017 to review revise and consider alternatives to the ldquoPower Charge Indifference Adjustmentrdquo or PCIA The PCIA allocates a proportional share of above-market costs of SCErsquos
energy procurement portfolio to departing load customers to ensure remaining bundled service customers are indifferent
October 11 2018 Commission decision changes PCIA methodology and has substantially addressed the historical subsidy to departing load that materialized when renewables market prices declined over the past 4 yearso Decision also established a Phase 2 which is addressing utility
portfolio optimization PCIA ldquopre-paymentrdquo options for entities and individual departing load customers and implementation of the ldquotrue-uprdquo process for Resource Adequacy (RA) and Renewable Energy Credits (RECs) costs
o A Phase 2 final decision on the benchmark and true-up process was approved on October 10 2019 with the other Phase 2 activities to continue into 2020
bull On February 8 2018 the Commission approved Resolution E-4907 requiring CCAs to demonstrate compliance with annual Resource Adequacy (RA) requirements prior to commencing operations
bull Existing Direct Access and CCA load is expected to be ~35 of SCErsquos total load by the end of 2019
Investor-Owned Utility (IOU)
Community Choice Aggregator (CCA)
Community Choice Aggregator (CCA) Overview
Approximately 40 of SCErsquos bundled service load could be part of a CCA or Direct Access by the end of 2020
October 30 2019 39
bull CPUC Order Instituting Ratemaking R 12-06-013 comprehensively reviewed residential rate structure including a future transition to Time of Use (TOU) rates In March 2018 SCE began to migrate 400000 residential customers to TOU rate structures
Remaining eligible residential customers to be migrated beginning October 2020bull July 2015 CPUC Decision D 15-07-001 includes Transition to 2 tiered rate structure coupled with Super-User Electric (SUE) Surcharge1
ldquoSuper User Electric Surchargerdquo for usage 400 above baseline (~3 of all usage)
Minimum bills of approximately $10month (applied to delivery revenue only)
January 2014 2019
100(60 of system usage)
219(3)
Tier 1100
Tier 2 101-400
SUEgt400
125(37)
Usage Level ( of Baseline)Usage Level ( of Baseline)
1 Completed in 20192 SCErsquos California Alternate Rates for Energy (CARE) program is an income-qualifying program that reduces energy bills for eligible customers by about 30
Winter Weekdays 8am-9pm Weekdays and Weekends 4-9pm
Off-Peak Summer Weekdays 11pm-8amWeekends All
Weekdays and Weekends All except 4-9pm
Winter Weekdays 9pm-8amWeekends All
Weekdays and Weekends 9pm-8am
Super Off-Peak Winter NA Weekdays and Weekends 8am-4pm
New Time-of-Use (TOU) Periods
bull On March 1 2019 SCE changed its basic TOU pricing period definition for the first time in over 30 years
bull Abundant mid-day renewable energy lowers prices from 8am-4pm (October - June)
bull Highest cost period is now 4pm-9pm all-days1
1 TOU pricing periods defined for non-residential customers per CPUC Decision D18-07-006 Similar residential TOU definitions were filed by SCE in A17-12-012
bull 998 solar projectsbull 320445 residential (71 of all residential customers) ndash 1756 MW bull 7333 non-residential ndash 977 MW bull Approximately 4775887 MWhyear generated
SCE Net Metering Statistics (919)
0
5
10
15
20
25
30
35
40
0
1000
2000
3000
4000
5000
6000
7000
2013 2014 2015 2016 2017 2018 2019
MW
Inst
alle
d
Num
ber o
f Sol
ar R
esid
entia
l Ins
talla
tions
Installations MW
July 1 2017bull Official start of NEM successor tariff customers are subject to
Mandatory TOU rate Non-bypassable charges Application fees
July 31 2017bull Residential customers who meet this deadline are grandfathered for
current TOU periods for maximum of 5 years (10 for non-residential)September 9 2017bull Smart Inverters required on all solar installationsJuly 25 2018bull Smart Inverters with Reactive Power Priority required on all solar
installationsNear Term Outlookbull Combination of a flatter tiered rate and the mandatory TOU NEM 20
rate structure has helped reduce the per customer cost shift further efforts to reduce the shift through new TOU pricing periods
bull Commission to revisit NEM Successor Tariff by July 2020 to evaluate the existing NEM tariffs and consider the development and adoption of successor tariffs
Key Dates
Third Quarter Earnings Summary
October 30 2019
Q32019
Q32018 Variance
Basic Earnings Per Share (EPS)1
SCE $ 145 $ 164 $ (019)
EIX Parent amp Other (009) (007) (002)
Basic EPS $ 136 $ 157 $ (021)
Less Non-core Items
SCE2 $ (014) $ 002 $ (016)
EIX Parent amp Other3 mdash (001) 001
Total Non-core $ (014) $ 001 $ (015)
Core Earnings Per Share (EPS)
SCE $ 159 $ 162 $ (003)
EIX Parent amp Other (009) (006) (003)
Core EPS $ 150 $ 156 $ (006)
Key SCE EPS Drivers4
Higher revenue5 $ 012- CPUC revenue (002)- 2018 FERC Formula Rate settlement 010- Other FERC revenue 004
Higher OampM (021)Lower depreciation 002Higher net financing costs (004)Income taxes5 019Property and other taxes (001)Results prior to impact from share dilution $ 007Impact from share dilution (010)Total core drivers $ (003)Non-core items 2 (016)Total $ (019)
Key EIX EPS Drivers4
EIX parent and other mdash Higher interest expense and corporate expenses $ (005)EEG mdash Lower corporate expenses 001Impact from share dilution 001Total core drivers $ (003)Non-core items 3 001Total $ (002)
1 See Earnings Non-GAAP reconciliations and Use of Non-GAAP Financial Measures in Appendix2 Includes SCEs contributions to Wildfire Insurance Fund in third quarter 2019 and impact from the approval of the Revised San Onofre Settlement Agreement in the third quarter 2018 3 Loss on sale of SoCore Energy4 2019 EPS drivers are reported at a consistent share count of 3258 million (2019 QTD weighted-average shares outstanding is 3471 million)5 Includes $020 of tax benefits refunded to customersNote Diluted earnings were $135 and $157 per share for the three months ended September 30 2019 and 2018 respectively
43
1 See Earnings Non-GAAP reconciliations and Use of Non-GAAP Financial Measures in Appendix2 Impact of 2018 GRC final decision related to impairment of utility property plant and equipment changes in allocation of deferred tax re-measurement between customers and
shareholders SCErsquos contributions to the Wildfire Insurance Fund gain from sale of nuclear fuel and impact from the approval of the Revised San Onofre Settlement Agreement3 Loss on sale of SoCore Energy and impact of hypothetical liquidation at book value (HLBV) accounting method4 2019 EPS drivers are reported at a consistent share count of 3258 million (2019 YTD weighted-average shares outstanding is 3330 million)5 Test Year 2018 GRC true-up of $020 includes revenue of $(034) OampM of $006 depreciation of $024 interest expense of $(001) property and other taxes of $001 and income taxes of
$0246 Includes $018 of tax benefits refunded to customersNote Diluted earnings were $342 and $308 per share for the nine months ended September 30 2019 and 2018 respectively
Year to Date Earnings Summary
October 30 2019
YTD 2019
YTD 2018 Variance
Basic Earnings Per Share (EPS)1
SCE $ 365 $ 343 $ 022
EIX Parent amp Other (022) (034) 012
Basic EPS $ 343 $ 309 $ 034
Less Non-core Items
SCE2 $ (030) $ 002 $ (032)
EIX Parent amp Other3 mdash (014) 014
Total Non-core $ (030) $ (012) $ (018)
Core Earnings Per Share (EPS)
SCE $ 395 $ 341 $ 054
EIX Parent amp Other (022) (020) (002)
Core EPS $ 373 $ 321 $ 052
Key SCE EPS Drivers4
Test Year 2018 GRC true-up5 $ 020Higher revenue6 055
- CPUC revenue 032- 2018 FERC Formula Rate settlement 010- FERC and other operating revenue 013
Higher OampM (026)Lower depreciation 005Higher net financing costs (012)Income taxes6 021Results prior to impact from share dilution $ 063Impact from share dilution (009)Total core drivers $ 054Non-core items2 (032)Total $ 022
Key EIX EPS Drivers4
EIX parent and other mdash Higher interest expense and corporate expenses $ (007)EEG mdash Lower corporate expenses and lower losses at the competitive business 004Impact from share dilution 001Total core drivers $ (002)Non-core items3 014Total $ 012
44
SCE Annual Results of Operationsbull Earning activities ndash revenue authorized by CPUC and FERC to provide reasonable cost recovery and return on investmentbull Cost-recovery activities ndash CPUC- and FERC-authorized balancing accounts to recover specific project or program costs subject
to reasonableness review or compliance with upfront standards
($ millions)
2018 2017
Earnings Activities
Cost-Recovery Activities
Total Consolidated
Earnings Activities
Cost-Recovery Activities
Total Consolidated
Operating revenue $6560 $6051 $12611 $6611 $5643 $12254Purchased power and fuel mdash 5406 5406 mdash 4873 4873Operation and maintenance 1972 730 2702 1898 824 2722Wildfire-related claims net of recoveries 2669 mdash 2669 ― ― ―Depreciation and amortization 1867 mdash 1867 2032 mdash 2032Property and other taxes 392 mdash 392 372 mdash 372Impairment and other charges (12) mdash (12) 716 mdash 716Other operating income (7) mdash (7) (8) mdash (8)Total operating expenses 6881 6136 13017 5010 5697 10707Operating (loss) income (321) (85) (406) 1601 (54) 1547Interest expense (671) (2) (673) (588) (1) (589)Other income and expenses 107 87 194 93 55 148(Loss) income before income taxes (885) mdash (885) 1106 mdash 1106Income tax (benefit) expense (696) mdash (696) (30) mdash (30)Net (loss) income (189) mdash (189) 1136 mdash 1136Preferred and preference stock dividend
requirements 121 mdash 121 124 mdash 124
Net (loss) income available for common stock ($310) mdash ($310) $1012 mdash $1012Less Non-core items (1750) (481)Core Earnings $1440 $1493
Note See Use of Non-GAAP Financial Measures
October 30 2019 45
Reconciliation of EIX Basic Earnings Per Share Guidance to EIX Core Earnings Per Share Guidance
EPS Attributable to Edison International 2019
Low Midpoint High
SCE $483
EIX Parent amp Other (032)
Basic EPS1 $441 $451 $461
Non-Core Items
SCE23 (029) (029) (029)
EIX Parent amp Other mdash mdash mdash
Total Non-Core1 (029) (029) (029)
Core EPS
SCE $512
EIX Parent amp Other (032)
Core EPS1 $470 $480 $490
1 EPS is calculated on the assumed weighted-average share count for 2019 Please see 2019 EIX Core Earnings Guidance slide for more information 2 Includes impact of 2018 GRC final decision related to impairment of utility property plant and equipment changes in allocation of deferred tax re-measurement between
customers and shareholders and SCErsquos contributions to the Wildfire Insurance Fund3 Includes $001 per share as a result of share count dilution
October 30 2019
Earnings Per Share Non-GAAP Reconciliations
46
Earnings Non-GAAP Reconciliations
1 Impact of 2018 GRC final decision related to impairment of utility property plant and equipment changes in allocation of deferred tax re-measurement between customers and shareholders SCErsquos contributions to the Wildfire Insurance Fund gain from sale of nuclear fuel and impact from the approval of the Revised San Onofre Settlement Agreement
2 Loss on sale of SoCore Energy and impact of hypothetical liquidation at book value (HLBV) accounting method
($ millions)
Reconciliation of EIX GAAP Earnings to EIX Core Earnings
Earnings Attributable to Edison International Q32019
Q32018
YTD 2019
YTD 2018
SCE $503 $536 $1215 $1119
EIX Parent amp Other (32) (23) (74) (112)
Basic Earnings $471 $513 $1141 $1007
Non-Core Items
SCE 1 ($48) 7 ($99) 7
EIX Parent amp Other 2 mdash (4) mdash (46)
Total Non-Core ($48) $3 ($99) ($39)
Core Earnings
SCE $551 $529 $1314 $1112
EIX Parent amp Other (32) (19) (74) (66)
Core Earnings $519 $510 $1240 $1046
October 30 2019 47
EIX Core EPS Non-GAAP ReconciliationsReconciliation of Edison International Basic Earnings Per Share to Edison International Core Earnings Per Share
Note See Use of Non-GAAP Financial Measures
Earnings Per Share Attributable to Edison International 2018 2017
Basic EPS ($130) $173
Non-Core Items
SCE
Wildfire-related claims net of recoveries (560) mdash
Settlement of 1994 ndash 2006 California tax audits 020 mdash
Write down impairment and other as a result of Revised San Onofre Settlement Agreement
003 (138)
Re-measurement of deferred taxes as a result of Tax Reform mdash (010)
Edison International Parent and Other
Settlement of 1994 ndash 2006 California tax audits (004) mdash
Re-measurement of deferred taxes as a result of Tax Reform mdash (133)
Sale of SoCore Energy and other (014) 004
Discontinued operations
Settlement of 1994 ndash 2006 California tax audits 010 mdash
Less Total Non-Core Items (545) (277)
Core EPS $415 $450
October 30 2019 48
Use of Non-GAAP Financial MeasuresEdison Internationals earnings are prepared in accordance with generally accepted accounting principles used in the United States Management uses core earnings internally for financial planning and for analysis of performance Core earnings are also used when communicating with investors and analysts regarding Edison Internationals earnings results to facilitate comparisons of the Companys performance from period to period Core earnings are a non-GAAP financial measure and may not be comparable to those of other companies Core earnings (or losses) are defined as earnings or losses attributable to Edison International shareholders less income or loss from discontinued operations and income or loss from significant discrete items that management does not consider representative of ongoing earnings such as exit activities including sale of certain assets and other activities that are no longer continuing asset impairments and certain tax regulatory or legal settlements or proceedings
A reconciliation of Non-GAAP information to GAAP information is included either on the slide where the information appears or on another slide referenced in this presentation
EIX Investor Relations Contact
Sam Ramraj Vice President (626) 302-2540 samramrajedisonintlcom
Allison Bahen Principal Manager (626) 302-5493 allisonbahenedisonintlcom
October 30 2019 49
Business Update
Slide Number 2
Table of Contents
EIX Strategy Should Produce Long-Term Value
SCE Highlights
Slide Number 6
SCE Historical Rate Base and Core Earnings
SCE Capital Expenditure Forecast
SCE Rate Base Forecast
Slide Number 10
Californiarsquos GHG Emissions Overview
SCErsquos Pathway 2045 Highlights
Slide Number 13
Slide Number 14
Slide Number 15
SCE Key Regulatory Proceedings
Slide Number 17
Slide Number 18
CPUC and FERC Cost of Capital Summary
CPUC Cost of Capital (2013-2019)
SCE Distribution System Investments
Slide Number 22
Slide Number 23
SCE Large Transmission Projects
SCE Operational Excellence
Responding to Industry Change
Slide Number 27
2019 EIX Core Earnings Guidance
EIX Annual Dividends Per Share
Appendix
EIXrsquos 2018 Sustainability Report Highlights
Slide Number 32
SCE Historical Capital Expenditures
Credit Ratings Summary
Distribution Power Grid of the Future
SCE Customer Demand Trends
SCE Bundled Revenue Requirement
Slide Number 38
SCE Rates and Bills Comparison
Slide Number 40
Slide Number 41
Slide Number 42
Slide Number 43
Slide Number 44
Slide Number 45
SCE Annual Results of Operations
Slide Number 47
Earnings Non-GAAP Reconciliations
EIX Core EPS Non-GAAP Reconciliations
Use of Non-GAAP Financial Measures
US Average
$134
SCE
$95
-291
US Average
128
SCE
164
higher
28
Created on Mon 6 Jun 2016 1250 PM EST (1750 GMT)
Concept
1990
1991
1992
1993
1994
1995
1996
1997
1998
1999
2000
2001
2002
2003
2004
2005
2006
2007
2008
2009
2010
2011
2012
2013
2014
2015
2016
2017
2018
2019
2020
2021
2022
2023
2024
2025
2026
Consumer Price Index All-Urban
131
136
140
144
148
152
157
161
163
167
172
177
180
184
189
195
202
207
215
215
218
225
230
233
237
237
239
245
251
258
265
272
279
286
293
300
306
422
304
297
260
281
294
234
155
219
337
282
160
230
267
337
322
287
381
-032
164
314
208
147
161
012
105
236
253
265
265
264
254
251
249
234
227
SOUTHERN CALIFORNIA EDISON
System Average Rate Forecast
Source Matt Sheriff
(centkWh)
SCE System Average Rate
SAR CPI (old)
SAR CPI (current)
CPI Los Angeles-Long Beach-Anaheim CA
Consumer Price Index All-Urban
0
1990
97cent
97cent
97cent
593
30
1
1991
103cent
101cent
101cent
410
422
2
1992
106cent
104cent
105cent
361
304
3
1993
103cent
107cent
107cent
253
297
4
1994
105cent
110cent
109cent
137
260
5
1995
107cent
113cent
110cent
153
281
25
6
1996
101cent
116cent
112cent
183
294
7
1997
101cent
119cent
114cent
158
234
8
1998
96cent
121cent
116cent
144
155
9
1999
96cent
124cent
119cent
235
219
10
2000
96cent
128cent
122cent
330
337
20
11
2001
142cent
131cent
127cent
336
282
12
2002
142cent
134cent
130cent
277
160
13
2003
124cent
137cent
133cent
259
230
14
2004
122cent
140cent
138cent
334
267
15
2005
126cent
145cent
144cent
447
337
16
2006
147cent
150cent
150cent
427
322
17
2007
139cent
154cent
155cent
328
287
18
2008
137cent
160cent
161cent
353
381
19
2009
143cent
159cent
159cent
-080
-032
20
2010
143cent
162cent
161cent
120
164
10
21
2011
141cent
167cent
166cent
267
314
22
2012
143cent
170cent
169cent
203
208
23
2013
159cent
173cent
171cent
108
147
24
2014
167cent
176cent
173cent
135
161
25
2015
159cent
176cent
175cent
091
012
5
26
2016
148cent
178cent
178cent
189
105
27
2017
157cent
182cent
183cent
279
236
29
20
10
28
2018
160cent
187cent
190cent
381
253
SCE
17
26
11
29
2019
159cent
192cent
195cent
244
265
LA
24
25
20
30
2020
194cent
197cent
199cent
219
265
36
31
2021
199cent
202cent
203cent
227
266
25
49
Created on Wed 23 Jan 2019 1245 PM EST (1745 GMT)
Mnemonic
Long Label
Last Update
Start Date
End Date
Frequency
1970
1971
1972
1973
1974
1975
1976
1977
1978
1979
1980
1981
1982
1983
1984
1985
1986
1987
1988
1989
1990
1991
1992
1993
1994
1995
1996
1997
1998
1999
2000
2001
2002
2003
2004
2005
2006
2007
2008
2009
2010
2011
2012
2013
2014
2015
2016
2017
2018
2019
2020
2021
2022
2023
2024
2025
2026
2027
2028
2029
2030
2031
2032
2033
2034
2035
2036
2037
2038
2039
2040
2041
2042
2043
2044
2045
2046
2047
2048
CPILANGAFRSM1
Los Angeles-Long Beach-Anaheim CA (MSA) [2013 Definition] FIPS Code 31080 Consumer Price Index for All Urban Consumers (1982-84=100) IHS MARKIT ECONOMICS December 2018 Forecast Source Bureau of Labor Statistics End of Historical Data 2017
122718
1970
2048
ANNUAL
3868
4011
4139
4374
4825
5334
5683
6080
6526
7233
8372
9184
9734
9907
10360
10838
11193
11667
12206
12826
13587
14143
14654
15025
15231
15464
15748
15997
16227
16608
17155
17732
18223
18696
19320
20183
21044
21734
22501
22322
22589
23193
23665
23921
24243
24463
24925
25621
26598
27248
27844
28475
29132
29806
30500
31165
31832
32533
33254
33985
34744
35508
36279
37061
37854
38640
39440
40278
41145
42043
42963
43898
44852
45825
46816
47822
48857
49934
51047
371
320
568
1031
1055
655
698
733
1083
1575
971
599
177
458
461
328
423
462
508
593
410
361
253
137
153
183
158
144
235
330
336
277
259
334
447
427
328
353
-080
120
267
203
108
135
091
189
279
381
244
219
227
231
231
233
218
214
220
222
220
223
220
217
215
214
208
207
213
215
218
219
218
217
217
216
215
216
220
223
Date of Report
July 26 2019
July 29 2019
July 29 2019
Edison International
Corporate Outlook
BBBStable
Baa3Stable
BBB-Stable
Senior Unsecured
BBB-
Baa3
BBB-
Commercial Paper
A-2
P-3
F3
Southern California Edison
Corporate Outlook
BBBStable
Baa2Stable
BBB-Stable
First Mortgage Bonds
A-
A3
BBB+
Senior Unsecured
BBB
Baa2
BBB
Preferred Securities
BB+
Ba1
BB+
Commercial Paper
A-2
P-2
F3
SCE Large Transmission Projects
FERC Cost of Capital112 ROE from January 1 2018 to November 12 2019bull ROE = Base (plus incentives) of 107 + CAISO Participation Application for FERC Formula recovery mechanism post
November 12 2019 was filed April 11 2019 Requested 50 bp CAISO adder approved but application for
rehearing requested by CPUC
Summary of Large Transmission Projects
Project Name Total Cost5 Remaining Investment(as of September 30 2019)
Estimated In-ServiceDate
West of Devers12 $848 million $416 million 2021
Mesa Substation1 $646 million $296 million 2022
Alberhill System3 $486 million $446 million mdash 3
Riverside Transmission Reliability4 $451 million $441 million 2024
Eldorado-Lugo-Mohave Upgrade $257 million $180 million 2021
1 CPUC approved2 Morongo Transmission holds an option to invest up to $400 million or half of the estimated cost of the transmission facilities only at the in-service date If the option is
exercised SCErsquos rate base would be offset by that amount 3 In August 2018 the CPUC approved the revised alternate decision which left the proceeding open and directed SCE to supplement the existing record with additional analysis
as it relates to the Project need and alternatives Potential revisions to the Project have not been reflected in the total cost of the Project or estimated in service date 4 Riverside Transmission Reliability Project total cost is currently estimated to be $451 million however costs could increase depending on the final route alternative selected5 Total Costs are nominal direct expenditures subject to CPUC and FERC cost recovery approval SCE regularly evaluates the cost and schedule based on permitting processes
given that SCE continues to see delays in securing project approvalsOctober 30 2019 23
SCE Operational Excellence
Top Quartilebull Safetybull Reliabilitybull Customer servicebull Cost efficiency
Optimizebull Capital productivitybull Purchased power costbull Digitization
High performing continuous improvement culture
Defining Excellence Measuring Excellence
bull Employee and public safety metrics
bull System performance and reliability (SAIDI and SAIFI)
bull Customer satisfaction calculation based on internal voice-of-customer surveys
bull OampM cost per customerbull Reduce system rate growth
with OampM purchased power cost reductions
Ongoing Operational Excellence
Efforts
October 30 2019 24
Responding to Industry ChangeLong-Term Industry Trends Strategy
bull The technology landscape is evolving at an unprecedented pace with innovation driving advances in cost and capabilities of distributed energy resources
bull Customer expectations are changing with increasing choices and alternatives a growing priority of sustainability objectives and flattening demand
bull The regulatory environment for utilities is complex increasingly supportive of new forms of competition but unable to keep pace with new business models
bull Policies both in California and globally are setting aggressive greenhouse gas reduction targets
SCE Strategybull Clean the power system by accelerating
the de-carbonization of electricity supplybull Help customers make cleaner energy
choices to support electrification and leverage flexible energy demand
bull Strengthen and modernize the grid by replacing aging infrastructure and deploying technology
bull Achieve operational and service excellence with top tier performance in safety reliability affordability and customer satisfaction
Beyond SCEbull Position Edison Energy as an independent
energy advisor and integrator for large commercial and industrial customers
bull Further clean energy and sustainability efforts in California through Edison Energy insights
October 30 2019 25
bull Energy is a significant risk large commercial and industrial customers face Edison Energy creates competitive advantage for market leaders by quantifying this risk and designing the portfolio solution to protect shareholder value threatened by complex energy policies increasing sustainability needs technological advancements and new products
bull Optimized energy solutions based on robust analytics of the customerrsquos energy portfolio in alignment with their goals and strategic objectives
bull Implementation of solutions through existing service lines or brokering with third parties
bull Edison International investment $83 million as of September 30 2019
Edison Energy
Edison Energy Summary
The Opportunity Trusted Advisor and Solution Integrator
Managed Portfolio Solution
Renewables amp Sustainability
Supply Solutions
Demand Solutions
Installations
October 30 2019 26
27
Total Rate Base $307 billion
bull FERC comprises ~20 of total
CPUC
Return on Equity (ROE)
103
Capital Structure2 48 equity
FERC
ROE3 112 with incentives(previously 105 with incentives)
Capital Structure Recorded capital structure 45 2019 average estimated equity
Other Items
Capital Market Activities
$49 billion of EIXSCE debt and equity issuances in addition to SCErsquos normal course debt financing of rate base
$468 $480
($033)($024)$041
$029
SCE 2019 EPSfrom Rate
Base Forecast
SCEVariances
2018 True-Ups
EIX Parentamp Other
EquityProgram WF FundFinancing
EIX 2019 CoreEPS Midpoint
Guidance
bull Financing and other$032
bull Z-factor advice letter approval $004
bull Energy efficiency $005
2019 Core Earnings Per Share Guidance ndashBuilding from SCE Rate Base
bull HoldCo operating expenses (1) cent per share per month
bull HoldCo debt issued $1 billion in 2019 ($400 million of issuance remaining)
bull EEG target breakeven run rate by year-end 2019
EIX 2019 Core EPS guidance range of $470 - $490 midpoint $009 higher than prior
Key Assumptions
Note See Earnings Per Share Non-GAAP Reconciliations and Use of Non-GAAP Financial Measures in Appendix All tax-affected information on this slide is based on our current combined statutory tax rate of approximately 28 Totals may not foot due to rounding
1 Reflects actual financing activity at SCE (August 1st debt offering) and EIX (July 30th equity offering) versus prior guidance based on assumption that financing would occur on September 10th
2 On February 28 2019 SCE filed an application with the CPUC for a waiver of compliance with this equity ratio requirement describing that while the wildfire-related charge accrued in the fourth quarter of 2018 caused its equity ratio to fall below 47 on a spot basis as of December 31 2018 SCE remains in compliance with the 48 equity ratio over the applicable 37-month average basis While the CPUC reviews the waiver application SCE is considered in compliance with the capital structure rules
3 SCErsquos April 11 2019 TO2019A filing to revise its ROE is pending review with the FERC and not reflected in guidance assumptions
2019 EIX Core Earnings Guidance
bull Test year 2018 GRC true-up $020
bull FERC ROE settlement (prior year)$009
bull Previously announced financing plan (debt and equity) ($018)
bull Update to financing plan based on actual results ($006)
bull Remaining previously disclosed equity plan $05 billion
1 2019 dividend annualized based on December 6 2018 declaration
Fifteen Consecutive Years of Dividend Growth
Target dividend growth within target payout ratio of 45-55 of SCErsquos earnings
1
October 30 2019 28
Appendix
October 30 2019 29
EIXrsquos 2018 Sustainability Report Highlights
Edison Energy is not the same company as Southern California Edison the utility and Edison Energy is not regulated by the California Public Utilities Commission Cumulative duration (in minutes) of sustained repair outages lasting longer than five minutes experienced by the average customer in a year (including major event days) In February 2019 the EIX board approved a $3 million donation to the Edison International Wildfire Assistance Fund to enhance community resiliency and wildfire prevention and
mitigation This affects the 2019 data year and is not reflected here
October 30 2019
ldquoAt Edison International we are leading the transformation of the electric power industry toward a clean energy future by focusing on opportunities in clean energy efficient electrification the grid of the future and customer choice As we pursue this vision sustainability remains at the core of who we are and what we dordquo ndash Pedro Pizarro Edison International CEO
bull Earnings not affected by variability of retail electricity salesbull Differences between amounts collected and authorized levels
either billed or refundedbull Promotes energy conservationbull Stabilizes revenues during economic cycles
Major Balancing Accountsbull Salesbull Fuel and Purchased powerbull Energy efficiencybull Pension expense
bull Cost-recovery related balancing accounts represented more than 59 of costs
bull Trigger mechanism for fuel and purchased power adjustments at 5 variance level
Advanced Long-TermProcurement Planning
bull Upfront contract approvals and prudency standards provide greater certainty of cost recovery (subject to compliance-related reasonableness review)
Forward-looking Ratemaking bull Forward and test year GRC with three-year rate cycle bull Separate cost of capital mechanism
October 30 2019 31
SCE Historical Capital Expenditures($ billions)
$40 $39
$35$38
$44
2014 2015 2016 2017 2018
October 30 2019 32
Credit Ratings Summary
Date of Report July 26 2019 July 29 2019 July 29 2019
Edison InternationalCorporate Outlook BBBStable Baa3Stable BBB-StableSenior Unsecured BBB- Baa3 BBB-Commercial Paper A-2 P-3 F3
Southern California EdisonCorporate Outlook BBBStable Baa2Stable BBB-StableFirst Mortgage Bonds A- A3 BBB+Senior Unsecured BBB Baa2 BBBPreferred Securities BB+ Ba1 BB+Commercial Paper A-2 P-2 F3
FitchMoodyrsquosSampP
October 30 2019 33
4
ampCalibriRegularFINANCIAL AND STATISTICAL REPORTampCalibriRegularampA
Distribution Power Grid of the Future
One-Way Electricity Flowbull System designed to distribute electricity
from large central generating plantsbull Voltage centrally maintainedbull Increasing integration of distributed
energy resourcesbull Limited situational awareness and
visualization tools for power grid operators
Renewable Generation Mandates
Subsidized Residential Solar
Limited Electric Vehicle Charging Infrastructure
Variable Two-Way Electricity Flowbull Distribution system at the center of the
power gridbull System designed to manage fluctuating
resources and customer demand bull Digital monitoring and control devices and
advanced communications systems to improve safety and reliability and integrate DERs
bull Improved data management and power grid operations and cyber risk mitigation
bull Integrated utility distribution with distributed energy resources planning
Maximize Distributed Resources and Electric Vehicle Adoptionbull Distribution power grid infrastructure
design supports customer choice and greater resiliency
Current State Future State
October 30 2019 34
SCE Customer Demand Trends
Note See Edison International Financial and Statistical Reports for 2017 for further information
Kilowatt-Hour Sales (millions of kWh) 2014 2015 2016 2017 2018
Residential 30027 30093 29579 30221 29865
Commercial 42004 42396 42189 42514 42369
Industrial 8392 7623 7162 6659 6786
Public authorities 4975 4795 4715 4711 4510
Agricultural and other 2019 1950 1803 1498 1745
Subtotal 87416 86857 85448 85602 85276
Resale 1308 1080 1794 1568 1867
Total Kilowatt-Hour Sales 88725 87937 87242 87170 87143
Total Number of Customers 5005401 5033330 5060528 5094818 5126985
Number of New Connections 29879 31653 38076 39621 39633
Area Peak Demand (MW) 23055 23079 23091 23508 23766
October 30 2019 35
SCE Bundled Revenue Requirement
Note Rates in effect as of July 26 2019 Represents bundled service which excludes Direct AccessCCA customers that do not receive generation services from SCE
SCE Systemwide Average Rate History (centkWh)
2010 2011 2012 2013 2014 2015 2016 2017 2018 2019
143 141 143 159 167 162 148 157 160 159
Fuel amp Purchased Power(47)
Distribution(38)
Transmission (8)
Generation(8)
Other (-1)
2019 Bundled Revenue
Requirement
$millions centkWh
Fuel amp Purchased Power ndash includes CDWR Bond Charge
4422 74
Distribution ndash poles wires substations service centers Edison SmartConnectreg
3628 61
Generation ndash owned generation investment and OampM 708 12
Transmission ndash greater than 220kV 789 13
Other ndash CPUC and legislative public purpose programs system reliability investments nuclear decommissioning and prior-year over collections
(116) (01)
Total Bundled Revenue Requirement ($millions) $9431
divide Bundled kWh (millions) 59396
= Bundled Systemwide Average Rate (centkWh) 159cent
October 30 2019 36
37
97cent
159cent
80cent
100cent
120cent
140cent
160cent
180cent
200cent
220cent
1990
1991
1992
1993
1994
1995
1996
1997
1998
1999
2000
2001
2002
2003
2004
2005
2006
2007
2008
2009
2010
2011
2012
2013
2014
2015
2016
2017
2018
2019
195cent
Rates reduced due to the implementation of 1) the SONGS Revised Settlement including NEIL insurance benefits 2) lower fuel amp purchased power costs and 3) a lower 2015 GRC revenue requirement that includes flow-through tax benefits
centkWh
System Average Rate Historical Growth
SCErsquos system average rate has grown less than inflation over the last 29 years
SCE System Average RateLos Angeles Area Inflation
Comparative System Average Rates
Delta to SCESCE 159cent --
PGampE 211cent1 33
SDGampE 246cent1 55
CAGR29-yr
(lsquo90-rsquo19)20-yr
(lsquo99-rsquo19)10-yr
(lsquo09-19)17 26 1124 25 20
Energy Crisis and return to normal
Higher gas price forecast post-Katrina leads to higher rates with subsequent refund of over collection
Delay in 2012 GRC leads to shorter ramp-up of rate increase
1 PGampE Advice 5644-E effective October 1 SDGampE Advice 3377-E effective June 1
October 30 2019
Data
SCE System Average Rate
1990199119921993199419951996199719981999200020012002200320042005200620072008200920102011201220132014201520162017201820199699999999999999310310610310510710110196969614214212412212614713913714314314114315916715940876786458386148350382761769171566871495475337116159CPI Los Angeles-Long Beach-Anaheim CA199019911992199319941995199619971998199920002001200220032004200520062007200820092010201120122013201420152016201720182019202096999999999999993100974239450441131046212585868498310726876840039228108738285083414611104041339548576811242695044160916114205839057899881158478900883218511856679342492612122475588812561061265926153091265513010279685966582133476140824337041379322865554462144095927379783561502417198233561515516495767909655160640840897938551593635512757601816127380397448466165581867639842851689511064769380217077830471050007173082233194307481746514628312063517794555998527898182917523920509811898939005269867419453007660169238SAR CPI (old)1990199119921993199419951996199719981999200020012002200320042005200620072008200920102011201220132014201520162017201820199699999999999999310108935518848128104164104853626311072574143759422111004139294598572113128515849244651164507302761853711917284265578923121016455131068581236705147011944127834109318192141314347216021390513353198545827113660054850437767140244467121649041449648574526591614963575483132515393112443397234159803525097292715929158237134114161898499904328691669815498437507617045100580396491729508329612907517573561579182243175943857388863061777863624593457518198880904395583186584452388557219152742489955948
195cent
CPI Workbook
image1png
129 ₵
164 ₵
US Average SCE
27 Higher
SCE Rates and Bills Comparison
SCErsquos average residential rates are above national averagebut residential bills are below national average due to lower usage
bull SCErsquos residential rates are above national average due in part to a cleaner fuel mix high cost of living and lower system load factor
bull SCErsquos residential customer usage is lower than the national average due to mild climate and higher energy efficiency appliance and building standards
bull Average monthly residential bills are lower than the national average as higher rate levels are more than offset by lower usage
Key FactorsKey Factors
Source EIAs Form 861M (formerly Form 826) Data Monthly Electric Utility Sales and Revenue Data for 12-Months Ending June 2019 httpswwweiagovelectricitydataeia861mindexhtml
2018-19 Average Residential Rates (centkWh)
2018-19 Average Residential Bills ($ per Month)
$128
$95
US Average SCE
26 Lower
October 30 2019 38
Sheet1
Sheet1
129 ₵
164 ₵
Sheet2
27 Higher
Sheet3
Sheet1
Sheet1
$128
Sheet2
26 Lower
Sheet3
bull Assembly Bill 1171 permits cities and counties and Joint Powers Agencies (JPAs) to act as CCAs to purchase and sell electricity on behalf of the utility customers within their jurisdiction
bull An Order Instituting Rulemaking (OIR R17-06-026) was opened on June 29 2017 to review revise and consider alternatives to the ldquoPower Charge Indifference Adjustmentrdquo or PCIA The PCIA allocates a proportional share of above-market costs of SCErsquos
energy procurement portfolio to departing load customers to ensure remaining bundled service customers are indifferent
October 11 2018 Commission decision changes PCIA methodology and has substantially addressed the historical subsidy to departing load that materialized when renewables market prices declined over the past 4 yearso Decision also established a Phase 2 which is addressing utility
portfolio optimization PCIA ldquopre-paymentrdquo options for entities and individual departing load customers and implementation of the ldquotrue-uprdquo process for Resource Adequacy (RA) and Renewable Energy Credits (RECs) costs
o A Phase 2 final decision on the benchmark and true-up process was approved on October 10 2019 with the other Phase 2 activities to continue into 2020
bull On February 8 2018 the Commission approved Resolution E-4907 requiring CCAs to demonstrate compliance with annual Resource Adequacy (RA) requirements prior to commencing operations
bull Existing Direct Access and CCA load is expected to be ~35 of SCErsquos total load by the end of 2019
Investor-Owned Utility (IOU)
Community Choice Aggregator (CCA)
Community Choice Aggregator (CCA) Overview
Approximately 40 of SCErsquos bundled service load could be part of a CCA or Direct Access by the end of 2020
October 30 2019 39
bull CPUC Order Instituting Ratemaking R 12-06-013 comprehensively reviewed residential rate structure including a future transition to Time of Use (TOU) rates In March 2018 SCE began to migrate 400000 residential customers to TOU rate structures
Remaining eligible residential customers to be migrated beginning October 2020bull July 2015 CPUC Decision D 15-07-001 includes Transition to 2 tiered rate structure coupled with Super-User Electric (SUE) Surcharge1
ldquoSuper User Electric Surchargerdquo for usage 400 above baseline (~3 of all usage)
Minimum bills of approximately $10month (applied to delivery revenue only)
January 2014 2019
100(60 of system usage)
219(3)
Tier 1100
Tier 2 101-400
SUEgt400
125(37)
Usage Level ( of Baseline)Usage Level ( of Baseline)
1 Completed in 20192 SCErsquos California Alternate Rates for Energy (CARE) program is an income-qualifying program that reduces energy bills for eligible customers by about 30
Winter Weekdays 8am-9pm Weekdays and Weekends 4-9pm
Off-Peak Summer Weekdays 11pm-8amWeekends All
Weekdays and Weekends All except 4-9pm
Winter Weekdays 9pm-8amWeekends All
Weekdays and Weekends 9pm-8am
Super Off-Peak Winter NA Weekdays and Weekends 8am-4pm
New Time-of-Use (TOU) Periods
bull On March 1 2019 SCE changed its basic TOU pricing period definition for the first time in over 30 years
bull Abundant mid-day renewable energy lowers prices from 8am-4pm (October - June)
bull Highest cost period is now 4pm-9pm all-days1
1 TOU pricing periods defined for non-residential customers per CPUC Decision D18-07-006 Similar residential TOU definitions were filed by SCE in A17-12-012
bull 998 solar projectsbull 320445 residential (71 of all residential customers) ndash 1756 MW bull 7333 non-residential ndash 977 MW bull Approximately 4775887 MWhyear generated
SCE Net Metering Statistics (919)
0
5
10
15
20
25
30
35
40
0
1000
2000
3000
4000
5000
6000
7000
2013 2014 2015 2016 2017 2018 2019
MW
Inst
alle
d
Num
ber o
f Sol
ar R
esid
entia
l Ins
talla
tions
Installations MW
July 1 2017bull Official start of NEM successor tariff customers are subject to
Mandatory TOU rate Non-bypassable charges Application fees
July 31 2017bull Residential customers who meet this deadline are grandfathered for
current TOU periods for maximum of 5 years (10 for non-residential)September 9 2017bull Smart Inverters required on all solar installationsJuly 25 2018bull Smart Inverters with Reactive Power Priority required on all solar
installationsNear Term Outlookbull Combination of a flatter tiered rate and the mandatory TOU NEM 20
rate structure has helped reduce the per customer cost shift further efforts to reduce the shift through new TOU pricing periods
bull Commission to revisit NEM Successor Tariff by July 2020 to evaluate the existing NEM tariffs and consider the development and adoption of successor tariffs
Key Dates
Third Quarter Earnings Summary
October 30 2019
Q32019
Q32018 Variance
Basic Earnings Per Share (EPS)1
SCE $ 145 $ 164 $ (019)
EIX Parent amp Other (009) (007) (002)
Basic EPS $ 136 $ 157 $ (021)
Less Non-core Items
SCE2 $ (014) $ 002 $ (016)
EIX Parent amp Other3 mdash (001) 001
Total Non-core $ (014) $ 001 $ (015)
Core Earnings Per Share (EPS)
SCE $ 159 $ 162 $ (003)
EIX Parent amp Other (009) (006) (003)
Core EPS $ 150 $ 156 $ (006)
Key SCE EPS Drivers4
Higher revenue5 $ 012- CPUC revenue (002)- 2018 FERC Formula Rate settlement 010- Other FERC revenue 004
Higher OampM (021)Lower depreciation 002Higher net financing costs (004)Income taxes5 019Property and other taxes (001)Results prior to impact from share dilution $ 007Impact from share dilution (010)Total core drivers $ (003)Non-core items 2 (016)Total $ (019)
Key EIX EPS Drivers4
EIX parent and other mdash Higher interest expense and corporate expenses $ (005)EEG mdash Lower corporate expenses 001Impact from share dilution 001Total core drivers $ (003)Non-core items 3 001Total $ (002)
1 See Earnings Non-GAAP reconciliations and Use of Non-GAAP Financial Measures in Appendix2 Includes SCEs contributions to Wildfire Insurance Fund in third quarter 2019 and impact from the approval of the Revised San Onofre Settlement Agreement in the third quarter 2018 3 Loss on sale of SoCore Energy4 2019 EPS drivers are reported at a consistent share count of 3258 million (2019 QTD weighted-average shares outstanding is 3471 million)5 Includes $020 of tax benefits refunded to customersNote Diluted earnings were $135 and $157 per share for the three months ended September 30 2019 and 2018 respectively
43
1 See Earnings Non-GAAP reconciliations and Use of Non-GAAP Financial Measures in Appendix2 Impact of 2018 GRC final decision related to impairment of utility property plant and equipment changes in allocation of deferred tax re-measurement between customers and
shareholders SCErsquos contributions to the Wildfire Insurance Fund gain from sale of nuclear fuel and impact from the approval of the Revised San Onofre Settlement Agreement3 Loss on sale of SoCore Energy and impact of hypothetical liquidation at book value (HLBV) accounting method4 2019 EPS drivers are reported at a consistent share count of 3258 million (2019 YTD weighted-average shares outstanding is 3330 million)5 Test Year 2018 GRC true-up of $020 includes revenue of $(034) OampM of $006 depreciation of $024 interest expense of $(001) property and other taxes of $001 and income taxes of
$0246 Includes $018 of tax benefits refunded to customersNote Diluted earnings were $342 and $308 per share for the nine months ended September 30 2019 and 2018 respectively
Year to Date Earnings Summary
October 30 2019
YTD 2019
YTD 2018 Variance
Basic Earnings Per Share (EPS)1
SCE $ 365 $ 343 $ 022
EIX Parent amp Other (022) (034) 012
Basic EPS $ 343 $ 309 $ 034
Less Non-core Items
SCE2 $ (030) $ 002 $ (032)
EIX Parent amp Other3 mdash (014) 014
Total Non-core $ (030) $ (012) $ (018)
Core Earnings Per Share (EPS)
SCE $ 395 $ 341 $ 054
EIX Parent amp Other (022) (020) (002)
Core EPS $ 373 $ 321 $ 052
Key SCE EPS Drivers4
Test Year 2018 GRC true-up5 $ 020Higher revenue6 055
- CPUC revenue 032- 2018 FERC Formula Rate settlement 010- FERC and other operating revenue 013
Higher OampM (026)Lower depreciation 005Higher net financing costs (012)Income taxes6 021Results prior to impact from share dilution $ 063Impact from share dilution (009)Total core drivers $ 054Non-core items2 (032)Total $ 022
Key EIX EPS Drivers4
EIX parent and other mdash Higher interest expense and corporate expenses $ (007)EEG mdash Lower corporate expenses and lower losses at the competitive business 004Impact from share dilution 001Total core drivers $ (002)Non-core items3 014Total $ 012
44
SCE Annual Results of Operationsbull Earning activities ndash revenue authorized by CPUC and FERC to provide reasonable cost recovery and return on investmentbull Cost-recovery activities ndash CPUC- and FERC-authorized balancing accounts to recover specific project or program costs subject
to reasonableness review or compliance with upfront standards
($ millions)
2018 2017
Earnings Activities
Cost-Recovery Activities
Total Consolidated
Earnings Activities
Cost-Recovery Activities
Total Consolidated
Operating revenue $6560 $6051 $12611 $6611 $5643 $12254Purchased power and fuel mdash 5406 5406 mdash 4873 4873Operation and maintenance 1972 730 2702 1898 824 2722Wildfire-related claims net of recoveries 2669 mdash 2669 ― ― ―Depreciation and amortization 1867 mdash 1867 2032 mdash 2032Property and other taxes 392 mdash 392 372 mdash 372Impairment and other charges (12) mdash (12) 716 mdash 716Other operating income (7) mdash (7) (8) mdash (8)Total operating expenses 6881 6136 13017 5010 5697 10707Operating (loss) income (321) (85) (406) 1601 (54) 1547Interest expense (671) (2) (673) (588) (1) (589)Other income and expenses 107 87 194 93 55 148(Loss) income before income taxes (885) mdash (885) 1106 mdash 1106Income tax (benefit) expense (696) mdash (696) (30) mdash (30)Net (loss) income (189) mdash (189) 1136 mdash 1136Preferred and preference stock dividend
requirements 121 mdash 121 124 mdash 124
Net (loss) income available for common stock ($310) mdash ($310) $1012 mdash $1012Less Non-core items (1750) (481)Core Earnings $1440 $1493
Note See Use of Non-GAAP Financial Measures
October 30 2019 45
Reconciliation of EIX Basic Earnings Per Share Guidance to EIX Core Earnings Per Share Guidance
EPS Attributable to Edison International 2019
Low Midpoint High
SCE $483
EIX Parent amp Other (032)
Basic EPS1 $441 $451 $461
Non-Core Items
SCE23 (029) (029) (029)
EIX Parent amp Other mdash mdash mdash
Total Non-Core1 (029) (029) (029)
Core EPS
SCE $512
EIX Parent amp Other (032)
Core EPS1 $470 $480 $490
1 EPS is calculated on the assumed weighted-average share count for 2019 Please see 2019 EIX Core Earnings Guidance slide for more information 2 Includes impact of 2018 GRC final decision related to impairment of utility property plant and equipment changes in allocation of deferred tax re-measurement between
customers and shareholders and SCErsquos contributions to the Wildfire Insurance Fund3 Includes $001 per share as a result of share count dilution
October 30 2019
Earnings Per Share Non-GAAP Reconciliations
46
Earnings Non-GAAP Reconciliations
1 Impact of 2018 GRC final decision related to impairment of utility property plant and equipment changes in allocation of deferred tax re-measurement between customers and shareholders SCErsquos contributions to the Wildfire Insurance Fund gain from sale of nuclear fuel and impact from the approval of the Revised San Onofre Settlement Agreement
2 Loss on sale of SoCore Energy and impact of hypothetical liquidation at book value (HLBV) accounting method
($ millions)
Reconciliation of EIX GAAP Earnings to EIX Core Earnings
Earnings Attributable to Edison International Q32019
Q32018
YTD 2019
YTD 2018
SCE $503 $536 $1215 $1119
EIX Parent amp Other (32) (23) (74) (112)
Basic Earnings $471 $513 $1141 $1007
Non-Core Items
SCE 1 ($48) 7 ($99) 7
EIX Parent amp Other 2 mdash (4) mdash (46)
Total Non-Core ($48) $3 ($99) ($39)
Core Earnings
SCE $551 $529 $1314 $1112
EIX Parent amp Other (32) (19) (74) (66)
Core Earnings $519 $510 $1240 $1046
October 30 2019 47
EIX Core EPS Non-GAAP ReconciliationsReconciliation of Edison International Basic Earnings Per Share to Edison International Core Earnings Per Share
Note See Use of Non-GAAP Financial Measures
Earnings Per Share Attributable to Edison International 2018 2017
Basic EPS ($130) $173
Non-Core Items
SCE
Wildfire-related claims net of recoveries (560) mdash
Settlement of 1994 ndash 2006 California tax audits 020 mdash
Write down impairment and other as a result of Revised San Onofre Settlement Agreement
003 (138)
Re-measurement of deferred taxes as a result of Tax Reform mdash (010)
Edison International Parent and Other
Settlement of 1994 ndash 2006 California tax audits (004) mdash
Re-measurement of deferred taxes as a result of Tax Reform mdash (133)
Sale of SoCore Energy and other (014) 004
Discontinued operations
Settlement of 1994 ndash 2006 California tax audits 010 mdash
Less Total Non-Core Items (545) (277)
Core EPS $415 $450
October 30 2019 48
Use of Non-GAAP Financial MeasuresEdison Internationals earnings are prepared in accordance with generally accepted accounting principles used in the United States Management uses core earnings internally for financial planning and for analysis of performance Core earnings are also used when communicating with investors and analysts regarding Edison Internationals earnings results to facilitate comparisons of the Companys performance from period to period Core earnings are a non-GAAP financial measure and may not be comparable to those of other companies Core earnings (or losses) are defined as earnings or losses attributable to Edison International shareholders less income or loss from discontinued operations and income or loss from significant discrete items that management does not consider representative of ongoing earnings such as exit activities including sale of certain assets and other activities that are no longer continuing asset impairments and certain tax regulatory or legal settlements or proceedings
A reconciliation of Non-GAAP information to GAAP information is included either on the slide where the information appears or on another slide referenced in this presentation
EIX Investor Relations Contact
Sam Ramraj Vice President (626) 302-2540 samramrajedisonintlcom
Allison Bahen Principal Manager (626) 302-5493 allisonbahenedisonintlcom
October 30 2019 49
Business Update
Slide Number 2
Table of Contents
EIX Strategy Should Produce Long-Term Value
SCE Highlights
Slide Number 6
SCE Historical Rate Base and Core Earnings
SCE Capital Expenditure Forecast
SCE Rate Base Forecast
Slide Number 10
Californiarsquos GHG Emissions Overview
SCErsquos Pathway 2045 Highlights
Slide Number 13
Slide Number 14
Slide Number 15
SCE Key Regulatory Proceedings
Slide Number 17
Slide Number 18
CPUC and FERC Cost of Capital Summary
CPUC Cost of Capital (2013-2019)
SCE Distribution System Investments
Slide Number 22
Slide Number 23
SCE Large Transmission Projects
SCE Operational Excellence
Responding to Industry Change
Slide Number 27
2019 EIX Core Earnings Guidance
EIX Annual Dividends Per Share
Appendix
EIXrsquos 2018 Sustainability Report Highlights
Slide Number 32
SCE Historical Capital Expenditures
Credit Ratings Summary
Distribution Power Grid of the Future
SCE Customer Demand Trends
SCE Bundled Revenue Requirement
Slide Number 38
SCE Rates and Bills Comparison
Slide Number 40
Slide Number 41
Slide Number 42
Slide Number 43
Slide Number 44
Slide Number 45
SCE Annual Results of Operations
Slide Number 47
Earnings Non-GAAP Reconciliations
EIX Core EPS Non-GAAP Reconciliations
Use of Non-GAAP Financial Measures
US Average
$134
SCE
$95
-291
US Average
128
SCE
164
higher
28
Created on Mon 6 Jun 2016 1250 PM EST (1750 GMT)
Concept
1990
1991
1992
1993
1994
1995
1996
1997
1998
1999
2000
2001
2002
2003
2004
2005
2006
2007
2008
2009
2010
2011
2012
2013
2014
2015
2016
2017
2018
2019
2020
2021
2022
2023
2024
2025
2026
Consumer Price Index All-Urban
131
136
140
144
148
152
157
161
163
167
172
177
180
184
189
195
202
207
215
215
218
225
230
233
237
237
239
245
251
258
265
272
279
286
293
300
306
422
304
297
260
281
294
234
155
219
337
282
160
230
267
337
322
287
381
-032
164
314
208
147
161
012
105
236
253
265
265
264
254
251
249
234
227
SOUTHERN CALIFORNIA EDISON
System Average Rate Forecast
Source Matt Sheriff
(centkWh)
SCE System Average Rate
SAR CPI (old)
SAR CPI (current)
CPI Los Angeles-Long Beach-Anaheim CA
Consumer Price Index All-Urban
0
1990
97cent
97cent
97cent
593
30
1
1991
103cent
101cent
101cent
410
422
2
1992
106cent
104cent
105cent
361
304
3
1993
103cent
107cent
107cent
253
297
4
1994
105cent
110cent
109cent
137
260
5
1995
107cent
113cent
110cent
153
281
25
6
1996
101cent
116cent
112cent
183
294
7
1997
101cent
119cent
114cent
158
234
8
1998
96cent
121cent
116cent
144
155
9
1999
96cent
124cent
119cent
235
219
10
2000
96cent
128cent
122cent
330
337
20
11
2001
142cent
131cent
127cent
336
282
12
2002
142cent
134cent
130cent
277
160
13
2003
124cent
137cent
133cent
259
230
14
2004
122cent
140cent
138cent
334
267
15
2005
126cent
145cent
144cent
447
337
16
2006
147cent
150cent
150cent
427
322
17
2007
139cent
154cent
155cent
328
287
18
2008
137cent
160cent
161cent
353
381
19
2009
143cent
159cent
159cent
-080
-032
20
2010
143cent
162cent
161cent
120
164
10
21
2011
141cent
167cent
166cent
267
314
22
2012
143cent
170cent
169cent
203
208
23
2013
159cent
173cent
171cent
108
147
24
2014
167cent
176cent
173cent
135
161
25
2015
159cent
176cent
175cent
091
012
5
26
2016
148cent
178cent
178cent
189
105
27
2017
157cent
182cent
183cent
279
236
29
20
10
28
2018
160cent
187cent
190cent
381
253
SCE
17
26
11
29
2019
159cent
192cent
195cent
244
265
LA
24
25
20
30
2020
194cent
197cent
199cent
219
265
36
31
2021
199cent
202cent
203cent
227
266
25
49
Created on Wed 23 Jan 2019 1245 PM EST (1745 GMT)
Mnemonic
Long Label
Last Update
Start Date
End Date
Frequency
1970
1971
1972
1973
1974
1975
1976
1977
1978
1979
1980
1981
1982
1983
1984
1985
1986
1987
1988
1989
1990
1991
1992
1993
1994
1995
1996
1997
1998
1999
2000
2001
2002
2003
2004
2005
2006
2007
2008
2009
2010
2011
2012
2013
2014
2015
2016
2017
2018
2019
2020
2021
2022
2023
2024
2025
2026
2027
2028
2029
2030
2031
2032
2033
2034
2035
2036
2037
2038
2039
2040
2041
2042
2043
2044
2045
2046
2047
2048
CPILANGAFRSM1
Los Angeles-Long Beach-Anaheim CA (MSA) [2013 Definition] FIPS Code 31080 Consumer Price Index for All Urban Consumers (1982-84=100) IHS MARKIT ECONOMICS December 2018 Forecast Source Bureau of Labor Statistics End of Historical Data 2017
122718
1970
2048
ANNUAL
3868
4011
4139
4374
4825
5334
5683
6080
6526
7233
8372
9184
9734
9907
10360
10838
11193
11667
12206
12826
13587
14143
14654
15025
15231
15464
15748
15997
16227
16608
17155
17732
18223
18696
19320
20183
21044
21734
22501
22322
22589
23193
23665
23921
24243
24463
24925
25621
26598
27248
27844
28475
29132
29806
30500
31165
31832
32533
33254
33985
34744
35508
36279
37061
37854
38640
39440
40278
41145
42043
42963
43898
44852
45825
46816
47822
48857
49934
51047
371
320
568
1031
1055
655
698
733
1083
1575
971
599
177
458
461
328
423
462
508
593
410
361
253
137
153
183
158
144
235
330
336
277
259
334
447
427
328
353
-080
120
267
203
108
135
091
189
279
381
244
219
227
231
231
233
218
214
220
222
220
223
220
217
215
214
208
207
213
215
218
219
218
217
217
216
215
216
220
223
Date of Report
July 26 2019
July 29 2019
July 29 2019
Edison International
Corporate Outlook
BBBStable
Baa3Stable
BBB-Stable
Senior Unsecured
BBB-
Baa3
BBB-
Commercial Paper
A-2
P-3
F3
Southern California Edison
Corporate Outlook
BBBStable
Baa2Stable
BBB-Stable
First Mortgage Bonds
A-
A3
BBB+
Senior Unsecured
BBB
Baa2
BBB
Preferred Securities
BB+
Ba1
BB+
Commercial Paper
A-2
P-2
F3
SCE Operational Excellence
Top Quartilebull Safetybull Reliabilitybull Customer servicebull Cost efficiency
Optimizebull Capital productivitybull Purchased power costbull Digitization
High performing continuous improvement culture
Defining Excellence Measuring Excellence
bull Employee and public safety metrics
bull System performance and reliability (SAIDI and SAIFI)
bull Customer satisfaction calculation based on internal voice-of-customer surveys
bull OampM cost per customerbull Reduce system rate growth
with OampM purchased power cost reductions
Ongoing Operational Excellence
Efforts
October 30 2019 24
Responding to Industry ChangeLong-Term Industry Trends Strategy
bull The technology landscape is evolving at an unprecedented pace with innovation driving advances in cost and capabilities of distributed energy resources
bull Customer expectations are changing with increasing choices and alternatives a growing priority of sustainability objectives and flattening demand
bull The regulatory environment for utilities is complex increasingly supportive of new forms of competition but unable to keep pace with new business models
bull Policies both in California and globally are setting aggressive greenhouse gas reduction targets
SCE Strategybull Clean the power system by accelerating
the de-carbonization of electricity supplybull Help customers make cleaner energy
choices to support electrification and leverage flexible energy demand
bull Strengthen and modernize the grid by replacing aging infrastructure and deploying technology
bull Achieve operational and service excellence with top tier performance in safety reliability affordability and customer satisfaction
Beyond SCEbull Position Edison Energy as an independent
energy advisor and integrator for large commercial and industrial customers
bull Further clean energy and sustainability efforts in California through Edison Energy insights
October 30 2019 25
bull Energy is a significant risk large commercial and industrial customers face Edison Energy creates competitive advantage for market leaders by quantifying this risk and designing the portfolio solution to protect shareholder value threatened by complex energy policies increasing sustainability needs technological advancements and new products
bull Optimized energy solutions based on robust analytics of the customerrsquos energy portfolio in alignment with their goals and strategic objectives
bull Implementation of solutions through existing service lines or brokering with third parties
bull Edison International investment $83 million as of September 30 2019
Edison Energy
Edison Energy Summary
The Opportunity Trusted Advisor and Solution Integrator
Managed Portfolio Solution
Renewables amp Sustainability
Supply Solutions
Demand Solutions
Installations
October 30 2019 26
27
Total Rate Base $307 billion
bull FERC comprises ~20 of total
CPUC
Return on Equity (ROE)
103
Capital Structure2 48 equity
FERC
ROE3 112 with incentives(previously 105 with incentives)
Capital Structure Recorded capital structure 45 2019 average estimated equity
Other Items
Capital Market Activities
$49 billion of EIXSCE debt and equity issuances in addition to SCErsquos normal course debt financing of rate base
$468 $480
($033)($024)$041
$029
SCE 2019 EPSfrom Rate
Base Forecast
SCEVariances
2018 True-Ups
EIX Parentamp Other
EquityProgram WF FundFinancing
EIX 2019 CoreEPS Midpoint
Guidance
bull Financing and other$032
bull Z-factor advice letter approval $004
bull Energy efficiency $005
2019 Core Earnings Per Share Guidance ndashBuilding from SCE Rate Base
bull HoldCo operating expenses (1) cent per share per month
bull HoldCo debt issued $1 billion in 2019 ($400 million of issuance remaining)
bull EEG target breakeven run rate by year-end 2019
EIX 2019 Core EPS guidance range of $470 - $490 midpoint $009 higher than prior
Key Assumptions
Note See Earnings Per Share Non-GAAP Reconciliations and Use of Non-GAAP Financial Measures in Appendix All tax-affected information on this slide is based on our current combined statutory tax rate of approximately 28 Totals may not foot due to rounding
1 Reflects actual financing activity at SCE (August 1st debt offering) and EIX (July 30th equity offering) versus prior guidance based on assumption that financing would occur on September 10th
2 On February 28 2019 SCE filed an application with the CPUC for a waiver of compliance with this equity ratio requirement describing that while the wildfire-related charge accrued in the fourth quarter of 2018 caused its equity ratio to fall below 47 on a spot basis as of December 31 2018 SCE remains in compliance with the 48 equity ratio over the applicable 37-month average basis While the CPUC reviews the waiver application SCE is considered in compliance with the capital structure rules
3 SCErsquos April 11 2019 TO2019A filing to revise its ROE is pending review with the FERC and not reflected in guidance assumptions
2019 EIX Core Earnings Guidance
bull Test year 2018 GRC true-up $020
bull FERC ROE settlement (prior year)$009
bull Previously announced financing plan (debt and equity) ($018)
bull Update to financing plan based on actual results ($006)
bull Remaining previously disclosed equity plan $05 billion
1 2019 dividend annualized based on December 6 2018 declaration
Fifteen Consecutive Years of Dividend Growth
Target dividend growth within target payout ratio of 45-55 of SCErsquos earnings
1
October 30 2019 28
Appendix
October 30 2019 29
EIXrsquos 2018 Sustainability Report Highlights
Edison Energy is not the same company as Southern California Edison the utility and Edison Energy is not regulated by the California Public Utilities Commission Cumulative duration (in minutes) of sustained repair outages lasting longer than five minutes experienced by the average customer in a year (including major event days) In February 2019 the EIX board approved a $3 million donation to the Edison International Wildfire Assistance Fund to enhance community resiliency and wildfire prevention and
mitigation This affects the 2019 data year and is not reflected here
October 30 2019
ldquoAt Edison International we are leading the transformation of the electric power industry toward a clean energy future by focusing on opportunities in clean energy efficient electrification the grid of the future and customer choice As we pursue this vision sustainability remains at the core of who we are and what we dordquo ndash Pedro Pizarro Edison International CEO
bull Earnings not affected by variability of retail electricity salesbull Differences between amounts collected and authorized levels
either billed or refundedbull Promotes energy conservationbull Stabilizes revenues during economic cycles
Major Balancing Accountsbull Salesbull Fuel and Purchased powerbull Energy efficiencybull Pension expense
bull Cost-recovery related balancing accounts represented more than 59 of costs
bull Trigger mechanism for fuel and purchased power adjustments at 5 variance level
Advanced Long-TermProcurement Planning
bull Upfront contract approvals and prudency standards provide greater certainty of cost recovery (subject to compliance-related reasonableness review)
Forward-looking Ratemaking bull Forward and test year GRC with three-year rate cycle bull Separate cost of capital mechanism
October 30 2019 31
SCE Historical Capital Expenditures($ billions)
$40 $39
$35$38
$44
2014 2015 2016 2017 2018
October 30 2019 32
Credit Ratings Summary
Date of Report July 26 2019 July 29 2019 July 29 2019
Edison InternationalCorporate Outlook BBBStable Baa3Stable BBB-StableSenior Unsecured BBB- Baa3 BBB-Commercial Paper A-2 P-3 F3
Southern California EdisonCorporate Outlook BBBStable Baa2Stable BBB-StableFirst Mortgage Bonds A- A3 BBB+Senior Unsecured BBB Baa2 BBBPreferred Securities BB+ Ba1 BB+Commercial Paper A-2 P-2 F3
FitchMoodyrsquosSampP
October 30 2019 33
4
ampCalibriRegularFINANCIAL AND STATISTICAL REPORTampCalibriRegularampA
Distribution Power Grid of the Future
One-Way Electricity Flowbull System designed to distribute electricity
from large central generating plantsbull Voltage centrally maintainedbull Increasing integration of distributed
energy resourcesbull Limited situational awareness and
visualization tools for power grid operators
Renewable Generation Mandates
Subsidized Residential Solar
Limited Electric Vehicle Charging Infrastructure
Variable Two-Way Electricity Flowbull Distribution system at the center of the
power gridbull System designed to manage fluctuating
resources and customer demand bull Digital monitoring and control devices and
advanced communications systems to improve safety and reliability and integrate DERs
bull Improved data management and power grid operations and cyber risk mitigation
bull Integrated utility distribution with distributed energy resources planning
Maximize Distributed Resources and Electric Vehicle Adoptionbull Distribution power grid infrastructure
design supports customer choice and greater resiliency
Current State Future State
October 30 2019 34
SCE Customer Demand Trends
Note See Edison International Financial and Statistical Reports for 2017 for further information
Kilowatt-Hour Sales (millions of kWh) 2014 2015 2016 2017 2018
Residential 30027 30093 29579 30221 29865
Commercial 42004 42396 42189 42514 42369
Industrial 8392 7623 7162 6659 6786
Public authorities 4975 4795 4715 4711 4510
Agricultural and other 2019 1950 1803 1498 1745
Subtotal 87416 86857 85448 85602 85276
Resale 1308 1080 1794 1568 1867
Total Kilowatt-Hour Sales 88725 87937 87242 87170 87143
Total Number of Customers 5005401 5033330 5060528 5094818 5126985
Number of New Connections 29879 31653 38076 39621 39633
Area Peak Demand (MW) 23055 23079 23091 23508 23766
October 30 2019 35
SCE Bundled Revenue Requirement
Note Rates in effect as of July 26 2019 Represents bundled service which excludes Direct AccessCCA customers that do not receive generation services from SCE
SCE Systemwide Average Rate History (centkWh)
2010 2011 2012 2013 2014 2015 2016 2017 2018 2019
143 141 143 159 167 162 148 157 160 159
Fuel amp Purchased Power(47)
Distribution(38)
Transmission (8)
Generation(8)
Other (-1)
2019 Bundled Revenue
Requirement
$millions centkWh
Fuel amp Purchased Power ndash includes CDWR Bond Charge
4422 74
Distribution ndash poles wires substations service centers Edison SmartConnectreg
3628 61
Generation ndash owned generation investment and OampM 708 12
Transmission ndash greater than 220kV 789 13
Other ndash CPUC and legislative public purpose programs system reliability investments nuclear decommissioning and prior-year over collections
(116) (01)
Total Bundled Revenue Requirement ($millions) $9431
divide Bundled kWh (millions) 59396
= Bundled Systemwide Average Rate (centkWh) 159cent
October 30 2019 36
37
97cent
159cent
80cent
100cent
120cent
140cent
160cent
180cent
200cent
220cent
1990
1991
1992
1993
1994
1995
1996
1997
1998
1999
2000
2001
2002
2003
2004
2005
2006
2007
2008
2009
2010
2011
2012
2013
2014
2015
2016
2017
2018
2019
195cent
Rates reduced due to the implementation of 1) the SONGS Revised Settlement including NEIL insurance benefits 2) lower fuel amp purchased power costs and 3) a lower 2015 GRC revenue requirement that includes flow-through tax benefits
centkWh
System Average Rate Historical Growth
SCErsquos system average rate has grown less than inflation over the last 29 years
SCE System Average RateLos Angeles Area Inflation
Comparative System Average Rates
Delta to SCESCE 159cent --
PGampE 211cent1 33
SDGampE 246cent1 55
CAGR29-yr
(lsquo90-rsquo19)20-yr
(lsquo99-rsquo19)10-yr
(lsquo09-19)17 26 1124 25 20
Energy Crisis and return to normal
Higher gas price forecast post-Katrina leads to higher rates with subsequent refund of over collection
Delay in 2012 GRC leads to shorter ramp-up of rate increase
1 PGampE Advice 5644-E effective October 1 SDGampE Advice 3377-E effective June 1
October 30 2019
Data
SCE System Average Rate
1990199119921993199419951996199719981999200020012002200320042005200620072008200920102011201220132014201520162017201820199699999999999999310310610310510710110196969614214212412212614713913714314314114315916715940876786458386148350382761769171566871495475337116159CPI Los Angeles-Long Beach-Anaheim CA199019911992199319941995199619971998199920002001200220032004200520062007200820092010201120122013201420152016201720182019202096999999999999993100974239450441131046212585868498310726876840039228108738285083414611104041339548576811242695044160916114205839057899881158478900883218511856679342492612122475588812561061265926153091265513010279685966582133476140824337041379322865554462144095927379783561502417198233561515516495767909655160640840897938551593635512757601816127380397448466165581867639842851689511064769380217077830471050007173082233194307481746514628312063517794555998527898182917523920509811898939005269867419453007660169238SAR CPI (old)1990199119921993199419951996199719981999200020012002200320042005200620072008200920102011201220132014201520162017201820199699999999999999310108935518848128104164104853626311072574143759422111004139294598572113128515849244651164507302761853711917284265578923121016455131068581236705147011944127834109318192141314347216021390513353198545827113660054850437767140244467121649041449648574526591614963575483132515393112443397234159803525097292715929158237134114161898499904328691669815498437507617045100580396491729508329612907517573561579182243175943857388863061777863624593457518198880904395583186584452388557219152742489955948
195cent
CPI Workbook
image1png
129 ₵
164 ₵
US Average SCE
27 Higher
SCE Rates and Bills Comparison
SCErsquos average residential rates are above national averagebut residential bills are below national average due to lower usage
bull SCErsquos residential rates are above national average due in part to a cleaner fuel mix high cost of living and lower system load factor
bull SCErsquos residential customer usage is lower than the national average due to mild climate and higher energy efficiency appliance and building standards
bull Average monthly residential bills are lower than the national average as higher rate levels are more than offset by lower usage
Key FactorsKey Factors
Source EIAs Form 861M (formerly Form 826) Data Monthly Electric Utility Sales and Revenue Data for 12-Months Ending June 2019 httpswwweiagovelectricitydataeia861mindexhtml
2018-19 Average Residential Rates (centkWh)
2018-19 Average Residential Bills ($ per Month)
$128
$95
US Average SCE
26 Lower
October 30 2019 38
Sheet1
Sheet1
129 ₵
164 ₵
Sheet2
27 Higher
Sheet3
Sheet1
Sheet1
$128
Sheet2
26 Lower
Sheet3
bull Assembly Bill 1171 permits cities and counties and Joint Powers Agencies (JPAs) to act as CCAs to purchase and sell electricity on behalf of the utility customers within their jurisdiction
bull An Order Instituting Rulemaking (OIR R17-06-026) was opened on June 29 2017 to review revise and consider alternatives to the ldquoPower Charge Indifference Adjustmentrdquo or PCIA The PCIA allocates a proportional share of above-market costs of SCErsquos
energy procurement portfolio to departing load customers to ensure remaining bundled service customers are indifferent
October 11 2018 Commission decision changes PCIA methodology and has substantially addressed the historical subsidy to departing load that materialized when renewables market prices declined over the past 4 yearso Decision also established a Phase 2 which is addressing utility
portfolio optimization PCIA ldquopre-paymentrdquo options for entities and individual departing load customers and implementation of the ldquotrue-uprdquo process for Resource Adequacy (RA) and Renewable Energy Credits (RECs) costs
o A Phase 2 final decision on the benchmark and true-up process was approved on October 10 2019 with the other Phase 2 activities to continue into 2020
bull On February 8 2018 the Commission approved Resolution E-4907 requiring CCAs to demonstrate compliance with annual Resource Adequacy (RA) requirements prior to commencing operations
bull Existing Direct Access and CCA load is expected to be ~35 of SCErsquos total load by the end of 2019
Investor-Owned Utility (IOU)
Community Choice Aggregator (CCA)
Community Choice Aggregator (CCA) Overview
Approximately 40 of SCErsquos bundled service load could be part of a CCA or Direct Access by the end of 2020
October 30 2019 39
bull CPUC Order Instituting Ratemaking R 12-06-013 comprehensively reviewed residential rate structure including a future transition to Time of Use (TOU) rates In March 2018 SCE began to migrate 400000 residential customers to TOU rate structures
Remaining eligible residential customers to be migrated beginning October 2020bull July 2015 CPUC Decision D 15-07-001 includes Transition to 2 tiered rate structure coupled with Super-User Electric (SUE) Surcharge1
ldquoSuper User Electric Surchargerdquo for usage 400 above baseline (~3 of all usage)
Minimum bills of approximately $10month (applied to delivery revenue only)
January 2014 2019
100(60 of system usage)
219(3)
Tier 1100
Tier 2 101-400
SUEgt400
125(37)
Usage Level ( of Baseline)Usage Level ( of Baseline)
1 Completed in 20192 SCErsquos California Alternate Rates for Energy (CARE) program is an income-qualifying program that reduces energy bills for eligible customers by about 30
Winter Weekdays 8am-9pm Weekdays and Weekends 4-9pm
Off-Peak Summer Weekdays 11pm-8amWeekends All
Weekdays and Weekends All except 4-9pm
Winter Weekdays 9pm-8amWeekends All
Weekdays and Weekends 9pm-8am
Super Off-Peak Winter NA Weekdays and Weekends 8am-4pm
New Time-of-Use (TOU) Periods
bull On March 1 2019 SCE changed its basic TOU pricing period definition for the first time in over 30 years
bull Abundant mid-day renewable energy lowers prices from 8am-4pm (October - June)
bull Highest cost period is now 4pm-9pm all-days1
1 TOU pricing periods defined for non-residential customers per CPUC Decision D18-07-006 Similar residential TOU definitions were filed by SCE in A17-12-012
bull 998 solar projectsbull 320445 residential (71 of all residential customers) ndash 1756 MW bull 7333 non-residential ndash 977 MW bull Approximately 4775887 MWhyear generated
SCE Net Metering Statistics (919)
0
5
10
15
20
25
30
35
40
0
1000
2000
3000
4000
5000
6000
7000
2013 2014 2015 2016 2017 2018 2019
MW
Inst
alle
d
Num
ber o
f Sol
ar R
esid
entia
l Ins
talla
tions
Installations MW
July 1 2017bull Official start of NEM successor tariff customers are subject to
Mandatory TOU rate Non-bypassable charges Application fees
July 31 2017bull Residential customers who meet this deadline are grandfathered for
current TOU periods for maximum of 5 years (10 for non-residential)September 9 2017bull Smart Inverters required on all solar installationsJuly 25 2018bull Smart Inverters with Reactive Power Priority required on all solar
installationsNear Term Outlookbull Combination of a flatter tiered rate and the mandatory TOU NEM 20
rate structure has helped reduce the per customer cost shift further efforts to reduce the shift through new TOU pricing periods
bull Commission to revisit NEM Successor Tariff by July 2020 to evaluate the existing NEM tariffs and consider the development and adoption of successor tariffs
Key Dates
Third Quarter Earnings Summary
October 30 2019
Q32019
Q32018 Variance
Basic Earnings Per Share (EPS)1
SCE $ 145 $ 164 $ (019)
EIX Parent amp Other (009) (007) (002)
Basic EPS $ 136 $ 157 $ (021)
Less Non-core Items
SCE2 $ (014) $ 002 $ (016)
EIX Parent amp Other3 mdash (001) 001
Total Non-core $ (014) $ 001 $ (015)
Core Earnings Per Share (EPS)
SCE $ 159 $ 162 $ (003)
EIX Parent amp Other (009) (006) (003)
Core EPS $ 150 $ 156 $ (006)
Key SCE EPS Drivers4
Higher revenue5 $ 012- CPUC revenue (002)- 2018 FERC Formula Rate settlement 010- Other FERC revenue 004
Higher OampM (021)Lower depreciation 002Higher net financing costs (004)Income taxes5 019Property and other taxes (001)Results prior to impact from share dilution $ 007Impact from share dilution (010)Total core drivers $ (003)Non-core items 2 (016)Total $ (019)
Key EIX EPS Drivers4
EIX parent and other mdash Higher interest expense and corporate expenses $ (005)EEG mdash Lower corporate expenses 001Impact from share dilution 001Total core drivers $ (003)Non-core items 3 001Total $ (002)
1 See Earnings Non-GAAP reconciliations and Use of Non-GAAP Financial Measures in Appendix2 Includes SCEs contributions to Wildfire Insurance Fund in third quarter 2019 and impact from the approval of the Revised San Onofre Settlement Agreement in the third quarter 2018 3 Loss on sale of SoCore Energy4 2019 EPS drivers are reported at a consistent share count of 3258 million (2019 QTD weighted-average shares outstanding is 3471 million)5 Includes $020 of tax benefits refunded to customersNote Diluted earnings were $135 and $157 per share for the three months ended September 30 2019 and 2018 respectively
43
1 See Earnings Non-GAAP reconciliations and Use of Non-GAAP Financial Measures in Appendix2 Impact of 2018 GRC final decision related to impairment of utility property plant and equipment changes in allocation of deferred tax re-measurement between customers and
shareholders SCErsquos contributions to the Wildfire Insurance Fund gain from sale of nuclear fuel and impact from the approval of the Revised San Onofre Settlement Agreement3 Loss on sale of SoCore Energy and impact of hypothetical liquidation at book value (HLBV) accounting method4 2019 EPS drivers are reported at a consistent share count of 3258 million (2019 YTD weighted-average shares outstanding is 3330 million)5 Test Year 2018 GRC true-up of $020 includes revenue of $(034) OampM of $006 depreciation of $024 interest expense of $(001) property and other taxes of $001 and income taxes of
$0246 Includes $018 of tax benefits refunded to customersNote Diluted earnings were $342 and $308 per share for the nine months ended September 30 2019 and 2018 respectively
Year to Date Earnings Summary
October 30 2019
YTD 2019
YTD 2018 Variance
Basic Earnings Per Share (EPS)1
SCE $ 365 $ 343 $ 022
EIX Parent amp Other (022) (034) 012
Basic EPS $ 343 $ 309 $ 034
Less Non-core Items
SCE2 $ (030) $ 002 $ (032)
EIX Parent amp Other3 mdash (014) 014
Total Non-core $ (030) $ (012) $ (018)
Core Earnings Per Share (EPS)
SCE $ 395 $ 341 $ 054
EIX Parent amp Other (022) (020) (002)
Core EPS $ 373 $ 321 $ 052
Key SCE EPS Drivers4
Test Year 2018 GRC true-up5 $ 020Higher revenue6 055
- CPUC revenue 032- 2018 FERC Formula Rate settlement 010- FERC and other operating revenue 013
Higher OampM (026)Lower depreciation 005Higher net financing costs (012)Income taxes6 021Results prior to impact from share dilution $ 063Impact from share dilution (009)Total core drivers $ 054Non-core items2 (032)Total $ 022
Key EIX EPS Drivers4
EIX parent and other mdash Higher interest expense and corporate expenses $ (007)EEG mdash Lower corporate expenses and lower losses at the competitive business 004Impact from share dilution 001Total core drivers $ (002)Non-core items3 014Total $ 012
44
SCE Annual Results of Operationsbull Earning activities ndash revenue authorized by CPUC and FERC to provide reasonable cost recovery and return on investmentbull Cost-recovery activities ndash CPUC- and FERC-authorized balancing accounts to recover specific project or program costs subject
to reasonableness review or compliance with upfront standards
($ millions)
2018 2017
Earnings Activities
Cost-Recovery Activities
Total Consolidated
Earnings Activities
Cost-Recovery Activities
Total Consolidated
Operating revenue $6560 $6051 $12611 $6611 $5643 $12254Purchased power and fuel mdash 5406 5406 mdash 4873 4873Operation and maintenance 1972 730 2702 1898 824 2722Wildfire-related claims net of recoveries 2669 mdash 2669 ― ― ―Depreciation and amortization 1867 mdash 1867 2032 mdash 2032Property and other taxes 392 mdash 392 372 mdash 372Impairment and other charges (12) mdash (12) 716 mdash 716Other operating income (7) mdash (7) (8) mdash (8)Total operating expenses 6881 6136 13017 5010 5697 10707Operating (loss) income (321) (85) (406) 1601 (54) 1547Interest expense (671) (2) (673) (588) (1) (589)Other income and expenses 107 87 194 93 55 148(Loss) income before income taxes (885) mdash (885) 1106 mdash 1106Income tax (benefit) expense (696) mdash (696) (30) mdash (30)Net (loss) income (189) mdash (189) 1136 mdash 1136Preferred and preference stock dividend
requirements 121 mdash 121 124 mdash 124
Net (loss) income available for common stock ($310) mdash ($310) $1012 mdash $1012Less Non-core items (1750) (481)Core Earnings $1440 $1493
Note See Use of Non-GAAP Financial Measures
October 30 2019 45
Reconciliation of EIX Basic Earnings Per Share Guidance to EIX Core Earnings Per Share Guidance
EPS Attributable to Edison International 2019
Low Midpoint High
SCE $483
EIX Parent amp Other (032)
Basic EPS1 $441 $451 $461
Non-Core Items
SCE23 (029) (029) (029)
EIX Parent amp Other mdash mdash mdash
Total Non-Core1 (029) (029) (029)
Core EPS
SCE $512
EIX Parent amp Other (032)
Core EPS1 $470 $480 $490
1 EPS is calculated on the assumed weighted-average share count for 2019 Please see 2019 EIX Core Earnings Guidance slide for more information 2 Includes impact of 2018 GRC final decision related to impairment of utility property plant and equipment changes in allocation of deferred tax re-measurement between
customers and shareholders and SCErsquos contributions to the Wildfire Insurance Fund3 Includes $001 per share as a result of share count dilution
October 30 2019
Earnings Per Share Non-GAAP Reconciliations
46
Earnings Non-GAAP Reconciliations
1 Impact of 2018 GRC final decision related to impairment of utility property plant and equipment changes in allocation of deferred tax re-measurement between customers and shareholders SCErsquos contributions to the Wildfire Insurance Fund gain from sale of nuclear fuel and impact from the approval of the Revised San Onofre Settlement Agreement
2 Loss on sale of SoCore Energy and impact of hypothetical liquidation at book value (HLBV) accounting method
($ millions)
Reconciliation of EIX GAAP Earnings to EIX Core Earnings
Earnings Attributable to Edison International Q32019
Q32018
YTD 2019
YTD 2018
SCE $503 $536 $1215 $1119
EIX Parent amp Other (32) (23) (74) (112)
Basic Earnings $471 $513 $1141 $1007
Non-Core Items
SCE 1 ($48) 7 ($99) 7
EIX Parent amp Other 2 mdash (4) mdash (46)
Total Non-Core ($48) $3 ($99) ($39)
Core Earnings
SCE $551 $529 $1314 $1112
EIX Parent amp Other (32) (19) (74) (66)
Core Earnings $519 $510 $1240 $1046
October 30 2019 47
EIX Core EPS Non-GAAP ReconciliationsReconciliation of Edison International Basic Earnings Per Share to Edison International Core Earnings Per Share
Note See Use of Non-GAAP Financial Measures
Earnings Per Share Attributable to Edison International 2018 2017
Basic EPS ($130) $173
Non-Core Items
SCE
Wildfire-related claims net of recoveries (560) mdash
Settlement of 1994 ndash 2006 California tax audits 020 mdash
Write down impairment and other as a result of Revised San Onofre Settlement Agreement
003 (138)
Re-measurement of deferred taxes as a result of Tax Reform mdash (010)
Edison International Parent and Other
Settlement of 1994 ndash 2006 California tax audits (004) mdash
Re-measurement of deferred taxes as a result of Tax Reform mdash (133)
Sale of SoCore Energy and other (014) 004
Discontinued operations
Settlement of 1994 ndash 2006 California tax audits 010 mdash
Less Total Non-Core Items (545) (277)
Core EPS $415 $450
October 30 2019 48
Use of Non-GAAP Financial MeasuresEdison Internationals earnings are prepared in accordance with generally accepted accounting principles used in the United States Management uses core earnings internally for financial planning and for analysis of performance Core earnings are also used when communicating with investors and analysts regarding Edison Internationals earnings results to facilitate comparisons of the Companys performance from period to period Core earnings are a non-GAAP financial measure and may not be comparable to those of other companies Core earnings (or losses) are defined as earnings or losses attributable to Edison International shareholders less income or loss from discontinued operations and income or loss from significant discrete items that management does not consider representative of ongoing earnings such as exit activities including sale of certain assets and other activities that are no longer continuing asset impairments and certain tax regulatory or legal settlements or proceedings
A reconciliation of Non-GAAP information to GAAP information is included either on the slide where the information appears or on another slide referenced in this presentation
EIX Investor Relations Contact
Sam Ramraj Vice President (626) 302-2540 samramrajedisonintlcom
Allison Bahen Principal Manager (626) 302-5493 allisonbahenedisonintlcom
October 30 2019 49
Business Update
Slide Number 2
Table of Contents
EIX Strategy Should Produce Long-Term Value
SCE Highlights
Slide Number 6
SCE Historical Rate Base and Core Earnings
SCE Capital Expenditure Forecast
SCE Rate Base Forecast
Slide Number 10
Californiarsquos GHG Emissions Overview
SCErsquos Pathway 2045 Highlights
Slide Number 13
Slide Number 14
Slide Number 15
SCE Key Regulatory Proceedings
Slide Number 17
Slide Number 18
CPUC and FERC Cost of Capital Summary
CPUC Cost of Capital (2013-2019)
SCE Distribution System Investments
Slide Number 22
Slide Number 23
SCE Large Transmission Projects
SCE Operational Excellence
Responding to Industry Change
Slide Number 27
2019 EIX Core Earnings Guidance
EIX Annual Dividends Per Share
Appendix
EIXrsquos 2018 Sustainability Report Highlights
Slide Number 32
SCE Historical Capital Expenditures
Credit Ratings Summary
Distribution Power Grid of the Future
SCE Customer Demand Trends
SCE Bundled Revenue Requirement
Slide Number 38
SCE Rates and Bills Comparison
Slide Number 40
Slide Number 41
Slide Number 42
Slide Number 43
Slide Number 44
Slide Number 45
SCE Annual Results of Operations
Slide Number 47
Earnings Non-GAAP Reconciliations
EIX Core EPS Non-GAAP Reconciliations
Use of Non-GAAP Financial Measures
US Average
$134
SCE
$95
-291
US Average
128
SCE
164
higher
28
Created on Mon 6 Jun 2016 1250 PM EST (1750 GMT)
Concept
1990
1991
1992
1993
1994
1995
1996
1997
1998
1999
2000
2001
2002
2003
2004
2005
2006
2007
2008
2009
2010
2011
2012
2013
2014
2015
2016
2017
2018
2019
2020
2021
2022
2023
2024
2025
2026
Consumer Price Index All-Urban
131
136
140
144
148
152
157
161
163
167
172
177
180
184
189
195
202
207
215
215
218
225
230
233
237
237
239
245
251
258
265
272
279
286
293
300
306
422
304
297
260
281
294
234
155
219
337
282
160
230
267
337
322
287
381
-032
164
314
208
147
161
012
105
236
253
265
265
264
254
251
249
234
227
SOUTHERN CALIFORNIA EDISON
System Average Rate Forecast
Source Matt Sheriff
(centkWh)
SCE System Average Rate
SAR CPI (old)
SAR CPI (current)
CPI Los Angeles-Long Beach-Anaheim CA
Consumer Price Index All-Urban
0
1990
97cent
97cent
97cent
593
30
1
1991
103cent
101cent
101cent
410
422
2
1992
106cent
104cent
105cent
361
304
3
1993
103cent
107cent
107cent
253
297
4
1994
105cent
110cent
109cent
137
260
5
1995
107cent
113cent
110cent
153
281
25
6
1996
101cent
116cent
112cent
183
294
7
1997
101cent
119cent
114cent
158
234
8
1998
96cent
121cent
116cent
144
155
9
1999
96cent
124cent
119cent
235
219
10
2000
96cent
128cent
122cent
330
337
20
11
2001
142cent
131cent
127cent
336
282
12
2002
142cent
134cent
130cent
277
160
13
2003
124cent
137cent
133cent
259
230
14
2004
122cent
140cent
138cent
334
267
15
2005
126cent
145cent
144cent
447
337
16
2006
147cent
150cent
150cent
427
322
17
2007
139cent
154cent
155cent
328
287
18
2008
137cent
160cent
161cent
353
381
19
2009
143cent
159cent
159cent
-080
-032
20
2010
143cent
162cent
161cent
120
164
10
21
2011
141cent
167cent
166cent
267
314
22
2012
143cent
170cent
169cent
203
208
23
2013
159cent
173cent
171cent
108
147
24
2014
167cent
176cent
173cent
135
161
25
2015
159cent
176cent
175cent
091
012
5
26
2016
148cent
178cent
178cent
189
105
27
2017
157cent
182cent
183cent
279
236
29
20
10
28
2018
160cent
187cent
190cent
381
253
SCE
17
26
11
29
2019
159cent
192cent
195cent
244
265
LA
24
25
20
30
2020
194cent
197cent
199cent
219
265
36
31
2021
199cent
202cent
203cent
227
266
25
49
Created on Wed 23 Jan 2019 1245 PM EST (1745 GMT)
Mnemonic
Long Label
Last Update
Start Date
End Date
Frequency
1970
1971
1972
1973
1974
1975
1976
1977
1978
1979
1980
1981
1982
1983
1984
1985
1986
1987
1988
1989
1990
1991
1992
1993
1994
1995
1996
1997
1998
1999
2000
2001
2002
2003
2004
2005
2006
2007
2008
2009
2010
2011
2012
2013
2014
2015
2016
2017
2018
2019
2020
2021
2022
2023
2024
2025
2026
2027
2028
2029
2030
2031
2032
2033
2034
2035
2036
2037
2038
2039
2040
2041
2042
2043
2044
2045
2046
2047
2048
CPILANGAFRSM1
Los Angeles-Long Beach-Anaheim CA (MSA) [2013 Definition] FIPS Code 31080 Consumer Price Index for All Urban Consumers (1982-84=100) IHS MARKIT ECONOMICS December 2018 Forecast Source Bureau of Labor Statistics End of Historical Data 2017
122718
1970
2048
ANNUAL
3868
4011
4139
4374
4825
5334
5683
6080
6526
7233
8372
9184
9734
9907
10360
10838
11193
11667
12206
12826
13587
14143
14654
15025
15231
15464
15748
15997
16227
16608
17155
17732
18223
18696
19320
20183
21044
21734
22501
22322
22589
23193
23665
23921
24243
24463
24925
25621
26598
27248
27844
28475
29132
29806
30500
31165
31832
32533
33254
33985
34744
35508
36279
37061
37854
38640
39440
40278
41145
42043
42963
43898
44852
45825
46816
47822
48857
49934
51047
371
320
568
1031
1055
655
698
733
1083
1575
971
599
177
458
461
328
423
462
508
593
410
361
253
137
153
183
158
144
235
330
336
277
259
334
447
427
328
353
-080
120
267
203
108
135
091
189
279
381
244
219
227
231
231
233
218
214
220
222
220
223
220
217
215
214
208
207
213
215
218
219
218
217
217
216
215
216
220
223
Date of Report
July 26 2019
July 29 2019
July 29 2019
Edison International
Corporate Outlook
BBBStable
Baa3Stable
BBB-Stable
Senior Unsecured
BBB-
Baa3
BBB-
Commercial Paper
A-2
P-3
F3
Southern California Edison
Corporate Outlook
BBBStable
Baa2Stable
BBB-Stable
First Mortgage Bonds
A-
A3
BBB+
Senior Unsecured
BBB
Baa2
BBB
Preferred Securities
BB+
Ba1
BB+
Commercial Paper
A-2
P-2
F3
27
Total Rate Base $307 billion
bull FERC comprises ~20 of total
CPUC
Return on Equity (ROE)
103
Capital Structure2 48 equity
FERC
ROE3 112 with incentives(previously 105 with incentives)
Capital Structure Recorded capital structure 45 2019 average estimated equity
Other Items
Capital Market Activities
$49 billion of EIXSCE debt and equity issuances in addition to SCErsquos normal course debt financing of rate base
$468 $480
($033)($024)$041
$029
SCE 2019 EPSfrom Rate
Base Forecast
SCEVariances
2018 True-Ups
EIX Parentamp Other
EquityProgram WF FundFinancing
EIX 2019 CoreEPS Midpoint
Guidance
bull Financing and other$032
bull Z-factor advice letter approval $004
bull Energy efficiency $005
2019 Core Earnings Per Share Guidance ndashBuilding from SCE Rate Base
bull HoldCo operating expenses (1) cent per share per month
bull HoldCo debt issued $1 billion in 2019 ($400 million of issuance remaining)
bull EEG target breakeven run rate by year-end 2019
EIX 2019 Core EPS guidance range of $470 - $490 midpoint $009 higher than prior
Key Assumptions
Note See Earnings Per Share Non-GAAP Reconciliations and Use of Non-GAAP Financial Measures in Appendix All tax-affected information on this slide is based on our current combined statutory tax rate of approximately 28 Totals may not foot due to rounding
1 Reflects actual financing activity at SCE (August 1st debt offering) and EIX (July 30th equity offering) versus prior guidance based on assumption that financing would occur on September 10th
2 On February 28 2019 SCE filed an application with the CPUC for a waiver of compliance with this equity ratio requirement describing that while the wildfire-related charge accrued in the fourth quarter of 2018 caused its equity ratio to fall below 47 on a spot basis as of December 31 2018 SCE remains in compliance with the 48 equity ratio over the applicable 37-month average basis While the CPUC reviews the waiver application SCE is considered in compliance with the capital structure rules
3 SCErsquos April 11 2019 TO2019A filing to revise its ROE is pending review with the FERC and not reflected in guidance assumptions
2019 EIX Core Earnings Guidance
bull Test year 2018 GRC true-up $020
bull FERC ROE settlement (prior year)$009
bull Previously announced financing plan (debt and equity) ($018)
bull Update to financing plan based on actual results ($006)
bull Remaining previously disclosed equity plan $05 billion
1 2019 dividend annualized based on December 6 2018 declaration
Fifteen Consecutive Years of Dividend Growth
Target dividend growth within target payout ratio of 45-55 of SCErsquos earnings
1
October 30 2019 28
Appendix
October 30 2019 29
EIXrsquos 2018 Sustainability Report Highlights
Edison Energy is not the same company as Southern California Edison the utility and Edison Energy is not regulated by the California Public Utilities Commission Cumulative duration (in minutes) of sustained repair outages lasting longer than five minutes experienced by the average customer in a year (including major event days) In February 2019 the EIX board approved a $3 million donation to the Edison International Wildfire Assistance Fund to enhance community resiliency and wildfire prevention and
mitigation This affects the 2019 data year and is not reflected here
October 30 2019
ldquoAt Edison International we are leading the transformation of the electric power industry toward a clean energy future by focusing on opportunities in clean energy efficient electrification the grid of the future and customer choice As we pursue this vision sustainability remains at the core of who we are and what we dordquo ndash Pedro Pizarro Edison International CEO
bull Earnings not affected by variability of retail electricity salesbull Differences between amounts collected and authorized levels
either billed or refundedbull Promotes energy conservationbull Stabilizes revenues during economic cycles
Major Balancing Accountsbull Salesbull Fuel and Purchased powerbull Energy efficiencybull Pension expense
bull Cost-recovery related balancing accounts represented more than 59 of costs
bull Trigger mechanism for fuel and purchased power adjustments at 5 variance level
Advanced Long-TermProcurement Planning
bull Upfront contract approvals and prudency standards provide greater certainty of cost recovery (subject to compliance-related reasonableness review)
Forward-looking Ratemaking bull Forward and test year GRC with three-year rate cycle bull Separate cost of capital mechanism
October 30 2019 31
SCE Historical Capital Expenditures($ billions)
$40 $39
$35$38
$44
2014 2015 2016 2017 2018
October 30 2019 32
Credit Ratings Summary
Date of Report July 26 2019 July 29 2019 July 29 2019
Edison InternationalCorporate Outlook BBBStable Baa3Stable BBB-StableSenior Unsecured BBB- Baa3 BBB-Commercial Paper A-2 P-3 F3
Southern California EdisonCorporate Outlook BBBStable Baa2Stable BBB-StableFirst Mortgage Bonds A- A3 BBB+Senior Unsecured BBB Baa2 BBBPreferred Securities BB+ Ba1 BB+Commercial Paper A-2 P-2 F3
FitchMoodyrsquosSampP
October 30 2019 33
4
ampCalibriRegularFINANCIAL AND STATISTICAL REPORTampCalibriRegularampA
Distribution Power Grid of the Future
One-Way Electricity Flowbull System designed to distribute electricity
from large central generating plantsbull Voltage centrally maintainedbull Increasing integration of distributed
energy resourcesbull Limited situational awareness and
visualization tools for power grid operators
Renewable Generation Mandates
Subsidized Residential Solar
Limited Electric Vehicle Charging Infrastructure
Variable Two-Way Electricity Flowbull Distribution system at the center of the
power gridbull System designed to manage fluctuating
resources and customer demand bull Digital monitoring and control devices and
advanced communications systems to improve safety and reliability and integrate DERs
bull Improved data management and power grid operations and cyber risk mitigation
bull Integrated utility distribution with distributed energy resources planning
Maximize Distributed Resources and Electric Vehicle Adoptionbull Distribution power grid infrastructure
design supports customer choice and greater resiliency
Current State Future State
October 30 2019 34
SCE Customer Demand Trends
Note See Edison International Financial and Statistical Reports for 2017 for further information
Kilowatt-Hour Sales (millions of kWh) 2014 2015 2016 2017 2018
Residential 30027 30093 29579 30221 29865
Commercial 42004 42396 42189 42514 42369
Industrial 8392 7623 7162 6659 6786
Public authorities 4975 4795 4715 4711 4510
Agricultural and other 2019 1950 1803 1498 1745
Subtotal 87416 86857 85448 85602 85276
Resale 1308 1080 1794 1568 1867
Total Kilowatt-Hour Sales 88725 87937 87242 87170 87143
Total Number of Customers 5005401 5033330 5060528 5094818 5126985
Number of New Connections 29879 31653 38076 39621 39633
Area Peak Demand (MW) 23055 23079 23091 23508 23766
October 30 2019 35
SCE Bundled Revenue Requirement
Note Rates in effect as of July 26 2019 Represents bundled service which excludes Direct AccessCCA customers that do not receive generation services from SCE
SCE Systemwide Average Rate History (centkWh)
2010 2011 2012 2013 2014 2015 2016 2017 2018 2019
143 141 143 159 167 162 148 157 160 159
Fuel amp Purchased Power(47)
Distribution(38)
Transmission (8)
Generation(8)
Other (-1)
2019 Bundled Revenue
Requirement
$millions centkWh
Fuel amp Purchased Power ndash includes CDWR Bond Charge
4422 74
Distribution ndash poles wires substations service centers Edison SmartConnectreg
3628 61
Generation ndash owned generation investment and OampM 708 12
Transmission ndash greater than 220kV 789 13
Other ndash CPUC and legislative public purpose programs system reliability investments nuclear decommissioning and prior-year over collections
(116) (01)
Total Bundled Revenue Requirement ($millions) $9431
divide Bundled kWh (millions) 59396
= Bundled Systemwide Average Rate (centkWh) 159cent
October 30 2019 36
37
97cent
159cent
80cent
100cent
120cent
140cent
160cent
180cent
200cent
220cent
1990
1991
1992
1993
1994
1995
1996
1997
1998
1999
2000
2001
2002
2003
2004
2005
2006
2007
2008
2009
2010
2011
2012
2013
2014
2015
2016
2017
2018
2019
195cent
Rates reduced due to the implementation of 1) the SONGS Revised Settlement including NEIL insurance benefits 2) lower fuel amp purchased power costs and 3) a lower 2015 GRC revenue requirement that includes flow-through tax benefits
centkWh
System Average Rate Historical Growth
SCErsquos system average rate has grown less than inflation over the last 29 years
SCE System Average RateLos Angeles Area Inflation
Comparative System Average Rates
Delta to SCESCE 159cent --
PGampE 211cent1 33
SDGampE 246cent1 55
CAGR29-yr
(lsquo90-rsquo19)20-yr
(lsquo99-rsquo19)10-yr
(lsquo09-19)17 26 1124 25 20
Energy Crisis and return to normal
Higher gas price forecast post-Katrina leads to higher rates with subsequent refund of over collection
Delay in 2012 GRC leads to shorter ramp-up of rate increase
1 PGampE Advice 5644-E effective October 1 SDGampE Advice 3377-E effective June 1
October 30 2019
Data
SCE System Average Rate
1990199119921993199419951996199719981999200020012002200320042005200620072008200920102011201220132014201520162017201820199699999999999999310310610310510710110196969614214212412212614713913714314314114315916715940876786458386148350382761769171566871495475337116159CPI Los Angeles-Long Beach-Anaheim CA199019911992199319941995199619971998199920002001200220032004200520062007200820092010201120122013201420152016201720182019202096999999999999993100974239450441131046212585868498310726876840039228108738285083414611104041339548576811242695044160916114205839057899881158478900883218511856679342492612122475588812561061265926153091265513010279685966582133476140824337041379322865554462144095927379783561502417198233561515516495767909655160640840897938551593635512757601816127380397448466165581867639842851689511064769380217077830471050007173082233194307481746514628312063517794555998527898182917523920509811898939005269867419453007660169238SAR CPI (old)1990199119921993199419951996199719981999200020012002200320042005200620072008200920102011201220132014201520162017201820199699999999999999310108935518848128104164104853626311072574143759422111004139294598572113128515849244651164507302761853711917284265578923121016455131068581236705147011944127834109318192141314347216021390513353198545827113660054850437767140244467121649041449648574526591614963575483132515393112443397234159803525097292715929158237134114161898499904328691669815498437507617045100580396491729508329612907517573561579182243175943857388863061777863624593457518198880904395583186584452388557219152742489955948
195cent
CPI Workbook
image1png
129 ₵
164 ₵
US Average SCE
27 Higher
SCE Rates and Bills Comparison
SCErsquos average residential rates are above national averagebut residential bills are below national average due to lower usage
bull SCErsquos residential rates are above national average due in part to a cleaner fuel mix high cost of living and lower system load factor
bull SCErsquos residential customer usage is lower than the national average due to mild climate and higher energy efficiency appliance and building standards
bull Average monthly residential bills are lower than the national average as higher rate levels are more than offset by lower usage
Key FactorsKey Factors
Source EIAs Form 861M (formerly Form 826) Data Monthly Electric Utility Sales and Revenue Data for 12-Months Ending June 2019 httpswwweiagovelectricitydataeia861mindexhtml
2018-19 Average Residential Rates (centkWh)
2018-19 Average Residential Bills ($ per Month)
$128
$95
US Average SCE
26 Lower
October 30 2019 38
Sheet1
Sheet1
129 ₵
164 ₵
Sheet2
27 Higher
Sheet3
Sheet1
Sheet1
$128
Sheet2
26 Lower
Sheet3
bull Assembly Bill 1171 permits cities and counties and Joint Powers Agencies (JPAs) to act as CCAs to purchase and sell electricity on behalf of the utility customers within their jurisdiction
bull An Order Instituting Rulemaking (OIR R17-06-026) was opened on June 29 2017 to review revise and consider alternatives to the ldquoPower Charge Indifference Adjustmentrdquo or PCIA The PCIA allocates a proportional share of above-market costs of SCErsquos
energy procurement portfolio to departing load customers to ensure remaining bundled service customers are indifferent
October 11 2018 Commission decision changes PCIA methodology and has substantially addressed the historical subsidy to departing load that materialized when renewables market prices declined over the past 4 yearso Decision also established a Phase 2 which is addressing utility
portfolio optimization PCIA ldquopre-paymentrdquo options for entities and individual departing load customers and implementation of the ldquotrue-uprdquo process for Resource Adequacy (RA) and Renewable Energy Credits (RECs) costs
o A Phase 2 final decision on the benchmark and true-up process was approved on October 10 2019 with the other Phase 2 activities to continue into 2020
bull On February 8 2018 the Commission approved Resolution E-4907 requiring CCAs to demonstrate compliance with annual Resource Adequacy (RA) requirements prior to commencing operations
bull Existing Direct Access and CCA load is expected to be ~35 of SCErsquos total load by the end of 2019
Investor-Owned Utility (IOU)
Community Choice Aggregator (CCA)
Community Choice Aggregator (CCA) Overview
Approximately 40 of SCErsquos bundled service load could be part of a CCA or Direct Access by the end of 2020
October 30 2019 39
bull CPUC Order Instituting Ratemaking R 12-06-013 comprehensively reviewed residential rate structure including a future transition to Time of Use (TOU) rates In March 2018 SCE began to migrate 400000 residential customers to TOU rate structures
Remaining eligible residential customers to be migrated beginning October 2020bull July 2015 CPUC Decision D 15-07-001 includes Transition to 2 tiered rate structure coupled with Super-User Electric (SUE) Surcharge1
ldquoSuper User Electric Surchargerdquo for usage 400 above baseline (~3 of all usage)
Minimum bills of approximately $10month (applied to delivery revenue only)
January 2014 2019
100(60 of system usage)
219(3)
Tier 1100
Tier 2 101-400
SUEgt400
125(37)
Usage Level ( of Baseline)Usage Level ( of Baseline)
1 Completed in 20192 SCErsquos California Alternate Rates for Energy (CARE) program is an income-qualifying program that reduces energy bills for eligible customers by about 30
Winter Weekdays 8am-9pm Weekdays and Weekends 4-9pm
Off-Peak Summer Weekdays 11pm-8amWeekends All
Weekdays and Weekends All except 4-9pm
Winter Weekdays 9pm-8amWeekends All
Weekdays and Weekends 9pm-8am
Super Off-Peak Winter NA Weekdays and Weekends 8am-4pm
New Time-of-Use (TOU) Periods
bull On March 1 2019 SCE changed its basic TOU pricing period definition for the first time in over 30 years
bull Abundant mid-day renewable energy lowers prices from 8am-4pm (October - June)
bull Highest cost period is now 4pm-9pm all-days1
1 TOU pricing periods defined for non-residential customers per CPUC Decision D18-07-006 Similar residential TOU definitions were filed by SCE in A17-12-012
bull 998 solar projectsbull 320445 residential (71 of all residential customers) ndash 1756 MW bull 7333 non-residential ndash 977 MW bull Approximately 4775887 MWhyear generated
SCE Net Metering Statistics (919)
0
5
10
15
20
25
30
35
40
0
1000
2000
3000
4000
5000
6000
7000
2013 2014 2015 2016 2017 2018 2019
MW
Inst
alle
d
Num
ber o
f Sol
ar R
esid
entia
l Ins
talla
tions
Installations MW
July 1 2017bull Official start of NEM successor tariff customers are subject to
Mandatory TOU rate Non-bypassable charges Application fees
July 31 2017bull Residential customers who meet this deadline are grandfathered for
current TOU periods for maximum of 5 years (10 for non-residential)September 9 2017bull Smart Inverters required on all solar installationsJuly 25 2018bull Smart Inverters with Reactive Power Priority required on all solar
installationsNear Term Outlookbull Combination of a flatter tiered rate and the mandatory TOU NEM 20
rate structure has helped reduce the per customer cost shift further efforts to reduce the shift through new TOU pricing periods
bull Commission to revisit NEM Successor Tariff by July 2020 to evaluate the existing NEM tariffs and consider the development and adoption of successor tariffs
Key Dates
Third Quarter Earnings Summary
October 30 2019
Q32019
Q32018 Variance
Basic Earnings Per Share (EPS)1
SCE $ 145 $ 164 $ (019)
EIX Parent amp Other (009) (007) (002)
Basic EPS $ 136 $ 157 $ (021)
Less Non-core Items
SCE2 $ (014) $ 002 $ (016)
EIX Parent amp Other3 mdash (001) 001
Total Non-core $ (014) $ 001 $ (015)
Core Earnings Per Share (EPS)
SCE $ 159 $ 162 $ (003)
EIX Parent amp Other (009) (006) (003)
Core EPS $ 150 $ 156 $ (006)
Key SCE EPS Drivers4
Higher revenue5 $ 012- CPUC revenue (002)- 2018 FERC Formula Rate settlement 010- Other FERC revenue 004
Higher OampM (021)Lower depreciation 002Higher net financing costs (004)Income taxes5 019Property and other taxes (001)Results prior to impact from share dilution $ 007Impact from share dilution (010)Total core drivers $ (003)Non-core items 2 (016)Total $ (019)
Key EIX EPS Drivers4
EIX parent and other mdash Higher interest expense and corporate expenses $ (005)EEG mdash Lower corporate expenses 001Impact from share dilution 001Total core drivers $ (003)Non-core items 3 001Total $ (002)
1 See Earnings Non-GAAP reconciliations and Use of Non-GAAP Financial Measures in Appendix2 Includes SCEs contributions to Wildfire Insurance Fund in third quarter 2019 and impact from the approval of the Revised San Onofre Settlement Agreement in the third quarter 2018 3 Loss on sale of SoCore Energy4 2019 EPS drivers are reported at a consistent share count of 3258 million (2019 QTD weighted-average shares outstanding is 3471 million)5 Includes $020 of tax benefits refunded to customersNote Diluted earnings were $135 and $157 per share for the three months ended September 30 2019 and 2018 respectively
43
1 See Earnings Non-GAAP reconciliations and Use of Non-GAAP Financial Measures in Appendix2 Impact of 2018 GRC final decision related to impairment of utility property plant and equipment changes in allocation of deferred tax re-measurement between customers and
shareholders SCErsquos contributions to the Wildfire Insurance Fund gain from sale of nuclear fuel and impact from the approval of the Revised San Onofre Settlement Agreement3 Loss on sale of SoCore Energy and impact of hypothetical liquidation at book value (HLBV) accounting method4 2019 EPS drivers are reported at a consistent share count of 3258 million (2019 YTD weighted-average shares outstanding is 3330 million)5 Test Year 2018 GRC true-up of $020 includes revenue of $(034) OampM of $006 depreciation of $024 interest expense of $(001) property and other taxes of $001 and income taxes of
$0246 Includes $018 of tax benefits refunded to customersNote Diluted earnings were $342 and $308 per share for the nine months ended September 30 2019 and 2018 respectively
Year to Date Earnings Summary
October 30 2019
YTD 2019
YTD 2018 Variance
Basic Earnings Per Share (EPS)1
SCE $ 365 $ 343 $ 022
EIX Parent amp Other (022) (034) 012
Basic EPS $ 343 $ 309 $ 034
Less Non-core Items
SCE2 $ (030) $ 002 $ (032)
EIX Parent amp Other3 mdash (014) 014
Total Non-core $ (030) $ (012) $ (018)
Core Earnings Per Share (EPS)
SCE $ 395 $ 341 $ 054
EIX Parent amp Other (022) (020) (002)
Core EPS $ 373 $ 321 $ 052
Key SCE EPS Drivers4
Test Year 2018 GRC true-up5 $ 020Higher revenue6 055
- CPUC revenue 032- 2018 FERC Formula Rate settlement 010- FERC and other operating revenue 013
Higher OampM (026)Lower depreciation 005Higher net financing costs (012)Income taxes6 021Results prior to impact from share dilution $ 063Impact from share dilution (009)Total core drivers $ 054Non-core items2 (032)Total $ 022
Key EIX EPS Drivers4
EIX parent and other mdash Higher interest expense and corporate expenses $ (007)EEG mdash Lower corporate expenses and lower losses at the competitive business 004Impact from share dilution 001Total core drivers $ (002)Non-core items3 014Total $ 012
44
SCE Annual Results of Operationsbull Earning activities ndash revenue authorized by CPUC and FERC to provide reasonable cost recovery and return on investmentbull Cost-recovery activities ndash CPUC- and FERC-authorized balancing accounts to recover specific project or program costs subject
to reasonableness review or compliance with upfront standards
($ millions)
2018 2017
Earnings Activities
Cost-Recovery Activities
Total Consolidated
Earnings Activities
Cost-Recovery Activities
Total Consolidated
Operating revenue $6560 $6051 $12611 $6611 $5643 $12254Purchased power and fuel mdash 5406 5406 mdash 4873 4873Operation and maintenance 1972 730 2702 1898 824 2722Wildfire-related claims net of recoveries 2669 mdash 2669 ― ― ―Depreciation and amortization 1867 mdash 1867 2032 mdash 2032Property and other taxes 392 mdash 392 372 mdash 372Impairment and other charges (12) mdash (12) 716 mdash 716Other operating income (7) mdash (7) (8) mdash (8)Total operating expenses 6881 6136 13017 5010 5697 10707Operating (loss) income (321) (85) (406) 1601 (54) 1547Interest expense (671) (2) (673) (588) (1) (589)Other income and expenses 107 87 194 93 55 148(Loss) income before income taxes (885) mdash (885) 1106 mdash 1106Income tax (benefit) expense (696) mdash (696) (30) mdash (30)Net (loss) income (189) mdash (189) 1136 mdash 1136Preferred and preference stock dividend
requirements 121 mdash 121 124 mdash 124
Net (loss) income available for common stock ($310) mdash ($310) $1012 mdash $1012Less Non-core items (1750) (481)Core Earnings $1440 $1493
Note See Use of Non-GAAP Financial Measures
October 30 2019 45
Reconciliation of EIX Basic Earnings Per Share Guidance to EIX Core Earnings Per Share Guidance
EPS Attributable to Edison International 2019
Low Midpoint High
SCE $483
EIX Parent amp Other (032)
Basic EPS1 $441 $451 $461
Non-Core Items
SCE23 (029) (029) (029)
EIX Parent amp Other mdash mdash mdash
Total Non-Core1 (029) (029) (029)
Core EPS
SCE $512
EIX Parent amp Other (032)
Core EPS1 $470 $480 $490
1 EPS is calculated on the assumed weighted-average share count for 2019 Please see 2019 EIX Core Earnings Guidance slide for more information 2 Includes impact of 2018 GRC final decision related to impairment of utility property plant and equipment changes in allocation of deferred tax re-measurement between
customers and shareholders and SCErsquos contributions to the Wildfire Insurance Fund3 Includes $001 per share as a result of share count dilution
October 30 2019
Earnings Per Share Non-GAAP Reconciliations
46
Earnings Non-GAAP Reconciliations
1 Impact of 2018 GRC final decision related to impairment of utility property plant and equipment changes in allocation of deferred tax re-measurement between customers and shareholders SCErsquos contributions to the Wildfire Insurance Fund gain from sale of nuclear fuel and impact from the approval of the Revised San Onofre Settlement Agreement
2 Loss on sale of SoCore Energy and impact of hypothetical liquidation at book value (HLBV) accounting method
($ millions)
Reconciliation of EIX GAAP Earnings to EIX Core Earnings
Earnings Attributable to Edison International Q32019
Q32018
YTD 2019
YTD 2018
SCE $503 $536 $1215 $1119
EIX Parent amp Other (32) (23) (74) (112)
Basic Earnings $471 $513 $1141 $1007
Non-Core Items
SCE 1 ($48) 7 ($99) 7
EIX Parent amp Other 2 mdash (4) mdash (46)
Total Non-Core ($48) $3 ($99) ($39)
Core Earnings
SCE $551 $529 $1314 $1112
EIX Parent amp Other (32) (19) (74) (66)
Core Earnings $519 $510 $1240 $1046
October 30 2019 47
EIX Core EPS Non-GAAP ReconciliationsReconciliation of Edison International Basic Earnings Per Share to Edison International Core Earnings Per Share
Note See Use of Non-GAAP Financial Measures
Earnings Per Share Attributable to Edison International 2018 2017
Basic EPS ($130) $173
Non-Core Items
SCE
Wildfire-related claims net of recoveries (560) mdash
Settlement of 1994 ndash 2006 California tax audits 020 mdash
Write down impairment and other as a result of Revised San Onofre Settlement Agreement
003 (138)
Re-measurement of deferred taxes as a result of Tax Reform mdash (010)
Edison International Parent and Other
Settlement of 1994 ndash 2006 California tax audits (004) mdash
Re-measurement of deferred taxes as a result of Tax Reform mdash (133)
Sale of SoCore Energy and other (014) 004
Discontinued operations
Settlement of 1994 ndash 2006 California tax audits 010 mdash
Less Total Non-Core Items (545) (277)
Core EPS $415 $450
October 30 2019 48
Use of Non-GAAP Financial MeasuresEdison Internationals earnings are prepared in accordance with generally accepted accounting principles used in the United States Management uses core earnings internally for financial planning and for analysis of performance Core earnings are also used when communicating with investors and analysts regarding Edison Internationals earnings results to facilitate comparisons of the Companys performance from period to period Core earnings are a non-GAAP financial measure and may not be comparable to those of other companies Core earnings (or losses) are defined as earnings or losses attributable to Edison International shareholders less income or loss from discontinued operations and income or loss from significant discrete items that management does not consider representative of ongoing earnings such as exit activities including sale of certain assets and other activities that are no longer continuing asset impairments and certain tax regulatory or legal settlements or proceedings
A reconciliation of Non-GAAP information to GAAP information is included either on the slide where the information appears or on another slide referenced in this presentation
EIX Investor Relations Contact
Sam Ramraj Vice President (626) 302-2540 samramrajedisonintlcom
Allison Bahen Principal Manager (626) 302-5493 allisonbahenedisonintlcom
October 30 2019 49
Business Update
Slide Number 2
Table of Contents
EIX Strategy Should Produce Long-Term Value
SCE Highlights
Slide Number 6
SCE Historical Rate Base and Core Earnings
SCE Capital Expenditure Forecast
SCE Rate Base Forecast
Slide Number 10
Californiarsquos GHG Emissions Overview
SCErsquos Pathway 2045 Highlights
Slide Number 13
Slide Number 14
Slide Number 15
SCE Key Regulatory Proceedings
Slide Number 17
Slide Number 18
CPUC and FERC Cost of Capital Summary
CPUC Cost of Capital (2013-2019)
SCE Distribution System Investments
Slide Number 22
Slide Number 23
SCE Large Transmission Projects
SCE Operational Excellence
Responding to Industry Change
Slide Number 27
2019 EIX Core Earnings Guidance
EIX Annual Dividends Per Share
Appendix
EIXrsquos 2018 Sustainability Report Highlights
Slide Number 32
SCE Historical Capital Expenditures
Credit Ratings Summary
Distribution Power Grid of the Future
SCE Customer Demand Trends
SCE Bundled Revenue Requirement
Slide Number 38
SCE Rates and Bills Comparison
Slide Number 40
Slide Number 41
Slide Number 42
Slide Number 43
Slide Number 44
Slide Number 45
SCE Annual Results of Operations
Slide Number 47
Earnings Non-GAAP Reconciliations
EIX Core EPS Non-GAAP Reconciliations
Use of Non-GAAP Financial Measures
US Average
$134
SCE
$95
-291
US Average
128
SCE
164
higher
28
Created on Mon 6 Jun 2016 1250 PM EST (1750 GMT)
Concept
1990
1991
1992
1993
1994
1995
1996
1997
1998
1999
2000
2001
2002
2003
2004
2005
2006
2007
2008
2009
2010
2011
2012
2013
2014
2015
2016
2017
2018
2019
2020
2021
2022
2023
2024
2025
2026
Consumer Price Index All-Urban
131
136
140
144
148
152
157
161
163
167
172
177
180
184
189
195
202
207
215
215
218
225
230
233
237
237
239
245
251
258
265
272
279
286
293
300
306
422
304
297
260
281
294
234
155
219
337
282
160
230
267
337
322
287
381
-032
164
314
208
147
161
012
105
236
253
265
265
264
254
251
249
234
227
SOUTHERN CALIFORNIA EDISON
System Average Rate Forecast
Source Matt Sheriff
(centkWh)
SCE System Average Rate
SAR CPI (old)
SAR CPI (current)
CPI Los Angeles-Long Beach-Anaheim CA
Consumer Price Index All-Urban
0
1990
97cent
97cent
97cent
593
30
1
1991
103cent
101cent
101cent
410
422
2
1992
106cent
104cent
105cent
361
304
3
1993
103cent
107cent
107cent
253
297
4
1994
105cent
110cent
109cent
137
260
5
1995
107cent
113cent
110cent
153
281
25
6
1996
101cent
116cent
112cent
183
294
7
1997
101cent
119cent
114cent
158
234
8
1998
96cent
121cent
116cent
144
155
9
1999
96cent
124cent
119cent
235
219
10
2000
96cent
128cent
122cent
330
337
20
11
2001
142cent
131cent
127cent
336
282
12
2002
142cent
134cent
130cent
277
160
13
2003
124cent
137cent
133cent
259
230
14
2004
122cent
140cent
138cent
334
267
15
2005
126cent
145cent
144cent
447
337
16
2006
147cent
150cent
150cent
427
322
17
2007
139cent
154cent
155cent
328
287
18
2008
137cent
160cent
161cent
353
381
19
2009
143cent
159cent
159cent
-080
-032
20
2010
143cent
162cent
161cent
120
164
10
21
2011
141cent
167cent
166cent
267
314
22
2012
143cent
170cent
169cent
203
208
23
2013
159cent
173cent
171cent
108
147
24
2014
167cent
176cent
173cent
135
161
25
2015
159cent
176cent
175cent
091
012
5
26
2016
148cent
178cent
178cent
189
105
27
2017
157cent
182cent
183cent
279
236
29
20
10
28
2018
160cent
187cent
190cent
381
253
SCE
17
26
11
29
2019
159cent
192cent
195cent
244
265
LA
24
25
20
30
2020
194cent
197cent
199cent
219
265
36
31
2021
199cent
202cent
203cent
227
266
25
49
Created on Wed 23 Jan 2019 1245 PM EST (1745 GMT)
Mnemonic
Long Label
Last Update
Start Date
End Date
Frequency
1970
1971
1972
1973
1974
1975
1976
1977
1978
1979
1980
1981
1982
1983
1984
1985
1986
1987
1988
1989
1990
1991
1992
1993
1994
1995
1996
1997
1998
1999
2000
2001
2002
2003
2004
2005
2006
2007
2008
2009
2010
2011
2012
2013
2014
2015
2016
2017
2018
2019
2020
2021
2022
2023
2024
2025
2026
2027
2028
2029
2030
2031
2032
2033
2034
2035
2036
2037
2038
2039
2040
2041
2042
2043
2044
2045
2046
2047
2048
CPILANGAFRSM1
Los Angeles-Long Beach-Anaheim CA (MSA) [2013 Definition] FIPS Code 31080 Consumer Price Index for All Urban Consumers (1982-84=100) IHS MARKIT ECONOMICS December 2018 Forecast Source Bureau of Labor Statistics End of Historical Data 2017
122718
1970
2048
ANNUAL
3868
4011
4139
4374
4825
5334
5683
6080
6526
7233
8372
9184
9734
9907
10360
10838
11193
11667
12206
12826
13587
14143
14654
15025
15231
15464
15748
15997
16227
16608
17155
17732
18223
18696
19320
20183
21044
21734
22501
22322
22589
23193
23665
23921
24243
24463
24925
25621
26598
27248
27844
28475
29132
29806
30500
31165
31832
32533
33254
33985
34744
35508
36279
37061
37854
38640
39440
40278
41145
42043
42963
43898
44852
45825
46816
47822
48857
49934
51047
371
320
568
1031
1055
655
698
733
1083
1575
971
599
177
458
461
328
423
462
508
593
410
361
253
137
153
183
158
144
235
330
336
277
259
334
447
427
328
353
-080
120
267
203
108
135
091
189
279
381
244
219
227
231
231
233
218
214
220
222
220
223
220
217
215
214
208
207
213
215
218
219
218
217
217
216
215
216
220
223
Date of Report
July 26 2019
July 29 2019
July 29 2019
Edison International
Corporate Outlook
BBBStable
Baa3Stable
BBB-Stable
Senior Unsecured
BBB-
Baa3
BBB-
Commercial Paper
A-2
P-3
F3
Southern California Edison
Corporate Outlook
BBBStable
Baa2Stable
BBB-Stable
First Mortgage Bonds
A-
A3
BBB+
Senior Unsecured
BBB
Baa2
BBB
Preferred Securities
BB+
Ba1
BB+
Commercial Paper
A-2
P-2
F3
Appendix
October 30 2019 29
EIXrsquos 2018 Sustainability Report Highlights
Edison Energy is not the same company as Southern California Edison the utility and Edison Energy is not regulated by the California Public Utilities Commission Cumulative duration (in minutes) of sustained repair outages lasting longer than five minutes experienced by the average customer in a year (including major event days) In February 2019 the EIX board approved a $3 million donation to the Edison International Wildfire Assistance Fund to enhance community resiliency and wildfire prevention and
mitigation This affects the 2019 data year and is not reflected here
October 30 2019
ldquoAt Edison International we are leading the transformation of the electric power industry toward a clean energy future by focusing on opportunities in clean energy efficient electrification the grid of the future and customer choice As we pursue this vision sustainability remains at the core of who we are and what we dordquo ndash Pedro Pizarro Edison International CEO
bull Earnings not affected by variability of retail electricity salesbull Differences between amounts collected and authorized levels
either billed or refundedbull Promotes energy conservationbull Stabilizes revenues during economic cycles
Major Balancing Accountsbull Salesbull Fuel and Purchased powerbull Energy efficiencybull Pension expense
bull Cost-recovery related balancing accounts represented more than 59 of costs
bull Trigger mechanism for fuel and purchased power adjustments at 5 variance level
Advanced Long-TermProcurement Planning
bull Upfront contract approvals and prudency standards provide greater certainty of cost recovery (subject to compliance-related reasonableness review)
Forward-looking Ratemaking bull Forward and test year GRC with three-year rate cycle bull Separate cost of capital mechanism
October 30 2019 31
SCE Historical Capital Expenditures($ billions)
$40 $39
$35$38
$44
2014 2015 2016 2017 2018
October 30 2019 32
Credit Ratings Summary
Date of Report July 26 2019 July 29 2019 July 29 2019
Edison InternationalCorporate Outlook BBBStable Baa3Stable BBB-StableSenior Unsecured BBB- Baa3 BBB-Commercial Paper A-2 P-3 F3
Southern California EdisonCorporate Outlook BBBStable Baa2Stable BBB-StableFirst Mortgage Bonds A- A3 BBB+Senior Unsecured BBB Baa2 BBBPreferred Securities BB+ Ba1 BB+Commercial Paper A-2 P-2 F3
FitchMoodyrsquosSampP
October 30 2019 33
4
ampCalibriRegularFINANCIAL AND STATISTICAL REPORTampCalibriRegularampA
Distribution Power Grid of the Future
One-Way Electricity Flowbull System designed to distribute electricity
from large central generating plantsbull Voltage centrally maintainedbull Increasing integration of distributed
energy resourcesbull Limited situational awareness and
visualization tools for power grid operators
Renewable Generation Mandates
Subsidized Residential Solar
Limited Electric Vehicle Charging Infrastructure
Variable Two-Way Electricity Flowbull Distribution system at the center of the
power gridbull System designed to manage fluctuating
resources and customer demand bull Digital monitoring and control devices and
advanced communications systems to improve safety and reliability and integrate DERs
bull Improved data management and power grid operations and cyber risk mitigation
bull Integrated utility distribution with distributed energy resources planning
Maximize Distributed Resources and Electric Vehicle Adoptionbull Distribution power grid infrastructure
design supports customer choice and greater resiliency
Current State Future State
October 30 2019 34
SCE Customer Demand Trends
Note See Edison International Financial and Statistical Reports for 2017 for further information
Kilowatt-Hour Sales (millions of kWh) 2014 2015 2016 2017 2018
Residential 30027 30093 29579 30221 29865
Commercial 42004 42396 42189 42514 42369
Industrial 8392 7623 7162 6659 6786
Public authorities 4975 4795 4715 4711 4510
Agricultural and other 2019 1950 1803 1498 1745
Subtotal 87416 86857 85448 85602 85276
Resale 1308 1080 1794 1568 1867
Total Kilowatt-Hour Sales 88725 87937 87242 87170 87143
Total Number of Customers 5005401 5033330 5060528 5094818 5126985
Number of New Connections 29879 31653 38076 39621 39633
Area Peak Demand (MW) 23055 23079 23091 23508 23766
October 30 2019 35
SCE Bundled Revenue Requirement
Note Rates in effect as of July 26 2019 Represents bundled service which excludes Direct AccessCCA customers that do not receive generation services from SCE
SCE Systemwide Average Rate History (centkWh)
2010 2011 2012 2013 2014 2015 2016 2017 2018 2019
143 141 143 159 167 162 148 157 160 159
Fuel amp Purchased Power(47)
Distribution(38)
Transmission (8)
Generation(8)
Other (-1)
2019 Bundled Revenue
Requirement
$millions centkWh
Fuel amp Purchased Power ndash includes CDWR Bond Charge
4422 74
Distribution ndash poles wires substations service centers Edison SmartConnectreg
3628 61
Generation ndash owned generation investment and OampM 708 12
Transmission ndash greater than 220kV 789 13
Other ndash CPUC and legislative public purpose programs system reliability investments nuclear decommissioning and prior-year over collections
(116) (01)
Total Bundled Revenue Requirement ($millions) $9431
divide Bundled kWh (millions) 59396
= Bundled Systemwide Average Rate (centkWh) 159cent
October 30 2019 36
37
97cent
159cent
80cent
100cent
120cent
140cent
160cent
180cent
200cent
220cent
1990
1991
1992
1993
1994
1995
1996
1997
1998
1999
2000
2001
2002
2003
2004
2005
2006
2007
2008
2009
2010
2011
2012
2013
2014
2015
2016
2017
2018
2019
195cent
Rates reduced due to the implementation of 1) the SONGS Revised Settlement including NEIL insurance benefits 2) lower fuel amp purchased power costs and 3) a lower 2015 GRC revenue requirement that includes flow-through tax benefits
centkWh
System Average Rate Historical Growth
SCErsquos system average rate has grown less than inflation over the last 29 years
SCE System Average RateLos Angeles Area Inflation
Comparative System Average Rates
Delta to SCESCE 159cent --
PGampE 211cent1 33
SDGampE 246cent1 55
CAGR29-yr
(lsquo90-rsquo19)20-yr
(lsquo99-rsquo19)10-yr
(lsquo09-19)17 26 1124 25 20
Energy Crisis and return to normal
Higher gas price forecast post-Katrina leads to higher rates with subsequent refund of over collection
Delay in 2012 GRC leads to shorter ramp-up of rate increase
1 PGampE Advice 5644-E effective October 1 SDGampE Advice 3377-E effective June 1
October 30 2019
Data
SCE System Average Rate
1990199119921993199419951996199719981999200020012002200320042005200620072008200920102011201220132014201520162017201820199699999999999999310310610310510710110196969614214212412212614713913714314314114315916715940876786458386148350382761769171566871495475337116159CPI Los Angeles-Long Beach-Anaheim CA199019911992199319941995199619971998199920002001200220032004200520062007200820092010201120122013201420152016201720182019202096999999999999993100974239450441131046212585868498310726876840039228108738285083414611104041339548576811242695044160916114205839057899881158478900883218511856679342492612122475588812561061265926153091265513010279685966582133476140824337041379322865554462144095927379783561502417198233561515516495767909655160640840897938551593635512757601816127380397448466165581867639842851689511064769380217077830471050007173082233194307481746514628312063517794555998527898182917523920509811898939005269867419453007660169238SAR CPI (old)1990199119921993199419951996199719981999200020012002200320042005200620072008200920102011201220132014201520162017201820199699999999999999310108935518848128104164104853626311072574143759422111004139294598572113128515849244651164507302761853711917284265578923121016455131068581236705147011944127834109318192141314347216021390513353198545827113660054850437767140244467121649041449648574526591614963575483132515393112443397234159803525097292715929158237134114161898499904328691669815498437507617045100580396491729508329612907517573561579182243175943857388863061777863624593457518198880904395583186584452388557219152742489955948
195cent
CPI Workbook
image1png
129 ₵
164 ₵
US Average SCE
27 Higher
SCE Rates and Bills Comparison
SCErsquos average residential rates are above national averagebut residential bills are below national average due to lower usage
bull SCErsquos residential rates are above national average due in part to a cleaner fuel mix high cost of living and lower system load factor
bull SCErsquos residential customer usage is lower than the national average due to mild climate and higher energy efficiency appliance and building standards
bull Average monthly residential bills are lower than the national average as higher rate levels are more than offset by lower usage
Key FactorsKey Factors
Source EIAs Form 861M (formerly Form 826) Data Monthly Electric Utility Sales and Revenue Data for 12-Months Ending June 2019 httpswwweiagovelectricitydataeia861mindexhtml
2018-19 Average Residential Rates (centkWh)
2018-19 Average Residential Bills ($ per Month)
$128
$95
US Average SCE
26 Lower
October 30 2019 38
Sheet1
Sheet1
129 ₵
164 ₵
Sheet2
27 Higher
Sheet3
Sheet1
Sheet1
$128
Sheet2
26 Lower
Sheet3
bull Assembly Bill 1171 permits cities and counties and Joint Powers Agencies (JPAs) to act as CCAs to purchase and sell electricity on behalf of the utility customers within their jurisdiction
bull An Order Instituting Rulemaking (OIR R17-06-026) was opened on June 29 2017 to review revise and consider alternatives to the ldquoPower Charge Indifference Adjustmentrdquo or PCIA The PCIA allocates a proportional share of above-market costs of SCErsquos
energy procurement portfolio to departing load customers to ensure remaining bundled service customers are indifferent
October 11 2018 Commission decision changes PCIA methodology and has substantially addressed the historical subsidy to departing load that materialized when renewables market prices declined over the past 4 yearso Decision also established a Phase 2 which is addressing utility
portfolio optimization PCIA ldquopre-paymentrdquo options for entities and individual departing load customers and implementation of the ldquotrue-uprdquo process for Resource Adequacy (RA) and Renewable Energy Credits (RECs) costs
o A Phase 2 final decision on the benchmark and true-up process was approved on October 10 2019 with the other Phase 2 activities to continue into 2020
bull On February 8 2018 the Commission approved Resolution E-4907 requiring CCAs to demonstrate compliance with annual Resource Adequacy (RA) requirements prior to commencing operations
bull Existing Direct Access and CCA load is expected to be ~35 of SCErsquos total load by the end of 2019
Investor-Owned Utility (IOU)
Community Choice Aggregator (CCA)
Community Choice Aggregator (CCA) Overview
Approximately 40 of SCErsquos bundled service load could be part of a CCA or Direct Access by the end of 2020
October 30 2019 39
bull CPUC Order Instituting Ratemaking R 12-06-013 comprehensively reviewed residential rate structure including a future transition to Time of Use (TOU) rates In March 2018 SCE began to migrate 400000 residential customers to TOU rate structures
Remaining eligible residential customers to be migrated beginning October 2020bull July 2015 CPUC Decision D 15-07-001 includes Transition to 2 tiered rate structure coupled with Super-User Electric (SUE) Surcharge1
ldquoSuper User Electric Surchargerdquo for usage 400 above baseline (~3 of all usage)
Minimum bills of approximately $10month (applied to delivery revenue only)
January 2014 2019
100(60 of system usage)
219(3)
Tier 1100
Tier 2 101-400
SUEgt400
125(37)
Usage Level ( of Baseline)Usage Level ( of Baseline)
1 Completed in 20192 SCErsquos California Alternate Rates for Energy (CARE) program is an income-qualifying program that reduces energy bills for eligible customers by about 30
Winter Weekdays 8am-9pm Weekdays and Weekends 4-9pm
Off-Peak Summer Weekdays 11pm-8amWeekends All
Weekdays and Weekends All except 4-9pm
Winter Weekdays 9pm-8amWeekends All
Weekdays and Weekends 9pm-8am
Super Off-Peak Winter NA Weekdays and Weekends 8am-4pm
New Time-of-Use (TOU) Periods
bull On March 1 2019 SCE changed its basic TOU pricing period definition for the first time in over 30 years
bull Abundant mid-day renewable energy lowers prices from 8am-4pm (October - June)
bull Highest cost period is now 4pm-9pm all-days1
1 TOU pricing periods defined for non-residential customers per CPUC Decision D18-07-006 Similar residential TOU definitions were filed by SCE in A17-12-012
bull 998 solar projectsbull 320445 residential (71 of all residential customers) ndash 1756 MW bull 7333 non-residential ndash 977 MW bull Approximately 4775887 MWhyear generated
SCE Net Metering Statistics (919)
0
5
10
15
20
25
30
35
40
0
1000
2000
3000
4000
5000
6000
7000
2013 2014 2015 2016 2017 2018 2019
MW
Inst
alle
d
Num
ber o
f Sol
ar R
esid
entia
l Ins
talla
tions
Installations MW
July 1 2017bull Official start of NEM successor tariff customers are subject to
Mandatory TOU rate Non-bypassable charges Application fees
July 31 2017bull Residential customers who meet this deadline are grandfathered for
current TOU periods for maximum of 5 years (10 for non-residential)September 9 2017bull Smart Inverters required on all solar installationsJuly 25 2018bull Smart Inverters with Reactive Power Priority required on all solar
installationsNear Term Outlookbull Combination of a flatter tiered rate and the mandatory TOU NEM 20
rate structure has helped reduce the per customer cost shift further efforts to reduce the shift through new TOU pricing periods
bull Commission to revisit NEM Successor Tariff by July 2020 to evaluate the existing NEM tariffs and consider the development and adoption of successor tariffs
Key Dates
Third Quarter Earnings Summary
October 30 2019
Q32019
Q32018 Variance
Basic Earnings Per Share (EPS)1
SCE $ 145 $ 164 $ (019)
EIX Parent amp Other (009) (007) (002)
Basic EPS $ 136 $ 157 $ (021)
Less Non-core Items
SCE2 $ (014) $ 002 $ (016)
EIX Parent amp Other3 mdash (001) 001
Total Non-core $ (014) $ 001 $ (015)
Core Earnings Per Share (EPS)
SCE $ 159 $ 162 $ (003)
EIX Parent amp Other (009) (006) (003)
Core EPS $ 150 $ 156 $ (006)
Key SCE EPS Drivers4
Higher revenue5 $ 012- CPUC revenue (002)- 2018 FERC Formula Rate settlement 010- Other FERC revenue 004
Higher OampM (021)Lower depreciation 002Higher net financing costs (004)Income taxes5 019Property and other taxes (001)Results prior to impact from share dilution $ 007Impact from share dilution (010)Total core drivers $ (003)Non-core items 2 (016)Total $ (019)
Key EIX EPS Drivers4
EIX parent and other mdash Higher interest expense and corporate expenses $ (005)EEG mdash Lower corporate expenses 001Impact from share dilution 001Total core drivers $ (003)Non-core items 3 001Total $ (002)
1 See Earnings Non-GAAP reconciliations and Use of Non-GAAP Financial Measures in Appendix2 Includes SCEs contributions to Wildfire Insurance Fund in third quarter 2019 and impact from the approval of the Revised San Onofre Settlement Agreement in the third quarter 2018 3 Loss on sale of SoCore Energy4 2019 EPS drivers are reported at a consistent share count of 3258 million (2019 QTD weighted-average shares outstanding is 3471 million)5 Includes $020 of tax benefits refunded to customersNote Diluted earnings were $135 and $157 per share for the three months ended September 30 2019 and 2018 respectively
43
1 See Earnings Non-GAAP reconciliations and Use of Non-GAAP Financial Measures in Appendix2 Impact of 2018 GRC final decision related to impairment of utility property plant and equipment changes in allocation of deferred tax re-measurement between customers and
shareholders SCErsquos contributions to the Wildfire Insurance Fund gain from sale of nuclear fuel and impact from the approval of the Revised San Onofre Settlement Agreement3 Loss on sale of SoCore Energy and impact of hypothetical liquidation at book value (HLBV) accounting method4 2019 EPS drivers are reported at a consistent share count of 3258 million (2019 YTD weighted-average shares outstanding is 3330 million)5 Test Year 2018 GRC true-up of $020 includes revenue of $(034) OampM of $006 depreciation of $024 interest expense of $(001) property and other taxes of $001 and income taxes of
$0246 Includes $018 of tax benefits refunded to customersNote Diluted earnings were $342 and $308 per share for the nine months ended September 30 2019 and 2018 respectively
Year to Date Earnings Summary
October 30 2019
YTD 2019
YTD 2018 Variance
Basic Earnings Per Share (EPS)1
SCE $ 365 $ 343 $ 022
EIX Parent amp Other (022) (034) 012
Basic EPS $ 343 $ 309 $ 034
Less Non-core Items
SCE2 $ (030) $ 002 $ (032)
EIX Parent amp Other3 mdash (014) 014
Total Non-core $ (030) $ (012) $ (018)
Core Earnings Per Share (EPS)
SCE $ 395 $ 341 $ 054
EIX Parent amp Other (022) (020) (002)
Core EPS $ 373 $ 321 $ 052
Key SCE EPS Drivers4
Test Year 2018 GRC true-up5 $ 020Higher revenue6 055
- CPUC revenue 032- 2018 FERC Formula Rate settlement 010- FERC and other operating revenue 013
Higher OampM (026)Lower depreciation 005Higher net financing costs (012)Income taxes6 021Results prior to impact from share dilution $ 063Impact from share dilution (009)Total core drivers $ 054Non-core items2 (032)Total $ 022
Key EIX EPS Drivers4
EIX parent and other mdash Higher interest expense and corporate expenses $ (007)EEG mdash Lower corporate expenses and lower losses at the competitive business 004Impact from share dilution 001Total core drivers $ (002)Non-core items3 014Total $ 012
44
SCE Annual Results of Operationsbull Earning activities ndash revenue authorized by CPUC and FERC to provide reasonable cost recovery and return on investmentbull Cost-recovery activities ndash CPUC- and FERC-authorized balancing accounts to recover specific project or program costs subject
to reasonableness review or compliance with upfront standards
($ millions)
2018 2017
Earnings Activities
Cost-Recovery Activities
Total Consolidated
Earnings Activities
Cost-Recovery Activities
Total Consolidated
Operating revenue $6560 $6051 $12611 $6611 $5643 $12254Purchased power and fuel mdash 5406 5406 mdash 4873 4873Operation and maintenance 1972 730 2702 1898 824 2722Wildfire-related claims net of recoveries 2669 mdash 2669 ― ― ―Depreciation and amortization 1867 mdash 1867 2032 mdash 2032Property and other taxes 392 mdash 392 372 mdash 372Impairment and other charges (12) mdash (12) 716 mdash 716Other operating income (7) mdash (7) (8) mdash (8)Total operating expenses 6881 6136 13017 5010 5697 10707Operating (loss) income (321) (85) (406) 1601 (54) 1547Interest expense (671) (2) (673) (588) (1) (589)Other income and expenses 107 87 194 93 55 148(Loss) income before income taxes (885) mdash (885) 1106 mdash 1106Income tax (benefit) expense (696) mdash (696) (30) mdash (30)Net (loss) income (189) mdash (189) 1136 mdash 1136Preferred and preference stock dividend
requirements 121 mdash 121 124 mdash 124
Net (loss) income available for common stock ($310) mdash ($310) $1012 mdash $1012Less Non-core items (1750) (481)Core Earnings $1440 $1493
Note See Use of Non-GAAP Financial Measures
October 30 2019 45
Reconciliation of EIX Basic Earnings Per Share Guidance to EIX Core Earnings Per Share Guidance
EPS Attributable to Edison International 2019
Low Midpoint High
SCE $483
EIX Parent amp Other (032)
Basic EPS1 $441 $451 $461
Non-Core Items
SCE23 (029) (029) (029)
EIX Parent amp Other mdash mdash mdash
Total Non-Core1 (029) (029) (029)
Core EPS
SCE $512
EIX Parent amp Other (032)
Core EPS1 $470 $480 $490
1 EPS is calculated on the assumed weighted-average share count for 2019 Please see 2019 EIX Core Earnings Guidance slide for more information 2 Includes impact of 2018 GRC final decision related to impairment of utility property plant and equipment changes in allocation of deferred tax re-measurement between
customers and shareholders and SCErsquos contributions to the Wildfire Insurance Fund3 Includes $001 per share as a result of share count dilution
October 30 2019
Earnings Per Share Non-GAAP Reconciliations
46
Earnings Non-GAAP Reconciliations
1 Impact of 2018 GRC final decision related to impairment of utility property plant and equipment changes in allocation of deferred tax re-measurement between customers and shareholders SCErsquos contributions to the Wildfire Insurance Fund gain from sale of nuclear fuel and impact from the approval of the Revised San Onofre Settlement Agreement
2 Loss on sale of SoCore Energy and impact of hypothetical liquidation at book value (HLBV) accounting method
($ millions)
Reconciliation of EIX GAAP Earnings to EIX Core Earnings
Earnings Attributable to Edison International Q32019
Q32018
YTD 2019
YTD 2018
SCE $503 $536 $1215 $1119
EIX Parent amp Other (32) (23) (74) (112)
Basic Earnings $471 $513 $1141 $1007
Non-Core Items
SCE 1 ($48) 7 ($99) 7
EIX Parent amp Other 2 mdash (4) mdash (46)
Total Non-Core ($48) $3 ($99) ($39)
Core Earnings
SCE $551 $529 $1314 $1112
EIX Parent amp Other (32) (19) (74) (66)
Core Earnings $519 $510 $1240 $1046
October 30 2019 47
EIX Core EPS Non-GAAP ReconciliationsReconciliation of Edison International Basic Earnings Per Share to Edison International Core Earnings Per Share
Note See Use of Non-GAAP Financial Measures
Earnings Per Share Attributable to Edison International 2018 2017
Basic EPS ($130) $173
Non-Core Items
SCE
Wildfire-related claims net of recoveries (560) mdash
Settlement of 1994 ndash 2006 California tax audits 020 mdash
Write down impairment and other as a result of Revised San Onofre Settlement Agreement
003 (138)
Re-measurement of deferred taxes as a result of Tax Reform mdash (010)
Edison International Parent and Other
Settlement of 1994 ndash 2006 California tax audits (004) mdash
Re-measurement of deferred taxes as a result of Tax Reform mdash (133)
Sale of SoCore Energy and other (014) 004
Discontinued operations
Settlement of 1994 ndash 2006 California tax audits 010 mdash
Less Total Non-Core Items (545) (277)
Core EPS $415 $450
October 30 2019 48
Use of Non-GAAP Financial MeasuresEdison Internationals earnings are prepared in accordance with generally accepted accounting principles used in the United States Management uses core earnings internally for financial planning and for analysis of performance Core earnings are also used when communicating with investors and analysts regarding Edison Internationals earnings results to facilitate comparisons of the Companys performance from period to period Core earnings are a non-GAAP financial measure and may not be comparable to those of other companies Core earnings (or losses) are defined as earnings or losses attributable to Edison International shareholders less income or loss from discontinued operations and income or loss from significant discrete items that management does not consider representative of ongoing earnings such as exit activities including sale of certain assets and other activities that are no longer continuing asset impairments and certain tax regulatory or legal settlements or proceedings
A reconciliation of Non-GAAP information to GAAP information is included either on the slide where the information appears or on another slide referenced in this presentation
EIX Investor Relations Contact
Sam Ramraj Vice President (626) 302-2540 samramrajedisonintlcom
Allison Bahen Principal Manager (626) 302-5493 allisonbahenedisonintlcom
October 30 2019 49
Business Update
Slide Number 2
Table of Contents
EIX Strategy Should Produce Long-Term Value
SCE Highlights
Slide Number 6
SCE Historical Rate Base and Core Earnings
SCE Capital Expenditure Forecast
SCE Rate Base Forecast
Slide Number 10
Californiarsquos GHG Emissions Overview
SCErsquos Pathway 2045 Highlights
Slide Number 13
Slide Number 14
Slide Number 15
SCE Key Regulatory Proceedings
Slide Number 17
Slide Number 18
CPUC and FERC Cost of Capital Summary
CPUC Cost of Capital (2013-2019)
SCE Distribution System Investments
Slide Number 22
Slide Number 23
SCE Large Transmission Projects
SCE Operational Excellence
Responding to Industry Change
Slide Number 27
2019 EIX Core Earnings Guidance
EIX Annual Dividends Per Share
Appendix
EIXrsquos 2018 Sustainability Report Highlights
Slide Number 32
SCE Historical Capital Expenditures
Credit Ratings Summary
Distribution Power Grid of the Future
SCE Customer Demand Trends
SCE Bundled Revenue Requirement
Slide Number 38
SCE Rates and Bills Comparison
Slide Number 40
Slide Number 41
Slide Number 42
Slide Number 43
Slide Number 44
Slide Number 45
SCE Annual Results of Operations
Slide Number 47
Earnings Non-GAAP Reconciliations
EIX Core EPS Non-GAAP Reconciliations
Use of Non-GAAP Financial Measures
US Average
$134
SCE
$95
-291
US Average
128
SCE
164
higher
28
Created on Mon 6 Jun 2016 1250 PM EST (1750 GMT)
Concept
1990
1991
1992
1993
1994
1995
1996
1997
1998
1999
2000
2001
2002
2003
2004
2005
2006
2007
2008
2009
2010
2011
2012
2013
2014
2015
2016
2017
2018
2019
2020
2021
2022
2023
2024
2025
2026
Consumer Price Index All-Urban
131
136
140
144
148
152
157
161
163
167
172
177
180
184
189
195
202
207
215
215
218
225
230
233
237
237
239
245
251
258
265
272
279
286
293
300
306
422
304
297
260
281
294
234
155
219
337
282
160
230
267
337
322
287
381
-032
164
314
208
147
161
012
105
236
253
265
265
264
254
251
249
234
227
SOUTHERN CALIFORNIA EDISON
System Average Rate Forecast
Source Matt Sheriff
(centkWh)
SCE System Average Rate
SAR CPI (old)
SAR CPI (current)
CPI Los Angeles-Long Beach-Anaheim CA
Consumer Price Index All-Urban
0
1990
97cent
97cent
97cent
593
30
1
1991
103cent
101cent
101cent
410
422
2
1992
106cent
104cent
105cent
361
304
3
1993
103cent
107cent
107cent
253
297
4
1994
105cent
110cent
109cent
137
260
5
1995
107cent
113cent
110cent
153
281
25
6
1996
101cent
116cent
112cent
183
294
7
1997
101cent
119cent
114cent
158
234
8
1998
96cent
121cent
116cent
144
155
9
1999
96cent
124cent
119cent
235
219
10
2000
96cent
128cent
122cent
330
337
20
11
2001
142cent
131cent
127cent
336
282
12
2002
142cent
134cent
130cent
277
160
13
2003
124cent
137cent
133cent
259
230
14
2004
122cent
140cent
138cent
334
267
15
2005
126cent
145cent
144cent
447
337
16
2006
147cent
150cent
150cent
427
322
17
2007
139cent
154cent
155cent
328
287
18
2008
137cent
160cent
161cent
353
381
19
2009
143cent
159cent
159cent
-080
-032
20
2010
143cent
162cent
161cent
120
164
10
21
2011
141cent
167cent
166cent
267
314
22
2012
143cent
170cent
169cent
203
208
23
2013
159cent
173cent
171cent
108
147
24
2014
167cent
176cent
173cent
135
161
25
2015
159cent
176cent
175cent
091
012
5
26
2016
148cent
178cent
178cent
189
105
27
2017
157cent
182cent
183cent
279
236
29
20
10
28
2018
160cent
187cent
190cent
381
253
SCE
17
26
11
29
2019
159cent
192cent
195cent
244
265
LA
24
25
20
30
2020
194cent
197cent
199cent
219
265
36
31
2021
199cent
202cent
203cent
227
266
25
49
Created on Wed 23 Jan 2019 1245 PM EST (1745 GMT)
Mnemonic
Long Label
Last Update
Start Date
End Date
Frequency
1970
1971
1972
1973
1974
1975
1976
1977
1978
1979
1980
1981
1982
1983
1984
1985
1986
1987
1988
1989
1990
1991
1992
1993
1994
1995
1996
1997
1998
1999
2000
2001
2002
2003
2004
2005
2006
2007
2008
2009
2010
2011
2012
2013
2014
2015
2016
2017
2018
2019
2020
2021
2022
2023
2024
2025
2026
2027
2028
2029
2030
2031
2032
2033
2034
2035
2036
2037
2038
2039
2040
2041
2042
2043
2044
2045
2046
2047
2048
CPILANGAFRSM1
Los Angeles-Long Beach-Anaheim CA (MSA) [2013 Definition] FIPS Code 31080 Consumer Price Index for All Urban Consumers (1982-84=100) IHS MARKIT ECONOMICS December 2018 Forecast Source Bureau of Labor Statistics End of Historical Data 2017
122718
1970
2048
ANNUAL
3868
4011
4139
4374
4825
5334
5683
6080
6526
7233
8372
9184
9734
9907
10360
10838
11193
11667
12206
12826
13587
14143
14654
15025
15231
15464
15748
15997
16227
16608
17155
17732
18223
18696
19320
20183
21044
21734
22501
22322
22589
23193
23665
23921
24243
24463
24925
25621
26598
27248
27844
28475
29132
29806
30500
31165
31832
32533
33254
33985
34744
35508
36279
37061
37854
38640
39440
40278
41145
42043
42963
43898
44852
45825
46816
47822
48857
49934
51047
371
320
568
1031
1055
655
698
733
1083
1575
971
599
177
458
461
328
423
462
508
593
410
361
253
137
153
183
158
144
235
330
336
277
259
334
447
427
328
353
-080
120
267
203
108
135
091
189
279
381
244
219
227
231
231
233
218
214
220
222
220
223
220
217
215
214
208
207
213
215
218
219
218
217
217
216
215
216
220
223
Date of Report
July 26 2019
July 29 2019
July 29 2019
Edison International
Corporate Outlook
BBBStable
Baa3Stable
BBB-Stable
Senior Unsecured
BBB-
Baa3
BBB-
Commercial Paper
A-2
P-3
F3
Southern California Edison
Corporate Outlook
BBBStable
Baa2Stable
BBB-Stable
First Mortgage Bonds
A-
A3
BBB+
Senior Unsecured
BBB
Baa2
BBB
Preferred Securities
BB+
Ba1
BB+
Commercial Paper
A-2
P-2
F3
EIXrsquos 2018 Sustainability Report Highlights
Edison Energy is not the same company as Southern California Edison the utility and Edison Energy is not regulated by the California Public Utilities Commission Cumulative duration (in minutes) of sustained repair outages lasting longer than five minutes experienced by the average customer in a year (including major event days) In February 2019 the EIX board approved a $3 million donation to the Edison International Wildfire Assistance Fund to enhance community resiliency and wildfire prevention and
mitigation This affects the 2019 data year and is not reflected here
October 30 2019
ldquoAt Edison International we are leading the transformation of the electric power industry toward a clean energy future by focusing on opportunities in clean energy efficient electrification the grid of the future and customer choice As we pursue this vision sustainability remains at the core of who we are and what we dordquo ndash Pedro Pizarro Edison International CEO
bull Earnings not affected by variability of retail electricity salesbull Differences between amounts collected and authorized levels
either billed or refundedbull Promotes energy conservationbull Stabilizes revenues during economic cycles
Major Balancing Accountsbull Salesbull Fuel and Purchased powerbull Energy efficiencybull Pension expense
bull Cost-recovery related balancing accounts represented more than 59 of costs
bull Trigger mechanism for fuel and purchased power adjustments at 5 variance level
Advanced Long-TermProcurement Planning
bull Upfront contract approvals and prudency standards provide greater certainty of cost recovery (subject to compliance-related reasonableness review)
Forward-looking Ratemaking bull Forward and test year GRC with three-year rate cycle bull Separate cost of capital mechanism
October 30 2019 31
SCE Historical Capital Expenditures($ billions)
$40 $39
$35$38
$44
2014 2015 2016 2017 2018
October 30 2019 32
Credit Ratings Summary
Date of Report July 26 2019 July 29 2019 July 29 2019
Edison InternationalCorporate Outlook BBBStable Baa3Stable BBB-StableSenior Unsecured BBB- Baa3 BBB-Commercial Paper A-2 P-3 F3
Southern California EdisonCorporate Outlook BBBStable Baa2Stable BBB-StableFirst Mortgage Bonds A- A3 BBB+Senior Unsecured BBB Baa2 BBBPreferred Securities BB+ Ba1 BB+Commercial Paper A-2 P-2 F3
FitchMoodyrsquosSampP
October 30 2019 33
4
ampCalibriRegularFINANCIAL AND STATISTICAL REPORTampCalibriRegularampA
Distribution Power Grid of the Future
One-Way Electricity Flowbull System designed to distribute electricity
from large central generating plantsbull Voltage centrally maintainedbull Increasing integration of distributed
energy resourcesbull Limited situational awareness and
visualization tools for power grid operators
Renewable Generation Mandates
Subsidized Residential Solar
Limited Electric Vehicle Charging Infrastructure
Variable Two-Way Electricity Flowbull Distribution system at the center of the
power gridbull System designed to manage fluctuating
resources and customer demand bull Digital monitoring and control devices and
advanced communications systems to improve safety and reliability and integrate DERs
bull Improved data management and power grid operations and cyber risk mitigation
bull Integrated utility distribution with distributed energy resources planning
Maximize Distributed Resources and Electric Vehicle Adoptionbull Distribution power grid infrastructure
design supports customer choice and greater resiliency
Current State Future State
October 30 2019 34
SCE Customer Demand Trends
Note See Edison International Financial and Statistical Reports for 2017 for further information
Kilowatt-Hour Sales (millions of kWh) 2014 2015 2016 2017 2018
Residential 30027 30093 29579 30221 29865
Commercial 42004 42396 42189 42514 42369
Industrial 8392 7623 7162 6659 6786
Public authorities 4975 4795 4715 4711 4510
Agricultural and other 2019 1950 1803 1498 1745
Subtotal 87416 86857 85448 85602 85276
Resale 1308 1080 1794 1568 1867
Total Kilowatt-Hour Sales 88725 87937 87242 87170 87143
Total Number of Customers 5005401 5033330 5060528 5094818 5126985
Number of New Connections 29879 31653 38076 39621 39633
Area Peak Demand (MW) 23055 23079 23091 23508 23766
October 30 2019 35
SCE Bundled Revenue Requirement
Note Rates in effect as of July 26 2019 Represents bundled service which excludes Direct AccessCCA customers that do not receive generation services from SCE
SCE Systemwide Average Rate History (centkWh)
2010 2011 2012 2013 2014 2015 2016 2017 2018 2019
143 141 143 159 167 162 148 157 160 159
Fuel amp Purchased Power(47)
Distribution(38)
Transmission (8)
Generation(8)
Other (-1)
2019 Bundled Revenue
Requirement
$millions centkWh
Fuel amp Purchased Power ndash includes CDWR Bond Charge
4422 74
Distribution ndash poles wires substations service centers Edison SmartConnectreg
3628 61
Generation ndash owned generation investment and OampM 708 12
Transmission ndash greater than 220kV 789 13
Other ndash CPUC and legislative public purpose programs system reliability investments nuclear decommissioning and prior-year over collections
(116) (01)
Total Bundled Revenue Requirement ($millions) $9431
divide Bundled kWh (millions) 59396
= Bundled Systemwide Average Rate (centkWh) 159cent
October 30 2019 36
37
97cent
159cent
80cent
100cent
120cent
140cent
160cent
180cent
200cent
220cent
1990
1991
1992
1993
1994
1995
1996
1997
1998
1999
2000
2001
2002
2003
2004
2005
2006
2007
2008
2009
2010
2011
2012
2013
2014
2015
2016
2017
2018
2019
195cent
Rates reduced due to the implementation of 1) the SONGS Revised Settlement including NEIL insurance benefits 2) lower fuel amp purchased power costs and 3) a lower 2015 GRC revenue requirement that includes flow-through tax benefits
centkWh
System Average Rate Historical Growth
SCErsquos system average rate has grown less than inflation over the last 29 years
SCE System Average RateLos Angeles Area Inflation
Comparative System Average Rates
Delta to SCESCE 159cent --
PGampE 211cent1 33
SDGampE 246cent1 55
CAGR29-yr
(lsquo90-rsquo19)20-yr
(lsquo99-rsquo19)10-yr
(lsquo09-19)17 26 1124 25 20
Energy Crisis and return to normal
Higher gas price forecast post-Katrina leads to higher rates with subsequent refund of over collection
Delay in 2012 GRC leads to shorter ramp-up of rate increase
1 PGampE Advice 5644-E effective October 1 SDGampE Advice 3377-E effective June 1
October 30 2019
Data
SCE System Average Rate
1990199119921993199419951996199719981999200020012002200320042005200620072008200920102011201220132014201520162017201820199699999999999999310310610310510710110196969614214212412212614713913714314314114315916715940876786458386148350382761769171566871495475337116159CPI Los Angeles-Long Beach-Anaheim CA199019911992199319941995199619971998199920002001200220032004200520062007200820092010201120122013201420152016201720182019202096999999999999993100974239450441131046212585868498310726876840039228108738285083414611104041339548576811242695044160916114205839057899881158478900883218511856679342492612122475588812561061265926153091265513010279685966582133476140824337041379322865554462144095927379783561502417198233561515516495767909655160640840897938551593635512757601816127380397448466165581867639842851689511064769380217077830471050007173082233194307481746514628312063517794555998527898182917523920509811898939005269867419453007660169238SAR CPI (old)1990199119921993199419951996199719981999200020012002200320042005200620072008200920102011201220132014201520162017201820199699999999999999310108935518848128104164104853626311072574143759422111004139294598572113128515849244651164507302761853711917284265578923121016455131068581236705147011944127834109318192141314347216021390513353198545827113660054850437767140244467121649041449648574526591614963575483132515393112443397234159803525097292715929158237134114161898499904328691669815498437507617045100580396491729508329612907517573561579182243175943857388863061777863624593457518198880904395583186584452388557219152742489955948
195cent
CPI Workbook
image1png
129 ₵
164 ₵
US Average SCE
27 Higher
SCE Rates and Bills Comparison
SCErsquos average residential rates are above national averagebut residential bills are below national average due to lower usage
bull SCErsquos residential rates are above national average due in part to a cleaner fuel mix high cost of living and lower system load factor
bull SCErsquos residential customer usage is lower than the national average due to mild climate and higher energy efficiency appliance and building standards
bull Average monthly residential bills are lower than the national average as higher rate levels are more than offset by lower usage
Key FactorsKey Factors
Source EIAs Form 861M (formerly Form 826) Data Monthly Electric Utility Sales and Revenue Data for 12-Months Ending June 2019 httpswwweiagovelectricitydataeia861mindexhtml
2018-19 Average Residential Rates (centkWh)
2018-19 Average Residential Bills ($ per Month)
$128
$95
US Average SCE
26 Lower
October 30 2019 38
Sheet1
Sheet1
129 ₵
164 ₵
Sheet2
27 Higher
Sheet3
Sheet1
Sheet1
$128
Sheet2
26 Lower
Sheet3
bull Assembly Bill 1171 permits cities and counties and Joint Powers Agencies (JPAs) to act as CCAs to purchase and sell electricity on behalf of the utility customers within their jurisdiction
bull An Order Instituting Rulemaking (OIR R17-06-026) was opened on June 29 2017 to review revise and consider alternatives to the ldquoPower Charge Indifference Adjustmentrdquo or PCIA The PCIA allocates a proportional share of above-market costs of SCErsquos
energy procurement portfolio to departing load customers to ensure remaining bundled service customers are indifferent
October 11 2018 Commission decision changes PCIA methodology and has substantially addressed the historical subsidy to departing load that materialized when renewables market prices declined over the past 4 yearso Decision also established a Phase 2 which is addressing utility
portfolio optimization PCIA ldquopre-paymentrdquo options for entities and individual departing load customers and implementation of the ldquotrue-uprdquo process for Resource Adequacy (RA) and Renewable Energy Credits (RECs) costs
o A Phase 2 final decision on the benchmark and true-up process was approved on October 10 2019 with the other Phase 2 activities to continue into 2020
bull On February 8 2018 the Commission approved Resolution E-4907 requiring CCAs to demonstrate compliance with annual Resource Adequacy (RA) requirements prior to commencing operations
bull Existing Direct Access and CCA load is expected to be ~35 of SCErsquos total load by the end of 2019
Investor-Owned Utility (IOU)
Community Choice Aggregator (CCA)
Community Choice Aggregator (CCA) Overview
Approximately 40 of SCErsquos bundled service load could be part of a CCA or Direct Access by the end of 2020
October 30 2019 39
bull CPUC Order Instituting Ratemaking R 12-06-013 comprehensively reviewed residential rate structure including a future transition to Time of Use (TOU) rates In March 2018 SCE began to migrate 400000 residential customers to TOU rate structures
Remaining eligible residential customers to be migrated beginning October 2020bull July 2015 CPUC Decision D 15-07-001 includes Transition to 2 tiered rate structure coupled with Super-User Electric (SUE) Surcharge1
ldquoSuper User Electric Surchargerdquo for usage 400 above baseline (~3 of all usage)
Minimum bills of approximately $10month (applied to delivery revenue only)
January 2014 2019
100(60 of system usage)
219(3)
Tier 1100
Tier 2 101-400
SUEgt400
125(37)
Usage Level ( of Baseline)Usage Level ( of Baseline)
1 Completed in 20192 SCErsquos California Alternate Rates for Energy (CARE) program is an income-qualifying program that reduces energy bills for eligible customers by about 30
Winter Weekdays 8am-9pm Weekdays and Weekends 4-9pm
Off-Peak Summer Weekdays 11pm-8amWeekends All
Weekdays and Weekends All except 4-9pm
Winter Weekdays 9pm-8amWeekends All
Weekdays and Weekends 9pm-8am
Super Off-Peak Winter NA Weekdays and Weekends 8am-4pm
New Time-of-Use (TOU) Periods
bull On March 1 2019 SCE changed its basic TOU pricing period definition for the first time in over 30 years
bull Abundant mid-day renewable energy lowers prices from 8am-4pm (October - June)
bull Highest cost period is now 4pm-9pm all-days1
1 TOU pricing periods defined for non-residential customers per CPUC Decision D18-07-006 Similar residential TOU definitions were filed by SCE in A17-12-012
bull 998 solar projectsbull 320445 residential (71 of all residential customers) ndash 1756 MW bull 7333 non-residential ndash 977 MW bull Approximately 4775887 MWhyear generated
SCE Net Metering Statistics (919)
0
5
10
15
20
25
30
35
40
0
1000
2000
3000
4000
5000
6000
7000
2013 2014 2015 2016 2017 2018 2019
MW
Inst
alle
d
Num
ber o
f Sol
ar R
esid
entia
l Ins
talla
tions
Installations MW
July 1 2017bull Official start of NEM successor tariff customers are subject to
Mandatory TOU rate Non-bypassable charges Application fees
July 31 2017bull Residential customers who meet this deadline are grandfathered for
current TOU periods for maximum of 5 years (10 for non-residential)September 9 2017bull Smart Inverters required on all solar installationsJuly 25 2018bull Smart Inverters with Reactive Power Priority required on all solar
installationsNear Term Outlookbull Combination of a flatter tiered rate and the mandatory TOU NEM 20
rate structure has helped reduce the per customer cost shift further efforts to reduce the shift through new TOU pricing periods
bull Commission to revisit NEM Successor Tariff by July 2020 to evaluate the existing NEM tariffs and consider the development and adoption of successor tariffs
Key Dates
Third Quarter Earnings Summary
October 30 2019
Q32019
Q32018 Variance
Basic Earnings Per Share (EPS)1
SCE $ 145 $ 164 $ (019)
EIX Parent amp Other (009) (007) (002)
Basic EPS $ 136 $ 157 $ (021)
Less Non-core Items
SCE2 $ (014) $ 002 $ (016)
EIX Parent amp Other3 mdash (001) 001
Total Non-core $ (014) $ 001 $ (015)
Core Earnings Per Share (EPS)
SCE $ 159 $ 162 $ (003)
EIX Parent amp Other (009) (006) (003)
Core EPS $ 150 $ 156 $ (006)
Key SCE EPS Drivers4
Higher revenue5 $ 012- CPUC revenue (002)- 2018 FERC Formula Rate settlement 010- Other FERC revenue 004
Higher OampM (021)Lower depreciation 002Higher net financing costs (004)Income taxes5 019Property and other taxes (001)Results prior to impact from share dilution $ 007Impact from share dilution (010)Total core drivers $ (003)Non-core items 2 (016)Total $ (019)
Key EIX EPS Drivers4
EIX parent and other mdash Higher interest expense and corporate expenses $ (005)EEG mdash Lower corporate expenses 001Impact from share dilution 001Total core drivers $ (003)Non-core items 3 001Total $ (002)
1 See Earnings Non-GAAP reconciliations and Use of Non-GAAP Financial Measures in Appendix2 Includes SCEs contributions to Wildfire Insurance Fund in third quarter 2019 and impact from the approval of the Revised San Onofre Settlement Agreement in the third quarter 2018 3 Loss on sale of SoCore Energy4 2019 EPS drivers are reported at a consistent share count of 3258 million (2019 QTD weighted-average shares outstanding is 3471 million)5 Includes $020 of tax benefits refunded to customersNote Diluted earnings were $135 and $157 per share for the three months ended September 30 2019 and 2018 respectively
43
1 See Earnings Non-GAAP reconciliations and Use of Non-GAAP Financial Measures in Appendix2 Impact of 2018 GRC final decision related to impairment of utility property plant and equipment changes in allocation of deferred tax re-measurement between customers and
shareholders SCErsquos contributions to the Wildfire Insurance Fund gain from sale of nuclear fuel and impact from the approval of the Revised San Onofre Settlement Agreement3 Loss on sale of SoCore Energy and impact of hypothetical liquidation at book value (HLBV) accounting method4 2019 EPS drivers are reported at a consistent share count of 3258 million (2019 YTD weighted-average shares outstanding is 3330 million)5 Test Year 2018 GRC true-up of $020 includes revenue of $(034) OampM of $006 depreciation of $024 interest expense of $(001) property and other taxes of $001 and income taxes of
$0246 Includes $018 of tax benefits refunded to customersNote Diluted earnings were $342 and $308 per share for the nine months ended September 30 2019 and 2018 respectively
Year to Date Earnings Summary
October 30 2019
YTD 2019
YTD 2018 Variance
Basic Earnings Per Share (EPS)1
SCE $ 365 $ 343 $ 022
EIX Parent amp Other (022) (034) 012
Basic EPS $ 343 $ 309 $ 034
Less Non-core Items
SCE2 $ (030) $ 002 $ (032)
EIX Parent amp Other3 mdash (014) 014
Total Non-core $ (030) $ (012) $ (018)
Core Earnings Per Share (EPS)
SCE $ 395 $ 341 $ 054
EIX Parent amp Other (022) (020) (002)
Core EPS $ 373 $ 321 $ 052
Key SCE EPS Drivers4
Test Year 2018 GRC true-up5 $ 020Higher revenue6 055
- CPUC revenue 032- 2018 FERC Formula Rate settlement 010- FERC and other operating revenue 013
Higher OampM (026)Lower depreciation 005Higher net financing costs (012)Income taxes6 021Results prior to impact from share dilution $ 063Impact from share dilution (009)Total core drivers $ 054Non-core items2 (032)Total $ 022
Key EIX EPS Drivers4
EIX parent and other mdash Higher interest expense and corporate expenses $ (007)EEG mdash Lower corporate expenses and lower losses at the competitive business 004Impact from share dilution 001Total core drivers $ (002)Non-core items3 014Total $ 012
44
SCE Annual Results of Operationsbull Earning activities ndash revenue authorized by CPUC and FERC to provide reasonable cost recovery and return on investmentbull Cost-recovery activities ndash CPUC- and FERC-authorized balancing accounts to recover specific project or program costs subject
to reasonableness review or compliance with upfront standards
($ millions)
2018 2017
Earnings Activities
Cost-Recovery Activities
Total Consolidated
Earnings Activities
Cost-Recovery Activities
Total Consolidated
Operating revenue $6560 $6051 $12611 $6611 $5643 $12254Purchased power and fuel mdash 5406 5406 mdash 4873 4873Operation and maintenance 1972 730 2702 1898 824 2722Wildfire-related claims net of recoveries 2669 mdash 2669 ― ― ―Depreciation and amortization 1867 mdash 1867 2032 mdash 2032Property and other taxes 392 mdash 392 372 mdash 372Impairment and other charges (12) mdash (12) 716 mdash 716Other operating income (7) mdash (7) (8) mdash (8)Total operating expenses 6881 6136 13017 5010 5697 10707Operating (loss) income (321) (85) (406) 1601 (54) 1547Interest expense (671) (2) (673) (588) (1) (589)Other income and expenses 107 87 194 93 55 148(Loss) income before income taxes (885) mdash (885) 1106 mdash 1106Income tax (benefit) expense (696) mdash (696) (30) mdash (30)Net (loss) income (189) mdash (189) 1136 mdash 1136Preferred and preference stock dividend
requirements 121 mdash 121 124 mdash 124
Net (loss) income available for common stock ($310) mdash ($310) $1012 mdash $1012Less Non-core items (1750) (481)Core Earnings $1440 $1493
Note See Use of Non-GAAP Financial Measures
October 30 2019 45
Reconciliation of EIX Basic Earnings Per Share Guidance to EIX Core Earnings Per Share Guidance
EPS Attributable to Edison International 2019
Low Midpoint High
SCE $483
EIX Parent amp Other (032)
Basic EPS1 $441 $451 $461
Non-Core Items
SCE23 (029) (029) (029)
EIX Parent amp Other mdash mdash mdash
Total Non-Core1 (029) (029) (029)
Core EPS
SCE $512
EIX Parent amp Other (032)
Core EPS1 $470 $480 $490
1 EPS is calculated on the assumed weighted-average share count for 2019 Please see 2019 EIX Core Earnings Guidance slide for more information 2 Includes impact of 2018 GRC final decision related to impairment of utility property plant and equipment changes in allocation of deferred tax re-measurement between
customers and shareholders and SCErsquos contributions to the Wildfire Insurance Fund3 Includes $001 per share as a result of share count dilution
October 30 2019
Earnings Per Share Non-GAAP Reconciliations
46
Earnings Non-GAAP Reconciliations
1 Impact of 2018 GRC final decision related to impairment of utility property plant and equipment changes in allocation of deferred tax re-measurement between customers and shareholders SCErsquos contributions to the Wildfire Insurance Fund gain from sale of nuclear fuel and impact from the approval of the Revised San Onofre Settlement Agreement
2 Loss on sale of SoCore Energy and impact of hypothetical liquidation at book value (HLBV) accounting method
($ millions)
Reconciliation of EIX GAAP Earnings to EIX Core Earnings
Earnings Attributable to Edison International Q32019
Q32018
YTD 2019
YTD 2018
SCE $503 $536 $1215 $1119
EIX Parent amp Other (32) (23) (74) (112)
Basic Earnings $471 $513 $1141 $1007
Non-Core Items
SCE 1 ($48) 7 ($99) 7
EIX Parent amp Other 2 mdash (4) mdash (46)
Total Non-Core ($48) $3 ($99) ($39)
Core Earnings
SCE $551 $529 $1314 $1112
EIX Parent amp Other (32) (19) (74) (66)
Core Earnings $519 $510 $1240 $1046
October 30 2019 47
EIX Core EPS Non-GAAP ReconciliationsReconciliation of Edison International Basic Earnings Per Share to Edison International Core Earnings Per Share
Note See Use of Non-GAAP Financial Measures
Earnings Per Share Attributable to Edison International 2018 2017
Basic EPS ($130) $173
Non-Core Items
SCE
Wildfire-related claims net of recoveries (560) mdash
Settlement of 1994 ndash 2006 California tax audits 020 mdash
Write down impairment and other as a result of Revised San Onofre Settlement Agreement
003 (138)
Re-measurement of deferred taxes as a result of Tax Reform mdash (010)
Edison International Parent and Other
Settlement of 1994 ndash 2006 California tax audits (004) mdash
Re-measurement of deferred taxes as a result of Tax Reform mdash (133)
Sale of SoCore Energy and other (014) 004
Discontinued operations
Settlement of 1994 ndash 2006 California tax audits 010 mdash
Less Total Non-Core Items (545) (277)
Core EPS $415 $450
October 30 2019 48
Use of Non-GAAP Financial MeasuresEdison Internationals earnings are prepared in accordance with generally accepted accounting principles used in the United States Management uses core earnings internally for financial planning and for analysis of performance Core earnings are also used when communicating with investors and analysts regarding Edison Internationals earnings results to facilitate comparisons of the Companys performance from period to period Core earnings are a non-GAAP financial measure and may not be comparable to those of other companies Core earnings (or losses) are defined as earnings or losses attributable to Edison International shareholders less income or loss from discontinued operations and income or loss from significant discrete items that management does not consider representative of ongoing earnings such as exit activities including sale of certain assets and other activities that are no longer continuing asset impairments and certain tax regulatory or legal settlements or proceedings
A reconciliation of Non-GAAP information to GAAP information is included either on the slide where the information appears or on another slide referenced in this presentation
EIX Investor Relations Contact
Sam Ramraj Vice President (626) 302-2540 samramrajedisonintlcom
Allison Bahen Principal Manager (626) 302-5493 allisonbahenedisonintlcom
October 30 2019 49
Business Update
Slide Number 2
Table of Contents
EIX Strategy Should Produce Long-Term Value
SCE Highlights
Slide Number 6
SCE Historical Rate Base and Core Earnings
SCE Capital Expenditure Forecast
SCE Rate Base Forecast
Slide Number 10
Californiarsquos GHG Emissions Overview
SCErsquos Pathway 2045 Highlights
Slide Number 13
Slide Number 14
Slide Number 15
SCE Key Regulatory Proceedings
Slide Number 17
Slide Number 18
CPUC and FERC Cost of Capital Summary
CPUC Cost of Capital (2013-2019)
SCE Distribution System Investments
Slide Number 22
Slide Number 23
SCE Large Transmission Projects
SCE Operational Excellence
Responding to Industry Change
Slide Number 27
2019 EIX Core Earnings Guidance
EIX Annual Dividends Per Share
Appendix
EIXrsquos 2018 Sustainability Report Highlights
Slide Number 32
SCE Historical Capital Expenditures
Credit Ratings Summary
Distribution Power Grid of the Future
SCE Customer Demand Trends
SCE Bundled Revenue Requirement
Slide Number 38
SCE Rates and Bills Comparison
Slide Number 40
Slide Number 41
Slide Number 42
Slide Number 43
Slide Number 44
Slide Number 45
SCE Annual Results of Operations
Slide Number 47
Earnings Non-GAAP Reconciliations
EIX Core EPS Non-GAAP Reconciliations
Use of Non-GAAP Financial Measures
US Average
$134
SCE
$95
-291
US Average
128
SCE
164
higher
28
Created on Mon 6 Jun 2016 1250 PM EST (1750 GMT)
Concept
1990
1991
1992
1993
1994
1995
1996
1997
1998
1999
2000
2001
2002
2003
2004
2005
2006
2007
2008
2009
2010
2011
2012
2013
2014
2015
2016
2017
2018
2019
2020
2021
2022
2023
2024
2025
2026
Consumer Price Index All-Urban
131
136
140
144
148
152
157
161
163
167
172
177
180
184
189
195
202
207
215
215
218
225
230
233
237
237
239
245
251
258
265
272
279
286
293
300
306
422
304
297
260
281
294
234
155
219
337
282
160
230
267
337
322
287
381
-032
164
314
208
147
161
012
105
236
253
265
265
264
254
251
249
234
227
SOUTHERN CALIFORNIA EDISON
System Average Rate Forecast
Source Matt Sheriff
(centkWh)
SCE System Average Rate
SAR CPI (old)
SAR CPI (current)
CPI Los Angeles-Long Beach-Anaheim CA
Consumer Price Index All-Urban
0
1990
97cent
97cent
97cent
593
30
1
1991
103cent
101cent
101cent
410
422
2
1992
106cent
104cent
105cent
361
304
3
1993
103cent
107cent
107cent
253
297
4
1994
105cent
110cent
109cent
137
260
5
1995
107cent
113cent
110cent
153
281
25
6
1996
101cent
116cent
112cent
183
294
7
1997
101cent
119cent
114cent
158
234
8
1998
96cent
121cent
116cent
144
155
9
1999
96cent
124cent
119cent
235
219
10
2000
96cent
128cent
122cent
330
337
20
11
2001
142cent
131cent
127cent
336
282
12
2002
142cent
134cent
130cent
277
160
13
2003
124cent
137cent
133cent
259
230
14
2004
122cent
140cent
138cent
334
267
15
2005
126cent
145cent
144cent
447
337
16
2006
147cent
150cent
150cent
427
322
17
2007
139cent
154cent
155cent
328
287
18
2008
137cent
160cent
161cent
353
381
19
2009
143cent
159cent
159cent
-080
-032
20
2010
143cent
162cent
161cent
120
164
10
21
2011
141cent
167cent
166cent
267
314
22
2012
143cent
170cent
169cent
203
208
23
2013
159cent
173cent
171cent
108
147
24
2014
167cent
176cent
173cent
135
161
25
2015
159cent
176cent
175cent
091
012
5
26
2016
148cent
178cent
178cent
189
105
27
2017
157cent
182cent
183cent
279
236
29
20
10
28
2018
160cent
187cent
190cent
381
253
SCE
17
26
11
29
2019
159cent
192cent
195cent
244
265
LA
24
25
20
30
2020
194cent
197cent
199cent
219
265
36
31
2021
199cent
202cent
203cent
227
266
25
49
Created on Wed 23 Jan 2019 1245 PM EST (1745 GMT)
Mnemonic
Long Label
Last Update
Start Date
End Date
Frequency
1970
1971
1972
1973
1974
1975
1976
1977
1978
1979
1980
1981
1982
1983
1984
1985
1986
1987
1988
1989
1990
1991
1992
1993
1994
1995
1996
1997
1998
1999
2000
2001
2002
2003
2004
2005
2006
2007
2008
2009
2010
2011
2012
2013
2014
2015
2016
2017
2018
2019
2020
2021
2022
2023
2024
2025
2026
2027
2028
2029
2030
2031
2032
2033
2034
2035
2036
2037
2038
2039
2040
2041
2042
2043
2044
2045
2046
2047
2048
CPILANGAFRSM1
Los Angeles-Long Beach-Anaheim CA (MSA) [2013 Definition] FIPS Code 31080 Consumer Price Index for All Urban Consumers (1982-84=100) IHS MARKIT ECONOMICS December 2018 Forecast Source Bureau of Labor Statistics End of Historical Data 2017
122718
1970
2048
ANNUAL
3868
4011
4139
4374
4825
5334
5683
6080
6526
7233
8372
9184
9734
9907
10360
10838
11193
11667
12206
12826
13587
14143
14654
15025
15231
15464
15748
15997
16227
16608
17155
17732
18223
18696
19320
20183
21044
21734
22501
22322
22589
23193
23665
23921
24243
24463
24925
25621
26598
27248
27844
28475
29132
29806
30500
31165
31832
32533
33254
33985
34744
35508
36279
37061
37854
38640
39440
40278
41145
42043
42963
43898
44852
45825
46816
47822
48857
49934
51047
371
320
568
1031
1055
655
698
733
1083
1575
971
599
177
458
461
328
423
462
508
593
410
361
253
137
153
183
158
144
235
330
336
277
259
334
447
427
328
353
-080
120
267
203
108
135
091
189
279
381
244
219
227
231
231
233
218
214
220
222
220
223
220
217
215
214
208
207
213
215
218
219
218
217
217
216
215
216
220
223
Date of Report
July 26 2019
July 29 2019
July 29 2019
Edison International
Corporate Outlook
BBBStable
Baa3Stable
BBB-Stable
Senior Unsecured
BBB-
Baa3
BBB-
Commercial Paper
A-2
P-3
F3
Southern California Edison
Corporate Outlook
BBBStable
Baa2Stable
BBB-Stable
First Mortgage Bonds
A-
A3
BBB+
Senior Unsecured
BBB
Baa2
BBB
Preferred Securities
BB+
Ba1
BB+
Commercial Paper
A-2
P-2
F3
Credit Ratings Summary
Date of Report July 26 2019 July 29 2019 July 29 2019
Edison InternationalCorporate Outlook BBBStable Baa3Stable BBB-StableSenior Unsecured BBB- Baa3 BBB-Commercial Paper A-2 P-3 F3
Southern California EdisonCorporate Outlook BBBStable Baa2Stable BBB-StableFirst Mortgage Bonds A- A3 BBB+Senior Unsecured BBB Baa2 BBBPreferred Securities BB+ Ba1 BB+Commercial Paper A-2 P-2 F3
FitchMoodyrsquosSampP
October 30 2019 33
4
ampCalibriRegularFINANCIAL AND STATISTICAL REPORTampCalibriRegularampA
Distribution Power Grid of the Future
One-Way Electricity Flowbull System designed to distribute electricity
from large central generating plantsbull Voltage centrally maintainedbull Increasing integration of distributed
energy resourcesbull Limited situational awareness and
visualization tools for power grid operators
Renewable Generation Mandates
Subsidized Residential Solar
Limited Electric Vehicle Charging Infrastructure
Variable Two-Way Electricity Flowbull Distribution system at the center of the
power gridbull System designed to manage fluctuating
resources and customer demand bull Digital monitoring and control devices and
advanced communications systems to improve safety and reliability and integrate DERs
bull Improved data management and power grid operations and cyber risk mitigation
bull Integrated utility distribution with distributed energy resources planning
Maximize Distributed Resources and Electric Vehicle Adoptionbull Distribution power grid infrastructure
design supports customer choice and greater resiliency
Current State Future State
October 30 2019 34
SCE Customer Demand Trends
Note See Edison International Financial and Statistical Reports for 2017 for further information
Kilowatt-Hour Sales (millions of kWh) 2014 2015 2016 2017 2018
Residential 30027 30093 29579 30221 29865
Commercial 42004 42396 42189 42514 42369
Industrial 8392 7623 7162 6659 6786
Public authorities 4975 4795 4715 4711 4510
Agricultural and other 2019 1950 1803 1498 1745
Subtotal 87416 86857 85448 85602 85276
Resale 1308 1080 1794 1568 1867
Total Kilowatt-Hour Sales 88725 87937 87242 87170 87143
Total Number of Customers 5005401 5033330 5060528 5094818 5126985
Number of New Connections 29879 31653 38076 39621 39633
Area Peak Demand (MW) 23055 23079 23091 23508 23766
October 30 2019 35
SCE Bundled Revenue Requirement
Note Rates in effect as of July 26 2019 Represents bundled service which excludes Direct AccessCCA customers that do not receive generation services from SCE
SCE Systemwide Average Rate History (centkWh)
2010 2011 2012 2013 2014 2015 2016 2017 2018 2019
143 141 143 159 167 162 148 157 160 159
Fuel amp Purchased Power(47)
Distribution(38)
Transmission (8)
Generation(8)
Other (-1)
2019 Bundled Revenue
Requirement
$millions centkWh
Fuel amp Purchased Power ndash includes CDWR Bond Charge
4422 74
Distribution ndash poles wires substations service centers Edison SmartConnectreg
3628 61
Generation ndash owned generation investment and OampM 708 12
Transmission ndash greater than 220kV 789 13
Other ndash CPUC and legislative public purpose programs system reliability investments nuclear decommissioning and prior-year over collections
(116) (01)
Total Bundled Revenue Requirement ($millions) $9431
divide Bundled kWh (millions) 59396
= Bundled Systemwide Average Rate (centkWh) 159cent
October 30 2019 36
37
97cent
159cent
80cent
100cent
120cent
140cent
160cent
180cent
200cent
220cent
1990
1991
1992
1993
1994
1995
1996
1997
1998
1999
2000
2001
2002
2003
2004
2005
2006
2007
2008
2009
2010
2011
2012
2013
2014
2015
2016
2017
2018
2019
195cent
Rates reduced due to the implementation of 1) the SONGS Revised Settlement including NEIL insurance benefits 2) lower fuel amp purchased power costs and 3) a lower 2015 GRC revenue requirement that includes flow-through tax benefits
centkWh
System Average Rate Historical Growth
SCErsquos system average rate has grown less than inflation over the last 29 years
SCE System Average RateLos Angeles Area Inflation
Comparative System Average Rates
Delta to SCESCE 159cent --
PGampE 211cent1 33
SDGampE 246cent1 55
CAGR29-yr
(lsquo90-rsquo19)20-yr
(lsquo99-rsquo19)10-yr
(lsquo09-19)17 26 1124 25 20
Energy Crisis and return to normal
Higher gas price forecast post-Katrina leads to higher rates with subsequent refund of over collection
Delay in 2012 GRC leads to shorter ramp-up of rate increase
1 PGampE Advice 5644-E effective October 1 SDGampE Advice 3377-E effective June 1
October 30 2019
Data
SCE System Average Rate
1990199119921993199419951996199719981999200020012002200320042005200620072008200920102011201220132014201520162017201820199699999999999999310310610310510710110196969614214212412212614713913714314314114315916715940876786458386148350382761769171566871495475337116159CPI Los Angeles-Long Beach-Anaheim CA199019911992199319941995199619971998199920002001200220032004200520062007200820092010201120122013201420152016201720182019202096999999999999993100974239450441131046212585868498310726876840039228108738285083414611104041339548576811242695044160916114205839057899881158478900883218511856679342492612122475588812561061265926153091265513010279685966582133476140824337041379322865554462144095927379783561502417198233561515516495767909655160640840897938551593635512757601816127380397448466165581867639842851689511064769380217077830471050007173082233194307481746514628312063517794555998527898182917523920509811898939005269867419453007660169238SAR CPI (old)1990199119921993199419951996199719981999200020012002200320042005200620072008200920102011201220132014201520162017201820199699999999999999310108935518848128104164104853626311072574143759422111004139294598572113128515849244651164507302761853711917284265578923121016455131068581236705147011944127834109318192141314347216021390513353198545827113660054850437767140244467121649041449648574526591614963575483132515393112443397234159803525097292715929158237134114161898499904328691669815498437507617045100580396491729508329612907517573561579182243175943857388863061777863624593457518198880904395583186584452388557219152742489955948
195cent
CPI Workbook
image1png
129 ₵
164 ₵
US Average SCE
27 Higher
SCE Rates and Bills Comparison
SCErsquos average residential rates are above national averagebut residential bills are below national average due to lower usage
bull SCErsquos residential rates are above national average due in part to a cleaner fuel mix high cost of living and lower system load factor
bull SCErsquos residential customer usage is lower than the national average due to mild climate and higher energy efficiency appliance and building standards
bull Average monthly residential bills are lower than the national average as higher rate levels are more than offset by lower usage
Key FactorsKey Factors
Source EIAs Form 861M (formerly Form 826) Data Monthly Electric Utility Sales and Revenue Data for 12-Months Ending June 2019 httpswwweiagovelectricitydataeia861mindexhtml
2018-19 Average Residential Rates (centkWh)
2018-19 Average Residential Bills ($ per Month)
$128
$95
US Average SCE
26 Lower
October 30 2019 38
Sheet1
Sheet1
129 ₵
164 ₵
Sheet2
27 Higher
Sheet3
Sheet1
Sheet1
$128
Sheet2
26 Lower
Sheet3
bull Assembly Bill 1171 permits cities and counties and Joint Powers Agencies (JPAs) to act as CCAs to purchase and sell electricity on behalf of the utility customers within their jurisdiction
bull An Order Instituting Rulemaking (OIR R17-06-026) was opened on June 29 2017 to review revise and consider alternatives to the ldquoPower Charge Indifference Adjustmentrdquo or PCIA The PCIA allocates a proportional share of above-market costs of SCErsquos
energy procurement portfolio to departing load customers to ensure remaining bundled service customers are indifferent
October 11 2018 Commission decision changes PCIA methodology and has substantially addressed the historical subsidy to departing load that materialized when renewables market prices declined over the past 4 yearso Decision also established a Phase 2 which is addressing utility
portfolio optimization PCIA ldquopre-paymentrdquo options for entities and individual departing load customers and implementation of the ldquotrue-uprdquo process for Resource Adequacy (RA) and Renewable Energy Credits (RECs) costs
o A Phase 2 final decision on the benchmark and true-up process was approved on October 10 2019 with the other Phase 2 activities to continue into 2020
bull On February 8 2018 the Commission approved Resolution E-4907 requiring CCAs to demonstrate compliance with annual Resource Adequacy (RA) requirements prior to commencing operations
bull Existing Direct Access and CCA load is expected to be ~35 of SCErsquos total load by the end of 2019
Investor-Owned Utility (IOU)
Community Choice Aggregator (CCA)
Community Choice Aggregator (CCA) Overview
Approximately 40 of SCErsquos bundled service load could be part of a CCA or Direct Access by the end of 2020
October 30 2019 39
bull CPUC Order Instituting Ratemaking R 12-06-013 comprehensively reviewed residential rate structure including a future transition to Time of Use (TOU) rates In March 2018 SCE began to migrate 400000 residential customers to TOU rate structures
Remaining eligible residential customers to be migrated beginning October 2020bull July 2015 CPUC Decision D 15-07-001 includes Transition to 2 tiered rate structure coupled with Super-User Electric (SUE) Surcharge1
ldquoSuper User Electric Surchargerdquo for usage 400 above baseline (~3 of all usage)
Minimum bills of approximately $10month (applied to delivery revenue only)
January 2014 2019
100(60 of system usage)
219(3)
Tier 1100
Tier 2 101-400
SUEgt400
125(37)
Usage Level ( of Baseline)Usage Level ( of Baseline)
1 Completed in 20192 SCErsquos California Alternate Rates for Energy (CARE) program is an income-qualifying program that reduces energy bills for eligible customers by about 30
Winter Weekdays 8am-9pm Weekdays and Weekends 4-9pm
Off-Peak Summer Weekdays 11pm-8amWeekends All
Weekdays and Weekends All except 4-9pm
Winter Weekdays 9pm-8amWeekends All
Weekdays and Weekends 9pm-8am
Super Off-Peak Winter NA Weekdays and Weekends 8am-4pm
New Time-of-Use (TOU) Periods
bull On March 1 2019 SCE changed its basic TOU pricing period definition for the first time in over 30 years
bull Abundant mid-day renewable energy lowers prices from 8am-4pm (October - June)
bull Highest cost period is now 4pm-9pm all-days1
1 TOU pricing periods defined for non-residential customers per CPUC Decision D18-07-006 Similar residential TOU definitions were filed by SCE in A17-12-012
bull 998 solar projectsbull 320445 residential (71 of all residential customers) ndash 1756 MW bull 7333 non-residential ndash 977 MW bull Approximately 4775887 MWhyear generated
SCE Net Metering Statistics (919)
0
5
10
15
20
25
30
35
40
0
1000
2000
3000
4000
5000
6000
7000
2013 2014 2015 2016 2017 2018 2019
MW
Inst
alle
d
Num
ber o
f Sol
ar R
esid
entia
l Ins
talla
tions
Installations MW
July 1 2017bull Official start of NEM successor tariff customers are subject to
Mandatory TOU rate Non-bypassable charges Application fees
July 31 2017bull Residential customers who meet this deadline are grandfathered for
current TOU periods for maximum of 5 years (10 for non-residential)September 9 2017bull Smart Inverters required on all solar installationsJuly 25 2018bull Smart Inverters with Reactive Power Priority required on all solar
installationsNear Term Outlookbull Combination of a flatter tiered rate and the mandatory TOU NEM 20
rate structure has helped reduce the per customer cost shift further efforts to reduce the shift through new TOU pricing periods
bull Commission to revisit NEM Successor Tariff by July 2020 to evaluate the existing NEM tariffs and consider the development and adoption of successor tariffs
Key Dates
Third Quarter Earnings Summary
October 30 2019
Q32019
Q32018 Variance
Basic Earnings Per Share (EPS)1
SCE $ 145 $ 164 $ (019)
EIX Parent amp Other (009) (007) (002)
Basic EPS $ 136 $ 157 $ (021)
Less Non-core Items
SCE2 $ (014) $ 002 $ (016)
EIX Parent amp Other3 mdash (001) 001
Total Non-core $ (014) $ 001 $ (015)
Core Earnings Per Share (EPS)
SCE $ 159 $ 162 $ (003)
EIX Parent amp Other (009) (006) (003)
Core EPS $ 150 $ 156 $ (006)
Key SCE EPS Drivers4
Higher revenue5 $ 012- CPUC revenue (002)- 2018 FERC Formula Rate settlement 010- Other FERC revenue 004
Higher OampM (021)Lower depreciation 002Higher net financing costs (004)Income taxes5 019Property and other taxes (001)Results prior to impact from share dilution $ 007Impact from share dilution (010)Total core drivers $ (003)Non-core items 2 (016)Total $ (019)
Key EIX EPS Drivers4
EIX parent and other mdash Higher interest expense and corporate expenses $ (005)EEG mdash Lower corporate expenses 001Impact from share dilution 001Total core drivers $ (003)Non-core items 3 001Total $ (002)
1 See Earnings Non-GAAP reconciliations and Use of Non-GAAP Financial Measures in Appendix2 Includes SCEs contributions to Wildfire Insurance Fund in third quarter 2019 and impact from the approval of the Revised San Onofre Settlement Agreement in the third quarter 2018 3 Loss on sale of SoCore Energy4 2019 EPS drivers are reported at a consistent share count of 3258 million (2019 QTD weighted-average shares outstanding is 3471 million)5 Includes $020 of tax benefits refunded to customersNote Diluted earnings were $135 and $157 per share for the three months ended September 30 2019 and 2018 respectively
43
1 See Earnings Non-GAAP reconciliations and Use of Non-GAAP Financial Measures in Appendix2 Impact of 2018 GRC final decision related to impairment of utility property plant and equipment changes in allocation of deferred tax re-measurement between customers and
shareholders SCErsquos contributions to the Wildfire Insurance Fund gain from sale of nuclear fuel and impact from the approval of the Revised San Onofre Settlement Agreement3 Loss on sale of SoCore Energy and impact of hypothetical liquidation at book value (HLBV) accounting method4 2019 EPS drivers are reported at a consistent share count of 3258 million (2019 YTD weighted-average shares outstanding is 3330 million)5 Test Year 2018 GRC true-up of $020 includes revenue of $(034) OampM of $006 depreciation of $024 interest expense of $(001) property and other taxes of $001 and income taxes of
$0246 Includes $018 of tax benefits refunded to customersNote Diluted earnings were $342 and $308 per share for the nine months ended September 30 2019 and 2018 respectively
Year to Date Earnings Summary
October 30 2019
YTD 2019
YTD 2018 Variance
Basic Earnings Per Share (EPS)1
SCE $ 365 $ 343 $ 022
EIX Parent amp Other (022) (034) 012
Basic EPS $ 343 $ 309 $ 034
Less Non-core Items
SCE2 $ (030) $ 002 $ (032)
EIX Parent amp Other3 mdash (014) 014
Total Non-core $ (030) $ (012) $ (018)
Core Earnings Per Share (EPS)
SCE $ 395 $ 341 $ 054
EIX Parent amp Other (022) (020) (002)
Core EPS $ 373 $ 321 $ 052
Key SCE EPS Drivers4
Test Year 2018 GRC true-up5 $ 020Higher revenue6 055
- CPUC revenue 032- 2018 FERC Formula Rate settlement 010- FERC and other operating revenue 013
Higher OampM (026)Lower depreciation 005Higher net financing costs (012)Income taxes6 021Results prior to impact from share dilution $ 063Impact from share dilution (009)Total core drivers $ 054Non-core items2 (032)Total $ 022
Key EIX EPS Drivers4
EIX parent and other mdash Higher interest expense and corporate expenses $ (007)EEG mdash Lower corporate expenses and lower losses at the competitive business 004Impact from share dilution 001Total core drivers $ (002)Non-core items3 014Total $ 012
44
SCE Annual Results of Operationsbull Earning activities ndash revenue authorized by CPUC and FERC to provide reasonable cost recovery and return on investmentbull Cost-recovery activities ndash CPUC- and FERC-authorized balancing accounts to recover specific project or program costs subject
to reasonableness review or compliance with upfront standards
($ millions)
2018 2017
Earnings Activities
Cost-Recovery Activities
Total Consolidated
Earnings Activities
Cost-Recovery Activities
Total Consolidated
Operating revenue $6560 $6051 $12611 $6611 $5643 $12254Purchased power and fuel mdash 5406 5406 mdash 4873 4873Operation and maintenance 1972 730 2702 1898 824 2722Wildfire-related claims net of recoveries 2669 mdash 2669 ― ― ―Depreciation and amortization 1867 mdash 1867 2032 mdash 2032Property and other taxes 392 mdash 392 372 mdash 372Impairment and other charges (12) mdash (12) 716 mdash 716Other operating income (7) mdash (7) (8) mdash (8)Total operating expenses 6881 6136 13017 5010 5697 10707Operating (loss) income (321) (85) (406) 1601 (54) 1547Interest expense (671) (2) (673) (588) (1) (589)Other income and expenses 107 87 194 93 55 148(Loss) income before income taxes (885) mdash (885) 1106 mdash 1106Income tax (benefit) expense (696) mdash (696) (30) mdash (30)Net (loss) income (189) mdash (189) 1136 mdash 1136Preferred and preference stock dividend
requirements 121 mdash 121 124 mdash 124
Net (loss) income available for common stock ($310) mdash ($310) $1012 mdash $1012Less Non-core items (1750) (481)Core Earnings $1440 $1493
Note See Use of Non-GAAP Financial Measures
October 30 2019 45
Reconciliation of EIX Basic Earnings Per Share Guidance to EIX Core Earnings Per Share Guidance
EPS Attributable to Edison International 2019
Low Midpoint High
SCE $483
EIX Parent amp Other (032)
Basic EPS1 $441 $451 $461
Non-Core Items
SCE23 (029) (029) (029)
EIX Parent amp Other mdash mdash mdash
Total Non-Core1 (029) (029) (029)
Core EPS
SCE $512
EIX Parent amp Other (032)
Core EPS1 $470 $480 $490
1 EPS is calculated on the assumed weighted-average share count for 2019 Please see 2019 EIX Core Earnings Guidance slide for more information 2 Includes impact of 2018 GRC final decision related to impairment of utility property plant and equipment changes in allocation of deferred tax re-measurement between
customers and shareholders and SCErsquos contributions to the Wildfire Insurance Fund3 Includes $001 per share as a result of share count dilution
October 30 2019
Earnings Per Share Non-GAAP Reconciliations
46
Earnings Non-GAAP Reconciliations
1 Impact of 2018 GRC final decision related to impairment of utility property plant and equipment changes in allocation of deferred tax re-measurement between customers and shareholders SCErsquos contributions to the Wildfire Insurance Fund gain from sale of nuclear fuel and impact from the approval of the Revised San Onofre Settlement Agreement
2 Loss on sale of SoCore Energy and impact of hypothetical liquidation at book value (HLBV) accounting method
($ millions)
Reconciliation of EIX GAAP Earnings to EIX Core Earnings
Earnings Attributable to Edison International Q32019
Q32018
YTD 2019
YTD 2018
SCE $503 $536 $1215 $1119
EIX Parent amp Other (32) (23) (74) (112)
Basic Earnings $471 $513 $1141 $1007
Non-Core Items
SCE 1 ($48) 7 ($99) 7
EIX Parent amp Other 2 mdash (4) mdash (46)
Total Non-Core ($48) $3 ($99) ($39)
Core Earnings
SCE $551 $529 $1314 $1112
EIX Parent amp Other (32) (19) (74) (66)
Core Earnings $519 $510 $1240 $1046
October 30 2019 47
EIX Core EPS Non-GAAP ReconciliationsReconciliation of Edison International Basic Earnings Per Share to Edison International Core Earnings Per Share
Note See Use of Non-GAAP Financial Measures
Earnings Per Share Attributable to Edison International 2018 2017
Basic EPS ($130) $173
Non-Core Items
SCE
Wildfire-related claims net of recoveries (560) mdash
Settlement of 1994 ndash 2006 California tax audits 020 mdash
Write down impairment and other as a result of Revised San Onofre Settlement Agreement
003 (138)
Re-measurement of deferred taxes as a result of Tax Reform mdash (010)
Edison International Parent and Other
Settlement of 1994 ndash 2006 California tax audits (004) mdash
Re-measurement of deferred taxes as a result of Tax Reform mdash (133)
Sale of SoCore Energy and other (014) 004
Discontinued operations
Settlement of 1994 ndash 2006 California tax audits 010 mdash
Less Total Non-Core Items (545) (277)
Core EPS $415 $450
October 30 2019 48
Use of Non-GAAP Financial MeasuresEdison Internationals earnings are prepared in accordance with generally accepted accounting principles used in the United States Management uses core earnings internally for financial planning and for analysis of performance Core earnings are also used when communicating with investors and analysts regarding Edison Internationals earnings results to facilitate comparisons of the Companys performance from period to period Core earnings are a non-GAAP financial measure and may not be comparable to those of other companies Core earnings (or losses) are defined as earnings or losses attributable to Edison International shareholders less income or loss from discontinued operations and income or loss from significant discrete items that management does not consider representative of ongoing earnings such as exit activities including sale of certain assets and other activities that are no longer continuing asset impairments and certain tax regulatory or legal settlements or proceedings
A reconciliation of Non-GAAP information to GAAP information is included either on the slide where the information appears or on another slide referenced in this presentation
EIX Investor Relations Contact
Sam Ramraj Vice President (626) 302-2540 samramrajedisonintlcom
Allison Bahen Principal Manager (626) 302-5493 allisonbahenedisonintlcom
October 30 2019 49
Business Update
Slide Number 2
Table of Contents
EIX Strategy Should Produce Long-Term Value
SCE Highlights
Slide Number 6
SCE Historical Rate Base and Core Earnings
SCE Capital Expenditure Forecast
SCE Rate Base Forecast
Slide Number 10
Californiarsquos GHG Emissions Overview
SCErsquos Pathway 2045 Highlights
Slide Number 13
Slide Number 14
Slide Number 15
SCE Key Regulatory Proceedings
Slide Number 17
Slide Number 18
CPUC and FERC Cost of Capital Summary
CPUC Cost of Capital (2013-2019)
SCE Distribution System Investments
Slide Number 22
Slide Number 23
SCE Large Transmission Projects
SCE Operational Excellence
Responding to Industry Change
Slide Number 27
2019 EIX Core Earnings Guidance
EIX Annual Dividends Per Share
Appendix
EIXrsquos 2018 Sustainability Report Highlights
Slide Number 32
SCE Historical Capital Expenditures
Credit Ratings Summary
Distribution Power Grid of the Future
SCE Customer Demand Trends
SCE Bundled Revenue Requirement
Slide Number 38
SCE Rates and Bills Comparison
Slide Number 40
Slide Number 41
Slide Number 42
Slide Number 43
Slide Number 44
Slide Number 45
SCE Annual Results of Operations
Slide Number 47
Earnings Non-GAAP Reconciliations
EIX Core EPS Non-GAAP Reconciliations
Use of Non-GAAP Financial Measures
US Average
$134
SCE
$95
-291
US Average
128
SCE
164
higher
28
Created on Mon 6 Jun 2016 1250 PM EST (1750 GMT)
Concept
1990
1991
1992
1993
1994
1995
1996
1997
1998
1999
2000
2001
2002
2003
2004
2005
2006
2007
2008
2009
2010
2011
2012
2013
2014
2015
2016
2017
2018
2019
2020
2021
2022
2023
2024
2025
2026
Consumer Price Index All-Urban
131
136
140
144
148
152
157
161
163
167
172
177
180
184
189
195
202
207
215
215
218
225
230
233
237
237
239
245
251
258
265
272
279
286
293
300
306
422
304
297
260
281
294
234
155
219
337
282
160
230
267
337
322
287
381
-032
164
314
208
147
161
012
105
236
253
265
265
264
254
251
249
234
227
SOUTHERN CALIFORNIA EDISON
System Average Rate Forecast
Source Matt Sheriff
(centkWh)
SCE System Average Rate
SAR CPI (old)
SAR CPI (current)
CPI Los Angeles-Long Beach-Anaheim CA
Consumer Price Index All-Urban
0
1990
97cent
97cent
97cent
593
30
1
1991
103cent
101cent
101cent
410
422
2
1992
106cent
104cent
105cent
361
304
3
1993
103cent
107cent
107cent
253
297
4
1994
105cent
110cent
109cent
137
260
5
1995
107cent
113cent
110cent
153
281
25
6
1996
101cent
116cent
112cent
183
294
7
1997
101cent
119cent
114cent
158
234
8
1998
96cent
121cent
116cent
144
155
9
1999
96cent
124cent
119cent
235
219
10
2000
96cent
128cent
122cent
330
337
20
11
2001
142cent
131cent
127cent
336
282
12
2002
142cent
134cent
130cent
277
160
13
2003
124cent
137cent
133cent
259
230
14
2004
122cent
140cent
138cent
334
267
15
2005
126cent
145cent
144cent
447
337
16
2006
147cent
150cent
150cent
427
322
17
2007
139cent
154cent
155cent
328
287
18
2008
137cent
160cent
161cent
353
381
19
2009
143cent
159cent
159cent
-080
-032
20
2010
143cent
162cent
161cent
120
164
10
21
2011
141cent
167cent
166cent
267
314
22
2012
143cent
170cent
169cent
203
208
23
2013
159cent
173cent
171cent
108
147
24
2014
167cent
176cent
173cent
135
161
25
2015
159cent
176cent
175cent
091
012
5
26
2016
148cent
178cent
178cent
189
105
27
2017
157cent
182cent
183cent
279
236
29
20
10
28
2018
160cent
187cent
190cent
381
253
SCE
17
26
11
29
2019
159cent
192cent
195cent
244
265
LA
24
25
20
30
2020
194cent
197cent
199cent
219
265
36
31
2021
199cent
202cent
203cent
227
266
25
49
Created on Wed 23 Jan 2019 1245 PM EST (1745 GMT)
Mnemonic
Long Label
Last Update
Start Date
End Date
Frequency
1970
1971
1972
1973
1974
1975
1976
1977
1978
1979
1980
1981
1982
1983
1984
1985
1986
1987
1988
1989
1990
1991
1992
1993
1994
1995
1996
1997
1998
1999
2000
2001
2002
2003
2004
2005
2006
2007
2008
2009
2010
2011
2012
2013
2014
2015
2016
2017
2018
2019
2020
2021
2022
2023
2024
2025
2026
2027
2028
2029
2030
2031
2032
2033
2034
2035
2036
2037
2038
2039
2040
2041
2042
2043
2044
2045
2046
2047
2048
CPILANGAFRSM1
Los Angeles-Long Beach-Anaheim CA (MSA) [2013 Definition] FIPS Code 31080 Consumer Price Index for All Urban Consumers (1982-84=100) IHS MARKIT ECONOMICS December 2018 Forecast Source Bureau of Labor Statistics End of Historical Data 2017
122718
1970
2048
ANNUAL
3868
4011
4139
4374
4825
5334
5683
6080
6526
7233
8372
9184
9734
9907
10360
10838
11193
11667
12206
12826
13587
14143
14654
15025
15231
15464
15748
15997
16227
16608
17155
17732
18223
18696
19320
20183
21044
21734
22501
22322
22589
23193
23665
23921
24243
24463
24925
25621
26598
27248
27844
28475
29132
29806
30500
31165
31832
32533
33254
33985
34744
35508
36279
37061
37854
38640
39440
40278
41145
42043
42963
43898
44852
45825
46816
47822
48857
49934
51047
371
320
568
1031
1055
655
698
733
1083
1575
971
599
177
458
461
328
423
462
508
593
410
361
253
137
153
183
158
144
235
330
336
277
259
334
447
427
328
353
-080
120
267
203
108
135
091
189
279
381
244
219
227
231
231
233
218
214
220
222
220
223
220
217
215
214
208
207
213
215
218
219
218
217
217
216
215
216
220
223
Date of Report
July 26 2019
July 29 2019
July 29 2019
Edison International
Corporate Outlook
BBBStable
Baa3Stable
BBB-Stable
Senior Unsecured
BBB-
Baa3
BBB-
Commercial Paper
A-2
P-3
F3
Southern California Edison
Corporate Outlook
BBBStable
Baa2Stable
BBB-Stable
First Mortgage Bonds
A-
A3
BBB+
Senior Unsecured
BBB
Baa2
BBB
Preferred Securities
BB+
Ba1
BB+
Commercial Paper
A-2
P-2
F3
Distribution Power Grid of the Future
One-Way Electricity Flowbull System designed to distribute electricity
from large central generating plantsbull Voltage centrally maintainedbull Increasing integration of distributed
energy resourcesbull Limited situational awareness and
visualization tools for power grid operators
Renewable Generation Mandates
Subsidized Residential Solar
Limited Electric Vehicle Charging Infrastructure
Variable Two-Way Electricity Flowbull Distribution system at the center of the
power gridbull System designed to manage fluctuating
resources and customer demand bull Digital monitoring and control devices and
advanced communications systems to improve safety and reliability and integrate DERs
bull Improved data management and power grid operations and cyber risk mitigation
bull Integrated utility distribution with distributed energy resources planning
Maximize Distributed Resources and Electric Vehicle Adoptionbull Distribution power grid infrastructure
design supports customer choice and greater resiliency
Current State Future State
October 30 2019 34
SCE Customer Demand Trends
Note See Edison International Financial and Statistical Reports for 2017 for further information
Kilowatt-Hour Sales (millions of kWh) 2014 2015 2016 2017 2018
Residential 30027 30093 29579 30221 29865
Commercial 42004 42396 42189 42514 42369
Industrial 8392 7623 7162 6659 6786
Public authorities 4975 4795 4715 4711 4510
Agricultural and other 2019 1950 1803 1498 1745
Subtotal 87416 86857 85448 85602 85276
Resale 1308 1080 1794 1568 1867
Total Kilowatt-Hour Sales 88725 87937 87242 87170 87143
Total Number of Customers 5005401 5033330 5060528 5094818 5126985
Number of New Connections 29879 31653 38076 39621 39633
Area Peak Demand (MW) 23055 23079 23091 23508 23766
October 30 2019 35
SCE Bundled Revenue Requirement
Note Rates in effect as of July 26 2019 Represents bundled service which excludes Direct AccessCCA customers that do not receive generation services from SCE
SCE Systemwide Average Rate History (centkWh)
2010 2011 2012 2013 2014 2015 2016 2017 2018 2019
143 141 143 159 167 162 148 157 160 159
Fuel amp Purchased Power(47)
Distribution(38)
Transmission (8)
Generation(8)
Other (-1)
2019 Bundled Revenue
Requirement
$millions centkWh
Fuel amp Purchased Power ndash includes CDWR Bond Charge
4422 74
Distribution ndash poles wires substations service centers Edison SmartConnectreg
3628 61
Generation ndash owned generation investment and OampM 708 12
Transmission ndash greater than 220kV 789 13
Other ndash CPUC and legislative public purpose programs system reliability investments nuclear decommissioning and prior-year over collections
(116) (01)
Total Bundled Revenue Requirement ($millions) $9431
divide Bundled kWh (millions) 59396
= Bundled Systemwide Average Rate (centkWh) 159cent
October 30 2019 36
37
97cent
159cent
80cent
100cent
120cent
140cent
160cent
180cent
200cent
220cent
1990
1991
1992
1993
1994
1995
1996
1997
1998
1999
2000
2001
2002
2003
2004
2005
2006
2007
2008
2009
2010
2011
2012
2013
2014
2015
2016
2017
2018
2019
195cent
Rates reduced due to the implementation of 1) the SONGS Revised Settlement including NEIL insurance benefits 2) lower fuel amp purchased power costs and 3) a lower 2015 GRC revenue requirement that includes flow-through tax benefits
centkWh
System Average Rate Historical Growth
SCErsquos system average rate has grown less than inflation over the last 29 years
SCE System Average RateLos Angeles Area Inflation
Comparative System Average Rates
Delta to SCESCE 159cent --
PGampE 211cent1 33
SDGampE 246cent1 55
CAGR29-yr
(lsquo90-rsquo19)20-yr
(lsquo99-rsquo19)10-yr
(lsquo09-19)17 26 1124 25 20
Energy Crisis and return to normal
Higher gas price forecast post-Katrina leads to higher rates with subsequent refund of over collection
Delay in 2012 GRC leads to shorter ramp-up of rate increase
1 PGampE Advice 5644-E effective October 1 SDGampE Advice 3377-E effective June 1
October 30 2019
Data
SCE System Average Rate
1990199119921993199419951996199719981999200020012002200320042005200620072008200920102011201220132014201520162017201820199699999999999999310310610310510710110196969614214212412212614713913714314314114315916715940876786458386148350382761769171566871495475337116159CPI Los Angeles-Long Beach-Anaheim CA199019911992199319941995199619971998199920002001200220032004200520062007200820092010201120122013201420152016201720182019202096999999999999993100974239450441131046212585868498310726876840039228108738285083414611104041339548576811242695044160916114205839057899881158478900883218511856679342492612122475588812561061265926153091265513010279685966582133476140824337041379322865554462144095927379783561502417198233561515516495767909655160640840897938551593635512757601816127380397448466165581867639842851689511064769380217077830471050007173082233194307481746514628312063517794555998527898182917523920509811898939005269867419453007660169238SAR CPI (old)1990199119921993199419951996199719981999200020012002200320042005200620072008200920102011201220132014201520162017201820199699999999999999310108935518848128104164104853626311072574143759422111004139294598572113128515849244651164507302761853711917284265578923121016455131068581236705147011944127834109318192141314347216021390513353198545827113660054850437767140244467121649041449648574526591614963575483132515393112443397234159803525097292715929158237134114161898499904328691669815498437507617045100580396491729508329612907517573561579182243175943857388863061777863624593457518198880904395583186584452388557219152742489955948
195cent
CPI Workbook
image1png
129 ₵
164 ₵
US Average SCE
27 Higher
SCE Rates and Bills Comparison
SCErsquos average residential rates are above national averagebut residential bills are below national average due to lower usage
bull SCErsquos residential rates are above national average due in part to a cleaner fuel mix high cost of living and lower system load factor
bull SCErsquos residential customer usage is lower than the national average due to mild climate and higher energy efficiency appliance and building standards
bull Average monthly residential bills are lower than the national average as higher rate levels are more than offset by lower usage
Key FactorsKey Factors
Source EIAs Form 861M (formerly Form 826) Data Monthly Electric Utility Sales and Revenue Data for 12-Months Ending June 2019 httpswwweiagovelectricitydataeia861mindexhtml
2018-19 Average Residential Rates (centkWh)
2018-19 Average Residential Bills ($ per Month)
$128
$95
US Average SCE
26 Lower
October 30 2019 38
Sheet1
Sheet1
129 ₵
164 ₵
Sheet2
27 Higher
Sheet3
Sheet1
Sheet1
$128
Sheet2
26 Lower
Sheet3
bull Assembly Bill 1171 permits cities and counties and Joint Powers Agencies (JPAs) to act as CCAs to purchase and sell electricity on behalf of the utility customers within their jurisdiction
bull An Order Instituting Rulemaking (OIR R17-06-026) was opened on June 29 2017 to review revise and consider alternatives to the ldquoPower Charge Indifference Adjustmentrdquo or PCIA The PCIA allocates a proportional share of above-market costs of SCErsquos
energy procurement portfolio to departing load customers to ensure remaining bundled service customers are indifferent
October 11 2018 Commission decision changes PCIA methodology and has substantially addressed the historical subsidy to departing load that materialized when renewables market prices declined over the past 4 yearso Decision also established a Phase 2 which is addressing utility
portfolio optimization PCIA ldquopre-paymentrdquo options for entities and individual departing load customers and implementation of the ldquotrue-uprdquo process for Resource Adequacy (RA) and Renewable Energy Credits (RECs) costs
o A Phase 2 final decision on the benchmark and true-up process was approved on October 10 2019 with the other Phase 2 activities to continue into 2020
bull On February 8 2018 the Commission approved Resolution E-4907 requiring CCAs to demonstrate compliance with annual Resource Adequacy (RA) requirements prior to commencing operations
bull Existing Direct Access and CCA load is expected to be ~35 of SCErsquos total load by the end of 2019
Investor-Owned Utility (IOU)
Community Choice Aggregator (CCA)
Community Choice Aggregator (CCA) Overview
Approximately 40 of SCErsquos bundled service load could be part of a CCA or Direct Access by the end of 2020
October 30 2019 39
bull CPUC Order Instituting Ratemaking R 12-06-013 comprehensively reviewed residential rate structure including a future transition to Time of Use (TOU) rates In March 2018 SCE began to migrate 400000 residential customers to TOU rate structures
Remaining eligible residential customers to be migrated beginning October 2020bull July 2015 CPUC Decision D 15-07-001 includes Transition to 2 tiered rate structure coupled with Super-User Electric (SUE) Surcharge1
ldquoSuper User Electric Surchargerdquo for usage 400 above baseline (~3 of all usage)
Minimum bills of approximately $10month (applied to delivery revenue only)
January 2014 2019
100(60 of system usage)
219(3)
Tier 1100
Tier 2 101-400
SUEgt400
125(37)
Usage Level ( of Baseline)Usage Level ( of Baseline)
1 Completed in 20192 SCErsquos California Alternate Rates for Energy (CARE) program is an income-qualifying program that reduces energy bills for eligible customers by about 30
Winter Weekdays 8am-9pm Weekdays and Weekends 4-9pm
Off-Peak Summer Weekdays 11pm-8amWeekends All
Weekdays and Weekends All except 4-9pm
Winter Weekdays 9pm-8amWeekends All
Weekdays and Weekends 9pm-8am
Super Off-Peak Winter NA Weekdays and Weekends 8am-4pm
New Time-of-Use (TOU) Periods
bull On March 1 2019 SCE changed its basic TOU pricing period definition for the first time in over 30 years
bull Abundant mid-day renewable energy lowers prices from 8am-4pm (October - June)
bull Highest cost period is now 4pm-9pm all-days1
1 TOU pricing periods defined for non-residential customers per CPUC Decision D18-07-006 Similar residential TOU definitions were filed by SCE in A17-12-012
bull 998 solar projectsbull 320445 residential (71 of all residential customers) ndash 1756 MW bull 7333 non-residential ndash 977 MW bull Approximately 4775887 MWhyear generated
SCE Net Metering Statistics (919)
0
5
10
15
20
25
30
35
40
0
1000
2000
3000
4000
5000
6000
7000
2013 2014 2015 2016 2017 2018 2019
MW
Inst
alle
d
Num
ber o
f Sol
ar R
esid
entia
l Ins
talla
tions
Installations MW
July 1 2017bull Official start of NEM successor tariff customers are subject to
Mandatory TOU rate Non-bypassable charges Application fees
July 31 2017bull Residential customers who meet this deadline are grandfathered for
current TOU periods for maximum of 5 years (10 for non-residential)September 9 2017bull Smart Inverters required on all solar installationsJuly 25 2018bull Smart Inverters with Reactive Power Priority required on all solar
installationsNear Term Outlookbull Combination of a flatter tiered rate and the mandatory TOU NEM 20
rate structure has helped reduce the per customer cost shift further efforts to reduce the shift through new TOU pricing periods
bull Commission to revisit NEM Successor Tariff by July 2020 to evaluate the existing NEM tariffs and consider the development and adoption of successor tariffs
Key Dates
Third Quarter Earnings Summary
October 30 2019
Q32019
Q32018 Variance
Basic Earnings Per Share (EPS)1
SCE $ 145 $ 164 $ (019)
EIX Parent amp Other (009) (007) (002)
Basic EPS $ 136 $ 157 $ (021)
Less Non-core Items
SCE2 $ (014) $ 002 $ (016)
EIX Parent amp Other3 mdash (001) 001
Total Non-core $ (014) $ 001 $ (015)
Core Earnings Per Share (EPS)
SCE $ 159 $ 162 $ (003)
EIX Parent amp Other (009) (006) (003)
Core EPS $ 150 $ 156 $ (006)
Key SCE EPS Drivers4
Higher revenue5 $ 012- CPUC revenue (002)- 2018 FERC Formula Rate settlement 010- Other FERC revenue 004
Higher OampM (021)Lower depreciation 002Higher net financing costs (004)Income taxes5 019Property and other taxes (001)Results prior to impact from share dilution $ 007Impact from share dilution (010)Total core drivers $ (003)Non-core items 2 (016)Total $ (019)
Key EIX EPS Drivers4
EIX parent and other mdash Higher interest expense and corporate expenses $ (005)EEG mdash Lower corporate expenses 001Impact from share dilution 001Total core drivers $ (003)Non-core items 3 001Total $ (002)
1 See Earnings Non-GAAP reconciliations and Use of Non-GAAP Financial Measures in Appendix2 Includes SCEs contributions to Wildfire Insurance Fund in third quarter 2019 and impact from the approval of the Revised San Onofre Settlement Agreement in the third quarter 2018 3 Loss on sale of SoCore Energy4 2019 EPS drivers are reported at a consistent share count of 3258 million (2019 QTD weighted-average shares outstanding is 3471 million)5 Includes $020 of tax benefits refunded to customersNote Diluted earnings were $135 and $157 per share for the three months ended September 30 2019 and 2018 respectively
43
1 See Earnings Non-GAAP reconciliations and Use of Non-GAAP Financial Measures in Appendix2 Impact of 2018 GRC final decision related to impairment of utility property plant and equipment changes in allocation of deferred tax re-measurement between customers and
shareholders SCErsquos contributions to the Wildfire Insurance Fund gain from sale of nuclear fuel and impact from the approval of the Revised San Onofre Settlement Agreement3 Loss on sale of SoCore Energy and impact of hypothetical liquidation at book value (HLBV) accounting method4 2019 EPS drivers are reported at a consistent share count of 3258 million (2019 YTD weighted-average shares outstanding is 3330 million)5 Test Year 2018 GRC true-up of $020 includes revenue of $(034) OampM of $006 depreciation of $024 interest expense of $(001) property and other taxes of $001 and income taxes of
$0246 Includes $018 of tax benefits refunded to customersNote Diluted earnings were $342 and $308 per share for the nine months ended September 30 2019 and 2018 respectively
Year to Date Earnings Summary
October 30 2019
YTD 2019
YTD 2018 Variance
Basic Earnings Per Share (EPS)1
SCE $ 365 $ 343 $ 022
EIX Parent amp Other (022) (034) 012
Basic EPS $ 343 $ 309 $ 034
Less Non-core Items
SCE2 $ (030) $ 002 $ (032)
EIX Parent amp Other3 mdash (014) 014
Total Non-core $ (030) $ (012) $ (018)
Core Earnings Per Share (EPS)
SCE $ 395 $ 341 $ 054
EIX Parent amp Other (022) (020) (002)
Core EPS $ 373 $ 321 $ 052
Key SCE EPS Drivers4
Test Year 2018 GRC true-up5 $ 020Higher revenue6 055
- CPUC revenue 032- 2018 FERC Formula Rate settlement 010- FERC and other operating revenue 013
Higher OampM (026)Lower depreciation 005Higher net financing costs (012)Income taxes6 021Results prior to impact from share dilution $ 063Impact from share dilution (009)Total core drivers $ 054Non-core items2 (032)Total $ 022
Key EIX EPS Drivers4
EIX parent and other mdash Higher interest expense and corporate expenses $ (007)EEG mdash Lower corporate expenses and lower losses at the competitive business 004Impact from share dilution 001Total core drivers $ (002)Non-core items3 014Total $ 012
44
SCE Annual Results of Operationsbull Earning activities ndash revenue authorized by CPUC and FERC to provide reasonable cost recovery and return on investmentbull Cost-recovery activities ndash CPUC- and FERC-authorized balancing accounts to recover specific project or program costs subject
to reasonableness review or compliance with upfront standards
($ millions)
2018 2017
Earnings Activities
Cost-Recovery Activities
Total Consolidated
Earnings Activities
Cost-Recovery Activities
Total Consolidated
Operating revenue $6560 $6051 $12611 $6611 $5643 $12254Purchased power and fuel mdash 5406 5406 mdash 4873 4873Operation and maintenance 1972 730 2702 1898 824 2722Wildfire-related claims net of recoveries 2669 mdash 2669 ― ― ―Depreciation and amortization 1867 mdash 1867 2032 mdash 2032Property and other taxes 392 mdash 392 372 mdash 372Impairment and other charges (12) mdash (12) 716 mdash 716Other operating income (7) mdash (7) (8) mdash (8)Total operating expenses 6881 6136 13017 5010 5697 10707Operating (loss) income (321) (85) (406) 1601 (54) 1547Interest expense (671) (2) (673) (588) (1) (589)Other income and expenses 107 87 194 93 55 148(Loss) income before income taxes (885) mdash (885) 1106 mdash 1106Income tax (benefit) expense (696) mdash (696) (30) mdash (30)Net (loss) income (189) mdash (189) 1136 mdash 1136Preferred and preference stock dividend
requirements 121 mdash 121 124 mdash 124
Net (loss) income available for common stock ($310) mdash ($310) $1012 mdash $1012Less Non-core items (1750) (481)Core Earnings $1440 $1493
Note See Use of Non-GAAP Financial Measures
October 30 2019 45
Reconciliation of EIX Basic Earnings Per Share Guidance to EIX Core Earnings Per Share Guidance
EPS Attributable to Edison International 2019
Low Midpoint High
SCE $483
EIX Parent amp Other (032)
Basic EPS1 $441 $451 $461
Non-Core Items
SCE23 (029) (029) (029)
EIX Parent amp Other mdash mdash mdash
Total Non-Core1 (029) (029) (029)
Core EPS
SCE $512
EIX Parent amp Other (032)
Core EPS1 $470 $480 $490
1 EPS is calculated on the assumed weighted-average share count for 2019 Please see 2019 EIX Core Earnings Guidance slide for more information 2 Includes impact of 2018 GRC final decision related to impairment of utility property plant and equipment changes in allocation of deferred tax re-measurement between
customers and shareholders and SCErsquos contributions to the Wildfire Insurance Fund3 Includes $001 per share as a result of share count dilution
October 30 2019
Earnings Per Share Non-GAAP Reconciliations
46
Earnings Non-GAAP Reconciliations
1 Impact of 2018 GRC final decision related to impairment of utility property plant and equipment changes in allocation of deferred tax re-measurement between customers and shareholders SCErsquos contributions to the Wildfire Insurance Fund gain from sale of nuclear fuel and impact from the approval of the Revised San Onofre Settlement Agreement
2 Loss on sale of SoCore Energy and impact of hypothetical liquidation at book value (HLBV) accounting method
($ millions)
Reconciliation of EIX GAAP Earnings to EIX Core Earnings
Earnings Attributable to Edison International Q32019
Q32018
YTD 2019
YTD 2018
SCE $503 $536 $1215 $1119
EIX Parent amp Other (32) (23) (74) (112)
Basic Earnings $471 $513 $1141 $1007
Non-Core Items
SCE 1 ($48) 7 ($99) 7
EIX Parent amp Other 2 mdash (4) mdash (46)
Total Non-Core ($48) $3 ($99) ($39)
Core Earnings
SCE $551 $529 $1314 $1112
EIX Parent amp Other (32) (19) (74) (66)
Core Earnings $519 $510 $1240 $1046
October 30 2019 47
EIX Core EPS Non-GAAP ReconciliationsReconciliation of Edison International Basic Earnings Per Share to Edison International Core Earnings Per Share
Note See Use of Non-GAAP Financial Measures
Earnings Per Share Attributable to Edison International 2018 2017
Basic EPS ($130) $173
Non-Core Items
SCE
Wildfire-related claims net of recoveries (560) mdash
Settlement of 1994 ndash 2006 California tax audits 020 mdash
Write down impairment and other as a result of Revised San Onofre Settlement Agreement
003 (138)
Re-measurement of deferred taxes as a result of Tax Reform mdash (010)
Edison International Parent and Other
Settlement of 1994 ndash 2006 California tax audits (004) mdash
Re-measurement of deferred taxes as a result of Tax Reform mdash (133)
Sale of SoCore Energy and other (014) 004
Discontinued operations
Settlement of 1994 ndash 2006 California tax audits 010 mdash
Less Total Non-Core Items (545) (277)
Core EPS $415 $450
October 30 2019 48
Use of Non-GAAP Financial MeasuresEdison Internationals earnings are prepared in accordance with generally accepted accounting principles used in the United States Management uses core earnings internally for financial planning and for analysis of performance Core earnings are also used when communicating with investors and analysts regarding Edison Internationals earnings results to facilitate comparisons of the Companys performance from period to period Core earnings are a non-GAAP financial measure and may not be comparable to those of other companies Core earnings (or losses) are defined as earnings or losses attributable to Edison International shareholders less income or loss from discontinued operations and income or loss from significant discrete items that management does not consider representative of ongoing earnings such as exit activities including sale of certain assets and other activities that are no longer continuing asset impairments and certain tax regulatory or legal settlements or proceedings
A reconciliation of Non-GAAP information to GAAP information is included either on the slide where the information appears or on another slide referenced in this presentation
EIX Investor Relations Contact
Sam Ramraj Vice President (626) 302-2540 samramrajedisonintlcom
Allison Bahen Principal Manager (626) 302-5493 allisonbahenedisonintlcom
October 30 2019 49
Business Update
Slide Number 2
Table of Contents
EIX Strategy Should Produce Long-Term Value
SCE Highlights
Slide Number 6
SCE Historical Rate Base and Core Earnings
SCE Capital Expenditure Forecast
SCE Rate Base Forecast
Slide Number 10
Californiarsquos GHG Emissions Overview
SCErsquos Pathway 2045 Highlights
Slide Number 13
Slide Number 14
Slide Number 15
SCE Key Regulatory Proceedings
Slide Number 17
Slide Number 18
CPUC and FERC Cost of Capital Summary
CPUC Cost of Capital (2013-2019)
SCE Distribution System Investments
Slide Number 22
Slide Number 23
SCE Large Transmission Projects
SCE Operational Excellence
Responding to Industry Change
Slide Number 27
2019 EIX Core Earnings Guidance
EIX Annual Dividends Per Share
Appendix
EIXrsquos 2018 Sustainability Report Highlights
Slide Number 32
SCE Historical Capital Expenditures
Credit Ratings Summary
Distribution Power Grid of the Future
SCE Customer Demand Trends
SCE Bundled Revenue Requirement
Slide Number 38
SCE Rates and Bills Comparison
Slide Number 40
Slide Number 41
Slide Number 42
Slide Number 43
Slide Number 44
Slide Number 45
SCE Annual Results of Operations
Slide Number 47
Earnings Non-GAAP Reconciliations
EIX Core EPS Non-GAAP Reconciliations
Use of Non-GAAP Financial Measures
US Average
$134
SCE
$95
-291
US Average
128
SCE
164
higher
28
Created on Mon 6 Jun 2016 1250 PM EST (1750 GMT)
Concept
1990
1991
1992
1993
1994
1995
1996
1997
1998
1999
2000
2001
2002
2003
2004
2005
2006
2007
2008
2009
2010
2011
2012
2013
2014
2015
2016
2017
2018
2019
2020
2021
2022
2023
2024
2025
2026
Consumer Price Index All-Urban
131
136
140
144
148
152
157
161
163
167
172
177
180
184
189
195
202
207
215
215
218
225
230
233
237
237
239
245
251
258
265
272
279
286
293
300
306
422
304
297
260
281
294
234
155
219
337
282
160
230
267
337
322
287
381
-032
164
314
208
147
161
012
105
236
253
265
265
264
254
251
249
234
227
SOUTHERN CALIFORNIA EDISON
System Average Rate Forecast
Source Matt Sheriff
(centkWh)
SCE System Average Rate
SAR CPI (old)
SAR CPI (current)
CPI Los Angeles-Long Beach-Anaheim CA
Consumer Price Index All-Urban
0
1990
97cent
97cent
97cent
593
30
1
1991
103cent
101cent
101cent
410
422
2
1992
106cent
104cent
105cent
361
304
3
1993
103cent
107cent
107cent
253
297
4
1994
105cent
110cent
109cent
137
260
5
1995
107cent
113cent
110cent
153
281
25
6
1996
101cent
116cent
112cent
183
294
7
1997
101cent
119cent
114cent
158
234
8
1998
96cent
121cent
116cent
144
155
9
1999
96cent
124cent
119cent
235
219
10
2000
96cent
128cent
122cent
330
337
20
11
2001
142cent
131cent
127cent
336
282
12
2002
142cent
134cent
130cent
277
160
13
2003
124cent
137cent
133cent
259
230
14
2004
122cent
140cent
138cent
334
267
15
2005
126cent
145cent
144cent
447
337
16
2006
147cent
150cent
150cent
427
322
17
2007
139cent
154cent
155cent
328
287
18
2008
137cent
160cent
161cent
353
381
19
2009
143cent
159cent
159cent
-080
-032
20
2010
143cent
162cent
161cent
120
164
10
21
2011
141cent
167cent
166cent
267
314
22
2012
143cent
170cent
169cent
203
208
23
2013
159cent
173cent
171cent
108
147
24
2014
167cent
176cent
173cent
135
161
25
2015
159cent
176cent
175cent
091
012
5
26
2016
148cent
178cent
178cent
189
105
27
2017
157cent
182cent
183cent
279
236
29
20
10
28
2018
160cent
187cent
190cent
381
253
SCE
17
26
11
29
2019
159cent
192cent
195cent
244
265
LA
24
25
20
30
2020
194cent
197cent
199cent
219
265
36
31
2021
199cent
202cent
203cent
227
266
25
49
Created on Wed 23 Jan 2019 1245 PM EST (1745 GMT)
Mnemonic
Long Label
Last Update
Start Date
End Date
Frequency
1970
1971
1972
1973
1974
1975
1976
1977
1978
1979
1980
1981
1982
1983
1984
1985
1986
1987
1988
1989
1990
1991
1992
1993
1994
1995
1996
1997
1998
1999
2000
2001
2002
2003
2004
2005
2006
2007
2008
2009
2010
2011
2012
2013
2014
2015
2016
2017
2018
2019
2020
2021
2022
2023
2024
2025
2026
2027
2028
2029
2030
2031
2032
2033
2034
2035
2036
2037
2038
2039
2040
2041
2042
2043
2044
2045
2046
2047
2048
CPILANGAFRSM1
Los Angeles-Long Beach-Anaheim CA (MSA) [2013 Definition] FIPS Code 31080 Consumer Price Index for All Urban Consumers (1982-84=100) IHS MARKIT ECONOMICS December 2018 Forecast Source Bureau of Labor Statistics End of Historical Data 2017
122718
1970
2048
ANNUAL
3868
4011
4139
4374
4825
5334
5683
6080
6526
7233
8372
9184
9734
9907
10360
10838
11193
11667
12206
12826
13587
14143
14654
15025
15231
15464
15748
15997
16227
16608
17155
17732
18223
18696
19320
20183
21044
21734
22501
22322
22589
23193
23665
23921
24243
24463
24925
25621
26598
27248
27844
28475
29132
29806
30500
31165
31832
32533
33254
33985
34744
35508
36279
37061
37854
38640
39440
40278
41145
42043
42963
43898
44852
45825
46816
47822
48857
49934
51047
371
320
568
1031
1055
655
698
733
1083
1575
971
599
177
458
461
328
423
462
508
593
410
361
253
137
153
183
158
144
235
330
336
277
259
334
447
427
328
353
-080
120
267
203
108
135
091
189
279
381
244
219
227
231
231
233
218
214
220
222
220
223
220
217
215
214
208
207
213
215
218
219
218
217
217
216
215
216
220
223
SCE Customer Demand Trends
Note See Edison International Financial and Statistical Reports for 2017 for further information
Kilowatt-Hour Sales (millions of kWh) 2014 2015 2016 2017 2018
Residential 30027 30093 29579 30221 29865
Commercial 42004 42396 42189 42514 42369
Industrial 8392 7623 7162 6659 6786
Public authorities 4975 4795 4715 4711 4510
Agricultural and other 2019 1950 1803 1498 1745
Subtotal 87416 86857 85448 85602 85276
Resale 1308 1080 1794 1568 1867
Total Kilowatt-Hour Sales 88725 87937 87242 87170 87143
Total Number of Customers 5005401 5033330 5060528 5094818 5126985
Number of New Connections 29879 31653 38076 39621 39633
Area Peak Demand (MW) 23055 23079 23091 23508 23766
October 30 2019 35
SCE Bundled Revenue Requirement
Note Rates in effect as of July 26 2019 Represents bundled service which excludes Direct AccessCCA customers that do not receive generation services from SCE
SCE Systemwide Average Rate History (centkWh)
2010 2011 2012 2013 2014 2015 2016 2017 2018 2019
143 141 143 159 167 162 148 157 160 159
Fuel amp Purchased Power(47)
Distribution(38)
Transmission (8)
Generation(8)
Other (-1)
2019 Bundled Revenue
Requirement
$millions centkWh
Fuel amp Purchased Power ndash includes CDWR Bond Charge
4422 74
Distribution ndash poles wires substations service centers Edison SmartConnectreg
3628 61
Generation ndash owned generation investment and OampM 708 12
Transmission ndash greater than 220kV 789 13
Other ndash CPUC and legislative public purpose programs system reliability investments nuclear decommissioning and prior-year over collections
(116) (01)
Total Bundled Revenue Requirement ($millions) $9431
divide Bundled kWh (millions) 59396
= Bundled Systemwide Average Rate (centkWh) 159cent
October 30 2019 36
37
97cent
159cent
80cent
100cent
120cent
140cent
160cent
180cent
200cent
220cent
1990
1991
1992
1993
1994
1995
1996
1997
1998
1999
2000
2001
2002
2003
2004
2005
2006
2007
2008
2009
2010
2011
2012
2013
2014
2015
2016
2017
2018
2019
195cent
Rates reduced due to the implementation of 1) the SONGS Revised Settlement including NEIL insurance benefits 2) lower fuel amp purchased power costs and 3) a lower 2015 GRC revenue requirement that includes flow-through tax benefits
centkWh
System Average Rate Historical Growth
SCErsquos system average rate has grown less than inflation over the last 29 years
SCE System Average RateLos Angeles Area Inflation
Comparative System Average Rates
Delta to SCESCE 159cent --
PGampE 211cent1 33
SDGampE 246cent1 55
CAGR29-yr
(lsquo90-rsquo19)20-yr
(lsquo99-rsquo19)10-yr
(lsquo09-19)17 26 1124 25 20
Energy Crisis and return to normal
Higher gas price forecast post-Katrina leads to higher rates with subsequent refund of over collection
Delay in 2012 GRC leads to shorter ramp-up of rate increase
1 PGampE Advice 5644-E effective October 1 SDGampE Advice 3377-E effective June 1
October 30 2019
Data
SCE System Average Rate
1990199119921993199419951996199719981999200020012002200320042005200620072008200920102011201220132014201520162017201820199699999999999999310310610310510710110196969614214212412212614713913714314314114315916715940876786458386148350382761769171566871495475337116159CPI Los Angeles-Long Beach-Anaheim CA199019911992199319941995199619971998199920002001200220032004200520062007200820092010201120122013201420152016201720182019202096999999999999993100974239450441131046212585868498310726876840039228108738285083414611104041339548576811242695044160916114205839057899881158478900883218511856679342492612122475588812561061265926153091265513010279685966582133476140824337041379322865554462144095927379783561502417198233561515516495767909655160640840897938551593635512757601816127380397448466165581867639842851689511064769380217077830471050007173082233194307481746514628312063517794555998527898182917523920509811898939005269867419453007660169238SAR CPI (old)1990199119921993199419951996199719981999200020012002200320042005200620072008200920102011201220132014201520162017201820199699999999999999310108935518848128104164104853626311072574143759422111004139294598572113128515849244651164507302761853711917284265578923121016455131068581236705147011944127834109318192141314347216021390513353198545827113660054850437767140244467121649041449648574526591614963575483132515393112443397234159803525097292715929158237134114161898499904328691669815498437507617045100580396491729508329612907517573561579182243175943857388863061777863624593457518198880904395583186584452388557219152742489955948
195cent
CPI Workbook
image1png
129 ₵
164 ₵
US Average SCE
27 Higher
SCE Rates and Bills Comparison
SCErsquos average residential rates are above national averagebut residential bills are below national average due to lower usage
bull SCErsquos residential rates are above national average due in part to a cleaner fuel mix high cost of living and lower system load factor
bull SCErsquos residential customer usage is lower than the national average due to mild climate and higher energy efficiency appliance and building standards
bull Average monthly residential bills are lower than the national average as higher rate levels are more than offset by lower usage
Key FactorsKey Factors
Source EIAs Form 861M (formerly Form 826) Data Monthly Electric Utility Sales and Revenue Data for 12-Months Ending June 2019 httpswwweiagovelectricitydataeia861mindexhtml
2018-19 Average Residential Rates (centkWh)
2018-19 Average Residential Bills ($ per Month)
$128
$95
US Average SCE
26 Lower
October 30 2019 38
Sheet1
Sheet1
129 ₵
164 ₵
Sheet2
27 Higher
Sheet3
Sheet1
Sheet1
$128
Sheet2
26 Lower
Sheet3
bull Assembly Bill 1171 permits cities and counties and Joint Powers Agencies (JPAs) to act as CCAs to purchase and sell electricity on behalf of the utility customers within their jurisdiction
bull An Order Instituting Rulemaking (OIR R17-06-026) was opened on June 29 2017 to review revise and consider alternatives to the ldquoPower Charge Indifference Adjustmentrdquo or PCIA The PCIA allocates a proportional share of above-market costs of SCErsquos
energy procurement portfolio to departing load customers to ensure remaining bundled service customers are indifferent
October 11 2018 Commission decision changes PCIA methodology and has substantially addressed the historical subsidy to departing load that materialized when renewables market prices declined over the past 4 yearso Decision also established a Phase 2 which is addressing utility
portfolio optimization PCIA ldquopre-paymentrdquo options for entities and individual departing load customers and implementation of the ldquotrue-uprdquo process for Resource Adequacy (RA) and Renewable Energy Credits (RECs) costs
o A Phase 2 final decision on the benchmark and true-up process was approved on October 10 2019 with the other Phase 2 activities to continue into 2020
bull On February 8 2018 the Commission approved Resolution E-4907 requiring CCAs to demonstrate compliance with annual Resource Adequacy (RA) requirements prior to commencing operations
bull Existing Direct Access and CCA load is expected to be ~35 of SCErsquos total load by the end of 2019
Investor-Owned Utility (IOU)
Community Choice Aggregator (CCA)
Community Choice Aggregator (CCA) Overview
Approximately 40 of SCErsquos bundled service load could be part of a CCA or Direct Access by the end of 2020
October 30 2019 39
bull CPUC Order Instituting Ratemaking R 12-06-013 comprehensively reviewed residential rate structure including a future transition to Time of Use (TOU) rates In March 2018 SCE began to migrate 400000 residential customers to TOU rate structures
Remaining eligible residential customers to be migrated beginning October 2020bull July 2015 CPUC Decision D 15-07-001 includes Transition to 2 tiered rate structure coupled with Super-User Electric (SUE) Surcharge1
ldquoSuper User Electric Surchargerdquo for usage 400 above baseline (~3 of all usage)
Minimum bills of approximately $10month (applied to delivery revenue only)
January 2014 2019
100(60 of system usage)
219(3)
Tier 1100
Tier 2 101-400
SUEgt400
125(37)
Usage Level ( of Baseline)Usage Level ( of Baseline)
1 Completed in 20192 SCErsquos California Alternate Rates for Energy (CARE) program is an income-qualifying program that reduces energy bills for eligible customers by about 30
Winter Weekdays 8am-9pm Weekdays and Weekends 4-9pm
Off-Peak Summer Weekdays 11pm-8amWeekends All
Weekdays and Weekends All except 4-9pm
Winter Weekdays 9pm-8amWeekends All
Weekdays and Weekends 9pm-8am
Super Off-Peak Winter NA Weekdays and Weekends 8am-4pm
New Time-of-Use (TOU) Periods
bull On March 1 2019 SCE changed its basic TOU pricing period definition for the first time in over 30 years
bull Abundant mid-day renewable energy lowers prices from 8am-4pm (October - June)
bull Highest cost period is now 4pm-9pm all-days1
1 TOU pricing periods defined for non-residential customers per CPUC Decision D18-07-006 Similar residential TOU definitions were filed by SCE in A17-12-012
bull 998 solar projectsbull 320445 residential (71 of all residential customers) ndash 1756 MW bull 7333 non-residential ndash 977 MW bull Approximately 4775887 MWhyear generated
SCE Net Metering Statistics (919)
0
5
10
15
20
25
30
35
40
0
1000
2000
3000
4000
5000
6000
7000
2013 2014 2015 2016 2017 2018 2019
MW
Inst
alle
d
Num
ber o
f Sol
ar R
esid
entia
l Ins
talla
tions
Installations MW
July 1 2017bull Official start of NEM successor tariff customers are subject to
Mandatory TOU rate Non-bypassable charges Application fees
July 31 2017bull Residential customers who meet this deadline are grandfathered for
current TOU periods for maximum of 5 years (10 for non-residential)September 9 2017bull Smart Inverters required on all solar installationsJuly 25 2018bull Smart Inverters with Reactive Power Priority required on all solar
installationsNear Term Outlookbull Combination of a flatter tiered rate and the mandatory TOU NEM 20
rate structure has helped reduce the per customer cost shift further efforts to reduce the shift through new TOU pricing periods
bull Commission to revisit NEM Successor Tariff by July 2020 to evaluate the existing NEM tariffs and consider the development and adoption of successor tariffs
Key Dates
Third Quarter Earnings Summary
October 30 2019
Q32019
Q32018 Variance
Basic Earnings Per Share (EPS)1
SCE $ 145 $ 164 $ (019)
EIX Parent amp Other (009) (007) (002)
Basic EPS $ 136 $ 157 $ (021)
Less Non-core Items
SCE2 $ (014) $ 002 $ (016)
EIX Parent amp Other3 mdash (001) 001
Total Non-core $ (014) $ 001 $ (015)
Core Earnings Per Share (EPS)
SCE $ 159 $ 162 $ (003)
EIX Parent amp Other (009) (006) (003)
Core EPS $ 150 $ 156 $ (006)
Key SCE EPS Drivers4
Higher revenue5 $ 012- CPUC revenue (002)- 2018 FERC Formula Rate settlement 010- Other FERC revenue 004
Higher OampM (021)Lower depreciation 002Higher net financing costs (004)Income taxes5 019Property and other taxes (001)Results prior to impact from share dilution $ 007Impact from share dilution (010)Total core drivers $ (003)Non-core items 2 (016)Total $ (019)
Key EIX EPS Drivers4
EIX parent and other mdash Higher interest expense and corporate expenses $ (005)EEG mdash Lower corporate expenses 001Impact from share dilution 001Total core drivers $ (003)Non-core items 3 001Total $ (002)
1 See Earnings Non-GAAP reconciliations and Use of Non-GAAP Financial Measures in Appendix2 Includes SCEs contributions to Wildfire Insurance Fund in third quarter 2019 and impact from the approval of the Revised San Onofre Settlement Agreement in the third quarter 2018 3 Loss on sale of SoCore Energy4 2019 EPS drivers are reported at a consistent share count of 3258 million (2019 QTD weighted-average shares outstanding is 3471 million)5 Includes $020 of tax benefits refunded to customersNote Diluted earnings were $135 and $157 per share for the three months ended September 30 2019 and 2018 respectively
43
1 See Earnings Non-GAAP reconciliations and Use of Non-GAAP Financial Measures in Appendix2 Impact of 2018 GRC final decision related to impairment of utility property plant and equipment changes in allocation of deferred tax re-measurement between customers and
shareholders SCErsquos contributions to the Wildfire Insurance Fund gain from sale of nuclear fuel and impact from the approval of the Revised San Onofre Settlement Agreement3 Loss on sale of SoCore Energy and impact of hypothetical liquidation at book value (HLBV) accounting method4 2019 EPS drivers are reported at a consistent share count of 3258 million (2019 YTD weighted-average shares outstanding is 3330 million)5 Test Year 2018 GRC true-up of $020 includes revenue of $(034) OampM of $006 depreciation of $024 interest expense of $(001) property and other taxes of $001 and income taxes of
$0246 Includes $018 of tax benefits refunded to customersNote Diluted earnings were $342 and $308 per share for the nine months ended September 30 2019 and 2018 respectively
Year to Date Earnings Summary
October 30 2019
YTD 2019
YTD 2018 Variance
Basic Earnings Per Share (EPS)1
SCE $ 365 $ 343 $ 022
EIX Parent amp Other (022) (034) 012
Basic EPS $ 343 $ 309 $ 034
Less Non-core Items
SCE2 $ (030) $ 002 $ (032)
EIX Parent amp Other3 mdash (014) 014
Total Non-core $ (030) $ (012) $ (018)
Core Earnings Per Share (EPS)
SCE $ 395 $ 341 $ 054
EIX Parent amp Other (022) (020) (002)
Core EPS $ 373 $ 321 $ 052
Key SCE EPS Drivers4
Test Year 2018 GRC true-up5 $ 020Higher revenue6 055
- CPUC revenue 032- 2018 FERC Formula Rate settlement 010- FERC and other operating revenue 013
Higher OampM (026)Lower depreciation 005Higher net financing costs (012)Income taxes6 021Results prior to impact from share dilution $ 063Impact from share dilution (009)Total core drivers $ 054Non-core items2 (032)Total $ 022
Key EIX EPS Drivers4
EIX parent and other mdash Higher interest expense and corporate expenses $ (007)EEG mdash Lower corporate expenses and lower losses at the competitive business 004Impact from share dilution 001Total core drivers $ (002)Non-core items3 014Total $ 012
44
SCE Annual Results of Operationsbull Earning activities ndash revenue authorized by CPUC and FERC to provide reasonable cost recovery and return on investmentbull Cost-recovery activities ndash CPUC- and FERC-authorized balancing accounts to recover specific project or program costs subject
to reasonableness review or compliance with upfront standards
($ millions)
2018 2017
Earnings Activities
Cost-Recovery Activities
Total Consolidated
Earnings Activities
Cost-Recovery Activities
Total Consolidated
Operating revenue $6560 $6051 $12611 $6611 $5643 $12254Purchased power and fuel mdash 5406 5406 mdash 4873 4873Operation and maintenance 1972 730 2702 1898 824 2722Wildfire-related claims net of recoveries 2669 mdash 2669 ― ― ―Depreciation and amortization 1867 mdash 1867 2032 mdash 2032Property and other taxes 392 mdash 392 372 mdash 372Impairment and other charges (12) mdash (12) 716 mdash 716Other operating income (7) mdash (7) (8) mdash (8)Total operating expenses 6881 6136 13017 5010 5697 10707Operating (loss) income (321) (85) (406) 1601 (54) 1547Interest expense (671) (2) (673) (588) (1) (589)Other income and expenses 107 87 194 93 55 148(Loss) income before income taxes (885) mdash (885) 1106 mdash 1106Income tax (benefit) expense (696) mdash (696) (30) mdash (30)Net (loss) income (189) mdash (189) 1136 mdash 1136Preferred and preference stock dividend
requirements 121 mdash 121 124 mdash 124
Net (loss) income available for common stock ($310) mdash ($310) $1012 mdash $1012Less Non-core items (1750) (481)Core Earnings $1440 $1493
Note See Use of Non-GAAP Financial Measures
October 30 2019 45
Reconciliation of EIX Basic Earnings Per Share Guidance to EIX Core Earnings Per Share Guidance
EPS Attributable to Edison International 2019
Low Midpoint High
SCE $483
EIX Parent amp Other (032)
Basic EPS1 $441 $451 $461
Non-Core Items
SCE23 (029) (029) (029)
EIX Parent amp Other mdash mdash mdash
Total Non-Core1 (029) (029) (029)
Core EPS
SCE $512
EIX Parent amp Other (032)
Core EPS1 $470 $480 $490
1 EPS is calculated on the assumed weighted-average share count for 2019 Please see 2019 EIX Core Earnings Guidance slide for more information 2 Includes impact of 2018 GRC final decision related to impairment of utility property plant and equipment changes in allocation of deferred tax re-measurement between
customers and shareholders and SCErsquos contributions to the Wildfire Insurance Fund3 Includes $001 per share as a result of share count dilution
October 30 2019
Earnings Per Share Non-GAAP Reconciliations
46
Earnings Non-GAAP Reconciliations
1 Impact of 2018 GRC final decision related to impairment of utility property plant and equipment changes in allocation of deferred tax re-measurement between customers and shareholders SCErsquos contributions to the Wildfire Insurance Fund gain from sale of nuclear fuel and impact from the approval of the Revised San Onofre Settlement Agreement
2 Loss on sale of SoCore Energy and impact of hypothetical liquidation at book value (HLBV) accounting method
($ millions)
Reconciliation of EIX GAAP Earnings to EIX Core Earnings
Earnings Attributable to Edison International Q32019
Q32018
YTD 2019
YTD 2018
SCE $503 $536 $1215 $1119
EIX Parent amp Other (32) (23) (74) (112)
Basic Earnings $471 $513 $1141 $1007
Non-Core Items
SCE 1 ($48) 7 ($99) 7
EIX Parent amp Other 2 mdash (4) mdash (46)
Total Non-Core ($48) $3 ($99) ($39)
Core Earnings
SCE $551 $529 $1314 $1112
EIX Parent amp Other (32) (19) (74) (66)
Core Earnings $519 $510 $1240 $1046
October 30 2019 47
EIX Core EPS Non-GAAP ReconciliationsReconciliation of Edison International Basic Earnings Per Share to Edison International Core Earnings Per Share
Note See Use of Non-GAAP Financial Measures
Earnings Per Share Attributable to Edison International 2018 2017
Basic EPS ($130) $173
Non-Core Items
SCE
Wildfire-related claims net of recoveries (560) mdash
Settlement of 1994 ndash 2006 California tax audits 020 mdash
Write down impairment and other as a result of Revised San Onofre Settlement Agreement
003 (138)
Re-measurement of deferred taxes as a result of Tax Reform mdash (010)
Edison International Parent and Other
Settlement of 1994 ndash 2006 California tax audits (004) mdash
Re-measurement of deferred taxes as a result of Tax Reform mdash (133)
Sale of SoCore Energy and other (014) 004
Discontinued operations
Settlement of 1994 ndash 2006 California tax audits 010 mdash
Less Total Non-Core Items (545) (277)
Core EPS $415 $450
October 30 2019 48
Use of Non-GAAP Financial MeasuresEdison Internationals earnings are prepared in accordance with generally accepted accounting principles used in the United States Management uses core earnings internally for financial planning and for analysis of performance Core earnings are also used when communicating with investors and analysts regarding Edison Internationals earnings results to facilitate comparisons of the Companys performance from period to period Core earnings are a non-GAAP financial measure and may not be comparable to those of other companies Core earnings (or losses) are defined as earnings or losses attributable to Edison International shareholders less income or loss from discontinued operations and income or loss from significant discrete items that management does not consider representative of ongoing earnings such as exit activities including sale of certain assets and other activities that are no longer continuing asset impairments and certain tax regulatory or legal settlements or proceedings
A reconciliation of Non-GAAP information to GAAP information is included either on the slide where the information appears or on another slide referenced in this presentation
EIX Investor Relations Contact
Sam Ramraj Vice President (626) 302-2540 samramrajedisonintlcom
Allison Bahen Principal Manager (626) 302-5493 allisonbahenedisonintlcom
October 30 2019 49
Business Update
Slide Number 2
Table of Contents
EIX Strategy Should Produce Long-Term Value
SCE Highlights
Slide Number 6
SCE Historical Rate Base and Core Earnings
SCE Capital Expenditure Forecast
SCE Rate Base Forecast
Slide Number 10
Californiarsquos GHG Emissions Overview
SCErsquos Pathway 2045 Highlights
Slide Number 13
Slide Number 14
Slide Number 15
SCE Key Regulatory Proceedings
Slide Number 17
Slide Number 18
CPUC and FERC Cost of Capital Summary
CPUC Cost of Capital (2013-2019)
SCE Distribution System Investments
Slide Number 22
Slide Number 23
SCE Large Transmission Projects
SCE Operational Excellence
Responding to Industry Change
Slide Number 27
2019 EIX Core Earnings Guidance
EIX Annual Dividends Per Share
Appendix
EIXrsquos 2018 Sustainability Report Highlights
Slide Number 32
SCE Historical Capital Expenditures
Credit Ratings Summary
Distribution Power Grid of the Future
SCE Customer Demand Trends
SCE Bundled Revenue Requirement
Slide Number 38
SCE Rates and Bills Comparison
Slide Number 40
Slide Number 41
Slide Number 42
Slide Number 43
Slide Number 44
Slide Number 45
SCE Annual Results of Operations
Slide Number 47
Earnings Non-GAAP Reconciliations
EIX Core EPS Non-GAAP Reconciliations
Use of Non-GAAP Financial Measures
US Average
$134
SCE
$95
-291
US Average
128
SCE
164
higher
28
Created on Mon 6 Jun 2016 1250 PM EST (1750 GMT)
Concept
1990
1991
1992
1993
1994
1995
1996
1997
1998
1999
2000
2001
2002
2003
2004
2005
2006
2007
2008
2009
2010
2011
2012
2013
2014
2015
2016
2017
2018
2019
2020
2021
2022
2023
2024
2025
2026
Consumer Price Index All-Urban
131
136
140
144
148
152
157
161
163
167
172
177
180
184
189
195
202
207
215
215
218
225
230
233
237
237
239
245
251
258
265
272
279
286
293
300
306
422
304
297
260
281
294
234
155
219
337
282
160
230
267
337
322
287
381
-032
164
314
208
147
161
012
105
236
253
265
265
264
254
251
249
234
227
SOUTHERN CALIFORNIA EDISON
System Average Rate Forecast
Source Matt Sheriff
(centkWh)
SCE System Average Rate
SAR CPI (old)
SAR CPI (current)
CPI Los Angeles-Long Beach-Anaheim CA
Consumer Price Index All-Urban
0
1990
97cent
97cent
97cent
593
30
1
1991
103cent
101cent
101cent
410
422
2
1992
106cent
104cent
105cent
361
304
3
1993
103cent
107cent
107cent
253
297
4
1994
105cent
110cent
109cent
137
260
5
1995
107cent
113cent
110cent
153
281
25
6
1996
101cent
116cent
112cent
183
294
7
1997
101cent
119cent
114cent
158
234
8
1998
96cent
121cent
116cent
144
155
9
1999
96cent
124cent
119cent
235
219
10
2000
96cent
128cent
122cent
330
337
20
11
2001
142cent
131cent
127cent
336
282
12
2002
142cent
134cent
130cent
277
160
13
2003
124cent
137cent
133cent
259
230
14
2004
122cent
140cent
138cent
334
267
15
2005
126cent
145cent
144cent
447
337
16
2006
147cent
150cent
150cent
427
322
17
2007
139cent
154cent
155cent
328
287
18
2008
137cent
160cent
161cent
353
381
19
2009
143cent
159cent
159cent
-080
-032
20
2010
143cent
162cent
161cent
120
164
10
21
2011
141cent
167cent
166cent
267
314
22
2012
143cent
170cent
169cent
203
208
23
2013
159cent
173cent
171cent
108
147
24
2014
167cent
176cent
173cent
135
161
25
2015
159cent
176cent
175cent
091
012
5
26
2016
148cent
178cent
178cent
189
105
27
2017
157cent
182cent
183cent
279
236
29
20
10
28
2018
160cent
187cent
190cent
381
253
SCE
17
26
11
29
2019
159cent
192cent
195cent
244
265
LA
24
25
20
30
2020
194cent
197cent
199cent
219
265
36
31
2021
199cent
202cent
203cent
227
266
25
49
Created on Wed 23 Jan 2019 1245 PM EST (1745 GMT)
Mnemonic
Long Label
Last Update
Start Date
End Date
Frequency
1970
1971
1972
1973
1974
1975
1976
1977
1978
1979
1980
1981
1982
1983
1984
1985
1986
1987
1988
1989
1990
1991
1992
1993
1994
1995
1996
1997
1998
1999
2000
2001
2002
2003
2004
2005
2006
2007
2008
2009
2010
2011
2012
2013
2014
2015
2016
2017
2018
2019
2020
2021
2022
2023
2024
2025
2026
2027
2028
2029
2030
2031
2032
2033
2034
2035
2036
2037
2038
2039
2040
2041
2042
2043
2044
2045
2046
2047
2048
CPILANGAFRSM1
Los Angeles-Long Beach-Anaheim CA (MSA) [2013 Definition] FIPS Code 31080 Consumer Price Index for All Urban Consumers (1982-84=100) IHS MARKIT ECONOMICS December 2018 Forecast Source Bureau of Labor Statistics End of Historical Data 2017
122718
1970
2048
ANNUAL
3868
4011
4139
4374
4825
5334
5683
6080
6526
7233
8372
9184
9734
9907
10360
10838
11193
11667
12206
12826
13587
14143
14654
15025
15231
15464
15748
15997
16227
16608
17155
17732
18223
18696
19320
20183
21044
21734
22501
22322
22589
23193
23665
23921
24243
24463
24925
25621
26598
27248
27844
28475
29132
29806
30500
31165
31832
32533
33254
33985
34744
35508
36279
37061
37854
38640
39440
40278
41145
42043
42963
43898
44852
45825
46816
47822
48857
49934
51047
371
320
568
1031
1055
655
698
733
1083
1575
971
599
177
458
461
328
423
462
508
593
410
361
253
137
153
183
158
144
235
330
336
277
259
334
447
427
328
353
-080
120
267
203
108
135
091
189
279
381
244
219
227
231
231
233
218
214
220
222
220
223
220
217
215
214
208
207
213
215
218
219
218
217
217
216
215
216
220
223
SCE Bundled Revenue Requirement
Note Rates in effect as of July 26 2019 Represents bundled service which excludes Direct AccessCCA customers that do not receive generation services from SCE
SCE Systemwide Average Rate History (centkWh)
2010 2011 2012 2013 2014 2015 2016 2017 2018 2019
143 141 143 159 167 162 148 157 160 159
Fuel amp Purchased Power(47)
Distribution(38)
Transmission (8)
Generation(8)
Other (-1)
2019 Bundled Revenue
Requirement
$millions centkWh
Fuel amp Purchased Power ndash includes CDWR Bond Charge
4422 74
Distribution ndash poles wires substations service centers Edison SmartConnectreg
3628 61
Generation ndash owned generation investment and OampM 708 12
Transmission ndash greater than 220kV 789 13
Other ndash CPUC and legislative public purpose programs system reliability investments nuclear decommissioning and prior-year over collections
(116) (01)
Total Bundled Revenue Requirement ($millions) $9431
divide Bundled kWh (millions) 59396
= Bundled Systemwide Average Rate (centkWh) 159cent
October 30 2019 36
37
97cent
159cent
80cent
100cent
120cent
140cent
160cent
180cent
200cent
220cent
1990
1991
1992
1993
1994
1995
1996
1997
1998
1999
2000
2001
2002
2003
2004
2005
2006
2007
2008
2009
2010
2011
2012
2013
2014
2015
2016
2017
2018
2019
195cent
Rates reduced due to the implementation of 1) the SONGS Revised Settlement including NEIL insurance benefits 2) lower fuel amp purchased power costs and 3) a lower 2015 GRC revenue requirement that includes flow-through tax benefits
centkWh
System Average Rate Historical Growth
SCErsquos system average rate has grown less than inflation over the last 29 years
SCE System Average RateLos Angeles Area Inflation
Comparative System Average Rates
Delta to SCESCE 159cent --
PGampE 211cent1 33
SDGampE 246cent1 55
CAGR29-yr
(lsquo90-rsquo19)20-yr
(lsquo99-rsquo19)10-yr
(lsquo09-19)17 26 1124 25 20
Energy Crisis and return to normal
Higher gas price forecast post-Katrina leads to higher rates with subsequent refund of over collection
Delay in 2012 GRC leads to shorter ramp-up of rate increase
1 PGampE Advice 5644-E effective October 1 SDGampE Advice 3377-E effective June 1
October 30 2019
Data
SCE System Average Rate
1990199119921993199419951996199719981999200020012002200320042005200620072008200920102011201220132014201520162017201820199699999999999999310310610310510710110196969614214212412212614713913714314314114315916715940876786458386148350382761769171566871495475337116159CPI Los Angeles-Long Beach-Anaheim CA199019911992199319941995199619971998199920002001200220032004200520062007200820092010201120122013201420152016201720182019202096999999999999993100974239450441131046212585868498310726876840039228108738285083414611104041339548576811242695044160916114205839057899881158478900883218511856679342492612122475588812561061265926153091265513010279685966582133476140824337041379322865554462144095927379783561502417198233561515516495767909655160640840897938551593635512757601816127380397448466165581867639842851689511064769380217077830471050007173082233194307481746514628312063517794555998527898182917523920509811898939005269867419453007660169238SAR CPI (old)1990199119921993199419951996199719981999200020012002200320042005200620072008200920102011201220132014201520162017201820199699999999999999310108935518848128104164104853626311072574143759422111004139294598572113128515849244651164507302761853711917284265578923121016455131068581236705147011944127834109318192141314347216021390513353198545827113660054850437767140244467121649041449648574526591614963575483132515393112443397234159803525097292715929158237134114161898499904328691669815498437507617045100580396491729508329612907517573561579182243175943857388863061777863624593457518198880904395583186584452388557219152742489955948
195cent
CPI Workbook
image1png
129 ₵
164 ₵
US Average SCE
27 Higher
SCE Rates and Bills Comparison
SCErsquos average residential rates are above national averagebut residential bills are below national average due to lower usage
bull SCErsquos residential rates are above national average due in part to a cleaner fuel mix high cost of living and lower system load factor
bull SCErsquos residential customer usage is lower than the national average due to mild climate and higher energy efficiency appliance and building standards
bull Average monthly residential bills are lower than the national average as higher rate levels are more than offset by lower usage
Key FactorsKey Factors
Source EIAs Form 861M (formerly Form 826) Data Monthly Electric Utility Sales and Revenue Data for 12-Months Ending June 2019 httpswwweiagovelectricitydataeia861mindexhtml
2018-19 Average Residential Rates (centkWh)
2018-19 Average Residential Bills ($ per Month)
$128
$95
US Average SCE
26 Lower
October 30 2019 38
Sheet1
Sheet1
129 ₵
164 ₵
Sheet2
27 Higher
Sheet3
Sheet1
Sheet1
$128
Sheet2
26 Lower
Sheet3
bull Assembly Bill 1171 permits cities and counties and Joint Powers Agencies (JPAs) to act as CCAs to purchase and sell electricity on behalf of the utility customers within their jurisdiction
bull An Order Instituting Rulemaking (OIR R17-06-026) was opened on June 29 2017 to review revise and consider alternatives to the ldquoPower Charge Indifference Adjustmentrdquo or PCIA The PCIA allocates a proportional share of above-market costs of SCErsquos
energy procurement portfolio to departing load customers to ensure remaining bundled service customers are indifferent
October 11 2018 Commission decision changes PCIA methodology and has substantially addressed the historical subsidy to departing load that materialized when renewables market prices declined over the past 4 yearso Decision also established a Phase 2 which is addressing utility
portfolio optimization PCIA ldquopre-paymentrdquo options for entities and individual departing load customers and implementation of the ldquotrue-uprdquo process for Resource Adequacy (RA) and Renewable Energy Credits (RECs) costs
o A Phase 2 final decision on the benchmark and true-up process was approved on October 10 2019 with the other Phase 2 activities to continue into 2020
bull On February 8 2018 the Commission approved Resolution E-4907 requiring CCAs to demonstrate compliance with annual Resource Adequacy (RA) requirements prior to commencing operations
bull Existing Direct Access and CCA load is expected to be ~35 of SCErsquos total load by the end of 2019
Investor-Owned Utility (IOU)
Community Choice Aggregator (CCA)
Community Choice Aggregator (CCA) Overview
Approximately 40 of SCErsquos bundled service load could be part of a CCA or Direct Access by the end of 2020
October 30 2019 39
bull CPUC Order Instituting Ratemaking R 12-06-013 comprehensively reviewed residential rate structure including a future transition to Time of Use (TOU) rates In March 2018 SCE began to migrate 400000 residential customers to TOU rate structures
Remaining eligible residential customers to be migrated beginning October 2020bull July 2015 CPUC Decision D 15-07-001 includes Transition to 2 tiered rate structure coupled with Super-User Electric (SUE) Surcharge1
ldquoSuper User Electric Surchargerdquo for usage 400 above baseline (~3 of all usage)
Minimum bills of approximately $10month (applied to delivery revenue only)
January 2014 2019
100(60 of system usage)
219(3)
Tier 1100
Tier 2 101-400
SUEgt400
125(37)
Usage Level ( of Baseline)Usage Level ( of Baseline)
1 Completed in 20192 SCErsquos California Alternate Rates for Energy (CARE) program is an income-qualifying program that reduces energy bills for eligible customers by about 30
Winter Weekdays 8am-9pm Weekdays and Weekends 4-9pm
Off-Peak Summer Weekdays 11pm-8amWeekends All
Weekdays and Weekends All except 4-9pm
Winter Weekdays 9pm-8amWeekends All
Weekdays and Weekends 9pm-8am
Super Off-Peak Winter NA Weekdays and Weekends 8am-4pm
New Time-of-Use (TOU) Periods
bull On March 1 2019 SCE changed its basic TOU pricing period definition for the first time in over 30 years
bull Abundant mid-day renewable energy lowers prices from 8am-4pm (October - June)
bull Highest cost period is now 4pm-9pm all-days1
1 TOU pricing periods defined for non-residential customers per CPUC Decision D18-07-006 Similar residential TOU definitions were filed by SCE in A17-12-012
bull 998 solar projectsbull 320445 residential (71 of all residential customers) ndash 1756 MW bull 7333 non-residential ndash 977 MW bull Approximately 4775887 MWhyear generated
SCE Net Metering Statistics (919)
0
5
10
15
20
25
30
35
40
0
1000
2000
3000
4000
5000
6000
7000
2013 2014 2015 2016 2017 2018 2019
MW
Inst
alle
d
Num
ber o
f Sol
ar R
esid
entia
l Ins
talla
tions
Installations MW
July 1 2017bull Official start of NEM successor tariff customers are subject to
Mandatory TOU rate Non-bypassable charges Application fees
July 31 2017bull Residential customers who meet this deadline are grandfathered for
current TOU periods for maximum of 5 years (10 for non-residential)September 9 2017bull Smart Inverters required on all solar installationsJuly 25 2018bull Smart Inverters with Reactive Power Priority required on all solar
installationsNear Term Outlookbull Combination of a flatter tiered rate and the mandatory TOU NEM 20
rate structure has helped reduce the per customer cost shift further efforts to reduce the shift through new TOU pricing periods
bull Commission to revisit NEM Successor Tariff by July 2020 to evaluate the existing NEM tariffs and consider the development and adoption of successor tariffs
Key Dates
Third Quarter Earnings Summary
October 30 2019
Q32019
Q32018 Variance
Basic Earnings Per Share (EPS)1
SCE $ 145 $ 164 $ (019)
EIX Parent amp Other (009) (007) (002)
Basic EPS $ 136 $ 157 $ (021)
Less Non-core Items
SCE2 $ (014) $ 002 $ (016)
EIX Parent amp Other3 mdash (001) 001
Total Non-core $ (014) $ 001 $ (015)
Core Earnings Per Share (EPS)
SCE $ 159 $ 162 $ (003)
EIX Parent amp Other (009) (006) (003)
Core EPS $ 150 $ 156 $ (006)
Key SCE EPS Drivers4
Higher revenue5 $ 012- CPUC revenue (002)- 2018 FERC Formula Rate settlement 010- Other FERC revenue 004
Higher OampM (021)Lower depreciation 002Higher net financing costs (004)Income taxes5 019Property and other taxes (001)Results prior to impact from share dilution $ 007Impact from share dilution (010)Total core drivers $ (003)Non-core items 2 (016)Total $ (019)
Key EIX EPS Drivers4
EIX parent and other mdash Higher interest expense and corporate expenses $ (005)EEG mdash Lower corporate expenses 001Impact from share dilution 001Total core drivers $ (003)Non-core items 3 001Total $ (002)
1 See Earnings Non-GAAP reconciliations and Use of Non-GAAP Financial Measures in Appendix2 Includes SCEs contributions to Wildfire Insurance Fund in third quarter 2019 and impact from the approval of the Revised San Onofre Settlement Agreement in the third quarter 2018 3 Loss on sale of SoCore Energy4 2019 EPS drivers are reported at a consistent share count of 3258 million (2019 QTD weighted-average shares outstanding is 3471 million)5 Includes $020 of tax benefits refunded to customersNote Diluted earnings were $135 and $157 per share for the three months ended September 30 2019 and 2018 respectively
43
1 See Earnings Non-GAAP reconciliations and Use of Non-GAAP Financial Measures in Appendix2 Impact of 2018 GRC final decision related to impairment of utility property plant and equipment changes in allocation of deferred tax re-measurement between customers and
shareholders SCErsquos contributions to the Wildfire Insurance Fund gain from sale of nuclear fuel and impact from the approval of the Revised San Onofre Settlement Agreement3 Loss on sale of SoCore Energy and impact of hypothetical liquidation at book value (HLBV) accounting method4 2019 EPS drivers are reported at a consistent share count of 3258 million (2019 YTD weighted-average shares outstanding is 3330 million)5 Test Year 2018 GRC true-up of $020 includes revenue of $(034) OampM of $006 depreciation of $024 interest expense of $(001) property and other taxes of $001 and income taxes of
$0246 Includes $018 of tax benefits refunded to customersNote Diluted earnings were $342 and $308 per share for the nine months ended September 30 2019 and 2018 respectively
Year to Date Earnings Summary
October 30 2019
YTD 2019
YTD 2018 Variance
Basic Earnings Per Share (EPS)1
SCE $ 365 $ 343 $ 022
EIX Parent amp Other (022) (034) 012
Basic EPS $ 343 $ 309 $ 034
Less Non-core Items
SCE2 $ (030) $ 002 $ (032)
EIX Parent amp Other3 mdash (014) 014
Total Non-core $ (030) $ (012) $ (018)
Core Earnings Per Share (EPS)
SCE $ 395 $ 341 $ 054
EIX Parent amp Other (022) (020) (002)
Core EPS $ 373 $ 321 $ 052
Key SCE EPS Drivers4
Test Year 2018 GRC true-up5 $ 020Higher revenue6 055
- CPUC revenue 032- 2018 FERC Formula Rate settlement 010- FERC and other operating revenue 013
Higher OampM (026)Lower depreciation 005Higher net financing costs (012)Income taxes6 021Results prior to impact from share dilution $ 063Impact from share dilution (009)Total core drivers $ 054Non-core items2 (032)Total $ 022
Key EIX EPS Drivers4
EIX parent and other mdash Higher interest expense and corporate expenses $ (007)EEG mdash Lower corporate expenses and lower losses at the competitive business 004Impact from share dilution 001Total core drivers $ (002)Non-core items3 014Total $ 012
44
SCE Annual Results of Operationsbull Earning activities ndash revenue authorized by CPUC and FERC to provide reasonable cost recovery and return on investmentbull Cost-recovery activities ndash CPUC- and FERC-authorized balancing accounts to recover specific project or program costs subject
to reasonableness review or compliance with upfront standards
($ millions)
2018 2017
Earnings Activities
Cost-Recovery Activities
Total Consolidated
Earnings Activities
Cost-Recovery Activities
Total Consolidated
Operating revenue $6560 $6051 $12611 $6611 $5643 $12254Purchased power and fuel mdash 5406 5406 mdash 4873 4873Operation and maintenance 1972 730 2702 1898 824 2722Wildfire-related claims net of recoveries 2669 mdash 2669 ― ― ―Depreciation and amortization 1867 mdash 1867 2032 mdash 2032Property and other taxes 392 mdash 392 372 mdash 372Impairment and other charges (12) mdash (12) 716 mdash 716Other operating income (7) mdash (7) (8) mdash (8)Total operating expenses 6881 6136 13017 5010 5697 10707Operating (loss) income (321) (85) (406) 1601 (54) 1547Interest expense (671) (2) (673) (588) (1) (589)Other income and expenses 107 87 194 93 55 148(Loss) income before income taxes (885) mdash (885) 1106 mdash 1106Income tax (benefit) expense (696) mdash (696) (30) mdash (30)Net (loss) income (189) mdash (189) 1136 mdash 1136Preferred and preference stock dividend
requirements 121 mdash 121 124 mdash 124
Net (loss) income available for common stock ($310) mdash ($310) $1012 mdash $1012Less Non-core items (1750) (481)Core Earnings $1440 $1493
Note See Use of Non-GAAP Financial Measures
October 30 2019 45
Reconciliation of EIX Basic Earnings Per Share Guidance to EIX Core Earnings Per Share Guidance
EPS Attributable to Edison International 2019
Low Midpoint High
SCE $483
EIX Parent amp Other (032)
Basic EPS1 $441 $451 $461
Non-Core Items
SCE23 (029) (029) (029)
EIX Parent amp Other mdash mdash mdash
Total Non-Core1 (029) (029) (029)
Core EPS
SCE $512
EIX Parent amp Other (032)
Core EPS1 $470 $480 $490
1 EPS is calculated on the assumed weighted-average share count for 2019 Please see 2019 EIX Core Earnings Guidance slide for more information 2 Includes impact of 2018 GRC final decision related to impairment of utility property plant and equipment changes in allocation of deferred tax re-measurement between
customers and shareholders and SCErsquos contributions to the Wildfire Insurance Fund3 Includes $001 per share as a result of share count dilution
October 30 2019
Earnings Per Share Non-GAAP Reconciliations
46
Earnings Non-GAAP Reconciliations
1 Impact of 2018 GRC final decision related to impairment of utility property plant and equipment changes in allocation of deferred tax re-measurement between customers and shareholders SCErsquos contributions to the Wildfire Insurance Fund gain from sale of nuclear fuel and impact from the approval of the Revised San Onofre Settlement Agreement
2 Loss on sale of SoCore Energy and impact of hypothetical liquidation at book value (HLBV) accounting method
($ millions)
Reconciliation of EIX GAAP Earnings to EIX Core Earnings
Earnings Attributable to Edison International Q32019
Q32018
YTD 2019
YTD 2018
SCE $503 $536 $1215 $1119
EIX Parent amp Other (32) (23) (74) (112)
Basic Earnings $471 $513 $1141 $1007
Non-Core Items
SCE 1 ($48) 7 ($99) 7
EIX Parent amp Other 2 mdash (4) mdash (46)
Total Non-Core ($48) $3 ($99) ($39)
Core Earnings
SCE $551 $529 $1314 $1112
EIX Parent amp Other (32) (19) (74) (66)
Core Earnings $519 $510 $1240 $1046
October 30 2019 47
EIX Core EPS Non-GAAP ReconciliationsReconciliation of Edison International Basic Earnings Per Share to Edison International Core Earnings Per Share
Note See Use of Non-GAAP Financial Measures
Earnings Per Share Attributable to Edison International 2018 2017
Basic EPS ($130) $173
Non-Core Items
SCE
Wildfire-related claims net of recoveries (560) mdash
Settlement of 1994 ndash 2006 California tax audits 020 mdash
Write down impairment and other as a result of Revised San Onofre Settlement Agreement
003 (138)
Re-measurement of deferred taxes as a result of Tax Reform mdash (010)
Edison International Parent and Other
Settlement of 1994 ndash 2006 California tax audits (004) mdash
Re-measurement of deferred taxes as a result of Tax Reform mdash (133)
Sale of SoCore Energy and other (014) 004
Discontinued operations
Settlement of 1994 ndash 2006 California tax audits 010 mdash
Less Total Non-Core Items (545) (277)
Core EPS $415 $450
October 30 2019 48
Use of Non-GAAP Financial MeasuresEdison Internationals earnings are prepared in accordance with generally accepted accounting principles used in the United States Management uses core earnings internally for financial planning and for analysis of performance Core earnings are also used when communicating with investors and analysts regarding Edison Internationals earnings results to facilitate comparisons of the Companys performance from period to period Core earnings are a non-GAAP financial measure and may not be comparable to those of other companies Core earnings (or losses) are defined as earnings or losses attributable to Edison International shareholders less income or loss from discontinued operations and income or loss from significant discrete items that management does not consider representative of ongoing earnings such as exit activities including sale of certain assets and other activities that are no longer continuing asset impairments and certain tax regulatory or legal settlements or proceedings
A reconciliation of Non-GAAP information to GAAP information is included either on the slide where the information appears or on another slide referenced in this presentation
EIX Investor Relations Contact
Sam Ramraj Vice President (626) 302-2540 samramrajedisonintlcom
Allison Bahen Principal Manager (626) 302-5493 allisonbahenedisonintlcom
October 30 2019 49
Business Update
Slide Number 2
Table of Contents
EIX Strategy Should Produce Long-Term Value
SCE Highlights
Slide Number 6
SCE Historical Rate Base and Core Earnings
SCE Capital Expenditure Forecast
SCE Rate Base Forecast
Slide Number 10
Californiarsquos GHG Emissions Overview
SCErsquos Pathway 2045 Highlights
Slide Number 13
Slide Number 14
Slide Number 15
SCE Key Regulatory Proceedings
Slide Number 17
Slide Number 18
CPUC and FERC Cost of Capital Summary
CPUC Cost of Capital (2013-2019)
SCE Distribution System Investments
Slide Number 22
Slide Number 23
SCE Large Transmission Projects
SCE Operational Excellence
Responding to Industry Change
Slide Number 27
2019 EIX Core Earnings Guidance
EIX Annual Dividends Per Share
Appendix
EIXrsquos 2018 Sustainability Report Highlights
Slide Number 32
SCE Historical Capital Expenditures
Credit Ratings Summary
Distribution Power Grid of the Future
SCE Customer Demand Trends
SCE Bundled Revenue Requirement
Slide Number 38
SCE Rates and Bills Comparison
Slide Number 40
Slide Number 41
Slide Number 42
Slide Number 43
Slide Number 44
Slide Number 45
SCE Annual Results of Operations
Slide Number 47
Earnings Non-GAAP Reconciliations
EIX Core EPS Non-GAAP Reconciliations
Use of Non-GAAP Financial Measures
US Average
$134
SCE
$95
-291
US Average
128
SCE
164
higher
28
Created on Mon 6 Jun 2016 1250 PM EST (1750 GMT)
Concept
1990
1991
1992
1993
1994
1995
1996
1997
1998
1999
2000
2001
2002
2003
2004
2005
2006
2007
2008
2009
2010
2011
2012
2013
2014
2015
2016
2017
2018
2019
2020
2021
2022
2023
2024
2025
2026
Consumer Price Index All-Urban
131
136
140
144
148
152
157
161
163
167
172
177
180
184
189
195
202
207
215
215
218
225
230
233
237
237
239
245
251
258
265
272
279
286
293
300
306
422
304
297
260
281
294
234
155
219
337
282
160
230
267
337
322
287
381
-032
164
314
208
147
161
012
105
236
253
265
265
264
254
251
249
234
227
SOUTHERN CALIFORNIA EDISON
System Average Rate Forecast
Source Matt Sheriff
(centkWh)
SCE System Average Rate
SAR CPI (old)
SAR CPI (current)
CPI Los Angeles-Long Beach-Anaheim CA
Consumer Price Index All-Urban
0
1990
97cent
97cent
97cent
593
30
1
1991
103cent
101cent
101cent
410
422
2
1992
106cent
104cent
105cent
361
304
3
1993
103cent
107cent
107cent
253
297
4
1994
105cent
110cent
109cent
137
260
5
1995
107cent
113cent
110cent
153
281
25
6
1996
101cent
116cent
112cent
183
294
7
1997
101cent
119cent
114cent
158
234
8
1998
96cent
121cent
116cent
144
155
9
1999
96cent
124cent
119cent
235
219
10
2000
96cent
128cent
122cent
330
337
20
11
2001
142cent
131cent
127cent
336
282
12
2002
142cent
134cent
130cent
277
160
13
2003
124cent
137cent
133cent
259
230
14
2004
122cent
140cent
138cent
334
267
15
2005
126cent
145cent
144cent
447
337
16
2006
147cent
150cent
150cent
427
322
17
2007
139cent
154cent
155cent
328
287
18
2008
137cent
160cent
161cent
353
381
19
2009
143cent
159cent
159cent
-080
-032
20
2010
143cent
162cent
161cent
120
164
10
21
2011
141cent
167cent
166cent
267
314
22
2012
143cent
170cent
169cent
203
208
23
2013
159cent
173cent
171cent
108
147
24
2014
167cent
176cent
173cent
135
161
25
2015
159cent
176cent
175cent
091
012
5
26
2016
148cent
178cent
178cent
189
105
27
2017
157cent
182cent
183cent
279
236
29
20
10
28
2018
160cent
187cent
190cent
381
253
SCE
17
26
11
29
2019
159cent
192cent
195cent
244
265
LA
24
25
20
30
2020
194cent
197cent
199cent
219
265
36
31
2021
199cent
202cent
203cent
227
266
25
49
Created on Wed 23 Jan 2019 1245 PM EST (1745 GMT)
Mnemonic
Long Label
Last Update
Start Date
End Date
Frequency
1970
1971
1972
1973
1974
1975
1976
1977
1978
1979
1980
1981
1982
1983
1984
1985
1986
1987
1988
1989
1990
1991
1992
1993
1994
1995
1996
1997
1998
1999
2000
2001
2002
2003
2004
2005
2006
2007
2008
2009
2010
2011
2012
2013
2014
2015
2016
2017
2018
2019
2020
2021
2022
2023
2024
2025
2026
2027
2028
2029
2030
2031
2032
2033
2034
2035
2036
2037
2038
2039
2040
2041
2042
2043
2044
2045
2046
2047
2048
CPILANGAFRSM1
Los Angeles-Long Beach-Anaheim CA (MSA) [2013 Definition] FIPS Code 31080 Consumer Price Index for All Urban Consumers (1982-84=100) IHS MARKIT ECONOMICS December 2018 Forecast Source Bureau of Labor Statistics End of Historical Data 2017
122718
1970
2048
ANNUAL
3868
4011
4139
4374
4825
5334
5683
6080
6526
7233
8372
9184
9734
9907
10360
10838
11193
11667
12206
12826
13587
14143
14654
15025
15231
15464
15748
15997
16227
16608
17155
17732
18223
18696
19320
20183
21044
21734
22501
22322
22589
23193
23665
23921
24243
24463
24925
25621
26598
27248
27844
28475
29132
29806
30500
31165
31832
32533
33254
33985
34744
35508
36279
37061
37854
38640
39440
40278
41145
42043
42963
43898
44852
45825
46816
47822
48857
49934
51047
371
320
568
1031
1055
655
698
733
1083
1575
971
599
177
458
461
328
423
462
508
593
410
361
253
137
153
183
158
144
235
330
336
277
259
334
447
427
328
353
-080
120
267
203
108
135
091
189
279
381
244
219
227
231
231
233
218
214
220
222
220
223
220
217
215
214
208
207
213
215
218
219
218
217
217
216
215
216
220
223
129 ₵
164 ₵
US Average SCE
27 Higher
SCE Rates and Bills Comparison
SCErsquos average residential rates are above national averagebut residential bills are below national average due to lower usage
bull SCErsquos residential rates are above national average due in part to a cleaner fuel mix high cost of living and lower system load factor
bull SCErsquos residential customer usage is lower than the national average due to mild climate and higher energy efficiency appliance and building standards
bull Average monthly residential bills are lower than the national average as higher rate levels are more than offset by lower usage
Key FactorsKey Factors
Source EIAs Form 861M (formerly Form 826) Data Monthly Electric Utility Sales and Revenue Data for 12-Months Ending June 2019 httpswwweiagovelectricitydataeia861mindexhtml
2018-19 Average Residential Rates (centkWh)
2018-19 Average Residential Bills ($ per Month)
$128
$95
US Average SCE
26 Lower
October 30 2019 38
Sheet1
Sheet1
129 ₵
164 ₵
Sheet2
27 Higher
Sheet3
Sheet1
Sheet1
$128
Sheet2
26 Lower
Sheet3
bull Assembly Bill 1171 permits cities and counties and Joint Powers Agencies (JPAs) to act as CCAs to purchase and sell electricity on behalf of the utility customers within their jurisdiction
bull An Order Instituting Rulemaking (OIR R17-06-026) was opened on June 29 2017 to review revise and consider alternatives to the ldquoPower Charge Indifference Adjustmentrdquo or PCIA The PCIA allocates a proportional share of above-market costs of SCErsquos
energy procurement portfolio to departing load customers to ensure remaining bundled service customers are indifferent
October 11 2018 Commission decision changes PCIA methodology and has substantially addressed the historical subsidy to departing load that materialized when renewables market prices declined over the past 4 yearso Decision also established a Phase 2 which is addressing utility
portfolio optimization PCIA ldquopre-paymentrdquo options for entities and individual departing load customers and implementation of the ldquotrue-uprdquo process for Resource Adequacy (RA) and Renewable Energy Credits (RECs) costs
o A Phase 2 final decision on the benchmark and true-up process was approved on October 10 2019 with the other Phase 2 activities to continue into 2020
bull On February 8 2018 the Commission approved Resolution E-4907 requiring CCAs to demonstrate compliance with annual Resource Adequacy (RA) requirements prior to commencing operations
bull Existing Direct Access and CCA load is expected to be ~35 of SCErsquos total load by the end of 2019
Investor-Owned Utility (IOU)
Community Choice Aggregator (CCA)
Community Choice Aggregator (CCA) Overview
Approximately 40 of SCErsquos bundled service load could be part of a CCA or Direct Access by the end of 2020
October 30 2019 39
bull CPUC Order Instituting Ratemaking R 12-06-013 comprehensively reviewed residential rate structure including a future transition to Time of Use (TOU) rates In March 2018 SCE began to migrate 400000 residential customers to TOU rate structures
Remaining eligible residential customers to be migrated beginning October 2020bull July 2015 CPUC Decision D 15-07-001 includes Transition to 2 tiered rate structure coupled with Super-User Electric (SUE) Surcharge1
ldquoSuper User Electric Surchargerdquo for usage 400 above baseline (~3 of all usage)
Minimum bills of approximately $10month (applied to delivery revenue only)
January 2014 2019
100(60 of system usage)
219(3)
Tier 1100
Tier 2 101-400
SUEgt400
125(37)
Usage Level ( of Baseline)Usage Level ( of Baseline)
1 Completed in 20192 SCErsquos California Alternate Rates for Energy (CARE) program is an income-qualifying program that reduces energy bills for eligible customers by about 30
Winter Weekdays 8am-9pm Weekdays and Weekends 4-9pm
Off-Peak Summer Weekdays 11pm-8amWeekends All
Weekdays and Weekends All except 4-9pm
Winter Weekdays 9pm-8amWeekends All
Weekdays and Weekends 9pm-8am
Super Off-Peak Winter NA Weekdays and Weekends 8am-4pm
New Time-of-Use (TOU) Periods
bull On March 1 2019 SCE changed its basic TOU pricing period definition for the first time in over 30 years
bull Abundant mid-day renewable energy lowers prices from 8am-4pm (October - June)
bull Highest cost period is now 4pm-9pm all-days1
1 TOU pricing periods defined for non-residential customers per CPUC Decision D18-07-006 Similar residential TOU definitions were filed by SCE in A17-12-012
bull 998 solar projectsbull 320445 residential (71 of all residential customers) ndash 1756 MW bull 7333 non-residential ndash 977 MW bull Approximately 4775887 MWhyear generated
SCE Net Metering Statistics (919)
0
5
10
15
20
25
30
35
40
0
1000
2000
3000
4000
5000
6000
7000
2013 2014 2015 2016 2017 2018 2019
MW
Inst
alle
d
Num
ber o
f Sol
ar R
esid
entia
l Ins
talla
tions
Installations MW
July 1 2017bull Official start of NEM successor tariff customers are subject to
Mandatory TOU rate Non-bypassable charges Application fees
July 31 2017bull Residential customers who meet this deadline are grandfathered for
current TOU periods for maximum of 5 years (10 for non-residential)September 9 2017bull Smart Inverters required on all solar installationsJuly 25 2018bull Smart Inverters with Reactive Power Priority required on all solar
installationsNear Term Outlookbull Combination of a flatter tiered rate and the mandatory TOU NEM 20
rate structure has helped reduce the per customer cost shift further efforts to reduce the shift through new TOU pricing periods
bull Commission to revisit NEM Successor Tariff by July 2020 to evaluate the existing NEM tariffs and consider the development and adoption of successor tariffs
Key Dates
Third Quarter Earnings Summary
October 30 2019
Q32019
Q32018 Variance
Basic Earnings Per Share (EPS)1
SCE $ 145 $ 164 $ (019)
EIX Parent amp Other (009) (007) (002)
Basic EPS $ 136 $ 157 $ (021)
Less Non-core Items
SCE2 $ (014) $ 002 $ (016)
EIX Parent amp Other3 mdash (001) 001
Total Non-core $ (014) $ 001 $ (015)
Core Earnings Per Share (EPS)
SCE $ 159 $ 162 $ (003)
EIX Parent amp Other (009) (006) (003)
Core EPS $ 150 $ 156 $ (006)
Key SCE EPS Drivers4
Higher revenue5 $ 012- CPUC revenue (002)- 2018 FERC Formula Rate settlement 010- Other FERC revenue 004
Higher OampM (021)Lower depreciation 002Higher net financing costs (004)Income taxes5 019Property and other taxes (001)Results prior to impact from share dilution $ 007Impact from share dilution (010)Total core drivers $ (003)Non-core items 2 (016)Total $ (019)
Key EIX EPS Drivers4
EIX parent and other mdash Higher interest expense and corporate expenses $ (005)EEG mdash Lower corporate expenses 001Impact from share dilution 001Total core drivers $ (003)Non-core items 3 001Total $ (002)
1 See Earnings Non-GAAP reconciliations and Use of Non-GAAP Financial Measures in Appendix2 Includes SCEs contributions to Wildfire Insurance Fund in third quarter 2019 and impact from the approval of the Revised San Onofre Settlement Agreement in the third quarter 2018 3 Loss on sale of SoCore Energy4 2019 EPS drivers are reported at a consistent share count of 3258 million (2019 QTD weighted-average shares outstanding is 3471 million)5 Includes $020 of tax benefits refunded to customersNote Diluted earnings were $135 and $157 per share for the three months ended September 30 2019 and 2018 respectively
43
1 See Earnings Non-GAAP reconciliations and Use of Non-GAAP Financial Measures in Appendix2 Impact of 2018 GRC final decision related to impairment of utility property plant and equipment changes in allocation of deferred tax re-measurement between customers and
shareholders SCErsquos contributions to the Wildfire Insurance Fund gain from sale of nuclear fuel and impact from the approval of the Revised San Onofre Settlement Agreement3 Loss on sale of SoCore Energy and impact of hypothetical liquidation at book value (HLBV) accounting method4 2019 EPS drivers are reported at a consistent share count of 3258 million (2019 YTD weighted-average shares outstanding is 3330 million)5 Test Year 2018 GRC true-up of $020 includes revenue of $(034) OampM of $006 depreciation of $024 interest expense of $(001) property and other taxes of $001 and income taxes of
$0246 Includes $018 of tax benefits refunded to customersNote Diluted earnings were $342 and $308 per share for the nine months ended September 30 2019 and 2018 respectively
Year to Date Earnings Summary
October 30 2019
YTD 2019
YTD 2018 Variance
Basic Earnings Per Share (EPS)1
SCE $ 365 $ 343 $ 022
EIX Parent amp Other (022) (034) 012
Basic EPS $ 343 $ 309 $ 034
Less Non-core Items
SCE2 $ (030) $ 002 $ (032)
EIX Parent amp Other3 mdash (014) 014
Total Non-core $ (030) $ (012) $ (018)
Core Earnings Per Share (EPS)
SCE $ 395 $ 341 $ 054
EIX Parent amp Other (022) (020) (002)
Core EPS $ 373 $ 321 $ 052
Key SCE EPS Drivers4
Test Year 2018 GRC true-up5 $ 020Higher revenue6 055
- CPUC revenue 032- 2018 FERC Formula Rate settlement 010- FERC and other operating revenue 013
Higher OampM (026)Lower depreciation 005Higher net financing costs (012)Income taxes6 021Results prior to impact from share dilution $ 063Impact from share dilution (009)Total core drivers $ 054Non-core items2 (032)Total $ 022
Key EIX EPS Drivers4
EIX parent and other mdash Higher interest expense and corporate expenses $ (007)EEG mdash Lower corporate expenses and lower losses at the competitive business 004Impact from share dilution 001Total core drivers $ (002)Non-core items3 014Total $ 012
44
SCE Annual Results of Operationsbull Earning activities ndash revenue authorized by CPUC and FERC to provide reasonable cost recovery and return on investmentbull Cost-recovery activities ndash CPUC- and FERC-authorized balancing accounts to recover specific project or program costs subject
to reasonableness review or compliance with upfront standards
($ millions)
2018 2017
Earnings Activities
Cost-Recovery Activities
Total Consolidated
Earnings Activities
Cost-Recovery Activities
Total Consolidated
Operating revenue $6560 $6051 $12611 $6611 $5643 $12254Purchased power and fuel mdash 5406 5406 mdash 4873 4873Operation and maintenance 1972 730 2702 1898 824 2722Wildfire-related claims net of recoveries 2669 mdash 2669 ― ― ―Depreciation and amortization 1867 mdash 1867 2032 mdash 2032Property and other taxes 392 mdash 392 372 mdash 372Impairment and other charges (12) mdash (12) 716 mdash 716Other operating income (7) mdash (7) (8) mdash (8)Total operating expenses 6881 6136 13017 5010 5697 10707Operating (loss) income (321) (85) (406) 1601 (54) 1547Interest expense (671) (2) (673) (588) (1) (589)Other income and expenses 107 87 194 93 55 148(Loss) income before income taxes (885) mdash (885) 1106 mdash 1106Income tax (benefit) expense (696) mdash (696) (30) mdash (30)Net (loss) income (189) mdash (189) 1136 mdash 1136Preferred and preference stock dividend
requirements 121 mdash 121 124 mdash 124
Net (loss) income available for common stock ($310) mdash ($310) $1012 mdash $1012Less Non-core items (1750) (481)Core Earnings $1440 $1493
Note See Use of Non-GAAP Financial Measures
October 30 2019 45
Reconciliation of EIX Basic Earnings Per Share Guidance to EIX Core Earnings Per Share Guidance
EPS Attributable to Edison International 2019
Low Midpoint High
SCE $483
EIX Parent amp Other (032)
Basic EPS1 $441 $451 $461
Non-Core Items
SCE23 (029) (029) (029)
EIX Parent amp Other mdash mdash mdash
Total Non-Core1 (029) (029) (029)
Core EPS
SCE $512
EIX Parent amp Other (032)
Core EPS1 $470 $480 $490
1 EPS is calculated on the assumed weighted-average share count for 2019 Please see 2019 EIX Core Earnings Guidance slide for more information 2 Includes impact of 2018 GRC final decision related to impairment of utility property plant and equipment changes in allocation of deferred tax re-measurement between
customers and shareholders and SCErsquos contributions to the Wildfire Insurance Fund3 Includes $001 per share as a result of share count dilution
October 30 2019
Earnings Per Share Non-GAAP Reconciliations
46
Earnings Non-GAAP Reconciliations
1 Impact of 2018 GRC final decision related to impairment of utility property plant and equipment changes in allocation of deferred tax re-measurement between customers and shareholders SCErsquos contributions to the Wildfire Insurance Fund gain from sale of nuclear fuel and impact from the approval of the Revised San Onofre Settlement Agreement
2 Loss on sale of SoCore Energy and impact of hypothetical liquidation at book value (HLBV) accounting method
($ millions)
Reconciliation of EIX GAAP Earnings to EIX Core Earnings
Earnings Attributable to Edison International Q32019
Q32018
YTD 2019
YTD 2018
SCE $503 $536 $1215 $1119
EIX Parent amp Other (32) (23) (74) (112)
Basic Earnings $471 $513 $1141 $1007
Non-Core Items
SCE 1 ($48) 7 ($99) 7
EIX Parent amp Other 2 mdash (4) mdash (46)
Total Non-Core ($48) $3 ($99) ($39)
Core Earnings
SCE $551 $529 $1314 $1112
EIX Parent amp Other (32) (19) (74) (66)
Core Earnings $519 $510 $1240 $1046
October 30 2019 47
EIX Core EPS Non-GAAP ReconciliationsReconciliation of Edison International Basic Earnings Per Share to Edison International Core Earnings Per Share
Note See Use of Non-GAAP Financial Measures
Earnings Per Share Attributable to Edison International 2018 2017
Basic EPS ($130) $173
Non-Core Items
SCE
Wildfire-related claims net of recoveries (560) mdash
Settlement of 1994 ndash 2006 California tax audits 020 mdash
Write down impairment and other as a result of Revised San Onofre Settlement Agreement
003 (138)
Re-measurement of deferred taxes as a result of Tax Reform mdash (010)
Edison International Parent and Other
Settlement of 1994 ndash 2006 California tax audits (004) mdash
Re-measurement of deferred taxes as a result of Tax Reform mdash (133)
Sale of SoCore Energy and other (014) 004
Discontinued operations
Settlement of 1994 ndash 2006 California tax audits 010 mdash
Less Total Non-Core Items (545) (277)
Core EPS $415 $450
October 30 2019 48
Use of Non-GAAP Financial MeasuresEdison Internationals earnings are prepared in accordance with generally accepted accounting principles used in the United States Management uses core earnings internally for financial planning and for analysis of performance Core earnings are also used when communicating with investors and analysts regarding Edison Internationals earnings results to facilitate comparisons of the Companys performance from period to period Core earnings are a non-GAAP financial measure and may not be comparable to those of other companies Core earnings (or losses) are defined as earnings or losses attributable to Edison International shareholders less income or loss from discontinued operations and income or loss from significant discrete items that management does not consider representative of ongoing earnings such as exit activities including sale of certain assets and other activities that are no longer continuing asset impairments and certain tax regulatory or legal settlements or proceedings
A reconciliation of Non-GAAP information to GAAP information is included either on the slide where the information appears or on another slide referenced in this presentation
EIX Investor Relations Contact
Sam Ramraj Vice President (626) 302-2540 samramrajedisonintlcom
Allison Bahen Principal Manager (626) 302-5493 allisonbahenedisonintlcom
October 30 2019 49
Business Update
Slide Number 2
Table of Contents
EIX Strategy Should Produce Long-Term Value
SCE Highlights
Slide Number 6
SCE Historical Rate Base and Core Earnings
SCE Capital Expenditure Forecast
SCE Rate Base Forecast
Slide Number 10
Californiarsquos GHG Emissions Overview
SCErsquos Pathway 2045 Highlights
Slide Number 13
Slide Number 14
Slide Number 15
SCE Key Regulatory Proceedings
Slide Number 17
Slide Number 18
CPUC and FERC Cost of Capital Summary
CPUC Cost of Capital (2013-2019)
SCE Distribution System Investments
Slide Number 22
Slide Number 23
SCE Large Transmission Projects
SCE Operational Excellence
Responding to Industry Change
Slide Number 27
2019 EIX Core Earnings Guidance
EIX Annual Dividends Per Share
Appendix
EIXrsquos 2018 Sustainability Report Highlights
Slide Number 32
SCE Historical Capital Expenditures
Credit Ratings Summary
Distribution Power Grid of the Future
SCE Customer Demand Trends
SCE Bundled Revenue Requirement
Slide Number 38
SCE Rates and Bills Comparison
Slide Number 40
Slide Number 41
Slide Number 42
Slide Number 43
Slide Number 44
Slide Number 45
SCE Annual Results of Operations
Slide Number 47
Earnings Non-GAAP Reconciliations
EIX Core EPS Non-GAAP Reconciliations
Use of Non-GAAP Financial Measures
US Average
$134
SCE
$95
-291
US Average
128
SCE
164
higher
28
Sheet1
Sheet1
129 ₵
164 ₵
Sheet2
27 Higher
Sheet3
Sheet1
Sheet1
$128
Sheet2
26 Lower
Sheet3
bull Assembly Bill 1171 permits cities and counties and Joint Powers Agencies (JPAs) to act as CCAs to purchase and sell electricity on behalf of the utility customers within their jurisdiction
bull An Order Instituting Rulemaking (OIR R17-06-026) was opened on June 29 2017 to review revise and consider alternatives to the ldquoPower Charge Indifference Adjustmentrdquo or PCIA The PCIA allocates a proportional share of above-market costs of SCErsquos
energy procurement portfolio to departing load customers to ensure remaining bundled service customers are indifferent
October 11 2018 Commission decision changes PCIA methodology and has substantially addressed the historical subsidy to departing load that materialized when renewables market prices declined over the past 4 yearso Decision also established a Phase 2 which is addressing utility
portfolio optimization PCIA ldquopre-paymentrdquo options for entities and individual departing load customers and implementation of the ldquotrue-uprdquo process for Resource Adequacy (RA) and Renewable Energy Credits (RECs) costs
o A Phase 2 final decision on the benchmark and true-up process was approved on October 10 2019 with the other Phase 2 activities to continue into 2020
bull On February 8 2018 the Commission approved Resolution E-4907 requiring CCAs to demonstrate compliance with annual Resource Adequacy (RA) requirements prior to commencing operations
bull Existing Direct Access and CCA load is expected to be ~35 of SCErsquos total load by the end of 2019
Investor-Owned Utility (IOU)
Community Choice Aggregator (CCA)
Community Choice Aggregator (CCA) Overview
Approximately 40 of SCErsquos bundled service load could be part of a CCA or Direct Access by the end of 2020
October 30 2019 39
bull CPUC Order Instituting Ratemaking R 12-06-013 comprehensively reviewed residential rate structure including a future transition to Time of Use (TOU) rates In March 2018 SCE began to migrate 400000 residential customers to TOU rate structures
Remaining eligible residential customers to be migrated beginning October 2020bull July 2015 CPUC Decision D 15-07-001 includes Transition to 2 tiered rate structure coupled with Super-User Electric (SUE) Surcharge1
ldquoSuper User Electric Surchargerdquo for usage 400 above baseline (~3 of all usage)
Minimum bills of approximately $10month (applied to delivery revenue only)
January 2014 2019
100(60 of system usage)
219(3)
Tier 1100
Tier 2 101-400
SUEgt400
125(37)
Usage Level ( of Baseline)Usage Level ( of Baseline)
1 Completed in 20192 SCErsquos California Alternate Rates for Energy (CARE) program is an income-qualifying program that reduces energy bills for eligible customers by about 30
Winter Weekdays 8am-9pm Weekdays and Weekends 4-9pm
Off-Peak Summer Weekdays 11pm-8amWeekends All
Weekdays and Weekends All except 4-9pm
Winter Weekdays 9pm-8amWeekends All
Weekdays and Weekends 9pm-8am
Super Off-Peak Winter NA Weekdays and Weekends 8am-4pm
New Time-of-Use (TOU) Periods
bull On March 1 2019 SCE changed its basic TOU pricing period definition for the first time in over 30 years
bull Abundant mid-day renewable energy lowers prices from 8am-4pm (October - June)
bull Highest cost period is now 4pm-9pm all-days1
1 TOU pricing periods defined for non-residential customers per CPUC Decision D18-07-006 Similar residential TOU definitions were filed by SCE in A17-12-012
bull 998 solar projectsbull 320445 residential (71 of all residential customers) ndash 1756 MW bull 7333 non-residential ndash 977 MW bull Approximately 4775887 MWhyear generated
SCE Net Metering Statistics (919)
0
5
10
15
20
25
30
35
40
0
1000
2000
3000
4000
5000
6000
7000
2013 2014 2015 2016 2017 2018 2019
MW
Inst
alle
d
Num
ber o
f Sol
ar R
esid
entia
l Ins
talla
tions
Installations MW
July 1 2017bull Official start of NEM successor tariff customers are subject to
Mandatory TOU rate Non-bypassable charges Application fees
July 31 2017bull Residential customers who meet this deadline are grandfathered for
current TOU periods for maximum of 5 years (10 for non-residential)September 9 2017bull Smart Inverters required on all solar installationsJuly 25 2018bull Smart Inverters with Reactive Power Priority required on all solar
installationsNear Term Outlookbull Combination of a flatter tiered rate and the mandatory TOU NEM 20
rate structure has helped reduce the per customer cost shift further efforts to reduce the shift through new TOU pricing periods
bull Commission to revisit NEM Successor Tariff by July 2020 to evaluate the existing NEM tariffs and consider the development and adoption of successor tariffs
Key Dates
Third Quarter Earnings Summary
October 30 2019
Q32019
Q32018 Variance
Basic Earnings Per Share (EPS)1
SCE $ 145 $ 164 $ (019)
EIX Parent amp Other (009) (007) (002)
Basic EPS $ 136 $ 157 $ (021)
Less Non-core Items
SCE2 $ (014) $ 002 $ (016)
EIX Parent amp Other3 mdash (001) 001
Total Non-core $ (014) $ 001 $ (015)
Core Earnings Per Share (EPS)
SCE $ 159 $ 162 $ (003)
EIX Parent amp Other (009) (006) (003)
Core EPS $ 150 $ 156 $ (006)
Key SCE EPS Drivers4
Higher revenue5 $ 012- CPUC revenue (002)- 2018 FERC Formula Rate settlement 010- Other FERC revenue 004
Higher OampM (021)Lower depreciation 002Higher net financing costs (004)Income taxes5 019Property and other taxes (001)Results prior to impact from share dilution $ 007Impact from share dilution (010)Total core drivers $ (003)Non-core items 2 (016)Total $ (019)
Key EIX EPS Drivers4
EIX parent and other mdash Higher interest expense and corporate expenses $ (005)EEG mdash Lower corporate expenses 001Impact from share dilution 001Total core drivers $ (003)Non-core items 3 001Total $ (002)
1 See Earnings Non-GAAP reconciliations and Use of Non-GAAP Financial Measures in Appendix2 Includes SCEs contributions to Wildfire Insurance Fund in third quarter 2019 and impact from the approval of the Revised San Onofre Settlement Agreement in the third quarter 2018 3 Loss on sale of SoCore Energy4 2019 EPS drivers are reported at a consistent share count of 3258 million (2019 QTD weighted-average shares outstanding is 3471 million)5 Includes $020 of tax benefits refunded to customersNote Diluted earnings were $135 and $157 per share for the three months ended September 30 2019 and 2018 respectively
43
1 See Earnings Non-GAAP reconciliations and Use of Non-GAAP Financial Measures in Appendix2 Impact of 2018 GRC final decision related to impairment of utility property plant and equipment changes in allocation of deferred tax re-measurement between customers and
shareholders SCErsquos contributions to the Wildfire Insurance Fund gain from sale of nuclear fuel and impact from the approval of the Revised San Onofre Settlement Agreement3 Loss on sale of SoCore Energy and impact of hypothetical liquidation at book value (HLBV) accounting method4 2019 EPS drivers are reported at a consistent share count of 3258 million (2019 YTD weighted-average shares outstanding is 3330 million)5 Test Year 2018 GRC true-up of $020 includes revenue of $(034) OampM of $006 depreciation of $024 interest expense of $(001) property and other taxes of $001 and income taxes of
$0246 Includes $018 of tax benefits refunded to customersNote Diluted earnings were $342 and $308 per share for the nine months ended September 30 2019 and 2018 respectively
Year to Date Earnings Summary
October 30 2019
YTD 2019
YTD 2018 Variance
Basic Earnings Per Share (EPS)1
SCE $ 365 $ 343 $ 022
EIX Parent amp Other (022) (034) 012
Basic EPS $ 343 $ 309 $ 034
Less Non-core Items
SCE2 $ (030) $ 002 $ (032)
EIX Parent amp Other3 mdash (014) 014
Total Non-core $ (030) $ (012) $ (018)
Core Earnings Per Share (EPS)
SCE $ 395 $ 341 $ 054
EIX Parent amp Other (022) (020) (002)
Core EPS $ 373 $ 321 $ 052
Key SCE EPS Drivers4
Test Year 2018 GRC true-up5 $ 020Higher revenue6 055
- CPUC revenue 032- 2018 FERC Formula Rate settlement 010- FERC and other operating revenue 013
Higher OampM (026)Lower depreciation 005Higher net financing costs (012)Income taxes6 021Results prior to impact from share dilution $ 063Impact from share dilution (009)Total core drivers $ 054Non-core items2 (032)Total $ 022
Key EIX EPS Drivers4
EIX parent and other mdash Higher interest expense and corporate expenses $ (007)EEG mdash Lower corporate expenses and lower losses at the competitive business 004Impact from share dilution 001Total core drivers $ (002)Non-core items3 014Total $ 012
44
SCE Annual Results of Operationsbull Earning activities ndash revenue authorized by CPUC and FERC to provide reasonable cost recovery and return on investmentbull Cost-recovery activities ndash CPUC- and FERC-authorized balancing accounts to recover specific project or program costs subject
to reasonableness review or compliance with upfront standards
($ millions)
2018 2017
Earnings Activities
Cost-Recovery Activities
Total Consolidated
Earnings Activities
Cost-Recovery Activities
Total Consolidated
Operating revenue $6560 $6051 $12611 $6611 $5643 $12254Purchased power and fuel mdash 5406 5406 mdash 4873 4873Operation and maintenance 1972 730 2702 1898 824 2722Wildfire-related claims net of recoveries 2669 mdash 2669 ― ― ―Depreciation and amortization 1867 mdash 1867 2032 mdash 2032Property and other taxes 392 mdash 392 372 mdash 372Impairment and other charges (12) mdash (12) 716 mdash 716Other operating income (7) mdash (7) (8) mdash (8)Total operating expenses 6881 6136 13017 5010 5697 10707Operating (loss) income (321) (85) (406) 1601 (54) 1547Interest expense (671) (2) (673) (588) (1) (589)Other income and expenses 107 87 194 93 55 148(Loss) income before income taxes (885) mdash (885) 1106 mdash 1106Income tax (benefit) expense (696) mdash (696) (30) mdash (30)Net (loss) income (189) mdash (189) 1136 mdash 1136Preferred and preference stock dividend
requirements 121 mdash 121 124 mdash 124
Net (loss) income available for common stock ($310) mdash ($310) $1012 mdash $1012Less Non-core items (1750) (481)Core Earnings $1440 $1493
Note See Use of Non-GAAP Financial Measures
October 30 2019 45
Reconciliation of EIX Basic Earnings Per Share Guidance to EIX Core Earnings Per Share Guidance
EPS Attributable to Edison International 2019
Low Midpoint High
SCE $483
EIX Parent amp Other (032)
Basic EPS1 $441 $451 $461
Non-Core Items
SCE23 (029) (029) (029)
EIX Parent amp Other mdash mdash mdash
Total Non-Core1 (029) (029) (029)
Core EPS
SCE $512
EIX Parent amp Other (032)
Core EPS1 $470 $480 $490
1 EPS is calculated on the assumed weighted-average share count for 2019 Please see 2019 EIX Core Earnings Guidance slide for more information 2 Includes impact of 2018 GRC final decision related to impairment of utility property plant and equipment changes in allocation of deferred tax re-measurement between
customers and shareholders and SCErsquos contributions to the Wildfire Insurance Fund3 Includes $001 per share as a result of share count dilution
October 30 2019
Earnings Per Share Non-GAAP Reconciliations
46
Earnings Non-GAAP Reconciliations
1 Impact of 2018 GRC final decision related to impairment of utility property plant and equipment changes in allocation of deferred tax re-measurement between customers and shareholders SCErsquos contributions to the Wildfire Insurance Fund gain from sale of nuclear fuel and impact from the approval of the Revised San Onofre Settlement Agreement
2 Loss on sale of SoCore Energy and impact of hypothetical liquidation at book value (HLBV) accounting method
($ millions)
Reconciliation of EIX GAAP Earnings to EIX Core Earnings
Earnings Attributable to Edison International Q32019
Q32018
YTD 2019
YTD 2018
SCE $503 $536 $1215 $1119
EIX Parent amp Other (32) (23) (74) (112)
Basic Earnings $471 $513 $1141 $1007
Non-Core Items
SCE 1 ($48) 7 ($99) 7
EIX Parent amp Other 2 mdash (4) mdash (46)
Total Non-Core ($48) $3 ($99) ($39)
Core Earnings
SCE $551 $529 $1314 $1112
EIX Parent amp Other (32) (19) (74) (66)
Core Earnings $519 $510 $1240 $1046
October 30 2019 47
EIX Core EPS Non-GAAP ReconciliationsReconciliation of Edison International Basic Earnings Per Share to Edison International Core Earnings Per Share
Note See Use of Non-GAAP Financial Measures
Earnings Per Share Attributable to Edison International 2018 2017
Basic EPS ($130) $173
Non-Core Items
SCE
Wildfire-related claims net of recoveries (560) mdash
Settlement of 1994 ndash 2006 California tax audits 020 mdash
Write down impairment and other as a result of Revised San Onofre Settlement Agreement
003 (138)
Re-measurement of deferred taxes as a result of Tax Reform mdash (010)
Edison International Parent and Other
Settlement of 1994 ndash 2006 California tax audits (004) mdash
Re-measurement of deferred taxes as a result of Tax Reform mdash (133)
Sale of SoCore Energy and other (014) 004
Discontinued operations
Settlement of 1994 ndash 2006 California tax audits 010 mdash
Less Total Non-Core Items (545) (277)
Core EPS $415 $450
October 30 2019 48
Use of Non-GAAP Financial MeasuresEdison Internationals earnings are prepared in accordance with generally accepted accounting principles used in the United States Management uses core earnings internally for financial planning and for analysis of performance Core earnings are also used when communicating with investors and analysts regarding Edison Internationals earnings results to facilitate comparisons of the Companys performance from period to period Core earnings are a non-GAAP financial measure and may not be comparable to those of other companies Core earnings (or losses) are defined as earnings or losses attributable to Edison International shareholders less income or loss from discontinued operations and income or loss from significant discrete items that management does not consider representative of ongoing earnings such as exit activities including sale of certain assets and other activities that are no longer continuing asset impairments and certain tax regulatory or legal settlements or proceedings
A reconciliation of Non-GAAP information to GAAP information is included either on the slide where the information appears or on another slide referenced in this presentation
EIX Investor Relations Contact
Sam Ramraj Vice President (626) 302-2540 samramrajedisonintlcom
Allison Bahen Principal Manager (626) 302-5493 allisonbahenedisonintlcom
October 30 2019 49
Business Update
Slide Number 2
Table of Contents
EIX Strategy Should Produce Long-Term Value
SCE Highlights
Slide Number 6
SCE Historical Rate Base and Core Earnings
SCE Capital Expenditure Forecast
SCE Rate Base Forecast
Slide Number 10
Californiarsquos GHG Emissions Overview
SCErsquos Pathway 2045 Highlights
Slide Number 13
Slide Number 14
Slide Number 15
SCE Key Regulatory Proceedings
Slide Number 17
Slide Number 18
CPUC and FERC Cost of Capital Summary
CPUC Cost of Capital (2013-2019)
SCE Distribution System Investments
Slide Number 22
Slide Number 23
SCE Large Transmission Projects
SCE Operational Excellence
Responding to Industry Change
Slide Number 27
2019 EIX Core Earnings Guidance
EIX Annual Dividends Per Share
Appendix
EIXrsquos 2018 Sustainability Report Highlights
Slide Number 32
SCE Historical Capital Expenditures
Credit Ratings Summary
Distribution Power Grid of the Future
SCE Customer Demand Trends
SCE Bundled Revenue Requirement
Slide Number 38
SCE Rates and Bills Comparison
Slide Number 40
Slide Number 41
Slide Number 42
Slide Number 43
Slide Number 44
Slide Number 45
SCE Annual Results of Operations
Slide Number 47
Earnings Non-GAAP Reconciliations
EIX Core EPS Non-GAAP Reconciliations
Use of Non-GAAP Financial Measures
US Average
$134
SCE
$95
-291
US Average
128
SCE
164
higher
28
Sheet1
129 ₵
164 ₵
Sheet2
27 Higher
Sheet3
Sheet1
Sheet1
$128
Sheet2
26 Lower
Sheet3
bull Assembly Bill 1171 permits cities and counties and Joint Powers Agencies (JPAs) to act as CCAs to purchase and sell electricity on behalf of the utility customers within their jurisdiction
bull An Order Instituting Rulemaking (OIR R17-06-026) was opened on June 29 2017 to review revise and consider alternatives to the ldquoPower Charge Indifference Adjustmentrdquo or PCIA The PCIA allocates a proportional share of above-market costs of SCErsquos
energy procurement portfolio to departing load customers to ensure remaining bundled service customers are indifferent
October 11 2018 Commission decision changes PCIA methodology and has substantially addressed the historical subsidy to departing load that materialized when renewables market prices declined over the past 4 yearso Decision also established a Phase 2 which is addressing utility
portfolio optimization PCIA ldquopre-paymentrdquo options for entities and individual departing load customers and implementation of the ldquotrue-uprdquo process for Resource Adequacy (RA) and Renewable Energy Credits (RECs) costs
o A Phase 2 final decision on the benchmark and true-up process was approved on October 10 2019 with the other Phase 2 activities to continue into 2020
bull On February 8 2018 the Commission approved Resolution E-4907 requiring CCAs to demonstrate compliance with annual Resource Adequacy (RA) requirements prior to commencing operations
bull Existing Direct Access and CCA load is expected to be ~35 of SCErsquos total load by the end of 2019
Investor-Owned Utility (IOU)
Community Choice Aggregator (CCA)
Community Choice Aggregator (CCA) Overview
Approximately 40 of SCErsquos bundled service load could be part of a CCA or Direct Access by the end of 2020
October 30 2019 39
bull CPUC Order Instituting Ratemaking R 12-06-013 comprehensively reviewed residential rate structure including a future transition to Time of Use (TOU) rates In March 2018 SCE began to migrate 400000 residential customers to TOU rate structures
Remaining eligible residential customers to be migrated beginning October 2020bull July 2015 CPUC Decision D 15-07-001 includes Transition to 2 tiered rate structure coupled with Super-User Electric (SUE) Surcharge1
ldquoSuper User Electric Surchargerdquo for usage 400 above baseline (~3 of all usage)
Minimum bills of approximately $10month (applied to delivery revenue only)
January 2014 2019
100(60 of system usage)
219(3)
Tier 1100
Tier 2 101-400
SUEgt400
125(37)
Usage Level ( of Baseline)Usage Level ( of Baseline)
1 Completed in 20192 SCErsquos California Alternate Rates for Energy (CARE) program is an income-qualifying program that reduces energy bills for eligible customers by about 30
Winter Weekdays 8am-9pm Weekdays and Weekends 4-9pm
Off-Peak Summer Weekdays 11pm-8amWeekends All
Weekdays and Weekends All except 4-9pm
Winter Weekdays 9pm-8amWeekends All
Weekdays and Weekends 9pm-8am
Super Off-Peak Winter NA Weekdays and Weekends 8am-4pm
New Time-of-Use (TOU) Periods
bull On March 1 2019 SCE changed its basic TOU pricing period definition for the first time in over 30 years
bull Abundant mid-day renewable energy lowers prices from 8am-4pm (October - June)
bull Highest cost period is now 4pm-9pm all-days1
1 TOU pricing periods defined for non-residential customers per CPUC Decision D18-07-006 Similar residential TOU definitions were filed by SCE in A17-12-012
bull 998 solar projectsbull 320445 residential (71 of all residential customers) ndash 1756 MW bull 7333 non-residential ndash 977 MW bull Approximately 4775887 MWhyear generated
SCE Net Metering Statistics (919)
0
5
10
15
20
25
30
35
40
0
1000
2000
3000
4000
5000
6000
7000
2013 2014 2015 2016 2017 2018 2019
MW
Inst
alle
d
Num
ber o
f Sol
ar R
esid
entia
l Ins
talla
tions
Installations MW
July 1 2017bull Official start of NEM successor tariff customers are subject to
Mandatory TOU rate Non-bypassable charges Application fees
July 31 2017bull Residential customers who meet this deadline are grandfathered for
current TOU periods for maximum of 5 years (10 for non-residential)September 9 2017bull Smart Inverters required on all solar installationsJuly 25 2018bull Smart Inverters with Reactive Power Priority required on all solar
installationsNear Term Outlookbull Combination of a flatter tiered rate and the mandatory TOU NEM 20
rate structure has helped reduce the per customer cost shift further efforts to reduce the shift through new TOU pricing periods
bull Commission to revisit NEM Successor Tariff by July 2020 to evaluate the existing NEM tariffs and consider the development and adoption of successor tariffs
Key Dates
Third Quarter Earnings Summary
October 30 2019
Q32019
Q32018 Variance
Basic Earnings Per Share (EPS)1
SCE $ 145 $ 164 $ (019)
EIX Parent amp Other (009) (007) (002)
Basic EPS $ 136 $ 157 $ (021)
Less Non-core Items
SCE2 $ (014) $ 002 $ (016)
EIX Parent amp Other3 mdash (001) 001
Total Non-core $ (014) $ 001 $ (015)
Core Earnings Per Share (EPS)
SCE $ 159 $ 162 $ (003)
EIX Parent amp Other (009) (006) (003)
Core EPS $ 150 $ 156 $ (006)
Key SCE EPS Drivers4
Higher revenue5 $ 012- CPUC revenue (002)- 2018 FERC Formula Rate settlement 010- Other FERC revenue 004
Higher OampM (021)Lower depreciation 002Higher net financing costs (004)Income taxes5 019Property and other taxes (001)Results prior to impact from share dilution $ 007Impact from share dilution (010)Total core drivers $ (003)Non-core items 2 (016)Total $ (019)
Key EIX EPS Drivers4
EIX parent and other mdash Higher interest expense and corporate expenses $ (005)EEG mdash Lower corporate expenses 001Impact from share dilution 001Total core drivers $ (003)Non-core items 3 001Total $ (002)
1 See Earnings Non-GAAP reconciliations and Use of Non-GAAP Financial Measures in Appendix2 Includes SCEs contributions to Wildfire Insurance Fund in third quarter 2019 and impact from the approval of the Revised San Onofre Settlement Agreement in the third quarter 2018 3 Loss on sale of SoCore Energy4 2019 EPS drivers are reported at a consistent share count of 3258 million (2019 QTD weighted-average shares outstanding is 3471 million)5 Includes $020 of tax benefits refunded to customersNote Diluted earnings were $135 and $157 per share for the three months ended September 30 2019 and 2018 respectively
43
1 See Earnings Non-GAAP reconciliations and Use of Non-GAAP Financial Measures in Appendix2 Impact of 2018 GRC final decision related to impairment of utility property plant and equipment changes in allocation of deferred tax re-measurement between customers and
shareholders SCErsquos contributions to the Wildfire Insurance Fund gain from sale of nuclear fuel and impact from the approval of the Revised San Onofre Settlement Agreement3 Loss on sale of SoCore Energy and impact of hypothetical liquidation at book value (HLBV) accounting method4 2019 EPS drivers are reported at a consistent share count of 3258 million (2019 YTD weighted-average shares outstanding is 3330 million)5 Test Year 2018 GRC true-up of $020 includes revenue of $(034) OampM of $006 depreciation of $024 interest expense of $(001) property and other taxes of $001 and income taxes of
$0246 Includes $018 of tax benefits refunded to customersNote Diluted earnings were $342 and $308 per share for the nine months ended September 30 2019 and 2018 respectively
Year to Date Earnings Summary
October 30 2019
YTD 2019
YTD 2018 Variance
Basic Earnings Per Share (EPS)1
SCE $ 365 $ 343 $ 022
EIX Parent amp Other (022) (034) 012
Basic EPS $ 343 $ 309 $ 034
Less Non-core Items
SCE2 $ (030) $ 002 $ (032)
EIX Parent amp Other3 mdash (014) 014
Total Non-core $ (030) $ (012) $ (018)
Core Earnings Per Share (EPS)
SCE $ 395 $ 341 $ 054
EIX Parent amp Other (022) (020) (002)
Core EPS $ 373 $ 321 $ 052
Key SCE EPS Drivers4
Test Year 2018 GRC true-up5 $ 020Higher revenue6 055
- CPUC revenue 032- 2018 FERC Formula Rate settlement 010- FERC and other operating revenue 013
Higher OampM (026)Lower depreciation 005Higher net financing costs (012)Income taxes6 021Results prior to impact from share dilution $ 063Impact from share dilution (009)Total core drivers $ 054Non-core items2 (032)Total $ 022
Key EIX EPS Drivers4
EIX parent and other mdash Higher interest expense and corporate expenses $ (007)EEG mdash Lower corporate expenses and lower losses at the competitive business 004Impact from share dilution 001Total core drivers $ (002)Non-core items3 014Total $ 012
44
SCE Annual Results of Operationsbull Earning activities ndash revenue authorized by CPUC and FERC to provide reasonable cost recovery and return on investmentbull Cost-recovery activities ndash CPUC- and FERC-authorized balancing accounts to recover specific project or program costs subject
to reasonableness review or compliance with upfront standards
($ millions)
2018 2017
Earnings Activities
Cost-Recovery Activities
Total Consolidated
Earnings Activities
Cost-Recovery Activities
Total Consolidated
Operating revenue $6560 $6051 $12611 $6611 $5643 $12254Purchased power and fuel mdash 5406 5406 mdash 4873 4873Operation and maintenance 1972 730 2702 1898 824 2722Wildfire-related claims net of recoveries 2669 mdash 2669 ― ― ―Depreciation and amortization 1867 mdash 1867 2032 mdash 2032Property and other taxes 392 mdash 392 372 mdash 372Impairment and other charges (12) mdash (12) 716 mdash 716Other operating income (7) mdash (7) (8) mdash (8)Total operating expenses 6881 6136 13017 5010 5697 10707Operating (loss) income (321) (85) (406) 1601 (54) 1547Interest expense (671) (2) (673) (588) (1) (589)Other income and expenses 107 87 194 93 55 148(Loss) income before income taxes (885) mdash (885) 1106 mdash 1106Income tax (benefit) expense (696) mdash (696) (30) mdash (30)Net (loss) income (189) mdash (189) 1136 mdash 1136Preferred and preference stock dividend
requirements 121 mdash 121 124 mdash 124
Net (loss) income available for common stock ($310) mdash ($310) $1012 mdash $1012Less Non-core items (1750) (481)Core Earnings $1440 $1493
Note See Use of Non-GAAP Financial Measures
October 30 2019 45
Reconciliation of EIX Basic Earnings Per Share Guidance to EIX Core Earnings Per Share Guidance
EPS Attributable to Edison International 2019
Low Midpoint High
SCE $483
EIX Parent amp Other (032)
Basic EPS1 $441 $451 $461
Non-Core Items
SCE23 (029) (029) (029)
EIX Parent amp Other mdash mdash mdash
Total Non-Core1 (029) (029) (029)
Core EPS
SCE $512
EIX Parent amp Other (032)
Core EPS1 $470 $480 $490
1 EPS is calculated on the assumed weighted-average share count for 2019 Please see 2019 EIX Core Earnings Guidance slide for more information 2 Includes impact of 2018 GRC final decision related to impairment of utility property plant and equipment changes in allocation of deferred tax re-measurement between
customers and shareholders and SCErsquos contributions to the Wildfire Insurance Fund3 Includes $001 per share as a result of share count dilution
October 30 2019
Earnings Per Share Non-GAAP Reconciliations
46
Earnings Non-GAAP Reconciliations
1 Impact of 2018 GRC final decision related to impairment of utility property plant and equipment changes in allocation of deferred tax re-measurement between customers and shareholders SCErsquos contributions to the Wildfire Insurance Fund gain from sale of nuclear fuel and impact from the approval of the Revised San Onofre Settlement Agreement
2 Loss on sale of SoCore Energy and impact of hypothetical liquidation at book value (HLBV) accounting method
($ millions)
Reconciliation of EIX GAAP Earnings to EIX Core Earnings
Earnings Attributable to Edison International Q32019
Q32018
YTD 2019
YTD 2018
SCE $503 $536 $1215 $1119
EIX Parent amp Other (32) (23) (74) (112)
Basic Earnings $471 $513 $1141 $1007
Non-Core Items
SCE 1 ($48) 7 ($99) 7
EIX Parent amp Other 2 mdash (4) mdash (46)
Total Non-Core ($48) $3 ($99) ($39)
Core Earnings
SCE $551 $529 $1314 $1112
EIX Parent amp Other (32) (19) (74) (66)
Core Earnings $519 $510 $1240 $1046
October 30 2019 47
EIX Core EPS Non-GAAP ReconciliationsReconciliation of Edison International Basic Earnings Per Share to Edison International Core Earnings Per Share
Note See Use of Non-GAAP Financial Measures
Earnings Per Share Attributable to Edison International 2018 2017
Basic EPS ($130) $173
Non-Core Items
SCE
Wildfire-related claims net of recoveries (560) mdash
Settlement of 1994 ndash 2006 California tax audits 020 mdash
Write down impairment and other as a result of Revised San Onofre Settlement Agreement
003 (138)
Re-measurement of deferred taxes as a result of Tax Reform mdash (010)
Edison International Parent and Other
Settlement of 1994 ndash 2006 California tax audits (004) mdash
Re-measurement of deferred taxes as a result of Tax Reform mdash (133)
Sale of SoCore Energy and other (014) 004
Discontinued operations
Settlement of 1994 ndash 2006 California tax audits 010 mdash
Less Total Non-Core Items (545) (277)
Core EPS $415 $450
October 30 2019 48
Use of Non-GAAP Financial MeasuresEdison Internationals earnings are prepared in accordance with generally accepted accounting principles used in the United States Management uses core earnings internally for financial planning and for analysis of performance Core earnings are also used when communicating with investors and analysts regarding Edison Internationals earnings results to facilitate comparisons of the Companys performance from period to period Core earnings are a non-GAAP financial measure and may not be comparable to those of other companies Core earnings (or losses) are defined as earnings or losses attributable to Edison International shareholders less income or loss from discontinued operations and income or loss from significant discrete items that management does not consider representative of ongoing earnings such as exit activities including sale of certain assets and other activities that are no longer continuing asset impairments and certain tax regulatory or legal settlements or proceedings
A reconciliation of Non-GAAP information to GAAP information is included either on the slide where the information appears or on another slide referenced in this presentation
EIX Investor Relations Contact
Sam Ramraj Vice President (626) 302-2540 samramrajedisonintlcom
Allison Bahen Principal Manager (626) 302-5493 allisonbahenedisonintlcom
October 30 2019 49
Business Update
Slide Number 2
Table of Contents
EIX Strategy Should Produce Long-Term Value
SCE Highlights
Slide Number 6
SCE Historical Rate Base and Core Earnings
SCE Capital Expenditure Forecast
SCE Rate Base Forecast
Slide Number 10
Californiarsquos GHG Emissions Overview
SCErsquos Pathway 2045 Highlights
Slide Number 13
Slide Number 14
Slide Number 15
SCE Key Regulatory Proceedings
Slide Number 17
Slide Number 18
CPUC and FERC Cost of Capital Summary
CPUC Cost of Capital (2013-2019)
SCE Distribution System Investments
Slide Number 22
Slide Number 23
SCE Large Transmission Projects
SCE Operational Excellence
Responding to Industry Change
Slide Number 27
2019 EIX Core Earnings Guidance
EIX Annual Dividends Per Share
Appendix
EIXrsquos 2018 Sustainability Report Highlights
Slide Number 32
SCE Historical Capital Expenditures
Credit Ratings Summary
Distribution Power Grid of the Future
SCE Customer Demand Trends
SCE Bundled Revenue Requirement
Slide Number 38
SCE Rates and Bills Comparison
Slide Number 40
Slide Number 41
Slide Number 42
Slide Number 43
Slide Number 44
Slide Number 45
SCE Annual Results of Operations
Slide Number 47
Earnings Non-GAAP Reconciliations
EIX Core EPS Non-GAAP Reconciliations
Use of Non-GAAP Financial Measures
US Average
$134
SCE
$95
-291
Sheet2
27 Higher
Sheet3
Sheet1
Sheet1
$128
Sheet2
26 Lower
Sheet3
bull Assembly Bill 1171 permits cities and counties and Joint Powers Agencies (JPAs) to act as CCAs to purchase and sell electricity on behalf of the utility customers within their jurisdiction
bull An Order Instituting Rulemaking (OIR R17-06-026) was opened on June 29 2017 to review revise and consider alternatives to the ldquoPower Charge Indifference Adjustmentrdquo or PCIA The PCIA allocates a proportional share of above-market costs of SCErsquos
energy procurement portfolio to departing load customers to ensure remaining bundled service customers are indifferent
October 11 2018 Commission decision changes PCIA methodology and has substantially addressed the historical subsidy to departing load that materialized when renewables market prices declined over the past 4 yearso Decision also established a Phase 2 which is addressing utility
portfolio optimization PCIA ldquopre-paymentrdquo options for entities and individual departing load customers and implementation of the ldquotrue-uprdquo process for Resource Adequacy (RA) and Renewable Energy Credits (RECs) costs
o A Phase 2 final decision on the benchmark and true-up process was approved on October 10 2019 with the other Phase 2 activities to continue into 2020
bull On February 8 2018 the Commission approved Resolution E-4907 requiring CCAs to demonstrate compliance with annual Resource Adequacy (RA) requirements prior to commencing operations
bull Existing Direct Access and CCA load is expected to be ~35 of SCErsquos total load by the end of 2019
Investor-Owned Utility (IOU)
Community Choice Aggregator (CCA)
Community Choice Aggregator (CCA) Overview
Approximately 40 of SCErsquos bundled service load could be part of a CCA or Direct Access by the end of 2020
October 30 2019 39
bull CPUC Order Instituting Ratemaking R 12-06-013 comprehensively reviewed residential rate structure including a future transition to Time of Use (TOU) rates In March 2018 SCE began to migrate 400000 residential customers to TOU rate structures
Remaining eligible residential customers to be migrated beginning October 2020bull July 2015 CPUC Decision D 15-07-001 includes Transition to 2 tiered rate structure coupled with Super-User Electric (SUE) Surcharge1
ldquoSuper User Electric Surchargerdquo for usage 400 above baseline (~3 of all usage)
Minimum bills of approximately $10month (applied to delivery revenue only)
January 2014 2019
100(60 of system usage)
219(3)
Tier 1100
Tier 2 101-400
SUEgt400
125(37)
Usage Level ( of Baseline)Usage Level ( of Baseline)
1 Completed in 20192 SCErsquos California Alternate Rates for Energy (CARE) program is an income-qualifying program that reduces energy bills for eligible customers by about 30
Winter Weekdays 8am-9pm Weekdays and Weekends 4-9pm
Off-Peak Summer Weekdays 11pm-8amWeekends All
Weekdays and Weekends All except 4-9pm
Winter Weekdays 9pm-8amWeekends All
Weekdays and Weekends 9pm-8am
Super Off-Peak Winter NA Weekdays and Weekends 8am-4pm
New Time-of-Use (TOU) Periods
bull On March 1 2019 SCE changed its basic TOU pricing period definition for the first time in over 30 years
bull Abundant mid-day renewable energy lowers prices from 8am-4pm (October - June)
bull Highest cost period is now 4pm-9pm all-days1
1 TOU pricing periods defined for non-residential customers per CPUC Decision D18-07-006 Similar residential TOU definitions were filed by SCE in A17-12-012
bull 998 solar projectsbull 320445 residential (71 of all residential customers) ndash 1756 MW bull 7333 non-residential ndash 977 MW bull Approximately 4775887 MWhyear generated
SCE Net Metering Statistics (919)
0
5
10
15
20
25
30
35
40
0
1000
2000
3000
4000
5000
6000
7000
2013 2014 2015 2016 2017 2018 2019
MW
Inst
alle
d
Num
ber o
f Sol
ar R
esid
entia
l Ins
talla
tions
Installations MW
July 1 2017bull Official start of NEM successor tariff customers are subject to
Mandatory TOU rate Non-bypassable charges Application fees
July 31 2017bull Residential customers who meet this deadline are grandfathered for
current TOU periods for maximum of 5 years (10 for non-residential)September 9 2017bull Smart Inverters required on all solar installationsJuly 25 2018bull Smart Inverters with Reactive Power Priority required on all solar
installationsNear Term Outlookbull Combination of a flatter tiered rate and the mandatory TOU NEM 20
rate structure has helped reduce the per customer cost shift further efforts to reduce the shift through new TOU pricing periods
bull Commission to revisit NEM Successor Tariff by July 2020 to evaluate the existing NEM tariffs and consider the development and adoption of successor tariffs
Key Dates
Third Quarter Earnings Summary
October 30 2019
Q32019
Q32018 Variance
Basic Earnings Per Share (EPS)1
SCE $ 145 $ 164 $ (019)
EIX Parent amp Other (009) (007) (002)
Basic EPS $ 136 $ 157 $ (021)
Less Non-core Items
SCE2 $ (014) $ 002 $ (016)
EIX Parent amp Other3 mdash (001) 001
Total Non-core $ (014) $ 001 $ (015)
Core Earnings Per Share (EPS)
SCE $ 159 $ 162 $ (003)
EIX Parent amp Other (009) (006) (003)
Core EPS $ 150 $ 156 $ (006)
Key SCE EPS Drivers4
Higher revenue5 $ 012- CPUC revenue (002)- 2018 FERC Formula Rate settlement 010- Other FERC revenue 004
Higher OampM (021)Lower depreciation 002Higher net financing costs (004)Income taxes5 019Property and other taxes (001)Results prior to impact from share dilution $ 007Impact from share dilution (010)Total core drivers $ (003)Non-core items 2 (016)Total $ (019)
Key EIX EPS Drivers4
EIX parent and other mdash Higher interest expense and corporate expenses $ (005)EEG mdash Lower corporate expenses 001Impact from share dilution 001Total core drivers $ (003)Non-core items 3 001Total $ (002)
1 See Earnings Non-GAAP reconciliations and Use of Non-GAAP Financial Measures in Appendix2 Includes SCEs contributions to Wildfire Insurance Fund in third quarter 2019 and impact from the approval of the Revised San Onofre Settlement Agreement in the third quarter 2018 3 Loss on sale of SoCore Energy4 2019 EPS drivers are reported at a consistent share count of 3258 million (2019 QTD weighted-average shares outstanding is 3471 million)5 Includes $020 of tax benefits refunded to customersNote Diluted earnings were $135 and $157 per share for the three months ended September 30 2019 and 2018 respectively
43
1 See Earnings Non-GAAP reconciliations and Use of Non-GAAP Financial Measures in Appendix2 Impact of 2018 GRC final decision related to impairment of utility property plant and equipment changes in allocation of deferred tax re-measurement between customers and
shareholders SCErsquos contributions to the Wildfire Insurance Fund gain from sale of nuclear fuel and impact from the approval of the Revised San Onofre Settlement Agreement3 Loss on sale of SoCore Energy and impact of hypothetical liquidation at book value (HLBV) accounting method4 2019 EPS drivers are reported at a consistent share count of 3258 million (2019 YTD weighted-average shares outstanding is 3330 million)5 Test Year 2018 GRC true-up of $020 includes revenue of $(034) OampM of $006 depreciation of $024 interest expense of $(001) property and other taxes of $001 and income taxes of
$0246 Includes $018 of tax benefits refunded to customersNote Diluted earnings were $342 and $308 per share for the nine months ended September 30 2019 and 2018 respectively
Year to Date Earnings Summary
October 30 2019
YTD 2019
YTD 2018 Variance
Basic Earnings Per Share (EPS)1
SCE $ 365 $ 343 $ 022
EIX Parent amp Other (022) (034) 012
Basic EPS $ 343 $ 309 $ 034
Less Non-core Items
SCE2 $ (030) $ 002 $ (032)
EIX Parent amp Other3 mdash (014) 014
Total Non-core $ (030) $ (012) $ (018)
Core Earnings Per Share (EPS)
SCE $ 395 $ 341 $ 054
EIX Parent amp Other (022) (020) (002)
Core EPS $ 373 $ 321 $ 052
Key SCE EPS Drivers4
Test Year 2018 GRC true-up5 $ 020Higher revenue6 055
- CPUC revenue 032- 2018 FERC Formula Rate settlement 010- FERC and other operating revenue 013
Higher OampM (026)Lower depreciation 005Higher net financing costs (012)Income taxes6 021Results prior to impact from share dilution $ 063Impact from share dilution (009)Total core drivers $ 054Non-core items2 (032)Total $ 022
Key EIX EPS Drivers4
EIX parent and other mdash Higher interest expense and corporate expenses $ (007)EEG mdash Lower corporate expenses and lower losses at the competitive business 004Impact from share dilution 001Total core drivers $ (002)Non-core items3 014Total $ 012
44
SCE Annual Results of Operationsbull Earning activities ndash revenue authorized by CPUC and FERC to provide reasonable cost recovery and return on investmentbull Cost-recovery activities ndash CPUC- and FERC-authorized balancing accounts to recover specific project or program costs subject
to reasonableness review or compliance with upfront standards
($ millions)
2018 2017
Earnings Activities
Cost-Recovery Activities
Total Consolidated
Earnings Activities
Cost-Recovery Activities
Total Consolidated
Operating revenue $6560 $6051 $12611 $6611 $5643 $12254Purchased power and fuel mdash 5406 5406 mdash 4873 4873Operation and maintenance 1972 730 2702 1898 824 2722Wildfire-related claims net of recoveries 2669 mdash 2669 ― ― ―Depreciation and amortization 1867 mdash 1867 2032 mdash 2032Property and other taxes 392 mdash 392 372 mdash 372Impairment and other charges (12) mdash (12) 716 mdash 716Other operating income (7) mdash (7) (8) mdash (8)Total operating expenses 6881 6136 13017 5010 5697 10707Operating (loss) income (321) (85) (406) 1601 (54) 1547Interest expense (671) (2) (673) (588) (1) (589)Other income and expenses 107 87 194 93 55 148(Loss) income before income taxes (885) mdash (885) 1106 mdash 1106Income tax (benefit) expense (696) mdash (696) (30) mdash (30)Net (loss) income (189) mdash (189) 1136 mdash 1136Preferred and preference stock dividend
requirements 121 mdash 121 124 mdash 124
Net (loss) income available for common stock ($310) mdash ($310) $1012 mdash $1012Less Non-core items (1750) (481)Core Earnings $1440 $1493
Note See Use of Non-GAAP Financial Measures
October 30 2019 45
Reconciliation of EIX Basic Earnings Per Share Guidance to EIX Core Earnings Per Share Guidance
EPS Attributable to Edison International 2019
Low Midpoint High
SCE $483
EIX Parent amp Other (032)
Basic EPS1 $441 $451 $461
Non-Core Items
SCE23 (029) (029) (029)
EIX Parent amp Other mdash mdash mdash
Total Non-Core1 (029) (029) (029)
Core EPS
SCE $512
EIX Parent amp Other (032)
Core EPS1 $470 $480 $490
1 EPS is calculated on the assumed weighted-average share count for 2019 Please see 2019 EIX Core Earnings Guidance slide for more information 2 Includes impact of 2018 GRC final decision related to impairment of utility property plant and equipment changes in allocation of deferred tax re-measurement between
customers and shareholders and SCErsquos contributions to the Wildfire Insurance Fund3 Includes $001 per share as a result of share count dilution
October 30 2019
Earnings Per Share Non-GAAP Reconciliations
46
Earnings Non-GAAP Reconciliations
1 Impact of 2018 GRC final decision related to impairment of utility property plant and equipment changes in allocation of deferred tax re-measurement between customers and shareholders SCErsquos contributions to the Wildfire Insurance Fund gain from sale of nuclear fuel and impact from the approval of the Revised San Onofre Settlement Agreement
2 Loss on sale of SoCore Energy and impact of hypothetical liquidation at book value (HLBV) accounting method
($ millions)
Reconciliation of EIX GAAP Earnings to EIX Core Earnings
Earnings Attributable to Edison International Q32019
Q32018
YTD 2019
YTD 2018
SCE $503 $536 $1215 $1119
EIX Parent amp Other (32) (23) (74) (112)
Basic Earnings $471 $513 $1141 $1007
Non-Core Items
SCE 1 ($48) 7 ($99) 7
EIX Parent amp Other 2 mdash (4) mdash (46)
Total Non-Core ($48) $3 ($99) ($39)
Core Earnings
SCE $551 $529 $1314 $1112
EIX Parent amp Other (32) (19) (74) (66)
Core Earnings $519 $510 $1240 $1046
October 30 2019 47
EIX Core EPS Non-GAAP ReconciliationsReconciliation of Edison International Basic Earnings Per Share to Edison International Core Earnings Per Share
Note See Use of Non-GAAP Financial Measures
Earnings Per Share Attributable to Edison International 2018 2017
Basic EPS ($130) $173
Non-Core Items
SCE
Wildfire-related claims net of recoveries (560) mdash
Settlement of 1994 ndash 2006 California tax audits 020 mdash
Write down impairment and other as a result of Revised San Onofre Settlement Agreement
003 (138)
Re-measurement of deferred taxes as a result of Tax Reform mdash (010)
Edison International Parent and Other
Settlement of 1994 ndash 2006 California tax audits (004) mdash
Re-measurement of deferred taxes as a result of Tax Reform mdash (133)
Sale of SoCore Energy and other (014) 004
Discontinued operations
Settlement of 1994 ndash 2006 California tax audits 010 mdash
Less Total Non-Core Items (545) (277)
Core EPS $415 $450
October 30 2019 48
Use of Non-GAAP Financial MeasuresEdison Internationals earnings are prepared in accordance with generally accepted accounting principles used in the United States Management uses core earnings internally for financial planning and for analysis of performance Core earnings are also used when communicating with investors and analysts regarding Edison Internationals earnings results to facilitate comparisons of the Companys performance from period to period Core earnings are a non-GAAP financial measure and may not be comparable to those of other companies Core earnings (or losses) are defined as earnings or losses attributable to Edison International shareholders less income or loss from discontinued operations and income or loss from significant discrete items that management does not consider representative of ongoing earnings such as exit activities including sale of certain assets and other activities that are no longer continuing asset impairments and certain tax regulatory or legal settlements or proceedings
A reconciliation of Non-GAAP information to GAAP information is included either on the slide where the information appears or on another slide referenced in this presentation
EIX Investor Relations Contact
Sam Ramraj Vice President (626) 302-2540 samramrajedisonintlcom
Allison Bahen Principal Manager (626) 302-5493 allisonbahenedisonintlcom
October 30 2019 49
Business Update
Slide Number 2
Table of Contents
EIX Strategy Should Produce Long-Term Value
SCE Highlights
Slide Number 6
SCE Historical Rate Base and Core Earnings
SCE Capital Expenditure Forecast
SCE Rate Base Forecast
Slide Number 10
Californiarsquos GHG Emissions Overview
SCErsquos Pathway 2045 Highlights
Slide Number 13
Slide Number 14
Slide Number 15
SCE Key Regulatory Proceedings
Slide Number 17
Slide Number 18
CPUC and FERC Cost of Capital Summary
CPUC Cost of Capital (2013-2019)
SCE Distribution System Investments
Slide Number 22
Slide Number 23
SCE Large Transmission Projects
SCE Operational Excellence
Responding to Industry Change
Slide Number 27
2019 EIX Core Earnings Guidance
EIX Annual Dividends Per Share
Appendix
EIXrsquos 2018 Sustainability Report Highlights
Slide Number 32
SCE Historical Capital Expenditures
Credit Ratings Summary
Distribution Power Grid of the Future
SCE Customer Demand Trends
SCE Bundled Revenue Requirement
Slide Number 38
SCE Rates and Bills Comparison
Slide Number 40
Slide Number 41
Slide Number 42
Slide Number 43
Slide Number 44
Slide Number 45
SCE Annual Results of Operations
Slide Number 47
Earnings Non-GAAP Reconciliations
EIX Core EPS Non-GAAP Reconciliations
Use of Non-GAAP Financial Measures
US Average
$134
SCE
$95
-291
Sheet3
Sheet1
Sheet1
$128
Sheet2
26 Lower
Sheet3
bull Assembly Bill 1171 permits cities and counties and Joint Powers Agencies (JPAs) to act as CCAs to purchase and sell electricity on behalf of the utility customers within their jurisdiction
bull An Order Instituting Rulemaking (OIR R17-06-026) was opened on June 29 2017 to review revise and consider alternatives to the ldquoPower Charge Indifference Adjustmentrdquo or PCIA The PCIA allocates a proportional share of above-market costs of SCErsquos
energy procurement portfolio to departing load customers to ensure remaining bundled service customers are indifferent
October 11 2018 Commission decision changes PCIA methodology and has substantially addressed the historical subsidy to departing load that materialized when renewables market prices declined over the past 4 yearso Decision also established a Phase 2 which is addressing utility
portfolio optimization PCIA ldquopre-paymentrdquo options for entities and individual departing load customers and implementation of the ldquotrue-uprdquo process for Resource Adequacy (RA) and Renewable Energy Credits (RECs) costs
o A Phase 2 final decision on the benchmark and true-up process was approved on October 10 2019 with the other Phase 2 activities to continue into 2020
bull On February 8 2018 the Commission approved Resolution E-4907 requiring CCAs to demonstrate compliance with annual Resource Adequacy (RA) requirements prior to commencing operations
bull Existing Direct Access and CCA load is expected to be ~35 of SCErsquos total load by the end of 2019
Investor-Owned Utility (IOU)
Community Choice Aggregator (CCA)
Community Choice Aggregator (CCA) Overview
Approximately 40 of SCErsquos bundled service load could be part of a CCA or Direct Access by the end of 2020
October 30 2019 39
bull CPUC Order Instituting Ratemaking R 12-06-013 comprehensively reviewed residential rate structure including a future transition to Time of Use (TOU) rates In March 2018 SCE began to migrate 400000 residential customers to TOU rate structures
Remaining eligible residential customers to be migrated beginning October 2020bull July 2015 CPUC Decision D 15-07-001 includes Transition to 2 tiered rate structure coupled with Super-User Electric (SUE) Surcharge1
ldquoSuper User Electric Surchargerdquo for usage 400 above baseline (~3 of all usage)
Minimum bills of approximately $10month (applied to delivery revenue only)
January 2014 2019
100(60 of system usage)
219(3)
Tier 1100
Tier 2 101-400
SUEgt400
125(37)
Usage Level ( of Baseline)Usage Level ( of Baseline)
1 Completed in 20192 SCErsquos California Alternate Rates for Energy (CARE) program is an income-qualifying program that reduces energy bills for eligible customers by about 30
Winter Weekdays 8am-9pm Weekdays and Weekends 4-9pm
Off-Peak Summer Weekdays 11pm-8amWeekends All
Weekdays and Weekends All except 4-9pm
Winter Weekdays 9pm-8amWeekends All
Weekdays and Weekends 9pm-8am
Super Off-Peak Winter NA Weekdays and Weekends 8am-4pm
New Time-of-Use (TOU) Periods
bull On March 1 2019 SCE changed its basic TOU pricing period definition for the first time in over 30 years
bull Abundant mid-day renewable energy lowers prices from 8am-4pm (October - June)
bull Highest cost period is now 4pm-9pm all-days1
1 TOU pricing periods defined for non-residential customers per CPUC Decision D18-07-006 Similar residential TOU definitions were filed by SCE in A17-12-012
bull 998 solar projectsbull 320445 residential (71 of all residential customers) ndash 1756 MW bull 7333 non-residential ndash 977 MW bull Approximately 4775887 MWhyear generated
SCE Net Metering Statistics (919)
0
5
10
15
20
25
30
35
40
0
1000
2000
3000
4000
5000
6000
7000
2013 2014 2015 2016 2017 2018 2019
MW
Inst
alle
d
Num
ber o
f Sol
ar R
esid
entia
l Ins
talla
tions
Installations MW
July 1 2017bull Official start of NEM successor tariff customers are subject to
Mandatory TOU rate Non-bypassable charges Application fees
July 31 2017bull Residential customers who meet this deadline are grandfathered for
current TOU periods for maximum of 5 years (10 for non-residential)September 9 2017bull Smart Inverters required on all solar installationsJuly 25 2018bull Smart Inverters with Reactive Power Priority required on all solar
installationsNear Term Outlookbull Combination of a flatter tiered rate and the mandatory TOU NEM 20
rate structure has helped reduce the per customer cost shift further efforts to reduce the shift through new TOU pricing periods
bull Commission to revisit NEM Successor Tariff by July 2020 to evaluate the existing NEM tariffs and consider the development and adoption of successor tariffs
Key Dates
Third Quarter Earnings Summary
October 30 2019
Q32019
Q32018 Variance
Basic Earnings Per Share (EPS)1
SCE $ 145 $ 164 $ (019)
EIX Parent amp Other (009) (007) (002)
Basic EPS $ 136 $ 157 $ (021)
Less Non-core Items
SCE2 $ (014) $ 002 $ (016)
EIX Parent amp Other3 mdash (001) 001
Total Non-core $ (014) $ 001 $ (015)
Core Earnings Per Share (EPS)
SCE $ 159 $ 162 $ (003)
EIX Parent amp Other (009) (006) (003)
Core EPS $ 150 $ 156 $ (006)
Key SCE EPS Drivers4
Higher revenue5 $ 012- CPUC revenue (002)- 2018 FERC Formula Rate settlement 010- Other FERC revenue 004
Higher OampM (021)Lower depreciation 002Higher net financing costs (004)Income taxes5 019Property and other taxes (001)Results prior to impact from share dilution $ 007Impact from share dilution (010)Total core drivers $ (003)Non-core items 2 (016)Total $ (019)
Key EIX EPS Drivers4
EIX parent and other mdash Higher interest expense and corporate expenses $ (005)EEG mdash Lower corporate expenses 001Impact from share dilution 001Total core drivers $ (003)Non-core items 3 001Total $ (002)
1 See Earnings Non-GAAP reconciliations and Use of Non-GAAP Financial Measures in Appendix2 Includes SCEs contributions to Wildfire Insurance Fund in third quarter 2019 and impact from the approval of the Revised San Onofre Settlement Agreement in the third quarter 2018 3 Loss on sale of SoCore Energy4 2019 EPS drivers are reported at a consistent share count of 3258 million (2019 QTD weighted-average shares outstanding is 3471 million)5 Includes $020 of tax benefits refunded to customersNote Diluted earnings were $135 and $157 per share for the three months ended September 30 2019 and 2018 respectively
43
1 See Earnings Non-GAAP reconciliations and Use of Non-GAAP Financial Measures in Appendix2 Impact of 2018 GRC final decision related to impairment of utility property plant and equipment changes in allocation of deferred tax re-measurement between customers and
shareholders SCErsquos contributions to the Wildfire Insurance Fund gain from sale of nuclear fuel and impact from the approval of the Revised San Onofre Settlement Agreement3 Loss on sale of SoCore Energy and impact of hypothetical liquidation at book value (HLBV) accounting method4 2019 EPS drivers are reported at a consistent share count of 3258 million (2019 YTD weighted-average shares outstanding is 3330 million)5 Test Year 2018 GRC true-up of $020 includes revenue of $(034) OampM of $006 depreciation of $024 interest expense of $(001) property and other taxes of $001 and income taxes of
$0246 Includes $018 of tax benefits refunded to customersNote Diluted earnings were $342 and $308 per share for the nine months ended September 30 2019 and 2018 respectively
Year to Date Earnings Summary
October 30 2019
YTD 2019
YTD 2018 Variance
Basic Earnings Per Share (EPS)1
SCE $ 365 $ 343 $ 022
EIX Parent amp Other (022) (034) 012
Basic EPS $ 343 $ 309 $ 034
Less Non-core Items
SCE2 $ (030) $ 002 $ (032)
EIX Parent amp Other3 mdash (014) 014
Total Non-core $ (030) $ (012) $ (018)
Core Earnings Per Share (EPS)
SCE $ 395 $ 341 $ 054
EIX Parent amp Other (022) (020) (002)
Core EPS $ 373 $ 321 $ 052
Key SCE EPS Drivers4
Test Year 2018 GRC true-up5 $ 020Higher revenue6 055
- CPUC revenue 032- 2018 FERC Formula Rate settlement 010- FERC and other operating revenue 013
Higher OampM (026)Lower depreciation 005Higher net financing costs (012)Income taxes6 021Results prior to impact from share dilution $ 063Impact from share dilution (009)Total core drivers $ 054Non-core items2 (032)Total $ 022
Key EIX EPS Drivers4
EIX parent and other mdash Higher interest expense and corporate expenses $ (007)EEG mdash Lower corporate expenses and lower losses at the competitive business 004Impact from share dilution 001Total core drivers $ (002)Non-core items3 014Total $ 012
44
SCE Annual Results of Operationsbull Earning activities ndash revenue authorized by CPUC and FERC to provide reasonable cost recovery and return on investmentbull Cost-recovery activities ndash CPUC- and FERC-authorized balancing accounts to recover specific project or program costs subject
to reasonableness review or compliance with upfront standards
($ millions)
2018 2017
Earnings Activities
Cost-Recovery Activities
Total Consolidated
Earnings Activities
Cost-Recovery Activities
Total Consolidated
Operating revenue $6560 $6051 $12611 $6611 $5643 $12254Purchased power and fuel mdash 5406 5406 mdash 4873 4873Operation and maintenance 1972 730 2702 1898 824 2722Wildfire-related claims net of recoveries 2669 mdash 2669 ― ― ―Depreciation and amortization 1867 mdash 1867 2032 mdash 2032Property and other taxes 392 mdash 392 372 mdash 372Impairment and other charges (12) mdash (12) 716 mdash 716Other operating income (7) mdash (7) (8) mdash (8)Total operating expenses 6881 6136 13017 5010 5697 10707Operating (loss) income (321) (85) (406) 1601 (54) 1547Interest expense (671) (2) (673) (588) (1) (589)Other income and expenses 107 87 194 93 55 148(Loss) income before income taxes (885) mdash (885) 1106 mdash 1106Income tax (benefit) expense (696) mdash (696) (30) mdash (30)Net (loss) income (189) mdash (189) 1136 mdash 1136Preferred and preference stock dividend
requirements 121 mdash 121 124 mdash 124
Net (loss) income available for common stock ($310) mdash ($310) $1012 mdash $1012Less Non-core items (1750) (481)Core Earnings $1440 $1493
Note See Use of Non-GAAP Financial Measures
October 30 2019 45
Reconciliation of EIX Basic Earnings Per Share Guidance to EIX Core Earnings Per Share Guidance
EPS Attributable to Edison International 2019
Low Midpoint High
SCE $483
EIX Parent amp Other (032)
Basic EPS1 $441 $451 $461
Non-Core Items
SCE23 (029) (029) (029)
EIX Parent amp Other mdash mdash mdash
Total Non-Core1 (029) (029) (029)
Core EPS
SCE $512
EIX Parent amp Other (032)
Core EPS1 $470 $480 $490
1 EPS is calculated on the assumed weighted-average share count for 2019 Please see 2019 EIX Core Earnings Guidance slide for more information 2 Includes impact of 2018 GRC final decision related to impairment of utility property plant and equipment changes in allocation of deferred tax re-measurement between
customers and shareholders and SCErsquos contributions to the Wildfire Insurance Fund3 Includes $001 per share as a result of share count dilution
October 30 2019
Earnings Per Share Non-GAAP Reconciliations
46
Earnings Non-GAAP Reconciliations
1 Impact of 2018 GRC final decision related to impairment of utility property plant and equipment changes in allocation of deferred tax re-measurement between customers and shareholders SCErsquos contributions to the Wildfire Insurance Fund gain from sale of nuclear fuel and impact from the approval of the Revised San Onofre Settlement Agreement
2 Loss on sale of SoCore Energy and impact of hypothetical liquidation at book value (HLBV) accounting method
($ millions)
Reconciliation of EIX GAAP Earnings to EIX Core Earnings
Earnings Attributable to Edison International Q32019
Q32018
YTD 2019
YTD 2018
SCE $503 $536 $1215 $1119
EIX Parent amp Other (32) (23) (74) (112)
Basic Earnings $471 $513 $1141 $1007
Non-Core Items
SCE 1 ($48) 7 ($99) 7
EIX Parent amp Other 2 mdash (4) mdash (46)
Total Non-Core ($48) $3 ($99) ($39)
Core Earnings
SCE $551 $529 $1314 $1112
EIX Parent amp Other (32) (19) (74) (66)
Core Earnings $519 $510 $1240 $1046
October 30 2019 47
EIX Core EPS Non-GAAP ReconciliationsReconciliation of Edison International Basic Earnings Per Share to Edison International Core Earnings Per Share
Note See Use of Non-GAAP Financial Measures
Earnings Per Share Attributable to Edison International 2018 2017
Basic EPS ($130) $173
Non-Core Items
SCE
Wildfire-related claims net of recoveries (560) mdash
Settlement of 1994 ndash 2006 California tax audits 020 mdash
Write down impairment and other as a result of Revised San Onofre Settlement Agreement
003 (138)
Re-measurement of deferred taxes as a result of Tax Reform mdash (010)
Edison International Parent and Other
Settlement of 1994 ndash 2006 California tax audits (004) mdash
Re-measurement of deferred taxes as a result of Tax Reform mdash (133)
Sale of SoCore Energy and other (014) 004
Discontinued operations
Settlement of 1994 ndash 2006 California tax audits 010 mdash
Less Total Non-Core Items (545) (277)
Core EPS $415 $450
October 30 2019 48
Use of Non-GAAP Financial MeasuresEdison Internationals earnings are prepared in accordance with generally accepted accounting principles used in the United States Management uses core earnings internally for financial planning and for analysis of performance Core earnings are also used when communicating with investors and analysts regarding Edison Internationals earnings results to facilitate comparisons of the Companys performance from period to period Core earnings are a non-GAAP financial measure and may not be comparable to those of other companies Core earnings (or losses) are defined as earnings or losses attributable to Edison International shareholders less income or loss from discontinued operations and income or loss from significant discrete items that management does not consider representative of ongoing earnings such as exit activities including sale of certain assets and other activities that are no longer continuing asset impairments and certain tax regulatory or legal settlements or proceedings
A reconciliation of Non-GAAP information to GAAP information is included either on the slide where the information appears or on another slide referenced in this presentation
EIX Investor Relations Contact
Sam Ramraj Vice President (626) 302-2540 samramrajedisonintlcom
Allison Bahen Principal Manager (626) 302-5493 allisonbahenedisonintlcom
October 30 2019 49
Business Update
Slide Number 2
Table of Contents
EIX Strategy Should Produce Long-Term Value
SCE Highlights
Slide Number 6
SCE Historical Rate Base and Core Earnings
SCE Capital Expenditure Forecast
SCE Rate Base Forecast
Slide Number 10
Californiarsquos GHG Emissions Overview
SCErsquos Pathway 2045 Highlights
Slide Number 13
Slide Number 14
Slide Number 15
SCE Key Regulatory Proceedings
Slide Number 17
Slide Number 18
CPUC and FERC Cost of Capital Summary
CPUC Cost of Capital (2013-2019)
SCE Distribution System Investments
Slide Number 22
Slide Number 23
SCE Large Transmission Projects
SCE Operational Excellence
Responding to Industry Change
Slide Number 27
2019 EIX Core Earnings Guidance
EIX Annual Dividends Per Share
Appendix
EIXrsquos 2018 Sustainability Report Highlights
Slide Number 32
SCE Historical Capital Expenditures
Credit Ratings Summary
Distribution Power Grid of the Future
SCE Customer Demand Trends
SCE Bundled Revenue Requirement
Slide Number 38
SCE Rates and Bills Comparison
Slide Number 40
Slide Number 41
Slide Number 42
Slide Number 43
Slide Number 44
Slide Number 45
SCE Annual Results of Operations
Slide Number 47
Earnings Non-GAAP Reconciliations
EIX Core EPS Non-GAAP Reconciliations
Use of Non-GAAP Financial Measures
US Average
$134
SCE
$95
-291
Sheet1
Sheet1
$128
Sheet2
26 Lower
Sheet3
bull Assembly Bill 1171 permits cities and counties and Joint Powers Agencies (JPAs) to act as CCAs to purchase and sell electricity on behalf of the utility customers within their jurisdiction
bull An Order Instituting Rulemaking (OIR R17-06-026) was opened on June 29 2017 to review revise and consider alternatives to the ldquoPower Charge Indifference Adjustmentrdquo or PCIA The PCIA allocates a proportional share of above-market costs of SCErsquos
energy procurement portfolio to departing load customers to ensure remaining bundled service customers are indifferent
October 11 2018 Commission decision changes PCIA methodology and has substantially addressed the historical subsidy to departing load that materialized when renewables market prices declined over the past 4 yearso Decision also established a Phase 2 which is addressing utility
portfolio optimization PCIA ldquopre-paymentrdquo options for entities and individual departing load customers and implementation of the ldquotrue-uprdquo process for Resource Adequacy (RA) and Renewable Energy Credits (RECs) costs
o A Phase 2 final decision on the benchmark and true-up process was approved on October 10 2019 with the other Phase 2 activities to continue into 2020
bull On February 8 2018 the Commission approved Resolution E-4907 requiring CCAs to demonstrate compliance with annual Resource Adequacy (RA) requirements prior to commencing operations
bull Existing Direct Access and CCA load is expected to be ~35 of SCErsquos total load by the end of 2019
Investor-Owned Utility (IOU)
Community Choice Aggregator (CCA)
Community Choice Aggregator (CCA) Overview
Approximately 40 of SCErsquos bundled service load could be part of a CCA or Direct Access by the end of 2020
October 30 2019 39
bull CPUC Order Instituting Ratemaking R 12-06-013 comprehensively reviewed residential rate structure including a future transition to Time of Use (TOU) rates In March 2018 SCE began to migrate 400000 residential customers to TOU rate structures
Remaining eligible residential customers to be migrated beginning October 2020bull July 2015 CPUC Decision D 15-07-001 includes Transition to 2 tiered rate structure coupled with Super-User Electric (SUE) Surcharge1
ldquoSuper User Electric Surchargerdquo for usage 400 above baseline (~3 of all usage)
Minimum bills of approximately $10month (applied to delivery revenue only)
January 2014 2019
100(60 of system usage)
219(3)
Tier 1100
Tier 2 101-400
SUEgt400
125(37)
Usage Level ( of Baseline)Usage Level ( of Baseline)
1 Completed in 20192 SCErsquos California Alternate Rates for Energy (CARE) program is an income-qualifying program that reduces energy bills for eligible customers by about 30
Winter Weekdays 8am-9pm Weekdays and Weekends 4-9pm
Off-Peak Summer Weekdays 11pm-8amWeekends All
Weekdays and Weekends All except 4-9pm
Winter Weekdays 9pm-8amWeekends All
Weekdays and Weekends 9pm-8am
Super Off-Peak Winter NA Weekdays and Weekends 8am-4pm
New Time-of-Use (TOU) Periods
bull On March 1 2019 SCE changed its basic TOU pricing period definition for the first time in over 30 years
bull Abundant mid-day renewable energy lowers prices from 8am-4pm (October - June)
bull Highest cost period is now 4pm-9pm all-days1
1 TOU pricing periods defined for non-residential customers per CPUC Decision D18-07-006 Similar residential TOU definitions were filed by SCE in A17-12-012
bull 998 solar projectsbull 320445 residential (71 of all residential customers) ndash 1756 MW bull 7333 non-residential ndash 977 MW bull Approximately 4775887 MWhyear generated
SCE Net Metering Statistics (919)
0
5
10
15
20
25
30
35
40
0
1000
2000
3000
4000
5000
6000
7000
2013 2014 2015 2016 2017 2018 2019
MW
Inst
alle
d
Num
ber o
f Sol
ar R
esid
entia
l Ins
talla
tions
Installations MW
July 1 2017bull Official start of NEM successor tariff customers are subject to
Mandatory TOU rate Non-bypassable charges Application fees
July 31 2017bull Residential customers who meet this deadline are grandfathered for
current TOU periods for maximum of 5 years (10 for non-residential)September 9 2017bull Smart Inverters required on all solar installationsJuly 25 2018bull Smart Inverters with Reactive Power Priority required on all solar
installationsNear Term Outlookbull Combination of a flatter tiered rate and the mandatory TOU NEM 20
rate structure has helped reduce the per customer cost shift further efforts to reduce the shift through new TOU pricing periods
bull Commission to revisit NEM Successor Tariff by July 2020 to evaluate the existing NEM tariffs and consider the development and adoption of successor tariffs
Key Dates
Third Quarter Earnings Summary
October 30 2019
Q32019
Q32018 Variance
Basic Earnings Per Share (EPS)1
SCE $ 145 $ 164 $ (019)
EIX Parent amp Other (009) (007) (002)
Basic EPS $ 136 $ 157 $ (021)
Less Non-core Items
SCE2 $ (014) $ 002 $ (016)
EIX Parent amp Other3 mdash (001) 001
Total Non-core $ (014) $ 001 $ (015)
Core Earnings Per Share (EPS)
SCE $ 159 $ 162 $ (003)
EIX Parent amp Other (009) (006) (003)
Core EPS $ 150 $ 156 $ (006)
Key SCE EPS Drivers4
Higher revenue5 $ 012- CPUC revenue (002)- 2018 FERC Formula Rate settlement 010- Other FERC revenue 004
Higher OampM (021)Lower depreciation 002Higher net financing costs (004)Income taxes5 019Property and other taxes (001)Results prior to impact from share dilution $ 007Impact from share dilution (010)Total core drivers $ (003)Non-core items 2 (016)Total $ (019)
Key EIX EPS Drivers4
EIX parent and other mdash Higher interest expense and corporate expenses $ (005)EEG mdash Lower corporate expenses 001Impact from share dilution 001Total core drivers $ (003)Non-core items 3 001Total $ (002)
1 See Earnings Non-GAAP reconciliations and Use of Non-GAAP Financial Measures in Appendix2 Includes SCEs contributions to Wildfire Insurance Fund in third quarter 2019 and impact from the approval of the Revised San Onofre Settlement Agreement in the third quarter 2018 3 Loss on sale of SoCore Energy4 2019 EPS drivers are reported at a consistent share count of 3258 million (2019 QTD weighted-average shares outstanding is 3471 million)5 Includes $020 of tax benefits refunded to customersNote Diluted earnings were $135 and $157 per share for the three months ended September 30 2019 and 2018 respectively
43
1 See Earnings Non-GAAP reconciliations and Use of Non-GAAP Financial Measures in Appendix2 Impact of 2018 GRC final decision related to impairment of utility property plant and equipment changes in allocation of deferred tax re-measurement between customers and
shareholders SCErsquos contributions to the Wildfire Insurance Fund gain from sale of nuclear fuel and impact from the approval of the Revised San Onofre Settlement Agreement3 Loss on sale of SoCore Energy and impact of hypothetical liquidation at book value (HLBV) accounting method4 2019 EPS drivers are reported at a consistent share count of 3258 million (2019 YTD weighted-average shares outstanding is 3330 million)5 Test Year 2018 GRC true-up of $020 includes revenue of $(034) OampM of $006 depreciation of $024 interest expense of $(001) property and other taxes of $001 and income taxes of
$0246 Includes $018 of tax benefits refunded to customersNote Diluted earnings were $342 and $308 per share for the nine months ended September 30 2019 and 2018 respectively
Year to Date Earnings Summary
October 30 2019
YTD 2019
YTD 2018 Variance
Basic Earnings Per Share (EPS)1
SCE $ 365 $ 343 $ 022
EIX Parent amp Other (022) (034) 012
Basic EPS $ 343 $ 309 $ 034
Less Non-core Items
SCE2 $ (030) $ 002 $ (032)
EIX Parent amp Other3 mdash (014) 014
Total Non-core $ (030) $ (012) $ (018)
Core Earnings Per Share (EPS)
SCE $ 395 $ 341 $ 054
EIX Parent amp Other (022) (020) (002)
Core EPS $ 373 $ 321 $ 052
Key SCE EPS Drivers4
Test Year 2018 GRC true-up5 $ 020Higher revenue6 055
- CPUC revenue 032- 2018 FERC Formula Rate settlement 010- FERC and other operating revenue 013
Higher OampM (026)Lower depreciation 005Higher net financing costs (012)Income taxes6 021Results prior to impact from share dilution $ 063Impact from share dilution (009)Total core drivers $ 054Non-core items2 (032)Total $ 022
Key EIX EPS Drivers4
EIX parent and other mdash Higher interest expense and corporate expenses $ (007)EEG mdash Lower corporate expenses and lower losses at the competitive business 004Impact from share dilution 001Total core drivers $ (002)Non-core items3 014Total $ 012
44
SCE Annual Results of Operationsbull Earning activities ndash revenue authorized by CPUC and FERC to provide reasonable cost recovery and return on investmentbull Cost-recovery activities ndash CPUC- and FERC-authorized balancing accounts to recover specific project or program costs subject
to reasonableness review or compliance with upfront standards
($ millions)
2018 2017
Earnings Activities
Cost-Recovery Activities
Total Consolidated
Earnings Activities
Cost-Recovery Activities
Total Consolidated
Operating revenue $6560 $6051 $12611 $6611 $5643 $12254Purchased power and fuel mdash 5406 5406 mdash 4873 4873Operation and maintenance 1972 730 2702 1898 824 2722Wildfire-related claims net of recoveries 2669 mdash 2669 ― ― ―Depreciation and amortization 1867 mdash 1867 2032 mdash 2032Property and other taxes 392 mdash 392 372 mdash 372Impairment and other charges (12) mdash (12) 716 mdash 716Other operating income (7) mdash (7) (8) mdash (8)Total operating expenses 6881 6136 13017 5010 5697 10707Operating (loss) income (321) (85) (406) 1601 (54) 1547Interest expense (671) (2) (673) (588) (1) (589)Other income and expenses 107 87 194 93 55 148(Loss) income before income taxes (885) mdash (885) 1106 mdash 1106Income tax (benefit) expense (696) mdash (696) (30) mdash (30)Net (loss) income (189) mdash (189) 1136 mdash 1136Preferred and preference stock dividend
requirements 121 mdash 121 124 mdash 124
Net (loss) income available for common stock ($310) mdash ($310) $1012 mdash $1012Less Non-core items (1750) (481)Core Earnings $1440 $1493
Note See Use of Non-GAAP Financial Measures
October 30 2019 45
Reconciliation of EIX Basic Earnings Per Share Guidance to EIX Core Earnings Per Share Guidance
EPS Attributable to Edison International 2019
Low Midpoint High
SCE $483
EIX Parent amp Other (032)
Basic EPS1 $441 $451 $461
Non-Core Items
SCE23 (029) (029) (029)
EIX Parent amp Other mdash mdash mdash
Total Non-Core1 (029) (029) (029)
Core EPS
SCE $512
EIX Parent amp Other (032)
Core EPS1 $470 $480 $490
1 EPS is calculated on the assumed weighted-average share count for 2019 Please see 2019 EIX Core Earnings Guidance slide for more information 2 Includes impact of 2018 GRC final decision related to impairment of utility property plant and equipment changes in allocation of deferred tax re-measurement between
customers and shareholders and SCErsquos contributions to the Wildfire Insurance Fund3 Includes $001 per share as a result of share count dilution
October 30 2019
Earnings Per Share Non-GAAP Reconciliations
46
Earnings Non-GAAP Reconciliations
1 Impact of 2018 GRC final decision related to impairment of utility property plant and equipment changes in allocation of deferred tax re-measurement between customers and shareholders SCErsquos contributions to the Wildfire Insurance Fund gain from sale of nuclear fuel and impact from the approval of the Revised San Onofre Settlement Agreement
2 Loss on sale of SoCore Energy and impact of hypothetical liquidation at book value (HLBV) accounting method
($ millions)
Reconciliation of EIX GAAP Earnings to EIX Core Earnings
Earnings Attributable to Edison International Q32019
Q32018
YTD 2019
YTD 2018
SCE $503 $536 $1215 $1119
EIX Parent amp Other (32) (23) (74) (112)
Basic Earnings $471 $513 $1141 $1007
Non-Core Items
SCE 1 ($48) 7 ($99) 7
EIX Parent amp Other 2 mdash (4) mdash (46)
Total Non-Core ($48) $3 ($99) ($39)
Core Earnings
SCE $551 $529 $1314 $1112
EIX Parent amp Other (32) (19) (74) (66)
Core Earnings $519 $510 $1240 $1046
October 30 2019 47
EIX Core EPS Non-GAAP ReconciliationsReconciliation of Edison International Basic Earnings Per Share to Edison International Core Earnings Per Share
Note See Use of Non-GAAP Financial Measures
Earnings Per Share Attributable to Edison International 2018 2017
Basic EPS ($130) $173
Non-Core Items
SCE
Wildfire-related claims net of recoveries (560) mdash
Settlement of 1994 ndash 2006 California tax audits 020 mdash
Write down impairment and other as a result of Revised San Onofre Settlement Agreement
003 (138)
Re-measurement of deferred taxes as a result of Tax Reform mdash (010)
Edison International Parent and Other
Settlement of 1994 ndash 2006 California tax audits (004) mdash
Re-measurement of deferred taxes as a result of Tax Reform mdash (133)
Sale of SoCore Energy and other (014) 004
Discontinued operations
Settlement of 1994 ndash 2006 California tax audits 010 mdash
Less Total Non-Core Items (545) (277)
Core EPS $415 $450
October 30 2019 48
Use of Non-GAAP Financial MeasuresEdison Internationals earnings are prepared in accordance with generally accepted accounting principles used in the United States Management uses core earnings internally for financial planning and for analysis of performance Core earnings are also used when communicating with investors and analysts regarding Edison Internationals earnings results to facilitate comparisons of the Companys performance from period to period Core earnings are a non-GAAP financial measure and may not be comparable to those of other companies Core earnings (or losses) are defined as earnings or losses attributable to Edison International shareholders less income or loss from discontinued operations and income or loss from significant discrete items that management does not consider representative of ongoing earnings such as exit activities including sale of certain assets and other activities that are no longer continuing asset impairments and certain tax regulatory or legal settlements or proceedings
A reconciliation of Non-GAAP information to GAAP information is included either on the slide where the information appears or on another slide referenced in this presentation
EIX Investor Relations Contact
Sam Ramraj Vice President (626) 302-2540 samramrajedisonintlcom
Allison Bahen Principal Manager (626) 302-5493 allisonbahenedisonintlcom
October 30 2019 49
Business Update
Slide Number 2
Table of Contents
EIX Strategy Should Produce Long-Term Value
SCE Highlights
Slide Number 6
SCE Historical Rate Base and Core Earnings
SCE Capital Expenditure Forecast
SCE Rate Base Forecast
Slide Number 10
Californiarsquos GHG Emissions Overview
SCErsquos Pathway 2045 Highlights
Slide Number 13
Slide Number 14
Slide Number 15
SCE Key Regulatory Proceedings
Slide Number 17
Slide Number 18
CPUC and FERC Cost of Capital Summary
CPUC Cost of Capital (2013-2019)
SCE Distribution System Investments
Slide Number 22
Slide Number 23
SCE Large Transmission Projects
SCE Operational Excellence
Responding to Industry Change
Slide Number 27
2019 EIX Core Earnings Guidance
EIX Annual Dividends Per Share
Appendix
EIXrsquos 2018 Sustainability Report Highlights
Slide Number 32
SCE Historical Capital Expenditures
Credit Ratings Summary
Distribution Power Grid of the Future
SCE Customer Demand Trends
SCE Bundled Revenue Requirement
Slide Number 38
SCE Rates and Bills Comparison
Slide Number 40
Slide Number 41
Slide Number 42
Slide Number 43
Slide Number 44
Slide Number 45
SCE Annual Results of Operations
Slide Number 47
Earnings Non-GAAP Reconciliations
EIX Core EPS Non-GAAP Reconciliations
Use of Non-GAAP Financial Measures
US Average
$134
SCE
$95
-291
Sheet1
$128
Sheet2
26 Lower
Sheet3
bull Assembly Bill 1171 permits cities and counties and Joint Powers Agencies (JPAs) to act as CCAs to purchase and sell electricity on behalf of the utility customers within their jurisdiction
bull An Order Instituting Rulemaking (OIR R17-06-026) was opened on June 29 2017 to review revise and consider alternatives to the ldquoPower Charge Indifference Adjustmentrdquo or PCIA The PCIA allocates a proportional share of above-market costs of SCErsquos
energy procurement portfolio to departing load customers to ensure remaining bundled service customers are indifferent
October 11 2018 Commission decision changes PCIA methodology and has substantially addressed the historical subsidy to departing load that materialized when renewables market prices declined over the past 4 yearso Decision also established a Phase 2 which is addressing utility
portfolio optimization PCIA ldquopre-paymentrdquo options for entities and individual departing load customers and implementation of the ldquotrue-uprdquo process for Resource Adequacy (RA) and Renewable Energy Credits (RECs) costs
o A Phase 2 final decision on the benchmark and true-up process was approved on October 10 2019 with the other Phase 2 activities to continue into 2020
bull On February 8 2018 the Commission approved Resolution E-4907 requiring CCAs to demonstrate compliance with annual Resource Adequacy (RA) requirements prior to commencing operations
bull Existing Direct Access and CCA load is expected to be ~35 of SCErsquos total load by the end of 2019
Investor-Owned Utility (IOU)
Community Choice Aggregator (CCA)
Community Choice Aggregator (CCA) Overview
Approximately 40 of SCErsquos bundled service load could be part of a CCA or Direct Access by the end of 2020
October 30 2019 39
bull CPUC Order Instituting Ratemaking R 12-06-013 comprehensively reviewed residential rate structure including a future transition to Time of Use (TOU) rates In March 2018 SCE began to migrate 400000 residential customers to TOU rate structures
Remaining eligible residential customers to be migrated beginning October 2020bull July 2015 CPUC Decision D 15-07-001 includes Transition to 2 tiered rate structure coupled with Super-User Electric (SUE) Surcharge1
ldquoSuper User Electric Surchargerdquo for usage 400 above baseline (~3 of all usage)
Minimum bills of approximately $10month (applied to delivery revenue only)
January 2014 2019
100(60 of system usage)
219(3)
Tier 1100
Tier 2 101-400
SUEgt400
125(37)
Usage Level ( of Baseline)Usage Level ( of Baseline)
1 Completed in 20192 SCErsquos California Alternate Rates for Energy (CARE) program is an income-qualifying program that reduces energy bills for eligible customers by about 30
Winter Weekdays 8am-9pm Weekdays and Weekends 4-9pm
Off-Peak Summer Weekdays 11pm-8amWeekends All
Weekdays and Weekends All except 4-9pm
Winter Weekdays 9pm-8amWeekends All
Weekdays and Weekends 9pm-8am
Super Off-Peak Winter NA Weekdays and Weekends 8am-4pm
New Time-of-Use (TOU) Periods
bull On March 1 2019 SCE changed its basic TOU pricing period definition for the first time in over 30 years
bull Abundant mid-day renewable energy lowers prices from 8am-4pm (October - June)
bull Highest cost period is now 4pm-9pm all-days1
1 TOU pricing periods defined for non-residential customers per CPUC Decision D18-07-006 Similar residential TOU definitions were filed by SCE in A17-12-012
bull 998 solar projectsbull 320445 residential (71 of all residential customers) ndash 1756 MW bull 7333 non-residential ndash 977 MW bull Approximately 4775887 MWhyear generated
SCE Net Metering Statistics (919)
0
5
10
15
20
25
30
35
40
0
1000
2000
3000
4000
5000
6000
7000
2013 2014 2015 2016 2017 2018 2019
MW
Inst
alle
d
Num
ber o
f Sol
ar R
esid
entia
l Ins
talla
tions
Installations MW
July 1 2017bull Official start of NEM successor tariff customers are subject to
Mandatory TOU rate Non-bypassable charges Application fees
July 31 2017bull Residential customers who meet this deadline are grandfathered for
current TOU periods for maximum of 5 years (10 for non-residential)September 9 2017bull Smart Inverters required on all solar installationsJuly 25 2018bull Smart Inverters with Reactive Power Priority required on all solar
installationsNear Term Outlookbull Combination of a flatter tiered rate and the mandatory TOU NEM 20
rate structure has helped reduce the per customer cost shift further efforts to reduce the shift through new TOU pricing periods
bull Commission to revisit NEM Successor Tariff by July 2020 to evaluate the existing NEM tariffs and consider the development and adoption of successor tariffs
Key Dates
Third Quarter Earnings Summary
October 30 2019
Q32019
Q32018 Variance
Basic Earnings Per Share (EPS)1
SCE $ 145 $ 164 $ (019)
EIX Parent amp Other (009) (007) (002)
Basic EPS $ 136 $ 157 $ (021)
Less Non-core Items
SCE2 $ (014) $ 002 $ (016)
EIX Parent amp Other3 mdash (001) 001
Total Non-core $ (014) $ 001 $ (015)
Core Earnings Per Share (EPS)
SCE $ 159 $ 162 $ (003)
EIX Parent amp Other (009) (006) (003)
Core EPS $ 150 $ 156 $ (006)
Key SCE EPS Drivers4
Higher revenue5 $ 012- CPUC revenue (002)- 2018 FERC Formula Rate settlement 010- Other FERC revenue 004
Higher OampM (021)Lower depreciation 002Higher net financing costs (004)Income taxes5 019Property and other taxes (001)Results prior to impact from share dilution $ 007Impact from share dilution (010)Total core drivers $ (003)Non-core items 2 (016)Total $ (019)
Key EIX EPS Drivers4
EIX parent and other mdash Higher interest expense and corporate expenses $ (005)EEG mdash Lower corporate expenses 001Impact from share dilution 001Total core drivers $ (003)Non-core items 3 001Total $ (002)
1 See Earnings Non-GAAP reconciliations and Use of Non-GAAP Financial Measures in Appendix2 Includes SCEs contributions to Wildfire Insurance Fund in third quarter 2019 and impact from the approval of the Revised San Onofre Settlement Agreement in the third quarter 2018 3 Loss on sale of SoCore Energy4 2019 EPS drivers are reported at a consistent share count of 3258 million (2019 QTD weighted-average shares outstanding is 3471 million)5 Includes $020 of tax benefits refunded to customersNote Diluted earnings were $135 and $157 per share for the three months ended September 30 2019 and 2018 respectively
43
1 See Earnings Non-GAAP reconciliations and Use of Non-GAAP Financial Measures in Appendix2 Impact of 2018 GRC final decision related to impairment of utility property plant and equipment changes in allocation of deferred tax re-measurement between customers and
shareholders SCErsquos contributions to the Wildfire Insurance Fund gain from sale of nuclear fuel and impact from the approval of the Revised San Onofre Settlement Agreement3 Loss on sale of SoCore Energy and impact of hypothetical liquidation at book value (HLBV) accounting method4 2019 EPS drivers are reported at a consistent share count of 3258 million (2019 YTD weighted-average shares outstanding is 3330 million)5 Test Year 2018 GRC true-up of $020 includes revenue of $(034) OampM of $006 depreciation of $024 interest expense of $(001) property and other taxes of $001 and income taxes of
$0246 Includes $018 of tax benefits refunded to customersNote Diluted earnings were $342 and $308 per share for the nine months ended September 30 2019 and 2018 respectively
Year to Date Earnings Summary
October 30 2019
YTD 2019
YTD 2018 Variance
Basic Earnings Per Share (EPS)1
SCE $ 365 $ 343 $ 022
EIX Parent amp Other (022) (034) 012
Basic EPS $ 343 $ 309 $ 034
Less Non-core Items
SCE2 $ (030) $ 002 $ (032)
EIX Parent amp Other3 mdash (014) 014
Total Non-core $ (030) $ (012) $ (018)
Core Earnings Per Share (EPS)
SCE $ 395 $ 341 $ 054
EIX Parent amp Other (022) (020) (002)
Core EPS $ 373 $ 321 $ 052
Key SCE EPS Drivers4
Test Year 2018 GRC true-up5 $ 020Higher revenue6 055
- CPUC revenue 032- 2018 FERC Formula Rate settlement 010- FERC and other operating revenue 013
Higher OampM (026)Lower depreciation 005Higher net financing costs (012)Income taxes6 021Results prior to impact from share dilution $ 063Impact from share dilution (009)Total core drivers $ 054Non-core items2 (032)Total $ 022
Key EIX EPS Drivers4
EIX parent and other mdash Higher interest expense and corporate expenses $ (007)EEG mdash Lower corporate expenses and lower losses at the competitive business 004Impact from share dilution 001Total core drivers $ (002)Non-core items3 014Total $ 012
44
SCE Annual Results of Operationsbull Earning activities ndash revenue authorized by CPUC and FERC to provide reasonable cost recovery and return on investmentbull Cost-recovery activities ndash CPUC- and FERC-authorized balancing accounts to recover specific project or program costs subject
to reasonableness review or compliance with upfront standards
($ millions)
2018 2017
Earnings Activities
Cost-Recovery Activities
Total Consolidated
Earnings Activities
Cost-Recovery Activities
Total Consolidated
Operating revenue $6560 $6051 $12611 $6611 $5643 $12254Purchased power and fuel mdash 5406 5406 mdash 4873 4873Operation and maintenance 1972 730 2702 1898 824 2722Wildfire-related claims net of recoveries 2669 mdash 2669 ― ― ―Depreciation and amortization 1867 mdash 1867 2032 mdash 2032Property and other taxes 392 mdash 392 372 mdash 372Impairment and other charges (12) mdash (12) 716 mdash 716Other operating income (7) mdash (7) (8) mdash (8)Total operating expenses 6881 6136 13017 5010 5697 10707Operating (loss) income (321) (85) (406) 1601 (54) 1547Interest expense (671) (2) (673) (588) (1) (589)Other income and expenses 107 87 194 93 55 148(Loss) income before income taxes (885) mdash (885) 1106 mdash 1106Income tax (benefit) expense (696) mdash (696) (30) mdash (30)Net (loss) income (189) mdash (189) 1136 mdash 1136Preferred and preference stock dividend
requirements 121 mdash 121 124 mdash 124
Net (loss) income available for common stock ($310) mdash ($310) $1012 mdash $1012Less Non-core items (1750) (481)Core Earnings $1440 $1493
Note See Use of Non-GAAP Financial Measures
October 30 2019 45
Reconciliation of EIX Basic Earnings Per Share Guidance to EIX Core Earnings Per Share Guidance
EPS Attributable to Edison International 2019
Low Midpoint High
SCE $483
EIX Parent amp Other (032)
Basic EPS1 $441 $451 $461
Non-Core Items
SCE23 (029) (029) (029)
EIX Parent amp Other mdash mdash mdash
Total Non-Core1 (029) (029) (029)
Core EPS
SCE $512
EIX Parent amp Other (032)
Core EPS1 $470 $480 $490
1 EPS is calculated on the assumed weighted-average share count for 2019 Please see 2019 EIX Core Earnings Guidance slide for more information 2 Includes impact of 2018 GRC final decision related to impairment of utility property plant and equipment changes in allocation of deferred tax re-measurement between
customers and shareholders and SCErsquos contributions to the Wildfire Insurance Fund3 Includes $001 per share as a result of share count dilution
October 30 2019
Earnings Per Share Non-GAAP Reconciliations
46
Earnings Non-GAAP Reconciliations
1 Impact of 2018 GRC final decision related to impairment of utility property plant and equipment changes in allocation of deferred tax re-measurement between customers and shareholders SCErsquos contributions to the Wildfire Insurance Fund gain from sale of nuclear fuel and impact from the approval of the Revised San Onofre Settlement Agreement
2 Loss on sale of SoCore Energy and impact of hypothetical liquidation at book value (HLBV) accounting method
($ millions)
Reconciliation of EIX GAAP Earnings to EIX Core Earnings
Earnings Attributable to Edison International Q32019
Q32018
YTD 2019
YTD 2018
SCE $503 $536 $1215 $1119
EIX Parent amp Other (32) (23) (74) (112)
Basic Earnings $471 $513 $1141 $1007
Non-Core Items
SCE 1 ($48) 7 ($99) 7
EIX Parent amp Other 2 mdash (4) mdash (46)
Total Non-Core ($48) $3 ($99) ($39)
Core Earnings
SCE $551 $529 $1314 $1112
EIX Parent amp Other (32) (19) (74) (66)
Core Earnings $519 $510 $1240 $1046
October 30 2019 47
EIX Core EPS Non-GAAP ReconciliationsReconciliation of Edison International Basic Earnings Per Share to Edison International Core Earnings Per Share
Note See Use of Non-GAAP Financial Measures
Earnings Per Share Attributable to Edison International 2018 2017
Basic EPS ($130) $173
Non-Core Items
SCE
Wildfire-related claims net of recoveries (560) mdash
Settlement of 1994 ndash 2006 California tax audits 020 mdash
Write down impairment and other as a result of Revised San Onofre Settlement Agreement
003 (138)
Re-measurement of deferred taxes as a result of Tax Reform mdash (010)
Edison International Parent and Other
Settlement of 1994 ndash 2006 California tax audits (004) mdash
Re-measurement of deferred taxes as a result of Tax Reform mdash (133)
Sale of SoCore Energy and other (014) 004
Discontinued operations
Settlement of 1994 ndash 2006 California tax audits 010 mdash
Less Total Non-Core Items (545) (277)
Core EPS $415 $450
October 30 2019 48
Use of Non-GAAP Financial MeasuresEdison Internationals earnings are prepared in accordance with generally accepted accounting principles used in the United States Management uses core earnings internally for financial planning and for analysis of performance Core earnings are also used when communicating with investors and analysts regarding Edison Internationals earnings results to facilitate comparisons of the Companys performance from period to period Core earnings are a non-GAAP financial measure and may not be comparable to those of other companies Core earnings (or losses) are defined as earnings or losses attributable to Edison International shareholders less income or loss from discontinued operations and income or loss from significant discrete items that management does not consider representative of ongoing earnings such as exit activities including sale of certain assets and other activities that are no longer continuing asset impairments and certain tax regulatory or legal settlements or proceedings
A reconciliation of Non-GAAP information to GAAP information is included either on the slide where the information appears or on another slide referenced in this presentation
EIX Investor Relations Contact
Sam Ramraj Vice President (626) 302-2540 samramrajedisonintlcom
Allison Bahen Principal Manager (626) 302-5493 allisonbahenedisonintlcom
October 30 2019 49
Business Update
Slide Number 2
Table of Contents
EIX Strategy Should Produce Long-Term Value
SCE Highlights
Slide Number 6
SCE Historical Rate Base and Core Earnings
SCE Capital Expenditure Forecast
SCE Rate Base Forecast
Slide Number 10
Californiarsquos GHG Emissions Overview
SCErsquos Pathway 2045 Highlights
Slide Number 13
Slide Number 14
Slide Number 15
SCE Key Regulatory Proceedings
Slide Number 17
Slide Number 18
CPUC and FERC Cost of Capital Summary
CPUC Cost of Capital (2013-2019)
SCE Distribution System Investments
Slide Number 22
Slide Number 23
SCE Large Transmission Projects
SCE Operational Excellence
Responding to Industry Change
Slide Number 27
2019 EIX Core Earnings Guidance
EIX Annual Dividends Per Share
Appendix
EIXrsquos 2018 Sustainability Report Highlights
Slide Number 32
SCE Historical Capital Expenditures
Credit Ratings Summary
Distribution Power Grid of the Future
SCE Customer Demand Trends
SCE Bundled Revenue Requirement
Slide Number 38
SCE Rates and Bills Comparison
Slide Number 40
Slide Number 41
Slide Number 42
Slide Number 43
Slide Number 44
Slide Number 45
SCE Annual Results of Operations
Slide Number 47
Earnings Non-GAAP Reconciliations
EIX Core EPS Non-GAAP Reconciliations
Use of Non-GAAP Financial Measures
bull CPUC Order Instituting Ratemaking R 12-06-013 comprehensively reviewed residential rate structure including a future transition to Time of Use (TOU) rates In March 2018 SCE began to migrate 400000 residential customers to TOU rate structures
Remaining eligible residential customers to be migrated beginning October 2020bull July 2015 CPUC Decision D 15-07-001 includes Transition to 2 tiered rate structure coupled with Super-User Electric (SUE) Surcharge1
ldquoSuper User Electric Surchargerdquo for usage 400 above baseline (~3 of all usage)
Minimum bills of approximately $10month (applied to delivery revenue only)
January 2014 2019
100(60 of system usage)
219(3)
Tier 1100
Tier 2 101-400
SUEgt400
125(37)
Usage Level ( of Baseline)Usage Level ( of Baseline)
1 Completed in 20192 SCErsquos California Alternate Rates for Energy (CARE) program is an income-qualifying program that reduces energy bills for eligible customers by about 30
Winter Weekdays 8am-9pm Weekdays and Weekends 4-9pm
Off-Peak Summer Weekdays 11pm-8amWeekends All
Weekdays and Weekends All except 4-9pm
Winter Weekdays 9pm-8amWeekends All
Weekdays and Weekends 9pm-8am
Super Off-Peak Winter NA Weekdays and Weekends 8am-4pm
New Time-of-Use (TOU) Periods
bull On March 1 2019 SCE changed its basic TOU pricing period definition for the first time in over 30 years
bull Abundant mid-day renewable energy lowers prices from 8am-4pm (October - June)
bull Highest cost period is now 4pm-9pm all-days1
1 TOU pricing periods defined for non-residential customers per CPUC Decision D18-07-006 Similar residential TOU definitions were filed by SCE in A17-12-012
bull 998 solar projectsbull 320445 residential (71 of all residential customers) ndash 1756 MW bull 7333 non-residential ndash 977 MW bull Approximately 4775887 MWhyear generated
SCE Net Metering Statistics (919)
0
5
10
15
20
25
30
35
40
0
1000
2000
3000
4000
5000
6000
7000
2013 2014 2015 2016 2017 2018 2019
MW
Inst
alle
d
Num
ber o
f Sol
ar R
esid
entia
l Ins
talla
tions
Installations MW
July 1 2017bull Official start of NEM successor tariff customers are subject to
Mandatory TOU rate Non-bypassable charges Application fees
July 31 2017bull Residential customers who meet this deadline are grandfathered for
current TOU periods for maximum of 5 years (10 for non-residential)September 9 2017bull Smart Inverters required on all solar installationsJuly 25 2018bull Smart Inverters with Reactive Power Priority required on all solar
installationsNear Term Outlookbull Combination of a flatter tiered rate and the mandatory TOU NEM 20
rate structure has helped reduce the per customer cost shift further efforts to reduce the shift through new TOU pricing periods
bull Commission to revisit NEM Successor Tariff by July 2020 to evaluate the existing NEM tariffs and consider the development and adoption of successor tariffs
Key Dates
Third Quarter Earnings Summary
October 30 2019
Q32019
Q32018 Variance
Basic Earnings Per Share (EPS)1
SCE $ 145 $ 164 $ (019)
EIX Parent amp Other (009) (007) (002)
Basic EPS $ 136 $ 157 $ (021)
Less Non-core Items
SCE2 $ (014) $ 002 $ (016)
EIX Parent amp Other3 mdash (001) 001
Total Non-core $ (014) $ 001 $ (015)
Core Earnings Per Share (EPS)
SCE $ 159 $ 162 $ (003)
EIX Parent amp Other (009) (006) (003)
Core EPS $ 150 $ 156 $ (006)
Key SCE EPS Drivers4
Higher revenue5 $ 012- CPUC revenue (002)- 2018 FERC Formula Rate settlement 010- Other FERC revenue 004
Higher OampM (021)Lower depreciation 002Higher net financing costs (004)Income taxes5 019Property and other taxes (001)Results prior to impact from share dilution $ 007Impact from share dilution (010)Total core drivers $ (003)Non-core items 2 (016)Total $ (019)
Key EIX EPS Drivers4
EIX parent and other mdash Higher interest expense and corporate expenses $ (005)EEG mdash Lower corporate expenses 001Impact from share dilution 001Total core drivers $ (003)Non-core items 3 001Total $ (002)
1 See Earnings Non-GAAP reconciliations and Use of Non-GAAP Financial Measures in Appendix2 Includes SCEs contributions to Wildfire Insurance Fund in third quarter 2019 and impact from the approval of the Revised San Onofre Settlement Agreement in the third quarter 2018 3 Loss on sale of SoCore Energy4 2019 EPS drivers are reported at a consistent share count of 3258 million (2019 QTD weighted-average shares outstanding is 3471 million)5 Includes $020 of tax benefits refunded to customersNote Diluted earnings were $135 and $157 per share for the three months ended September 30 2019 and 2018 respectively
43
1 See Earnings Non-GAAP reconciliations and Use of Non-GAAP Financial Measures in Appendix2 Impact of 2018 GRC final decision related to impairment of utility property plant and equipment changes in allocation of deferred tax re-measurement between customers and
shareholders SCErsquos contributions to the Wildfire Insurance Fund gain from sale of nuclear fuel and impact from the approval of the Revised San Onofre Settlement Agreement3 Loss on sale of SoCore Energy and impact of hypothetical liquidation at book value (HLBV) accounting method4 2019 EPS drivers are reported at a consistent share count of 3258 million (2019 YTD weighted-average shares outstanding is 3330 million)5 Test Year 2018 GRC true-up of $020 includes revenue of $(034) OampM of $006 depreciation of $024 interest expense of $(001) property and other taxes of $001 and income taxes of
$0246 Includes $018 of tax benefits refunded to customersNote Diluted earnings were $342 and $308 per share for the nine months ended September 30 2019 and 2018 respectively
Year to Date Earnings Summary
October 30 2019
YTD 2019
YTD 2018 Variance
Basic Earnings Per Share (EPS)1
SCE $ 365 $ 343 $ 022
EIX Parent amp Other (022) (034) 012
Basic EPS $ 343 $ 309 $ 034
Less Non-core Items
SCE2 $ (030) $ 002 $ (032)
EIX Parent amp Other3 mdash (014) 014
Total Non-core $ (030) $ (012) $ (018)
Core Earnings Per Share (EPS)
SCE $ 395 $ 341 $ 054
EIX Parent amp Other (022) (020) (002)
Core EPS $ 373 $ 321 $ 052
Key SCE EPS Drivers4
Test Year 2018 GRC true-up5 $ 020Higher revenue6 055
- CPUC revenue 032- 2018 FERC Formula Rate settlement 010- FERC and other operating revenue 013
Higher OampM (026)Lower depreciation 005Higher net financing costs (012)Income taxes6 021Results prior to impact from share dilution $ 063Impact from share dilution (009)Total core drivers $ 054Non-core items2 (032)Total $ 022
Key EIX EPS Drivers4
EIX parent and other mdash Higher interest expense and corporate expenses $ (007)EEG mdash Lower corporate expenses and lower losses at the competitive business 004Impact from share dilution 001Total core drivers $ (002)Non-core items3 014Total $ 012
44
SCE Annual Results of Operationsbull Earning activities ndash revenue authorized by CPUC and FERC to provide reasonable cost recovery and return on investmentbull Cost-recovery activities ndash CPUC- and FERC-authorized balancing accounts to recover specific project or program costs subject
to reasonableness review or compliance with upfront standards
($ millions)
2018 2017
Earnings Activities
Cost-Recovery Activities
Total Consolidated
Earnings Activities
Cost-Recovery Activities
Total Consolidated
Operating revenue $6560 $6051 $12611 $6611 $5643 $12254Purchased power and fuel mdash 5406 5406 mdash 4873 4873Operation and maintenance 1972 730 2702 1898 824 2722Wildfire-related claims net of recoveries 2669 mdash 2669 ― ― ―Depreciation and amortization 1867 mdash 1867 2032 mdash 2032Property and other taxes 392 mdash 392 372 mdash 372Impairment and other charges (12) mdash (12) 716 mdash 716Other operating income (7) mdash (7) (8) mdash (8)Total operating expenses 6881 6136 13017 5010 5697 10707Operating (loss) income (321) (85) (406) 1601 (54) 1547Interest expense (671) (2) (673) (588) (1) (589)Other income and expenses 107 87 194 93 55 148(Loss) income before income taxes (885) mdash (885) 1106 mdash 1106Income tax (benefit) expense (696) mdash (696) (30) mdash (30)Net (loss) income (189) mdash (189) 1136 mdash 1136Preferred and preference stock dividend
requirements 121 mdash 121 124 mdash 124
Net (loss) income available for common stock ($310) mdash ($310) $1012 mdash $1012Less Non-core items (1750) (481)Core Earnings $1440 $1493
Note See Use of Non-GAAP Financial Measures
October 30 2019 45
Reconciliation of EIX Basic Earnings Per Share Guidance to EIX Core Earnings Per Share Guidance
EPS Attributable to Edison International 2019
Low Midpoint High
SCE $483
EIX Parent amp Other (032)
Basic EPS1 $441 $451 $461
Non-Core Items
SCE23 (029) (029) (029)
EIX Parent amp Other mdash mdash mdash
Total Non-Core1 (029) (029) (029)
Core EPS
SCE $512
EIX Parent amp Other (032)
Core EPS1 $470 $480 $490
1 EPS is calculated on the assumed weighted-average share count for 2019 Please see 2019 EIX Core Earnings Guidance slide for more information 2 Includes impact of 2018 GRC final decision related to impairment of utility property plant and equipment changes in allocation of deferred tax re-measurement between
customers and shareholders and SCErsquos contributions to the Wildfire Insurance Fund3 Includes $001 per share as a result of share count dilution
October 30 2019
Earnings Per Share Non-GAAP Reconciliations
46
Earnings Non-GAAP Reconciliations
1 Impact of 2018 GRC final decision related to impairment of utility property plant and equipment changes in allocation of deferred tax re-measurement between customers and shareholders SCErsquos contributions to the Wildfire Insurance Fund gain from sale of nuclear fuel and impact from the approval of the Revised San Onofre Settlement Agreement
2 Loss on sale of SoCore Energy and impact of hypothetical liquidation at book value (HLBV) accounting method
($ millions)
Reconciliation of EIX GAAP Earnings to EIX Core Earnings
Earnings Attributable to Edison International Q32019
Q32018
YTD 2019
YTD 2018
SCE $503 $536 $1215 $1119
EIX Parent amp Other (32) (23) (74) (112)
Basic Earnings $471 $513 $1141 $1007
Non-Core Items
SCE 1 ($48) 7 ($99) 7
EIX Parent amp Other 2 mdash (4) mdash (46)
Total Non-Core ($48) $3 ($99) ($39)
Core Earnings
SCE $551 $529 $1314 $1112
EIX Parent amp Other (32) (19) (74) (66)
Core Earnings $519 $510 $1240 $1046
October 30 2019 47
EIX Core EPS Non-GAAP ReconciliationsReconciliation of Edison International Basic Earnings Per Share to Edison International Core Earnings Per Share
Note See Use of Non-GAAP Financial Measures
Earnings Per Share Attributable to Edison International 2018 2017
Basic EPS ($130) $173
Non-Core Items
SCE
Wildfire-related claims net of recoveries (560) mdash
Settlement of 1994 ndash 2006 California tax audits 020 mdash
Write down impairment and other as a result of Revised San Onofre Settlement Agreement
003 (138)
Re-measurement of deferred taxes as a result of Tax Reform mdash (010)
Edison International Parent and Other
Settlement of 1994 ndash 2006 California tax audits (004) mdash
Re-measurement of deferred taxes as a result of Tax Reform mdash (133)
Sale of SoCore Energy and other (014) 004
Discontinued operations
Settlement of 1994 ndash 2006 California tax audits 010 mdash
Less Total Non-Core Items (545) (277)
Core EPS $415 $450
October 30 2019 48
Use of Non-GAAP Financial MeasuresEdison Internationals earnings are prepared in accordance with generally accepted accounting principles used in the United States Management uses core earnings internally for financial planning and for analysis of performance Core earnings are also used when communicating with investors and analysts regarding Edison Internationals earnings results to facilitate comparisons of the Companys performance from period to period Core earnings are a non-GAAP financial measure and may not be comparable to those of other companies Core earnings (or losses) are defined as earnings or losses attributable to Edison International shareholders less income or loss from discontinued operations and income or loss from significant discrete items that management does not consider representative of ongoing earnings such as exit activities including sale of certain assets and other activities that are no longer continuing asset impairments and certain tax regulatory or legal settlements or proceedings
A reconciliation of Non-GAAP information to GAAP information is included either on the slide where the information appears or on another slide referenced in this presentation
EIX Investor Relations Contact
Sam Ramraj Vice President (626) 302-2540 samramrajedisonintlcom
Allison Bahen Principal Manager (626) 302-5493 allisonbahenedisonintlcom
October 30 2019 49
Business Update
Slide Number 2
Table of Contents
EIX Strategy Should Produce Long-Term Value
SCE Highlights
Slide Number 6
SCE Historical Rate Base and Core Earnings
SCE Capital Expenditure Forecast
SCE Rate Base Forecast
Slide Number 10
Californiarsquos GHG Emissions Overview
SCErsquos Pathway 2045 Highlights
Slide Number 13
Slide Number 14
Slide Number 15
SCE Key Regulatory Proceedings
Slide Number 17
Slide Number 18
CPUC and FERC Cost of Capital Summary
CPUC Cost of Capital (2013-2019)
SCE Distribution System Investments
Slide Number 22
Slide Number 23
SCE Large Transmission Projects
SCE Operational Excellence
Responding to Industry Change
Slide Number 27
2019 EIX Core Earnings Guidance
EIX Annual Dividends Per Share
Appendix
EIXrsquos 2018 Sustainability Report Highlights
Slide Number 32
SCE Historical Capital Expenditures
Credit Ratings Summary
Distribution Power Grid of the Future
SCE Customer Demand Trends
SCE Bundled Revenue Requirement
Slide Number 38
SCE Rates and Bills Comparison
Slide Number 40
Slide Number 41
Slide Number 42
Slide Number 43
Slide Number 44
Slide Number 45
SCE Annual Results of Operations
Slide Number 47
Earnings Non-GAAP Reconciliations
EIX Core EPS Non-GAAP Reconciliations
Use of Non-GAAP Financial Measures
Earnings Non-GAAP Reconciliations
1 Impact of 2018 GRC final decision related to impairment of utility property plant and equipment changes in allocation of deferred tax re-measurement between customers and shareholders SCErsquos contributions to the Wildfire Insurance Fund gain from sale of nuclear fuel and impact from the approval of the Revised San Onofre Settlement Agreement
2 Loss on sale of SoCore Energy and impact of hypothetical liquidation at book value (HLBV) accounting method
($ millions)
Reconciliation of EIX GAAP Earnings to EIX Core Earnings
Earnings Attributable to Edison International Q32019
Q32018
YTD 2019
YTD 2018
SCE $503 $536 $1215 $1119
EIX Parent amp Other (32) (23) (74) (112)
Basic Earnings $471 $513 $1141 $1007
Non-Core Items
SCE 1 ($48) 7 ($99) 7
EIX Parent amp Other 2 mdash (4) mdash (46)
Total Non-Core ($48) $3 ($99) ($39)
Core Earnings
SCE $551 $529 $1314 $1112
EIX Parent amp Other (32) (19) (74) (66)
Core Earnings $519 $510 $1240 $1046
October 30 2019 47
EIX Core EPS Non-GAAP ReconciliationsReconciliation of Edison International Basic Earnings Per Share to Edison International Core Earnings Per Share
Note See Use of Non-GAAP Financial Measures
Earnings Per Share Attributable to Edison International 2018 2017
Basic EPS ($130) $173
Non-Core Items
SCE
Wildfire-related claims net of recoveries (560) mdash
Settlement of 1994 ndash 2006 California tax audits 020 mdash
Write down impairment and other as a result of Revised San Onofre Settlement Agreement
003 (138)
Re-measurement of deferred taxes as a result of Tax Reform mdash (010)
Edison International Parent and Other
Settlement of 1994 ndash 2006 California tax audits (004) mdash
Re-measurement of deferred taxes as a result of Tax Reform mdash (133)
Sale of SoCore Energy and other (014) 004
Discontinued operations
Settlement of 1994 ndash 2006 California tax audits 010 mdash
Less Total Non-Core Items (545) (277)
Core EPS $415 $450
October 30 2019 48
Use of Non-GAAP Financial MeasuresEdison Internationals earnings are prepared in accordance with generally accepted accounting principles used in the United States Management uses core earnings internally for financial planning and for analysis of performance Core earnings are also used when communicating with investors and analysts regarding Edison Internationals earnings results to facilitate comparisons of the Companys performance from period to period Core earnings are a non-GAAP financial measure and may not be comparable to those of other companies Core earnings (or losses) are defined as earnings or losses attributable to Edison International shareholders less income or loss from discontinued operations and income or loss from significant discrete items that management does not consider representative of ongoing earnings such as exit activities including sale of certain assets and other activities that are no longer continuing asset impairments and certain tax regulatory or legal settlements or proceedings
A reconciliation of Non-GAAP information to GAAP information is included either on the slide where the information appears or on another slide referenced in this presentation
EIX Investor Relations Contact
Sam Ramraj Vice President (626) 302-2540 samramrajedisonintlcom
Allison Bahen Principal Manager (626) 302-5493 allisonbahenedisonintlcom
October 30 2019 49
Business Update
Slide Number 2
Table of Contents
EIX Strategy Should Produce Long-Term Value
SCE Highlights
Slide Number 6
SCE Historical Rate Base and Core Earnings
SCE Capital Expenditure Forecast
SCE Rate Base Forecast
Slide Number 10
Californiarsquos GHG Emissions Overview
SCErsquos Pathway 2045 Highlights
Slide Number 13
Slide Number 14
Slide Number 15
SCE Key Regulatory Proceedings
Slide Number 17
Slide Number 18
CPUC and FERC Cost of Capital Summary
CPUC Cost of Capital (2013-2019)
SCE Distribution System Investments
Slide Number 22
Slide Number 23
SCE Large Transmission Projects
SCE Operational Excellence
Responding to Industry Change
Slide Number 27
2019 EIX Core Earnings Guidance
EIX Annual Dividends Per Share
Appendix
EIXrsquos 2018 Sustainability Report Highlights
Slide Number 32
SCE Historical Capital Expenditures
Credit Ratings Summary
Distribution Power Grid of the Future
SCE Customer Demand Trends
SCE Bundled Revenue Requirement
Slide Number 38
SCE Rates and Bills Comparison
Slide Number 40
Slide Number 41
Slide Number 42
Slide Number 43
Slide Number 44
Slide Number 45
SCE Annual Results of Operations
Slide Number 47
Earnings Non-GAAP Reconciliations
EIX Core EPS Non-GAAP Reconciliations
Use of Non-GAAP Financial Measures
Use of Non-GAAP Financial MeasuresEdison Internationals earnings are prepared in accordance with generally accepted accounting principles used in the United States Management uses core earnings internally for financial planning and for analysis of performance Core earnings are also used when communicating with investors and analysts regarding Edison Internationals earnings results to facilitate comparisons of the Companys performance from period to period Core earnings are a non-GAAP financial measure and may not be comparable to those of other companies Core earnings (or losses) are defined as earnings or losses attributable to Edison International shareholders less income or loss from discontinued operations and income or loss from significant discrete items that management does not consider representative of ongoing earnings such as exit activities including sale of certain assets and other activities that are no longer continuing asset impairments and certain tax regulatory or legal settlements or proceedings
A reconciliation of Non-GAAP information to GAAP information is included either on the slide where the information appears or on another slide referenced in this presentation
EIX Investor Relations Contact
Sam Ramraj Vice President (626) 302-2540 samramrajedisonintlcom
Allison Bahen Principal Manager (626) 302-5493 allisonbahenedisonintlcom