Office of Tax Analysis Working Paper 110 October 2016 Business Use of Section 179 Expensing and Bonus Depreciation, 2002-2014 John Kitchen and Matthew Knittel The OTA Working Papers Series presents original research by the staff of the Office of Tax Analysis. These papers are intended to generate discussion and critical comment while informing and improving the quality of the analysis conducted by the Office. The papers are works in progress and subject to revision. Views and opinions expressed are those of the authors and do not necessarily represent official Treasury or Commonwealth of Pennsylvania positions or policy. Comments are welcome, as are suggestions for improvements, and should be directed to the authors. OTA Working Papers may be quoted without additional permission.
Transcript
Office of Tax Analysis Working Paper 110
October 2016
Business Use of Section 179 Expensing and Bonus Depreciation, 2002-2014
John Kitchen and Matthew Knittel
The OTA Working Papers Series presents original research by the staff of the Office of Tax Analysis. These papers are intended to generate discussion and critical comment while informing and improving the quality of the analysis conducted by the Office. The papers are works in progress and subject to revision. Views and opinions expressed are those of the authors and do not necessarily represent official Treasury or Commonwealth of Pennsylvania positions or policy. Comments are welcome, as are suggestions for improvements, and should be directed to the authors. OTA Working Papers may be quoted without additional permission.
BUSINESS USE OF SECTION 179 EXPENSING AND BONUS DEPRECIATION, 2002-2014
October 2016
John Kitchen1 and Matthew Knittel2
This paper examines business use of special provisions for increased expensing of capital investment that have been passed into law over the past decade and a half -- bonus depreciation and expanded Section 179 expensing limits. Tax data over the 2002-2014 period show that corporations, pass-through entities, and individual filers have tended to use Section 179 expensing in the 60 percent to 80 percent range, both in terms of the numbers of businesses claiming the deductions and for the deduction amounts claimed relative to total allowed investment amounts. For bonus depreciation, in the years 2002-2004 and 2008-2014, the effective take-up rates were lower than observed for Section 179 expensing. The number of firms using bonus depreciation for eligible investment generally was in the 40 percent to 60 percent range relative to the number eligible, while the bonus depreciation deduction relative to the eligible investment amount generally was in the 50 percent to 70 percent range for C corporations and S corporations, but was at lower ranges of about 40 percent to 60 percent for partnerships and 30 percent to 40 percent for individuals. Total business use of Section 179 expensing and bonus depreciation over the 2002-2014 period averaged nearly $300 billion per year, and more recently over $400 billion per year for 2012-2014. Probit analysis of C corporation data from 2008 is consistent with theoretical priors that bonus depreciation use is limited by firms in a loss position, and by firms with net operating loss carryforwards. The analysis also is consistent with a positive relationship between bonus use and conformity of state tax laws with Federal treatment regarding bonus depreciation; average equipment investment life; the size of the firm; and for manufacturing and mining firms relative to other industries.
Keywords: Business taxes, Expensing, Bonus Depreciation, Investment
JEL Codes: H22, H25
1 John Kitchen: Office of Tax Analysis, U.S. Department of the Treasury, [email protected]. 2 Matthew Knittel: Independent Fiscal Office, Commonwealth of Pennsylvania, [email protected].
1
1. INTRODUCTION
Over the past decade and a half, special provisions for accelerated depreciation of
equipment investment were passed and signed into law, with the stated policy intent of providing
pro-growth incentives for increasing investment. The two main provisions for special accelerated
depreciation have been: 1) “bonus” depreciation under Section 168(k) that allows for an
additional first-year depreciation deduction; and 2) increases in Section 179 expensing limits, the
maximum deduction allowed for full expensing of equipment investment by “small businesses.”
By allowing firms to deduct capital expenditures more quickly, bonus depreciation and Section
179 expensing reduce the cost of capital and lower the effective tax rate.
This paper provides a retrospective on the use of Section 179 expensing and bonus
depreciation over the 2002-2014 period, including take-up rates -- the percentages of eligible
firms and investment using the provision -- across organizational form (C corporations, S
corporations, partnerships, and individuals3) and across tax years.4 We review existing studies
regarding the evidence on whether the special expensing provisions led to increases in investment
above levels that would have otherwise occurred -- i.e. a policy-induced behavioral response --
but do not provide any new evidence on that issue. Rather, the focus is on the overall utilization
of Section 179 expensing and bonus depreciation for the given investment observed, and the
characteristics of firms that appear to underlie the decision to use or not use bonus depreciation.
Using IRS Statistics of Income (SOI) tax data, we find that take-up rates were relatively high for
Section 179 expensing (for allowed investment given income tests) -- generally in the 70 percent
to 80 percent range for C corporations and S corporations, and somewhat lower at around 60
percent to 70 percent for partnerships and individuals. For bonus depreciation, the take-up rates
relative to eligible investment generally were in the 50 percent to 60 percent range for C
corporations and S corporations, in the 40 percent to 60 percent range for partnerships, and in the
30 percent to 40 percent range for individuals. In dollar volume, use of Section 179 expensing
has varied over the years as the legislative limits and the performance of the economy have
varied; aggregate use of Section 179 expensing across all legal forms averaged just over $50
billion per year over 2003-2011, and just over $80 billion in the more recent years of 2012-2014.
Regarding the use of bonus depreciation, during years when 50 percent bonus was in place, the
total use across legal forms ranged from about $210 billion (average for 2004, 2008-2009) to
about $345 billion (average 2012-2014). The peak use for bonus depreciation was for 2011 when
3 The reference to “individuals” is often synonymous with “sole proprietors” but our analysis also includes farm and rental filers. 4 This paper updates and expands upon earlier work in Knittel (2005), Knittel (2007) and Kitchen and Knittel (2011).
2
100 percent bonus depreciation was in place and the total bonus amount claimed was $548
billion.
We also present empirical analysis examining the role of various factors that affect the
estimated probability of a firm using bonus depreciation. While we cannot precisely identify the
factors that determine the take-up rates for bonus depreciation, the analysis and empirical
evidence we present are consistent with the use of bonus depreciation being reduced by the firm
being in a loss position or using net operating loss carryforwards and thus being unable to fully
realize the tax benefits of immediate expensing. The results are also loosely consistent with
bonus use being lower because of the lack of conformity of state tax laws with Federal treatment
regarding bonus depreciation. The results also indicate bonus use is higher for firms with longer-
lived equipment investment, for larger firms, and for mining and manufacturing firms.
The paper proceeds as follows. Section 2 presents background and recent historical
information on Section 179 and bonus depreciation provisions and legislation. Section 3 presents
information on the economics of accelerated depreciation, with examples that illustrate the
beneficial effects in terms of the present value of deductions, the cost of capital, and the effective
tax rate. Section 4 provides the policy perspective and a brief review of the literature on
empirical evidence on the investment responses to bonus depreciation provisions. Section 5
discusses the data used and the adjustments, imputations, and other calculations that are made.
Section 6 presents the results from the tax data for use of Section 179 and bonus depreciation by
organizational form and by year. Section 7 presents empirical results for probit estimation for the
probability of firm use of bonus depreciation based on various characteristics, as well as some
representative examples. Section 8 considers some special issues, including the distribution by
income and by industry for the use of Section 179 and bonus depreciation, and the challenge of
properly accounting for “used” property in making the estimates. Section 9 presents the summary
and conclusions. Appendixes are included that provide the IRS Form 4562 for Depreciation and
Amortization; charts for the legislative history for Section 179 and bonus depreciation; and a
description of the derivation of the investment basis amounts for Section 179 and bonus used in
the paper.
2. SECTION 179 EXPENSING AND BONUS DEPRECIATION LEGISLATION
Over the years, numerous laws have been passed instituting specific provisions in the tax
code to allow for immediate expensing of investment; notably, over the past decade and a half,
the special depreciation allowance -- also known as “bonus depreciation” -- has allowed for
partial or full expensing of equipment and software investment for various years, and higher
3
Section 179 expensing limits and phase-out ranges have allowed for greater investment expensing
by businesses with investment amounts below established limits.5 This section presents some
historical and background discussion for the bonus depreciation and Section 179 expensing
provisions.
2.1 Section 179 expensing
Section 179 expensing was added to the tax code with the enactment of the Economic
Recovery and Tax Act of 1981 and the Accelerated Cost Recovery System rules.6 Under Section
179, taxpayers may elect to expense qualifying investment up to a specified limit. Qualifying
investment is defined as depreciable tangible personal property that is purchased for use in the
active conduct of a trade or business.7 In general, this definition includes equipment that would
normally be depreciated under the Modified Accelerated Cost Recovery System (MACRS) for
property with a tax life of 3, 5, 7, 10, 15, or 20 years. For tax years that began in 2002, the
maximum Section 179 deduction was $24,000; the deduction was phased-out dollar-for-dollar if
qualified investment exceeded $200,000. The Jobs and Growth Tax Relief Reconciliation Act
(JGTRRA) of 2003 increased the maximum deduction to $100,000 and the phase-out level to
$400,000 for tax years that began in 2003 and, including an extension under the American Jobs
Creation Act (AJCA) of 2004, those limits continued, adjusted for inflation, through 2007. The
Small Business and Work Opportunity Act of 2007 (passed with the Defense Supplemental of
2007) raised the limits to $125,000/$500,000 for 2007; the Economic Stimulus Act (ESA) of
2008 and the American Recovery and Reinvestment Act (ARRA) of 2009 set the limits at
$250,000/$800,000 for 2008 and 2009; the Small Business Jobs Act (SBJA) of 2010 set the limits
at $500,000/$2,000,000 for 2010 and 2011; the American Taxpayer Relief Act (ATRA) of 2012
extended the $500,000/$2,000,000 levels through 2012-2013; the Tax Increase Prevention Act
(TIPA) of 2014 extended those levels through 2014; and the Protecting Americans from Tax
Hikes (PATH) Act of 2015 made permanent the maximum deduction at $500,000 and the phase-
out threshold at $2,000,000 -- with those levels indexed for inflation for years after 2015.
In addition to the qualifying investment limit, the Section 179 deduction is also limited
by a taxpayer’s taxable income. The deduction may not exceed the sum of taxable income
5 See Appendix B for a detailed legislative timeline. 6 For a succinct description of the background regarding depreciation and Section 179 expensing as of 2005, also see Joint Committee on Taxation (2005); and for a more recent description also see Gunther (2015). 7 This includes off-the-shelf computer software placed in service in taxable years beginning after 2003. Alternatively, these purchases would not qualify for Section 179 expensing and would be amortized over three years.
4
derived from the active conduct of a business (or businesses) plus any wage or salary income.
The income limit applies separately to the individual taxpayer and each business entity. Many
individuals receive multiple Section 179 deductions because they have more than one sole
proprietorship and/or they receive Section 179 deductions that are passed through from
partnerships or S corporations. (The pass-through of Section 179 deductions to specific
partners/shareholders is unique; all other depreciation allowances are included in the computation
of business net income and apportioned among partners/shareholders.) Regardless of how many
deductions a single taxpayer receives from a sole proprietorship, farm, or pass-through entity, the
taxpayer’s total deduction may not exceed the lesser of the maximum deduction or the taxable
income limit. Amounts disallowed by the income limitation are carried forward to future tax
years. The deduction for carryforwards plus any current year amounts expensed under Section
179 may not exceed the maximum deduction limit or, if lesser, the taxable income limit. In this
manner, carryforward deductions that are generated via Section 179 are always subject to the
maximum deduction and taxable income limits. Conversely, “regular” depreciation deductions
are not subject to such limits.
Although most equipment -- including “used” equipment as long as it is new to the
taxpayer -- qualifies for Section 179, certain listed property does not. Listed property is property
that lends itself to personal use such as passenger automobiles, property used for transportation,
computers and related peripheral equipment (unless used solely at a regular business
establishment), and property generally used for entertainment, recreation, or amusement.
Taxpayers must apportion listed property between business and personal use and claim
deductions attributable to the business share only (if greater than 50 percent). In addition, further
complications arise for expensing and depreciation treatment for passenger automobiles (listed
property) and heavy Sport Utility Vehicles (SUVs). The depreciation deduction for passenger
automobiles (those rated at 6,000 pounds gross vehicle weight or less) is limited and dependent
on the use or non-use of bonus depreciation; for example, the maximum depreciation deduction
for the first year for a passenger automobile placed in service in 2013 was $11,160 if electing to
use bonus depreciation, but only $3,160 if not electing to use bonus depreciation. For heavy
SUVs -- “any 4-wheeled vehicle primarily designed or used to carry passengers … that is rated at
more than 6,000 pounds gross vehicle weight and not more than 14,000 pounds gross vehicle
weight” -- the taxpayer cannot elect to expense more than $25,000 of the cost of the vehicle. As a
result of these varying depreciation deduction limits under alternative expensing and depreciation
treatments, taxpayers can face varying incentives regarding the choices to use Section 179
expensing or bonus depreciation.
5
2.2 Bonus depreciation
In the wake of the September 11 attacks and the recession of 2001, the Job Creation and
Worker Assistance Act of 2002 put in place in Section 168(k) of the Internal Revenue Code an
additional first-year depreciation deduction equal to 30 percent of the adjusted basis of qualified
property (30 percent “bonus” depreciation) for property placed in service on or after September
11, 2001. The Jobs and Growth Tax Relief Reconciliation Act (JGTRRA) of 2003 increased the
bonus depreciation percentage to 50 percent, for investment made after May 5, 2003 and before
January 1, 2005. Following its expiration at the end of 2004, bonus depreciation was not in place
during 2005-2007 -- the middle-to-latter years of that economic expansion. In 2008, 50 percent
bonus depreciation was reinstated by the Economic Stabilization Act (ESA) of 2008, and the
American Recovery and Reinvestment Act (ARRA) of 2009 extended it through 2009. The
Small Business Jobs Act (SBJA) of 2010 initially extended 50 percent bonus depreciation
through 2010, but full 100 percent expensing was put in place for the period September 9, 2010
through December 31, 2011 by the Tax Relief and Unemployment Insurance Reauthorization and
Job Creation Act (TRUIRJCA) of 2010. Bonus depreciation at 50 percent was extended through
2012 by TRUIRJCA, through 2013 by the American Tax Relief Act (ATRA) of 2012, and
through 2014 by the Tax Increase Prevention Act (TIPA) of 2014. The Protecting Americans
from Tax Hikes (PATH) Act of 2015 extended 50 percent bonus depreciation for the years 2015
through 2017, and then a partial phase-down to 40 percent bonus depreciation for 2018 and 30
percent bonus depreciation for 2019. Qualified property for bonus depreciation is generally new
equipment and prepackaged software (see Appendix C for more specific information on qualified
property).
Taxpayers may claim bonus depreciation if they have eligible investment and, unlike
Section 179 expensing, there are no investment or income limits. Eligible investment is
investment to which the general rules of the MACRS apply and have a class life of 20 years or
less.8 Original use must commence with the taxpayer claiming the deduction; used equipment
purchases do not qualify for bonus depreciation.
In addition to the general provisions for bonus depreciation, a variety of special cases for
bonus depreciation treatment have been put in place in various years and periods over the past
decade -- notably for New York Liberty Zone property, Gulf Opportunity Zone property,
8 Eligible investment also includes water utility property, computer software (other than software covered by Section 197), qualified leasehold improvement property, and certain aircraft. Property required to be depreciated under the Alternative Depreciation System (ADS), notably tangible property used predominantly outside the United States, is not eligible for bonus depreciation.
6
cellulosic and biomass fuel plant property, reuse and recycling property, and disaster assistance
property.9
3. ECONOMICS OF ACCELERATED DEPRECIATION
Before presenting and examining results from reported tax data, it is informative to
examine how accelerated tax depreciation affects a firm’s marginal effective tax rate and
investment decision.
3.1 The mechanics of bonus depreciation
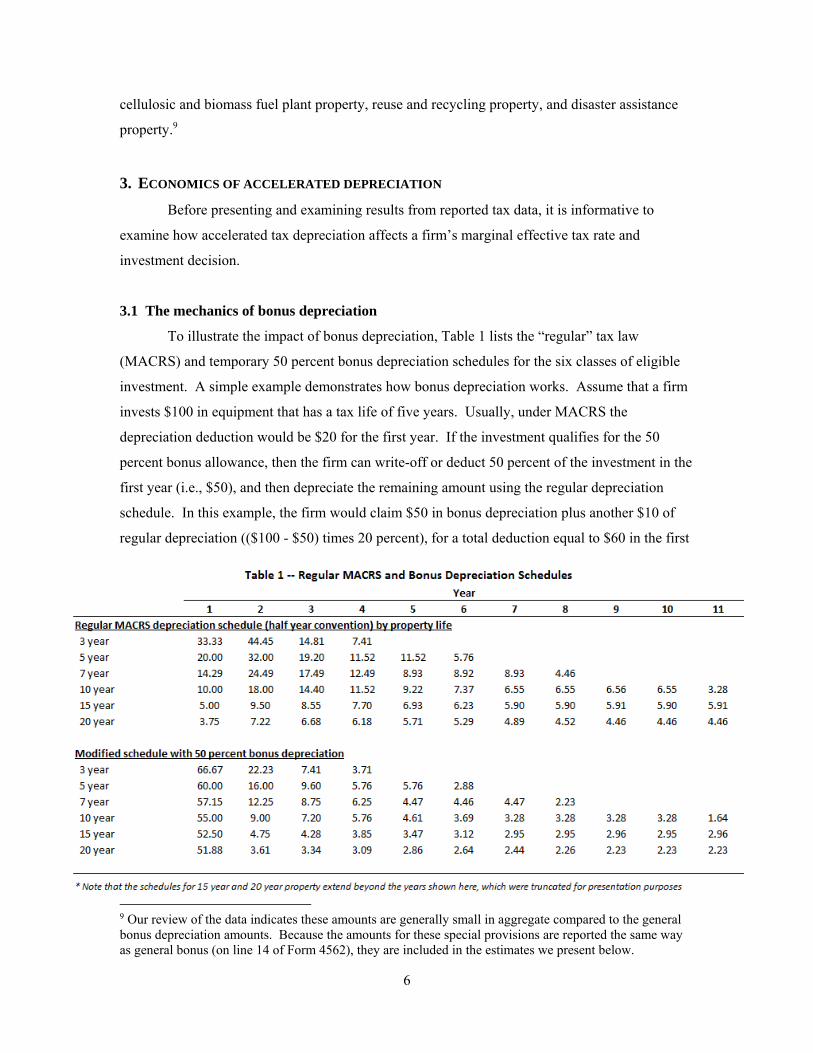
To illustrate the impact of bonus depreciation, Table 1 lists the “regular” tax law
(MACRS) and temporary 50 percent bonus depreciation schedules for the six classes of eligible
investment. A simple example demonstrates how bonus depreciation works. Assume that a firm
invests $100 in equipment that has a tax life of five years. Usually, under MACRS the
depreciation deduction would be $20 for the first year. If the investment qualifies for the 50
percent bonus allowance, then the firm can write-off or deduct 50 percent of the investment in the
first year (i.e., $50), and then depreciate the remaining amount using the regular depreciation
schedule. In this example, the firm would claim $50 in bonus depreciation plus another $10 of
regular depreciation (($100 - $50) times 20 percent), for a total deduction equal to $60 in the first
9 Our review of the data indicates these amounts are generally small in aggregate compared to the general bonus depreciation amounts. Because the amounts for these special provisions are reported the same way as general bonus (on line 14 of Form 4562), they are included in the estimates we present below.
7
year. This is shown in the second line of the bottom section of Table 1. Note that the reported
bonus deduction does not represent the net additional deduction claimed by the firm in the year
the investment is made ($40 in this example); the incremental deduction attributable to the bonus
provision is somewhat less than the bonus deduction itself.
3.2 The user cost of capital and effective tax rates
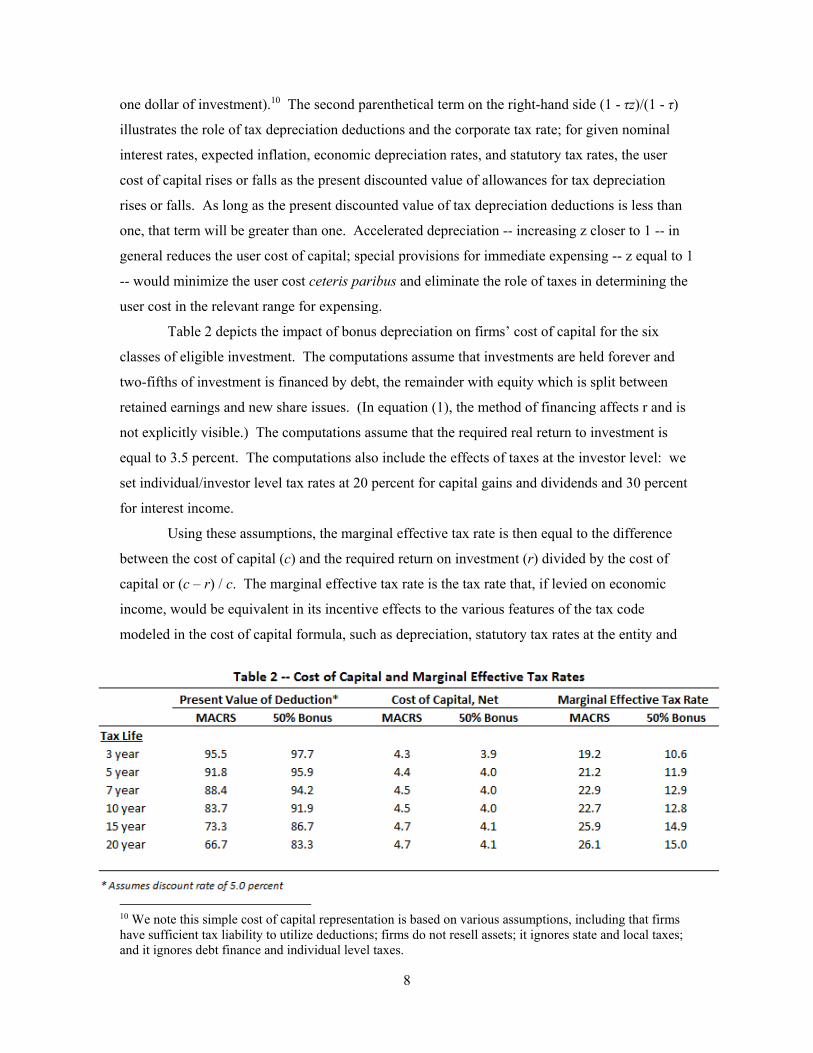
Bonus depreciation reduces the effective tax rate on investment because it increases the
net present value of the depreciation allowance. The first set of columns in Table 2 show the net
present value of deductions for regular MACRS depreciation and for the 50 percent bonus
depreciation schedules under an assumption of a 5 percent discount rate. Bonus depreciation can
substantially accelerate deductions, especially for longer-lived property. Compared to regular
tax depreciation, 50 percent bonus depreciation increases the net present value of deductions by
25 percent for twenty-year property. Conversely, for three-year property, 50 percent bonus
depreciation adds little to net present values: about 2percent.
Although present value comparisons are straightforward and can be informative, they do
not provide a comprehensive measure of the impact that accelerated tax depreciation has on
investment incentives. A more complete measure is a firm’s marginal effective tax rate which is
a derivative of the cost of capital as first developed by Hall and Jorgensen (1967). The cost of
capital is the pre-tax rate of return on a barely profitable investment that covers the investment’s
tax cost while still leaving the investor his or her required after-tax rate of return. The cost of
capital represents the pre-tax return on the final or marginal investment; firms should undertake
additional investment as long as the (net of depreciation) marginal product of capital exceeds the
cost of capital.
Following Hall and Jorgenson (1967) and a typical approach considered in the literature,
a simplified representation of the cost of capital (for one dollar of investment) is given by (in this
case for a corporation and net of economic depreciation):
1 1 1
where r is the real discount rate, δ is the rate of economic depreciation, τ is the statutory corporate
tax rate, and z is the present discounted value of allowances for tax depreciation deductions (for
8
one dollar of investment).10 The second parenthetical term on the right-hand side (1 - τz)/(1 - τ)
illustrates the role of tax depreciation deductions and the corporate tax rate; for given nominal
interest rates, expected inflation, economic depreciation rates, and statutory tax rates, the user
cost of capital rises or falls as the present discounted value of allowances for tax depreciation
rises or falls. As long as the present discounted value of tax depreciation deductions is less than
one, that term will be greater than one. Accelerated depreciation -- increasing z closer to 1 -- in
general reduces the user cost of capital; special provisions for immediate expensing -- z equal to 1
-- would minimize the user cost ceteris paribus and eliminate the role of taxes in determining the
user cost in the relevant range for expensing.
Table 2 depicts the impact of bonus depreciation on firms’ cost of capital for the six
classes of eligible investment. The computations assume that investments are held forever and
two-fifths of investment is financed by debt, the remainder with equity which is split between
retained earnings and new share issues. (In equation (1), the method of financing affects r and is
not explicitly visible.) The computations assume that the required real return to investment is
equal to 3.5 percent. The computations also include the effects of taxes at the investor level: we
set individual/investor level tax rates at 20 percent for capital gains and dividends and 30 percent
for interest income.
Using these assumptions, the marginal effective tax rate is then equal to the difference
between the cost of capital (c) and the required return on investment (r) divided by the cost of
capital or (c – r) / c. The marginal effective tax rate is the tax rate that, if levied on economic
income, would be equivalent in its incentive effects to the various features of the tax code
modeled in the cost of capital formula, such as depreciation, statutory tax rates at the entity and
10 We note this simple cost of capital representation is based on various assumptions, including that firms have sufficient tax liability to utilize deductions; firms do not resell assets; it ignores state and local taxes; and it ignores debt finance and individual level taxes.
9
investor levels and indexing provisions. If the tax system measured and taxed economic income,
then the marginal effective tax rate on investment would equal the statutory tax rate.
3.3 Cash flow benefit of bonus depreciation
Marginal effective tax rates are useful when considering the firm’s investment decision,
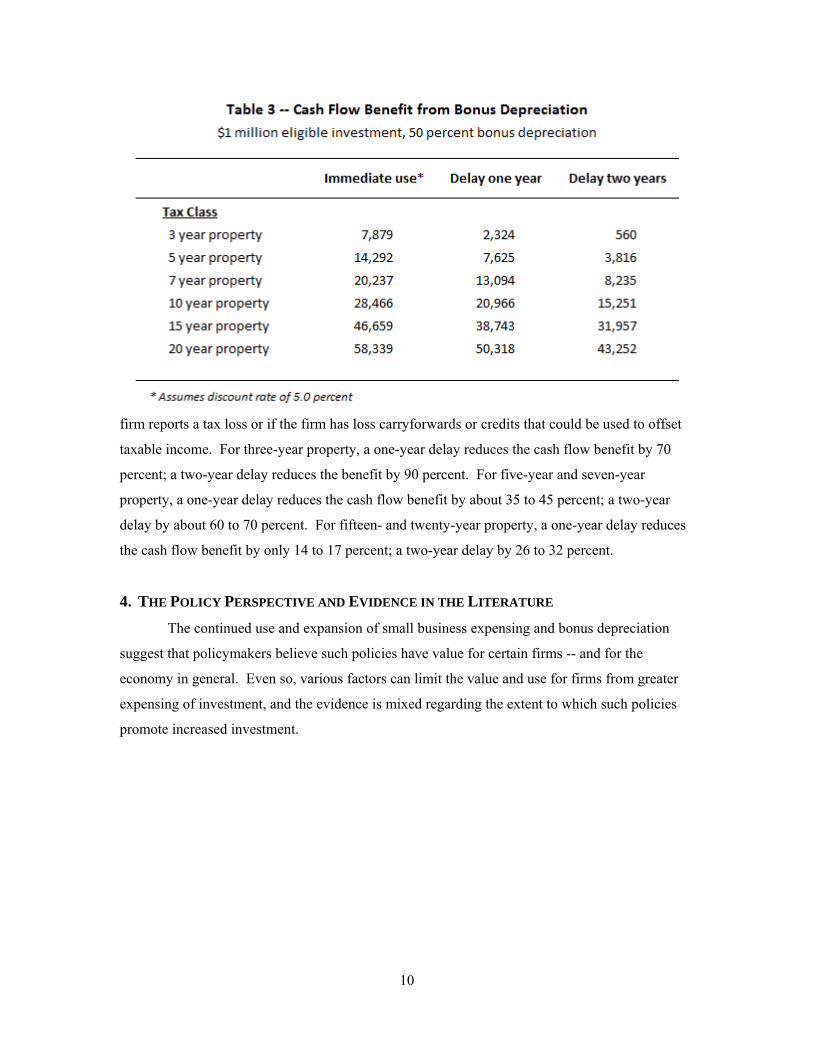
but they do not provide insight regarding bonus depreciation’s cash flow benefit to a firm. Table
3 shows the maximum potential benefit to firms who claim bonus depreciation for a $1 million
investment. The computed cash flow benefit is simply the net present value of the change in tax
liability over the tax life of the investment.11 For example, bonus depreciation on a $1 million
investment in five-year property would reduce tax liability by $140,000 in the year of investment:
$600,000 times 35 percent less $200,000 times 35 percent. Bonus depreciation then increases tax
liability by $56,000 in the second year, $33,600 in the third year, $20,160 in the fourth and fifth
years and $10,080 in the sixth year (a net differential of zero if we ignore present value). The net
present value of this change in tax liability over the investment’s tax life -- $14,292 in the second
row first column of Table 3 -- shows the firm’s cash flow benefit from delaying tax payments.
For three-year property, the computed cash flow benefit is more modest at $7,879. The cash flow
benefit more than doubles to $20,237 for seven-year property. For twenty-year property, the cash
flow benefit is significant at $58,339 because bonus depreciation pulls deductions forward from
tax years many years in the future. It should be noted that the cash flow benefit appears much
larger for longer-lived property largely due to the asset’s longer tax life for a given outlay.
These simple cash flow computations as shown in the “immediate use” column of Table
3 assume that firms have sufficient taxable income to make full use of all accelerated deductions
in the first year of bonus depreciation. However, this assumption does not hold for many firms.
For example, loss firms cannot immediately use the accelerated deduction to offset taxable
income and must instead carry the loss forward to offset taxable income in a future year.
Alternatively, firms with stocks of unused credits or loss carryforwards may receive less benefit
from bonus depreciation if the accelerated deduction merely displaces a credit or loss
carryforward that would have been claimed in its absence. For carryforward firms and firms that
generate new tax credits, it is possible that bonus depreciation has little or no impact on the
stream of tax liability reported by the firm.
Table 3 lists the cash flow benefit if the additional bonus depreciation allowances cannot
be used to offset taxable income for one or two tax years. This delay may effectively occur if the
11 For purposes of illustration in these examples, we use the statutory corporate tax rate as the relevant tax rate.
10
firm reports a tax loss or if the firm has loss carryforwards or credits that could be used to offset
taxable income. For three-year property, a one-year delay reduces the cash flow benefit by 70
percent; a two-year delay reduces the benefit by 90 percent. For five-year and seven-year
property, a one-year delay reduces the cash flow benefit by about 35 to 45 percent; a two-year
delay by about 60 to 70 percent. For fifteen- and twenty-year property, a one-year delay reduces
the cash flow benefit by only 14 to 17 percent; a two-year delay by 26 to 32 percent.
4. THE POLICY PERSPECTIVE AND EVIDENCE IN THE LITERATURE
The continued use and expansion of small business expensing and bonus depreciation
suggest that policymakers believe such policies have value for certain firms -- and for the
economy in general. Even so, various factors can limit the value and use for firms from greater
expensing of investment, and the evidence is mixed regarding the extent to which such policies
promote increased investment.
11
4.1 Perceived benefits ... and possible limitations and costs? The Ways and Means Committee -- in its committee report for the Jobs and Growth Tax
Relief Reconciliation Act of 2003 -- cited the perceived investment and economic benefits from
expanded Section 179 expensing and from bonus depreciation. For Section 179 expensing:
The Committee believes that section 179 expensing provides two important benefits for small businesses. First, it lowers the cost of capital for tangible property used in a trade or business. With a lower cost of capital, the Committee believes small business will invest in more equipment and employ more workers. Second, it eliminates depreciation recordkeeping requirements with respect to expensed property. In order to increase the value of these benefits and to increase the number of taxpayers eligible, the Committee bill increases the amount allowed to be expensed under section 179 and increases the amount of the phase-out threshold, as well as indexing these amounts. (Committee on Ways and Means (2003), p. 25)
Similarly, for bonus depreciation:
The Committee believes that increasing and extending the additional first-year depreciation will accelerate purchases of equipment, promote capital investment, modernization, and growth, and will help to spur an economic recovery. As businesses accelerate their purchases of equipment current employment will increase to produce that equipment. (Committee on Ways and Means (2003), p. 23)
Related to our earlier discussion above, Cohen, Hansen and Hassett (2002) showed that
“By reducing the user cost for equipment and software, partial expensing provides the incentives
to stimulate current investment, an impact that is likely to be strengthened by the temporary
nature of the provision.” Auerbach (2009) identified benefits -- but also some limitations -- for
bonus depreciation:
Bonus depreciation increases the incentive to invest by increasing the present value of depreciation deductions. It might have an advantage over other investment incentives that do not affect the timing of tax payments if private discount rates substantially exceed the government’s discount rate, as might be especially true at the moment. But the key to any scheme of accelerated depreciation is the acceleration, since there is no net increase in the nominal deductions taken over time. Thus, for firms without taxable income that may become taxable only years later, bonus depreciation is of little value. This may be a more important issue now than in earlier decades, given the sharp and as yet not fully understood surge in losses observed earlier in this decade.
Steuerle (2008) further addresses the challenges associated with using bonus depreciation during
periods of slower economic performance, and especially as an investment incentive:
12
What types of businesses can actually use this type of allowance? Those that already have a lot of profits. ... Many businesses -- both those that are new and those that are going through rough times -- can’t take advantage of such a generous tax break. Interestingly, it is during an economic slowdown or recession that businesses hardest hit will be the ones put at a further disadvantage: They will be relatively less likely than other firms to be able to take advantage of extraordinary write-offs. ... Even if one wants temporary investment incentives, bonus depreciation is an anti-competitive way to provide them.
Additional complications regarding the use and incentives from bonus depreciation have
been identified, notably from states decoupling from Federal tax code for purposes of determining
depreciation deductions:
The pressure on states to decouple from federal efforts to stimulate the economy is not a new development. The Job Creation and Worker Assistance Act of 2002 (Pub. L. No. 107-147)—enacted during a recession—provided an additional first-year depreciation to encourage investment. Ultimately, about 30 states decoupled from the provision. States have since decoupled from various other provisions—including bonus depreciation provisions that apply to the 2008 and 2009 tax years, federal net operating loss provisions, and federal treatment of cancellation of indebtedness income. (Gregory and Roll (2010))
To the extent that firms choose to simplify their tax accounting and reporting, the
decoupling of state tax treatment from Federal bonus depreciation would raise additional tax
accounting costs and burdens that could limit the use and potential benefits from bonus
depreciation.
4.2 Research and evidence on induced investment responses
Although we do not provide any new direct evidence in this paper on the responsiveness
or inducement of investment to Section 179 expensing or bonus depreciation, the information on
the firm use/take-up of those provisions has direct bearing on the question of whether the
provisions act as significant incentives for investment. In their review of literature regarding the
empirical evidence on the effectiveness of investment incentives, Hungerford and Gravelle (2010)
properly put the issue in the context of the question of whether investment is responsive to
changes in the “price” of capital. Hassett and Hubbard (2002) provided a review of the empirical
literature at that time, stating “Many observers even recently (e.g., Clark (1993)) have argued that
tax policy likely does not significantly affect investment.” Indeed, empirical estimates of the
responsiveness of investment to changes in the user cost indicate an inelastic response; Cummins,
Hassett and Hubbard (1994) estimated the elasticity of aggregate investment with respect to the
user cost of capital at about -0.66, while Chirinko, Fazzari, and Meyer (1999) found that their
13
micro-dataset-based estimates “lead us to prefer a precisely estimated but small elasticity of
approximately -0.25.” Lee and Rabanal (2010) found that in estimation of investment equations
for forecasting purposes, the use of a tax-adjusted measure for the user cost of capital was inferior
to an unadjusted measure of the user cost of capital. Such inelastic investment responses to
changes in the price of capital -- and unreliable estimation results for empirical purposes -- would
seem therefore to make it less likely, or more difficult to identify, that bonus depreciation or other
accelerated depreciation provisions have a significant incentive effect on investment.
The evidence from recent studies that specifically addressed the role of bonus
depreciation as an investment incentive is mixed, at best. Desai and Goolsbee (2004) found only
a small response of investment to the initial implementation of bonus depreciation, stating:
“Changes to depreciation allowances simply do not have much impact when the system is already
so close to full expensing and when aggregate declines in market value (and therefore in q) are so
large.” Cohen and Cummins (2006) observed empirical evidence that “suggests only a very
limited impact of partial expensing on investment spending, if any.” Cohen and Cummins also
cited several surveys of businesses indicating that “partial expensing affected investment
decisions of very few respondents.” House and Shapiro (2008), in contrast to many other studies,
observed significant investment effects from bonus depreciation such that “Capital that benefitted
substantially from the policy saw sharp increases in investment,” in which the investment
response was higher for longer-lived equipment relative to shorter-lived equipment, and for
bonus-eligible investment goods relative to non-eligible investment goods. Interestingly, Huston
(2006) found evidence that “firms made changes to their investment patterns, significantly
increasing purchases of advantaged assets ... [but] also significantly decreased non-advantaged
asset purchases, leading to only a marginal overall increase in capital expenditures.” Auerbach
and Hassett (2009) provide a review of evidence and accept the view that “the partial expensing
provision would have a small and positive effect on investment.”
Hulse and Livingstone (2010) found mixed evidence with some results indicating that
bonus depreciation led to higher capital expenditures during its availability, while other results
suggested an insignificant effect. Edgerton (2011a) observed that because firms place greater
weight on accounting treatment and profits, accelerated depreciation would be less effective in
stimulating business investment; similarly, Hanlon (2012) argued that financial accounting effects
can strongly influence the incentives of tax policy for investment and notably that, “companies
respond less than predicted to bonus depreciation partly because the tax savings are not reflected
14
on a firm’s accounting income statement.”12 Edgerton (2010) examined asymmetries between
taxable and nontaxable firms and finds results suggesting “that tax incentives have the smallest
impact on investment exactly when they are most likely to be put in place -- during downturns in
economic activity when cash flows are low.” Edgerton (2011b) examined prices of used
equipment (which is not eligible for bonus depreciation and the price should be held down
relative to the price of new equipment which is eligible for bonus) and finds that “There is no
evidence ... that recent bonus depreciation investment incentives had any effect on the relative
price of used construction machinery.”
More recently, Zwick and Mahon (2014, 2016) examined the use of bonus depreciation
in more detail. Zwick and Mahon (2016) found that “bonus depreciation raised investment in
eligible capital relative to ineligible capital by 10.4% between 2001 and 2004 and 16.9% between
2008 and 2010. Second, small firms respond 95% more than big firms. Third, firms respond
strongly when the policy generates immediate cash flows but not when cash flows only come in
the future.” They also observe that the results support “models in which financial frictions or
fixed costs amplify investment responses.”
Hence, on the whole, empirical results are mixed regarding the extent to which bonus
depreciation provisions have a significant incentive effect for investment. Nonetheless, beyond
any investment incentive effects and other relationships, Section 179 expensing and bonus
depreciation can also have important cash flow effects for businesses. We turn next to the
presentation of information and data regarding the observed use of Section 179 expensing and
bonus depreciation.
5. IRS TAX DATA AND DERIVING INVESTMENT BASIS
The data used for this analysis are from the Internal Revenue Service’s (IRS) SOI income
tax files for tax years 2002 through 2014.13 The data files for each year are stratified samples of
returns for the tax year, weighted to represent national totals. For individuals, the tax year
coincides with the calendar year; for corporations, tax year t includes firms with tax years that
end in July of year t through June of year t+1.
12 See also Neubig (2006). 13 The data for corporations used in this paper are “advance” tax year 2014 data; final data for 2014 were not yet available when the numbers were produced for this paper.
15
5.1 IRS Form 4562: Depreciation and Amortization
Much of the data of interest for this analysis is drawn from the reported amounts from
IRS Form 4562: Depreciation and Amortization – which is presented in Appendix A. Firms
report detailed information on investment basis and depreciation amounts on Form 4562,
including a worksheet calculation for determining the investment amounts and income limitations
for Section 179; the “special depreciation allowance” (bonus depreciation); and the investment
basis and depreciation amounts for property depreciated under MACRS and other methods.
5.2 Deriving investment basis for Section 179 and bonus
The calculation of the investment basis amounts for Section 179 and bonus depreciation
deductions closely follows from the data for Form 4562.14 However, because there is not an
exact alignment of the Form 4562 data with statutory definitions of qualified eligible property,
and also because of the Section 179 investment limits, special accounting and imputations must
be made. For both Section 179 and bonus depreciation, property depreciated under MACRS with
a recovery period of 20 years or less is generally eligible property. For bonus depreciation, only
new property is eligible, while for Section 179 used property (new to the owner) is also eligible.
In examining the detailed data, we observed several special cases and likely incorrect reporting
for which we had to make special accounting: notably imputing a basis amount from the reported
deduction when deductions are shown for a given asset life but no basis is reported; imputing
basis to properly reflect the amount of a reported bonus depreciation deduction when there is an
obviously underreported basis amount; and in some cases we simply had to eliminate firms when
the data reported were obviously incorrect and we were unable to make reasonable imputations.
Because Section 179 deductions are targeted toward small businesses and are therefore
limited by law, they are capped by a “dollar limitation” and a “reduction in limitation” (a phase-
out once investment reaches and exceeds certain levels). The tables that follow show the dollar
limitation and the phase-out level; Appendix B shows the legislative history for these limits. The
calculation of the investment basis amounts for the case of Section 179 deductions therefore
begins by capping the Section 179 deduction amount at the maximum permitted under the general
Section 179 limits. The calculated eligible property basis for Section 179 is the sum of the
capped Section 179 deduction, reported bonus depreciation, the reported basis amounts for 3-, 5-,
7-, 10-, 15-, and 20-year property, and an imputed software investment basis. In addition to the
investment limit and phase-out, Section 179 deductions are subject to a business income limit -- 14 For a detailed description of the methods we used to calculate the relevant investment basis that is eligible for bonus depreciation or Section 179, the reader is referred to Appendix C. We provide only a summary here in the text.
16
as IRS Publication 946 states: “limited to the taxable income from the active conduct of any trade
or business during the year.” Disallowed deduction amounts resulting from the income limitation
can be carried over to subsequent years. Using reported income variables by reporter, we
calculated the amount of eligible basis under the business income limit to determine the amount
of “allowed” basis for Section 179 deductions in the current year.
The calculation for the eligible basis for bonus was similar to that described above for the
eligible property basis for Section 179 -- the sum of the MACRS basis amounts, imputed software
basis, and reported bonus depreciation -- but the Section 179 deduction amount and any Section
179 carryover amounts are not included in the calculation. Another notable difference is that only
“new” property and not “used” property, is eligible for bonus depreciation. To account for used
investment, we reduced the calculated basis by 6 percent based on evidence from the Annual
Capital Expenditures Survey (ACES).
6. BUSINESS USE OF SECTION 179 EXPENSING AND BONUS DEPRECIATION: THE DATA
Tables 4, 5, 6 and 7 present annual data on key variables for the years 2002-2014 across
the various legal forms: C corporations, S corporations, partnerships, and individuals. The data
in the table are presented from the perspectives of both the numbers of firms and the dollar
amount of investment. The data presentation takes a top down approach, starting from the
broadest measure and working down to the narrowly-defined Section 179 and bonus firms and
investment amounts. In the bottom of each table, for convenience of reference the last three lines
show by year the Section 179 investment limitation, the Section 179 full phase-out level, and the
bonus depreciation percentage.
Table 4 provides the data for C corporations. The top line shows that the total number of
filers was generally around two million firms from 2002 to 2006, with that number trailing off to
just over 1.6 million by 2012-2014. These results reflect the ongoing trend toward fewer
businesses incorporated as C corporations. The numbers of C corporations with eligible Section
179 basis and with bonus basis declined across the sample period absolutely, and also relative to
the total number of firms: the number claiming the Section 179 deduction fell from 369,935 in
2002 to 244,217 in 2014, and the number claiming bonus depreciation fell from 346,468 in 2002
to 131,575 in 2014. For the Section 179 take-up percentages, only about 40 to 50 percent of
firms with eligible investment used Section 179 expensing. However, that does not account for
the income limitation that requires sufficient business income to use the Section 179 expensing
deduction. Accounting for the income limitation, the take-up percentage for the number of firms
with “allowed” Section 179 investment was generally around 80 percent. For bonus depreciation,
17
usually less than half of corporations with eligible investment basis actually used bonus
depreciation, with the rate varying from 41 percent to 52 percent. It is notable that the highest
take-up rate at 52 percent was in 2011, the year of 100 percent bonus depreciation. Analogous
results are shown in the bottom half of the table for the dollar amounts of investment. The
Section 179 take-up rates were generally in the 70 to 80 percent range relative to allowed Section
179 basis amounts; the bonus take-up percentages were in the 53 to 59 percent range for 2001-
2004 but were more varied over the 2008-2014 period, ranging from 47 percent in 2008 to 75
percent in 2012. The data show higher use of bonus depreciation relative to eligible investment
in the later years, averaging near 70 percent across 2011-2014.
Notable exceptions for the general patterns for the take-up rates for Section 179
expensing and bonus depreciation occurred for the tax year 2011 when 100 percent bonus
depreciation was in place; in that year, the take-up percentages for the number of firms using
Section 179 expensing were at markedly lower levels than for other years (e.g., for C corporations
at 69 percent compared to the more-typical take-up rates near 80 percent) – and the percentage of
firms using bonus was higher as noted above. The number of C corporations using Section 179
expensing in 2011 was about 40,000 lower than the average for surrounding years, while the
number using bonus depreciation was about 40,000 higher. These results suggest, at least at some
margin, a fungible choice in the 2011 tax year between claiming Section 179 expensing and (full)
100 percent bonus expensing; given that either provision would yield full expensing, some
businesses perhaps viewed it as a simplification to use bonus depreciation, rather than Section
179 expensing with its reporting and calculation requirements for the associated limits, phase-
outs and income tests.
An additional observation regarding the bonus depreciation amounts and investment are
(1) the large increase in eligible bonus basis from 2011 to 2012 (a 15.7 percent increase) and (2)
the peaking of the bonus take-up rate in 2012 (for the dollar amount); these occurred despite the
fall from 100 percent bonus in 2011 to 50 percent bonus in 2012. From the perspective of bonus
depreciation creating incentives for boosting investment, then, if anything, one would tend to
think the temporary full expensing (100 percent) in late 2010 through 2011 should have pulled
investment forward out of 2012. Looking ahead to the NIPA data in Table 8, we see there also
was a corresponding jump in the NIPA data for investment in 2012, but somewhat less strong at
12 percent. These outcomes are contrary to an expectation that the retreat from 100 percent
expensing to 50 percent expensing would result in somewhat weaker investment in 2012 relative
to otherwise, and particularly in the first quarter of 2012; but the NIPA investment data do not
18
show that, and in 2012:Q1 the growth rate for NIPA equipment investment was a strong 18
percent.15
Table 5 provides the analogous comparisons for bonus depreciation and Section 179
expensing use for S corporations. In contrast to the decline for the total number of C corporations
over time observed in Table 1, the number of S corporations rose steadily over the period shown,
from 3.15 million in 2002 to 4.38 million in 2014 (top line of Table 5). The number of S
corporations claiming the Section 179 expensing deduction rose from 724,164 in 2002 to over
900,000 for 2005 to 2007, but then fell to 736,438 in 2009 during the recession, and then rose
again to over 870,000 for 2012-2013 and 945,898 in 2014. The Section 179 take-up percentage –
both for the number of firms with allowed investment and for the dollar amount of investment –
generally persisted around 75 percent to 80 percent. Regarding bonus depreciation use,
progressively fewer S corporations used bonus depreciation over the period 2002-2004 and the
number using bonus depreciation over the 2008-2014 (aside from 2011) period tended to run at
around 400,000 or just over. Regarding the total dollar amount of bonus depreciation deductions
used, aside from the recession year of 2009 ($18 billion) and the 100 percent bonus year of 2011
($52 billion), bonus use by S corporations during 50 percent bonus years was relatively steady in
the $24 billion to $28 billion range. The bonus depreciation take-up percentages were relatively
steady as well, with the take-up percentage for firms generally running in the 50 percent to 54
percent range, and the take-up percentage relative to eligible investment being generally around
60 percent. As noted above for the C corporation data, some notable exceptions to the general
patterns occur for 2011 when 100 percent bonus depreciation was in place: relative to the
observed take-up rates for most years, bonus depreciation take-up rates were higher for 2011
while the take-up rates for Section 179 were lower. In terms of the number of firms using the
provisions, the number of firms using Section 179 expensing fell by about 200,000 in 2011
compared to the average for surrounding years, while the number of firms using bonus
depreciation rose by about 200,000 compared to surrounding years.
Table 6 presents the data for partnerships. The top line shows, similar to observed for S
corporations, a steady increase in the number of partnerships, rising from 2.242 million in 2002 to
3.611 million by 2014. Take-up rates for Section 179 expensing for the number of firms and the
dollar amount of allowed basis were generally in the 60 percent to 70 percent range (aside from
2011); however, the take-up rates for Section 179 expensing relative to the eligible investment
basis were much lower – generally in the 20 percent to 30 percent range. Those results suggest a 15 These observations seem consistent with a view that, in the aggregate at least, bonus depreciation and the user cost of capital effects are of, at best, secondary importance for determining investment relative to other factors such as the general level of economic activity and the overall investment environment and outlook.
19
large number of partnerships that didn’t have sufficient income to meet the income test for using
the Section 179 deduction – i.e., low taxable income or even in loss position. For 2011, a similar
pattern as that observed for C corporations and S corporations – although somewhat less
pronounced – occurs for the lower Section 179 take-up rates by firms and higher bonus
depreciation use.
For individual filers, the results presented in Table 7 show the total number of individual
filers in the 130 million to 153 million range across the 2002-2014 period with the combined sole
proprietors, farmers, rental real estate, etc. (from Schedules C, F, and E) accounting for about 31
million to 40 million over those years.16 On average, about one-fifth (7.1 million to 7.8 million
per year) of those filers have eligible 179 basis, with about 90 percent of those having allowable
179 basis once the income test is applied. The take-up percentage, both relative to the number of
firms and relative to the amount of allowed investment basis, generally is in the 60 percent to 70
percent range across the years. For bonus depreciation, the take-up rate percentages in the 45
percent to 49 percent range (other than 2011) relative to the number of filers with eligible basis
show that generally just less than half of the filers with eligible bonus basis actually use bonus
depreciation. Relative to the amount of eligible investment, the take-up rates are even lower, in
the 33 percent to 40 percent range. As for the other legal forms, the 2011 results show fewer
filers reporting Section 179 expensing deductions and more using bonus depreciation.
Table 8 presents aggregate results, which in most cases are the sum of the results across
the various business forms. We also present some rough comparisons for the observed SOI data
on investment in comparison to adjusted data for equipment and software from the National
Income and Product Accounts (NIPAs).17 Care must be taken in interpreting the numbers shown,
in particular for the total Section 179 numbers; for example, the total number of firms using
Section 179 is a larger number than would actually claim it because of the use by pass-through
entities (S corporations and partnerships) that would have to pass-through the Section 179 to the
final reporters (usually individuals, except for corporate partners). Nonetheless, pass-through
entities do “use” Section 179 as they report those amounts on the 4562 form, but then the 179
amounts are passed through to shareholders or partners. Also, for individual filers we do not treat
each separate schedule filed as a separate reporter. Aggregate amounts of Section 179 and bonus
deductions are shown at the bottom of Table 8 with the Section 179 values only including the
amounts reported by individuals (including the amounts from pass-through entities) and C
16 The number here represents the number of individual filers, not the number of separate schedules; hence, an individual with multiple schedules for Schedules C, E or F counts as one filer. 17 These aggregate investment comparisons are not meant to be exact, but rather illustrative of the rough relative comparison in magnitude of the amounts of investment in the SOI and the NIPAs.
20
corporations. Over the 2003 to 2011 period, the total Section 179 amounts were in the $44 billion
to $59 billion range, rising only gradually even though the Section 179 investment limits rose
from $100,000 in 2003 to $500,000 in 2010-2011. Higher Section 179 expensing total amounts
in the $76 billion to $87 billion range were observed in 2012-2014 with the maintained $500,000
limit and the economy returning to sustained recovery. For bonus depreciation, the total amounts
were at just over $200 billion for 2004, 2008 and 2009. The 100 percent bonus year of 2011 saw
a very large $548 billion total bonus depreciation deduction amount, and the bonus depreciation
totals were at about $340 billion over 2012-2014 with the return to 50 percent bonus. Looking at
the total bonus depreciation amounts in Table 8 and comparing back to the bonus depreciation
amounts in Table 4 for C corporations, it can be seen that C corporations account for about two-
thirds of all bonus depreciation. The combined total for Section 179 and bonus depreciation
expensing amounts were around $250 billion to $260 billion for 2004, 2008 and 2009, $348
billion in 2010, $602 billion in 2011, and in the $422 billion to $435 billion range for 2012-2014.
All in all, Table 8 provides a good summary of the data and relationships. There are
essentially three distinct periods: 2002-2009; 2010-2011; and 2012-2014. And, looking across
the tables and years, there appears to be a definite shift upwards after the period for 100 percent
bonus of late 2010 through 2011, both in terms of bonus depreciation claimed and for take-up
rates. One hypothesis is that 100 percent bonus got a number of firms to claim bonus
depreciation that otherwise did not do so previously under only 50 percent bonus. Then, once
having claimed it in 2011, a then higher number of firms continued to claim subsequently under
the return to 50 percent bonus, perhaps due to (1) having incurred fixed costs (accounting, tax
reporting and other) to claim it and/or (2) it would have too big a negative impact on cash flows
not to continue claiming 50 percent.
21
22
23
24
25
26
7. ECONOMETRIC ANALYSIS: BONUS USE AND ESTIMATED PROBABILITY OF TAKE-UP
To further examine the role of key variables in determining business use of bonus
depreciation, we used Probit estimation on selected subset of the C corporation data from 2008.
Probit estimation is a binary estimation procedure – based on assigning 0 or 1 values to whether a
firm uses or does not use bonus in this case – that therefore allows us to estimate the probability
of firm take-up of bonus depreciation for given characteristics.18
7.1 The sample
We adjusted the sample by 1) including only those firms with investment basis eligible
for bonus; 2) eliminating filers reporting consolidated returns; and 3) including only filers with an
identified state location.19 These changes to the sample help to assure that we have individual
corporations with eligible bonus property – and for an identified state because we examine the
role of state depreciation law conformity to Federal law. After these adjustments the sample size
is 29,869. We use the unweighted data as we are interested in the individual firm behavior and
not the aggregate numbers or amounts.
7.2 Specification and results
Table 9 presents the results from the probit estimation of the following equation:
Bonus firm= 1 for firm using bonus depreciation, = otherwise
State = 1 for State that conforms to Federal for bonus depreciation, =0 otherwise20
InvLifeis the average investment life in years for the firm’s investment21
GrsRcptsis the firm’s gross receipts, in $millions
LossFirm= 1 if the firm has net income < 0, = 0 otherwise
NOLD= 1 if the firm has a net operating loss deduction
Indi = 1 for firm in 2-digit NAICs industry i, = 0 otherwise (manufacturing dummy is
excluded and is the base case of the estimation)
18 This section is a replication of the same material from Kitchen and Knittel (2011). 19 The state location variable from the SOI data doesn’t preclude multi-state locations for component parts of the corporation; that relationship could limit the interpretation of the state effects observed in the estimation, particularly for large firms. 20 The state conformity was taken from Gregory and Roll (2010), BNA Daily Tax Report. 21 Note that the weighted average equipment life across all firms in the sample is 5.8 years.
27
The results, in terms of the signs of the coefficients on the explanatory variables,
generally conform to what should be expected from theory and analysis. But caution should be
taken in interpreting and applying the results. Because the estimation is Probit, the coefficients of
the variables do not represent the marginal impact of the explanatory variable on the estimated
probability. The estimated marginal effect in these estimations would be about one-third the
magnitude of the shown coefficient estimate; we examine alternative values below but do so by
letting the estimation software produce the result. Also, the McFadden R-squared is low at 0.04 –
low even for this measure which is often low in Probit estimations. Hence, although the results
and following discussion appear reasonable and confirming of priors, there is wide variability in
the relationships and limited confidence in prediction.
In Table 9, the state conformity variable has a positive coefficient, aligning with the
perspective that a firm would find it easier or less costly to use bonus depreciation if the
accounting for depreciation were simpler, i.e. being able to use one set of books for depreciation
treatment for tax purposes. The positive coefficient on the investment asset life term conforms to
the view that bonus depreciation would be of greater value for firms with longer-lived equipment
relative to shorter-lived equipment. The positive coefficient on the gross receipts variable
indicates that larger firms are more likely to use bonus depreciation than smaller firms. The
negative coefficients on the loss firm variable and on the net operating loss variable conform to
the expectation that firms in a loss position or using net operating loss deductions would not find
the immediate, accelerated depreciation deductions of bonus depreciation to be of as much
value.22 Finally, the coefficients on the industry variables generally seem reasonable as well.
Recalling that the base case is for manufacturing, the lone coefficient that is positive and
significant is for the mining industry, a capital intensive industry. The coefficients for most other
industries are negative and significant (with a few exceptions). Hence, the results suggest that
higher bonus take-up rates would be expected to occur in manufacturing and mining – and lower
take-up rates in services and other industries.
To illustrate the implications of the results for the probability of a firm using bonus
depreciation, Table 10 shows the estimated probabilities under various conditions. The first case
is a large, profitable manufacturing company in a state that conforms to Federal bonus
depreciation, and with above-average equipment life (10 years); the estimated probability of
bonus use is about 95 percent. In the second case, if instead of being profitable, the firm is in a
22 Note that firms that are in a loss position or with net operating loss deductions greater than the amount of bonus deduction available for use still often use bonus depreciation; net operating losses can be carried forward, for example. In the restricted sample used for the estimation for Table 8, of the 17,431 firms that used bonus depreciation 7,026 were in a loss position.
28
29
30
loss position then the estimated probability drops by about 15 percent to 80 percent. The third
case considers a large manufacturer in a nonconforming state, in a loss position, and with average
equipment life (6 years); the estimated probability for bonus use is 62 percent. Cases 4, 5 and 6
examine small to medium manufacturing firms in nonconforming states, with short to average
equipment life and varying loss or net operating loss deduction status; the probabilities are in the
56 percent to 60 percent range. Case 7 considers a large, profitable mining firm in a conforming
state with above average equipment, yielding an estimated probability of 90 percent (similar to
the first case, except for mining instead of manufacturing and about two-thirds as large in terms
of gross receipts). Cases 8 and 9 consider small firms that are in loss position, with short-to-
average life equipment, in nonconforming states, in agriculture and in services; the estimated
probabilities are low, at 36 percent and 34 percent.
8. SELECTED ISSUES
This section provides information and data on several additional issues, including the
distribution of bonus depreciation and Section 179 use by industry, the distribution by income
levels, and the challenge of properly accounting for “used” property in making the estimates.
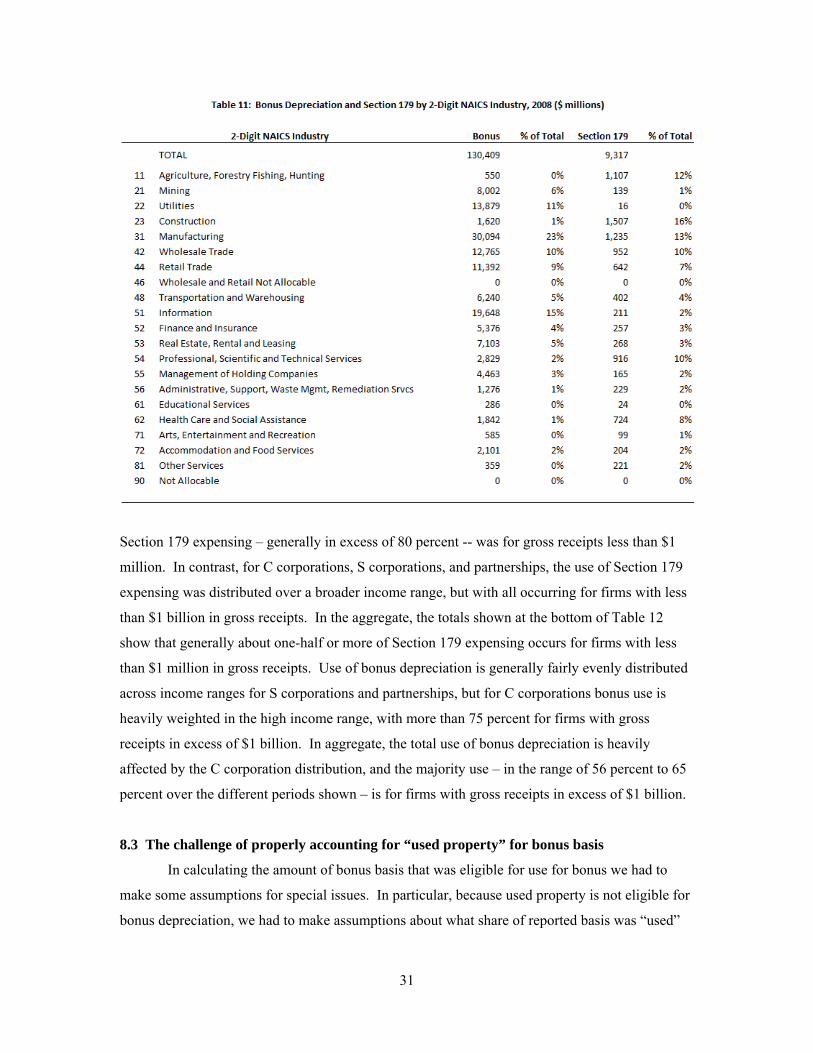
8.1 Distribution of bonus depreciation and Section 179 use by industry
To provide some further information and context that readers and analysts may find of
value, Table 11 presents data from 2008 on the use of bonus depreciation and Section 179
expensing by C corporations by two-digit NAICS industry. The data show that, as might be
expected, manufacturing accounts for a large share (23 percent) of the use of bonus depreciation
with information, wholesale trade and utilities also representing important shares. For Section
179 use by C corporations, the largest users are construction; agriculture, forestry, fishing, and
hunting; manufacturing; wholesale trade; and professional, scientific and technical services.
8.2 Distribution by income levels
The distribution of the use of Section 179 and bonus depreciation according to a gross
income measure (see Table 12) is largely as one might expect23. Section 179 deductions, with
their investment limits, are concentrated more at lower income levels; bonus depreciation, with
the unlimited amounts of eligible investment, end up being used more by large firms at higher
income levels. For example, for individuals, the predominant use of both bonus depreciation and
23 The gross receipts measure used here is derived in a manner similar to that in the Knittel, et al, (2011) paper on small businesses.
31
Section 179 expensing – generally in excess of 80 percent -- was for gross receipts less than $1
million. In contrast, for C corporations, S corporations, and partnerships, the use of Section 179
expensing was distributed over a broader income range, but with all occurring for firms with less
than $1 billion in gross receipts. In the aggregate, the totals shown at the bottom of Table 12
show that generally about one-half or more of Section 179 expensing occurs for firms with less
than $1 million in gross receipts. Use of bonus depreciation is generally fairly evenly distributed
across income ranges for S corporations and partnerships, but for C corporations bonus use is
heavily weighted in the high income range, with more than 75 percent for firms with gross
receipts in excess of $1 billion. In aggregate, the total use of bonus depreciation is heavily
affected by the C corporation distribution, and the majority use – in the range of 56 percent to 65
percent over the different periods shown – is for firms with gross receipts in excess of $1 billion.
8.3 The challenge of properly accounting for “used property” for bonus basis
In calculating the amount of bonus basis that was eligible for use for bonus we had to
make some assumptions for special issues. In particular, because used property is not eligible for
bonus depreciation, we had to make assumptions about what share of reported basis was “used”
32
33
and not “new”. We relied on the Annual Capital Expenditure Survey (ACES) data to make that
application -- assuming that 6 percent of reported basis was “used” property. The ACES data is
the best available data that we are aware of. Nonetheless, to the extent that actual reported
investment basis that is “used” differs from that assumption, the amount of eligible basis in the
denominator for the take-up calculation would also be affected. Although the results generally
seem reasonable, we still cannot say definitively that they aren’t affected by the “used” property
assumption we have used. The results for 2008 are an example here. For C corporations, the
bonus take-up rate (relative to the amount of investment) is at its lowest -- 47 percent -- in 2008.
It is possible that there were increased mergers and acquisitions of firms or purchases of property
of failed firms in 2008 as the U.S. economy entered the “great recession.” If so, the share of used
property in investment might have been higher in 2008 than in other years, and if improperly
accounted for it would overstate the amount of new property and understate the bonus take-up
rate. Even so, the ACES data did not indicate such a relative change in used property acquisition.
We recognize that the results presented can be sensitive to the assumptions made and the
calculations involved.
9. CONCLUDING COMMENTS
This paper presents data and evidence on the use of special accelerated depreciation
provisions of the past decade, for Section 179 and bonus depreciation. Although firms used both
provisions, the observed take-up rates indicate the provisions were not used as extensively as
might have been expected a priori or in full conformance with the policy perspective of providing
a significant investment incentive. Using SOI tax data over the 2002-2014 period, we observed
that corporations, pass-through entities, and individuals used Section 179 expensing in the 60
percent to 80 percent range, both in terms of the numbers of firms and relative to total allowed
investment amounts. For bonus depreciation, in the years 2002-2004 and 2008-2014, the
effective take-up rates were lower than observed for Section 179 expensing. The number of firms
using bonus depreciation for eligible investment generally was in the 40 percent to 60 percent
range relative to the number eligible, while the bonus depreciation deduction relative to the
eligible investment amount generally was in the 50 percent to 70 percent range for C corporations
and S corporations, but was at lower ranges of about 40 percent to 60 percent for partnerships and
30 percent to 40 percent for individuals. Total business use of Section 179 expensing and bonus
depreciation over the 2002-2014 period averaged nearly $300 billion per year, and more recently
over $400 billion per year for 2012-2014. We examined factors that help explain why firms
would forgo use of bonus depreciation. In many cases, bonus depreciation may have afforded
34
little, if any, benefit. Specifically, loss firms and firms with loss carryforwards may realize little
cash flow benefit.
Probit analysis of C corporation data from 2008 produced results consistent with such
theoretical priors that bonus depreciation use is limited by firms in a loss position, and by firms
with net operating loss carryforwards. In addition, the analysis also is consistent with firm’s use
of bonus depreciation being positively related to 1) the firm’s location in a state whose bonus
treatment conforms with Federal bonus depreciation; (2) average equipment investment life; 3)
the size of the firm; and 4) the firm being a manufacturing or mining firm relative to being in
other industries.
While the reasons for the low bonus take-up rates are not fully understood, as discussed
in Knittel (2007) that result is consistent with the corporate response to the implementation of the
Asset Depreciation Range (ADR) system in 1971. The Revenue Act of 1971 provided a range of
asset lives for various classes of assets placed in service after December 1970. The Revenue Act
of 1971 allowed firms to use shorter asset lives than provided for under prior law. Although more
generous depreciation allowances were made available, Vasquez (1974) found that many firms
elected not to use the ADR system and instead used less generous schedules that decreased the
present value of deductions. Even among large firms, Vasquez found that only 63 percent of
firms elected to use the ADR system. Similar to our results, Vasquez found higher utilization
rates for industries dominated by large firms with longer-lived property.
In general, the analysis presented here indicates that bonus depreciation can, in theory,
reduce the cost of investment and provide an investment incentive and cash flow benefits, and the
data presented show its extensive use by businesses over the years. In practice, however, various
factors limit the use of bonus depreciation and its relative value for boosting investment.
35
REFERENCES AUERBACH, ALAN J. (2009), “Implementing the New Fiscal Policy Activism,” American
Economic Review, Vol. 99, No. 2, May. AUERBACH, ALAN J. AND KEVIN A. HASSETT (2009), “Taxes and Business Investment: Lessons
from the Past Decade,” in Alan D. Viard, ed., Tax Policy Lessons from the 2000s, American Enterprise Institute.
BUREAU OF THE CENSUS, Annual Capital Expenditures Survey, various years. CHIRINCO, ROBERT S., STEVEN M. FAZARI, AND ANDREW P. MEYER (1999), “How responsive is
business capital formation to its user cost? An exploration with micro data,” Journal of Public Economics 74.
CLARK, PETER K. (1993), “Tax Incentives and Equipment Investment,” Brookings Papers on
Economic Activity, 1. COHEN, DARREL AND JASON CUMMINS (2006), “A Retrospective Evaluation of the Effects of
Temporary Partial Expensing,” Finance and Economics Discussion Series 2006-19, Federal Reserve Board of Governors, April.
COHEN, DARREL S., DORTHE-PERNILLE HANSEN AND KEVIN A. HASSETT (2002), “The Effects of
Temporary Partial Expensing on Investment Incentives in the United States,” National Tax Journal, Vol. LV, No. 3, September.
COMMITTEE ON WAYS AND MEANS (2003), Report 108-94: Jobs and Growth Reconciliation Tax
Act of 2003, U.S. House of Representatives, May 8. CUMMINS, JASON G., KEVIN A. HASSETT, AND R. GLENN HUBBARD (1994), “A Reconsideration
of Investment Behavior Using Tax Reforms as Natural Experiments,” Brookings Papers on Economic Activity, 2.
DESAI, MIHIR A. AND AUSTAN D. GOOLSBEE (2004), “Investment, Overhang, and Tax Policy,”
Brookings Papers on Economic Activity, Vol. 2. EDGE, ROCHELLE M. AND JEREMY B. RUDD (2010), “General Equilibrium Effects of Investment
Tax Incentives,” Finance and Economic Discussion Series, Federal Reserve Board, 2010-17, February.
EDGERTON, JESSE (2010), “Investment Incentives and Corporate Tax Asymmetries,” Journal of
Public Economics, 94(11-12). EDGERTON, JESSE (2011a), “Investment, Accounting, and the Salience of the Corporate Income
Tax,” Federal Reserve Board of Governors, Working Paper 2011-20, March 27. EDGERTON, JESSE (2011b), “The Effects of Taxation on Business Investment: New Evidence
from Used Equipment,” Federal Reserve Board of Governors, Mimeo, January.
36
GREGORY, DOLORES AND STEVEN ROLL (2010), “Prospects of More Decoupling From I.R.C. Raise Concerns About Complexity, Federal Indifference to State Fiscal Needs,” BNA Daily Tax Report, October 14.
GUNTHER, GARY (2015), “The Section 179 and Bonus Depreciation Expensing Allowances:
Current Law and Issues for the 114th Congress,” Congressional Research Service, August 6. HALL, ROBERT E. AND DALE W. JORGENSON (1967), “Tax Policy and Investment Behavior,”
American Economic Review 57 No. 3, June. HANLON, MICHELLE (2012), “Testimony of Michelle Hanlon before the United States Senate
Committee on Finance”, March 6. HASSETT, KEVIN A. & HUBBARD, R. GLENN (2002), "Tax policy and business investment,"in: A.
J. Auerbach & M. Feldstein (ed.), Handbook of Public Economics, edition 1, volume 3, chapter 20, pages 1293-1343 Elsevier.
HULSE, DAVID S. AND JANE R. LIVINGSTONE (2010), “Incentive Effects of Bonus Depreciation,”
Journal of Accounting and Public Policy, Vol. 29, No. 6, January. HUNGERFORD, THOMAS L. AND JANE G. GRAVELLE (2010), “Business Investment and
Employment Tax Incentives to Stimulate the Economy,” CRS Report for Congress, Congressional Research Service, January 22.
A&M University, January. HOUSE, CHRISTOPHER L. AND MATTHEW D. SHAPIRO (2008), “Temporary Tax Incentives:
Theory with Evidence from Bonus Depreciation,” American Economic Review, June. INTERNAL REVENUE SERVICE, Form 4562: Amortization and Depreciation, various years. INTERNAL REVENUE SERVICE, Publication 946: How to Depreciate Property, various years. JOINT COMMITTEE ON TAXATION (2005), “Present Law and Legislative Background Relating to
Depreciation and Section 179 Expensing,” JCX-54-05, July 20. KITCHEN, JOHN AND MATTHEW KNITTEL (2011), “Business Use of Special Provisions for
Accelerated Depreciation: Section 179 Expensing and Bonus Depreciation, 2002-2009,” Unpublished Manuscript, National Tax Association annual conference on taxation, New Orleans, LA, November 2011. (http://papers.ssrn.com/sol3/papers.cfm?abstract_id=2789660)
KNITTEL, MATTHEW (2005), “Small Business Utilization of Accelerated Tax Depreciation:
Section 179 Expensing and Bonus Depreciation,” National Tax Association Proceedings, 98th Annual Conference on Taxation.
KNITTEL, MATTHEW (2007), “Corporate Response to Accelerated Tax Depreciation: Bonus
Depreciation for Tax Years 2002-2004,” Office of Tax Analysis, U.S. Department of the Treasury, Office of Tax Analysis Working Paper 98, May.
37
KNITTEL, MATTHEW, SUSAN NELSON, JASON DEBACKER, JOHN KITCHEN, JAMES PEARCE, AND
RICHARD PRISINZANO (2011), “Methodology to Identify Small Businesses and Their Owners,” Office of Tax Analysis, U.S. Department of the Treasury, Technical Paper 4, August.
LEE, JAEWOO AND PAU RABANAL (2010), “Forecasting U.S. Investment,” IMF Working Paper
WP/10/246, International Monetary Fund, November. NEUBIG, TOM (2006), “Where’s the Applause? Why Most Corporations Prefer a Lower Tax
Rate,” Tax Notes, April 24. STEUERLE, GENE (2008), “Some Ignored Costs of Bonus Depreciation,” Tax Notes, March 3. VASQUEZ, THOMAS (1974), “The Effects of the Asset Depreciation Range System on
Depreciation Practices,” OTA Working Paper 1, Office of Tax Analysis, U.S. Department of the Treasury, May.
ZWICK, ERIC AND JAMES MAHON (2014), “Do Financial Frictions Amplify Fiscal Policy?
Evidence from Business Investment Stimulus,” Working Paper, January. ZWICK, ERIC AND JAMES MAHON (2016), “Tax Policy and Heterogeneous Investment Behavior,”
National Bureau of Economic Research Working Paper No. 21876, January.
38
APPENDIX A -- IRS FORM 4562A
39
40
APPENDIX B -- LEGISLATIVE HISTORY FOR SECTION 179 AND BONUS DEPRECIATION MAIN PROVISIONS (2000-2016)
41
42
APPENDIX C -- DETERMINATION OF INVESTMENT BASIS FOR SECTION 179 AND BONUS The calculation of the investment basis amounts for Section 179 and bonus depreciation deductions is based on data reported on -- and closely follows the structure of -- IRS Form 4562: Depreciation and Amortization (see Appendix A). However, because there is not an exact alignment of the Form 4562 data with statutory definitions of qualified eligible property, and also because of the Section 179 investment limits, special accounting and imputations must be made. Qualified Property The following descriptions of qualified property are based on information presented in IRS Publication 946: How to Depreciation Property (see Publication 946 for more details). Qualified Property, Section 179 Deduction To qualify for the Section 179 deduction, property must be eligible property purchased for business use.
1. Tangible personal property (generally machinery and equipment and similar, not real property, but including off-the-shelf computer software).
2. Other tangible property (except buildings and their structural components) used as: a. An integral part of manufacturing, production, or extraction or of furnishing
transportation, communications, electricity, gas, water, or sewage disposal services, b. A research facility used in connection with any of the activities in (a) above, or c. A facility used in connection with any of the activities in (a) for the bulk storage of
fungible commodities. 3. Single purpose agricultural (livestock) or horticultural structures. See chapter 7 of
Publication 225 for definitions and information regarding the use requirements that apply to these structures.
4. Storage facilities (except buildings and their structural components) used in connection with distributing petroleum or any primary product of petroleum.
Land and improvements and other “excepted property” do not qualify for the Section 179 deduction. Qualified Property, Special Depreciation Allowance (Bonus Depreciation)
1. New property, one of the following types: a. Tangible property depreciated under the modified accelerated cost recovery system
(MACRS) with a recovery period of 20 years or less. b. Water utility property c. Computer software that is readily available for purchase by the general public, is
subject to a nonexclusive license, and has not been substantially modified. d. Qualified leasehold improvement property
2. Property acquired by purchase during period bonus provision is in place, and no prior binding contract in place
3. Property must be placed in service by ending date for bonus provision (an additional year for long-production period and certain aircraft property)
43
Excepted Property:
1. Property placed in service and disposed of in the same year 2. Property converted from business use to personal use in same tax year it is acquired 3. Property required to be depreciated under the Alternative Depreciation System (ADS). 4. Property for which election made to not claim special depreciation allowance. 5. Qualified restaurant property (post 2008) 6. Qualified retail improvement property (post 2008) 7. Property for which election made to accelerate certain credits in lieu of special
depreciation allowance
Some Specific Adjustments to the Data In examining the detailed data, we observed several special cases and potential misreporting that needed to be accounted for. We observed a number of firms that appear to have reported all their depreciation deductions in the “Other depreciation” field of Form 4562 line 16, and no other detail; in many cases, these were very large amounts and appear to have been an accounting convenience and did not reflect the correct accounting for basis and depreciation deductions. We chose to eliminate those firms from our accounting. Other firms would report deductions for a specific MACRS asset class, but not any associated basis; for those cases, we imputed a basis amount from the reported deduction. For firms that reported a bonus depreciation deduction, but then did not have reported basis equivalent to what mathematically would be the required amount of basis, we imputed the basis to properly reflect the amount for that reported bonus deduction. Calculation of Section 179 Investment Basis Section 179 Limits: Section 179 deductions are targeted toward small businesses, and are therefore limited by law, capped by a “dollar limitation” and a “reduction in limitation” (a phase-out once investment reaches and exceeds certain levels). The tables in the text of the paper show the dollar limitation and the phase-out level; Appendix B shows the legislative history for these limits. For example, in 2008, the general Section 179 deduction was limited to a maximum of $250,000 and that limit was reduced dollar-for-dollar as investment exceeded $800,000 (the reduction in limitation), with a total phase-out for investment at $1,050,000. Adjusting for Disaster and Other Amounts: During the years under consideration in this study, legislation for several special cases expanded the amounts of the allowed Section 179 deductions for disasters -- including for the New York Liberty zone, Gulf Opportunity Zone, Recovery Assistance property, and Disaster Assistance property. We chose to focus on the general Section 179 deduction and to exclude these amounts. The calculation of the investment basis amounts for the case of Section 179 deductions therefore begins by capping the Section 179 deduction amount at the maximum permitted under the general Section 179 limits. The amounts for these special disaster provisions generally were a very small part of the total; for example, for S corporations in 2008 the difference represented less than $33 million of the $21.4 billion total for Section 179 deductions. “Eligible Property” Basis: The calculated eligible property basis for Section 179 is the sum of the capped Section 179 deduction, reported bonus depreciation, the reported basis amounts for 3-, 5-, 7-, 10-, 15-, and 20-year property, and an imputed software investment basis. The amount of software investment is imputed as it is not reported on Form 4562; software deductions are
44
reported in line 16 “Other depreciation”. Based on examination of NIPA data for off-the-shelf software investment and calculations based on various depreciation patterns, we estimated that a reasonable imputation for software investment basis was to use approximately 84 percent of the current year “other depreciation” amount. One additional component for the basis is the inclusion of the “carryover of disallowed [Section 179] deduction” from the prior year. The amount of the calculated total basis from the summation was then subjected to the Section 179 dollar limitation and the phase-out of the reduction in limitation to determine the eligible Section 179 basis. Note that listed property amounts included in the reported Section 179 deduction are included in this calculated amount of basis, but no additional amounts of listed property beyond that are included (as listed basis amounts are not reported). Note that reported amounts of bonus depreciation are included in this calculation; Section 179 is eligible for claiming prior to bonus and allows for full expensing, so if bonus is used instead it would represent basis eligible for Section 179 that wasn’t used for the Section 179 deduction. The Section 179 Income Test and “Allowed” Basis: In addition to the investment limit and phase-out, Section 179 deductions are subject to a business income limit -- as Publication 946 states: “limited to the taxable income from the active conduct of any trade or business during the year.” Disallowed deduction amounts resulting from the income limitation can be carried over to subsequent years. Using reported income variables by reporter, we calculated the amount of eligible basis under the business income limit to determine the amount of “allowed” basis for Section 179 deductions in the current year. Calculation of Basis Eligible for Bonus The calculation for the eligible basis for bonus was similar to that described above for the eligible property basis for Section 179 -- the sum of the MACRS basis amounts, imputed software basis, and reported bonus depreciation -- but the Section 179 deduction amount and any Section 179 carryover amounts are not included in the calculation. Another notable difference is that only “new” property and not “used” property, is eligible for bonus depreciation. Examination of data from the Census Bureau’s Annual Capital Expenditure Survey (ACES) over a variety of years showed that expenditures on used investment typically represented about 6 percent of total investment expenditures for equipment. To account for used investment, we therefore reduced the calculated basis by 6 percent. We did not include listed property in our calculations for bonus depreciation and basis. On Form 4562, the amount of listed property bonus depreciation is reported separately and included in listed property deductions, but because listed property basis amounts were not available a useful comparison could not be made including listed property.